Embed Size (px)
Citation preview

Page 1
Example of mWater Platform
By Mouhamed Fadel Ndaw, Sr. Water and Sanitation Specialist
November 2015
Field Note:
ICT Services to improve performances
of rural water private operators in West Africa
Page 2
1. INTRODUCTION
This Field Note provides an overview of the mWater platform, based on information from the WSP
study on “Unlocking the Potential of ICT Services in the Water and Sanitation Sector in Africa1”
completed in June 2015. This Field Note seeks to provide information on the mWater pilot projects
conducted in four West African countries (Senegal, Mali, Benin and Niger) to demonstrate the
feasibility of the use of ICT tools to improve the monitoring and management of rural and small
town piped water schemes.
The mWater platform is a service-oriented platform developed as a mobile-to-web monitoring
system. The platform was developed by the Senegalese mobile solutions company Manobi
through a public-private partnership co-funded by the WSP in 2007. As of today, mWater is
monitoring 251 water schemes in real-time and has an inventory of more than 35,000 water points
in the four countries of Senegal, Mali, Benin and Niger.
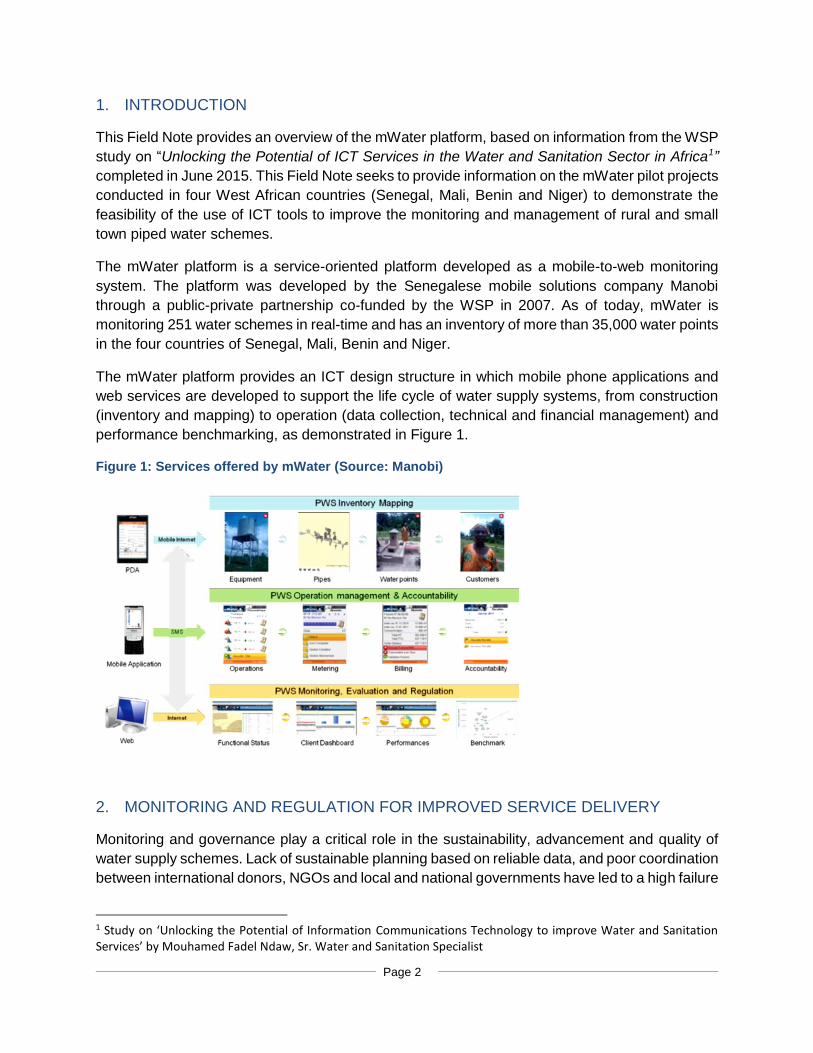
The mWater platform provides an ICT design structure in which mobile phone applications and
web services are developed to support the life cycle of water supply systems, from construction
(inventory and mapping) to operation (data collection, technical and financial management) and
performance benchmarking, as demonstrated in Figure 1.
Figure 1: Services offered by mWater (Source: Manobi)
2. MONITORING AND REGULATION FOR IMPROVED SERVICE DELIVERY
Monitoring and governance play a critical role in the sustainability, advancement and quality of
water supply schemes. Lack of sustainable planning based on reliable data, and poor coordination
between international donors, NGOs and local and national governments have led to a high failure
1 Study on ‘Unlocking the Potential of Information Communications Technology to improve Water and Sanitation Services’ by Mouhamed Fadel Ndaw, Sr. Water and Sanitation Specialist

Page 3
rate of WASH projects. In Africa, while there is considerable variation amongst countries,
estimates are that 24-30 percent of rural water supply systems are non-functional2.
In Senegal, Mali, Benin and Niger, approximately 53% of the rural population have access to an
improved water supply (refer to Figure 2 for country breakdown), while 23% of the rural population,
or approximately 8.3 million people, have access to a piped water scheme. The majority of these
schemes are operated by water user associations, domestic private operators through delegated
management arrangements, or other alternative service providers (management models vary by
country). The monitoring and governance of these small-scale rural water schemes, for which
reliable and up-to-date data is required, play a vital role in the sustainability and quality of the
services.
Figure 2: Rural water access statistics in Senegal, Mali, Benin and Niger (WHO/UNICEF, JMP 20143)
Total Population
(in ‘000)
Rural population
(in ‘000)
Rural access
rate (2012)
Rural population
served (in ‘000)
Rural access to piped
schemes* (2012)
Rural population served by
piped schemes (in ’000)
Senegal 13,726 7,824 60% 4,694 54% 4,225
Mali 14,854 9,507 54% 5,134 10% 951
Benin 10,051 5,428 69% 3,745 20% 1,086
Niger 17,157 13,726 42% 5,765 15% 2,059
Total 55,788 36,485 53% 19,338 23% 8,321 *A piped scheme is defined as a water system which provides access via a house connection, yard tap or public tap.
In rural areas of developing countries, the data required to improve planning, monitoring and
management of water services is often not available due to the high cost of the data collection
process. The development of appropriate monitoring tools to address this challenge is critical for
effective sector governance, increased system sustainability, and to improve equitability of
services provision to poor and vulnerable population groups.
3. THE FIRST GENERATION OF MWATER - SENEGAL PILOT
The mWater platform was developed by Manobi in Senegal in 2007 as a response to monitoring
challenges of the growing number of small-scale water schemes in rural areas and small towns.
The public-private partnership (PPP) between PEPAM (the Senegalese Water and Sanitation
Program for the MDGs) and Manobi, signed in June 2007, provided an ICT framework in which
mobile phone applications and web services were developed to support three fundamental
elements of the water supply systems: construction (inventory and geo-referencing of
2 Elizabeth L. Kleemeier 2010 Updated. Private Operators and Rural Water Supplies, A desk review of Experiences. 3 WHO/UNICEF, JMP 2014. Progress on Drinking Water and Sanitation. 2014 Update. Geneva: WHO/UNICEF Joint Monitoring Programme for Water Supply and Sanitation.

Page 4
infrastructure), operation (data collection, technical and financial management) and regulation.
The partnership was supported by WSP.
The platform supports the design and development of applications for the collection and
processing of monitoring and evaluation data by exploiting cell phone technologies and "mobile-
to-web" protocols in unified databases. The first generation of the platform focused on the
development of two layers of services:
A geographical information system that references the water and sanitation infrastructure
using GPS co-ordinates; and
A set of tools and services assisting water service operators (water associations and
private operators) to manage, both technically and financially, their small-scale water
supply network.
The first mWater pilot was conducted between April and September 2008 in Senegal, in the
regions of Louga and Thies. As part of the first layer of service, the mWater inventory mapping,
58 electronic data forms where collected and transmitted to the system through a PDA (Personal
Digital Assistant) application. 56 forms were from water points and 2 from sanitation points4.
As part of the second layer of service, the first mWater management service, water operators
used their mobile phones to send data by SMS on three technical and financial parameters (water
production index, financial savings, and breakdowns) which enabled the generation of easy to
use monthly performance monitoring reports. Figure 3 describes the frequency of reporting and
the utilization of the parameters. By the end of the pilot, the project had demonstrated that by
having access to such information, municipalities and other government stakeholders were able
to provide better technical assistance, as well as incentives to service providers to improve
operational efficiencies.
4 WSP, 2013. Assessment of the mWater platform for the monitoring of rural and small towns piped water schemes in Senegal, Mali, Benin and Niger.

Page 5
Figure 3 : mWater base parameters
Parameter Frequency Utilization
Water meter index Weekly Monitors bulk water production.
Cash balance
Weekly Monitors available cash in current cash books and in bank accounts
Alert SMS on water network breakdown
Ad-hoc Monitors the number of network breakdowns and servicing disruption days.
4. THE SECOND GENERATION OF MWATER PLATFORM (MWATER+) IN MALI, BENIN, SENEGAL AND NIGER
The positive results obtained by testing the inventory and basic management services in Senegal
stimulated the development of a second generation of services targeted to support the
management of water schemes in Mali within the framework of the country’s technical and
monitoring system for small water systems called STEFI (Suivi technique et financier). These
services were developed with the financial support of UNICEF and Agence Française de
Developpement. The tool, branded as mWater+, monitored 24 water schemes between April 2010
and November 2011 as part of a pilot phase5. After the pilot phase was concluded Manobi
maintained the platform operational and water operators have continued to use the services
offered.
In this second generation of services, the number of parameters collected increased. The new
mWater covered three layers of services: inventory and cartography, technical & financial
monitoring of the scheme’s management and sector performance & benchmarking. Figure 4
below describes the indicators that mWater captures and monitors over time for each water supply
system.
Figure 4: Data indicators monitored by mWater+ Platform
Access indicators Number of water points
Population coverage
Consumption indicators Meter readings
Average consumption
User quality of service indicators Water quality
Continuity of service
Technical indicators Functional status of the infrastructure
Network efficiency or Non-Revenue Water
Economic and financial indicators Energy costs
Lifespan of infrastructure and equipment
Renewal fund
5 WSP, 2013. Assessment of the mWater platform for the monitoring of rural and small towns piped water schemes in Senegal, Mali, Benin and Niger.

Page 6
Costs
Production costs per m3
Revenue
Inventory statement
Available cash flow
Pricing indicators Tariffs
Average bill collection period
Bill collection rate
Monitoring these indicators enables an assessment of how well the water supply system is
operating and informs decision-making that will ensure the sustainability of a quality service based
on reliable and objective information. By capturing more data in the production, distribution and
commercialization phases of the systems, Manobi was able to build a more complex web
dashboard in order to track indicators and generate automatic reports (refer to Figures 5-7).
Figure 5: mWater phone application and web platform

Page 7

Page 8
Figure 6: Visualization of mWater data – water source6
Figure 7: Visualization of mWater data – water rates7
The application enables8:
Monitoring and management of the operation and maintenance of small piped systems,
including breakdowns, service outages, water losses and leaks, and other physical
problems;
Monitoring of the operational status of the infrastructure and equipment, such as the
distribution network, water points, pumping equipment, etc.;
6 Adokpo Migan, S. 2014. mWater – Passage à l’échelle, contractualisation. Atelier régional. WSP, Banque Mondiale. Présentation PowerPoint. 17 diapositives. 7 Adokpo Migan, S. 2014. mWater – Passage à l’échelle, contractualisation. Atelier régional. 8 Cowater & iComms, 2015. TIC dans le secteur Eau, Assainissement et Hygiène (WASH) – BENIN – L'étude de cas de MWATER. Unpublished case study prepared for WSP.

Page 9
Dynamic mapping of system components, allowing the tracing and visualization of the
network;
Collection of data on availability and consumption of water, such as water volumes, water
available at the water points and in reservoirs, as well as fees collected;
Collection of information on the evolution of supply and demand for drinking water and
the related business services, including information on users, details of selected services,
volumes consumed and accounting; and
Collection and analysis of the financial operation and sustainability of the services
provided, allowing the evaluation of the state of the infrastructure and services offered,
the value of capital investments, financial performance, etc.
Interoperability and greater data accessibility through open data standards are possible with
mWater. The data can be exported from mWater in Excel or GIS format for analysis by any
application. However, this access to data needs to be carefully controlled and regulated by
establishing clear rules and documenting roles and responsibilities.
The mWater+ service was further deployed in Benin from December 2011. Fifty one (51) water
schemes, serving 169,000 people across 13 communes9, received technical assistance through
WSP support to the Beninese government. Later, in February 2012, the government of Niger also
requested the support of WSP to use the mWater platform for assistance and support of 62 water
schemes in the Tahoua region10. The pilot, conducted between November 2012 and October
2013, was so successful that the government wants to scale up to the entire country.
In January 2013 Manobi began to offer the mWater+ service to 14 water operators in Senegal.
This operation was financed by the Luxembourg Government through the PEPAM LuxDev
project11. WSP is currently supporting OFOR (Office des Forages Ruraux) in the Central zone to
implement a second scale up, to 600 systems12.
More recently, in September 2014 the third generation of mWater, with advanced functionality,
was scaled up and used to inventory 151 schemes in Benin13. 62% of the piped water schemes
in Benin under delegated management are now monitored using mWater14.
9 Manobi, 2013. Rapport Final de la Mise en Route de la plate-forme mWater d’appui au suivi-gestion des AEP et formation des beneficiaires. Prepared for WSP. 10 WSP, 2013. Assessment of the mWater platform for the monitoring of rural and small towns piped water schemes in Senegal, Mali, Benin and Niger. Data also corresponds to Manobi website & Cowater & iComms, 2015. TIC dans le secteur Eau, Assainissement et Hygiène (WASH) – BENIN – L'étude de cas de MWATER. Unpublished case study prepared for WSP. 11 WSP, 2013. Assessment of the mWater platform for the monitoring of rural and small towns piped water schemes in Senegal, Mali, Benin and Niger. 12 Cowater & iComms, 2015. TIC dans le secteur Eau, Assainissement et Hygiène – le cas du Sénégal. Unpublished case study prepared for WSP. 13 Adokpo Migan, S. 2014. mWater – Passage à l’échelle, contractualisation. 14 WSP. 2014. Using Mobile to Web Technology (mWater) to Improve Efficiency of Water Supplies (Benin case). Presented at 2014 World Water Week, Stockholm.

Page 10
Figure 8 demonstrates the timeline of the development, piloting and scale-up of the mWater
platform.
Figure 8: Timeline of development of mWater services
The inventory service of mWater has been implemented in Senegal, Mali, Niger and Benin with
the results shown in Figure 9.
Figure 9 : mWater inventory pilot results
Country Water points inventoried
Senegal 29,06215
Mali 1,76016
Niger 1,28817
Benin 3,66318
Total 35,773
In Senegal, as of June 2013, nearly 30,000 water points were referenced (85% of the existing
water points). Key advantages of the electronic inventory were a faster referencing of each water
15 Total figure aggregating inventory (26,262), mWater basic (1758) and mWater+ (678). Data from: WSP, 2013. Assessment of the mWater platform for the monitoring of rural and small towns piped water schemes in Senegal, Mali, Benin and Niger. 16 WSP, 2013. Assessment of the mWater platform for the monitoring of rural and small towns piped water schemes in Senegal, Mali, Benin and Niger. 17 Cowater & iComms, 2015. TIC dans le secteur Eau, Assainissement et Hygiène – le cas du Niger. Unpublished case study prepared for WSP. 18 Cowater & iComms, 2015. TIC dans le secteur Eau, Assainissement et Hygiène (WASH) – BENIN – L'étude de cas de MWATER. Unpublished case study prepared for WSP.
Senegal (2007 to 2009)
Development of inventory and basic
management services to 70 water schemes
Mali (Apr 2010 - Nov 2011)
Development and piloting of advanced monitoring services
to 24 water schemes Benin (Dec 2011)
mWater+ service to 51 water schemes
Niger (Feb 2012)
mWater+ service to 62 water schemes
Senegal (Jan 2013)mWater+ service to 14
water schemes
Benin (Sept 2014)
MWATER™ V3.0 with advanced functionality is active in Benin
on 151 schemes.

Page 11
point (3 to 5 minutes per point), automatic transfer and immediate integration to the web platform
and 30% reduction of data collection costs. In Benin, the use of mWater for inventory purposes
resulted in the reconstitution of drawings of assets and water networks for 51 rural water schemes.
The mWater+ platform is actively monitoring 251 water systems in the four countries, which
represents 7% of the 3,579 estimated total number of schemes in Senegal, Mali, Niger and Benin,
as shown in Figure 10. This does not include the 600 schemes in Senegal where scale-up is
currently on-going.
Figure 10: Deployment of mWater in Senegal, Mali, Benin and Niger19
Country Water schemes monitored
Total water supply
schemes
%
Senegal 1420 1,505 0.9%
Mali 2421 600 4%
Niger 62 1,017 6%
Benin 15122 457 33%
Total 251 3,579 7%
In the case of Benin, mWater has enabled municipalities to have access to essential data on the
water infrastructure in their jurisdiction, and according to Manobi23, mWater has facilitated access
to financing for service providers through documentation of historic data on technical and financial
operations permitting investments in the system, for example, investments required for expansion.
Previous to mWater, these data were simply not available.
5. FINANCING
All the core mWater mobile 2 web platform infrastructure and software has been entirely financed
by Manobi. Development partners have contributed to implementing the mWater platform within
the specific countries through the financing of pilots to test it and through participation in the
scaling up process, as in Benin.
In Benin, business-to-business contracts are being put in place to maximize financial
sustainability as part of the scale-up and the WSP/World Bank exit strategy, in collaboration with
the Direction du Service Public de l’Eau de la Régulation.
19 Data from : WSP, 2013. Assessment of the mWater platform for the monitoring of rural and small towns piped water schemes in Senegal, Mali, Benin and Niger. All data cross-referenced with additional sources, including Cowater’s country case studies prepared for WSP (2015) and Manobi’s website. 20 Another 70 water schemes were monitored using the mWater basic version but are no longer active as of June 2013, according to WSP, 2013. 21 The total water schemes to be monitored in Mali were 55 but due to security reasons, the number had to be reduced to 24, according to WSP, 2013. 22 Updated data from : WSP, 2014. Using Mobile to Web Technology (mWater) to Improve Efficiency of Water Supplies (Benin case). Presented at 2014 World Water Week, Stockholm. 23 Manobi, 2013. Rapport Final de la Mise en Route de la plate-forme mWater d’appui au suivi-gestion des AEP et formation des beneficiaires. Prepared for WSP.

Page 12
According to Manobi, three types of costs are included in the scale-up of mWater24:
Referencing/inventory of water schemes, a capital investment required prior to the
deployment of mWater;
Equipment and setup costs for water service providers, including a configured mobile
phone with the mWater application, initial data entry, and training of service provider
personnel; and
Operation and maintenance costs for the mWater platform, including on-going support
and reporting.
These costs vary per country and are demonstrated in the cases of Benin and Niger in Figures
11 and 12. Costs in Mali were higher with total costs estimated at CFA 2,673,000 per scheme25.
Figure 11 : Cost per system of mWater in Benin26
24 Manobi, 2013. Rapport Final de la Mise en Route de la plate-forme mWater d’appui au suivi-gestion des AEP et formation des beneficiaires. Prepared for WSP. 25 WSP, 2013. Assessment of the mWater platform for the monitoring of rural and small towns piped water schemes in Senegal, Mali, Benin and Niger. 26 Adokpo Migan, S. 2014. mWater – Passage à l’échelle, contractualisation.

Page 13
Figure 12 : Cost per system of mWater in Niger27
Included in the above are the costs of building the capacity of local and central government to use
the platform, assess the data and integrate the data into management decision-making, the cost
to the service provider for on-going data collection and air time and the cost to government to
maintain oversight over the monitoring process. There is no additional cost for equipment as
mWater runs on existing computers and smartphones.
6. KEY CHALLENGES
The following key challenges in scale up of the platform were identified during implementation in
the four pilot countries:
Diversity of the water sector in each country
The diversity of the water sector in each country is a challenge that requires a great level of
contextualization and adjustment to the reality of rural water management. For example, the
system had to be adapted based on the existence of a regulatory body, the type of delegation
mode (public/community based vs. private management of water schemes), the multiplicity of
schemes managed by the same operator, the existence of technical support services, the diversity
of the water price structure by country, etc. In each country, the platform had to be customized
according to these aspects.
27 Manobi, 2013. Rapport Final de la Mise en Route de la plate-forme mWater d’appui au suivi-gestion des AEP et formation des beneficiaires. Prepared for WSP.

Page 14
Connecting with mobile operators
Establishing partnerships with mobile operators in new countries can present technical and
financial challenges when scaling-up services. By aligning with an operator who works in multiple
countries the negotiation across boundaries can be simplified.
Lack of mobile and internet infrastructure
The coverage and reliability of ICT infrastructure, particularly mobile infrastructure, is increasing
rapidly in African countries, including in rural areas. However, there are still remote areas which
do not have access to these services or to electricity, limiting the applicability of the mWater
platform in these areas (e.g. in Niger mobile phone penetration is approximately only 40% of the
population). The cost of internet access can also be prohibitive.
Resistance to change
The mWater platform enables greater transparency and accountability in the water sector, which
for the public is a direct benefit. However, operators and local government may be less willing to
embrace a system which facilitates public accountability and financial transparency.
Stakeholder relationships
Management of stakeholder relations between the public and private sector, including potential
implementing partners, requires close coordination between the various stakeholders, who do not
always have the same objectives. Particularly in the context of PPP, reaching consensus can take
significant effort and time.
7. SUCCESS FACTORS FOR SCALING UP
The key factors for successful scale up, drawn from the four pilot countries, have been28:
1. Demand driven process: The client should act as project champion, driving the scale up
process according to its needs, with the participation of water service providers.
2. Standardization: Standardized terminology will ensure consistent asset description and
categorization, and clearly defined performance monitoring indicators, while standard
reporting formats facilitate assessment and benchmarking.
3. Piloting: A successful pilot demonstrates results to stakeholders and enables identification
and mitigation of potential bottlenecks. Results in terms of improved scheme performance
and profitability can be used to gain stakeholder confidence in the advantages of the
application.
28 Success factors collected from the following sources : WSP. 2014. Using Mobile to Web Technology (mWater) to Improve Efficiency of Water Supplies (Benin case). Presented at 2014 World Water Week, Stockholm. Cowater & iComms, 2015. TIC dans le secteur Eau, Assainissement et Hygiène – le cas du Niger. Unpublished case study prepared for WSP. Cowater & iComms, 2015. TIC dans le secteur Eau, Assainissement et Hygiène (WASH) – BENIN – L'étude de cas de MWATER. Unpublished case study prepared for WSP. Cowater & iComms, 2015. TIC dans le secteur Eau, Assainissement et Hygiène – le cas du Sénégal. Unpublished case study prepared for WSP.

Page 15
4. Sequencing of implementation: The mWater platform should be implemented through a
step-by-step process, beginning with inventory/mapping, adding core service monitoring
tools and finally added value services. This allows the sector to gain an understanding of
the tool, facilitates its acceptance and use, and enables capacity to be developed in a
sustainable manner.
5. Cost-sharing business model: A public/private cost-sharing business model will contribute
to the financial sustainability of the platform.
6. Clear roles and responsibilities: The roles and responsibilities, as well as data access
regulations (conditions for access, data ownership), must be clearly delineated, including
in IT services contracts and agreements between stakeholders, to ensure the most
appropriate levels of access to the data and its effective analysis and use.
7. Monitoring and supervision: Continuous monitoring of the scale-up phase is essential to
ensure appropriate systems and processes are put in place and results achieved. Close
monitoring by higher levels of government using the data produced enables corrective
actions to be taken with each service provider as required, and also institutionalizes use
of the data for monitoring purposes.
8. Addressing the quality of wireless connectivity: A methodology for rapid incident
management should be agreed upon with the mobile service provider to ensure service
issues were dealt with within 24 hours.
9. Responsive reporting formats: A responsive platform that can be customized to meet the
reporting needs of a particular country, and generate required reports enables
standardization of reporting and also creates an incentive for uptake of the platform by
service providers and government.
10. Standardized data collection: A standard process for data collection, including when and
the number of times data is to be collected each month, enables the reports generated to
be comparable between service providers and municipalities.
11. Ownership of results: Key stakeholders, including the sector regulator, must be highly
involved in the planning and implementation process. Data collection, and more
importantly its use in planning and management decision-making, need to be
institutionalized at all levels and integrated into sector regulation to ensure sustained
demand for the data.
12. Capacity building: Customized capacity building should be delivered for each group of
users (administrator, approver, operator, user), including on-going capacity building for all
stakeholders and users of the tool.
8. CONCLUSIONS
1. The four successive mWater pilots in Senegal, Mali, Benin and Niger have demonstrated that
it is possible to collect data from remote rural areas using mobile phones and to provide a web
platform with almost real-time data that can be analysed and used to improve the
management of the schemes.
2. The inventory service provided by mWater has demonstrated that it is possible and necessary
to document with accuracy water assets and to plan renewals and extensions to ensure
effective management of those assets by:
a. Normalising the description and data collection system of water assets.

Page 16
b. Organising all stakeholders in the usage of a collective data warehouse by ensuring
collection and update of the same asset datasets.
c. Reducing the costs and delays of conducting inventory and cartography of water assets.
3. The technical and financial management services has shown that it is possible to collect
operational data and provide valuable feedback information to service providers to improve
the ability to analyse sector data and as a result the management of the schemes, and
produce automated reports:
a. The customer management module strengthens consumer confidence in the quality of
service of the water operator through more transparent service delivery.
b. The equipment and network breakdown alert module can improve the organization of
maintenance services.
c. The automatic report generation module concerning production, distribution and
management of the schemes increases interaction between the water operators,
municipalities and the sector government authority and enables better monitoring by local
government.
d. The applied transparency in financial flows and technical management of the water
systems allows for better accounting reports and increases the possibility for service
providers to self-finance network extensions and household connections by using
commercial banks and local financial institutions, as the data permit a better evaluation of
the potential and economic possibilities for investors and operators.
4. The benchmarking and regulation services will strengthen the capacity of the State to
effectively use the results to plan and monitor investments, enhancing the level of water
access and the quality of water for the most vulnerable populations. It also enables
comparison in close to real-time of water operators’ performance and facilitates regulators’
decisions on contract management and support to service providers.
5. The regional approach adopted with the mWater platform facilitates:
a. Sharing of investment and operational costs of the tool, making the service more
accessible to the greatest number of water operators, municipalities and government
services.
b. Normalising national and regional monitoring indicators for the performance of water
systems, enabling comparison at different scales.
c. Stimulating the development of the quality of service by sharing experiences with a
common technical base between neighbouring countries in the framework of a
straightforward and simplified South-South cooperation.
6. The pilots demonstrated that an ICT-based platform such as mWater allows information-
sharing amongst all stakeholders in the sector and enables the harmonization of monitoring
and reporting tools which then can facilitate comparisons at the local, regional and national
level. This can result in improved sector planning and resource distribution based on results
achieved at the local level (through benchmarking) and focusing resources on underserved
areas and populations enabling more equitable services distribution.
7. The improved information availability and management of the schemes as a result of mWater
permits an increase in profitability and encourages the implementation of PPP concessions
with private operators.

Page 17
8. Benchmarking of the on-going performance of private operators can support increased
transparency, elevate business standards and highlight areas where capacity strengthening
is needed.
9. Finally, it was demonstrated that financial and human resources support, as well as an exit
strategy from external support and the development of an appropriate business plan are
required to ensure the sustainability of the platform and its on-going use.