Embed Size (px)
Citation preview

ORNL/CON=228/Pl
Field Test Evaluation of Conservatioil Retrofits of Low-Income Single-Family Buildings in Wisconsin:
Summary Report
Mark P. Ternes Fred D. Boercker Lance N. McCold Michael B. Gettings

. .
1
Printed in the United States of Amerika. Available from National Technical Information Service
U.S. Department of Commerce 5285 Port Royal Road, Springfield, Virginia 22161
NTIS price codes-Printed Copy: ~05 Microfiche ,401
This report was prepared as an account of work sponsored by an agency of the UnitedStatesGovernment. NeithertheUnitedStatesGovernment noranyagency r-----l thereof, nor any of therr employees, makes any warranty, express or Implied, or assumes any legal liability or responsrbility for the accuracy, completeness, or usefulness of any information, apparatus, product, or process disclosed, or represents that its use would not infringe privately owned rights. Reference herein to any specific commercial product, process, orservice by trade name, trademark, manufacturer, or otherwise, does not necessarily constitute or imply its endorsement, recommendation, or favoring by the United States Government or any agency thereof. The views and opinrons of authors expressed herein do not necessarily state or reflect those of the IJnited StatesGovernment or any agency thereof.

ORNL/CON-228/=1
ENERGY DIVISION
FIELD TEST EVALUATION OF CONSERVATION RETROFITS OF LOW-INCOME SINGLE-FAMILY BUILDINGS IN WISCONSIN: SUMMARY REPORT
Mark P. Ternes Fred 0. Boercker Lance N. McCold
Michael 8. Gettings
Date Published - July 1988
Building Energy Retrofit Research Program
Prepared for the Office of Buildings and Community Systems
and the Office of State and Local Assistance Programs
U.S. Department of Energy
Prepared by the OAK RIDGE NATIONAL LABORATORY
Oak Ridge, Tennessee 37831-6285 operated by
MARTIN MARIETTA ENERGY SYSTEMS, INC. for the
U.S. DEPARTMENT OF ENERGY under Contract No. DE-AC05-84OR21400

Reports in This Series
General Title: FIELD TEST EVALUATION OF CONSERVATION RETROFITS OF LOW-INCOME, SINGLE-FAMILY BUILDINGS IN WISCONSIN
ORNL/CON-228/Pl. Summary Report
ORNL/CON-228/P2. 4udit Field Test Implementation and Results
ORNL/CON-228/P3. Combined Building Shell and Heating System Retrofit Audit
ORNL/CON-228/P4. Occupant Behavior and House Thermal Characteristics in Fifteen Energy Conservation Retrofitted Houses
ORNL/CON-228/P5. Blower-Door-Guided Infiltration Reduction Procedure, Field Test Implementation and Results

TABLE OF CONTENTS
LIST OF FIGURES. .......................
LIST OF TABLES ........................
ACKNOWLEDGMENTS. .......................
ABSTRACT ...........................
EXECUTIVE SUMMARY. ......................
1.
2.
3.
4.
INTRODUCTION . . . . . . . . . . . . . . . . . . . . . . . 1.1 BACKGROUND. ..................... 1.2 PURPOSE .......................
PARTICIPANTS IN THE WISCONSIN FIELD STUDY. ........ 3 2.1 PARTICIPANTS AND THEIR ROLES. ............ 3 2.2 DOE OBJECTIVES FOR THE STUDY. ............ 6 2.3 STATE OF WISCONSIN GOALS. .............. 7 2.4 PRIVATE SECTOR (UTILITY) GOALS. ........... 8 2.5 ASE ORJECTIVE .................... 8
OVERVIEW OF THE WISCONSIN FIELD TEST ........... 3.1 AUDIT-DIRECTED RETROFIT PROCEDURE .......... 3.2 BLOWER-DOOR-GUIDED INFILTRATION REDUCTION PROCEDURE . 3.3 OCCUPANT BEHAVIOR AND HOUSE THERMAL CHARACTERISTICS
STUDY ........................ 3.4 FIELD TEST EXPERIMENTAL DESIGN. ...........
11 11 14
18 19
27 27 36
39
SUMMARY OF FINDINGS FROM THE FIELD TEST. . . . . . . . . . 4.1 AUDIT-DIRECTED RETROFIT PROCEDURE . . . . . . . . . . 4.2 BLOWER-DOOR-GUIDED INFILTRATION REDUCTION PROCEDURE . 4.3 OCCUPANT BEHAVIOR AND HOUSE THERMAL CHARACTERISTICS
STUDY . . . . . . . . . . . . . . . . . . . . . . . .
IMPLICATIONS OF THE FIELD TEST FINDINGS. FOR FUTURE SINGLE-FAMILY RETROFIT PROGRAMS. . . . . . . . . . . . . .
REFERENCES . . . . . . . . . . . . . . . . . . .-. . . . . . .
V
vii
ix
xi
xiii
1 1 1
45
49
iii

t
,

2.1
3.1
3.2
3.3
4.1
4.2
4.3
LIST OF FIGURES
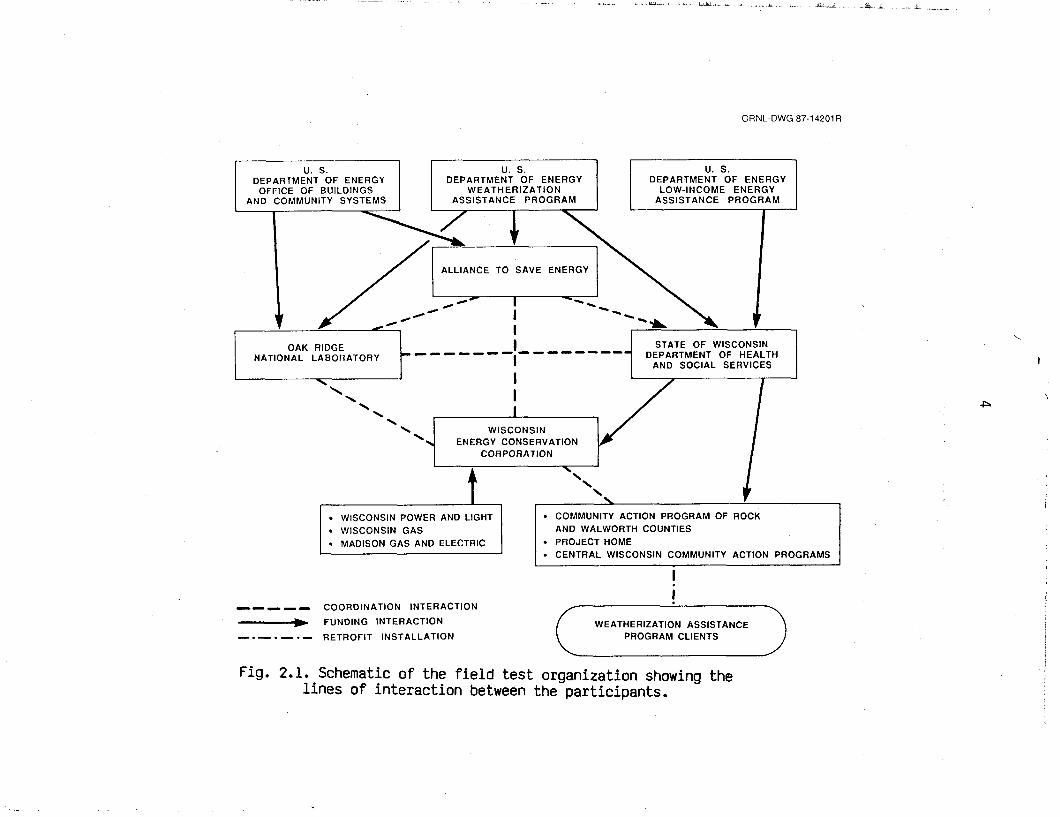
Schematic of the field test organization showing the lines of interaction between the participants. . . . . . . . . .
Overview of projects comprising the Field Test Evaluation of Conservation Retrofits of Low-Income, Single-Family Buildings. . . . . . . . . . . . . . . . . . . . . . . . .
Picture and diagram of a blower door . . . . . . . . . . .
The hatched area shows the location of the low-income, single-family buildings used in the field test . . . . . .
Predicted savings vs measured savings, by predominant retrofit type. (Both the predicted and measured savings do not include pilot gas savings. The measured savings have been adjusted for control group savings.) . . . . . .
Comparison of predicted and measured energy savings for individual houses. The vertical lines indicate the 90% confidence intervals of the measured savings. (Both the predicted and measured savings do not include pilot gas savings. The measured savings have not been adjusted for control group savings.). . . . . . . . . . . . . . . . . .
Temperature at the thermostat and in the living room compared with average house temperature. . . . . . . . . .
4
12
16
20
32
33
43
V

g:
k

LIST OF TABLES
3.1 Air leakage rate reduction goals used in the blower-door-guided infiltration reduction procedure. . . 17
3.2 Information collected for 66 houses in the Wisconsin field test evaluation of conservation retrofits. . . . . 22
4.1 Comparison of program costs and energy savings: 1983 WECC study vs 1985-86 field test results . . . . . . . . 29
4.2 Reportable average audit group savings . . . . . . . . . 30
4.3 Air leakage rate reductions and retrofit costs. . . . . 38
4.4 Pre- to post-retrofit thermostat temperature and setpoint changes calculated using daily data. . . . . . 41
vii

t

ACKNOWLEDGMENTS
This study required the cooperation of individuals from many
organizations. Only with their efforts and contributions was the
project possible. The authors wish to acknowledge the following:
Department of Energy/Office of Buildings and Community Systems,
Mr. Ernie Freeman Department of Energy/Weatherization Assistance Program,
hlr. Jim Gardner Alliance to Save Energy, Mr. Mark Hopkins, Mr. George Guyant,
Mr. Steve Tull, and Ms. Leslie Post
Wisconsin Department of Health and Social Services, Ms. Cathy Ghandehari and Mr. Peter Pawlisch
Wisconsin Energy Conservation Corporation, Mr. Jeffrey Schlegel, Ms. Linda O’Leary, and Mr. David Hewitt
Wisconsin Power and Light, Mr. Don Neumeyer and Mr. Rick Morgan Wisconsin Gas, Mr. Wally Zeddun and Mr. Kurt Koepp
Madison Gas and Electric, Ms. Claire Fulenwider and Mr. Robert Stofts Community Action Program (CAP) of Rock and Walworth Counties,
Mr. Warren Jones and Mr. Peter Tracey ProSect Home, Mr. Ken Stanek
Central Wisconsin CAP, Mr. Lee Duerst
Oak Ridge National Laboratory, Mr. Bill Mixon, Mr. Mike Karnitz,
Mr. David Wasserman, and Miss Clara Brown
ix

ABSTRACT
During the winter of 1985-86, a retrofit field test was performed in 66 occupied, low-income, single-family homes in Madison, Wisconsin. The primary objectives of the field test were to (1) determine the measured energy savings and the relative benefits of a combination of envelope and mechanical equipment retrofits that were selected following a new audit-directed retrofit procedure, (2) determine the energy savings and benefits due to performing infiltration reduction work following a recently developed infiltration reduction procedure, and (3) study general occupant behavior and house thermal charac- teristics and their possible change following retrofit installation. This report provides an overview of the project and summarizes the findings which will be presented in detail in separate reports.
(11
1
I I
i (2)
i
Major findings from the field test include
The audit-directed retrofit procedure produced an average savings of 207 therms/year/house. The procedure also more than doubled the overall cost-effectiveness of the low-income weatherization assistance program as compared with the priority system formerly used in Wisconsin. Wall insulation and condensing furnaces were the major retrofits (predicted annual energy savings greater than 100 therms/year) most often selected under the procedure. The respective average energy savings of the houses receiving wall insulation and condensing furnace. s was 14.6 and 14.3 therms/year for each $100 spent on them under the program.
The blower-door-guided infiltration reduction procedure reduced expenditures for infiltration reduction to about one-fourth of previous program costs (from $570/house to $106/house). The procedure also reduced the average air leakage rate in the treated houses by 16%, whereas, in a previous study, no significant reduction was found following the installation of typical infiltration reduction measures.
(3) Twenty to 60% of the deviation between predicted and measured savings can be attributed to incorrect assumptions regarding the indoor temperature before and after retrofit used in making the predictions. Incorrect assumptions regarding the value of the indoor temperature before retrofit may be more prevalent than incorrect assumptions regarding a constant indoor temperature following retrofit, as the occupants did not generally increase their indoor temperature after retrofit installation (the occupants did not generally display "take back" behavior).
xi

..-. .__

EXECUTIVE SUMMARY
FIELD TEST BACKGROUND AND PURPOSE
During the winter of 1985-86, Oak Ridge National Laboratory
(ORNL), the Alliance to Save Energy, and the Wisconsin Energy Conservation Corpbration (WECC) performed a field test in 66 occupied,
low-income, single-family homes in the area of Madison, Wisconsin.
Financial support for this field test was supplied by the U.S.
Department of Energy (DOE), Office of Buildings and Community Systems;
the DOE Weatherization Assistance Program (WAP); the DOE Low-Income
Energy 4ssistance Program; the State of Wisconsin, Department of
Health and Social Services; and three Wisconsin utilities (Wisconsin
Power and Light, Wisconsin Gas, and Madison Gas and Electric).
The primary objectives of the field test were to (1) determine the measured energy savings and the relative benefits of a combination
of envelope and mechanical equipment retrofits that were selected
foliowing a new audit-directed retrofit procedure (ADRP),
(2) determine the energy savings and benefits due to performing infiltration reduction work following a recently developed
infiltration reduction procedure, and (3) study general occupant
behavior and house thermal characteristics and their possible change
following retrofit installation. ORNL is preparing, in addition to
this summary report, several detailed reports. (A list of these
reports is provided at the front of this document.)
FIELD TEST STUDIES
The three field test objectives guided the design of the field
test and, in order to provide answers to them, the field test was
divided into three significant studies:
. . . x111

. ’ .-
(1) ORNL de ve 1 oped an ADRP to improve the selection of
building-envelope and heating-system retrofits. The improvement lies in analyzing houses individually to determine which
retrofits are most cost-effective for that particular house
rather than adhering to a fixed priority list approach typical of
most weatherization assistance programs. Further, the ADRP
includes a rational process for deciding the amount of money to
spend on each house in a group of houses. Because houses receive different retrofits and various amounts of money are spent on
each house, the ADRP can significantly enhance program energy savings per dollar of retrofit investment. The primary objective
of this study was to determine the benefits and performance of
the AORP and to measure the energy savings of combined
heating-system and building-envelope retrofits.
(2) WECC de ve oped an infiltration reduction procedure that uses a 1
blower door to improve the infiltration reduction work performed under weatherization programs. Weatherization programs have previously focused on caulking and weatherstripping doors and
windows. Under the infiltration reduction procedure, the air leakage rate of the house is determined using a calibrated blower door, allowing expenditure levels and air leakage rate reduction
goals for each house to be set. Major leaks in the house are sealed while the blower-door is in place to help locate the leaks and to track the air leakage rate during retrofit. The homes are sealed until the air leakage reduction goal or the expenditure level is reached. The primary objectives of this study were to assist in the development of the procedure and to investigate its
cost-effectiveness.
(3) Two explanations have been proposed to explain why measured energy savings of retrofit programs are less than predicted and why large scatter is observed in the measured energy savings of
similar homes modified with similar retrofits: (a) actions taken
xiv

by the occupants following retrofit, such as increasing the
thermostat setpoint, may reduce savings, and (b) the actual
temperatures in the house may be lower than the value assumed in
estimating the retrofit savings. This study was performed to
address these and other related issues by determining [a) if the
indoor temperature of the house changes following retrofit installation, (b) if the expected deviation between predicted and monitored energy savings could be reduced by including indoor temperature in the analysis, and (c) general occupant behavior
and house thermal characteristics and their possible change
following retrofit installation.
FINDINGS
Audit-Directed Retrofit Procedure
The ADRP was found to be a successful tool for cost-effectively
selecting building-envelope and heating-system retrofits in weatherization programs, offering significant advantages compared to a fixed priority list approach. Replacing inefficient furnaces with
higher-efficiency units and installing wall insulation were found to
be effective retrofits well worth considering in weatherization programs. Specific results and conclusions obtained from the audit
portion of the field test were
(1) The ADRP, which used an expanded list of building-envelope and
heating-system retrofits, more than doubled the overall cost-effectiveness of Wisconsin's low-income WAP as compared with the priority system formerly used in Wisconsin in 1982. The
annual energy savings achieved by the program per hundred program dollars increased from 4.8 therms/year/$100 in 1982 to
12.6 therms/year/$lOO.
xv

(2) Condens' lng furnace replacement and wall insulation are major retrofits (predicted annual savings greater than
100 therms/year) that appear to be cost-effective. Minor retro- fits (such as vent dampers and infiltration reduction) do not
appear to be. The average energy savings of the houses
receiving wall insulation was 14.6 therms/year for each $100 spent on them under the program, about the same as the houses
receiving a condensing furnace. The average energy savings of
the houses receiving no major retrofits was only 18 therms/year per hundred program dollars.
(3) The average savings of the houses was 207 therms/year, or 19% of
the average pr e-retrofit space heating consumption of the houses.
Individual house savings was quite variable, ranging from -162 to 604 therms/year. On average, the houses receiving a major retrofit saved the most energy: 345 therms/year and 257
therms/year for the houses receiving a condensing furnace and wall insulation, respectively, as compared to an average of
12 therms/year for houses receiving only minor retrofits. The
variability of the individual house savings and the concentration of the savings in the houses receiving a major retrofit can
largely be attributed to the ADRP which was designed to
concentrate retrofits in houses that would most .benefit from the
retrofits.
(4) The annual h ea ing t energy savings for the entire group of retrofitted houses was approximately 83% of that predicted. On average, the audit accurately predicted the savings for condensing furnaces, but overpredicted the savings for wall
insulation (by about 25%) and the minor retrofits. The energy savings for individual houses was not predicted accurately by the
audit.
xvi

(5) The retrofits selected by the ADRP were quite different from the retrofits employed in the traditional weatherization program: only four of 20 houses retrofitted fo,llowing the ADRP received ceiling insulation and none received storm windows. Condensing
furnaces and wall insulation were major retrofits most often
selected by the ADRP in the 20 test homes.
Blower-Door-Guided Infiltration Reduction Procedure
The blower-door-guided infiltration reduction procedure was found
to be a useful tool to reduce expenditures for infiltration reduction while ensuring that significant air leakage rate reductions are obtained. Hot,vever, the infiltration reduction work that was performed
did not produce, on average, measurabale energy savings in the test
houses. Specific results and conclusions obtained from the *‘blower
door** portion of the field .test were
(1) The blo wer-door-guided infiltration reduction procedure reduced
expenditures (labor plus material) for infiltration reduction to about one-fourth of that previously required by Wisconsin's WAP
(from $570/'house to $106/house).
(2) The infilt ra ion reduction procedure reduced the average air t
leakage rate in the treated houses by 16%, whereas, in a previous study, no significant reduction was found following the installation of typical infiltration reduction measures.
(3) The air leakage rate reductions were, on average, largest in the
houses recommended by the procedure to receive infiltration reduction measures (work was performed on additional houses that
was not recommended by the procedure). Because the reductions
of individual houses were quite variable, the potential reduction of a house depends on more than the initial air leakage rate.
xvii

(4) The infilt ra Ion reduction procedure applied to a group of houses t'
provided an effective guide to the average amount of infiltration reduction that can be achieved and the expense necessary to accomplish the reduction.
(5) Although air leakage rates were reduced using the infiltration
reduction procedure, a reduction in the average energy consumption of the treated houses was not observed from an
analysis of metered energy use data.
Occupant Behavior and House Thermal Characteristics Study
Indoor temperature changes attributable to the installation of
conservation measures were not generally observed. However, consideration of the indoor temperature in the analysis can explain a
large portion of the deviation between predicted and measured savings.
Specific results and conclusions obtained from the occupant behavior and house thermal characteristics study were
(1) Twenty to 60% of the deviation between predicted and measured savings can be attributed to incorrect assumptions regarding the
indoor temperature before and after retrofit used in making the
predictions. Incorrect assumptions regarding the value of the
indoor temperature before retrofit may be more prevalent than
incorrect assumptions regarding a constant indoor temperature following retrofit, as the occupants did not generally increase their indoor temperature after retrofit installation (the
occupants did not generally display "take back" behavior).
(2) A single indoor temperature was found to adequately represent the
average house temperature in many homes.
. . . xv111

(3) Indoor temperature and thermostat setpoint are distinct
parameters such that inferences concerning one cannot be made
from the other; thus, both need to be monitored if both are to be
studied in an experiment.
(4) Occupant's perceptions of their house's thermal characteristics and comfort, and their change following retrofit installation, were found to be inconsistent with measured data; thus, responses to occupant questionnaires may not provide sufficiently accurate data to be generally useful in audits or analyses to supplement
or interpret results.
xix
,i


1. INTRODUCTION
1.1 BACKGROUND
A retrofit field test involving 66 occupied, low-income, single-
family homes in the area of Madison, Wisconsin was performed during
the winter of 1985-86. The primary objectives of the field test were
to (1) determine the measured energy savings and the relative benefits
of a combination of envelope and mechanical equipment retrofits that
were selected following a new audit-directed retrofit procedure (ADRP); (2) determine the energy savings and benefits due to per- forming infiltration reduction work following a recently developed
infiltration reduction procedure; and (3) study general occupant
behavior and house thermal characteristics and their possible change
following retrofit installation.
1.2 PURPOSE
Oak Ridge National Laboratory (ORNL) is preparing, in addition to
this summary report, several detailed reports on the results of this
project. (A list of these reports is provided at the front of this document.) The purpose of this summary report is to provide a concise
and timely listing of the major findings and to provide an overview of the entire project which otherwise might be lost in the detail of
individual reports. The general purposes of this report are to
1. provide an overview of the field test performed in Wisconsin,
identifying the various studies that were performed, the background that led to the need for the studies, and the various forthcoming reports;
2. provide a summary of the major findings, omitting much of the
technical detail; and
3. discuss implications of these findings for future and similar building energy retrofit programs.

2
The questions of concern to each of the major participants in the
study and the role each performed are identified in Sect. 2. In Sect. 3, a detailed overview of the field test and specific objectives of each study are presented. The major findings are summarized in Sect. 4. 'Implications of the field test findings for future single- family retrofit programs are discussed in Sect. 5.
3
2. PARTICIPANTS IN THE WISCONSIN FIELD STUDY
2.1 PARTICIPANTS AND THEIR ROLES
The field test was a”cooperative effort among several organiza- tions, as shown in Fig. 2.1. The most important requirement was that
all participants function as a team, each performing the required tasks on a very tight schedule so that the entire project could be
completed within less than one year. The major tasks that had to be
performed were
1. Select or develop an audit technique that could recommend the
most cost-effective combination of retrofits for each house and
for the entire retrofit program.
i. Develop an infiltration reduction procedure using a blower door to optimize the amount of infiltration work per-formed in a house.
3. Design analysis methods capable of evaluating the effectiveness
of the audit technique and infiltration reduction procedure, using a single winter’s data, and capable of studying the rela-
tions between retrofit installations, occupant behavior, and
house thermal characteristics.
4. Devise methods of field metering that are inexpensive and non-
intrusive for the occupants, but capable of yielding the required
data.
5. Implement the field test plan and collect the necessary data.
6. qnalyze the data and report results.
ORNL-DWG 87.14201 R
l COMMUNITY ACTION PROGRAM OF ROCK
l CENTRAL WISCONSIN COMMUNITY ACTION PROGRAMS
I
-- - -- COORDINATION INTERACTION
) FUNDING INTERACTION
-. - . - . - RETROFIT INSTALLATION (-c&i-q
Fig. 2.1. Schematic of the field test organization showing the lines of interaction between the participants.
,
E

5
Financial support for this field test was supplied by the
U.S. Department of Energy (DOE), Office of Buildings and Community
Systems (DOE-OBCS); the DOE Weatherization Assistance Program (DOE-WAP); the DOE Low-Income Energy Assistance Program (DOE-LIEAP);
the State of Wisconsin, Department of Health and Social Services (DHSS); and three Wisconsin utilities (Wisconsin Power and Light,
Wisconsin Gas, and Madison Gas and Electric).
The DOE offices provided funding to ORNL and the Alliance to Save
Energy (ASE) to develop and test a method for selecting optimal com-
binations of retrofits. ASE helped initiate the project and assisted
in the planning and management of the project; ASE's efforts were instrumental in getting the State of Wisconsin DHSS to join in the
field test. ORNL was funded to assist in the technical aspects of the
evaluative study. ORNL developed the audit and the field test plan
with input from ASE, DHSS, and the Wisconsin Energy Conservation Corporation (WECC) and also had responsibility for analyzing the data
and reporting results. DHSS funded WECC to develop a unique infiltra-
tion reduction procedure and to implement the field test, which
included selecting the homes to retrofit and meter, purchasing and
installing meters, collecting weekly meter readings, training audi-
tors, performing audit calculations, and coordinating the retrofit
activities. DHSS also provided some of its WAP and LIEAP funds to be
used for weatherization of homes in the field test. The three utili-
ties provided funds for the purchase and installation of meters used
in the field test. Although each of the groups involved in the field
test had an interest in providing maximum energy conservation to low- income homes at reasonable cost, each had a different role in the
overall process. Consequently, each had somewhat different concerns that needed to be addressed in the evaluation of the weatherization program, and each had different questions that needed to be answered by the field test study. The remainder of this section discusses
briefly some of the questions of concern to each of the major par- ticipants in the Wisconsin field test.

6
2.2 DOE OBJECTIVES FDf? THE STUDY
The Single-Family Retrofit Research Program of the DOE-OBCS,
Building Services Division,1 needed quality field data on the perfor- mance of energy conservation retrofits in occupied homes to decrease the uncertainty of savings predictions. The DOE-OBCS program also desired to work closely with those implementing conservation programs in order to include the most effective retrofit measures and to
facilitate transfer of results to practice. This project represents the initial cooperative, cost-shared field monitoring project that was important to establish roles and procedures, test monitoring and
analysis methods, and provide initial data on retrofit issues of interest to OBCS, which included
1. What are the energy savings and cost savings of combined shell
and mechanical retrofits? 2. Why do specific energy conservation retrofits save less energy
than predicted? 3. To what extent does occupant behavior account for some of the
lost energy savings? Is there evidence that occupants convert some potential savings into greater comfort (higher thermostat settings), thus "taking back" savings?
4. To what extent can field test evaluation procedures for single- family buildings be improved and standardized? How may the
metering and data analysis be carried out with minimum cost and
yet yield credible answers regarding energy savings? Can the
entire field test (pre-retrofit metering, retrofit, and post-
retrofit metering) be carried out in a single winter?
The WAP of the DOE State and Local Assistance Program is the major source of funding for energy conservation retrofits of low-
income housing. This program was created in 1976 by Title IV of
Public Law 94-385. WAP's major interests in the Wisconsin field test
were to (1) identify any improvements in the method of implementing

7
low-income retrofit programs that would provide greater energy and
dollar savings per dollar of WAP investment in retrofits, and
(2) learn to what extent occupant behavior is reducing WAP energy
savings below the expected levels. Field-tested improvements in the
Wisconsin program could be transferred, where applicable, to other states, thus multiplying the savings.
2.3 STATE OF WISCONSIN GOALS
In 1986, Wisconsin spent over $18 million of federal funds to
weatherize 7500 low-income homes -- $7.5 million from WAP and $10.5
million from LIEAP, representing 15% of the state's total LIEAP award. In addition, the Utility Weatherization Assistance Program for low-
income homes is mandated by the Wisconsin Public Service Commission
and involves 11 of the largest gas and electric utilities. This
program spent $8 million in 1985 to weatherize 7300 homes.
In 1983, the Wisconsin Department of Administration authorized an evaluative study of the low-income weatherization program to be con-
ducted by WECC, a state-wide, non-profit corporation. Results of the
study were reported in October, 1984, in four volumes.* The study
showed that almost all of the houses weatherized in 1982 were being
treated to the same set of retrofits: caulking and weatherstripping,
insulating water heater tanks, insulating warm air ducts, insulating
the attic, and adding storm windows. Based on analyses of monthly
utility bills, average energy savings from these retrofits was esti- mated to be 80-130 therms/year/house or approximately 6 to 10% of the
annual home gas use. Recommendations from the study were to adopt a
new and expanded list of retrofit measures, to use blower doors to improve infiltration control work, to insulate walls, and to retrofit or replace furnaces.
As a result of this evaluative study, the State of Wisconsin DHSS
had a number of special interests in a field test:

- - .-_-. > I T _. ..- .i. “,~_l.-~_.-__-. .._.. -... .
v”‘ /
1. Can the energy saved per dollar invested in the Wisconsin
low-income retrofit program be improved? 2. Could the use of blower doors significantly improve the effec-
tiveness of infiltration control measures? 3. Could an improved procedure be devised to select retrofits best
suited for individual houses?
4. Would additional retrofit options, such as furnace replacement and insulation of walls (both expensive retrofits), prove to be a
wise use of retrofit money?
2.4 PRIVATE SECTOR (UTILITY) GOALS
Because of their involvement in the Utility Weatherization Assistance Program, the larger utilities serving Wisconsin had
interests in a field test study. Questions of concern to them include
1. Which retrofits are the most cost-effective for low-income homes
in Wisconsin?
2. For those retrofits that do not perform as expected, does the fault lie with the quality of the installation of the retrofit or with the method of predicting the savings?
2.5 ASE OBJECTIVE
ASE is a non-profit organization founded in 1977 to promote effi-
cient use of energy. It is supported by contributions from car- porations, unions, individuals, and by project-specific grants from public sources. ASE has been interested in enlarging retrofit options
to include mechanical retrofits in addition to the conventional
building envelope retrofits. Recent revisions in DOE-WAP guidelines
allow mechanical retrofits to be included in low-income programs. ASE initiated the idea of a demonstration project as part of a state low- income retrofit program to improve the performance and cost-
effectiveness of state and utility weatherization programs through the

9
use of better technology. ASE presented the demonstration project
idea to OBCS and to the WAP office of DOE. In order to accommodate
some DOE objectives, as well as the ASE objective, the scope of the
project was broadened from a demonstration of mechanical system retro- fits to a field test evaluative study of a broad range of retrofits. It would include a method to select optimal combinations of mechanical
and/or envelope retrofits and an evaluation of the effectiveness of
the retrofits selected. C-lowever, ASE's primary interest would con-
tinue to be "How can better technology be cost-effectively incor- porated into low-income energy conservation programs to improve them?"


11
3. OVERVIEW DF THE WISCDNSIN FIELO TEST
In order to provide answers to the variety of questions moti-
vating the field test, the overall program was divided into three
separate studies, as indicated in Fig. 3.1. This section describes
the objectives of each of the three studies and the experimental design of the entire field test.
3.1 AUDIT-DIRECTED RETROFIT PROCEDURE
The purpose of the DOE-WAP is to improve the energy utilization
efficiency of homes of low-income families. Until recently,
DOE-funded low-income weatherization activities were limited to
infiltration control, insulation, and addition of storm windows, with
an expenditure limit of $1,000 per house. Under these conditions,
most retrofit programs operated from a fixed priority list such as
control infiltration by installing weatherstripping and caulking,
insulate the water heater, add ceiling insulation to some pre- determined level, and then install storm windows until the expenditure limit is reached. Under these conditions, each house received about
the same treatment, and about the same amount was spent on each house.
Revised DOE regulations increased the average expenditure per dwelling to $1,600 and permitted an expanded list of retrofits to be
performed, including
1. heating and cooling system tune-ups, repairs, and modifications;
2. installation of thermostat control systems, heat exchangers, and
heat pump water heaters; and
3. furnace and boiler replacements.
This expanded retrofit list provided options for more cost-effective
energy savings, but it also complicated the process of selecting the
best combination of retrofits for a house or for a given group of

. ” - . ._
ORNL-DWG 87-14199
FIELD TEST EVALUATION PROJECTS I I
I
DEVELOP AND TEST AN AUDIT-DIRECTED
RETROFIT PROCEDURE FOR OPTIMIZING EXPENDITURES AND BENEFITS IN LOW-INCOME
HOUSING
I
DEVELOP AND TEST A BLOWER-DOOR-GUIDED
INFILTRATION REDUCTION PROCEDURE
I
STUDY HOUSE THERMAL CHARACTERISTICS
AND OCCUPANT BEHAVIOR
Fig. 3.1. Overview of projects comprising the Field Test Evaluation of Conservation Retrofits of Low-Income, Single-Family Buildings.

13
houses. With the revised regulations, a set priority list was inade-
quate to apply to all houses in a geographic area. The optimum com-
bination of retrofits for a given house always depends on the
characteristics of the house which is to receive the retrofits.
ORNL was asked by DOE to select or develop a procedure that could
be used by home weatherization installers to select retrofits that
would optimize conservation program expenditures among low-income,
single-family homes. No suitable, public domain audit or analysis
program was found, so ORNL developed an audit-directed retrofit proce-
dure (ADRP) which is described in detail in two other reports.314 The
chief distinction of the ADRP, as contrasted with the set list of
priorities, is that each house is examined individually to determine which retrofits are most cost-effective for that house. An additional
distinction of the ADRP is that it includes a rational process for deciding how much money to spend on each house in a group of houses in
order to optimize conservation program expenditures for the group. Under this procedure, houses receive different retrofits, and various amoun,ts of money are spent on each house in order to achieve maximum
program energy savings per dollar of retrofit investment.
The ADRP was developed to reduce heating energy consumption only.
Heating-system retrofits, which were limited to gas furnaces,
included: (1) replacing a standing pilot with an intermittent ignition
device, (2) installing an electromechanical full-closure vent damper, (3) installi ng a thermally-activated vent damper, (4) installing a
secondary condensing heat exchanger, (5) replacing an atmospheric burner with a gas power burner, and (6) replacing the existing furnace
with a high-, efficiency furnace. Building-envelope retrofits included
(1) ceiling insulation, (2) exterior wall cavity insulation, (3) storm windows, (4) storm doors, (5) floor insulation, (6) exterior basement
wall insulation, (7) sill box insulation, and (8) blower-door-guided infiltration reduction.

/ d -\--- . ..- “. . I -.. -..I ..I_-. 11- ..-.---.....
I
14
The ADRP consists of two parts. First, an audit is applied to
each house to predict the benefit-to-cost (B/C) ratio for each indivi-
dual retrofit. Costs of materials and labor involved in each retrofit are estimated by the audit. after retrofit savings are estimated
using audit calculations, a B/C ratio is calculated for each retrofit using the estimated costs and savings. Once the retrofits for each
individual house are ranked by their B/C ratios, interactions among
the retrofits are considered and revised B/C ratios are determined. Retrofit interactions become important when both heating-system and
building-envelope retrofits are used. Second, retrofits are selected
that optimize the cost effectiveness of the program using the revised
B/C ratios. For a group of houses, all the retrofits are ranked by
their B/C ratios. Retrofits with the highest B/C ratios are then selected until the allocated money for the group of houses is spent.
The ADRP was used in the Wisconsin Field Test, which is described in detail in Ref. 5. The primary purposes of this portion of the
Wisconsin field test were to determine the benefits of the ADRP and to
measure the energy savings of combined heating-system and building-
envelope retrofits. The prediction capability of the audit and the
performance of individual retrofits were also of interest.
3.2 BLOWER-DOOR-GUIDED INFILTRATION REDUCTION PROCEDURE
Infiltration reduction has been an important part of the DOE-WAP
and similar programs. Previous infiltration reduction work focused on
caulking and weatherstripping doors and windows and was performed without the use of a tool to identify major leakage sites. Questions
regarding the effectiveness of this type of infiltration reduction practice have arisen. Indeed, measured energy savings due to this
work have been found to be less than expected. One explanation for this is that the common practice of sealing around doors and windows,

15
for example, only seals insignificant leaks, while important leaks are
ignored. In addition, infiltration reduction work may be performed in
homes that already have low air infiltration rates.
A blower door, shown in Fig. 3.2, either pressurizes or depressurizes a house, allowing the leakiness (or air leakage rate) of
the house to be measured. Infiltration reduction techniques using a
blower door have also been successfully used by practitioners in the field: the blower door is used to identify the major sources of air leakage (which may be hidden in attic cracks or interior walls) which
are then sealed. However, a procedure to incorporate this technique
into the WAP had not been developed.
A blower-door-guided infiltration reduction procedure was developed by WECC to (1) solve the problems associated with the con-
ventional approach to reducing air infiltration used in WAPs,
(2) incorporate the blower door technique into the WAP, and
(3) increase the efficiency and cost-effectiveness of the technique.
A detailed description of the procedure and its development is pro- vided in Refs. 6 and 7. The basic approach to the procedure is to
have a weatherization crew determine the air leakage rate of the
house, using a calibrated blower door, at 50 Pascal of depressuriza- tion. Expenditure levels and air leakage rate reduction goals for each house are then set based on the measured air leakage rate of that particular house. The expenditure level for labor and materials
depends largely on the house air changes per hour at 50 Pascal
depressurization (ACH50):
Expenditure Level = (ACH50)2 x (House Area)/1400,
where the expenditure level is in units of dollars and the house area is in units of ft2. The air leakage rate reduction goals are listed
in Table 3.1. Homes whose air leakage rate is 8 ACH50 or less receive

ORNL-DWG 87-14202
-DOOR JAMB -FRAME (STEEL CHANNEL) -COATEDNYLONCOVER
-AIR PUMP -VALVE TO INFLATE SEALING TUBE K
-FRAME HINGES (LOCKING)
-OUTSIDE PRESSURE TAP -LATCH FOR FAN -RETAINING SPLINE FOR COVER -RUBBER SEAL FOR FAN -KNOBS TO ADJUST SIZE -SPRING-LOADED EXPANSION BAR -CORNER SEALS -
Fig. 3.2. Picture and diagram of a blower door.

17
Table 3.1. Air leakage rate reduction goals used in the blower-door-guided infiltration reduction procedure
Initial air leakage rate Reduction goal (ACH50)a (ACH50)a
8 or less Seal leaks that affect comfort only
8 to 10 Reduce ACH50 by 1
10 to 12 Reduce ACH50 by 2
13 to 15 Reduce ACH50 by 3
16 to 18 Reduce ACH50 by 4
18 or greater Reduce ACH50 by 5
aACH50 - house air changes per hour at 50 Pascal depressurization.

18
no treatment (except to seal leaks that directly affect comfort) due to economic considerations and to avoid moisture and indoor air quality problems. Homes that have an air leakage rate greater than 8
ACH50 are assigned reduction goals that vary with the leakiness of the
house. Major leaks in the house are sealed while the blower door is in place to help locate the leaks and to track the air leakage rate during retrofit. The homes are sealed until the air leakage rate reduction goal or expenditure level is met. Crews are discouraged from caulking and weatherstripping windows in favor of finding larger leakage areas with the help of the blower door. The crews are equipped with a variety of infiltration control materials to meet most
needs.
4 detailed description of this proSect is provided in Ref. 7. The primary objectives of this study were (1) to assist in the
development of the blower-door-guided infiltration reduction proce- dure, (2) to demonstrate techniques of determining the air leakage reduction and subsequent energy savings resulting from the retrofit, and (3) to investigate the cost-effectiveness of the procedure.
3.3 OCCUPANT BEHAVIOR AND HOUSE THERMAL CHARACTERISTICS STUDY
A number of residential weatherization studies have found that
the measured energy savings attributed to a retrofit program are less than the predicted savings, and that there is large scatter in the measured energy savings; even for similar houses modified with similar retrofits. Four reasons are often advanced to explain these differen- ces :
1. occupant behavior, especially regarding thermostat settings, may
reduce savings; 2. the actual temperatures within the houses may be maintained at a
lower level than that assumed in estimating the savings;
3. the weatherization measures may be poorly installed; and 4. the predictive models may systematically overestimate savings.

19
This study was performed to address the first two points. A detailed
description of this project is contained in Ref. 8. Specific purposes were threefold: (1) to determine if the indoor temperature of the
home changes following retrofit installation, (2) to determine if the
expected deviation between predicted and monitored energy savings could be reduced by including indoor temperature in the analysis, and
(3) to study general occupant behavior and house thermal character- istics and their possible change following retrofit installation.
3.4 FIELD TEST EXPERIMENTAL DESIGN
The field test was performed during the winter of 1985-86 in four southern Wisconsin counties in the vicinity of Madison. (See
Fig. 3.3.) Initially, over 100 houses, divided evenly into three
groups, were to be used in the field test. For several reasons [such
as scheduling and attrition), 66 houses, divided into three uneven
groups, were actually used in the field test. The houses selected for inclusion in the field test met the following selection criteria:
1. The house must be eligible for the DOE-WAP.
2. The house must be a gas-heated, single-family detached home,
excluding mobile homes.
3. The owner must have occupied the house for at least one year and
must not have been planning extended time away from home during the 1985-86 winter.
4. Secondary heating devices (e.g., wood stoves) must not be used.
5. The occupants must be willing to participate in the field test.
The ADRP was used to determine which combination of envelope and
mechanical system retrofits were installed in a group of 20 homes. An average of $1600/house was selected to be spent on these homes to con-
form with DOE regulations and to make the study comparable with other studies of Wisconsin's WAP. Of the $1600, $400 was set aside to cover

ORNL-DWG 87-14198
TREMPEALEAU
GRANT
\-
SOUTH
WOOD
/c
1 El I
t
Fig. 3.3. The hatched area shows the location of the low-income, single-family buildings used in the field test.

21
administration (including auditing) and house repair costs, leaving
$1200 to be spent for retrofits. The retrofits were installed by the
same local weatherization providers that normally provide these ser- vices for the state. The regular auditors were trained in the use of
the audit and in heating system efficiency measurements, but specially
trained experts were not employed. A second group of 18 homes had air
leaks sealed following the blower-door-guided infiltration reduction procedure. The remaining 28 homes served as a control group for the
retrofitted houses to allow compensation for house changes and occu-
pant behavior changes between the pre- and post-retrofit periods. Retrofits were not installed in these houses until after the field
test was completed.
All houses in the first and third groups were used to study the
ADRP, while all houses in the second and third groups were used to
study the infiltration reduction procedure. Selected homes from each group were metered more extensively and used in the study of occupant
behavior and house thermal characteristics.
Table 3.2 lists the data gathered for each house that was used to
calculate pre- and post-retrofit heating system fuel uses, normalized for an average heating season in southern Wisconsin. Three classes of
data were collected: (1) data fo r each house needed to determine the
retrofit energy savings, (2) weather data needed to determine the retrofit, energy savings, and (3) general data on the houses and occu-
pants needed to implement the ADRP and the infiltration reduction pro-
cedure. Three data parameters were monitored weekly for each house:
furnace system run-time, house gas consumption, and house electricity consumption. The furnace weekly run-time, combined with a measured fuel consumption rate of the heating system, allowed the weekly
heating system fuel consumption to be determined. (The fuel consump-
tions of the heating system and house are not equal to one another because of other uses of gas within the house, such as for cooking.)

Table 3.2. Information collected for 66 houses in the Wisconsin field test evaluation of conservation retrofits
Data item Source of information
Whole-house gas use Utility meter (weekly reading)
Whole-house electricity use Utility meter (weekly reading)
Furnace gas use
Ambient air temperature
Building characteristics and heating system characteristics
Submetered with run-time meter (weekly reading)
Hourly data from 3 weather stations in the 4 counties;
Yourly data from Truax Field in Madison (local airport) for 36-year period
Audit

23
The house gas and electric utility meter readings were used to verify the reasonableness of the heating season data. In addition to the
data identified in Table 3.2, records were kept of the original and of
the retrofitted air leakage rates for each of the 20 houses in the
audit group and the 18 houses in the infiltration reduction group. These data from the infiltration reduction group were used to estimate energy savings and to evaluate the expenditure levels and air leakage rate reduction goals identified in the infiltration reduction proce- dure.
The retrofit energy savings of the treated houses were first determined individually. Weekly heating system fuel consumption,
measured before and after retrofit installations, spanned a range of
weather conditions, allowing fuel consumption to be linearly corre- lated to the outdoor temperature. The normalized pre- and post-
retrofit annual energy consumptions were then determined using the
correlations and long-term average outdoor temperatures for the
Madison area. The difference between the pre- and post-retrofit
annual energy consumptions is the annual energy savings normalized for average Madison outdoor temperatures.
The energy savings of the houses comprising the audited group were then averaged to determine the average benefit of the ADRP.
Similarly, the average benefit of the infiltration reduction procedure was determined using the energy savings of the houses comprising the
infiltration reduction group. These savings, as calculated, represent
the savings due to the respective treatment, as well as to occupant
behavior or house changes which may have occurred during the moni- toring period. The control group was included in the test in order
that other variables that could affect energy use such as occupant
behavior or house changes could be accounted for. (Occupant behavior or house changes occurring in the control group are assumed to occur, on average, in the treated groups.) The control group houses were

24
analyzed as if they had been retrofitted, allowing an average energy "savings" to be determined. The average saving's of the treated groups were then adjusted by subtracting the control group ?avings” from them.
Selected homes from each group were metered more extensively and
used in the study of occupant behavior and house thermal charac- teristics. For this study, ten data parameters were monitored hourly in 15 of the 66 homes used in the field test. These homes were moni-
tored from the two counties closest to Madison (Dane and Rock) to
expedite the installation, monitoring, and repair of the data acquisi-
tion equipment. The 15 homes included seven homes from the audit
group of houses, three from the infiltration reduction or “blower door” group, and five from the control group. The ten monitored data
parameters were
1. living room air temperature, 2. kitchen air temperature, 3. master bedroom air temperature, 4. basement air temperature (or spare bedroom air temperature), 5. interior surface temperature of the living room ceiling, 6. interior surface temperature of an exterior wall, 7. air temperature at the thermostat, 8. outdoor temperature, 9. thermostat setpoint, and
10. furnace run-time.
Data were collected approximately every eight seconds, and hourly
averages or totals were stored in computer memory. These hourly data
were remotely retrieved each week. The majority of the analyses per- formed using these data were qualitative evaluations of graphical results, although some calculations were also performed.

25
Monitoring'of the data parameters identified in Table 3.2 for
each individual house began during the last half of October and the first half of November in 1985. Most retrofits were performed during
the last two weeks of January and the first two weeks of February,
1986. Post-retrofit data collection for each house began shortly after the retrofits were completed and continued until May. The 15
houses metered more extensively for the occupant behavior and house thermal characteristics study were instrumented between November 21 and December 20, 1985, allowing five to nine weeks of pre-retrofit data to be collected before the audit and infiltration reduction houses were retrofitted. Approximately 14 weeks of post-retrofit data
were collected by mid-May.


27
4. SUMMARY OF FINDINGS FROM THE FIELD TEST
This section will report the major findings resulting from the analysis of the field test data for the three studies. Only the pri-
mary findings will be presented. The interested reader is urged to
pursue detailed discussions of the findings, including statistical
analysis results, for the ADRP in Ref. 5, for the infiltration reduc-
tion procedure in Ref. 7, and the occupant behavior and house thermal
characteristics study in Ref. 8.
4.1 AUDIT-DIRECTED RETRDFIT PROCEDURE
The ADRP was found to be a successful tool for cost-effectively
selecting building-envelope and heating system retrofits.in weatheri- zation programs, offering significant advantages compared to a fixed
priority list approach. Replacing inefficient furnaces with high-
efficiency units and installing wall insulation were found to be
effective retrofits well worth considering in weatherization programs. Specific results obtained from the audit portion of the field test
were
1. The ADRP, together with the expanded list of retrofits, more than
doubled the overall cost-effectiveness of Wisconsin's low-income
WAP as compared with the’priority system formerly used in
Wisconsin in 1982. As shown in Table 4.1, the annual energy savings achieved by the program per hundred program dollars increased from 4.8 therms/year/$100 in 1982 to 12.6 therms/year/$lOO. A portion of the increased efficiency
might also be attributed to the increased skill acquired by
weatherization installers between I.982 and 1985 through experience and training.
28
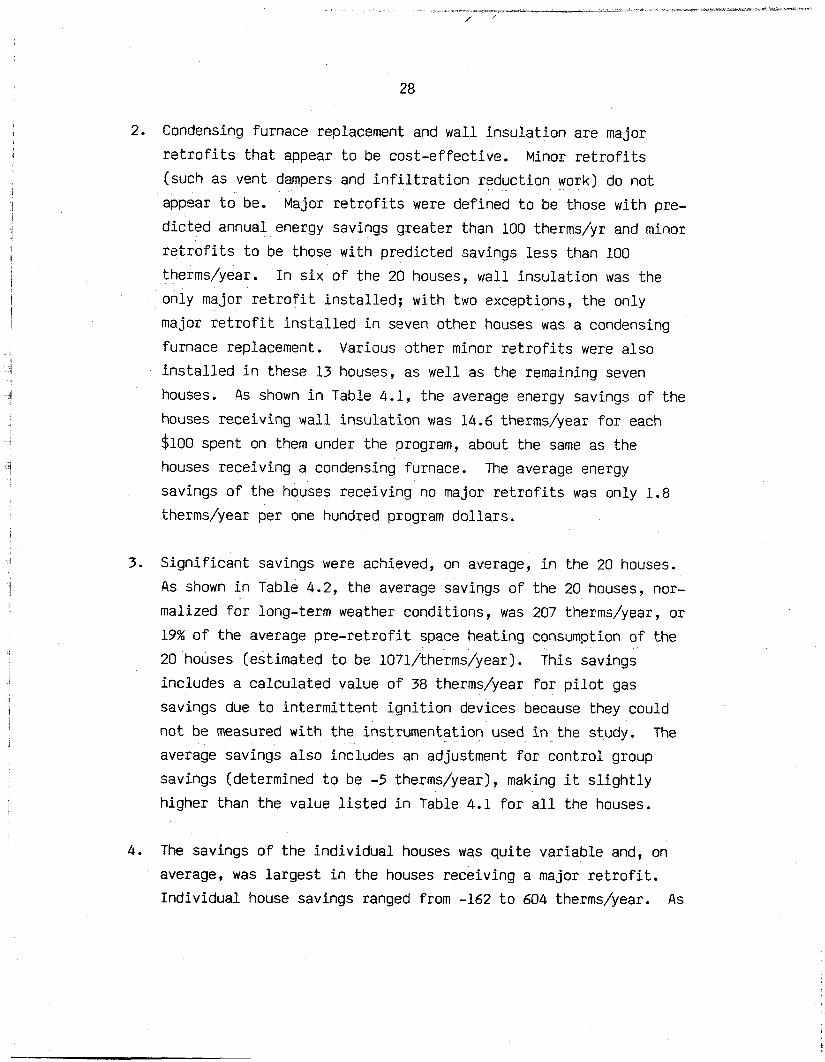
2. Condensing furnace replacement and wall insulation are major retrofits that appear to be cost-effective. Minor retrofits (such as vent dampers and infiltration reduction work) do not
appear to be. Major retrofits were defined to be those with pre- dicted annual energy savings greater than 100 therms/yr and minor retrofits to be those with predicted savings less than 100 therms/year. In six of the 20 houses, wall insulation was the
only major retrofit installed; with two exceptions, the only
major retrofit installed in seven other houses was a condensing
furnace replacement. Various other minor retrofits were also installed in these 13 houses, as well as the remaining seven
houses. As shown in Table 4.1, the average energy savings of the
houses receiving wall insulation was 14.6 therms/year for each
$100 spent on them under the program, about the same as the
houses receiving a condensing furnace. The average energy savings of the houses receiving no major retrofits was only 1.8 therms/year per one hundred program dollars.
3. Significant savings were achieved, on average, in the 20 houses.
As shown in Table 4.2, the average savings of the 20 houses, nor- malized for long-term weather conditions, was 207 therms/year, or 19% of the average pre-retrofit space heating consumption of the
20 houses (estimated to be 107l/therms/‘year). This savings
includes a calculated value of 38 therms/year for pilot gas
savings due to intermittent ignition devices because they could
not be measured with the instrumentation used in the study. The
average savings also includes an adjustment for control group savings (determined to be -5 therms/year), making it slightly
higher than the value listed in Table 4.1 for all the houses.
4. The savings of the individual houses was quite variable and, on
average, was largest in the houses receiving a major retrofit. Individual house savings ranged from -162 to 604 therms/year. As

29
Table 4.1. Comparison of program costs and energy savings: 1983 WECC studya vs 1985-86 field test results
Annual energy Average Heating energy savings per hundred
amount s ent savings/housec program dollars per house E ($) (therms/year) (therms/year/$lOO)
1985-86 field test
Condensing furnace 2,408 345 14.3
Wall insulation 1,764 14.6
Minor retrofits 660 12 1.8
All houses 1,603 202 12.6
1983 WECC study 2,250 105 4.8
aRef. 1 (Vol. 3), Wisconsin Energy Conservation Corporation, Low-Income Weatherization Program Study, "Technical Findings," October 31, 1984.
bAn administrative cost of $300/house is included in the figures for the 1985-86 field test.
cThe savings for the 1985-86 field test include estimated pilot gas savings, but do not incorporate adjustment for control group savings.

30
Table 4.2. Reportable average audit group savings
Energy consumption (therms/year)
pre-retrofit post-retrofit M
Control group (mean):
measurable heating 913 918 -5 energy use
Audit group (mean):
measurable heating 1033 869 164 16a energy use
adjusted heating energy savingsb
169
estimated pilot gas 38 38 energy use
Total 1071 207 19d
aThe measurable heating energy savings of the audit group divided by the measurable pre-retrofit heating energy use of the audit group.
bThe measurable heating energy savings of the audit group adjusted using the measurable heating energy savings of the control group.
CThe total audit group savings divided by the total pre-retrofit heating energy use of the audit group.

31
shown in Table 4.1, the average savings for the houses receiving a condensing furnace and wall insulation was 345 therms/year and
257 therms/year, respectively, as compared to an average of 12
therms/year saved by the houses receiving only minor retrofits. The variability of the individual house savings and the con-
centration of the savings in the houses receiving a major retro- fit can largely be attributed to the ADRP, which was designed to
concentrate retrofits in houses that would most benefit from the retrofits.
5. The average savings achieved by the 20 houses was closely pre- dicted by the audit. As shown in Fig. 4.1, the annual heating
energy savings for the entire group of retrofitted houses was
approximately 83% of that predicted.
6. On average, the audit accurately predicted savings for condensing
furnaces, but overpredicted the savings for wall insulation and
the minor retrofits. As shown in Fig. 4.1, the predicted and
measured savings for houses receiving the major retrofit of a
condensing furnace agreed very well. However, the savings for
houses receiving wall insulation as the major retrofit was only about 74% of that predicted. In addition, little savings was
predicted for houses receiving only minor retrofits, and no
savings was actually measured.
7. The energy savings for individual houses was not predicted accurately by the audit. A comparison of the measured and pre-
dicted savings for each of the 20 houses is presented in Fig. 4.2. Of the 20 audit group houses, ten had measured savings
which were significantly higher or lower than predicted. Three of the seven houses which received a condensing furnace had sta- tistically significant discrepancies between predicted and
measured savings. Four of the six houses which received wall

ORNL-DWG 00-11122
350
200
150
100
50
WALL INSULATION
MINOR RETROFITS
RETROFIT CATEGORY
ixi?d PREDICTED m MEASURED
AVERAGE
Fig. 4.1. Predicted savings vs measured savings, by predominant retrofit type. (Both the predicted and measured savings do not include pilot gas savings.
The measured savings have been adjusted for control group savings.)

700
600
500
400
300
200
100
0
-100
-200
-300
ORNL-DWG 08-11123
1
T CF
T T 1
1000 W - HOUSES RECEIVING PREDOMINANTLY WALL
900 - INSULATION CF - HOUSES RECEIVING PREDOMINANTLY A
800 - CONDENSING FURNACE
+ - HOUSES RECEIVING ONLY MINOR RETROFITS
-r
-
t
j
1 1
I CF
1
0 200
PREDICTED SAVINGS (therms/year)
400
Fig. 4.2. Comparison of predicted and measured savings for individual houses. The vertical lines indicate the 90% confidence intervals of the measured savings.
(Both the predicted and measured savings do not include pilot gas savings. The measured savings have not been adjusted for control group savings.)

34
insulation had measured savings that were statistically different
1 than predicted, with a majority of these having measured savings
less than predicted. These discrepancies are likely the result
of the audit's failure to account for one or more factors which
affect energy savings; a consistent problem may also exist with
the wall insulation savings calculations in the audit because of
the consistent differences observed.
8. The retrofits selected by the ADRP in the field test were quite
different from the retrofits employed in the traditional weatherization program. The traditional program concentrated on
ceiling insulation, water heater insulation, infiltration control, and storm windows. In the field test, only four houses
received ceiling insulation and none of the 20 houses received storm windows. Water heater insulation was not included in the
list of retrofits considered by the audit and, thus, was not
instalied in the field test.
9. The retrofits included in the expanded list of retrofits were selected for inclusion in the 20 houses at different frequencies by the ADRP. Five retrofits were not installed in any of the / houses: secondary condensing heat exchanger, gas power burner, storm windows, storm doors, and floor insulation. The remaining nine retrofits were installed in at least four houses but not more than ten houses.
10. The cost of installing the retrofits in the homes varied depending on the actual retrofits installed. The houses
receiving wall insulation as the major retrofit cost $1764/house;
the houses receiving a condensing furnace cost $2408/house; and
the houses receiving no major retrofits cost $660/house. In each
case, these numbers include the costs of various minor retrofits applied to the houses and an administration cost of $300/house.

35
The administration cost is based upon an average cost of $4O/house that occurred in the field test to perform minor house repairs, an estimated cost of $lOO/house to perform the audit,
and an estimated cost of $160/house to perform other administra- tion functions such as outreach, income verification, and record keeping.
11. The overall costs of installing these retrofits were predicted with good accuracy. Total actual costs were less than 5X above
total predicted costs, although wider scatter was observed in the
cost comparisons of individual houses.
12. The following improvements were identified at the conclusion of
the field test that could increase the cost-effectiveness of the
ADRP: (a) eliminate the requirement to spend all the money allo-
cated for the group of houses to be retrofitted (such a require- ment led to choosing retrofits with B/C ratios less than 1.0 in
the field test) or specify that retrofits with a B/C ratio below a minimum value cannot be performed; (b) remove ineffective
retrofits from the audit and/or improve the audit predictions and
calculations so that ineffective retrofits would not be chosen;
(c) reduce or eliminate the installation of minor retrofits by
installing retrofits in only those homes that can benefit from a major retrofit or by installing only major retrofits (the savings
obtained from minor retrofits are not sufficient to overcome their installation costs plus auditing and administration costs); (d) add addit ional cost-effective retrofits to the procedure (such as hot water retrofits which were included in the tradi- tional program); and (e) reduce the audit and administration
costs.
13. The new test method developed for this project worked well and provided good results. The method principally involved the analysis of weekly submetered heating system fuel consumption

/ . . “. _ ._ _.,
36
data. The method allowed the field test to be performed in one heating season and included uncertainty analysis which was
applied consistently throughout the calculations.
4.2 BLOWER-DOOR-GUIDED INFILTRATION REDUCTION PROCEDURE
The blower-door-guided infiltration reduction procedure was found L
to be a useful tool to reduce expenditures for infiltration reduction while ensuring that significant air leakage rate reductions are obtained. However, the infiltration reduction work that was performed did not produce, on average, measurable energy savings in the test
houses. Specific results from the “blower door” portion of the field
test were
1. The blower-door-guided infiltration reduction procedure reduced expenditures (labor plus materials) for infiltration reduction to about one-fourth of that previously required by Wisconsin's WAP.
A 1985 study9 of 50 low-income houses in Wisconsin reported an average infiltration control expenditure of $570/house. The 18
houses in this study were treated for an average of $106/house,
which included costs of $13 to $68 to set up the blower door and
perform initial testing (the set-up cost depended on travel time
and house characteristics). This reduction came about in two
ways: (a) the blower door identified houses that already had low
infiltration rates, so time and money were not spent providing needless services (see item 3 below), and (b) the procedure limited the expenditures in the individual houses that were retrofitted to values significantly less than that previously spent.
2. The infiltration reduction procedure significantly reduced the
average air leakage rate in the treated houses whereas, in the
1985 study,9 no significant reduction in air leakage rate was

3.
4.
37
found following the installation of typical infiltration reduc-
tion measures. As shown in Table 4.3, the average air leakage
rate in the 18 treated houses was reduced from 8.3 to 7.0 ACH50,
representing a 16% reduction, despite the fact that the average
infiltration rate of the houses was already relatively low.
The air leakage rate reductions were, on average, largest in houses recommended for retrofit. Because the reductions of indi-
vidual houses were quite variable, the potential reduction of a house depends on more than the initial air leakage rate. Of the
18 houses, only seven were recommended to receive infiltration
reduction measures (they had an initial air leakage rate greater than 8 ACH50); however, work on seven additional houses was also
performed. As shown in Table 4.3, the air leakage rate reduc-
tions in the individual homes that were retrofitted ranged from 0.1 to 6.0 ACH50. The average reduction for the seven recom-
mended houses was 2.4 ACH50, while the average reduction for the seven additional retrofitted houses was only 0.9 ACH50. Since no
work was performed on the remaining four houses, no reduction occurred in them.
The infiltration reduction procedure applied to a group of houses
provided an effective guide to the average amount of infiltration reduction that can be achieved and the expense necessary to accomplish the reduction. The average recommended retrofit cost
for the 18 houses of the test group was $77, compared with the actual average expenditure of $106. Some of this over- expenditure may be attributed to the cost of performing the ini- tial blower door test, which was not included in the cost
estimate. In the seven houses recommended for retrofit, 89% of
the targeted air leakage reduction was achieved, and only 76% of
the recommended expenditure was required.

38
Table 4.3. Air leakage rate reductions and retrofit costs
Initial air Change in leakage rate cost leakage rate Actual Actual
House (ACH50) (ACH50) (%I Targeted Recommended Actual (ACH50) ($1 ($1
‘\ Houses retrofitted as recommended:
1 i R21 19.5 6.0 3 31 5.0 256
R22 16.8 1.4 8 4.0 291 4 R35 16.2 1.9 12 4.0 129 : D26 14.7 4.7 32 3.0 218
R03 9.2 0.8 9 1.0 94 R52 9.0 1.3 14 1.0 88
4 R43 8.6 0.7 8 1.0 49 1
Average 13.4 2.4 18 2.7 161
Houses receiving retrofits that were not recommended:
DO4 7.9 3.7 47 0.0 44 301 R07 7.7 0.2 3 0.0 55 50 ROl 7.2 1.0 14 0.0 42 60 D41 5.9 0.4 7 0.0 31 186 G27 5.3 0.2 4 0.0 24 88 R06 5.2 0.8 15 0.0 21 92 R39 3.9 0.1 3 0.0 13 92
Average 6.2 0.9 15 0.0 33 124
Houses receiving no retrofits as recommended:
R31 3.4 0.0 0 0.0 9 63 R04 3.2 0.0 0 0.0 8 13 R27 3.1 0.0 0 0.0 7 25 GO1 2.6 0.0 0 0.0 5 68
Average 3.1 0.0 0 0.0 7 42
Overall Average 8.3 1.3 16 1.1 77 106
216 126 98
211 96 75 39
123
Note: ACHSO tion.
- house air changed per hour at 50 Pascal depkessuriza-

39
5. The minimum initial leakage rate of 8 ACH50, below which no
retrofit work is advised by the procedure, appears to be an
appropriate choice. Although air leakage rate reductions were
achieved in houses not recommended for retrofit, these reductions were typically less than those achieved in the recommended houses
and required relatively large expenditures per unit of change.
6. ,Although air leakage rates were reduced using the infiltration reduction procedure, a reduction in the average energy consump-
tion of the treated homes was not observed from an analysis of
metered energy use data. Analysis indicated that factors other
than the reduction in the air infiltration rate and possible
changes in the indoor temperature were influencing the house
energy consumptions, making a direct measurement of retrofit savings difficult. Calculation of the expected energy savings
using the measured air leakage rate reductions indicated that the
average savings would be 37 therms/year for all houses in which
infiltration retrofits were performed (or 5% of the average annual heating consumption of the houses).
7. The following improvements were identified at the conclusion of
the test that could increase the effectiveness of the procedure: (a) the retrofit crew s need to be trained more extensively to ensure stricter adherence to the procedure, and (b) the average cost of establishing the initial leakage rate of the house using
a blower door needs to be included in the equation for the recom- mended expenditure level.
4.3 OCCUPANT BEHAVIOR AND HOUSE THERMAL CHARACTERISTICS STUDY
Indoor temperature changes attributable to the installation of
conservation measures were not generally observed. However, con-
sideration of the indoor temperature in the analysis can explain a
., /’ -~ T - - _.‘” _.,...-.I.. - ._._. -- -..._ -. _ . ,. i . I . - _ ”
40
large portion of the deviation between predicted and measured savings.
Specific results from the occupant behavior and house thermal charac- teristic study were
1. A large portion of the deviation between predicted and measured savings can be attributed to incorrect assumptions used in making
the predictions, with other unidentified factors being respon- sible for the remaining portion of the discrepancy. Knowing the
indoor temperature of the houses as well as their measured balance point temperatures (derived from a graphical analysis of
heating energy use versus outdoor temperature plots), a value for the measured energy savings of each house was calculated as if
the house actually conformed to two main assumptions made in pre- dieting the energy savings (a pre-retrofit balance point tem-
perature of 65-F and a constant indoor temperature). Twenty to
60% of the difference between predicted and measured savings in
the houses studied could be accounted for by this type of
analysis.
2. Additional results indicate that incorrect assumptions regarding the value of the indoor temperature or balance point may be more prevalent than incorrect assumptions regarding a constant indoor temperature in explaining differences between predicted and
measured savings. The indoor temperature in one-third of the 15
homes studied was either warmer or colder than values that might
be typically assumed in making energy savings calculations (67 to
73'F). On the other hand, the indoor temperature of the houses
was generally steady as the occupants did not typically increase their indoor temperature after retrofit installation (the occu-
pants did not generally display "take back*' behavior). Table 4.4
shows that the average change in temperature measured at the
thermostat was more than 1-F in only four houses (two of which
were only l.l*F) and that these few houses were evenly distri- buted among the three groups. Thus, consistent changes in the
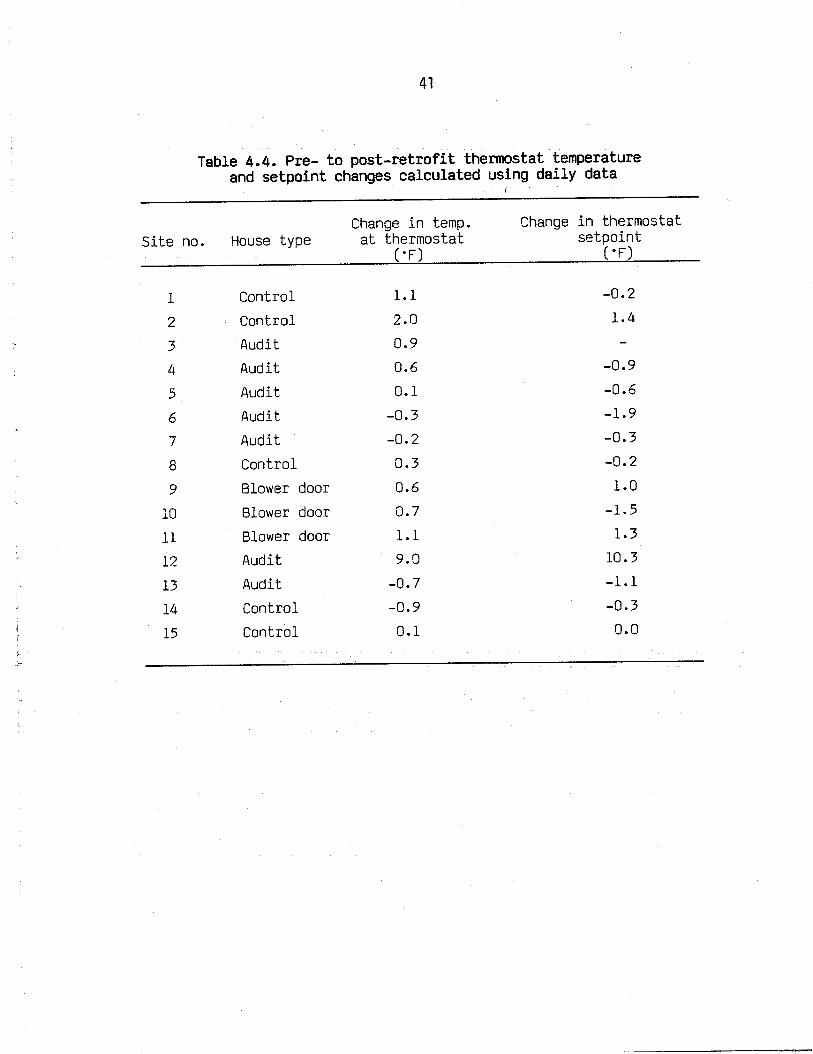
41
Table 4.4. Pre- to post-retrofit thermostat temperature and setpoint changes calculated using daily data
i
Change in temp. Change in thermostat Site no. House type at thermostat setpoint
('F) ('F)
1 Control
2 Control
1.1 2.0
-0.2
1.4
3 Audit 0.9
4 Audit 0.6 -0.9
5 Audit 0.1 -0.6
6 Audit -0.3 -1.9
7 Audit -0.2 -0.3 8 Control 0.3 -0.2 9 Blower door 0.6 1.0
10 Blower door 0.7 -1.5 11 Blower door 1.1 1.3 12 Audit 9.0 10.3 13 Audit -0.7 -1.1 14 Control -0.9 -0.3
i 15 Control 0.1 0.0
“-

3.
4.
42
indoor temperature due to retrofit installation were not
observed. In addition, the thermostat management practice used during the post-retrofit period was identical to the practice used during the pre-retrofit period in all 14 houses for which
pre- and post-retrofit data were’available. This indicated that
the management practice was also not affected by a retrofit installation.
A single indoor temperature was found to adequately represent the average house temperature in many homes, verifying an assumption
made in a monitoring guideline developed by ORNL.IO The four indoor temperatures monitored in each house were typically within
4'F of each other, indicating that most houses were at a reason- ably uniform temperatur e and might be adequately described by a
single temperature measurement (generally, the master bedroom temperature was lower and the kitchen temperature higher). In two-thirds of the houses, the thermostat or living room tem-
perature was found to represent the average house temperature (defined to be the average temperature of the living area, kitchen, and master bedroom weighted using their respective floor
area). A typical example is shown in Fig. 4.3.
Indoor temperature and thermostat setpoint are distinct parameters such that inferences concerning one cannot be made
from the other; thus, both need to be monitored if both are to be
studied in an experiment. 4verage air temperatures at the ther- mostat were found to be distinctly different from average values
of the thermostat setpoint over selected time periods and at dif-
ferent times of the day. However, as indicated in Table 4.4, a
change which occurred in one following retrofit installation was
not necessarily accompanied by a change in the other.

ORNL DWG 87 14203
COMPARISON OF THREE HOUSE TEMPERATURES
-- AVERAGE, THERMOSTAT, AND LIVING ROOM
78-
n-
76-
76-
74-
73-
72-
71 -
70-
69-
68-
67h 326 346 1 21 41 ~ 61 81 101 121 141
JULIAN DAY (1986-1986)
Fig. 4.3. Temperature at the thermostat and in the living room compared with average house temperature.

5. Four different thermostat management practices were observed in the houses: ( ) a seven households did not adjust their ther- mostat, (b) four set the thermostat back at night, (c) two set the thermostat back during the day, and (d) one lowered the ther- mostat at night and during the day, but raised it for a short period in the morning and a slightly longer period in the
evening.
6. Occupant's perceptions of their houses’ thermal characteristics and comfort, and their change following retrofit installation,
were found to be inconsistent with measured data; thus, responses to occupant questionnaires may not provide sufficiently accurate data to be generally useful in audits or analyses to supplement
or interpret results. For a given time period, two-thirds of the
occupants correctly identified their typical thermostat manage- ment practice, but only one-half could accurately provide the
average indoor temperature maintained in their house.
Furthermore, the occupants could not reliably indicate if a
change in indoor temperatur e or thermostat setpoint had occurred between two time periods. 411 occupants felt that their comfort had improved following a major retrofit installation, but
measured indoor air temperature data did not support their obser- vation. Despite the temperature maintained in the house, the
occupants usually wished it could be higher.

45
5. IMPLICATIONS OF THE FIELD TEST FINDINGS FOR
FUTURE SINGLE-FAMILY RETROFIT PROGRAMS
The results reported in the preceding "findings" section are
applicable to the four counties in southern Wisconsin and to the kinds
of low-income housing stock encountered in the field study. To the
extent that the climate or housing stock of some other area differs from that of these four counties, the findings become less and less
applicable. The general procedures used in this field test, however,
should be useful to managers of most other single-family retrofit programs, regardless of geographic region or house type. The
following eight points summarize the implications of the findings of
this field test for other similar programs.
1. An audit-directed retrofit procedure, which selects retrofits for houses so as to maximize program benefits, should be seriously considered as an alternative to use of the priority list approach.
2. Heating system retrofits are well worth considering as an addi-
tion to the list of retrofit options. The specific mechanical
retrofits that should be included for consideration are largely determined by climate. Furnace retrofits and/or replacements are
important in northern climates.
3. Although savings due to wall insulation were 74% of that pre- dicted, wall insulation is a useful addition to the envelope
retrofit options because of the large energy savings that result.
4. The use of a blower door to evaluate the need to‘carry out
infiltration control work on a house and to locate major leaks efficiently should prove to be a useful technique in most single-
family retrofit programs.

‘k. _-_-- ..I”. .“. .._ l.. . . “-__ ._. .__.
’ -
46
5. Monitoring the interior air temperature for a number of houses
does offer clues to occupant behaviors that impact the achieved
energy savings of retrofits. This process allows better understandinq as to how occupants alter energy savings which can
lead to improved predictive techniques; it does not change the
amount of energy saved. The lack of "take back" behavior in the
monitored houses casts doubt on "take back" as the significant
cause of the discrepancy between measured and predicted energy savings.
6. Evaluating the performance of a state-run building retrofit program and measuring the impacts of newly-adopted changes in the
program procedure should prove to be a cost-effective use of
funds. Such evaluative field studies identify what is good in a
program and should be retained, and what is not effective and
should be dropped. Periodic assessments of retrofit program pro- cedures based upon metered energy consumption data allow for program improvements and provide a firm basis for accounting to
public agencies for the wise expenditure of public funds.
7. Low-cost and non-invasive metering techniques are important features of field studies. This project did not devise new hard- ware, but it did experiment with the use of elapsed-time meters to substitute for a gas meter in measuring furnace fuel use.
Low-cost data loggers were also used successfully. Not only do
the elapsed-time meters save money, but they also may be
installed quickly and inexpensively.
8. With careful planning and with good cooperation among groups, a field test involving both pre-retrofit and post-retrofit metering can be carried out in a single heating season, depending on the , research goals of the experiment. Planning and coordination is difficult to achieve, and the time and financial support for these functions should be recognized in scheduling the program.

47
In summary, the planning and implementation of a field test
evaluation of building retrofits require foresight, cooperation, and patience as different groups attempt to coordinate varied inputs to
the project. It also requires money. The results, however, are well
worth the effort, because the program becomes much more efficient in
delivering effective energy conservation retrofits to low-income
households.


49
REFERENCES
1.
2.
3.
4.
5.
6.
7.
a.
9.
10.
Single-Family Building Retrofit Research: Multi-Year Plan, FY 1986 - FY 1991, ORNL-, Oak Ridge National Laboratory, -- May 1986.
Wisconsin Energy Conservation Corporation, Low-Income Weatherization Program Study, October 31, 1984.
Vol. 1: “History and Performance*’ Vol. 2: "Policy Recommendations@' Vol. 3: "Technical Findings*' Vol. 4: tiFuel and Household Analysis"
McCold, L. N., Field Test Evaluation of Conservation Retrofits of Low-Income, Sin-a- Buildin s: Combined Building Shell anr Heating System Retrofit Audit, h/C-3, Oak Rid@-- - National Laboratory, May 1987.
McCold, Lance N., Jeffrey A. Schlegel, and David C. Hewitt, "Technical and Practical Problems of Developing and Implementing an Improved Retrofit Audit ,'* Proceedings from the ACEEE 1986 --- Summer Study on Energy Efficiency in Buildings, August 1986.
McCold, Lance N., et al., Field Test Evaluation of Conservation Retrofits of Low-Income, Sm-mly Buildings% Wisconsin: Audit FielrTest Implementation and Results, ORNLEON-228/P2, Oak RidgeNational Laboratory, May 1988.
Schlegel, 3. A., et al., "Improving Infiltration Control Techniques in Low-Income Weatherization,‘* Proceedings from the ACEEE 1986 Summer Study on Energy Efficiency in BuildiEAugust 1986.-----
-
Gettings, M. B., Field Test Evaluation of Conservation Retrofits of Low-Income, SimFay Buildings in Wisconsin: Blower-Door-Guided Infiltration Reduction Procedure Field Test Implementation and Results, ORNLwP5, Oak Rid-t=1 Laboratory, Aprrl988.
Ternes, M. P., and D. M. Wasserman, Field Test Evaluation of Conservation Retrofits of Low-Incomemgle-Family Buildi@ in Wisconsin: Occupant Beh%ior and House Thermal Characteristics% Fifteen Energy Conservation Rzomd Houses, ORNL/CON-228/P4, Oak Ridge National Laboratory, August 1988.
Kanarek, M., et al., Energy Conservation Through Weatherization and Indoor Air Quality, University of Wisconsin, 1985.
Ternes, M. P., Single-Family Building Retrofit Performance Monitoring Protocol: Data Specification Guideline, ORNL/CON-196, Oak Ridge National Laboratory, June 1987.

,
f w

51
ORNL/CON-228/Pl
INTERNAL DISTRIBUTION
l-10. M. P. Ternes 11. J. Miller 12. W. Fulkerson 13. R.-B. Shelton 14. T. J. Wilbanks 15. R. S. Carlsmith 16. M. A. Kuliasha 17. M. A. Broders 18. W. R. Mixon 19. M. A. Karnitz
20-29. C. L. Brown 30. J. E. Christian
31-40. M. B. Gettings
41. J. 0. Kolb 42-51. L. N. McCold
52. H. A. McLain 53. A. M. Perry 54. 0. E. Reichle 55. E. T. Rogers 56. M. Schweitzer 57. T. R. Sharp 58. ORNL Patent Office 59. Central Research Library 60. Document Reference Section
61-63. Laboratory Records 64. Laboratory Records - RC
EXTERNAL DISTRIBUTION
65. R. 4kers, Roy and Sons, P.O. Box 5490, El Monte, CA 91731 66. Shirley Anderson, Office of Energy Conservation and Environment,
Department of Public Service, State of New York, 3 Empire State Plaza, Albany, NY 12223
67. Todd Anuskiewicz, Michigan Energy and Resource Research Assoc., 328 Executive Plaza, 1200 Sixth Street, Detroit, MI 48226
68. .John R. Armstrong, Dept. of Energy and Economic Development, 900 American Center Bldg., 150 East Kellogg Blvd., St. Paul, MN 55101
69. Sam Ashley, Public Service Company of Oklahoma, P.O. Box 867, Owasso, OK 74055
70. G. L. Askew, Tennessee Valley Authority, SP 2s 51D-C, Chattanooga, TN 37402-2801
71. Larry J. Augustine, U.S. Army Corps of Engineers, P.O. Box 4005, Champaign, IL 61820
72. E. L. Bales, New Jersey Institute of Technology, School of Architecture, 323 High Street, Newark, NJ 07102
73. K. R. Barnes, Oklahoma Gas and Electric Company, P.O. Box 321, Oklahoma City, OK 73101
74. Lester W. Baxter, Energy Center, University of Pennsylvania, 3814 Walnut Street, Philadelphia, PA 19104
75. Mary Jane D. Brummitt, Energy Coordination Office, Minneapolis Energy Office, City Hall, Room 334, Minneapolis, MN 55414

i
76.
77.
78.
79.
80.
8i.
82.
83.
84.
85.
86.
87.
88.
89.
90.
91.
92.
93.
94.
95.
96.
97.
98.
99.
--’ -,c-- . “- .
52
Benita Byrd, Public Service Commission, P.O. Box 7854, Madison, WI 53707 Bill Cady, Commonwealth Energy, P.O,Box 9150, Cambridge, MA 02142 Krista L. Cantebury , Energy Business Association, Maritime Building, 911 Western Avenue, Seattle, WA 98104 Mark Cherniack, Northwest Power Planning Council, 850 S.W. Broadway, Suite 1100, Portland, OR 97204 Barbara Cigainero, Economic Opportunities, Texas Department of Community Affairs, P.O. Box 13166, Austin, TX 78711 J. F. Clark, Southern States Energy Board, 2300 Peachford Road, One Exchange Place, Suite 1230, Atlanta, GA 30338 Roger Clark, Governor’s Energy Council, P.O. Box 8010, Harrisburg, PA 17105 Russell Clark, Arizona Department of Commerce, State Capitol Tower, 1700 W. Washington, Phoenix, AZ 85007 Brian Clement, City of Austin, Fountain Park Plaza I, 3000 IH-35, Austin, TX 78704 Tom Connell, School of Urban and Public Affairs, Carnegie Mellon University, Pittsburgh, PA 15213 Vaughn Conrad, Public Service Company of Oklahoma, P.O. Box 201, 212 East 6th Street, Tulsa, OK 74102 Lynne M. Constantine, Executive Director, Energy Conservation Coalition, 1001 Connecticut Avenue, N.W., Suite 535, Washington, D.C. 20036 Garry Cook, Homestead Learning Center, P.O. Box 703, Oregon City, OR 97045 Christopher Copp, Energy Office, City of Minneapolis, City Hall, Room 330, Minneapolis, MN 55414 Bonnie Cornwall, California Energy Extension Service, 1600 Ninth Street, Suite 330, Sacramento, CA 95814 Jeffrey Crouse , Oepartment of Building Inspection and Safety Engineering, City of Milwaukee, 600 W. Walnut Street, Milwaukee, MN WI 53202 J. 3. Cuttica, Vice President of Research and Development, Gas Research Institute, 8600 W. Bryn Mawr Avenue, Chicago, IL 60631 Tommy Davis, Energy Conservation Division, New York Department of Housing Preservation and Development, 100 Gold Street, Room 8040, New York, NY 10038 Brian Davison, City of Austin, Electric Utility, P.O. Box 1088, Austin, TX 78767 John P. Dechow, Columbia Gas System Corp., 1600 Dublin Road, Columbus, OH 43215 Rob deKieffer, Barrier Design Alliance, 2045 Grove, Boulder, CO 80302 Christopher L. Dent, Lambert Engineering, 601 N.W. Harmon Blvd., Bend, OR 97701 Daniel J. Desmond, Governor’s Energy Council, P.O. Box 8010, 1625 North Front Street, Harrisburg, PA 17105 John G. Douglass, Washington State Energy Office, 400 East Union Street, Olympia, WA 98501

53
100.
101.
102.
103.
104.
10.5.
106.
107.
108.
109.
110.
111.
112.
113.
114.
115.
116-125.
126.
127.
128.
129.
130.
131.
Judy Driggans, Tennessee Valley Authority, SP 2s 55D-C, Chattanooga, TN 37402-2801 John Duberg, Kearney/Centaur Division, A. T. Kearney, Inc., Suite 700, 1400 I Street, N.W., Washington, D.C. 20005 Gautam Dutt, Princeton University Center for Energy and Environmental Studies, Princeton, NJ 08544 John P. Eberhard, NAS/NAE/?JRC Advisory Board on Built Environment, 2101 Constitution Avenue, Washington, D.C. 20418 Terry Egnor, Seattle City Light, 1015 Third Avenue, Seattle, WA 981D4-1198 Meredith Emmett, NC AEC, P.O. @ox 12699, Research Triangle Park, NC 27709 Anne Evens, Center for Neighborhood Tech., 570 W. Randolph, Chicago, IL 60606 Marv Faoerson, 900 American Center Bldg., 150 E. Kellogg Blvd., st.hJi, MN .55101 D. Farmer, Weatherization Program Specialist, Tennessee Department of Human Services, 400 Deaderick, 14th Floor, Nashville, TN 37219 Brian Fay, Wisconsin Gas Company, 12th Floor, 626 E. Wisconsin Avenue, Milwaukee, WI 53202 Margaret F. Fels, Center for Energy and Environmental Studies, Engineering Quad, Princeton University, Princeton, NJ 08544 William S. Fleming, W. S. Fleming and Associates, Inc., 5802 Court Street, Syracuse, NY 13206 Mary Fowler, Department of Energy, CE-222, FORSTL, 1000 Independence Avenue S.W., Washington, D.C. 20585 C. Fowlkes, Fowlkes Engineering, 31 Gardner Park Drive, Bozeman, MT 59715-9296 E. Frankel, House Committee on Science and Technology, Rayburn Building, Room 2320, Washington, D.C. 20515 Michael Freedberg, Center for Neighborhood Tech., 570 W. Randolph, Chicago, IL 60606 Ernest Freeman, Department of Energy, CE-133, FORSTL, 1000 Independence Avenue, S.W., Washington, D.C. 20585 Claire Fulenwider, Wisconsin Gas and Electric Company, P.O. Box 1231, Madison, WI 53701 Jim Gallagher, Office of Energy Conservation and Environment, Department of Public Service, State of New York, 3 Empire State Plaza, Albany, NY 12223 Carol Gardner, Bonneville Power Administration, P.O. Box 3621, Portland, OR 97208 Jim Gardner, Division of Weatherization, 1J.S. Department of Energy, CE-232, FDRSTL, 1000 Independence Avenue, S.W., Washington, D.C. 20585 P. S. Gee, North Carolina Alternative Energy Corporation, P.O. Box 12699, Research Triangle Park, NC 27709 J. Genzer, Esq., Staff Associate, Committee on Energy and Environment, National Governor’s Association, 444 North
I Capitol Street, Washington, D.C. 20001

132. 1
133. ^, 84 ‘1 134. ? 4 135.
1 136.
4 137.
1 138. !
139. 1
140.
141.
142.
143.
144. /
145.
146.
147.
148.
149.
150.
151-165.
166.
167.
. 54
W. Gerkin, U.S. Department of Energy, CE-131, FORSTL, 1000 Independence Avenue, S.W., Washington, D.C. 20585 Cathy Ghandehari, State of Wisconsin, Department of Health and Social Services, P.O. Box 7851, Madison, WI 53707 Peter Gladhart, Institute for Family and Child Study, College of Human Ecology, Michigan State University, East Lansing, MI 48823 Karen L. Griffin, California Energy Commission, 1516 Ninth Street, Sacramento, CA 95814 James E. Griffith, Public Service Electric and Gas Research Corp. , 200 Boyden Avenue, Maplewood, NJ 07040 R. Groberg, U.S. Department of Housing and Urban Development, 451 7th Street, S.W., Washington, D.C. 20410 J. S. Gumz, Pacific Gas and Electric Company, 77 Beale Street, San Francisco, CA 94106 George Guyant, Alliance to Save Energy, 1925 K Street, N.W., Washington, D.C. 20006 Greg Habinger, Minn. Dept. of Energy and Economic Development, 150 E. Kellogg Blvd., St. Paul, MN 55101 James Hall, Tennessee Valley Authority, MR 2s 38A-C, Chattanooga, TN 37402-2801 L. Harris, Assistant Commissioner for Administration, Tennessee Department of Human Services, 400 Deaderick, 14th Floor, Nashville, TN 37219 D. T. Harrje, Princeton University, Center for Energy and Environmental Studies, Engineering Quad, Princeton, NJ 08544 Jack Haslam, Department of Community Affairs, Division of Housing and Community Development, 2571 Executive Center Circle East, Tallahassee, FL 32301 Mark P. Hass, Director, Policy and Research Division, Energy Administration, Michigan Department of Commerce, P.O. Box 30228, Lansing, MI 48909 J. P. Hawke, State Office of Community Services, Capitol Complex, Carson City, NV 89710 David Hewitt, Portland Energy, 1120 S.W. Fifth Avenue, Portland, OR 97202 Martha Hewitt, Minneapolis Energy Office, City Hall, Minneapolis, MN 55802 Richard L. Hobson, Baltimore Gas and Electric, P.O. Box 1475, Baltimore, MD 21203 J. Holmes, U.S. Department of Energy, CE-133, FORSTL, 1000 Independence Avenue, S.W., Washington, D.C. 20585 Mark Hopkins, Alliance to Save Energy, 1925 K Street, N.W., Suite 206, Washington, D.C. 20006 Greg Hubinger, Minnesota Department of Energy and Economic Development, 900 American Center Building, 150 E. Kellogg Blvd., St. Paul, MN 55101 Patrick 3. Hughes, Vice-President, W. S. Fleming and Associates, 5802 Court Street, Syracuse, NY 13206

55
168. William M. Hughs, Lone Star Gas Co., 301 S. Harwood, Dallas, TX 75201
169. Roger C. Hundt, Lennox Industries, P.O. Box 877, Carrollton, TX 75011
170. Dolores Hurtado, Portland Energy Conservation, Inc., 2950 S.E. Stark, Suite 130, Portland, OR 97214
171. S. Jaeger, Resource Management Department, City of Austin, 3000 South lH-35, Austin, TX 78704
172. C. Jernigan, North Carolina Department of Commerce, Energy Division, Dobbs Building, Raleigh, NC 27611
173. Steve H. Johnson, Housing Development Agency, P.O. Box 1924, Columbia, MO 65205
174. Ralph F. Jones, Brookhaven National Laboratory, Building 120, Upton, NY 11973
175. J. P. Kalt, Professor of Economics, Kennedy School of Government, Harvard University, 79 John F. Kennedy Street, Cambridge, MA 02138
176. Norine Karins, New York State Energy Research and Development Authority, 2 Rockefeller Plaza, Albany, NY 12223
177. John Katrakis, Center for Neighborhood Tech.., 570 W. Randolph, Chicago, IL 60606
178. K. C. Kazmer, Project Manager, Energy Systems Assessment, Gas Research Institute, 8600 West Bryn Mawr Avenue, Chicago, IL 60631
179. Kenneth M. Keating, Bonneville Power Administration, P.O. Box 3621, KIM, Portland, OR 97219
180. Frank Kensill, IHD, 718 West Norris, Philadelphia, PA 19122 181. 0. K. Knight, U.S. Department of Energy, EH-2Y/7E-088,
1000 Independence Avenue, S.W., Washington, D.C. 20585 182. Norman Krumholz, Cleveland Center for Neighborhood
Development, College of Urban Affairs, Cleveland State University, Cleveland, OH 44116
183. Les Lambert, Lambert Engineering, Inc., 601 NW Harmon Blvd., Bend, OR 97701
184. Harry Lane, Department of Energy, CE-222, FORSTL, 1000 Independence Avenue, S.W., Washington, D.C. 20585
185. Tom Lent, Energy Coordinating Agency, 1501 Cherry St., Philadelphia, PA 19102
186. Bernie Lewis, 8411 N.W. Lakeshore, Vancouver, WA 98655 187. Jackie Lind, Minn. Dept. of Energy and Economic Development,
150 E. Kellogg Blvd., St. Paul, MN 55101 188. Carey Lively, NAHB/RF, P.O. Box 1627, Rockville, MD 20850 189. 0. MacFadyen, National Association of Home Builders Research
Foundation, P.O. Box 1627, Rockville, MD 30850 190. Robert A. MacRiss, Institute of Gas Technology, Energy
Development Center, 4201 W. 36th Street, Chicago, IL 60632 191. Arthur R. Maret, Gas Research Institute, 8600 West Bryn Mawr
Avenue, Chicago, IL 60631 192. Steve Marsh, City of Austin, Electric Utility, P.O. Box 1088,
Austin, TX 78767

_ , - - _ . , --12i.. - - - . _ - . - -_ - . - ” . ._^ . . . _ . __ . , . _~
/
193.
194.
195.
196.
197.
198.
199.
200.
201.
202.
203.
204.
205.
206.
207.
208.
209.
210.
211.
212.
213.
214. 215.
56
Richard P. Mazzucchi, Battelle Pacific Northwest Laboratories, P.O. Box C5395, Seattle, WA 98105 Lou McClelland, Institute of Behavioral Science, University of Colorado, Campus Box 468, IBS #5, Boulder, CO 80309 Dan McFarland, Community Energy Partnership, 20 East St., Boston, MA Alan Meier, Lawrence Berkeley Laboratory, B90H, Berkeley, CA 94720 R. Meyer, Office of Energy Resources, 270 Washington Street, S.W., Suite 615, Atlanta, GA 30334 Gary Miller, Division of Urban and Rural Assistance, Oklahoma Department of Commerce, 6601 North Broadway Extension, Building No. 5, Oklahoma City, OK 73116 J. Millhone, U.S. Department of Energy, CE-133, FORSTL, 1000 Independence Avenue, S.W., Washington, D.C. 20585 H. Misuriello, W. S. Fleming and Associates, Inc., 5802 Court Street, Syracuse, NY 13206 M. Modera, Lawrence Berkeley Laboratory, Building 90, Room 3074, Berkeley, CA 94720 0. E. Morrison, Professor of Sociology, Michigan State University, 201 Berkey Hall, East Lansing, MI 48824-1111 Silliam F. Morse, Director of Research, Columbia Gas System Service Corp., 1600 Dublin Road, P.O. Box 2318, Columbus, OH 43216-2318 David Moulton, Subcommittee on Energy, Conservation, and Power, H2-316, U.S. House of Representatives, Washington, D.C. 20515 Thomas Murtaugh, The Peoples Gas Light and Coke Company, 864 West 63rd Street, Philadelphia, PA 19104 Steven Nadel, Massachusetts Audubon Society, 10 Juniper Road, Belmont, MA Iric Nathanson, Director, Energy Finance, Minneapolis Community Development Agency, 250 S. Fourth Street, Minneapolis, MN 55415 Gary Nelson, Gary Nelson and Associates, 4723 Upton St., Minneapolis, MN 55410 Don Neumeyer, Wisconsin Power and Light, Natural Gas Division, 7617 Mineral Point Road, Madison, WI 53703 Ray Nihill, National Fuel Gas, 2484 Seneca Street, Buffalo, NY 14210 Mike Nuess, Energy Resources Center, W. 808 Spokane Falls Blvd., Spokane, WA 99201-3333 Alan G. Obaigbena, Florida Public Service Commission, 101 East Gaines St., Tallahassee, FL 32301 0. L. O’Neal, Texas Ah University, Department of Mechanical Engineering, College Station, TX 77843 H. Gil Peach, 216 Cascade Street, Hood River, OR 97031 George C. Penn, Wisconsin Power and Light, P.O. Box 192, Madison, WI 53701

57
216. Richard L. Perrine, Civil Engineering Dept., Engineering I, Room 2066, University of California, Los Angeles, CA 90024
217. James N. Phillips, Lone Star Gas Co., 2601 Logan St., Dallas, TX 75215
218. G. D. Pine, Gas Research Institute, 8600 West Bryn Mawr Avenue, Chicago, IL 60631
219. John Proctor, 7637 S. Garland, Littleton, CO 80123 220. Jonathan Raab, Bureau of Government Research, P.O. Box 3177,
University of Oregon, Eugene, OR 97403 221. W. J. Raup, Dept. of Energy, CE-222, FORSTL,
1000 Independence Avenue, S.W., Washington, D.C. 20585 222. John Reese, Manager, Residential Energy Conservation,
New York State Energy Office, 2 Rockefeller Plaza, Albany, NY 12223
223. F. R. Robertson, Tennessee Valley Authority, Program Manager, Energy Demonstrations, Divisi.on of Conservation and Energy Management, Chattanoog?, TN 37402-2801
224. Rob Roy, Emerald People s Utility District, 5001 Franklin Blvd., Eugene, OR 97403
225. James Sackett, St. Louis Energy Management, 411 W. Tenth St., St. Louis, MO 63103
226. Steve Saltzman, Greater Los Angeles Energy Coalition, 10956 Weyburn Avenue, Suite 28, Los Angeles, CA 90024
227. David Saum, Infiltec, P.O. Box 1533, Falls Church, VA 22041 228. Hugh Saussy, Jr., Director, Boston Support Office,
U.S. Department of Energy, Analex Building, Room 1002, 150 Causeway Street, Boston, MA 02114
229. Jeff Schlegel, Wisconsin Energy Conservation Corporation, 1045 East Dayton Street, Madison, WI 53703
230. Tom J. Secrest, Battelle Pacific Northwest Laboratories, Sigma IV Bldg., P.O. Box 999, Richland, WA 99352
231. John Sesso, National Center for Appropriate Technology, P.O. Box 3838, Butte, MT 59702
232. Lester Shen, Underground Space Ceore, Vancouver, WA 98655 233. E. Shepherd, New York State Energy Research and Development
Authority, 2 Rockefeller Plaza, Albany, NY 12223 234. Max H. Sherman, Lawrence Berkeley Laboratory, Building 90,
Berkeley, CA 94720 235. 0. Smith, National Center for Appropriate Technology,
P.O. Box 3838, Butte, MT 59702-3838 236. Anthony Smith, Executive Director, Community Energy
Development Corp., 4420 Walnut St., Philadelphia, PA 19104 237. R. Smith, Program Manager, Florida Department of Community
Affairs, Bureau of Local Government Assistance, 2571 Executive Center Circle East, Tallahassee, FL 32301
238. Philip Snyder, ‘Supervisor, Weatherization Inspectors, Seattle Dept. of Human Resources, Community Services Division, 400 Yesler Bldg., 2nd Floor, Seattle, WA' 98104
239. Robert Socolow, Princeton Universityi Center for Energy and Environmental Studies, Engineering-Quad, H-102, Princeton, NJ 08540

58
240. Danny Stefaniak, National Fuel Gas, 2484 Seneca Street, Buffalo, NY 14210
241. Valdi Stefanson, Energy Resource Center, 427 St. Clair Avenue, St. Paul, MN 55102
242. William H. Steigelmann, TechPlan Associates, Inc., 15 Cynwyd Road, Suite 200, Bala Cynwyd, PA 19004
243. Paul C. Stern, National Academy of Sciences, JH852, 2101 Constitution Avenue, N.W., Washington, D.C. 20418
244. Bradley Streb, PERC, 36 Concord St., Framingham, WA 01701 245. Sam Swanson, Office of Energy Conservation and Environment,
Department of Public Service, State of New York, 3 Empire State Plaza, Albany, NY 12223
246. Paul F. Swenson, East Ohio Gas Co., P.O. Box 5759, Cleveland, OH 44101
247. Robert Sydney, General Manager, Citizens Conservation Corporation, 530 Atlantic Avenue, Boston, MA 02210
248. Philip W. Thor, Bonneville Power Administration, P.O. Box 3621, EPC, Portland, OR 97208
249. W. 0. Turner, Texas Ah University, Mechanical Engineering Department, College Station, TX 77643
250. Andre Van Rest, Dept. of Energy, CE-232, FORSTL, 1000 Independence Ave., S.W., Washington, D.C. 20585
251. J. Viegel, North Carolina Alternative Energy Corporation, P.O. Box 12699, Research Triangle Park, NC 27709
252. Ed Vine, Lawrence Berkeley Laboratory, Building 90, Room 3125, Berkeley, CA 94720
253. Jim Vodnik, Community Relations - Social Development Commission, 161 West Wisconsin Avenue, Milwaukee, WI 53203
254. David Walcott, New York State Energy Research and Development Authority, 2 Rockefeller Plaza, Albany, NY 12223
255. J. Warner, American Consulting Eng. Council, Research Management Foundation, 1015 15th Street, Suite 802, Washington, D.C. 20005
256. Allen 0. Wells, Project Manager, Engine Driven Systems, Gas Research Institute, 8600 West Bryn Mawr Avenue, Chicago, IL 60631
257. C. Wentowski, Program Manager, Alabama Department of Economic and Community Affairs, 3465 Norman Bridge Road, Montgomery, AL 36105-0930
258. Linda Wigington, Pennsylvania Energy Center, 2 Gateway Center, Pittsburgh, PA 15222
259. John A. Wilson, California Energy Commission, 1516 9th Street, Sacramento, CA 95814-5512
260. Tom Wilson, R.E.C., P.O. Box 69, Fairchild, WI 54741 261. Jerzy .Wilus, Dept. of Natural Resources, 285 Jefferson St.,
P.O. Box 176, Jefferson City, MO 65102 262. Larry M. Windingland, U.S. Army Corps of Engineers,
P.O. Box 4005, Champaign, IL 61820 263. Vinton L. Wolfe, Atlanta Gas and Light Co., P.O. Box 4569,
Atlanta, GA 30302
59
264. Georgene Zachary, Wa-Ro-Ma Community Action, 209 South Broadway, Coweta, OK 74429
265. Thomas S. Zawacki, Institute of Gas Technology, 4201 West 36th St., Chicago, IL 60632
266. Office of the Assistant Manager for Energy Research and Development, U.S. Department of Energy, Oak Ridge Operations, Oak Ridge, TN 37831-8600
267-276. OSTI, U.S. Department of Energy, P.O. Box 2001, Oak Ridge, TN 37831-6501
i7U.S. GOVERNMENT PRINTING OFFICE 1988-548-118/80085

.
P