Embed Size (px)
Citation preview

All figures and legends in a single file:
Scheme 1. Routine method of encapsulation of an hydrophobic compound into an
hydrophobic polymeric microsphere by swelling followed by evaporation of the
swelling solvent.
Fig. 1. A scheme explaining the increased solubility of fluorescein in organic solvents
and in water. In the organic phase the hydrogen bonds depicted can “protect” the
hydrophilic hydroxyl groups, and in the aqueous phase, the salts formed are soluble.
Fig. 2. Solvation of fluorescein and its entrapment in the organic phase of a biphasic
system: (a) Fluorescein in DCM followed by addition of TEA; (b) Fluorescein in
DCM followed by addition of TEA, then aqueous SDS solution; (c) Fluorescein in
DCM followed by addition of AcOH; (d) Fluorescein in DCM followed by addition
of AcOH, then aqueous SDS solution; (e) Fluorescein in DCM followed by addition
of TEA, then a molar equivalent of AcOH, then aqueous SDS solution; (f) same as
(e), but with half the quantity of AcOH.
Fig. 3. A scheme explaining the low water solubility of fluorescein in presence of
TEA and AcOH.
Fig. 4. Size and size distribution of template polystyrene nanoparticles,
determined by DLS with PCCS.
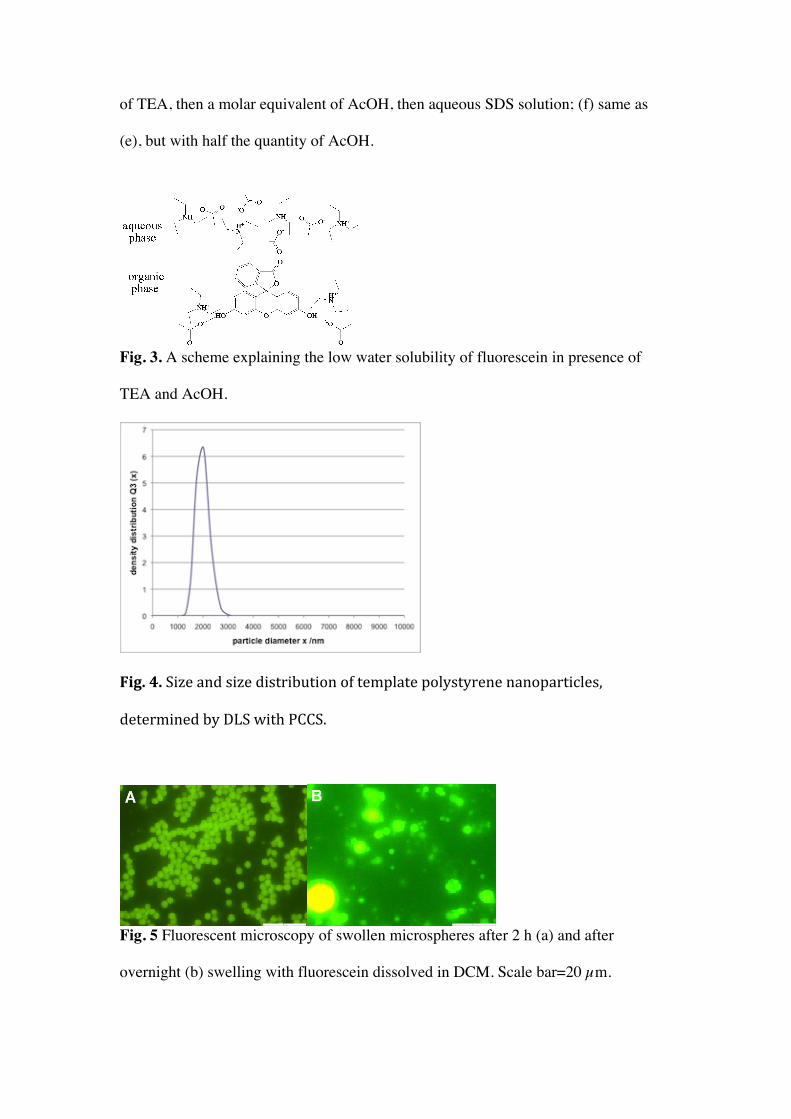
Fig. 5 Fluorescent microscopy of swollen microspheres after 2 h (a) and after
overnight (b) swelling with fluorescein dissolved in DCM. Scale bar=20 µm.

Fig. 6 Fluorescent microscope image of washed 1.9 ± 0.2 µm fluorescein-containing
polystyrene microspheres. Scale bar=20 µm.
Fig. 7 Confocal microscopy, representing a slice through the centre of the bead:
(A) shows that the fluorescein is distributed throughout the microsphere and not
simply adsorbed on the bead surface, while (B) shows rhodamine on the surface
of polystyrene microspheres, displayed solely for comparison, appearing as rings

around the beads. These particles were coated with gelatine, and rhodamine
isothiocyanate was bound to the gelatine amines. Original Magnification = X 600.
Fig. 8 Excitation and emission spectra of fluorescein in ethanol (a), acetone (b) and
polystyrene microspheres (c).

Fig. 9 Tetracycline (A), its entrapment into the organic phase of a biphasic system (B)
and its encapsulation into polystyrene microspheres (C) Original magnification X600.