Embed Size (px)
Citation preview
Filipino American Filipino American Cardiovascular HealthCardiovascular Health
Presented to: Presented to: NYU Post-Graduate Medical SchoolNYU Post-Graduate Medical School
UP Medical Alumni Society in America UP Medical Alumni Society in America
Presented by: Presented by: Luceli C. Cuasay, DrPH, MPH Luceli C. Cuasay, DrPH, MPH
Summit, July 8-9, 2011Summit, July 8-9, 2011
11
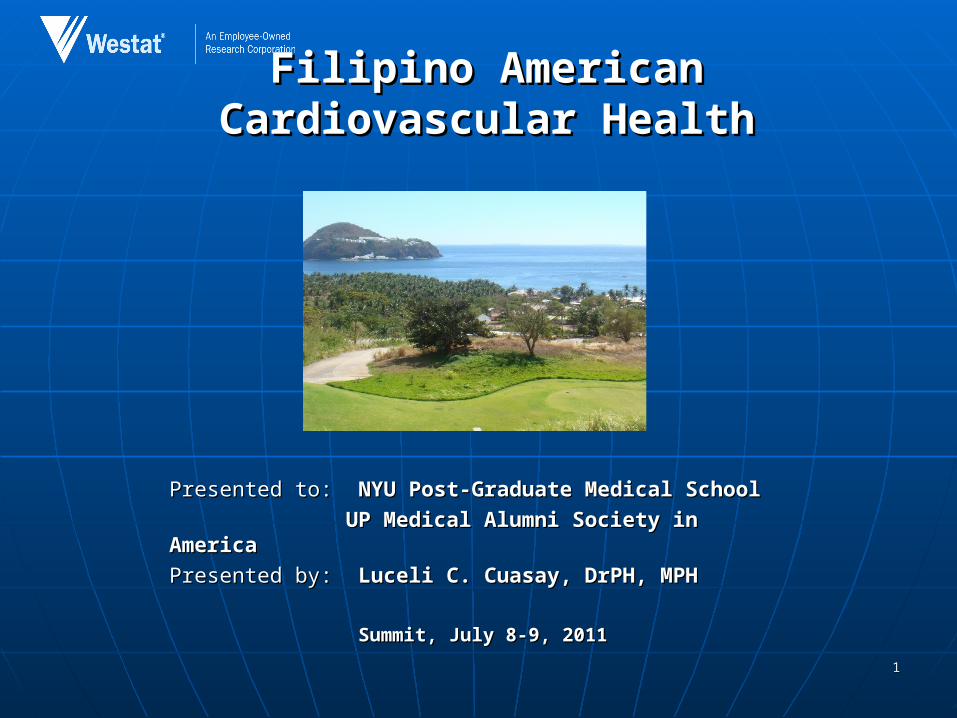
Largest Asian American Ethnic GroupsLargest Asian American Ethnic Groups
Census 2000 and Census 2010Census 2000 and Census 2010
Race AloneRace Alone
22
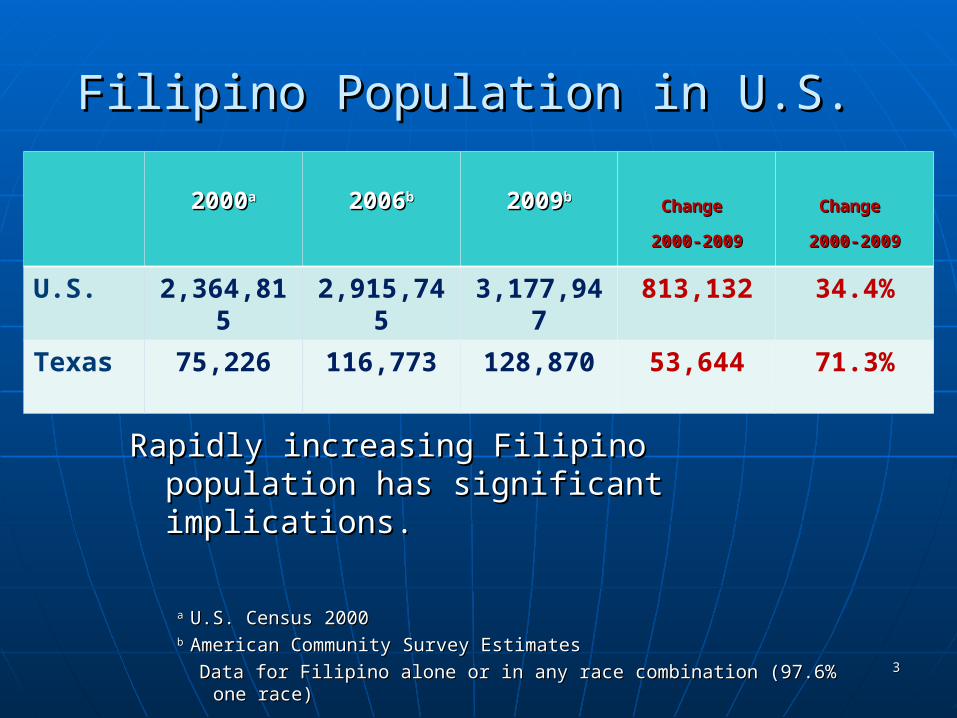
Filipino Population in U.S. Filipino Population in U.S.
Rapidly increasing Filipino population has Rapidly increasing Filipino population has significant implicationsignificant implicationss..
a a U.S. Census 2000U.S. Census 2000b b American Community Survey EstimatesAmerican Community Survey Estimates
Data for Filipino alone or in any race combination (97.6% one race) Data for Filipino alone or in any race combination (97.6% one race)
20002000aa 20062006bb 20092009bbChange Change
2000-20092000-2009
Change Change
2000-20092000-2009
U.S. 2,364,815 2,915,745 3,177,947 813,132 34.4%
Texas 75,226 116,773 128,870 53,644 71.3%
33
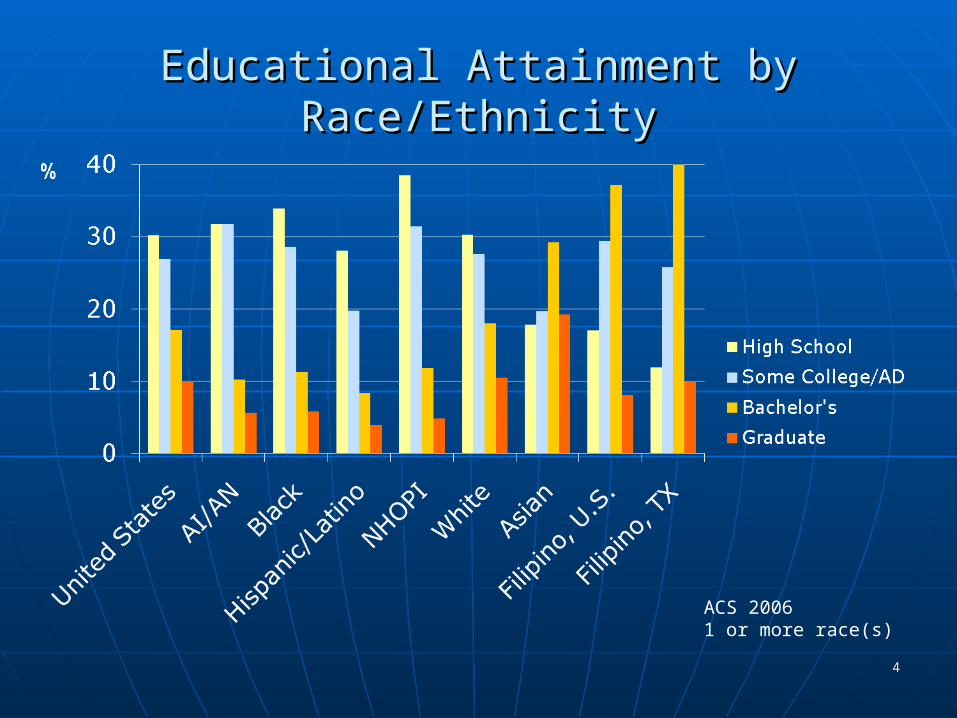
Educational Attainment by Race/EthnicityEducational Attainment by Race/Ethnicity
ACS 20061 or more race(s)
44
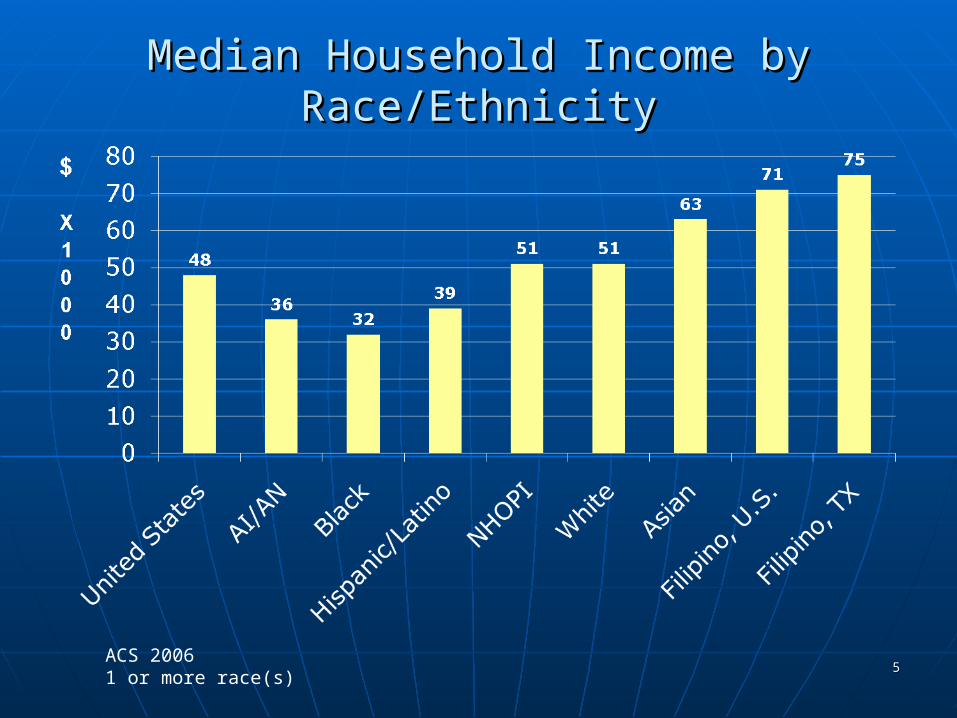
Median Household Income by Median Household Income by Race/EthnicityRace/Ethnicity
ACS 20061 or more race(s)
55
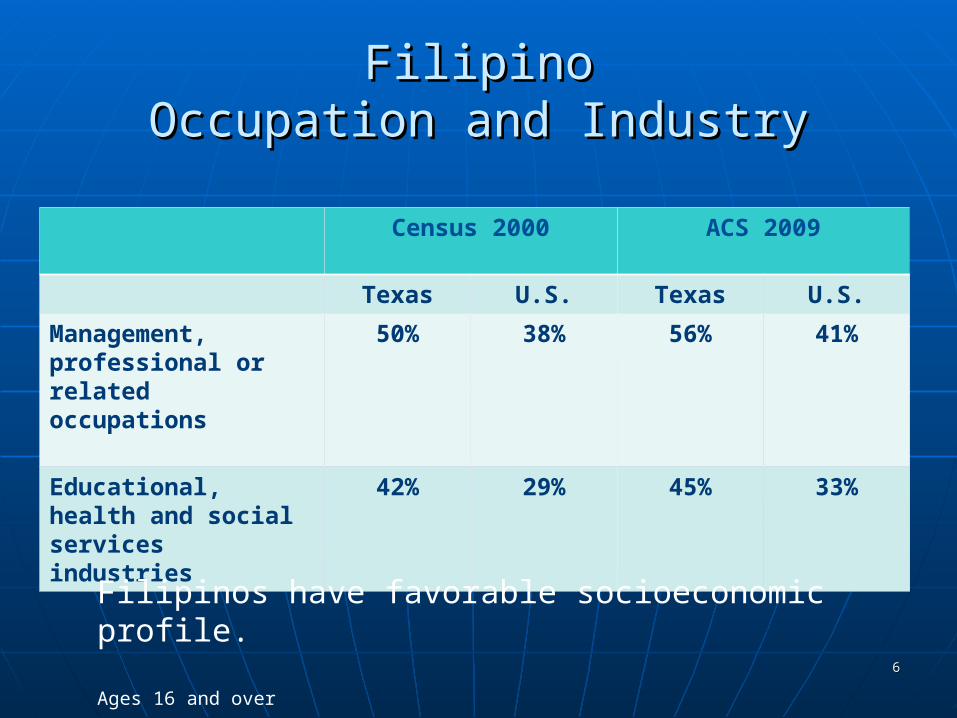
FilipinoFilipinoOccupation and IndustryOccupation and Industry
Census 2000 ACS 2009
Texas U.S. Texas U.S.
Management, professional or related occupations
50% 38% 56% 41%
Educational, health and social services industries
42% 29% 45% 33%
Filipinos have favorable socioeconomic profile.
Ages 16 and over 66
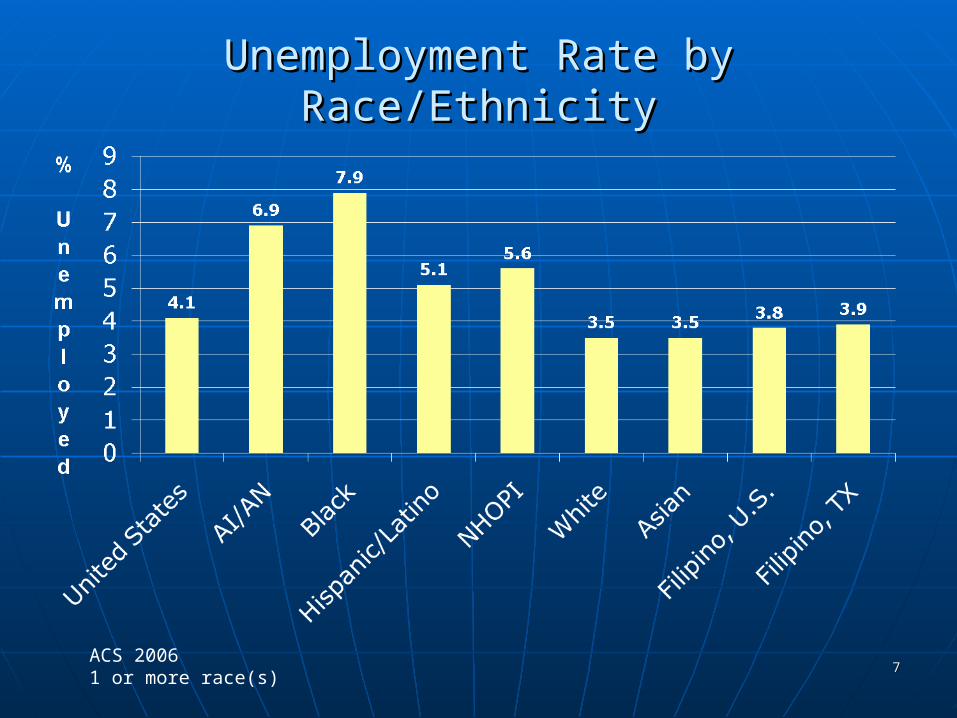
Unemployment Rate by Race/EthnicityUnemployment Rate by Race/Ethnicity
ACS 20061 or more race(s)
77
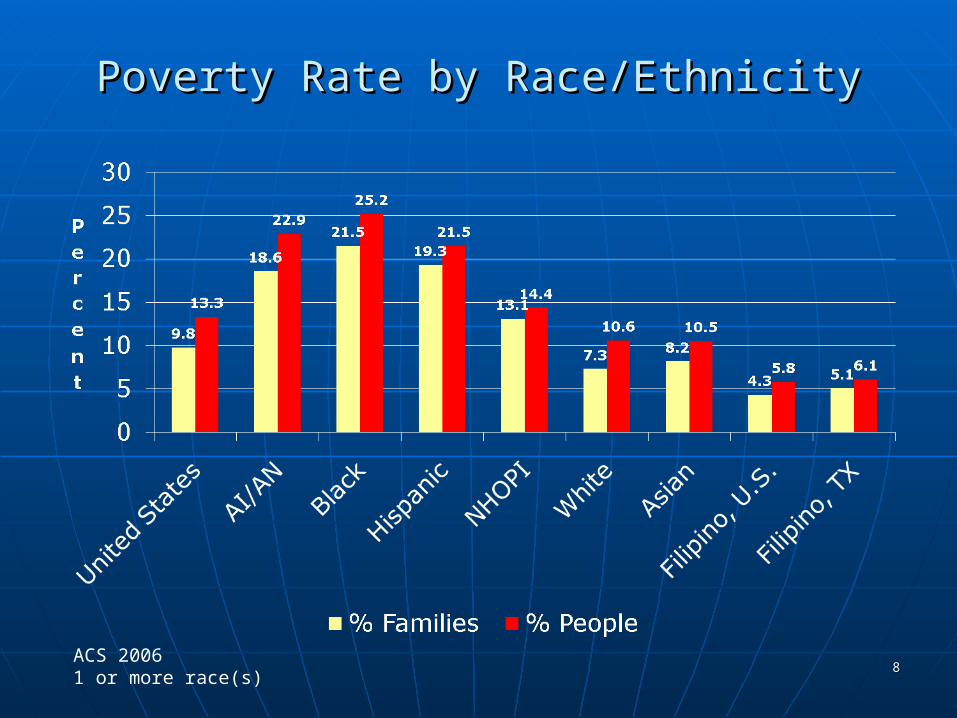
Poverty Rate by Race/EthnicityPoverty Rate by Race/Ethnicity
ACS 20061 or more race(s)
88
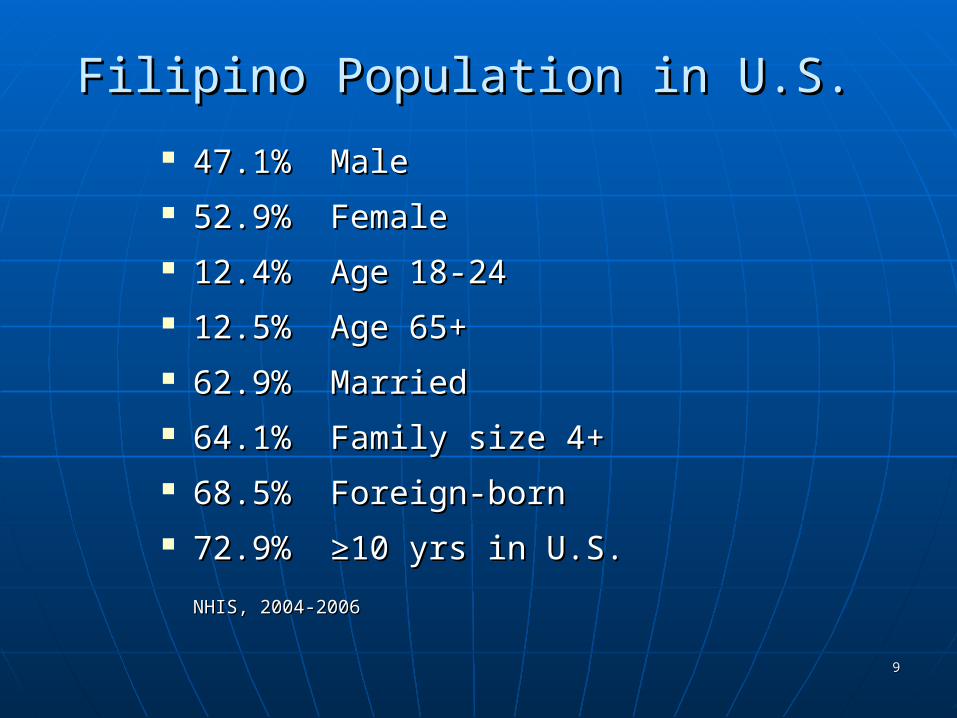
Filipino Population in U.S. Filipino Population in U.S.
47.1% Male47.1% Male 52.9% Female52.9% Female 12.4% Age 18-2412.4% Age 18-24 12.5% Age 65+12.5% Age 65+ 62.9% Married62.9% Married 64.1% Family size 4+64.1% Family size 4+ 68.5% Foreign-born68.5% Foreign-born 72.9% ≥10 yrs in U.S.72.9% ≥10 yrs in U.S.
NHIS, 2004-2006NHIS, 2004-2006
99
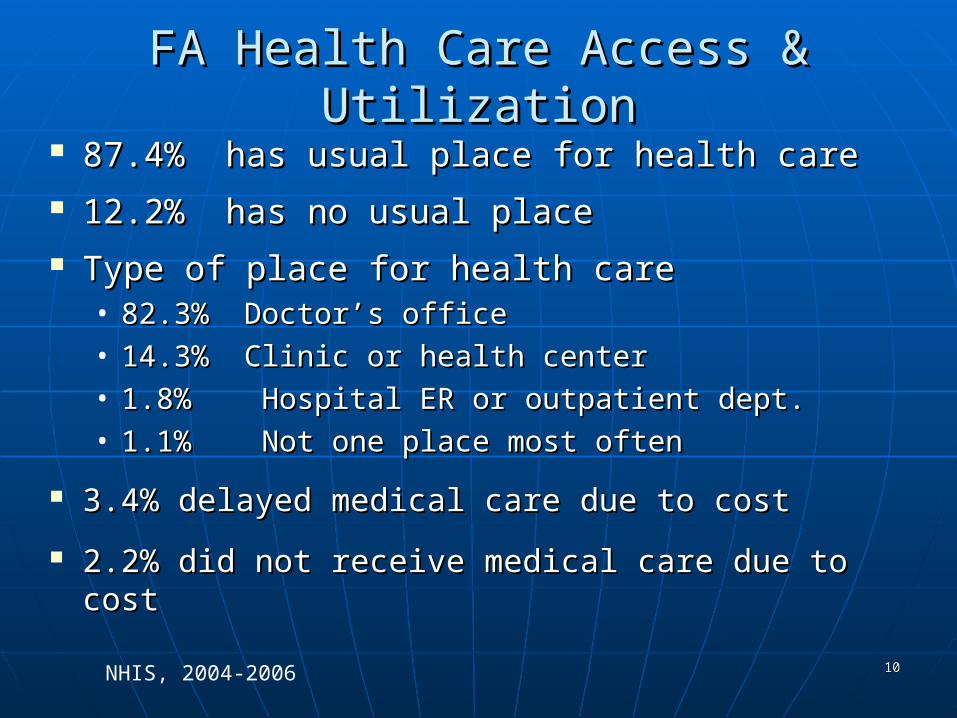
FA Health Care Access & UtilizationFA Health Care Access & Utilization 87.4% has usual place for health care87.4% has usual place for health care 12.2% has no usual place12.2% has no usual place Type of place for health care Type of place for health care
• 82.3% Doctor82.3% Doctor’’s offices office• 14.3% Clinic or health center14.3% Clinic or health center• 1.8% Hospital ER or outpatient dept.1.8% Hospital ER or outpatient dept.• 1.1% Not one place most often1.1% Not one place most often
3.4% delayed medical care due to cost3.4% delayed medical care due to cost
2.2% did not receive medical care due to cost2.2% did not receive medical care due to cost
NHIS, 2004-2006 1010
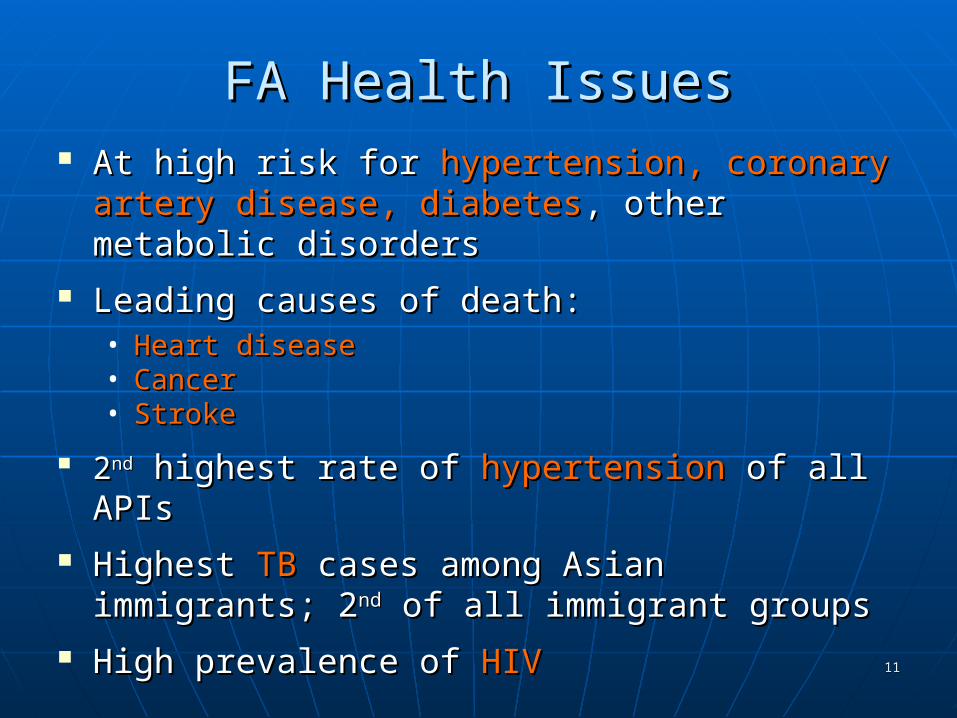
FA Health IssuesFA Health Issues At high risk for At high risk for hypertension, coronary artery hypertension, coronary artery
disease, diabetesdisease, diabetes, other metabolic disorders, other metabolic disorders Leading causes of death: Leading causes of death:
• Heart diseaseHeart disease• CancerCancer• StrokeStroke
22ndnd highest rate of highest rate of hypertensionhypertension of all APIs of all APIs Highest Highest TBTB cases among Asian immigrants; cases among Asian immigrants;
22ndnd of all immigrant groups of all immigrant groups High prevalence of High prevalence of HIVHIV
1111
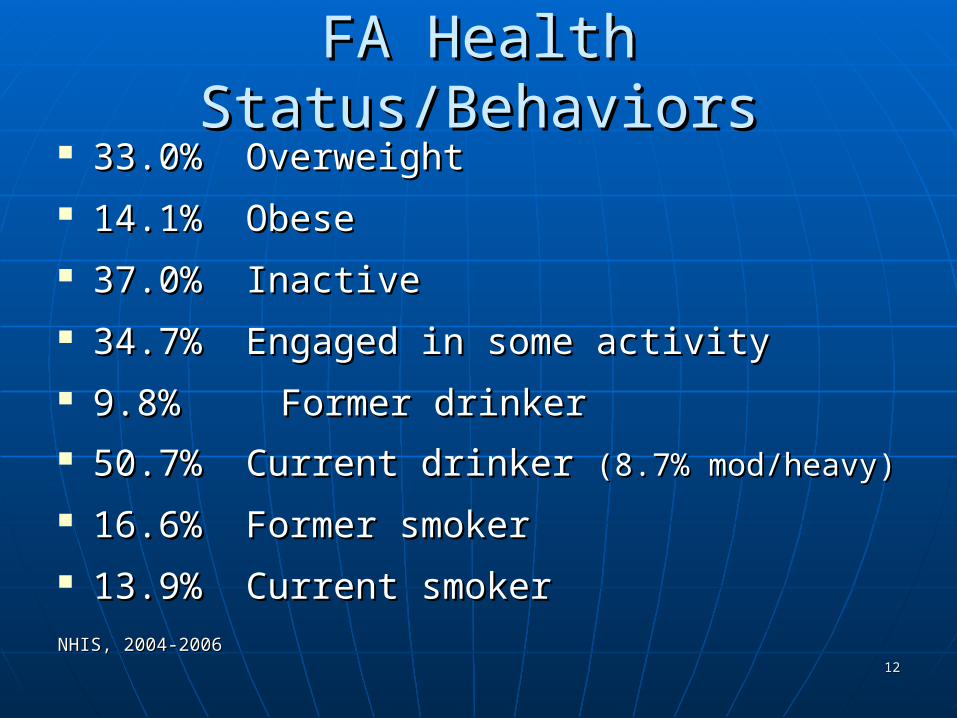
FA Health Status/BehaviorsFA Health Status/Behaviors 33.0% Overweight33.0% Overweight 14.1% Obese14.1% Obese 37.0% Inactive37.0% Inactive 34.7% Engaged in some activity34.7% Engaged in some activity 9.8% 9.8% Former drinkerFormer drinker 50.7% Current drinker 50.7% Current drinker (8.7% mod/heavy)(8.7% mod/heavy)
16.6% Former smoker16.6% Former smoker 13.9% Current smoker13.9% Current smokerNHIS, 2004-2006NHIS, 2004-2006
1212
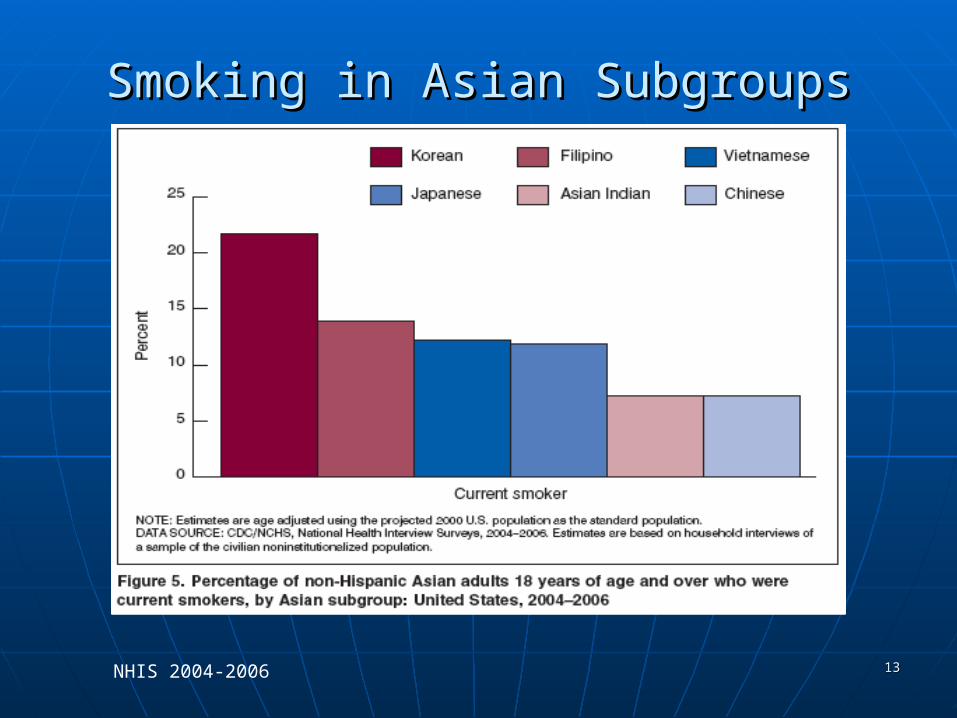
Smoking in Asian SubgroupsSmoking in Asian Subgroups
NHIS 2004-2006 1313
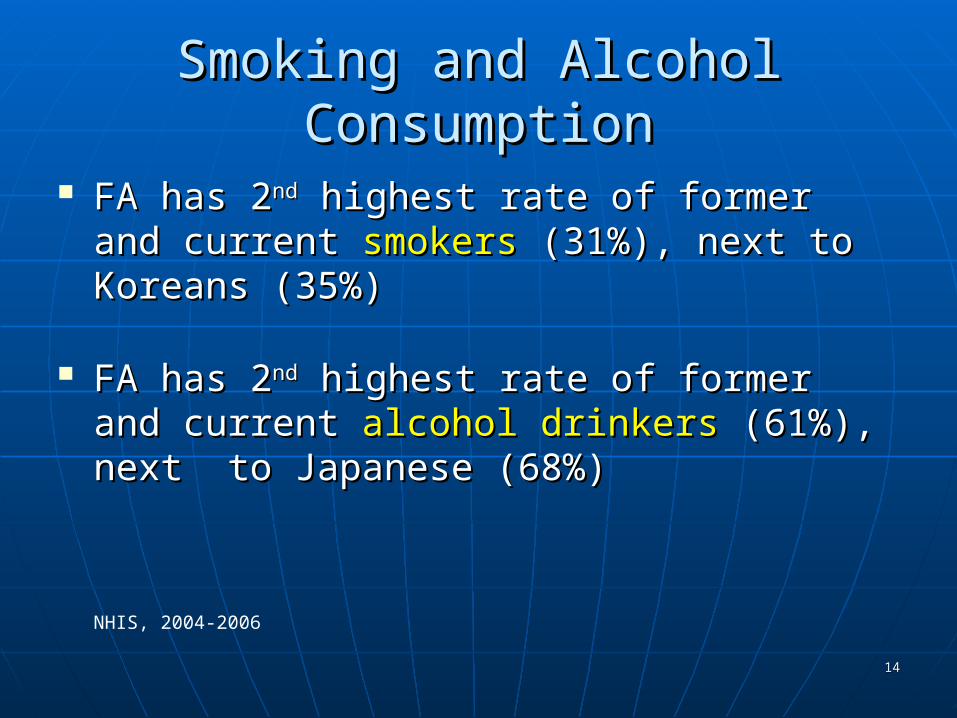
Smoking and Alcohol ConsumptionSmoking and Alcohol Consumption
FA has 2FA has 2ndnd highest rate of former and highest rate of former and current current smokers smokers (31%), next to Koreans (31%), next to Koreans (35%)(35%)
FA has 2FA has 2ndnd highest rate of former and highest rate of former and current current alcohol drinkersalcohol drinkers (61%), next to (61%), next to Japanese (68%) Japanese (68%)
NHIS, 2004-2006
1414
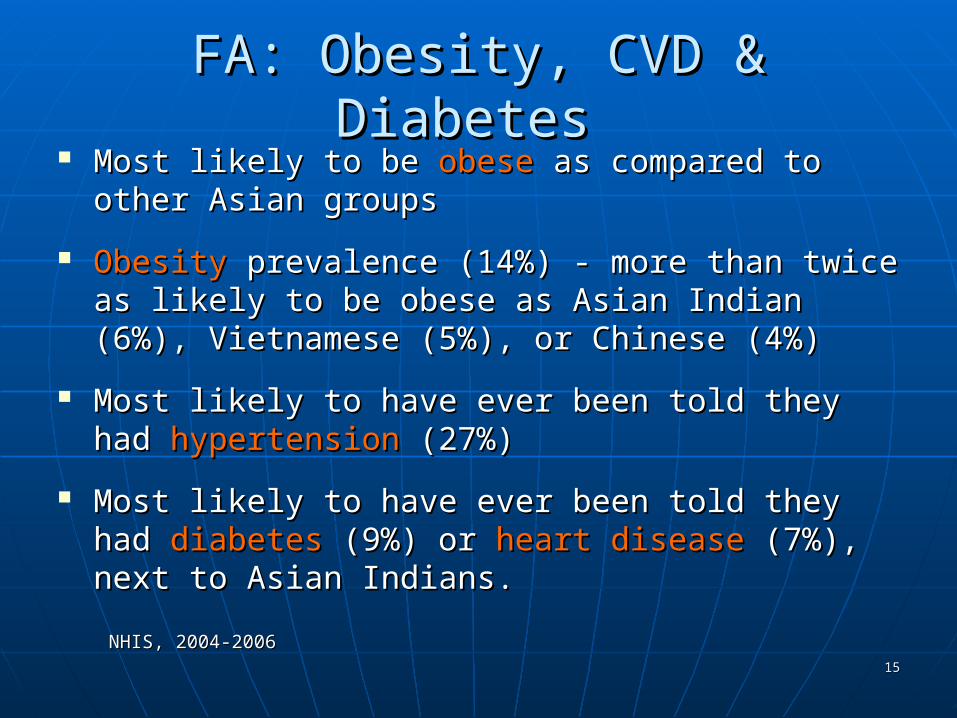
FA: Obesity, CVD & Diabetes FA: Obesity, CVD & Diabetes Most likely to be Most likely to be obeseobese as compared to other as compared to other
Asian groupsAsian groups
ObesityObesity prevalence (14%) - more than twice as prevalence (14%) - more than twice as likely to be obese as Asian Indian (6%), likely to be obese as Asian Indian (6%), Vietnamese (5%), or Chinese (4%) Vietnamese (5%), or Chinese (4%)
Most likely to have ever been told they had Most likely to have ever been told they had hypertensionhypertension (27%) (27%)
Most likely to have ever been told they had Most likely to have ever been told they had diabetesdiabetes (9%) or (9%) or heart disease heart disease (7%), next to (7%), next to Asian Indians. Asian Indians.
NHIS, 2004-2006NHIS, 2004-20061515
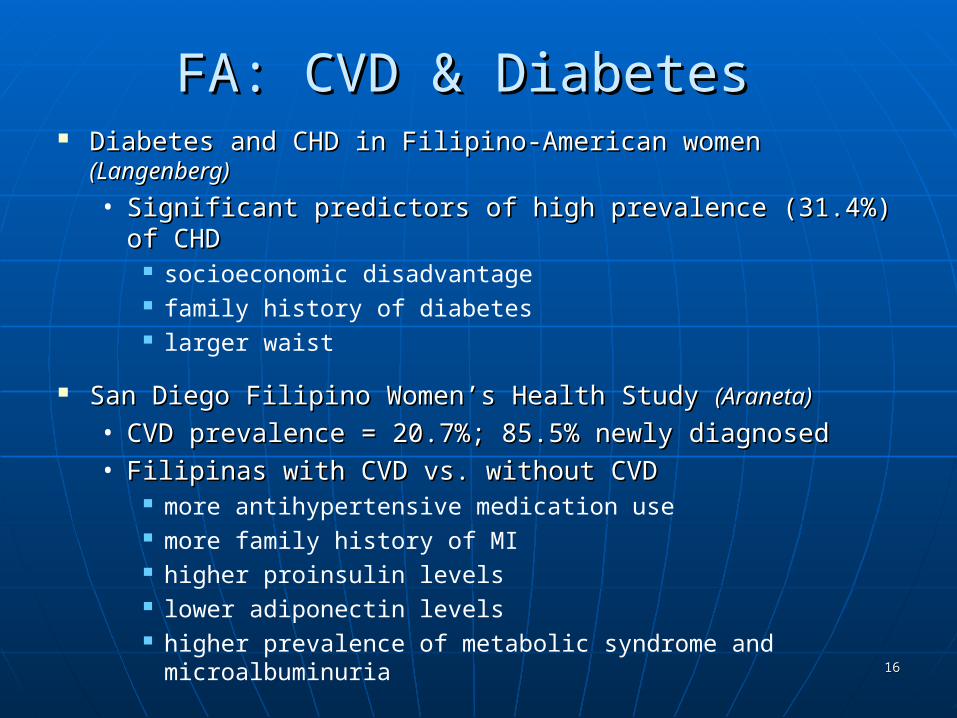
FA: CVD & Diabetes FA: CVD & Diabetes Diabetes and CHD in Filipino-American women Diabetes and CHD in Filipino-American women (Langenberg)(Langenberg)
• Significant predictors of high prevalence (31.4%) of CHDSignificant predictors of high prevalence (31.4%) of CHD socioeconomic disadvantage family history of diabetes larger waist
San DiegoSan Diego Filipino WomenFilipino Women’’s Health Study s Health Study (Araneta) (Araneta)
• CVD prevalence = 20.7%; 85.5% newly diagnosed CVD prevalence = 20.7%; 85.5% newly diagnosed
• Filipinas with CVD vs. without CVDFilipinas with CVD vs. without CVD more antihypertensive medication use more family history of MI higher proinsulin levels lower adiponectin levels higher prevalence of metabolic syndrome and
microalbuminuria 1616
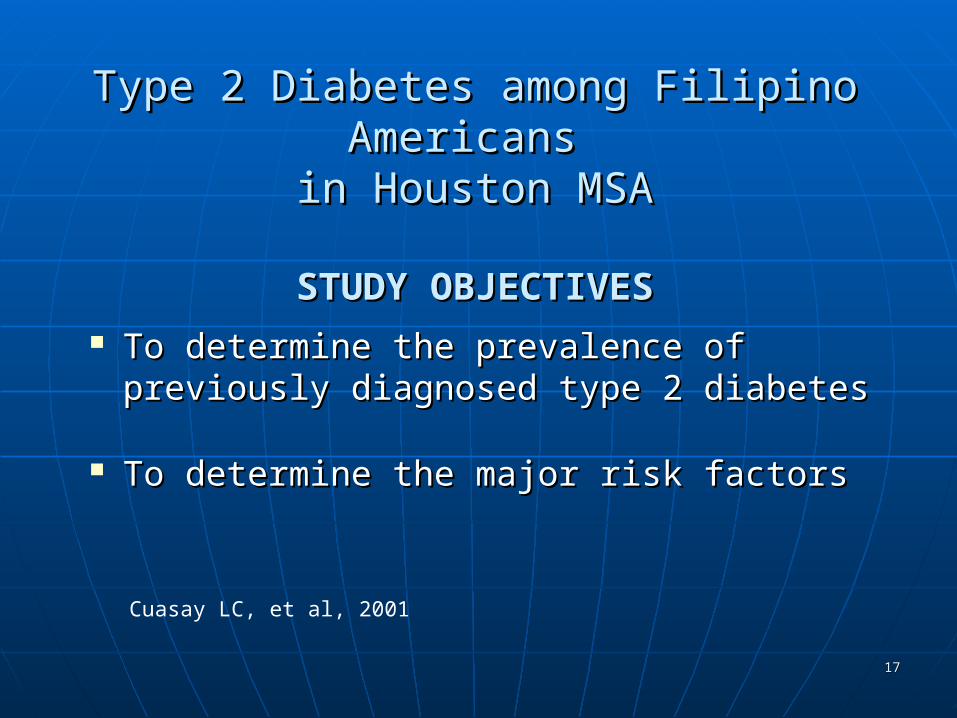
Type 2 Diabetes among Filipino Americans Type 2 Diabetes among Filipino Americans in Houston MSAin Houston MSA
STUDY OBJECTIVESSTUDY OBJECTIVES
To determine the prevalence of previously To determine the prevalence of previously diagnosed type 2 diabetesdiagnosed type 2 diabetes
To determine the major risk factorsTo determine the major risk factors
Cuasay LC, et al, 2001
1717
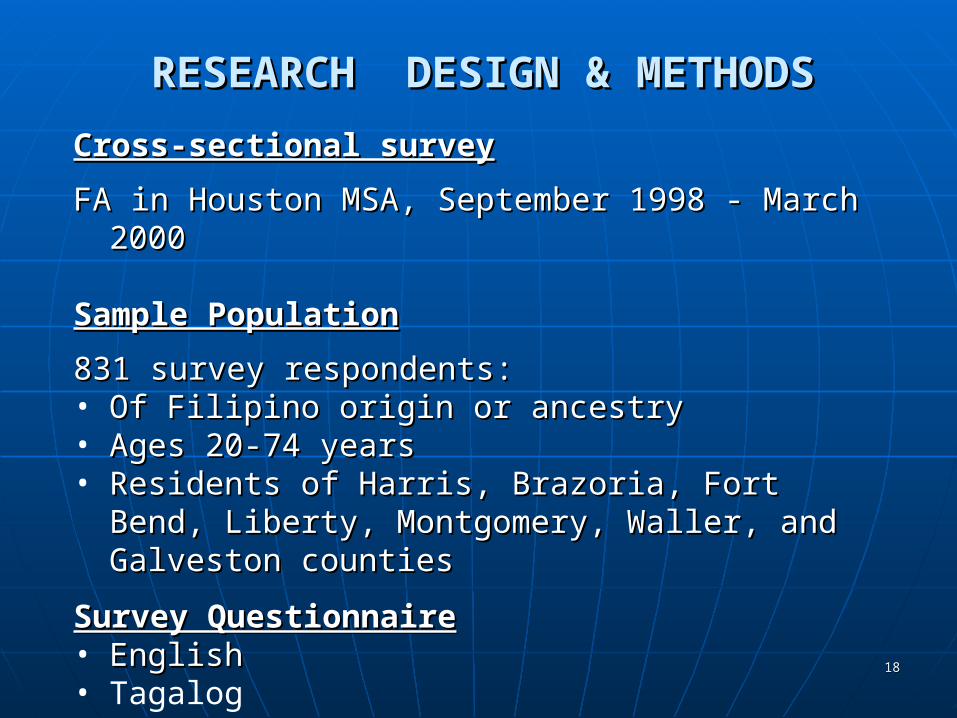
RESEARCHRESEARCH DESIGN & METHODSDESIGN & METHODS
Cross-sectional surveyCross-sectional survey
FA in Houston MSA, September 1998 - March 2000FA in Houston MSA, September 1998 - March 2000
Sample PopulationSample Population
831 survey respondents:831 survey respondents:• Of Filipino origin or ancestryOf Filipino origin or ancestry• Ages 20-74 yearsAges 20-74 years• Residents of Harris, Brazoria, Fort Bend, Liberty, Residents of Harris, Brazoria, Fort Bend, Liberty,
Montgomery, Waller, and Galveston countiesMontgomery, Waller, and Galveston counties
Survey QuestionnaireSurvey Questionnaire• English English • Tagalog
1818
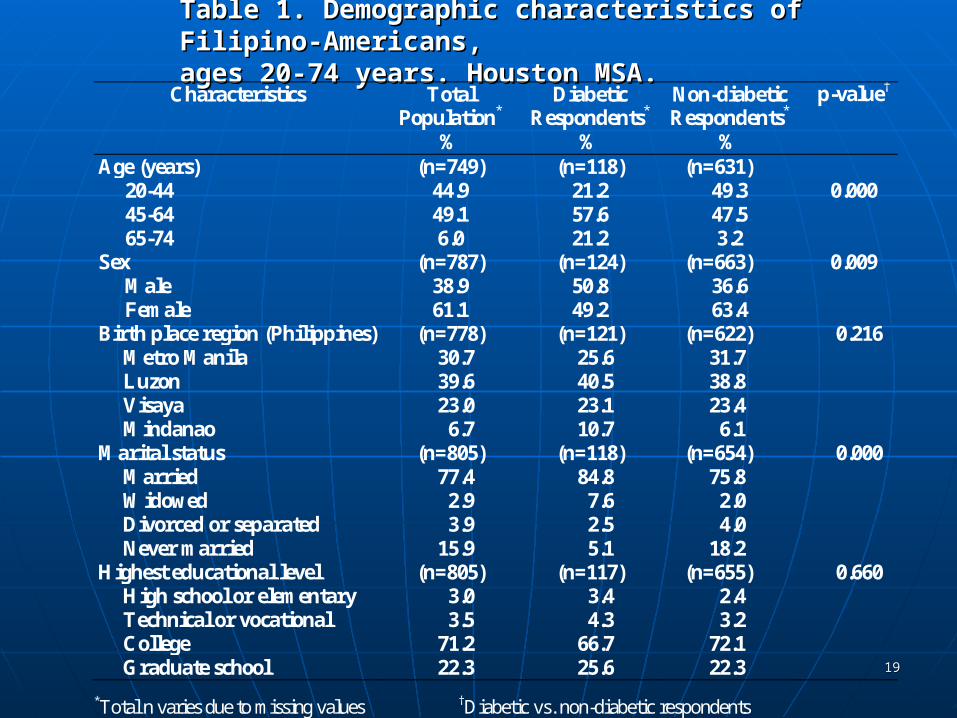
Table 1. Demographic characteristics of Filipino-Americans, Table 1. Demographic characteristics of Filipino-Americans, ages 20-74 years. Houston MSA.ages 20-74 years. Houston MSA.
Characteristics Total Population*
%
Diabetic Respondents*
%
Non-diabetic Respondents*
%
p-value†
Age (years) (n=749) (n=118) (n=631) 20-44 44.9 21.2 49.3 0.000 45-64 49.1 57.6 47.5 65-74 6.0 21.2 3.2
Sex (n=787) (n=124) (n=663) 0.009 Male 38.9 50.8 36.6 Female 61.1 49.2 63.4
Birth place region (Philippines) (n=778) (n=121) (n=622) 0.216 Metro Manila 30.7 25.6 31.7 Luzon 39.6 40.5 38.8 Visaya 23.0 23.1 23.4 Mindanao 6.7 10.7 6.1
Marital status (n=805) (n=118) (n=654) 0.000 Married 77.4 84.8 75.8 Widowed 2.9 7.6 2.0 Divorced or separated 3.9 2.5 4.0 Never married 15.9 5.1 18.2
Highest educational level (n=805) (n=117) (n=655) 0.660 High school or elementary 3.0 3.4 2.4 Technical or vocational 3.5 4.3 3.2 College 71.2 66.7 72.1 Graduate school 22.3 25.6 22.3
*Total n varies due to missing values †Diabetic vs. non-diabetic respondents
1919
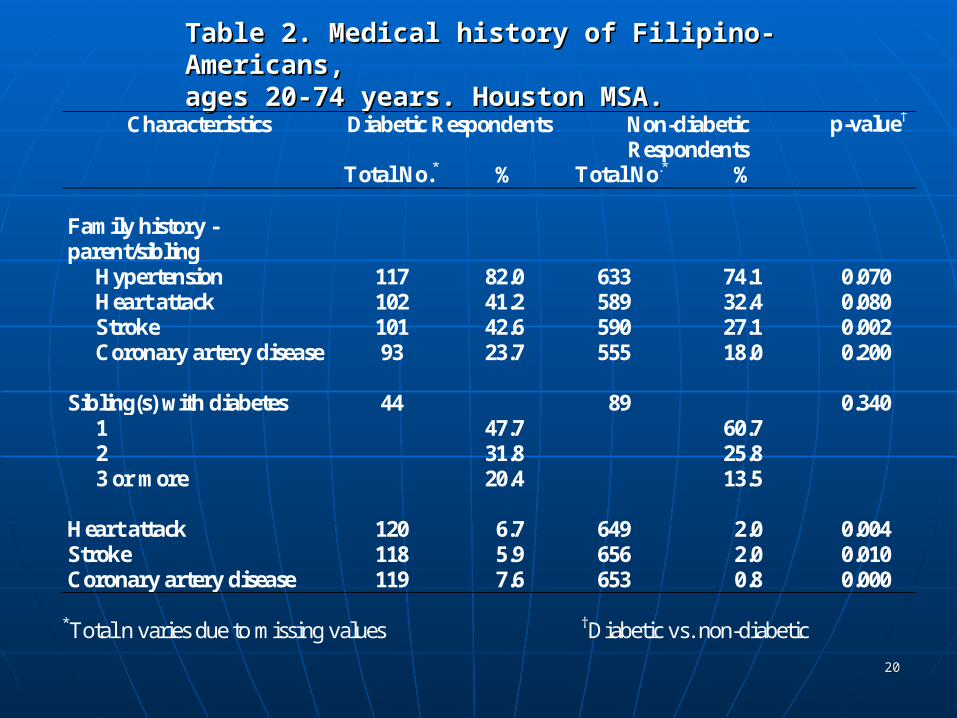
Table 2. Medical history of Filipino-Americans, Table 2. Medical history of Filipino-Americans, ages 20-74 years. Houston MSA.ages 20-74 years. Houston MSA.
Characteristics Diabetic Respondents Non-diabetic Respondents
p-value†
Total No.* % Total No.* % Family history - parent/sibling
Hypertension 117 82.0 633 74.1 0.070 Heart attack 102 41.2 589 32.4 0.080 Stroke 101 42.6 590 27.1 0.002 Coronary artery disease 93 23.7 555 18.0 0.200
Sibling(s) with diabetes 44 89 0.340 1 47.7 60.7 2 31.8 25.8 3 or more 20.4 13.5
Heart attack 120 6.7 649 2.0 0.004 Stroke 118 5.9 656 2.0 0.010 Coronary artery disease 119 7.6 653 0.8 0.000
*Total n varies due to missing values †Diabetic vs. non-diabetic
2020
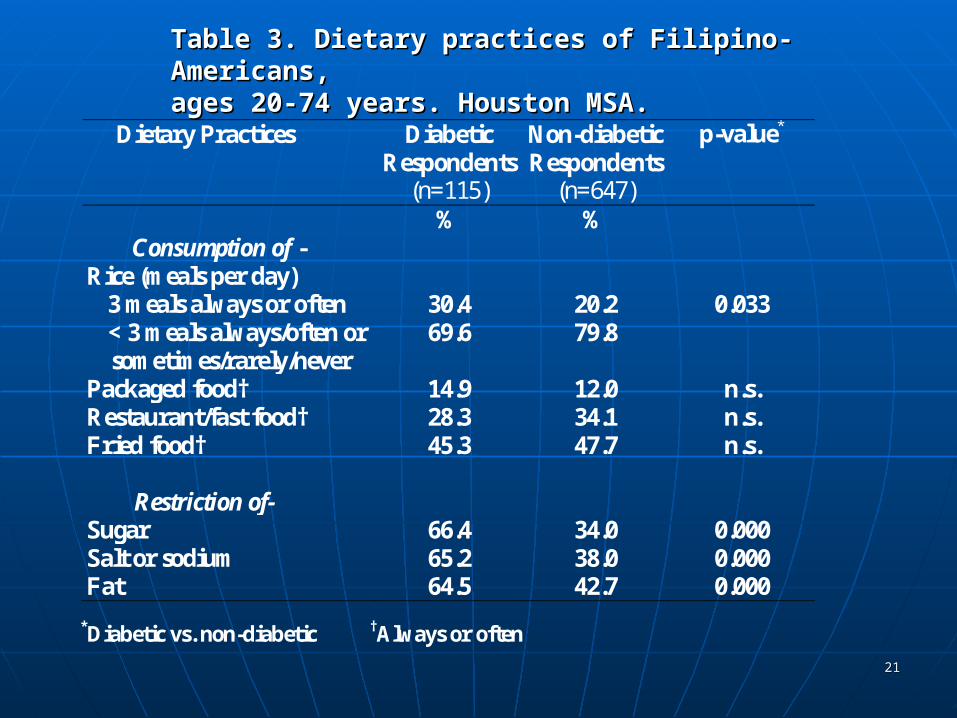
Table 3. Dietary practices of Filipino-Americans, Table 3. Dietary practices of Filipino-Americans, ages 20-74 years. Houston MSA.ages 20-74 years. Houston MSA.
Dietary Practices Diabetic Respondents
(n=115)
Non-diabetic Respondents
(n=647)
p-value*
% % Consumption of -
Rice (meals per day) 3 meals always or often 30.4 20.2 0.033 < 3 meals always/often or sometimes/rarely/never
69.6 79.8
Packaged food† 14.9 12.0 n.s. Restaurant/fast food† 28.3 34.1 n.s. Fried food† 45.3 47.7 n.s.
Restriction of- Sugar 66.4 34.0 0.000 Salt or sodium 65.2 38.0 0.000 Fat 64.5 42.7 0.000
*Diabetic vs. non-diabetic †Always or often
2121
0
10
20
30
40
50
60
70
Either parent Both parents Any sibling
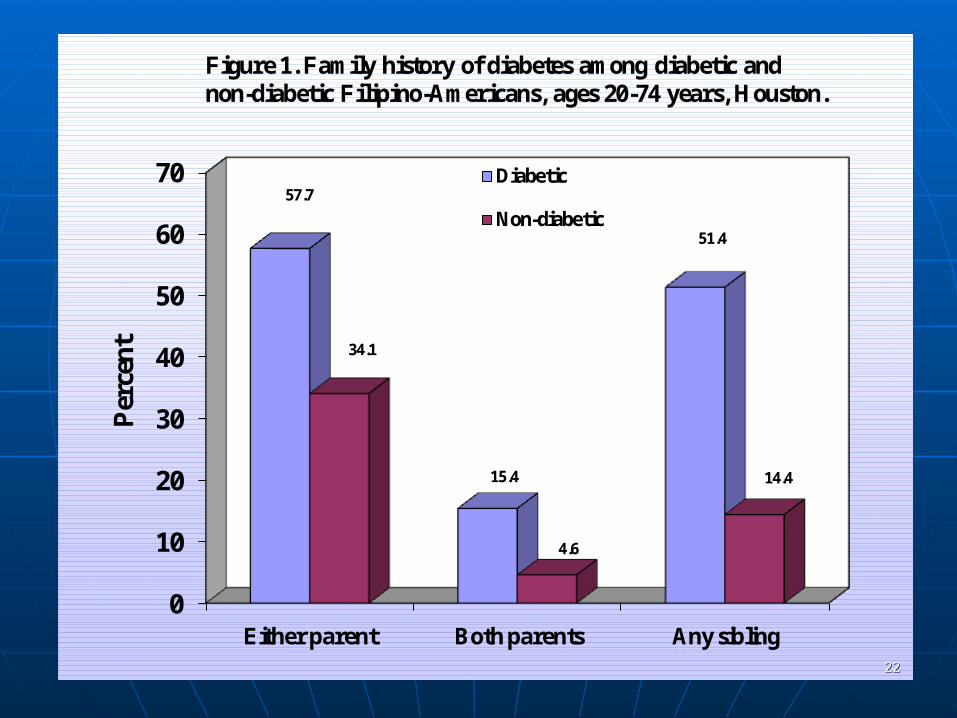
57.7
15.4
51.4
34.1
4.6
14.4
Per
cen
t
Figure 1. Family history of diabetes among diabetic and non-diabetic Filipino-Americans, ages 20-74 years, Houston.
Diabetic
Non-diabetic
2222
0
10
20
30
40
50
60
70
80
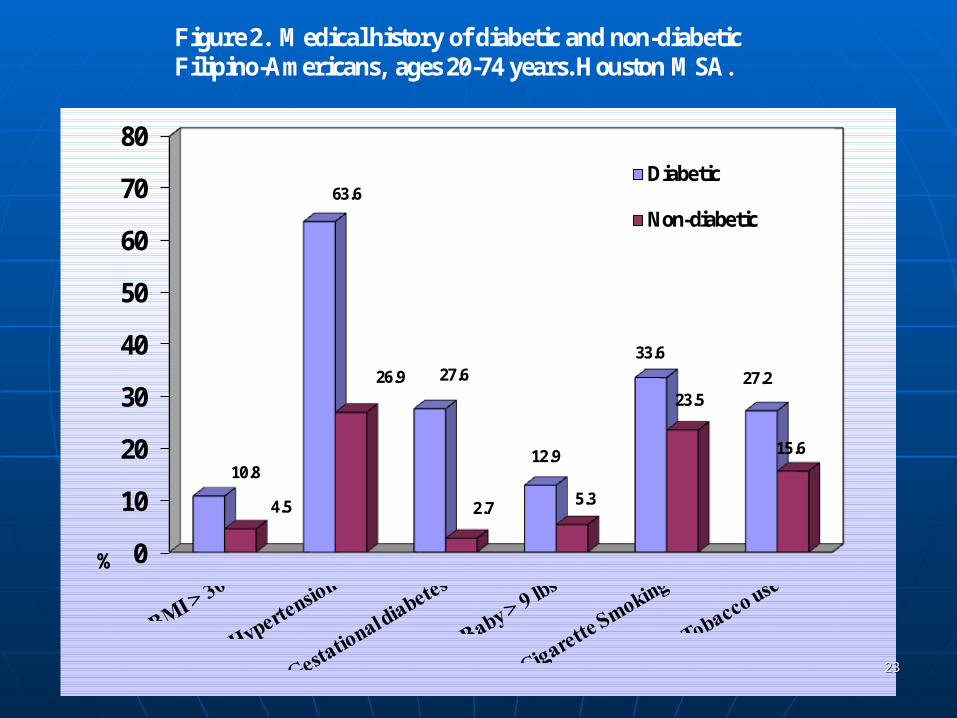
10.8
63.6
27.6
12.9
33.6
27.2
4.5
26.9
2.7 5.3
23.5
15.6
Figure 2. Medical history of diabetic and non-diabeticFilipino-Americans, ages 20-74 years. Houston MSA.
Diabetic
Non-diabetic
%
2323
0 10 20 30 40 50 60
Low income (<$20,000)
Gestational (women)
Baby > 9 lbs (women)
Obesity (BMI >30)
Diabetes family history
Female
Male
65-74
55-64
45-54
35-44
Ages 20-34
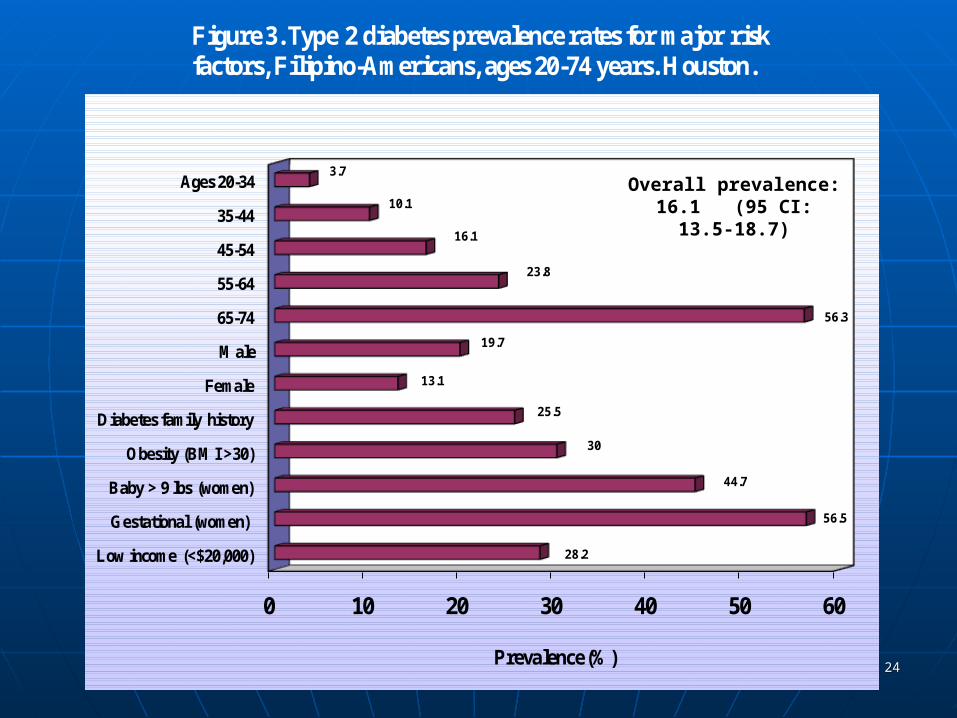
28.2
56.5
44.7
30
25.5
13.1
19.7
56.3
23.8
16.1
10.1
3.7
Prevalence (%)
Figure 3. Type 2 diabetes prevalence rates for major risk factors, Filipino-Americans, ages 20-74 years. Houston.
Overall prevalence: 16.1 (95 CI: 13.5-18.7)
2424
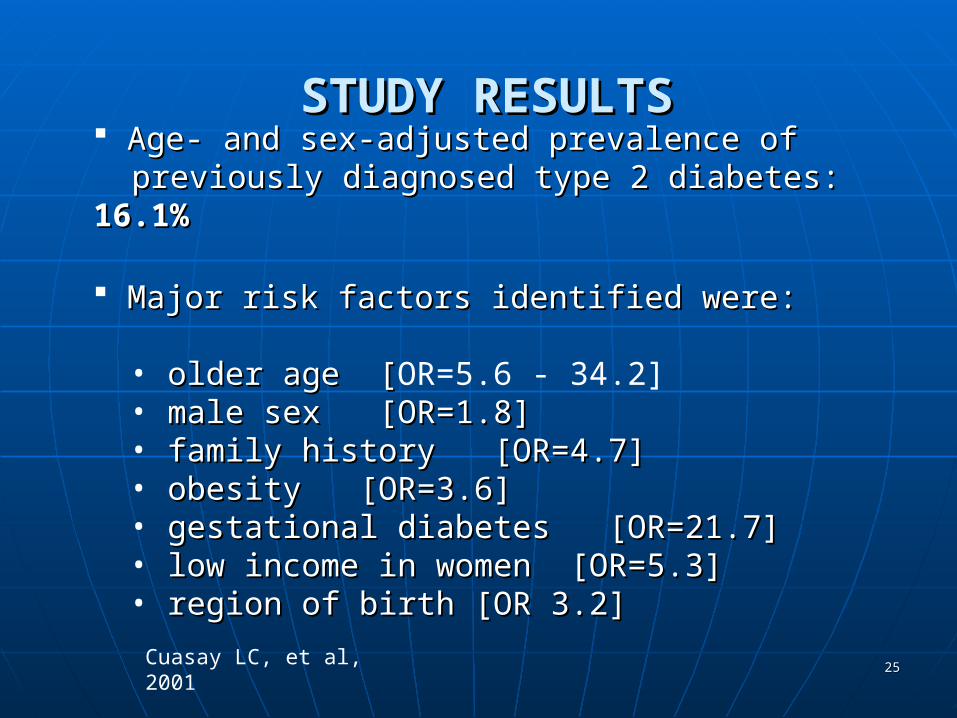
Age- and sex-adjusted prevalence ofAge- and sex-adjusted prevalence of previously diagnosed type 2 diabetes: previously diagnosed type 2 diabetes: 16.1%16.1%
Major risk factors identified were:Major risk factors identified were:
• older age [older age [OR=5.6 - 34.2]• male sex [OR=1.8]male sex [OR=1.8]• family history [OR=4.7]family history [OR=4.7]• obesity [OR=3.6]obesity [OR=3.6]• gestational diabetes [OR=21.7]gestational diabetes [OR=21.7]• low income in women [OR=5.3]low income in women [OR=5.3]• region of birth [OR 3.2] region of birth [OR 3.2]
STUDY RESULTSSTUDY RESULTS
Cuasay LC, et al, 20012525
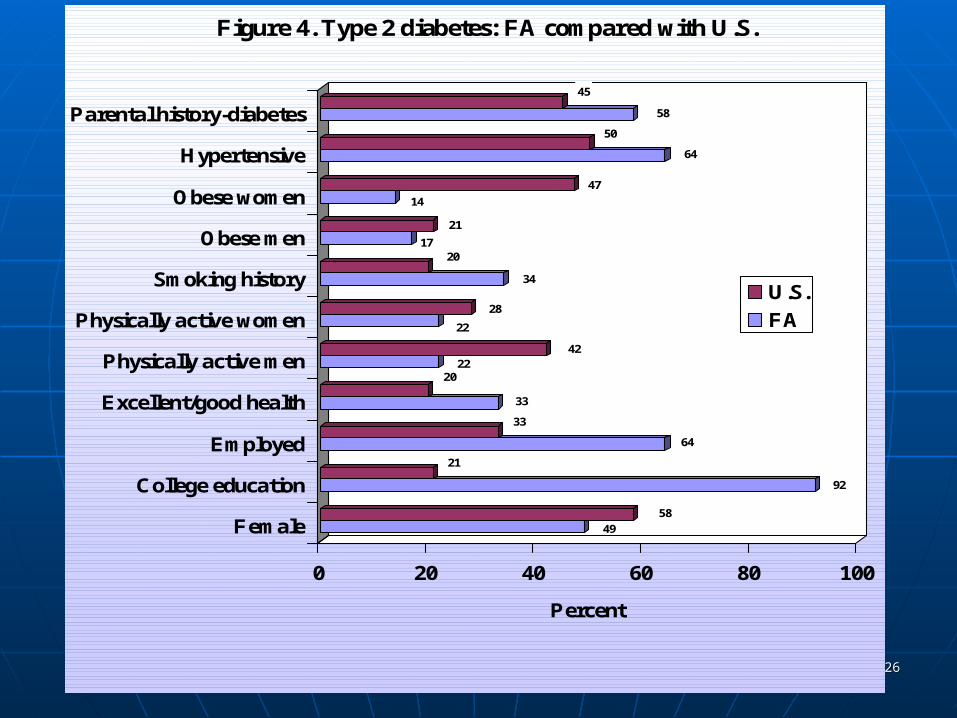
49
58
92
21
64
33
33
2022
42
22
28
34
2017
21
14
47
64
50
58
45
0 20 40 60 80 100
Percent
Female
College education
Employed
Excellent/good health
Physically active men
Physically active women
Smoking history
Obese men
Obese women
Hypertensive
Parental history-diabetes
Figure 4. Type 2 diabetes: FA compared with U.S.
U.S.
FA
2626
2727
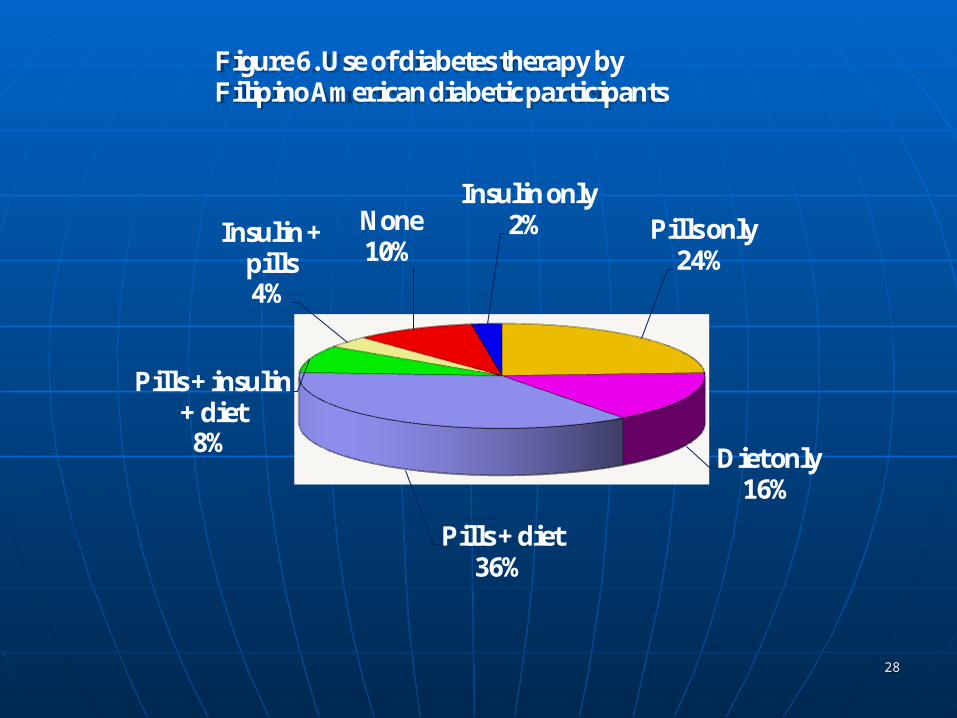
Pills only24%
Diet only16%
Pills + diet36%
Pills + insulin + diet8%
Insulin + pills4%
None10%
Insulin only2%
Figure 6. Use of diabetes therapy byFilipino American diabetic participants
2828
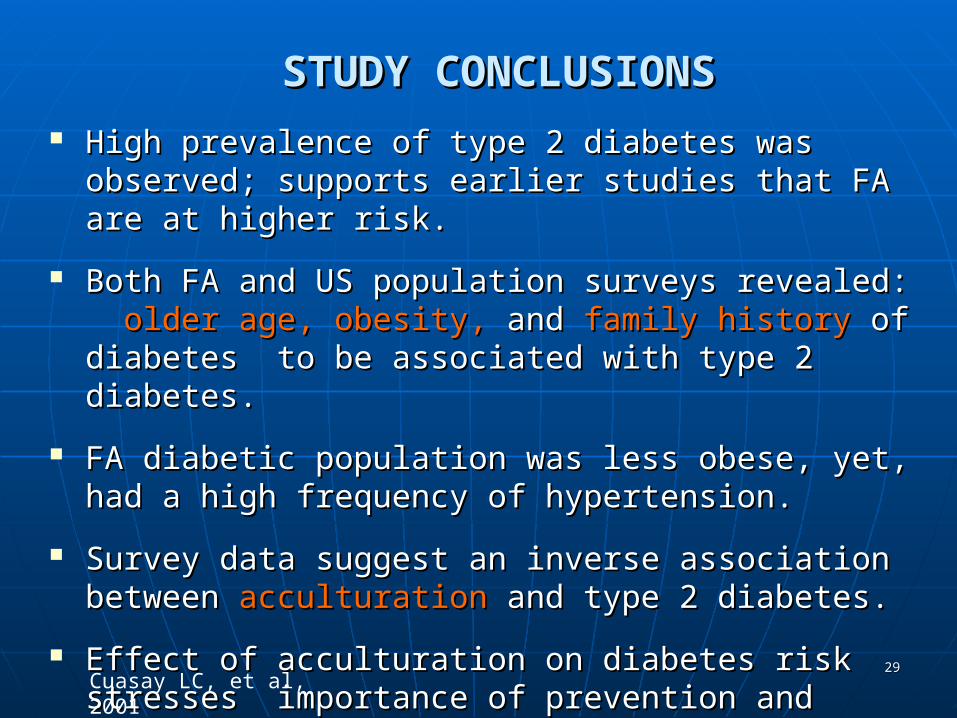
STUDY CONCLUSIONSSTUDY CONCLUSIONS High prevalence of type 2 diabetes was observed; supports High prevalence of type 2 diabetes was observed; supports
earlier studies that FA are at higher risk.earlier studies that FA are at higher risk.
Both FA and US population surveys revealed: Both FA and US population surveys revealed: older age, older age, obesity,obesity, andand family history family history of diabetes to be associated of diabetes to be associated with type 2 diabetes.with type 2 diabetes.
FA diabetic population was less obese, yet, had a high FA diabetic population was less obese, yet, had a high frequency of hypertension.frequency of hypertension.
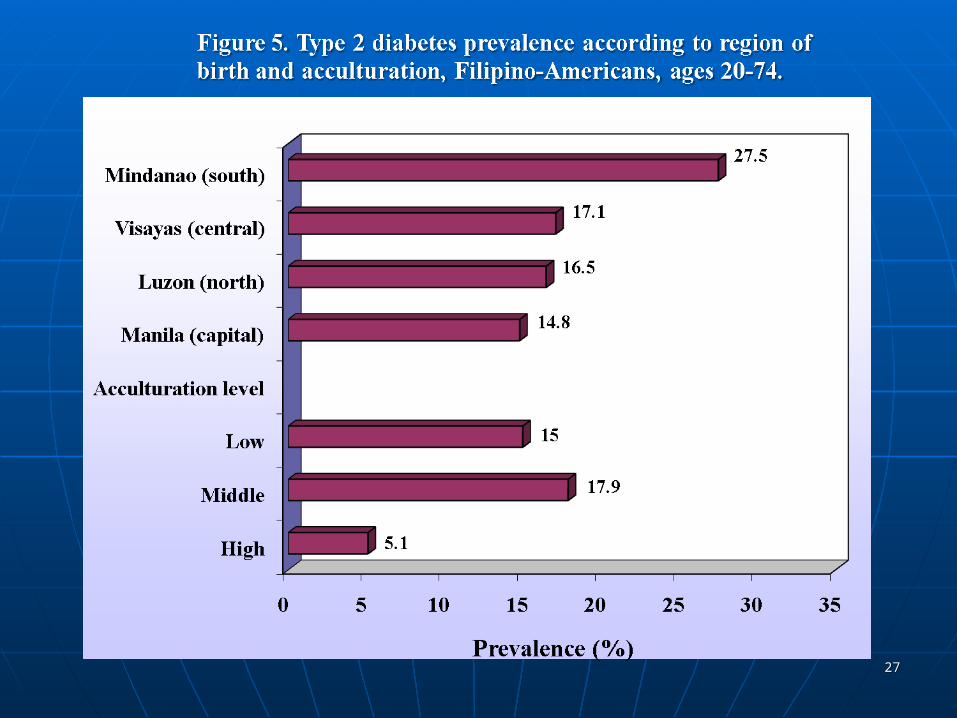
Survey data suggest an inverse association between Survey data suggest an inverse association between acculturationacculturation and type 2 diabetes. and type 2 diabetes.
Effect of acculturation on diabetes risk stresses Effect of acculturation on diabetes risk stresses importance of prevention and control strategies.importance of prevention and control strategies.
2929Cuasay LC, et al, 2001
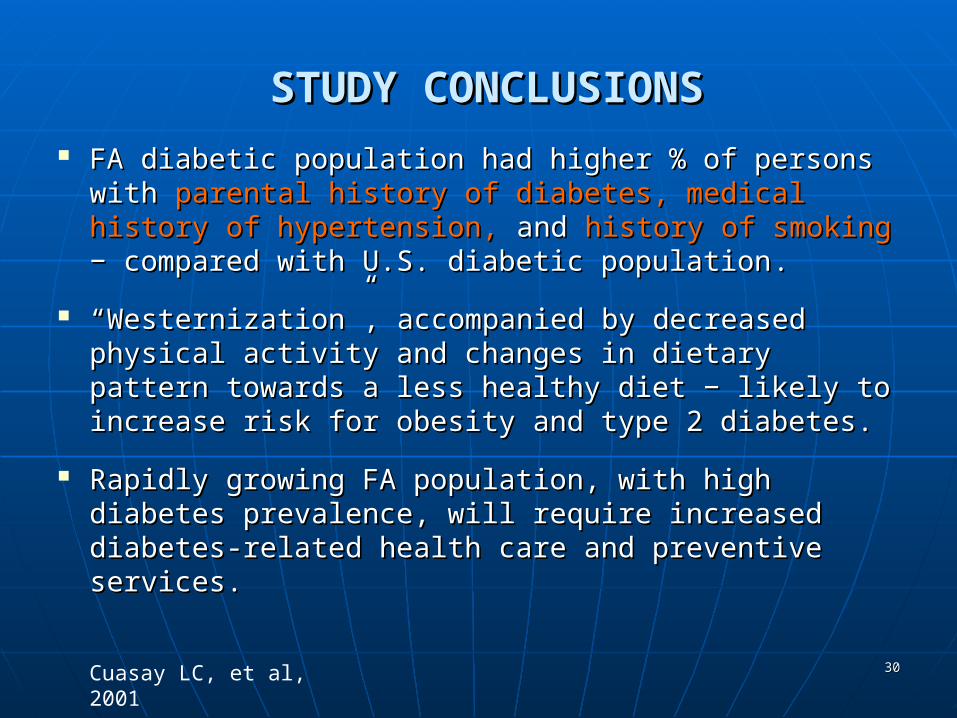
FA diabetic population had higher % of persons with FA diabetic population had higher % of persons with parental history of diabetes, medical history of parental history of diabetes, medical history of hypertension, hypertension, andand history of smoking history of smoking − compared with − compared with U.S. diabetic populationU.S. diabetic population. .
““WesternizationWesternization””, accompanied by decreased physical , accompanied by decreased physical activity and changes in dietary pattern towards a less activity and changes in dietary pattern towards a less healthy diet − likely to increase risk for obesity and type healthy diet − likely to increase risk for obesity and type 2 diabetes.2 diabetes.
Rapidly growing FA population, with high diabetes Rapidly growing FA population, with high diabetes prevalence, will require increased diabetes-related health prevalence, will require increased diabetes-related health care and preventive services.care and preventive services.
STUDY CONCLUSIONSSTUDY CONCLUSIONS
3030Cuasay LC, et al, 2001
Filipino Americans Filipino Americans An Invisible MinorityAn Invisible Minority
Large population, with very limited data on health needsLarge population, with very limited data on health needs
Major health issues persist in spite of:Major health issues persist in spite of:
• having a favorable socioeconomic status, having a favorable socioeconomic status,
• large percentage employed in health care industry, large percentage employed in health care industry,
• being English proficientbeing English proficient
— — characteristics associated with improved characteristics associated with improved health health access and health status. access and health status.
3131
Filipino Health Needs Assessment Filipino Health Needs Assessment (FilHNA) (FilHNA)
Collect information on health status, health behaviors Collect information on health status, health behaviors and beliefs, health care access, and utilization of and beliefs, health care access, and utilization of Filipinos (≥18 years) residing in Brazoria, Fort Bend, Filipinos (≥18 years) residing in Brazoria, Fort Bend, Galveston, and Harris counties.Galveston, and Harris counties.
Major emphasis on cancer, diabetes, circulatory and Major emphasis on cancer, diabetes, circulatory and respiratory conditions, and mental health issues.respiratory conditions, and mental health issues.
Improve understanding of health and cancer concerns, Improve understanding of health and cancer concerns, so that educational programs and interventions can be so that educational programs and interventions can be developed to help meet the Filipino communitydeveloped to help meet the Filipino community’’s needs.s needs.
3232
FilHNA ProjectFilHNA Project
Qualitative studyQualitative study: Conduct focus group interviews of key community groups (ages 18‑55 and >55 years).• physicians• nurses • allied health professionals• non-health professionals• non-professionals
Quantitative studyQuantitative study: Conduct health needs assessment survey of representative sample of Filipinos in four target counties.
3333
ReferencesReferences1.1. Cuasay LC, et al. Prevalence and determinants of Type 2 diabetes among Cuasay LC, et al. Prevalence and determinants of Type 2 diabetes among
Filipino-Americans in the Houston, Texas Metropolitan Statistical Area. Filipino-Americans in the Houston, Texas Metropolitan Statistical Area. Diabetes Care 2001:24:2054-2058.Diabetes Care 2001:24:2054-2058.
2.2. Barnes PM, Adams PF, Powell-Griner E. Health Characteristics of the Asian Barnes PM, Adams PF, Powell-Griner E. Health Characteristics of the Asian adult population: United States, 2004-2006. Adv Data 2008;394:1-22.adult population: United States, 2004-2006. Adv Data 2008;394:1-22.
3.3. Klatsky AL, Tekawa I, Armstrong MA. Cardiovascular risk factors among Klatsky AL, Tekawa I, Armstrong MA. Cardiovascular risk factors among Asian Americans. Public Health Rep 1996;111(Suppl 2):62-4. Asian Americans. Public Health Rep 1996;111(Suppl 2):62-4.
4.4. Ryan C, Shaw R, et al. Coronary heart disease in Filipino and Filipino Ryan C, Shaw R, et al. Coronary heart disease in Filipino and Filipino American patients: prevalence of risk factors and outcomes of treatment. J American patients: prevalence of risk factors and outcomes of treatment. J Invasive Cardiol. 2000;12(3):134-139. Invasive Cardiol. 2000;12(3):134-139.
5.5. Stavig G, Igra A, Leonard A. Hypertension and related health issues among Stavig G, Igra A, Leonard A. Hypertension and related health issues among Asians and Pacific Islanders in California. Public Health Reports. 1988;103, Asians and Pacific Islanders in California. Public Health Reports. 1988;103, 28-37.28-37.
6.6. Langenberg C, Rosario M, et al. Diabetes and Coronary Heart Disease in Langenberg C, Rosario M, et al. Diabetes and Coronary Heart Disease in Filipino-American Women: Role of growth and life course socioeconomic Filipino-American Women: Role of growth and life course socioeconomic factors. Diabetes Care 2007;30;535-541.factors. Diabetes Care 2007;30;535-541.
7.7. Araneta MR, Wingard DL, Barrett-Connor E. Type 2 diabetes and metabolic Araneta MR, Wingard DL, Barrett-Connor E. Type 2 diabetes and metabolic syndrome in Filipina-American women: A high risk non-obese population. syndrome in Filipina-American women: A high risk non-obese population. Diabetes Care 2002;25(3):494-499. Diabetes Care 2002;25(3):494-499.
3434
QUESTIONS?QUESTIONS?
Luceli C. Cuasay, DrPH, MPHLuceli C. Cuasay, DrPH, MPH
5615 Kirby Drive, Suite 710Houston, TX 77005
3535
Survey QuestionnaireSurvey Questionnaire
• EnglishEnglish, adapted from National Health and Nutrition Examination Survey (NHANES), Hispanic Health and Nutrition Examination Survey (HHANES) & National Health Interview Survey (NHIS) questionnaires
• TagalogTagalog, produced by back-and-forth translation
3636
AgeAgeSexSexFamily history of diabetesFamily history of diabetes: Having a parent or a sibling who had been diagnosed with diabetes.History of gestational diabetesHistory of gestational diabetes: A “yes” response to the question, “Have you ever been told by a physician that you had diabetes when you were pregnant?”Overall obesity: Self-reported body mass index (BMI) > 30 kg/m2.Physical activityPhysical activity: Person engaged in any exercise, sports, or physically active hobbies for at least 20 minutes: physically active, 4 times a week; moderately active, 1-3 times a week; and sedentary, < 1 time a week or no activity.
RISK FACTORS – DEFINITIONSRISK FACTORS – DEFINITIONS
3737
RISK FACTORS – DEFINITIONSRISK FACTORS – DEFINITIONS
Educational attainment and household income:Educational attainment and household income: Surrogate items for socioeconomic status
RespondentRespondent’’s birthplace (Philippines):s birthplace (Philippines): Manila, the country’s capital One of 3 major regions:
• Luzon (north) • Visayas (central) • Mindanao (south)
3838
RISK FACTORS – DEFINITIONSRISK FACTORS – DEFINITIONS
Acculturation levelAcculturation level: A six-item acculturation score equal to the arithmetic mean of the codes of six data items.
• 1st four items represented language ability and preference in speaking, reading, and writing• 5th itemgeneration• 6th itemfood preference
1=strongest Filipino orientation 5=strongest American orientation
3=equally Filipino and American orientation
Based on scores, respondents were classified into 3 acculturation levels: high, middle, and low
3939