Embed Size (px)
Citation preview
ARTICLE IN PRESS
Journal of Biomechanics 43 (2010) 1573–1579
Contents lists available at ScienceDirect
journal homepage: www.elsevier.com/locate/jbiomech
Journal of Biomechanics
0021-92
doi:10.1
n Corr
E-m
www.JBiomech.com
Filtering the surface EMG signal: Movement artifact andbaseline noise contamination
Carlo J. De Luca a,b, L. Donald Gilmore b, Mikhail Kuznetsov b, Serge H. Roy b,n
a Delsys Inc., Boston MA, USAb NeuroMuscular Research Center, Boston University, 19 Deerfield St, Boston MA, USA
a r t i c l e i n f o
Article history:
Accepted 5 January 2010The surface electromyographic (sEMG) signal that originates in the muscle is inevitably contaminated by
various noise signals or artifacts that originate at the skin-electrode interface, in the electronics that
Keywords:
EMG signal
Movement artifact
Baseline noise
Filtering
90/$ - see front matter & 2010 Elsevier Ltd. A
016/j.jbiomech.2010.01.027
esponding author. Tel.: +1 617 358 0718; fax
ail address: [email protected] (S.H. Roy).
a b s t r a c t
amplifies the signals, and in external sources. Modern technology is substantially immune to some of
these noises, but not to the baseline noise and the movement artifact noise. These noise sources have
frequency spectra that contaminate the low-frequency part of the sEMG frequency spectrum. There are
many factors which must be taken into consideration when determining the appropriate filter specifica-
tions to remove these artifacts; they include the muscle tested and type of contraction, the sensor
configuration, and specific noise source. The band-pass determination is always a compromise between
(a) reducing noise and artifact contamination, and (b) preserving the desired information from the sEMG
signal. This study was designed to investigate the effects of mechanical perturbations and noise that are
typically encountered during sEMG recordings in clinical and related applications. The analysis estab-
lished the relationship between the attenuation rates of the movement artifact and the sEMG signal as a
function of the filter band pass. When this relationship is combined with other considerations related to
the informational content of the signal, the signal distortion of filters, and the kinds of artifacts evaluated
in this study, a Butterworth filter with a corner frequency of 20 Hz and a slope of 12 dB/oct is recom-
mended for general use. The results of this study are relevant to biomechanical and clinical applications
where the measurements of body dynamics and kinematics may include artifact sources.
& 2010 Elsevier Ltd. All rights reserved.
1. Introduction
The surface electromyographic (sEMG) signal contains thesignal that originates in the muscle and various noise componentswhich are endemic and unavoidable. These noise componentscontaminate the sEMG signal and may lead to an erroneousinterpretation of the signal. This is especially the case when thesignal is obtained during dynamic contractions and when it ismeant to provide information concerning the physiology andanatomy of muscles.
Beyond using effective methods of locating and securing thesEMG sensor to the skin (De Luca, 1997; Roy et al., 2007), one ofthe simplest and most direct means of increasing the fidelity ofthe sEMG signal is to filter the maximum amount of noise whileretaining as much of the desired EMG signal frequency spectrumas possible. The frequency spectrum of the sEMG signal collectedwith commonly used sensors ranges from 0 to 400 Hz, dependingon the electrode spacing, the amount of fatty tissue between theskin and the muscle tissue, the shapes of the action potentials, and
ll rights reserved.
: +1 617 353 5737.
muscle type (Basmajian and De Luca, 1985). The bandwidth isgenerally greater if the sensor is placed over the insertion of themuscle fibers into the tendons or on top of the innervation zone ofthe muscle. However, such a placement is not advisable becausethe amplitude of the signal is sensitive to this precise location(Beck et al., 2008). At the high-frequency end of the sEMG signalspectrum, the low-pass filter corner frequency (the boundary ofthe filter’s frequency response where signal energy is attenuatedby 3 dB), should be set where the amplitude of the noisecomponents surpasses that of the sEMG signal. Consequently, itis preferable for the high end of the sEMG frequency spectrum tohave a low-pass corner frequency in the range of 400–450 Hz.
At the low-frequency end of the spectrum, the choice of thelocation of the high-pass filter corner frequency is more involvedbecause several noise sources contribute signals whose low-frequency spectra overlap with that of the sEMG signal. Conse-quently, the determination of the filter characteristics in thisregion has been a focus of attention. Over the past three decades,various recommendations and standards have been put forth;they are: (a) the recommendations of the International Societyof Electrophysiology and Kinesiology (Winter et al., 1980)which recommended a high-pass corner frequency of 20 Hz;(b) Standards for Reporting EMG Data (Merletti, 1999) which
ARTICLE IN PRESS
sEMG
Accelerometer(normal acceleration)
sEMG
Force gauge
1 cm
1 cm1 mm
Accelerometer(shear acceleration)
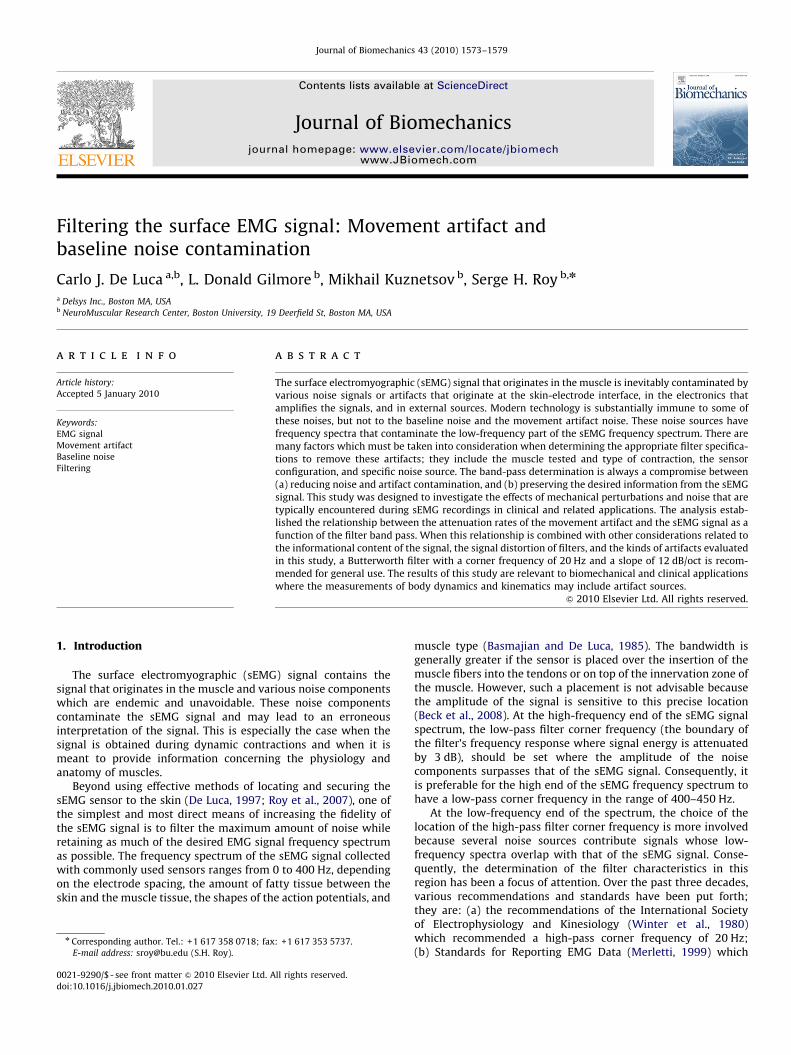
Fig. 1. Image of the experimental data collection. The sensor locations are shown
for the Tibialis Anterior (TA) muscle (left) and First Dorsal Interosseous (FDI)
muscle (right). The sEMG sensors contain two electrodes consisting of parallel bars
spaced 1 cm apart. A uni-axial accelerometer was placed below the EMG sensor on
the TA muscle to measure shear acceleration and another above the FDI muscle to
measure normal acceleration.
C.J. De Luca et al. / Journal of Biomechanics 43 (2010) 1573–15791574
recommended 5 Hz; (c) the requirements of the Journal ofElectromyography and Kinesiology which requires a cornerfrequency of 10 Hz for a report to be published; and (d) theSurface EMG for Noninvasive Assessment of Muscles (SENIAM)recommendations (Stegeman and Hermens, 1998) which recom-mends 10–20 Hz.
The SENIAM recommendation is based on a survey of thepractices of various laboratories identified via the sEMG literature,rather than data from empirical studies. Hence, that report onlyreflects the convention of a self-selected group of EMG practi-tioners. The only available empirical data has been provided byvan Boxtel et al. (1998) and van Boxtel (2001) who recommend ahigh-pass corner frequency range of 15–28 Hz when detectingsignals from facial muscles, including blinking eye lids. There areno empirically based specifications for filtering sEMG data fromlimb muscles.
There are several intrinsic and extrinsic sources of low-frequency noise that may contaminate the sEMG signal. The twoextrinsic noise sources, the power line noise and the cable motion
artifact, can be almost totally eliminated with modern electronicstechnology and appropriate circuit design. The two intrinsic noisesources originate in the electronics of the amplification system(thermal noise) and at the skin-electrode interface (electro-
chemical noise), respectively (Huigen et al., 2002). Together, thesenoise sources form the baseline noise which is detected whenevera sensor is attached to the skin. An additional noise source, themovement artifact noise, also originates at the electrode-skininterface. It is generated when: (a) the muscle moves underneaththe skin, and (b) when a force impulse travels through the muscleand skin underlying the sensor causing a movement at theelectrode-skin interface. The resulting time-varying voltageproduced across the two electrodes can be the most troublesomeof noise sources and requires the most attention.
In this report we provide empirical evidence to ascertain areasonable value for the corner frequency for removing the low-frequency noise components; especially those generated by themovement artifact. Removal of these components renders thesEMG signal more useful for practical applications. Our approachselected different high-pass corner frequencies typically used tofilter the sEMG signal, and compared their performance undercontrolled noise conditions.
2. Methods
The methods were designed to elicit a large number (4300) of controlled
isometric contractions with and without movement artifact. Seven healthy male
subjects and five healthy female subjects (mean age 30.3; range 19–63 years)
volunteered for the study after providing institutionally approved written
informed consent. Two muscles, the tibialis anterior (TA) and the first dorsal
interosseous (FDI), were chosen for this study because of their differences in size
and skin thickness, which influence the sEMG signal spectra of the two muscles
(Basmajian and De Luca, 1985) and thereby provide diverse signal sources for the
investigation.
The sEMG signals were detected with DE-2.1 sensors (Delsys Inc.) and were
amplified by a BagnoliTM 8-channel system (Delsys Inc.) with a modified band pass
of 0.15 Hz (6 dB/oct) to 450 Hz (24 dB/oct). The skin was cleaned by mildly
scrubbing it with 70% isopropyl alcohol. The sensors were attached to the skin
with a double-sided adhesive interface tailored to match the contours of the
sensor. The sEMG sensor was located on the belly of the muscle at a position
distant from the innervation zones and the muscle tendon interface, following the
recommendations of De Luca, 1997 and Saitou et al., 2000. A Dermatrodes HE-R
(American Imex) electrode (5.08 cm dia.) was located on the back of the left hand
to provide a reference.
In order to monitor the movement artifact, accelerometers were attached in
the proximity of the sEMG sensors (dynamic range 75 g; maximum resolution
2 mg; bandwidth 4250 Hz); refer to Fig. 1. For the FDI, the accelerometer
(Motorola MMA1220D) was placed on top of the sEMG sensor to register normal
acceleration, as would likely be produced when movement artifacts caused by
direct contact with the sensor occur. For the TA, the accelerometer (Analog Devices
ADXL105JQCL) was placed distal to the sEMG sensor to register shear force, as
would occur for example by impacts to the limb while walking. The raw data from
the sEMG and accelerometer sensors were sampled at a rate of 5 KHz and stored in
digital format using EMGworkss Acquisition software.
Data were acquired while the subjects were seated with their hand and lower
limb secured into an apparatus that constrained the muscles to isometric
contractions (Adam and De Luca, 2005). The protocol for producing artifacts was
designed to replicate two conditions; one in which perturbations are externally
applied directly to the sensor and the second in which perturbations to the sensor
are produced as a result of body movement. While there are numerous methods
to apply mechanical disturbances to the sensor, we selected more forceful
perturbations which include those that might be encountered in work and sports
environments. For the case of externally applied perturbations, movement artifact
producing force was applied by tapping the sensor placed on the FDI muscle.
We purposefully tapped directly on the sensor to maximize the effect of the
mechanical disturbance. The acceleration profile was monitored and used to guide
the experimenter in applying similar taps to the sensor. For the second condition,
we produced a perturbation to the body that would be similar to that which occurs
during the heel strike phase of gait. The sensor located on the TA muscle of the leg
was indirectly perturbed by striking the supra-patella region of the flexed knee
with the open palm of the hand, simulating heel strike during gait. With practice,
we were able to apply a force on the knee in a manner that produced accelerations
to the sensor that were similar to those obtained in a pilot study where heel strike
was accentuated by having the subjects walk without shoes. This simulation
provided a controlled means of obtaining the data at various isometric contraction
levels.
The experimental protocol began with the acquisition of the maximum
voluntary contraction (MVC) level by asking the subject to contract as strongly as
possible and to hold the contraction for 3 s. This procedure was repeated two more
times with rest intervals of 3 min. The highest peak value of the three contractions
was chosen as the MVC level. After a rest period of 3 min, the subjects were asked
to perform three constant-force isometric contractions at 0%, 10%, and 50% MVC
level, with a rest period of 3 min between each contraction. Each contraction was
sustained for 20 s. The 0% MVC was executed with the muscle completely relaxed
as evidenced by no discernable sEMG signal. This datum sample was used to
obtain the baseline noise of the system. Three additional 0% MVC level contrac-
tions were performed, each with a sequence of 20 artifact-inducing taps applied at
2 s intervals.
3. Results
The data were filtered at the three representative high-passcorner frequencies (10, 20, 30 Hz) and normalized to the samedata high-pass filtered at 1 Hz. The three corner frequencies wereprocessed using two different filter slopes at 12 and 24 dB/oct toinitially determine the affect of the filter slope on the signalspectrum. The influence on the spectral shapes was minor (lessthan 1% difference in RMS), and consequently, we report theresults from only one filter slope. The 12 dB/oct Butterworth filterslope was selected because it exhibited less overshoot and has afaster settling time in response to signal transients.
ARTICLE IN PRESS
C.J. De Luca et al. / Journal of Biomechanics 43 (2010) 1573–1579 1575
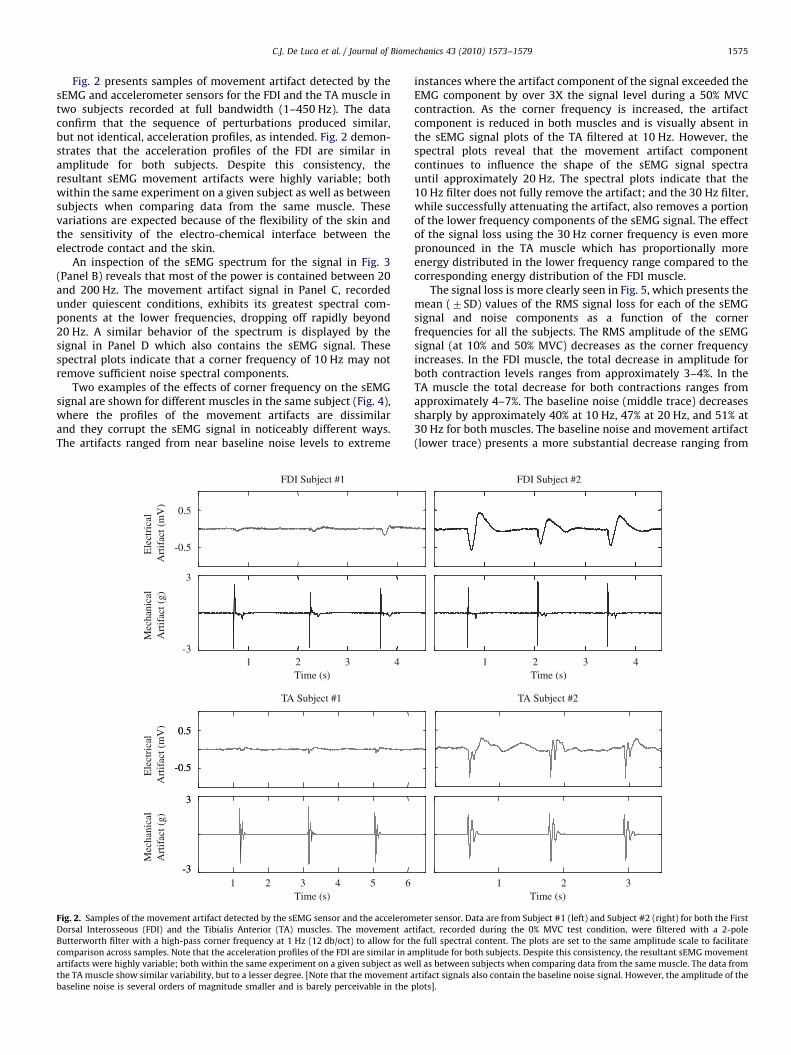
Fig. 2 presents samples of movement artifact detected by thesEMG and accelerometer sensors for the FDI and the TA muscle intwo subjects recorded at full bandwidth (1–450 Hz). The dataconfirm that the sequence of perturbations produced similar,but not identical, acceleration profiles, as intended. Fig. 2 demon-strates that the acceleration profiles of the FDI are similar inamplitude for both subjects. Despite this consistency, theresultant sEMG movement artifacts were highly variable; bothwithin the same experiment on a given subject as well as betweensubjects when comparing data from the same muscle. Thesevariations are expected because of the flexibility of the skin andthe sensitivity of the electro-chemical interface between theelectrode contact and the skin.
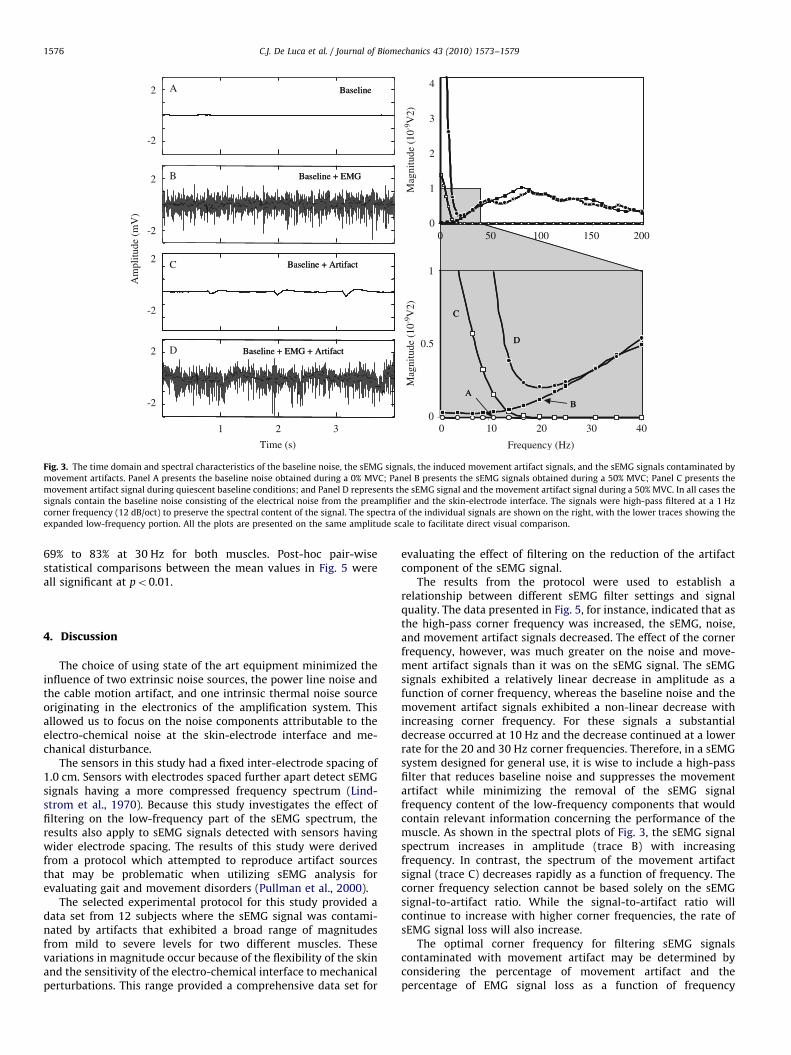
An inspection of the sEMG spectrum for the signal in Fig. 3(Panel B) reveals that most of the power is contained between 20and 200 Hz. The movement artifact signal in Panel C, recordedunder quiescent conditions, exhibits its greatest spectral com-ponents at the lower frequencies, dropping off rapidly beyond20 Hz. A similar behavior of the spectrum is displayed by thesignal in Panel D which also contains the sEMG signal. Thesespectral plots indicate that a corner frequency of 10 Hz may notremove sufficient noise spectral components.
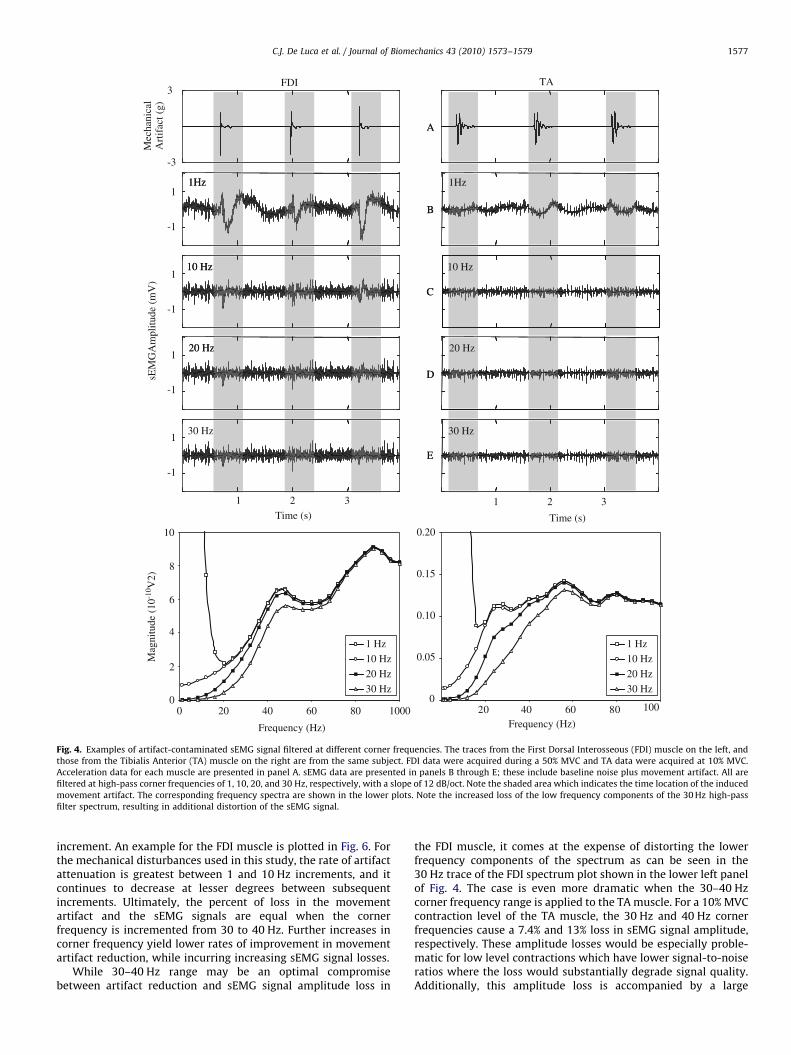
Two examples of the effects of corner frequency on the sEMGsignal are shown for different muscles in the same subject (Fig. 4),where the profiles of the movement artifacts are dissimilarand they corrupt the sEMG signal in noticeably different ways.The artifacts ranged from near baseline noise levels to extreme
Ele
ctri
cal
Mec
hani
cal
0.5
-0.5
3
-3
0.5
-0.5
-3
3
Art
ifac
t (m
V)
Art
ifac
t (g)
Ele
ctri
cal
Mec
hani
cal
Art
ifac
t (m
V)
Art
ifac
t (g)
Time (s)1
0.5
-0.5
-3
3
TA Subject #1
FDI Subject #1
2 3 4
Time (s)1 2 3 4 65
Fig. 2. Samples of the movement artifact detected by the sEMG sensor and the accelerom
Dorsal Interosseous (FDI) and the Tibialis Anterior (TA) muscles. The movement ar
Butterworth filter with a high-pass corner frequency at 1 Hz (12 db/oct) to allow for th
comparison across samples. Note that the acceleration profiles of the FDI are similar in a
artifacts were highly variable; both within the same experiment on a given subject as w
the TA muscle show similar variability, but to a lesser degree. [Note that the movement a
baseline noise is several orders of magnitude smaller and is barely perceivable in the
instances where the artifact component of the signal exceeded theEMG component by over 3X the signal level during a 50% MVCcontraction. As the corner frequency is increased, the artifactcomponent is reduced in both muscles and is visually absent inthe sEMG signal plots of the TA filtered at 10 Hz. However, thespectral plots reveal that the movement artifact componentcontinues to influence the shape of the sEMG signal spectrauntil approximately 20 Hz. The spectral plots indicate that the10 Hz filter does not fully remove the artifact; and the 30 Hz filter,while successfully attenuating the artifact, also removes a portionof the lower frequency components of the sEMG signal. The effectof the signal loss using the 30 Hz corner frequency is even morepronounced in the TA muscle which has proportionally moreenergy distributed in the lower frequency range compared to thecorresponding energy distribution of the FDI muscle.
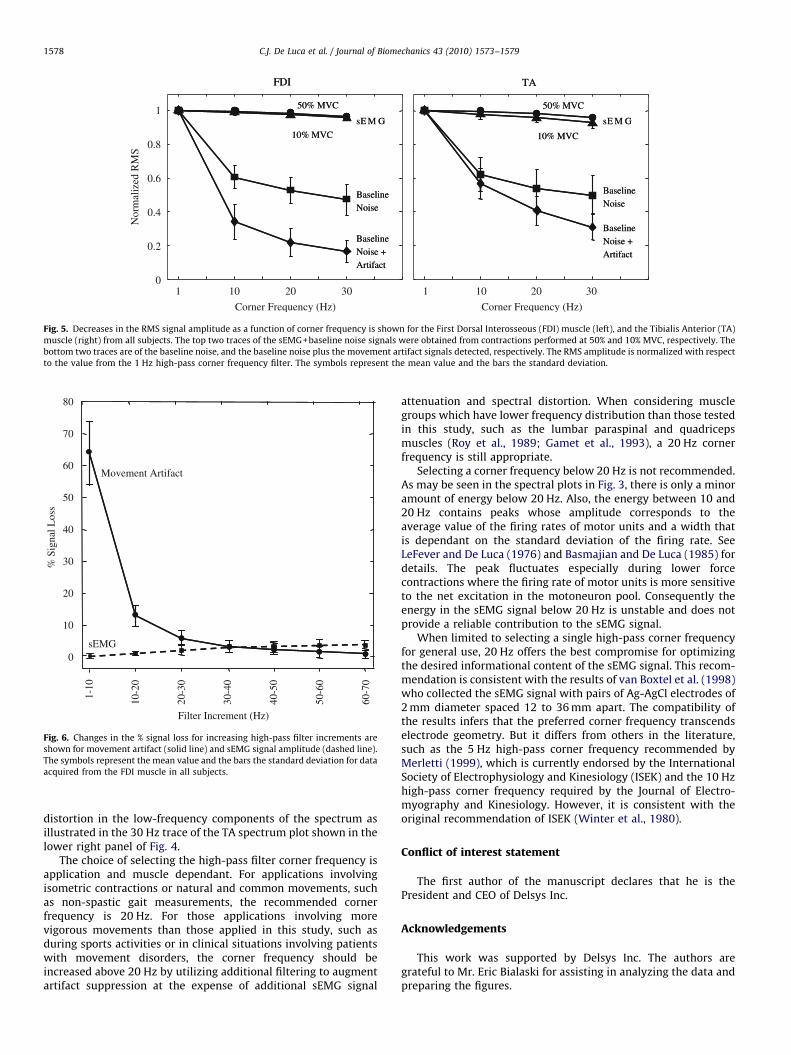
The signal loss is more clearly seen in Fig. 5, which presents themean (7SD) values of the RMS signal loss for each of the sEMGsignal and noise components as a function of the cornerfrequencies for all the subjects. The RMS amplitude of the sEMGsignal (at 10% and 50% MVC) decreases as the corner frequencyincreases. In the FDI muscle, the total decrease in amplitude forboth contraction levels ranges from approximately 3–4%. In theTA muscle the total decrease for both contractions ranges fromapproximately 4–7%. The baseline noise (middle trace) decreasessharply by approximately 40% at 10 Hz, 47% at 20 Hz, and 51% at30 Hz for both muscles. The baseline noise and movement artifact(lower trace) presents a more substantial decrease ranging from
TA Subject #2
FDI Subject #2
Time (s)1 2 3
Time (s)1 2 3 4
eter sensor. Data are from Subject #1 (left) and Subject #2 (right) for both the First
tifact, recorded during the 0% MVC test condition, were filtered with a 2-pole
e full spectral content. The plots are set to the same amplitude scale to facilitate
mplitude for both subjects. Despite this consistency, the resultant sEMG movement
ell as between subjects when comparing data from the same muscle. The data from
rtifact signals also contain the baseline noise signal. However, the amplitude of the
plots].
ARTICLE IN PRESS
2
-2
Time (s)
1
Am
plitu
de (
mV
)
Mag
nitu
de (
10-9
V2)
2
4
3
1
0
0.5
Mag
nitu
de (
10-9
V2)
Frequency (Hz)
32
2
-2
2
-2
2
-20
50 100 150 2000
0 10
AB
C
D
Baseline
Baseline + EMGB
Baseline + Artifact
Baseline + EMG + Artifact
1
AB
C
D
BaselineA
Baseline + EMG
Baseline + ArtifactC
Baseline + EMG + ArtifactD
20 30 40
Fig. 3. The time domain and spectral characteristics of the baseline noise, the sEMG signals, the induced movement artifact signals, and the sEMG signals contaminated by
movement artifacts. Panel A presents the baseline noise obtained during a 0% MVC; Panel B presents the sEMG signals obtained during a 50% MVC; Panel C presents the
movement artifact signal during quiescent baseline conditions; and Panel D represents the sEMG signal and the movement artifact signal during a 50% MVC. In all cases the
signals contain the baseline noise consisting of the electrical noise from the preamplifier and the skin-electrode interface. The signals were high-pass filtered at a 1 Hz
corner frequency (12 dB/oct) to preserve the spectral content of the signal. The spectra of the individual signals are shown on the right, with the lower traces showing the
expanded low-frequency portion. All the plots are presented on the same amplitude scale to facilitate direct visual comparison.
C.J. De Luca et al. / Journal of Biomechanics 43 (2010) 1573–15791576
69% to 83% at 30 Hz for both muscles. Post-hoc pair-wisestatistical comparisons between the mean values in Fig. 5 wereall significant at po0.01.
4. Discussion
The choice of using state of the art equipment minimized theinfluence of two extrinsic noise sources, the power line noise andthe cable motion artifact, and one intrinsic thermal noise sourceoriginating in the electronics of the amplification system. Thisallowed us to focus on the noise components attributable to theelectro-chemical noise at the skin-electrode interface and me-chanical disturbance.
The sensors in this study had a fixed inter-electrode spacing of1.0 cm. Sensors with electrodes spaced further apart detect sEMGsignals having a more compressed frequency spectrum (Lind-strom et al., 1970). Because this study investigates the effect offiltering on the low-frequency part of the sEMG spectrum, theresults also apply to sEMG signals detected with sensors havingwider electrode spacing. The results of this study were derivedfrom a protocol which attempted to reproduce artifact sourcesthat may be problematic when utilizing sEMG analysis forevaluating gait and movement disorders (Pullman et al., 2000).
The selected experimental protocol for this study provided adata set from 12 subjects where the sEMG signal was contami-nated by artifacts that exhibited a broad range of magnitudesfrom mild to severe levels for two different muscles. Thesevariations in magnitude occur because of the flexibility of the skinand the sensitivity of the electro-chemical interface to mechanicalperturbations. This range provided a comprehensive data set for
evaluating the effect of filtering on the reduction of the artifactcomponent of the sEMG signal.
The results from the protocol were used to establish arelationship between different sEMG filter settings and signalquality. The data presented in Fig. 5, for instance, indicated that asthe high-pass corner frequency was increased, the sEMG, noise,and movement artifact signals decreased. The effect of the cornerfrequency, however, was much greater on the noise and move-ment artifact signals than it was on the sEMG signal. The sEMGsignals exhibited a relatively linear decrease in amplitude as afunction of corner frequency, whereas the baseline noise and themovement artifact signals exhibited a non-linear decrease withincreasing corner frequency. For these signals a substantialdecrease occurred at 10 Hz and the decrease continued at a lowerrate for the 20 and 30 Hz corner frequencies. Therefore, in a sEMGsystem designed for general use, it is wise to include a high-passfilter that reduces baseline noise and suppresses the movementartifact while minimizing the removal of the sEMG signalfrequency content of the low-frequency components that wouldcontain relevant information concerning the performance of themuscle. As shown in the spectral plots of Fig. 3, the sEMG signalspectrum increases in amplitude (trace B) with increasingfrequency. In contrast, the spectrum of the movement artifactsignal (trace C) decreases rapidly as a function of frequency. Thecorner frequency selection cannot be based solely on the sEMGsignal-to-artifact ratio. While the signal-to-artifact ratio willcontinue to increase with higher corner frequencies, the rate ofsEMG signal loss will also increase.
The optimal corner frequency for filtering sEMG signalscontaminated with movement artifact may be determined byconsidering the percentage of movement artifact and thepercentage of EMG signal loss as a function of frequency
ARTICLE IN PRESS
Mag
nitu
de (
10-1
0 V2)
1 Hz
10 Hz
20 Hz
30 Hz
1 Hz
10 Hz
20 Hz
30 Hz
0
Frequency (Hz)
60 8020 400
10
2
4
6
8
0
0.20
0.05
0.10
0.15
1000Frequency (Hz)
60 0802 40 100
FDI TA3
-3
Time (s)
1
sEM
GA
mpl
itude
(m
V)
32
1
-1
A
B
C
D
E
1Hz
10 Hz
20 Hz
30 Hz
1Hz
10 Hz
20 Hz
30 Hz1
-1
1
-1
1
-1
Mec
hani
cal
Art
ifac
t (g)
A
B
C
D
E
1Hz
10 Hz
20 Hz
1Hz
10 Hz
20 Hz
30 Hz
1
1Hz
10 Hz
20 Hz
30 Hz
2
Time (s)
3
Fig. 4. Examples of artifact-contaminated sEMG signal filtered at different corner frequencies. The traces from the First Dorsal Interosseous (FDI) muscle on the left, and
those from the Tibialis Anterior (TA) muscle on the right are from the same subject. FDI data were acquired during a 50% MVC and TA data were acquired at 10% MVC.
Acceleration data for each muscle are presented in panel A. sEMG data are presented in panels B through E; these include baseline noise plus movement artifact. All are
filtered at high-pass corner frequencies of 1, 10, 20, and 30 Hz, respectively, with a slope of 12 dB/oct. Note the shaded area which indicates the time location of the induced
movement artifact. The corresponding frequency spectra are shown in the lower plots. Note the increased loss of the low frequency components of the 30 Hz high-pass
filter spectrum, resulting in additional distortion of the sEMG signal.
C.J. De Luca et al. / Journal of Biomechanics 43 (2010) 1573–1579 1577
increment. An example for the FDI muscle is plotted in Fig. 6. Forthe mechanical disturbances used in this study, the rate of artifactattenuation is greatest between 1 and 10 Hz increments, and itcontinues to decrease at lesser degrees between subsequentincrements. Ultimately, the percent of loss in the movementartifact and the sEMG signals are equal when the cornerfrequency is incremented from 30 to 40 Hz. Further increases incorner frequency yield lower rates of improvement in movementartifact reduction, while incurring increasing sEMG signal losses.
While 30–40 Hz range may be an optimal compromisebetween artifact reduction and sEMG signal amplitude loss in
the FDI muscle, it comes at the expense of distorting the lowerfrequency components of the spectrum as can be seen in the30 Hz trace of the FDI spectrum plot shown in the lower left panelof Fig. 4. The case is even more dramatic when the 30–40 Hzcorner frequency range is applied to the TA muscle. For a 10% MVCcontraction level of the TA muscle, the 30 Hz and 40 Hz cornerfrequencies cause a 7.4% and 13% loss in sEMG signal amplitude,respectively. These amplitude losses would be especially proble-matic for low level contractions which have lower signal-to-noiseratios where the loss would substantially degrade signal quality.Additionally, this amplitude loss is accompanied by a large
ARTICLE IN PRESS
Corner Frequency (Hz)
Nor
mal
ized
RM
S
1
0.8
0.6
10
50% MVC 50% MVC
BaselineNoise + Artifact
BaselineNoise + Artifact
BaselineNoise
BaselineNoise
10% MVC 10% MVC
GMEsGMEs
FDI TA
1
0.2
0
0.4
50% MVC 50% MVC
BaselineNoise + Artifact
BaselineNoise + Artifact
BaselineNoise
BaselineNoise
10% MVC 10% MVC
GMEsGMEs
FDI TA
20 30
Corner Frequency (Hz)
101 20 30
Fig. 5. Decreases in the RMS signal amplitude as a function of corner frequency is shown for the First Dorsal Interosseous (FDI) muscle (left), and the Tibialis Anterior (TA)
muscle (right) from all subjects. The top two traces of the sEMG+baseline noise signals were obtained from contractions performed at 50% and 10% MVC, respectively. The
bottom two traces are of the baseline noise, and the baseline noise plus the movement artifact signals detected, respectively. The RMS amplitude is normalized with respect
to the value from the 1 Hz high-pass corner frequency filter. The symbols represent the mean value and the bars the standard deviation.
sEMG
% S
igna
l Los
s
1-10
10-2
0
20-3
0
30-4
0
40-5
0
50-6
0
60-7
0
10
20
30
40
50
60
70
Movement Artifact
Filter Increment (Hz)
0
80
Fig. 6. Changes in the % signal loss for increasing high-pass filter increments are
shown for movement artifact (solid line) and sEMG signal amplitude (dashed line).
The symbols represent the mean value and the bars the standard deviation for data
acquired from the FDI muscle in all subjects.
C.J. De Luca et al. / Journal of Biomechanics 43 (2010) 1573–15791578
distortion in the low-frequency components of the spectrum asillustrated in the 30 Hz trace of the TA spectrum plot shown in thelower right panel of Fig. 4.
The choice of selecting the high-pass filter corner frequency isapplication and muscle dependant. For applications involvingisometric contractions or natural and common movements, suchas non-spastic gait measurements, the recommended cornerfrequency is 20 Hz. For those applications involving morevigorous movements than those applied in this study, such asduring sports activities or in clinical situations involving patientswith movement disorders, the corner frequency should beincreased above 20 Hz by utilizing additional filtering to augmentartifact suppression at the expense of additional sEMG signal
attenuation and spectral distortion. When considering musclegroups which have lower frequency distribution than those testedin this study, such as the lumbar paraspinal and quadricepsmuscles (Roy et al., 1989; Gamet et al., 1993), a 20 Hz cornerfrequency is still appropriate.
Selecting a corner frequency below 20 Hz is not recommended.As may be seen in the spectral plots in Fig. 3, there is only a minoramount of energy below 20 Hz. Also, the energy between 10 and20 Hz contains peaks whose amplitude corresponds to theaverage value of the firing rates of motor units and a width thatis dependant on the standard deviation of the firing rate. SeeLeFever and De Luca (1976) and Basmajian and De Luca (1985) fordetails. The peak fluctuates especially during lower forcecontractions where the firing rate of motor units is more sensitiveto the net excitation in the motoneuron pool. Consequently theenergy in the sEMG signal below 20 Hz is unstable and does notprovide a reliable contribution to the sEMG signal.
When limited to selecting a single high-pass corner frequencyfor general use, 20 Hz offers the best compromise for optimizingthe desired informational content of the sEMG signal. This recom-mendation is consistent with the results of van Boxtel et al. (1998)who collected the sEMG signal with pairs of Ag-AgCl electrodes of2 mm diameter spaced 12 to 36 mm apart. The compatibility ofthe results infers that the preferred corner frequency transcendselectrode geometry. But it differs from others in the literature,such as the 5 Hz high-pass corner frequency recommended byMerletti (1999), which is currently endorsed by the InternationalSociety of Electrophysiology and Kinesiology (ISEK) and the 10 Hzhigh-pass corner frequency required by the Journal of Electro-myography and Kinesiology. However, it is consistent with theoriginal recommendation of ISEK (Winter et al., 1980).
Conflict of interest statement
The first author of the manuscript declares that he is thePresident and CEO of Delsys Inc.
Acknowledgements
This work was supported by Delsys Inc. The authors aregrateful to Mr. Eric Bialaski for assisting in analyzing the data andpreparing the figures.
ARTICLE IN PRESS
C.J. De Luca et al. / Journal of Biomechanics 43 (2010) 1573–1579 1579
Appendix A. Supplementary Material
Supplementary data associated with this article can be foundin the online version at doi:10.1016/j.jbiomech.2010.01.027.
References
Adam, A., De Luca, C.J., 2005. Firing rates of motor units in human vastus lateralismuscle during fatiguing isometric contractions. Journal of Applied Physiology99, 268–280.
Basmajian, J.V., De Luca, C.J., 1985. Muscles Alive 5th edition Williams and Wilkins,Baltimore.
Beck, T.W., Housh, T.J., Cramer, J.T., Malek, M.H., Mielke, M., Hendrix, R., Weir, J.P.,2008. Electrode shift and normalization reduce the innervation zone’sinfluence on EMG. Medicine and Science in Sports and Exercise 40, 1314–1322.
De Luca, C.J., 1997. The use of surface electromyography in biomechanics. Journalof Applied Biomechanics 13, 135–163.
Gamet, D., Duchene, J., Garapon-Bar, C., Goubel, F., 1993. Surface electromyogrampower spectrum in human quadriceps muscle during incremental exercise.Journal of Applied Physiology 74 (6), 2704–2710.
Huigen, E., Peper, A., Grimbergen, C.A., 2002. Investigation into the origin of thenoise of surface electrodes. Medical and Biological Engineering and Computing40, 332–338.
LeFever R.S. and De Luca C.J., 1976. The contribution of individual motor units tothe EMG power spectrum. In: Proceedings of 29th Annual Conference onEngineering in Medicine and Biology, Boston, p. 56.
Lindstrom, L.R., Magnusson, R., Petersen, I., 1970. Muscular fatigue and actionpotential conduction velocity changes studied with frequency analysis of EMGsignals. Electromyography 4, 3341–3353.
Merletti, R., 1999. Standards for reporting EMG data. Journal of Electromyographyand Kinesiology 9, 1.
Pullman, S.L., Goodin, D.S., Marquinez, A.I., Tabbal, S., Rubin, M., 2000. Clinicalutility of surface EMG: report of the therapeutics and technology assessmentsubcommittee of the American Academy of Neurology. Neurology 55 (2),171–177.
Roy, S.H., DeLuca, C.J., Casavant, D.A., 1989. Lumbar muscle fatigue and chroniclower back pain. Spine 14, 992–1001.
Roy, S.H., De Luca, G., Cheng, S., Johansson, A., Gilmore, L.D., De Luca, C.J., 2007.Electro-mechanical stability of surface EMG sensors. Medical and BiologicalEngineering and Computing 45, 447–457.
Saitou, K., Masuda, T., Michipkami, D., Kojima, R., Okada, M., 2000. Innervationzones of the upper and lower limb muscles estimated by using multi-channelsurface EMG. Journal of Human Ergology 29, 35–52.
Stegeman D.F. and Hermens H.J., 1998. Standards for surface electromyography:the European project (SENIAM). In: Hermens H.J., Rau G., Disselhorst-Klug C.,Freriks B. (Eds.), Surface Electromyography Application Areas and Parameters.Proceedings of the Third General SENIAM Workshop on surface electromyo-graphy, Aachen, Germany, pp. 108–112.
van Boxtel, A., Boelhouwer, A.J.W., Bos, A.R., 1998. Optimal EMG signal bandwidthand interelectrode distance for the recording of acoustic, electrocutaneous,and photic blink reflexes. Psychophysiology 35, 690–697.
van Boxtel, A., 2001. Optimal signal bandwidth for the recording of surface EMGactivity of facial, jaw, oral, and neck muscles. Psychophysiology 38, 23–34.
Winter D.A., Rau G., Kadefors R., Broman H., and De Luca C.J., 1980. Units, termsand standards in the reporting of EMG research. A Report of the ad hocCommittee of the International Society of Electrophysiological Kinesiology.


![Wavelet Based EMG Artifact Removal From ECG Signal...based CSTD technique. R.shantha selva kumari, from 0-7695-3050-8, 2007 IEEE computer society [8] A mathematical algorithm for ECG](https://img.pdfslide.net/doc/110x75/5eb99b76ffdbdd1fd473caf8/wavelet-based-emg-artifact-removal-from-ecg-signal-based-cstd-technique-rshantha.jpg)


![· [30]C. Teng, Y. Zhang, and G. Wang, The Removal of EMG Artifact from EEG Signals by the Multivariate Empirical Mode Decomposition, SignalProcessing, Communications and …](https://img.pdfslide.net/doc/110x75/5e157609485ee60370306e4f/30c-teng-y-zhang-and-g-wang-the-removal-of-emg-artifact-from-eeg-signals.jpg)