Embed Size (px)
Citation preview
E-470 Traffic and Revenue Study
Summary Report
December 1, 2008
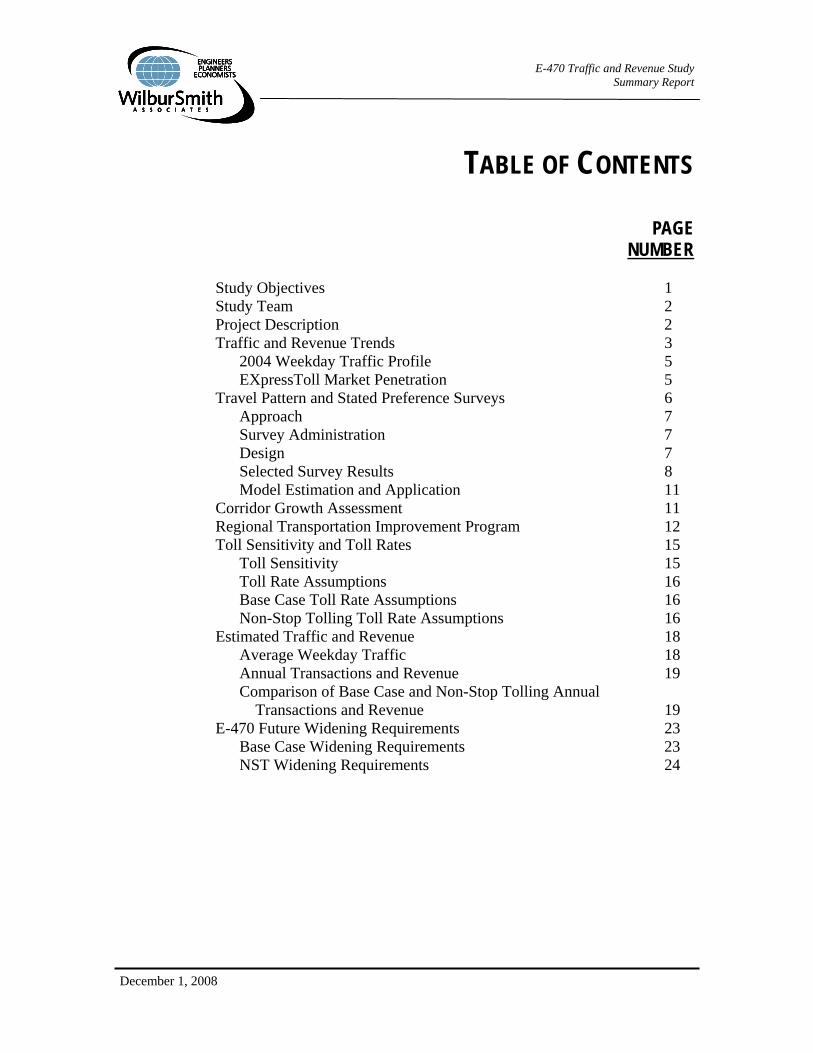
TABLE OF CONTENTS
PAGE NUMBER
Study Objectives 1 Study Team 2 Project Description 2 Traffic and Revenue Trends 3 2004 Weekday Traffic Profile 5 EXpressToll Market Penetration 5 Travel Pattern and Stated Preference Surveys 6 Approach 7 Survey Administration 7 Design 7 Selected Survey Results 8 Model Estimation and Application 11 Corridor Growth Assessment 11 Regional Transportation Improvement Program 12 Toll Sensitivity and Toll Rates 15 Toll Sensitivity 15 Toll Rate Assumptions 16 Base Case Toll Rate Assumptions 16 Non-Stop Tolling Toll Rate Assumptions 16 Estimated Traffic and Revenue 18 Average Weekday Traffic 18 Annual Transactions and Revenue 19 Comparison of Base Case and Non-Stop Tolling Annual Transactions and Revenue 19 E-470 Future Widening Requirements 23 Base Case Widening Requirements 23 NST Widening Requirements 24
E-470 Traffic and Revenue Study
Summary Report
December 1, 2008
ILLUSTRATIONS
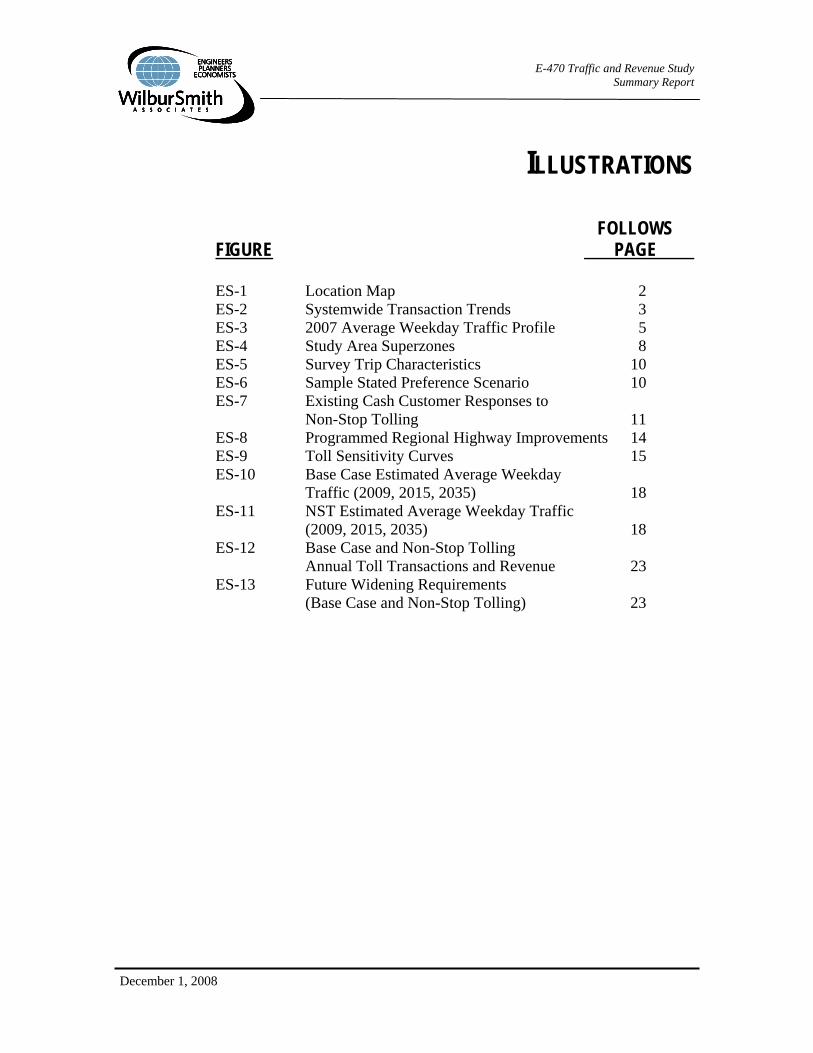
FOLLOWS FIGURE PAGE ES-1 Location Map 2 ES-2 Systemwide Transaction Trends 3 ES-3 2007 Average Weekday Traffic Profile 5 ES-4 Study Area Superzones 8 ES-5 Survey Trip Characteristics 10 ES-6 Sample Stated Preference Scenario 10 ES-7 Existing Cash Customer Responses to Non-Stop Tolling 11 ES-8 Programmed Regional Highway Improvements 14 ES-9 Toll Sensitivity Curves 15 ES-10 Base Case Estimated Average Weekday Traffic (2009, 2015, 2035) 18 ES-11 NST Estimated Average Weekday Traffic (2009, 2015, 2035) 18 ES-12 Base Case and Non-Stop Tolling Annual Toll Transactions and Revenue 23 ES-13 Future Widening Requirements (Base Case and Non-Stop Tolling) 23
E-470 Traffic and Revenue Study
Summary Report
December 1, 2008
TABULATIONS TABLE PAGE ES-1 Annual Transaction and Toll Revenue Trends 4 ES-2 EXpressToll Market Penetration Percentages 2006 - 2008 6 ES-3 Trips by Origin and Destination Superzones 9 ES-4 Comparison of DRCOG and Adjusted Corridor Forecasts 13 ES-5 Base Case Toll Rate Assumptions Passenger Car-Based Rates 2006 – 2021 16 ES-6 Non-Stop Tolling Toll Rate Assumptions Passenger Car-Based Rates 2009 – 2021 17 ES-7 Estimated Annual Toll Transactions and Revenue Base Case 20 ES-8 Estimated Annual Toll Transactions and Revenue Non-Stop Tolling – 3 Year Increases 21 ES-9 Comparison of Base Case and Non-Stop Tolling Estimated Annual Toll Transactions and Revenue 3 Year Toll Increases 22
E-470 Traffic and Revenue Study Summary Report
December 1, 2008 Page 1
SUMMARY REPORT E-470 TRAFFIC AND REVENUE STUDY
The E-470 toll road was constructed in four separate phases over a 14 year period beginning in 1989 and ending with the 12.2 mile Phase IV segment from 120th Avenue to I-25 north, completed and opened to traffic on January 3, 2003. From its opening until 2005, E-470 had experienced steady growth in both traffic and revenue. Since then, growth has been more irregular, due in part to the unprecedented rise in motor fuel prices and the slowdown in the regional (and national) housing market and economy. We should note, however, that within the 2005 to 2008 period, transaction growth in 2007 over 2006 was 4.5 percent, a rate of growth which is more consistent with a facility beginning to reach stable patterns of usage (i.e., leaving the ramp-up phase). E-470 does provide substantial traffic relief to the rapidly growing Denver area, and improved access to Denver International Airport (DIA). Perhaps more importantly, the E-470 corridor continues to be poised for substantial levels of economic growth in the future, and E-470 will provide the basic infrastructure framework to support this growth. This report provides a summary of the comprehensive traffic and revenue study for the E-470 Public Highway Authority (Authority) conducted by Wilbur Smith Associates (WSA). The goal of this challenging and important study was to assess the traffic and revenue impacts associated with the introduction of fully electronic, cashless, non-stop tolling (NST) and toll rate structure modifications on E-470 beginning on January 1, 2009. E-470 currently provides partial NST through its EXpressToll, electronic toll collection program. Fully electronic NST will allow E-470 customers to pay tolls electronically using either EXpressToll or License Plate Toll (LPT) options. In the LTP option, a customer’s license plate will be read by the video tolling system and the appropriate toll is added to a bill that will be mailed to the vehicle owner. The study provides updated traffic and revenue forecasts for both a Base Case, which assumed continuation of the existing cash-barrier form of toll collection, and NST Scenarios through year 2038. The study also evaluated the need for potential future widening requirements to maintain the high level-of-service for which E-470 has become known.
STUDY OBJECTIVES
The primary objectives of the study were to: Develop a real-life, up-to-date profile of motorists currently using E-470 through travel
pattern/trip characteristics surveys; Estimate the potential shift of existing Cash customers into EXpressToll or License Plate
Tolling due to the introduction of NST through stated-preference surveys; Estimate the potential traffic diversion in response to toll rate/structure changes;
E-470 Traffic and Revenue Study Summary Report
December 1, 2008 Page 2
Prepare 30-year estimates of traffic and revenue for Base Case and NST scenarios; Evaluate future mainline operating conditions for each tolling scenario; and Estimate the transaction and revenue impacts associated with NST.
In order to satisfy these objectives, a study work program was conceived which would: Identify the actual travel patterns and trip characteristics of E-470 customers through origin-
destination surveys; Assess the shift of existing Cash customers into EXpressToll and License Plate Toll (LPT)
alternatives through Stated Preference Surveys; Assess the reasonableness of corridor growth assumptions used in the Denver regional traffic
model to forecast long-term traffic growth; Assess toll rate sensitivity to provide a measure of revenue capacity under increased toll
rates; Prepare Base Case and NST forecasts of annual toll revenue through year 2038; and Identify future capital improvements to the E-470 mainline required to maintain desired
levels-of-service, which maintain E-470’s competitive travel advantages over toll-free alternatives.
STUDY TEAM
Wilbur Smith Associates was the prime consultant with overall responsibility for successful completion of the work. WSA was responsible for all traffic and revenue analyses, including all travel demand modeling, future toll revenue, toll plaza operation assessments and documentation of study results. WSA was assisted by three important subconsultants, including: Economic & Planning Systems (EPS) – EPS was responsible for performing the corridor
growth assessment and reasonableness assessment of underlying socioeconomic forecasts; Felsburg Holt & Ullevig (FHU) – FHU was responsible for performing system operational
analyses, specifically identifying future year mainline levels-of-service and widening needs; and
Resource Systems Group (RSG) – RSG was responsible for conducting and analyzing the results of both the Travel Pattern/Trip Characteristics and Stated Preference Surveys administered to existing E-470 customers.
PROJECT DESCRIPTION
E-470 extends approximately 46.6 miles between the southern junction with I-25 and C-470 and its northern junction with I-25 at the Northwest Parkway. As shown in Figure ES-1, E-470 was opened in phases, between 1991 and 2003. The initial segment, which extended approximately
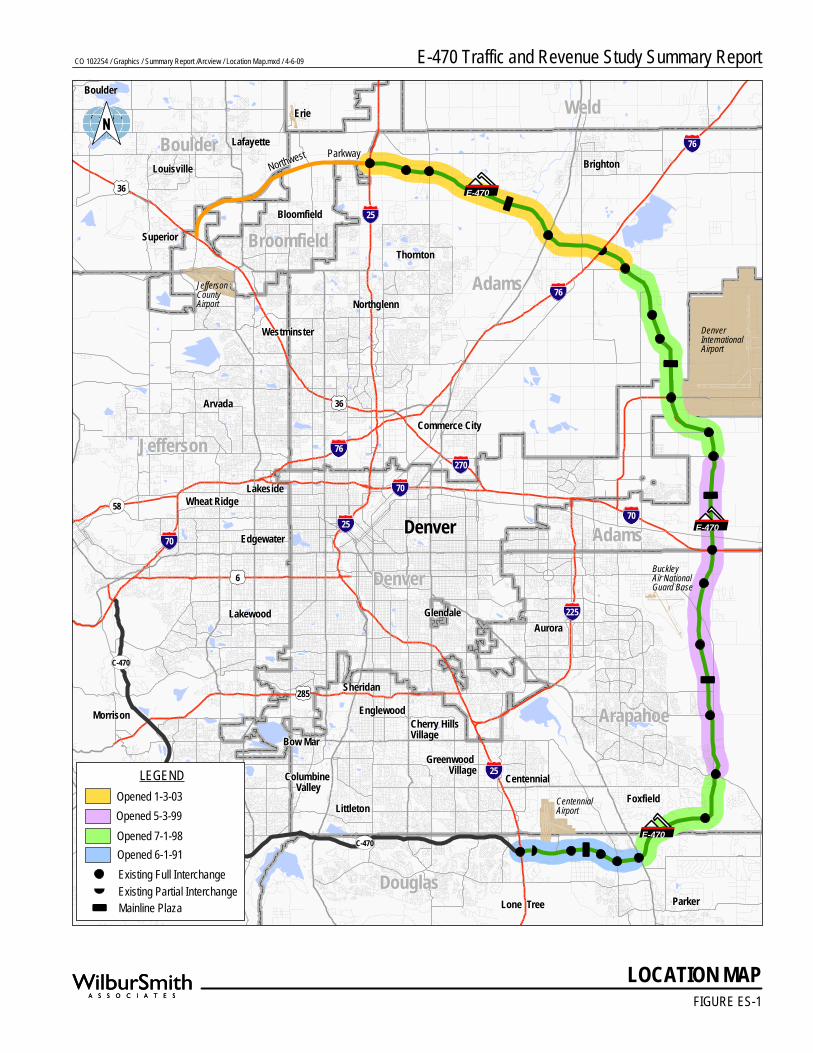
FIGURE ES-1
LOCATION MAP
E-470 Traffic and Revenue Study Summary ReportCO 102254 / Graphics / Summary Report /Arcview / Location Map.mxd / 4-6-09
25E-470
76
76
36
36
25
225
70
70
70
6
58
285
270
25
C-470
76
E-470
E-470
Foxfield
Lone Tree
Bow Mar
GlendaleAurora
Denver
Northwest Parkway
Edgewater
Lakewood
Wheat RidgeLakeside
Commerce City
Westminster
Northglenn
Thornton
Bloomfield
Erie
Lafayette
Louisville
Superior
C-470
DenverInternationalAirport
JeffersonCountyAirport
CentennialAirport
CentennialGreenwood
Village
Cherry Hills Village
Columbine Valley
Boulder
Brighton
EnglewoodSheridan
Morrison
Littleton
Buckley Air National Guard Base
Arvada
Boulder
Parker
Adams
Jefferson
Denver
Arapahoe
Douglas
BoulderWeld
Adams
Broomfield
LEGEND
Existing Full InterchangeExisting Partial InterchangeMainline Plaza
Opened 7-1-98Opened 6-1-91
Opened 5-3-99Opened 1-3-03
E-470 Traffic and Revenue Study Summary Report
December 1, 2008 Page 3
five miles between I-25 and Parker Road, was operated for approximately seven years prior to completion of subsequent phases. Phases 2 and 3 were opened in stages generally between 1998 and 1999 and cover the entire section between Parker Road and 120th Avenue. This segment included the critical connection to Pena Boulevard which provided improved direct access to and from Denver International Airport (DIA). The final segment was completed in early 2003, generally between I-25 (north) and 120th Avenue. This provided a new connection to I-76 as well as substantially improving access to and from DIA for motorists traveling in the northern portions of the greater Denver/Boulder region. The facility was originally constructed as a four-lane, limited-access toll road with a total of 23 interchanges. The southernmost portion, generally Phase 1, is undergoing widening to six lanes scheduled to be completed by the end of this year. In the future, five additional interchanges are planned to be added at various locations along the corridor. Along the eastern and northern portions of E-470, much of the corridor was constructed in undeveloped land. In many cases, interchanges were provided in anticipation of future growth, although relatively little traffic uses these interchanges today. However, the available land along the E-470 corridor is expected to be largely developed over the forecast period, with substantial growth in travel demand expected in the future, which may necessitate some widening of E-470 by 2018 and beyond. E-470 currently employs a closed-barrier system of toll collection (although this will change on January 1, 2009 with the introduction of NST), including five mainline toll plazas over its nearly 47-mile length. In addition, ramp tolls are located at many of the interchanges, generally providing for unattended, automated toll collection. Plaza A, located on the Phase 1 portion of the project, currently charges a passenger car toll of $1.75, while each of the other four mainline plazas currently assess tolls of $2.00. This results in a through-trip toll (end to end) of $9.75, or approximately $0.207 per mile. This is a relatively high toll rate in comparison to other facilities, and tolls are assumed to continue to increase in future years.
TRAFFIC AND REVENUE TRENDS
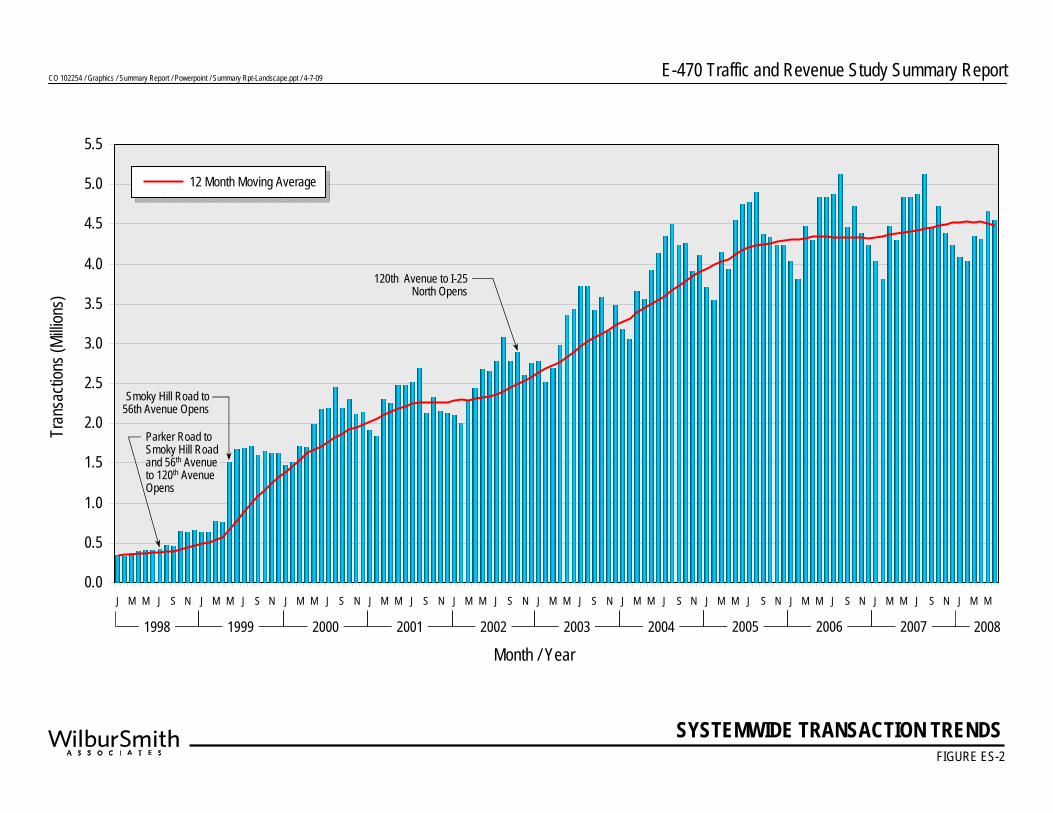
Figure ES-2 presents monthly transaction trends between 1998 and 2008. Through most of 1998, monthly transactions averaged less than 500,000 per month, generally reflecting traffic activity on the Phase 1 section between I-25 and Parker Road only. The segment from Parker Road to Smoky Hill Road opened in mid-1998, resulting in an increase in monthly transactions. By mid-1999, the remaining portions of Phases 2 and 3 were open to traffic, with monthly transactions exceeded 1.5 million. Steady growth continued thereafter, notwithstanding some adjustments in toll rates. The final segment, Phase 4, was opened at the
CO 102254 / Graphics / Summary Report / Powerpoint / Summary Rpt-Landscape.ppt / 4-7-09 E-470 Traffic and Revenue Study Summary Report
SYSTEMWIDE TRANSACTION TRENDSFIGURE ES-2
0.0
0.5
1.0
1.5
2.0
2.5
3.0
3.5
4.0
4.5
5.0
5.5
J M M J S N J M M J S N J M M J S N J M M J S N J M M J S N J M M J S N J M M J S N J M M J S N J M M J S N J M M J S N J M M
Tran
sacti
ons (
Millio
ns)
Month / Year
120th Avenue to I-25 North Opens
Smoky Hill Road to 56th Avenue Opens
Parker Road to Smoky Hill Road and 56th Avenue to 120th Avenue Opens
12 Month Moving Average
1998 1999 2000 2001 2002 2003 2004 2005 2006 2007 2008
E-470 Traffic and Revenue Study Summary Report
December 1, 2008 Page 4
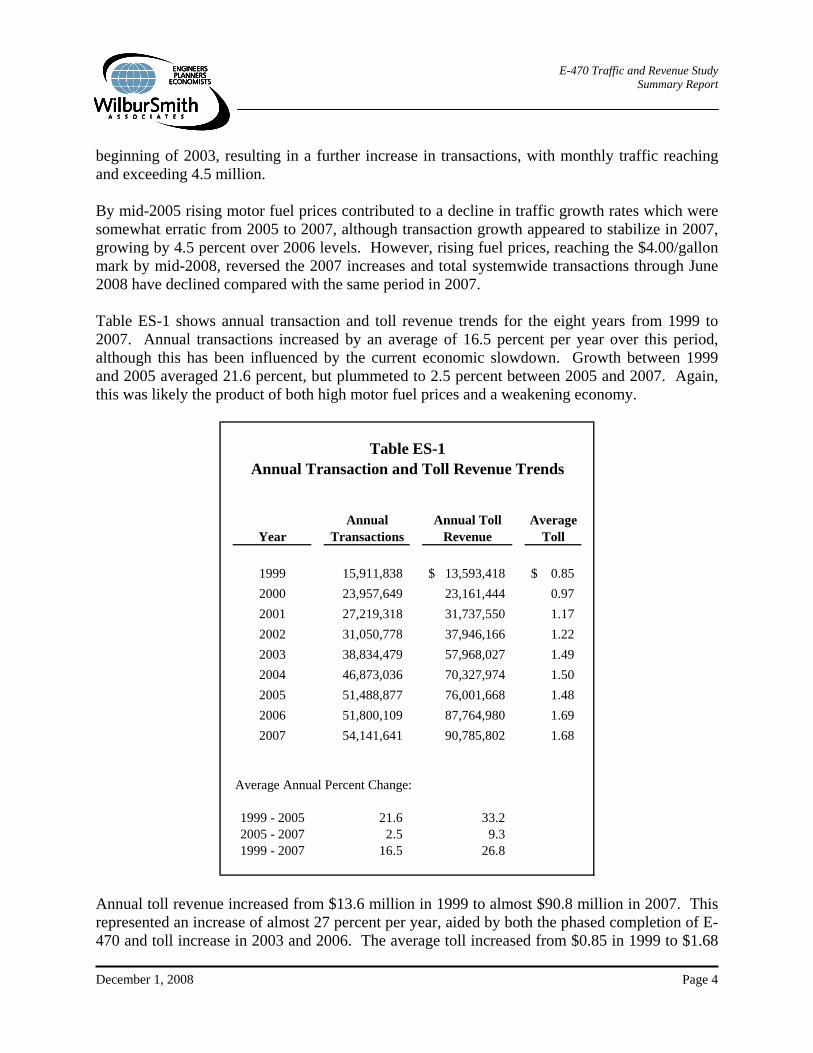
beginning of 2003, resulting in a further increase in transactions, with monthly traffic reaching and exceeding 4.5 million. By mid-2005 rising motor fuel prices contributed to a decline in traffic growth rates which were somewhat erratic from 2005 to 2007, although transaction growth appeared to stabilize in 2007, growing by 4.5 percent over 2006 levels. However, rising fuel prices, reaching the $4.00/gallon mark by mid-2008, reversed the 2007 increases and total systemwide transactions through June 2008 have declined compared with the same period in 2007. Table ES-1 shows annual transaction and toll revenue trends for the eight years from 1999 to 2007. Annual transactions increased by an average of 16.5 percent per year over this period, although this has been influenced by the current economic slowdown. Growth between 1999 and 2005 averaged 21.6 percent, but plummeted to 2.5 percent between 2005 and 2007. Again, this was likely the product of both high motor fuel prices and a weakening economy.
Year
1999 15,911,838 13,593,418$ 0.85$ 2000 23,957,649 23,161,444 0.97 2001 27,219,318 31,737,550 1.17 2002 31,050,778 37,946,166 1.22 2003 38,834,479 57,968,027 1.49 2004 46,873,036 70,327,974 1.50 2005 51,488,877 76,001,668 1.48 2006 51,800,109 87,764,980 1.69 2007 54,141,641 90,785,802 1.68
Average Annual Percent Change:
1999 - 2005 21.6 33.22005 - 2007 2.5 9.31999 - 2007 16.5 26.8
Table ES-1Annual Transaction and Toll Revenue Trends
Annual Transactions
Annual Toll Revenue
Average Toll
Annual toll revenue increased from $13.6 million in 1999 to almost $90.8 million in 2007. This represented an increase of almost 27 percent per year, aided by both the phased completion of E-470 and toll increase in 2003 and 2006. The average toll increased from $0.85 in 1999 to $1.68
E-470 Traffic and Revenue Study Summary Report
December 1, 2008 Page 5
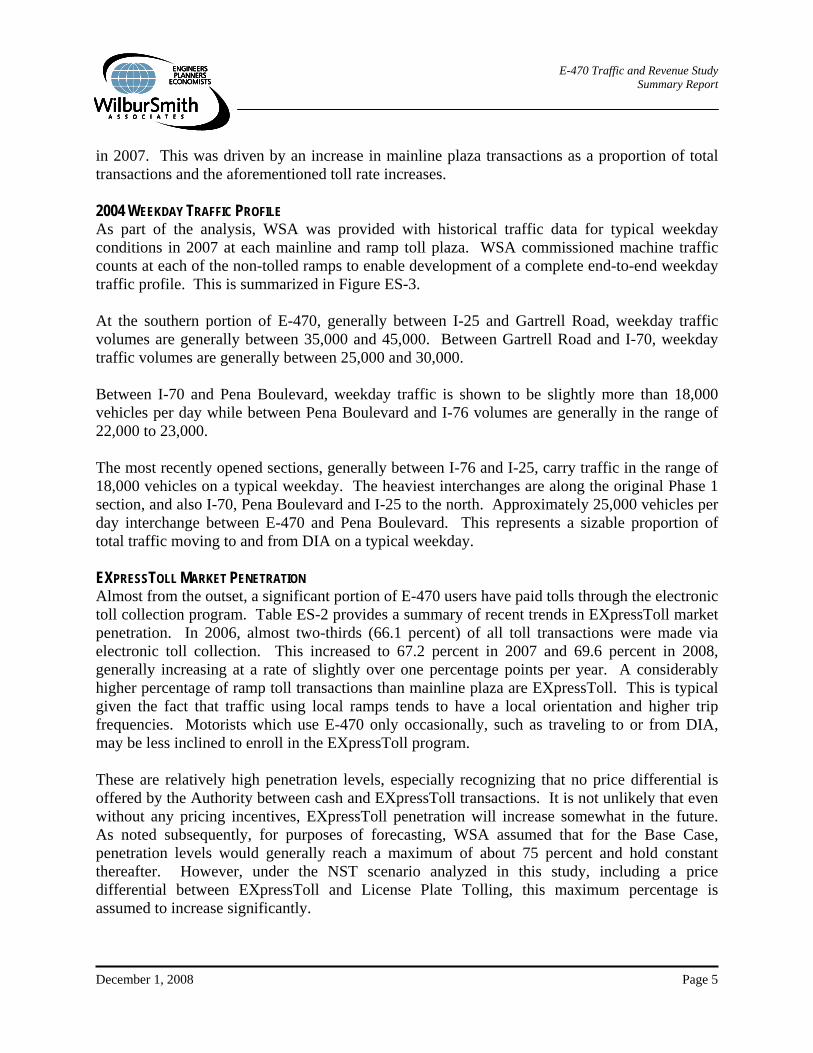
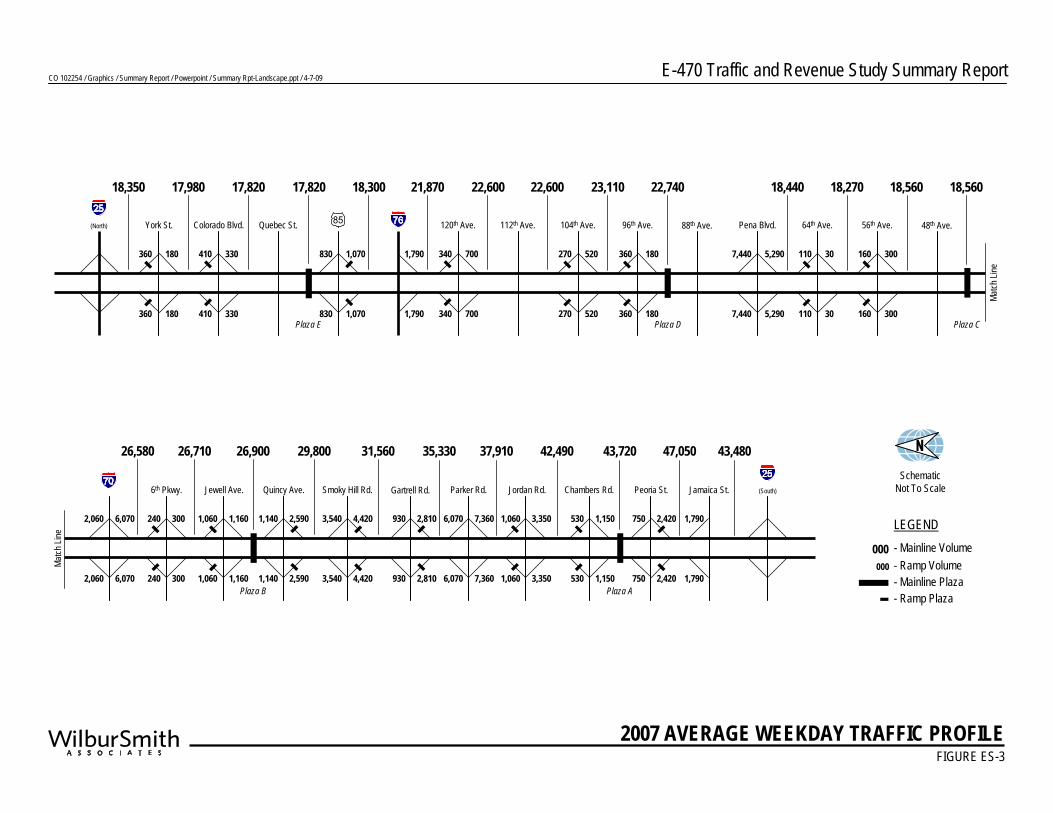
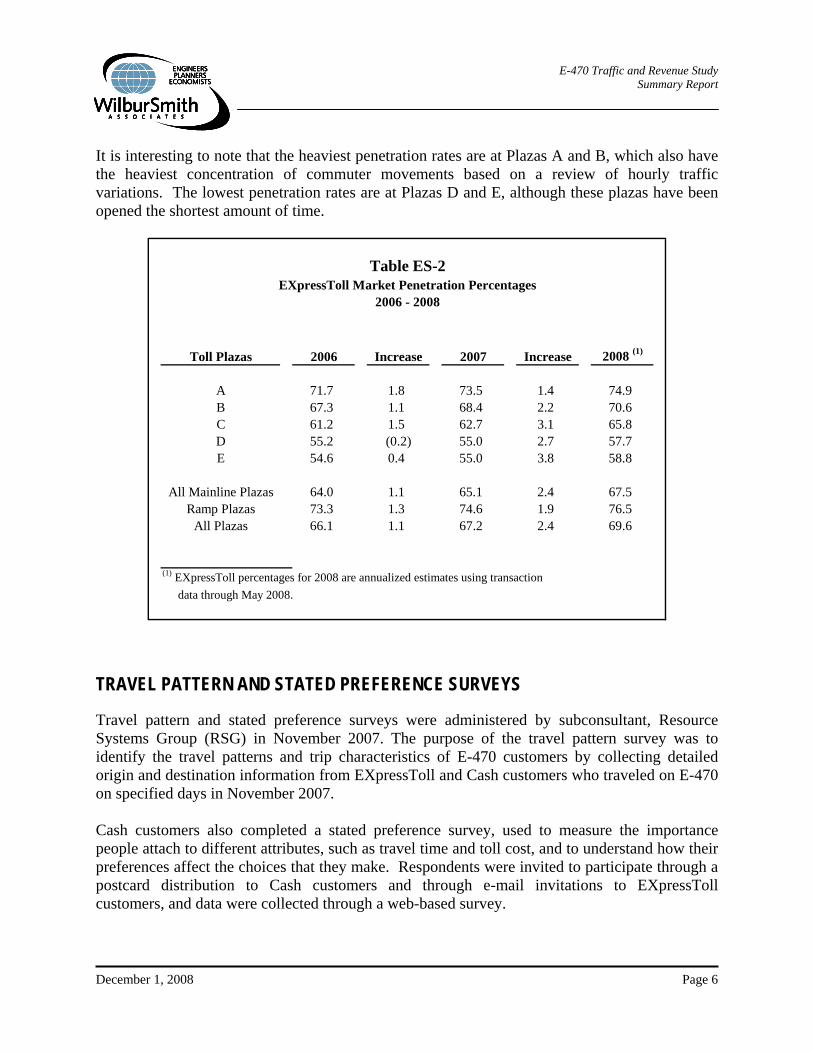
in 2007. This was driven by an increase in mainline plaza transactions as a proportion of total transactions and the aforementioned toll rate increases. 2004 WEEKDAY TRAFFIC PROFILE As part of the analysis, WSA was provided with historical traffic data for typical weekday conditions in 2007 at each mainline and ramp toll plaza. WSA commissioned machine traffic counts at each of the non-tolled ramps to enable development of a complete end-to-end weekday traffic profile. This is summarized in Figure ES-3. At the southern portion of E-470, generally between I-25 and Gartrell Road, weekday traffic volumes are generally between 35,000 and 45,000. Between Gartrell Road and I-70, weekday traffic volumes are generally between 25,000 and 30,000. Between I-70 and Pena Boulevard, weekday traffic is shown to be slightly more than 18,000 vehicles per day while between Pena Boulevard and I-76 volumes are generally in the range of 22,000 to 23,000. The most recently opened sections, generally between I-76 and I-25, carry traffic in the range of 18,000 vehicles on a typical weekday. The heaviest interchanges are along the original Phase 1 section, and also I-70, Pena Boulevard and I-25 to the north. Approximately 25,000 vehicles per day interchange between E-470 and Pena Boulevard. This represents a sizable proportion of total traffic moving to and from DIA on a typical weekday. EXPRESSTOLL MARKET PENETRATION Almost from the outset, a significant portion of E-470 users have paid tolls through the electronic toll collection program. Table ES-2 provides a summary of recent trends in EXpressToll market penetration. In 2006, almost two-thirds (66.1 percent) of all toll transactions were made via electronic toll collection. This increased to 67.2 percent in 2007 and 69.6 percent in 2008, generally increasing at a rate of slightly over one percentage points per year. A considerably higher percentage of ramp toll transactions than mainline plaza are EXpressToll. This is typical given the fact that traffic using local ramps tends to have a local orientation and higher trip frequencies. Motorists which use E-470 only occasionally, such as traveling to or from DIA, may be less inclined to enroll in the EXpressToll program. These are relatively high penetration levels, especially recognizing that no price differential is offered by the Authority between cash and EXpressToll transactions. It is not unlikely that even without any pricing incentives, EXpressToll penetration will increase somewhat in the future. As noted subsequently, for purposes of forecasting, WSA assumed that for the Base Case, penetration levels would generally reach a maximum of about 75 percent and hold constant thereafter. However, under the NST scenario analyzed in this study, including a price differential between EXpressToll and License Plate Tolling, this maximum percentage is assumed to increase significantly.
CO 102254 / Graphics / Summary Report / Powerpoint / Summary Rpt-Landscape.ppt / 4-7-09 E-470 Traffic and Revenue Study Summary Report
FIGURE ES-3
(North) York St. Colorado Blvd. Quebec St. 120th Ave. 112th Ave. 104th Ave. 96th Ave. 88th Ave. Pena Blvd. 64th Ave. 56th Ave. 48th Ave.
Match
Line
Plaza DPlaza E Plaza C
6th Pkwy. Jewell Ave. Quincy Ave. Parker Rd. Jordan Rd. Chambers Rd. Peoria St.Smoky Hill Rd. Gartrell Rd. (South)Jamaica St.
Match
Line
Plaza APlaza B
LEGEND- Mainline Volume- Ramp Volume- Mainline Plaza- Ramp Plaza
000000
2007 AVERAGE WEEKDAY TRAFFIC PROFILE
18,350
360 180
17,980
410 330
17,820
830 1,070
17,820 18,300
1,790 340 700
22,60021,870
270 520
22,600
360 180
23,110
7,440 5,290
22,740
110 30
18,440
160 300
18,270 18,560 18,560
26,580
240 300
26,710
1,060 1,160
26,900
1,140 2,590
29,800
3,540 4,420
31,560
930 2,810
35,330
6,070 7,360
37,910
1,060 3,350
42,490
530 1,150
43,720
750 2,420
47,050
1,790
43,480Schematic
Not To Scale
360 180 410 330 830 1,070 1,790 340 700 270 520 360 180 7,440 5,290 110 30 160 300
240 300 1,060 1,160 1,140 2,590 3,540 4,420 930 2,810 6,070 7,360 1,060 3,350 530 1,150 750 2,420 1,790
2,060 6,070
2,060 6,070
E-470 Traffic and Revenue Study Summary Report
December 1, 2008 Page 6
It is interesting to note that the heaviest penetration rates are at Plazas A and B, which also have the heaviest concentration of commuter movements based on a review of hourly traffic variations. The lowest penetration rates are at Plazas D and E, although these plazas have been opened the shortest amount of time.
Table ES-2EXpressToll Market Penetration Percentages
2006 - 2008
Toll Plazas 2006 2007 2008 (1)
A 71.7 1.8 73.5 1.4 74.9B 67.3 1.1 68.4 2.2 70.6C 61.2 1.5 62.7 3.1 65.8D 55.2 (0.2) 55.0 2.7 57.7E 54.6 0.4 55.0 3.8 58.8
All Mainline Plazas 64.0 1.1 65.1 2.4 67.5Ramp Plazas 73.3 1.3 74.6 1.9 76.5
All Plazas 66.1 1.1 67.2 2.4 69.6
(1) EXpressToll percentages for 2008 are annualized estimates using transaction data through May 2008.
IncreaseIncrease
TRAVEL PATTERN AND STATED PREFERENCE SURVEYS
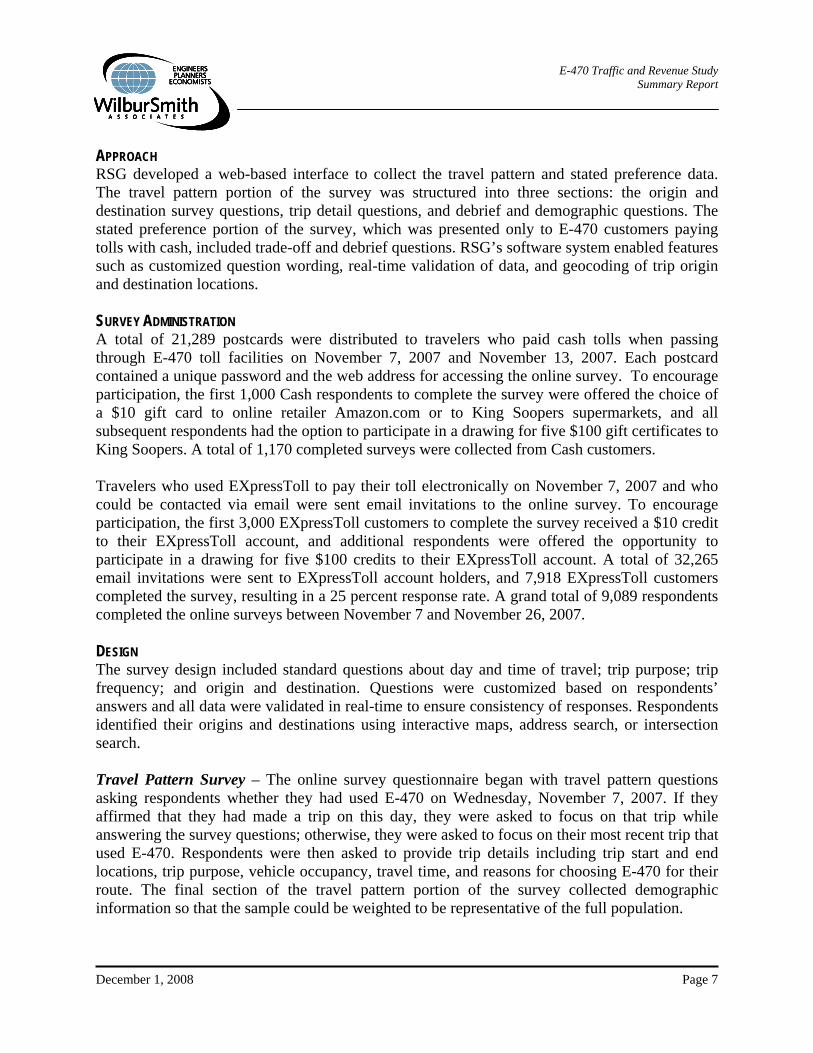
Travel pattern and stated preference surveys were administered by subconsultant, Resource Systems Group (RSG) in November 2007. The purpose of the travel pattern survey was to identify the travel patterns and trip characteristics of E-470 customers by collecting detailed origin and destination information from EXpressToll and Cash customers who traveled on E-470 on specified days in November 2007. Cash customers also completed a stated preference survey, used to measure the importance people attach to different attributes, such as travel time and toll cost, and to understand how their preferences affect the choices that they make. Respondents were invited to participate through a postcard distribution to Cash customers and through e-mail invitations to EXpressToll customers, and data were collected through a web-based survey.
E-470 Traffic and Revenue Study Summary Report
December 1, 2008 Page 7
APPROACH RSG developed a web-based interface to collect the travel pattern and stated preference data. The travel pattern portion of the survey was structured into three sections: the origin and destination survey questions, trip detail questions, and debrief and demographic questions. The stated preference portion of the survey, which was presented only to E-470 customers paying tolls with cash, included trade-off and debrief questions. RSG’s software system enabled features such as customized question wording, real-time validation of data, and geocoding of trip origin and destination locations. SURVEY ADMINISTRATION A total of 21,289 postcards were distributed to travelers who paid cash tolls when passing through E-470 toll facilities on November 7, 2007 and November 13, 2007. Each postcard contained a unique password and the web address for accessing the online survey. To encourage participation, the first 1,000 Cash respondents to complete the survey were offered the choice of a $10 gift card to online retailer Amazon.com or to King Soopers supermarkets, and all subsequent respondents had the option to participate in a drawing for five $100 gift certificates to King Soopers. A total of 1,170 completed surveys were collected from Cash customers. Travelers who used EXpressToll to pay their toll electronically on November 7, 2007 and who could be contacted via email were sent email invitations to the online survey. To encourage participation, the first 3,000 EXpressToll customers to complete the survey received a $10 credit to their EXpressToll account, and additional respondents were offered the opportunity to participate in a drawing for five $100 credits to their EXpressToll account. A total of 32,265 email invitations were sent to EXpressToll account holders, and 7,918 EXpressToll customers completed the survey, resulting in a 25 percent response rate. A grand total of 9,089 respondents completed the online surveys between November 7 and November 26, 2007. DESIGN The survey design included standard questions about day and time of travel; trip purpose; trip frequency; and origin and destination. Questions were customized based on respondents’ answers and all data were validated in real-time to ensure consistency of responses. Respondents identified their origins and destinations using interactive maps, address search, or intersection search. Travel Pattern Survey – The online survey questionnaire began with travel pattern questions asking respondents whether they had used E-470 on Wednesday, November 7, 2007. If they affirmed that they had made a trip on this day, they were asked to focus on that trip while answering the survey questions; otherwise, they were asked to focus on their most recent trip that used E-470. Respondents were then asked to provide trip details including trip start and end locations, trip purpose, vehicle occupancy, travel time, and reasons for choosing E-470 for their route. The final section of the travel pattern portion of the survey collected demographic information so that the sample could be weighted to be representative of the full population.
E-470 Traffic and Revenue Study Summary Report
December 1, 2008 Page 8
Stated Preference Survey – The stated preference survey, administered to Cash customers only, consisted of an additional set of questions after the trip detail questions and before the demographic questions. Respondents were asked why they choose to pay their tolls with cash as well as several questions designed to gauge their awareness of the different methods available for signing up for an EXpressToll account. Respondents were then asked to choose between three hypothetical alternatives for future travel on E-470, with the stipulation that cash toll collection would not be available. The three options were: pay the toll with EXpressToll, pay by license plate toll, or stop using E-470. The travel time and toll cost details of the three alternatives were customized based on the respondent’s reported travel time and toll cost, the number of toll plazas passed through on E-470, and the travel time for the next best alternate route. The toll amount for the E-470 EXpressToll option was the toll amount reported by the respondent and was not varied. To test a range of license plate toll surcharges, the toll amount for the license plate toll option was varied from 115 percent of reported toll to 150 percent of reported toll. Following the stated preference questions, respondents answered a few debrief questions, including their opinion of the NST concept and their likelihood of opening an EXpressToll account if NST was implemented. Details of the questionnaire design and example survey screens are included in Appendix A and Appendix B of the full report, respectively. SELECTED SURVEY RESULTS Travel Pattern Survey Results – A total of 9,089 E-470 travelers completed the surveys. Of these, 7,919 (87 percent) were EXpressToll and 1,170 (13 percent) were Cash customers. Trip Origins and Destinations – The trip origins and destinations provided by survey
respondents were geocoded to traffic analysis zones (TAZ) used in the DRCOG traffic models, and filtered to include only origin-destination pairs that could logically use E-470. To aid in this “logical movement check,” the DRCOG TAZs were aggregated into 55 “Superzones,” shown in Figure ES-4. Superzones 1 through 36 represent the detailed area within the DRCOG traffic model. External local (superzones 50 through 58) and external long distance (superzones 89 through 99) represent trips made from origins and/or destinations outside the DRCOG model area.
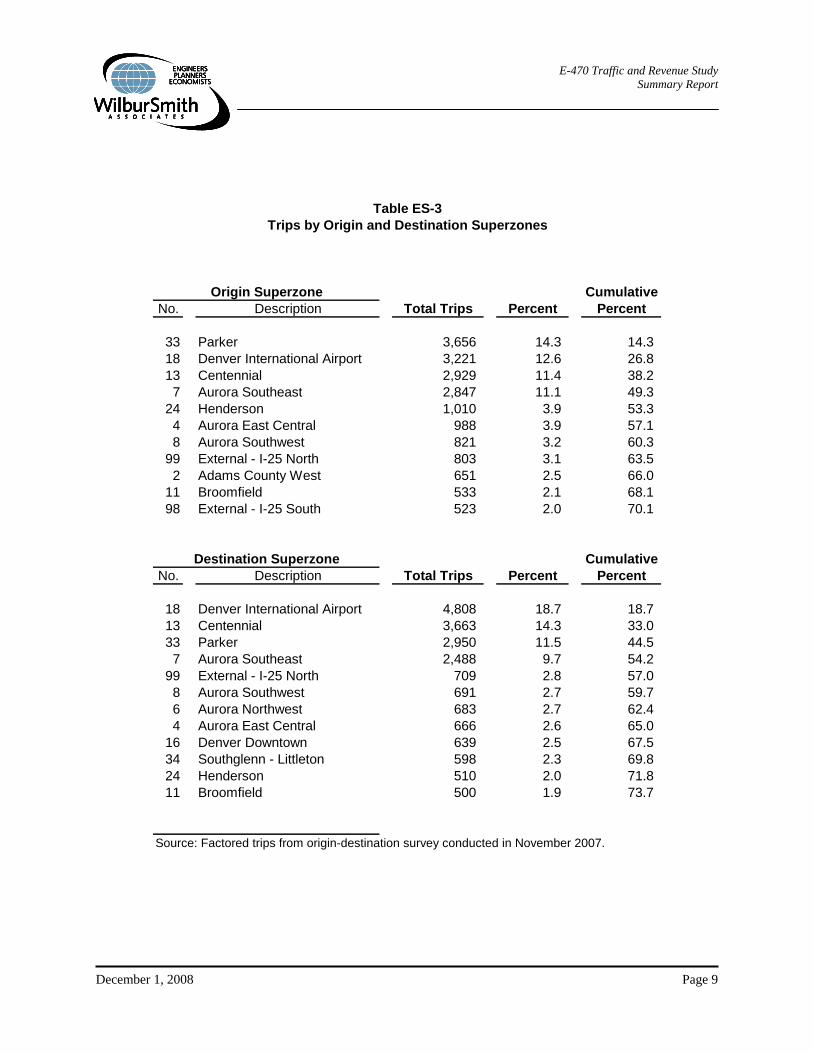
Table ES-3 presents some of the most prevalent zones of trip origin and destination. The values in the table represent “factored” survey trip data. The travel pattern survey database containing valid trips was factored up to actual observed traffic volumes at each survey location. As shown in the table, for both origins and destinations, the top five zones represent more than half of all trips. The “I-25 North” and “I-25 South” zones represent the long-distance trips originating or ending outside of the DRCOG model area and could include places such as Longmont, Fort Collins, Colorado Springs, Pueblo, or beyond.
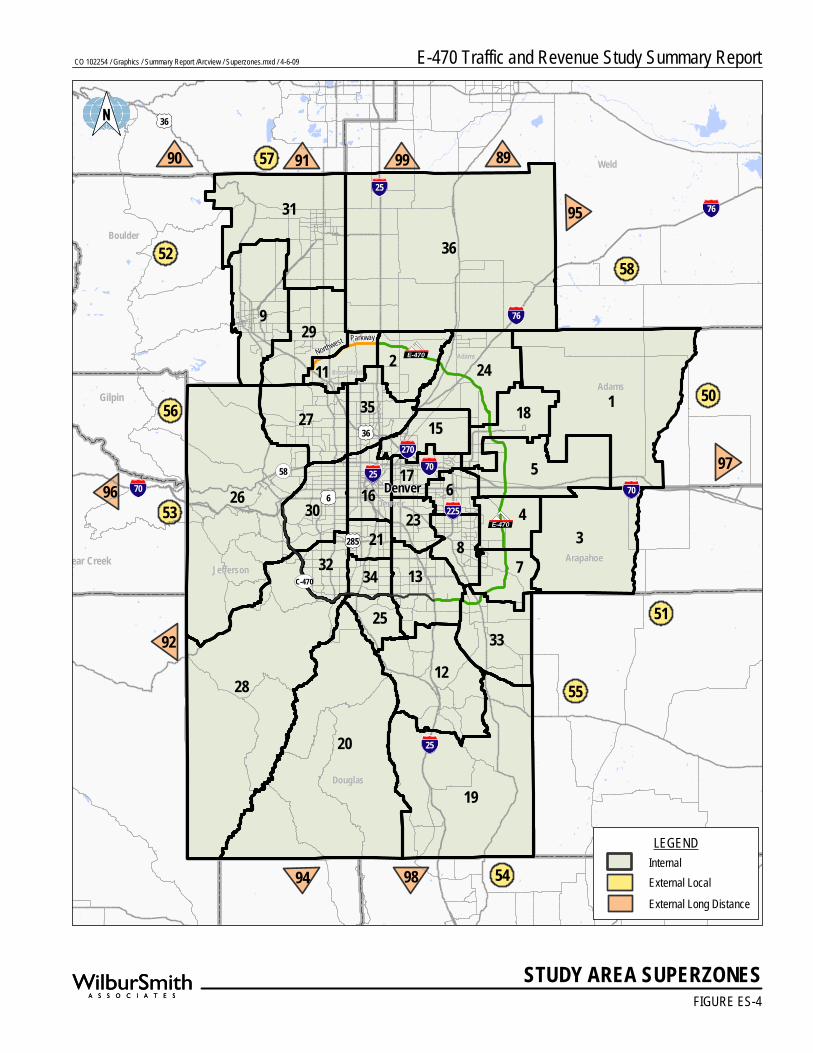
FIGURE ES-4
STUDY AREA SUPERZONES
2576
76
36
36
25
225
7070
706
58
285
270
25
C-470
Denver
Northwest Parkway
E-470
E-470
Clear Creek
Gilpin
Adams
Jefferson
Denver
Arapahoe
Douglas
Boulder
Weld
AdamsBroomfield
36
1
3
20
28
26
19
5
9
31
12
2 24
4
7
27
33
29
813
306
183515
16
11
32
23
25
2134
17 9796
91
92
90
94 98
95
8999
54
55
51
53
56 50
5852
57
LEGENDInternalExternal Local
External Long Distance
E-470 Traffic and Revenue Study Summary ReportCO 102254 / Graphics / Summary Report /Arcview / Superzones.mxd / 4-6-09
E-470 Traffic and Revenue Study Summary Report
December 1, 2008 Page 9
Table ES-3Trips by Origin and Destination Superzones
CumulativeNo. Description Total Trips Percent Percent
33 Parker 3,656 14.3 14.318 Denver International Airport 3,221 12.6 26.813 Centennial 2,929 11.4 38.27 Aurora Southeast 2,847 11.1 49.3
24 Henderson 1,010 3.9 53.34 Aurora East Central 988 3.9 57.18 Aurora Southwest 821 3.2 60.3
99 External - I-25 North 803 3.1 63.52 Adams County West 651 2.5 66.0
11 Broomfield 533 2.1 68.198 External - I-25 South 523 2.0 70.1
CumulativeNo. Description Total Trips Percent Percent
18 Denver International Airport 4,808 18.7 18.713 Centennial 3,663 14.3 33.033 Parker 2,950 11.5 44.57 Aurora Southeast 2,488 9.7 54.2
99 External - I-25 North 709 2.8 57.08 Aurora Southwest 691 2.7 59.76 Aurora Northwest 683 2.7 62.44 Aurora East Central 666 2.6 65.0
16 Denver Downtown 639 2.5 67.534 Southglenn - Littleton 598 2.3 69.824 Henderson 510 2.0 71.811 Broomfield 500 1.9 73.7
Source: Factored trips from origin-destination survey conducted in November 2007.
Origin Superzone
Destination Superzone
E-470 Traffic and Revenue Study Summary Report
December 1, 2008 Page 10
Among specific origin-destination pairs, the top movements include trips between Centennial and Parker, Aurora Southeast and Centennial, Centennial and DIA, DIA and I-25 North, DIA and Parker, Aurora Southeast and Parker, and Boulder and DIA. These movements all accounted for over 500 trips.
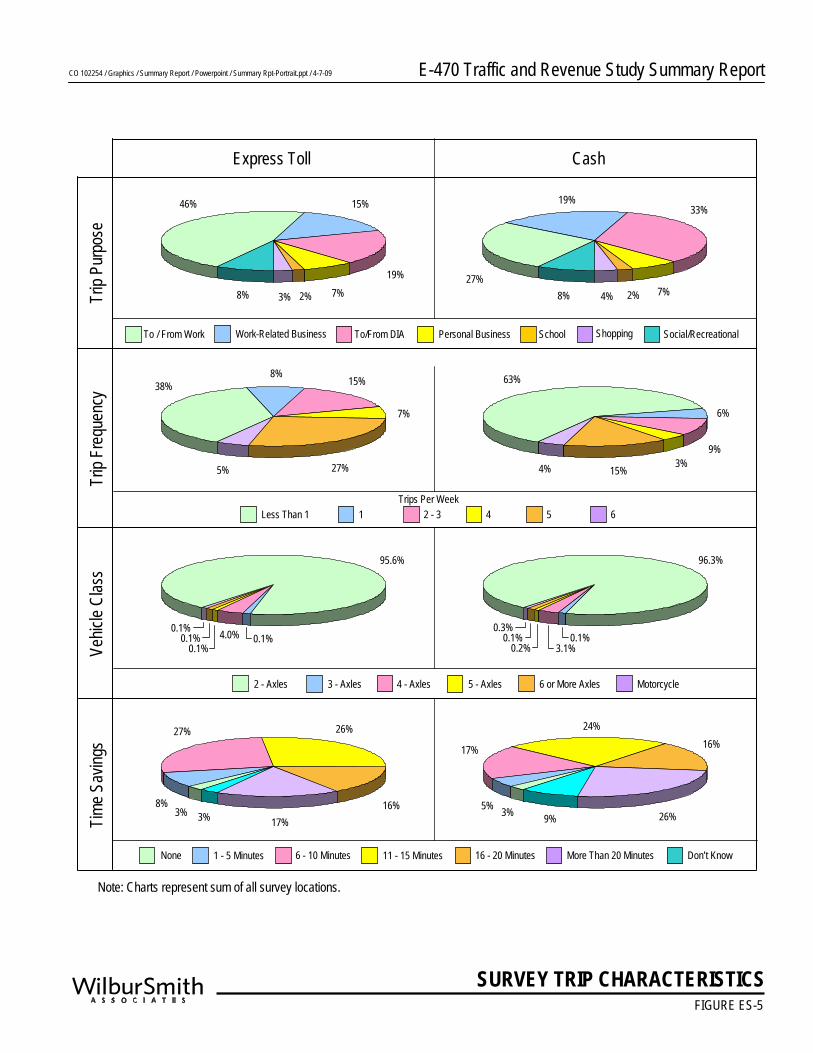
Trip Characteristics – Some of the trip characteristics of E-470 customers are presented in
Figure ES-5. Detailed tables are presented in the Chapter 3 and Appendix C of the full report. Commute trips represented the most common trip among EXpressToll customers, accounting for over 45 percent, with trips to and from DIA and work-related business trips each accounting for over 15 percent. Among Cash customers, trips to and from Denver International Airport (DIA) represented the largest share at 33 percent, with commute trips and business trips each represented over 15 percent.
EXpressToll customers generally exhibited higher trip frequencies, with over 30 percent making five or more trips per week, compared with 38 percent making less than one trip. Only 19 percent of Cash customers made five or six trips, while 63 percent made one or fewer.
Over 95 percent of both cash and EXpressToll trips were in two-axle vehicles. Respondents were asked to estimate how much time they think they saved by using E-470 rather than the next best alternative route. Twenty-six percent of Cash customers reported that they saved more than 20 minutes by using E-470, whereas only 17 percent of EXpressToll customers reported saving that much time. The average time savings for EXpressToll and Cash customers was 14 and 16 minutes, respectively.
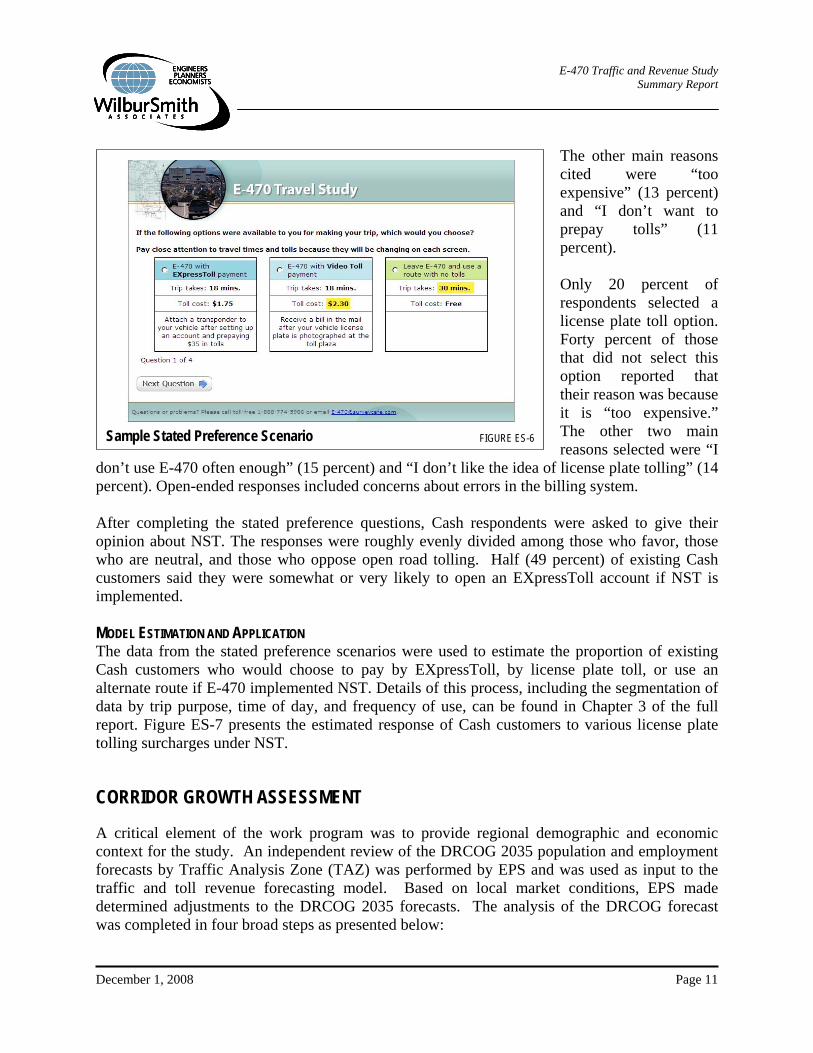
Stated Preference Survey Results – The first series of questions in the stated preference survey (administered to Cash customers only) probed for awareness of EXpressToll sign-up options. Fifty-eight percent of Cash respondents were not aware that they could open an EXpressToll account using a check, and 61 percent were not aware that they could immediately receive their transponders by signing up at King Soopers and Safeway Stores. Nearly 90 percent of Cash respondents shop at either King Soopers or Safeway. Next, Cash respondents were shown four hypothetical NST scenarios, and were asked to choose whether they would pay the toll with EXpressToll toll collection, license plate toll collection, or leave E-470 and use an alternate toll-free route. Figure ES-6 presents a sample survey scenario. Three-quarters (75 percent) of existing Cash customers selected an EXpressToll option at least once. Of these, Cash customers who selected at least one EXpressToll option, 50 percent would prefer to open an EXpressToll account at their local King Soopers or Safeway, and 45 percent would prefer to use the Internet to open an account. Of the 25 percent of Cash customers who did not select an EXpressToll option, 38 percent reported that they do not use E-470 often enough.
E-470 Traffic and Revenue Study Summary ReportCO 102254 / Graphics / Summary Report / Powerpoint / Summary Rpt-Portrait.ppt / 4-7-09
7%
46%
2%
19%
3%8%
15%
SURVEY TRIP CHARACTERISTICSFIGURE ES-5
Express Toll
Trip
Freq
uenc
yTr
ip Pu
rpos
eVe
hicle
Clas
s
Cash
Trips Per WeekLess Than 1 1 2 - 3 4 5 6
Time S
aving
s
4.0%
95.6%
0.1%
96.3%
To / From Work Work-Related Business To/From DIA Personal Business Social/RecreationalSchool Shopping
4%
33%19%
7%8% 2%27%
2 - Axles 3 - Axles 4 - Axles 5 - Axles 6 or More Axles Motorcycle
None 1 - 5 Minutes 6 - 10 Minutes 11 - 15 Minutes 16 - 20 Minutes More Than 20 Minutes
3%
24%
17%16%
9% 26%
7%
38%
5% 27%
15%8%
3%
6%
63%
9%
15%4%
Note: Charts represent sum of all survey locations.
Don’t Know
0.1%3.1%
0.3%0.1%
0.2%
8%
27% 26%
3% 3%5%
17% 16%
0.1%0.1%
0.1%
E-470 Traffic and Revenue Study Summary Report
December 1, 2008 Page 11
The other main reasons cited were “too expensive” (13 percent) and “I don’t want to prepay tolls” (11 percent). Only 20 percent of respondents selected a license plate toll option. Forty percent of those that did not select this option reported that their reason was because it is “too expensive.” The other two main reasons selected were “I
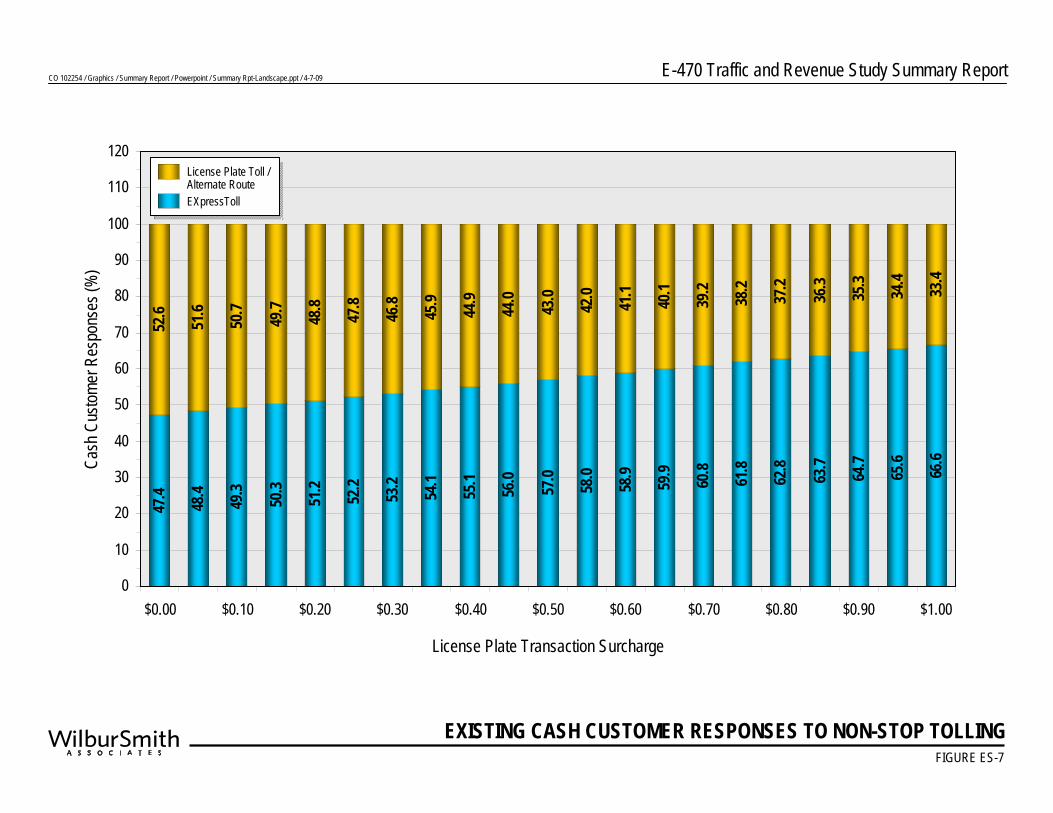
don’t use E-470 often enough” (15 percent) and “I don’t like the idea of license plate tolling” (14 percent). Open-ended responses included concerns about errors in the billing system. After completing the stated preference questions, Cash respondents were asked to give their opinion about NST. The responses were roughly evenly divided among those who favor, those who are neutral, and those who oppose open road tolling. Half (49 percent) of existing Cash customers said they were somewhat or very likely to open an EXpressToll account if NST is implemented. MODEL ESTIMATION AND APPLICATION The data from the stated preference scenarios were used to estimate the proportion of existing Cash customers who would choose to pay by EXpressToll, by license plate toll, or use an alternate route if E-470 implemented NST. Details of this process, including the segmentation of data by trip purpose, time of day, and frequency of use, can be found in Chapter 3 of the full report. Figure ES-7 presents the estimated response of Cash customers to various license plate tolling surcharges under NST.
CORRIDOR GROWTH ASSESSMENT
A critical element of the work program was to provide regional demographic and economic context for the study. An independent review of the DRCOG 2035 population and employment forecasts by Traffic Analysis Zone (TAZ) was performed by EPS and was used as input to the traffic and toll revenue forecasting model. Based on local market conditions, EPS made determined adjustments to the DRCOG 2035 forecasts. The analysis of the DRCOG forecast was completed in four broad steps as presented below:
FIGURE 3-3Sample Stated Preference Scenario FIGURE ES-6
CO 102254 / Graphics / Summary Report / Powerpoint / Summary Rpt-Landscape.ppt / 4-7-09 E-470 Traffic and Revenue Study Summary Report
EXISTING CASH CUSTOMER RESPONSES TO NON-STOP TOLLINGFIGURE ES-7
47.4
48.4
49.3
50.3
51.2
52.2
53.2
54.1
55.1
56.0
57.0
58.0
58.9
59.9
60.8
61.8
62.8
63.7
64.7
65.6
66.6
52.6
51.6
50.7
49.7
48.8
47.8
46.8
45.9
44.9
44.0
43.0
42.0
41.1
40.1
39.2
38.2
37.2
36.3
35.3
34.4
33.4
0
10
20
30
40
50
60
70
80
90
100
110
120
$0.00 $0.10 $0.20 $0.30 $0.40 $0.50 $0.60 $0.70 $0.80 $0.90 $1.00
Cash
Cus
tomer
Res
pons
es (%
)
License Plate Transaction Surcharge
EXpressToll
License Plate Toll /Alternate Route
E-470 Traffic and Revenue Study Summary Report
December 1, 2008 Page 12
EPS used GIS to extract TAZ data within the planning areas of each jurisdiction which represent the future growth and annexation areas. This TAZ level data was aggregated into forecasts for the local planning areas;
EPS prepared baseline population, household, and employment projections based on recent population, residential construction, and employment trends for comparison to the DRCOG 2035 forecasts. EPS also analyzed local market conditions in the office, industrial, and retail real estate markets, including vacancies and absorption trends;
EPS interviewed local planning staff on locally prepared growth projections, future land use policy, and major development activity to supplement the analyses of baseline trends; and
In the final step, the baseline projections and primary research on development potential, current and expected future market share and competition, and capacity in each jurisdiction were compared to the DRCOG 2035 forecasts. Where the DRCOG forecasts were judged to be too high or too low based on the baseline trends and local conditions, positive or negative factors were applied to the respective forecast years to adjust the forecast totals to a more reasonable expectation of future growth.
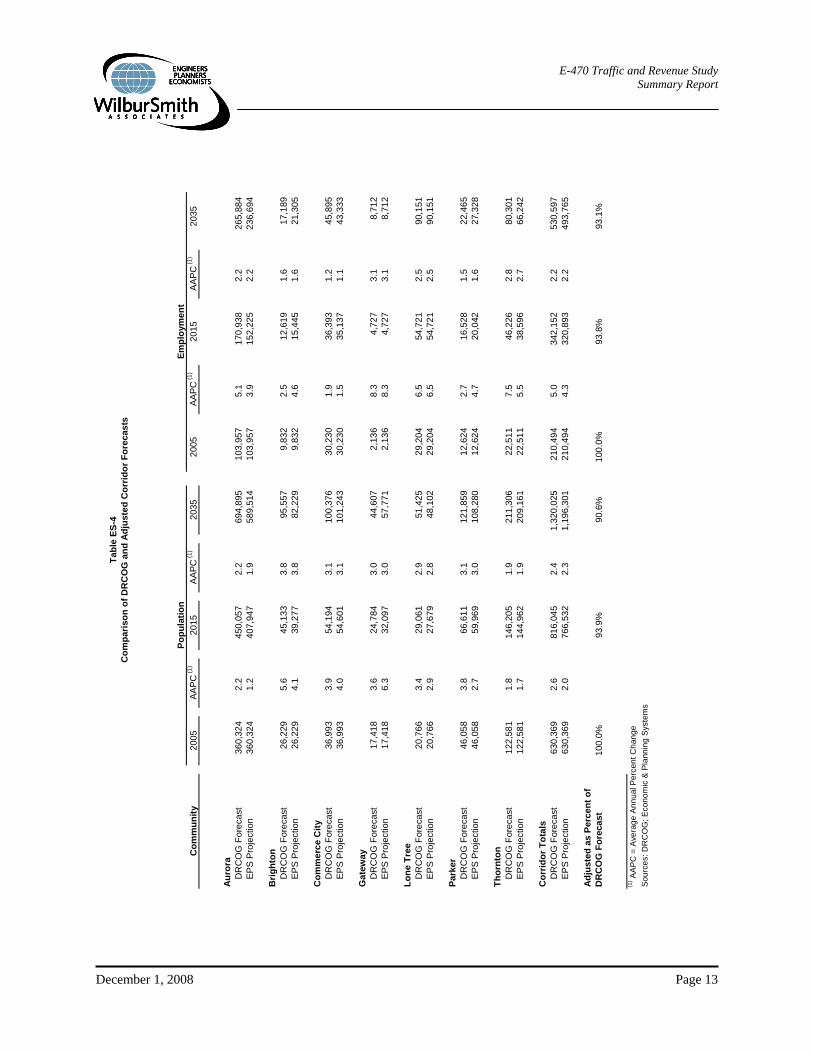
The adjusted 2035 population forecast is approximately 10 percent less than DRCOG’s 2035 forecast. The difference between the adjusted employment forecast and the DRCOG 2035 forecast is approximately seven percent. The proposed forecasts reflect more sensitivity to local market conditions than the unadjusted DRCOG 2035 forecasts. Table ES-4 shows the independent projections and the DRCOG 2035 forecasts for each jurisdiction’s planning area. There are, however, minor differences which vary by jurisdiction. The adjusted forecast in aggregate is 90.6 percent of the DRCOG 2035 population forecast for the study area. Based on EPS’ analysis of baseline trends and market activity, and conversations with other local economic experts, the DRCOG 2035 forecast is believed to overstate employment growth on the eastern side of the metropolitan area and understate employment growth in parts of the northern side. In 2015, the adjusted forecast for the study area is 93.8 percent of the DRCOG forecast, and 93.1 percent in 2035.
REGIONAL TRANSPORTATION IMPROVEMENT PROGRAM
A significant number of important transportation improvements are currently programmed in the immediate E-470 corridor and along principle competing freeways and routes. Much of the expansion and new roadways in the E-470 corridor in the future will be needed to accommodate the socioeconomic growth which is projected for the corridor. In essence, this growth in population and employment will substantially increase travel demand in the corridor, but additional capacity needed to support this growth will also provide additional competition to E-470 in the future.
E-470 Traffic and Revenue Study Summary Report
December 1, 2008 Page 13
Tabl
e ES
-4C
ompa
rison
of D
RC
OG
and
Adj
uste
d C
orrid
or F
orec
asts
Com
mun
ity20
05AA
PC(1
)20
15AA
PC(1
)20
3520
05AA
PC(1
)20
15A
APC
(1)
2035
Auro
raD
RC
OG
For
ecas
t36
0,32
42.
245
0,05
72.
269
4,89
510
3,95
75.
117
0,93
82.
226
5,88
4EP
S Pr
ojec
tion
360,
324
1.2
407,
947
1.9
589,
514
103,
957
3.9
152,
225
2.2
236,
694
Brig
hton
DR
CO
G F
orec
ast
26,2
295.
645
,133
3.8
95,5
579,
832
2.5
12,6
191.
617
,189
EPS
Proj
ectio
n26
,229
4.1
39,2
773.
882
,229
9,83
24.
615
,445
1.6
21,3
05
Com
mer
ce C
ityD
RC
OG
For
ecas
t36
,993
3.9
54,1
943.
110
0,37
630
,230
1.9
36,3
931.
245
,895
EPS
Proj
ectio
n36
,993
4.0
54,6
013.
110
1,24
330
,230
1.5
35,1
371.
143
,333
Gat
eway
DR
CO
G F
orec
ast
17,4
183.
624
,784
3.0
44,6
072,
136
8.3
4,72
73.
18,
712
EPS
Proj
ectio
n17
,418
6.3
32,0
973.
057
,771
2,13
68.
34,
727
3.1
8,71
2
Lone
Tre
eD
RC
OG
For
ecas
t20
,766
3.4
29,0
612.
951
,425
29,2
046.
554
,721
2.5
90,1
51EP
S Pr
ojec
tion
20,7
662.
927
,679
2.8
48,1
0229
,204
6.5
54,7
212.
590
,151
Park
erD
RC
OG
For
ecas
t46
,058
3.8
66,6
113.
112
1,85
912
,624
2.7
16,5
281.
522
,465
EPS
Proj
ectio
n46
,058
2.7
59,9
693.
010
8,28
012
,624
4.7
20,0
421.
627
,328
Thor
nton
DR
CO
G F
orec
ast
122,
581
1.8
146,
205
1.9
211,
306
22,5
117.
546
,226
2.8
80,3
01EP
S Pr
ojec
tion
122,
581
1.7
144,
962
1.9
209,
161
22,5
115.
538
,596
2.7
66,2
42
Cor
ridor
Tot
als
DR
CO
G F
orec
ast
630,
369
2.6
816,
045
2.4
1,32
0,02
521
0,49
45.
034
2,15
22.
253
0,59
7EP
S Pr
ojec
tion
630,
369
2.0
766,
532
2.3
1,19
6,30
121
0,49
44.
332
0,89
32.
249
3,76
5
Adju
sted
as
Perc
ent o
fD
RC
OG
For
ecas
t10
0.0%
93.9
%90
.6%
100.
0%93
.8%
93.1
%
(1) A
APC
= A
vera
ge A
nnua
l Per
cent
Cha
nge
Sour
ces:
DR
CO
G; E
cono
mic
& P
lann
ing
Syst
ems
Popu
latio
nEm
ploy
men
t
E-470 Traffic and Revenue Study Summary Report
December 1, 2008 Page 14
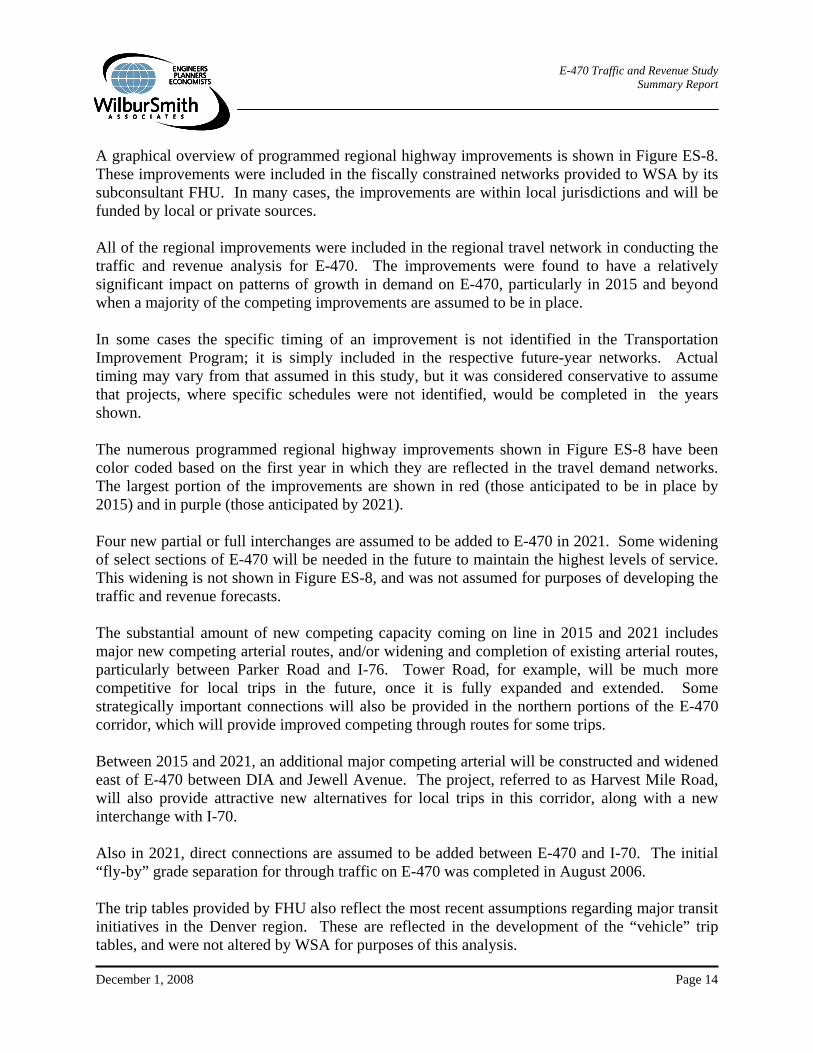
A graphical overview of programmed regional highway improvements is shown in Figure ES-8. These improvements were included in the fiscally constrained networks provided to WSA by its subconsultant FHU. In many cases, the improvements are within local jurisdictions and will be funded by local or private sources. All of the regional improvements were included in the regional travel network in conducting the traffic and revenue analysis for E-470. The improvements were found to have a relatively significant impact on patterns of growth in demand on E-470, particularly in 2015 and beyond when a majority of the competing improvements are assumed to be in place. In some cases the specific timing of an improvement is not identified in the Transportation Improvement Program; it is simply included in the respective future-year networks. Actual timing may vary from that assumed in this study, but it was considered conservative to assume that projects, where specific schedules were not identified, would be completed in the years shown. The numerous programmed regional highway improvements shown in Figure ES-8 have been color coded based on the first year in which they are reflected in the travel demand networks. The largest portion of the improvements are shown in red (those anticipated to be in place by 2015) and in purple (those anticipated by 2021). Four new partial or full interchanges are assumed to be added to E-470 in 2021. Some widening of select sections of E-470 will be needed in the future to maintain the highest levels of service. This widening is not shown in Figure ES-8, and was not assumed for purposes of developing the traffic and revenue forecasts. The substantial amount of new competing capacity coming on line in 2015 and 2021 includes major new competing arterial routes, and/or widening and completion of existing arterial routes, particularly between Parker Road and I-76. Tower Road, for example, will be much more competitive for local trips in the future, once it is fully expanded and extended. Some strategically important connections will also be provided in the northern portions of the E-470 corridor, which will provide improved competing through routes for some trips. Between 2015 and 2021, an additional major competing arterial will be constructed and widened east of E-470 between DIA and Jewell Avenue. The project, referred to as Harvest Mile Road, will also provide attractive new alternatives for local trips in this corridor, along with a new interchange with I-70. Also in 2021, direct connections are assumed to be added between E-470 and I-70. The initial “fly-by” grade separation for through traffic on E-470 was completed in August 2006. The trip tables provided by FHU also reflect the most recent assumptions regarding major transit initiatives in the Denver region. These are reflected in the development of the “vehicle” trip tables, and were not altered by WSA for purposes of this analysis.
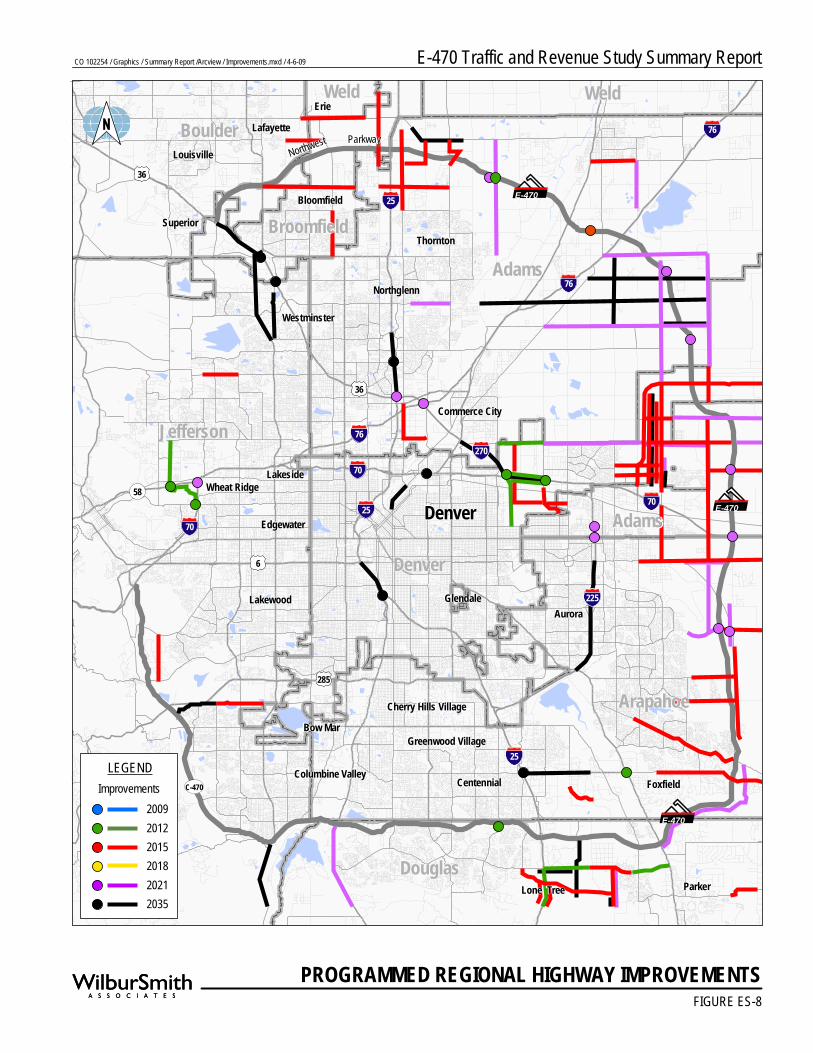
FIGURE ES-8
PROGRAMMED REGIONAL HIGHWAY IMPROVEMENTS
25 E-470
76
76
36
36
25
225
70
70
70
6
58
285
270
25
C-470
76
E-470
E-470
Foxfield
Lone Tree
Centennial
Greenwood Village
Cherry Hills VillageBow Mar
Columbine Valley
GlendaleAurora
Denver
Weld
Northwest Parkway
Edgewater
Lakewood
Wheat RidgeLakeside
Commerce City
Westminster
Northglenn
Thornton
Bloomfield
ErieLafayette
Louisville
Superior
Parker
Adams
Jefferson
Denver
Arapahoe
Douglas
BoulderWeld
Adams
Broomfield
Improvements200920122015201820212035
LEGEND
E-470 Traffic and Revenue Study Summary ReportCO 102254 / Graphics / Summary Report /Arcview / Improvements.mxd / 4-6-09
E-470 Traffic and Revenue Study Summary Report
December 1, 2008 Page 15
TOLL SENSITIVITY AND TOLL RATES
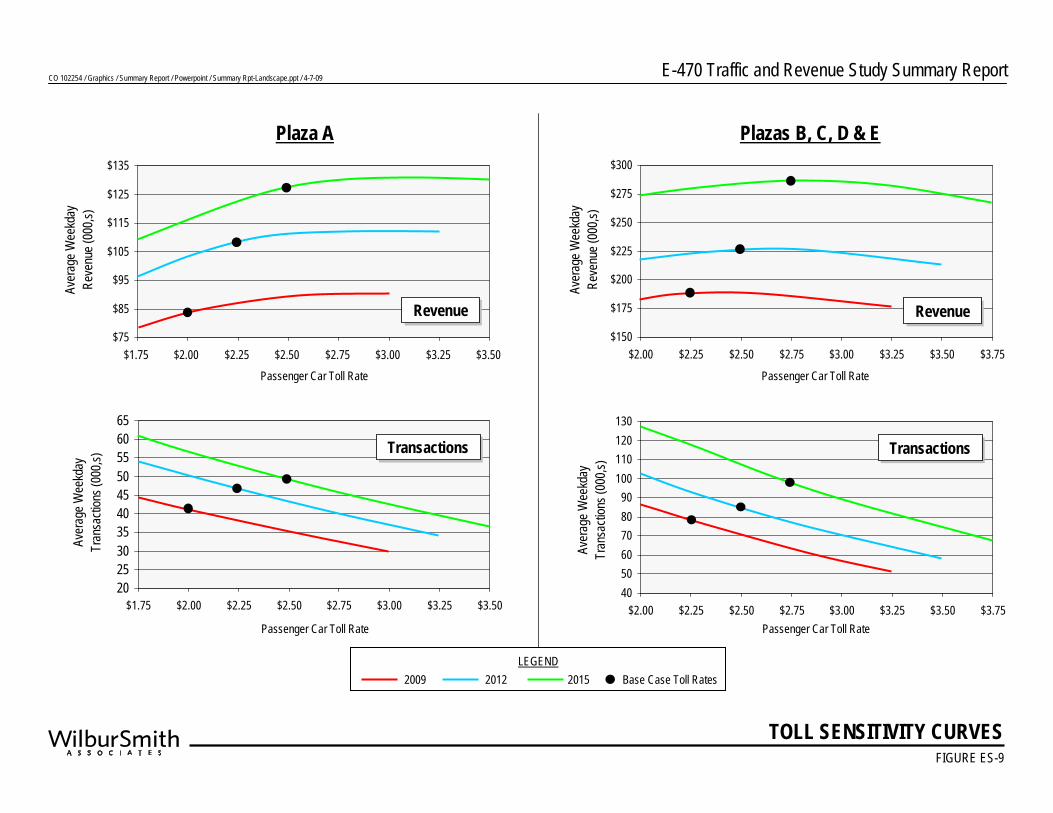
E-470 toll rates at mainline plazas are currently $2.00 for passenger cars, with the exception of Plaza A which has a passenger car toll of $1.75. Ramp plazas currently assess rates of $0.75. Over its relatively short history, the E-470 Public Highway Authority has increased toll rates generally every three years. The toll rate at Mainline Plaza A, for example, was $0.50 in 1995, and has been increased five times, most recently in 2006, to $1.75. Each of the increases has been in the amount of $0.25, and all toll rates have historically been rounded to the nearest $0.25 for ease of cash handling and transaction processing. TOLL SENSITIVITY Prior studies used in support of the current outstanding bonds on E-470 assumed the continuation of toll increases, generally every three years, into the future. For purposes of the Base Case and NST traffic and revenue forecasts in this study, WSA evaluated traffic and revenue potential under a range of alternative toll rates for 2009, 2012 and 2015 assignment years. In each case, toll rate increments of $0.25 higher at each of the mainline plazas were tested with proportional increases at ramp tolls as required. This was done to evaluate the relative toll elasticity against current rates and those proposed for the future to determine if past toll rate increase assumptions could be employed in this study, particularly for the NST scenario where video surcharges for LPT were likely. A summary of the toll sensitivity analysis is shown in Figure ES-9. Because of the differentials in current toll rates, curves are shown separately for Plaza A and for Plazas B, C, D and E combined. Curves show the impacts on average weekday transactions and toll revenue at progressively higher toll charges. Curves are provided for each of the years toll sensitivity was analyzed (2009, 2012 and 2015). The dots on each curve show the assumed toll rates in each of these future years used in the traffic and revenue analysis. The multi-year toll sensitivity analysis shows current tolls (slightly more than $0.21 per mile for through trips) are relatively high and there is a relatively high elasticity to future toll changes. Current toll rates are not yet at the peak of the revenue curve in any of the analysis years. However, toll sensitivity is not shown individually for Plazas B through E, Plaza C and to a slightly lesser degree, Plaza B, are very close to the peak at existing rates. This is probably due to both the relatively high existing toll rates and the availability of very proximate, parallel toll-free alternate rates (Picadilly Road, Tower Road and Gun Club Road) which generally operate at posted speeds most of the day. Finally, projected future rates are close to the maximum revenue points on the curve, and at Plaza C the programmed future rates are on the downside of the revenue curve. However, Plazas B, C, D and E combined do not exceed the revenue maximizing point on the curve. Between 2008 and 2021, five toll increases are currently planned, each nominally at $0.25. This reflects an annual rate adjustment of approximately 3.5 percent per annum, which is above the
CO 102254 / Graphics / Summary Report / Powerpoint / Summary Rpt-Landscape.ppt / 4-7-09 E-470 Traffic and Revenue Study Summary Report
TOLL SENSITIVITY CURVESFIGURE ES-9
Plaza A
Aver
age W
eekd
ayRe
venu
e (00
0,s)
$75
$85
$95
$105
$115
$125
$135
$1.75 $2.00 $2.25 $2.50 $2.75 $3.00 $3.25 $3.50
RevenueRevenue
20253035404550556065
$1.75 $2.00 $2.25 $2.50 $2.75 $3.00 $3.25 $3.50
Aver
age W
eekd
ay
Tran
sacti
ons (
000,s
) TransactionsTransactions
$150
$175
$200
$225
$250
$275
$300
$2.00 $2.25 $2.50 $2.75 $3.00 $3.25 $3.50 $3.75
Aver
age W
eekd
ayRe
venu
e (00
0,s)
405060708090
100110120130
$2.00 $2.25 $2.50 $2.75 $3.00 $3.25 $3.50 $3.75
Aver
age W
eekd
ay
Tran
sacti
ons (
000,s
)
RevenueRevenue
TransactionsTransactions
Plazas B, C, D & E
Base Case Toll Rates2009 2012 2015LEGEND
Passenger Car Toll Rate
Passenger Car Toll Rate
Passenger Car Toll Rate
Passenger Car Toll Rate
E-470 Traffic and Revenue Study Summary Report
December 1, 2008 Page 16
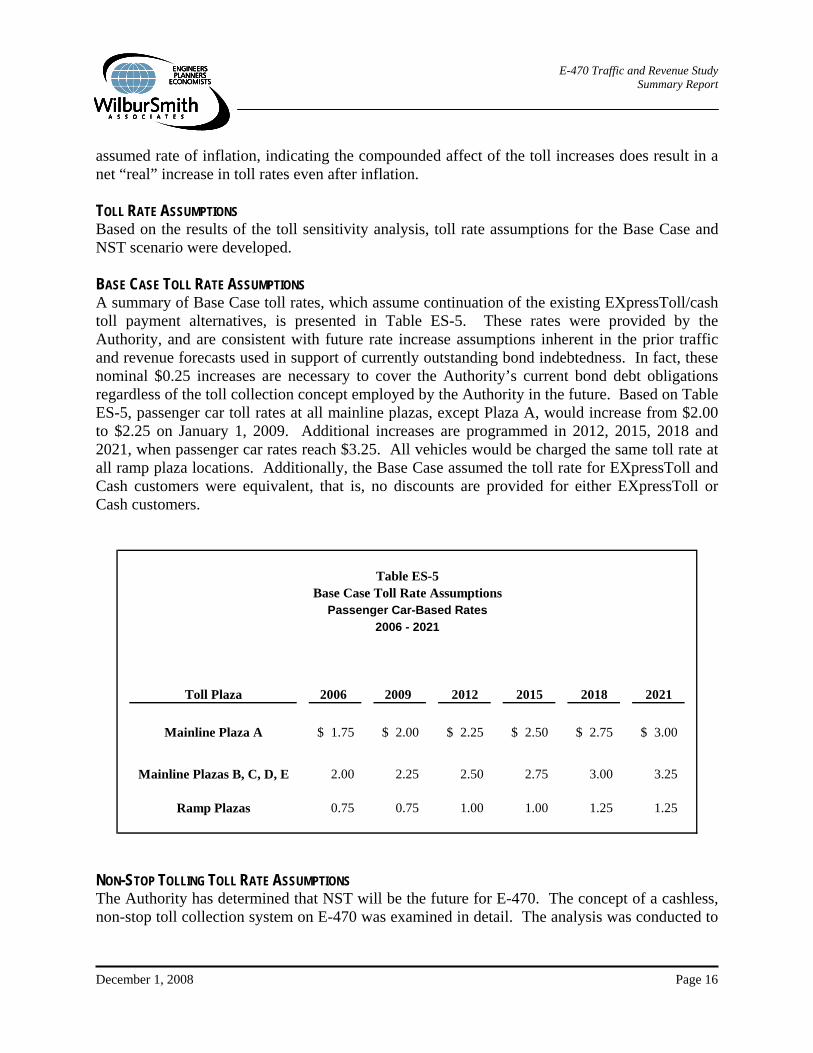
assumed rate of inflation, indicating the compounded affect of the toll increases does result in a net “real” increase in toll rates even after inflation. TOLL RATE ASSUMPTIONS Based on the results of the toll sensitivity analysis, toll rate assumptions for the Base Case and NST scenario were developed. BASE CASE TOLL RATE ASSUMPTIONS A summary of Base Case toll rates, which assume continuation of the existing EXpressToll/cash toll payment alternatives, is presented in Table ES-5. These rates were provided by the Authority, and are consistent with future rate increase assumptions inherent in the prior traffic and revenue forecasts used in support of currently outstanding bond indebtedness. In fact, these nominal $0.25 increases are necessary to cover the Authority’s current bond debt obligations regardless of the toll collection concept employed by the Authority in the future. Based on Table ES-5, passenger car toll rates at all mainline plazas, except Plaza A, would increase from $2.00 to $2.25 on January 1, 2009. Additional increases are programmed in 2012, 2015, 2018 and 2021, when passenger car rates reach $3.25. All vehicles would be charged the same toll rate at all ramp plaza locations. Additionally, the Base Case assumed the toll rate for EXpressToll and Cash customers were equivalent, that is, no discounts are provided for either EXpressToll or Cash customers.
Table ES-5Base Case Toll Rate Assumptions
Passenger Car-Based Rates2006 - 2021
Toll Plaza 2006 2009 2012 2015 2018 2021
Mainline Plaza A 1.75$ 2.00$ 2.25$ 2.50$ 2.75$ 3.00$
Mainline Plazas B, C, D, E 2.00 2.25 2.50 2.75 3.00 3.25
Ramp Plazas 0.75 0.75 1.00 1.00 1.25 1.25
NON-STOP TOLLING TOLL RATE ASSUMPTIONS The Authority has determined that NST will be the future for E-470. The concept of a cashless, non-stop toll collection system on E-470 was examined in detail. The analysis was conducted to
E-470 Traffic and Revenue Study Summary Report
December 1, 2008 Page 17
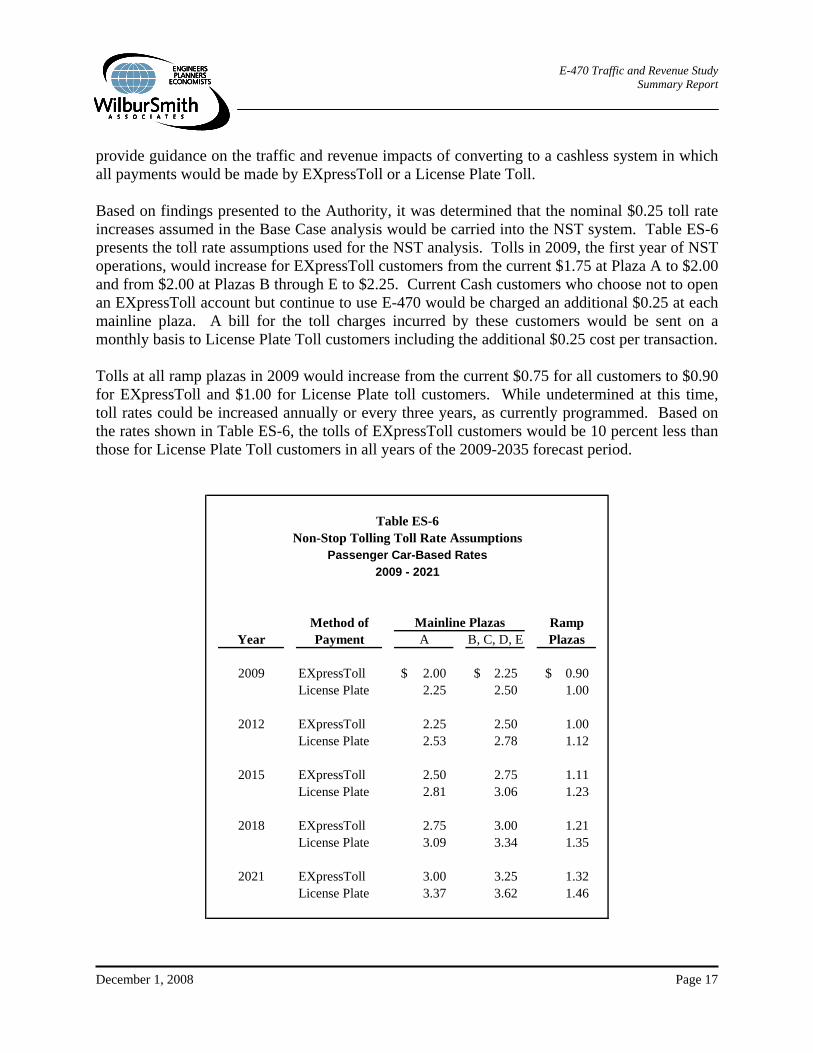
provide guidance on the traffic and revenue impacts of converting to a cashless system in which all payments would be made by EXpressToll or a License Plate Toll. Based on findings presented to the Authority, it was determined that the nominal $0.25 toll rate increases assumed in the Base Case analysis would be carried into the NST system. Table ES-6 presents the toll rate assumptions used for the NST analysis. Tolls in 2009, the first year of NST operations, would increase for EXpressToll customers from the current $1.75 at Plaza A to $2.00 and from $2.00 at Plazas B through E to $2.25. Current Cash customers who choose not to open an EXpressToll account but continue to use E-470 would be charged an additional $0.25 at each mainline plaza. A bill for the toll charges incurred by these customers would be sent on a monthly basis to License Plate Toll customers including the additional $0.25 cost per transaction. Tolls at all ramp plazas in 2009 would increase from the current $0.75 for all customers to $0.90 for EXpressToll and $1.00 for License Plate toll customers. While undetermined at this time, toll rates could be increased annually or every three years, as currently programmed. Based on the rates shown in Table ES-6, the tolls of EXpressToll customers would be 10 percent less than those for License Plate Toll customers in all years of the 2009-2035 forecast period.
Table ES-6Non-Stop Tolling Toll Rate Assumptions
Passenger Car-Based Rates2009 - 2021
Mainline PlazasYear A B, C, D, E
2009 EXpressToll 2.00$ 2.25$ 0.90$ License Plate 2.25 2.50 1.00
2012 EXpressToll 2.25 2.50 1.00 License Plate 2.53 2.78 1.12
2015 EXpressToll 2.50 2.75 1.11 License Plate 2.81 3.06 1.23
2018 EXpressToll 2.75 3.00 1.21 License Plate 3.09 3.34 1.35
2021 EXpressToll 3.00 3.25 1.32 License Plate 3.37 3.62 1.46
Method of Payment
Ramp Plazas
E-470 Traffic and Revenue Study Summary Report
December 1, 2008 Page 18
Toll rates for commercial vehicles at mainline plazas are assumed to be proportionally higher based on vehicle size.
ESTIMATED TRAFFIC AND REVENUE
The traffic forecasting analysis for this study involved two steps: Develop a 2007 base year regional travel demand model based on the DRCOG regional
travel demand model that was calibrated against traffic counts on the E-470 mainline and ramps; and
Develop 2009, 2012, 2015, 2018, 2021, and 2035 trip tables resulting from the changes in socioeconomic data and highway networks input into the regional travel model.
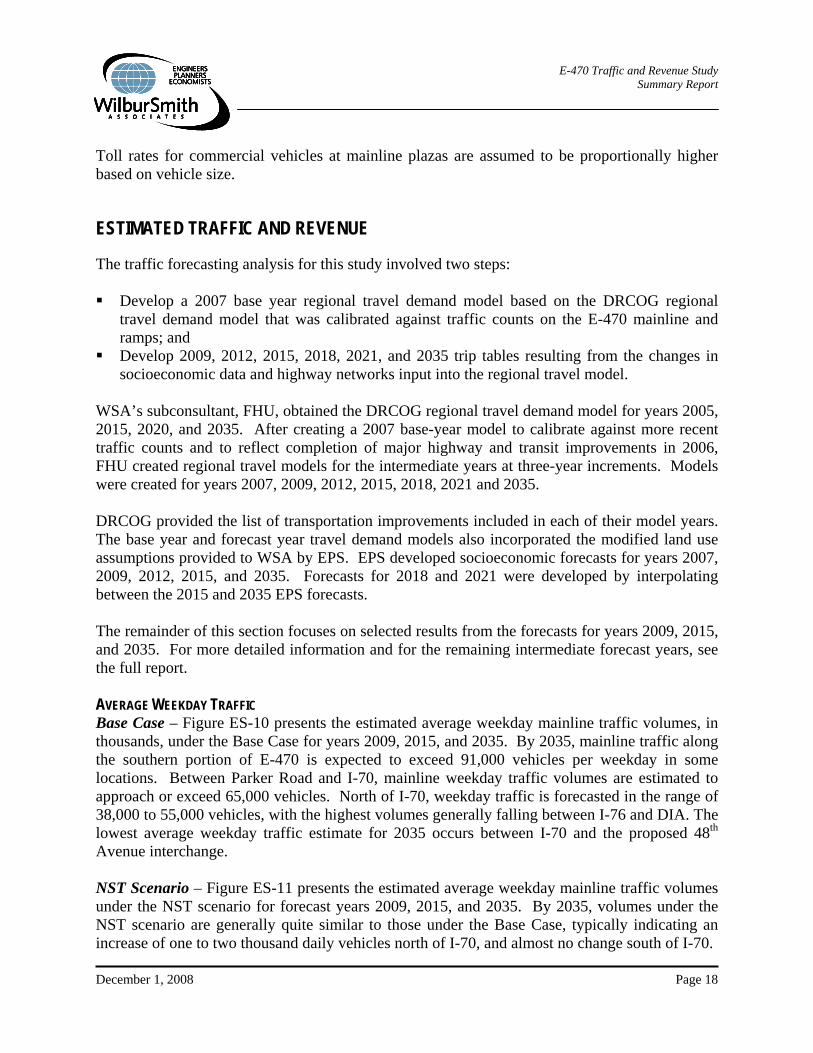
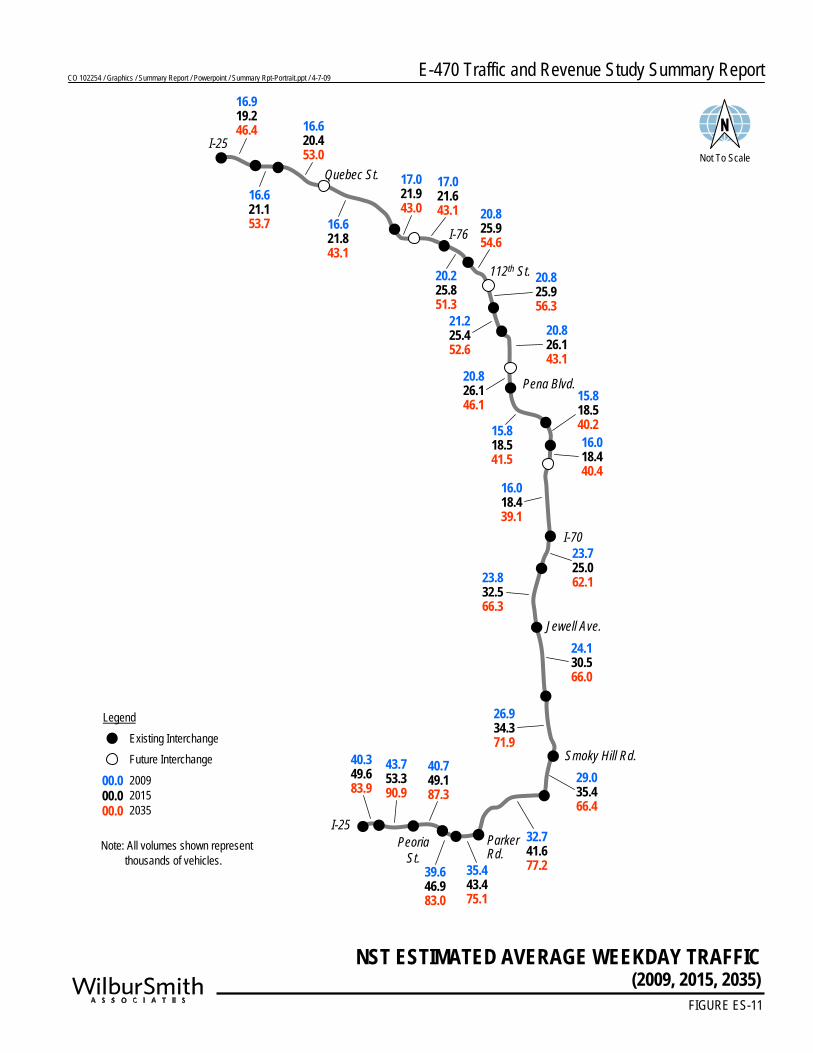
WSA’s subconsultant, FHU, obtained the DRCOG regional travel demand model for years 2005, 2015, 2020, and 2035. After creating a 2007 base-year model to calibrate against more recent traffic counts and to reflect completion of major highway and transit improvements in 2006, FHU created regional travel models for the intermediate years at three-year increments. Models were created for years 2007, 2009, 2012, 2015, 2018, 2021 and 2035. DRCOG provided the list of transportation improvements included in each of their model years. The base year and forecast year travel demand models also incorporated the modified land use assumptions provided to WSA by EPS. EPS developed socioeconomic forecasts for years 2007, 2009, 2012, 2015, and 2035. Forecasts for 2018 and 2021 were developed by interpolating between the 2015 and 2035 EPS forecasts. The remainder of this section focuses on selected results from the forecasts for years 2009, 2015, and 2035. For more detailed information and for the remaining intermediate forecast years, see the full report. AVERAGE WEEKDAY TRAFFIC Base Case – Figure ES-10 presents the estimated average weekday mainline traffic volumes, in thousands, under the Base Case for years 2009, 2015, and 2035. By 2035, mainline traffic along the southern portion of E-470 is expected to exceed 91,000 vehicles per weekday in some locations. Between Parker Road and I-70, mainline weekday traffic volumes are estimated to approach or exceed 65,000 vehicles. North of I-70, weekday traffic is forecasted in the range of 38,000 to 55,000 vehicles, with the highest volumes generally falling between I-76 and DIA. The lowest average weekday traffic estimate for 2035 occurs between I-70 and the proposed 48th Avenue interchange. NST Scenario – Figure ES-11 presents the estimated average weekday mainline traffic volumes under the NST scenario for forecast years 2009, 2015, and 2035. By 2035, volumes under the NST scenario are generally quite similar to those under the Base Case, typically indicating an increase of one to two thousand daily vehicles north of I-70, and almost no change south of I-70.
E-470 Traffic and Revenue Study Summary ReportCO 102254 / Graphics / Summary Report / Powerpoint / Summary Rpt-Portrait.ppt / 4-7-09
BASE CASE ESTIMATED AVERAGE WEEKDAY TRAFFIC(2009, 2015, 2035)
FIGURE ES-10
Existing InterchangeFuture Interchange
Legend
Quebec St.
I-76
112th St.
Pena Blvd.
I-70
Jewell Ave.
Smoky Hill Rd.
Parker Rd.
Peoria St.
I-25
I-25
00.000.000.0
200920152035
Note: All volumes shown representthousands of vehicles.
17.119.544.9
16.821.552.8
16.820.752.1
16.822.142.1
17.322.342.1
17.322.041.9
20.626.250.2
21.226.353.7
21.226.355.2
21.625.751.7
21.226.442.6
21.226.445.5 16.1
18.838.816.318.839.0
16.318.837.7
16.118.840.0
24.125.561.224.2
33.065.8
24.430.965.8
27.434.971.8
29.736.066.2
33.642.477.136.1
44.175.0
40.247.682.9
41.349.787.1
44.554.191.0
41.050.384.2
Not To Scale
E-470 Traffic and Revenue Study Summary ReportCO 102254 / Graphics / Summary Report / Powerpoint / Summary Rpt-Portrait.ppt / 4-7-09
NST ESTIMATED AVERAGE WEEKDAY TRAFFIC(2009, 2015, 2035)
FIGURE ES-11
Existing InterchangeFuture Interchange
Legend
Quebec St.
I-76
112th St.
Pena Blvd.
I-70
Jewell Ave.
Smoky Hill Rd.
Parker Rd.
Peoria St.
I-25
I-25
00.000.000.0
200920152035
Note: All volumes shown representthousands of vehicles.
16.919.246.4
16.621.153.7
16.620.453.0
16.621.843.1
17.021.943.0
17.021.643.1
20.225.851.3
20.825.954.6
20.825.956.3
21.225.452.6
20.826.143.1
20.826.146.1 15.8
18.540.216.018.440.4
16.018.439.1
15.818.541.5
23.725.062.123.8
32.566.3
24.130.566.0
26.934.371.9
29.035.466.4
32.741.677.235.4
43.475.1
39.646.983.0
40.749.187.3
43.753.390.9
40.349.683.9
Not To Scale
E-470 Traffic and Revenue Study Summary Report
December 1, 2008 Page 19
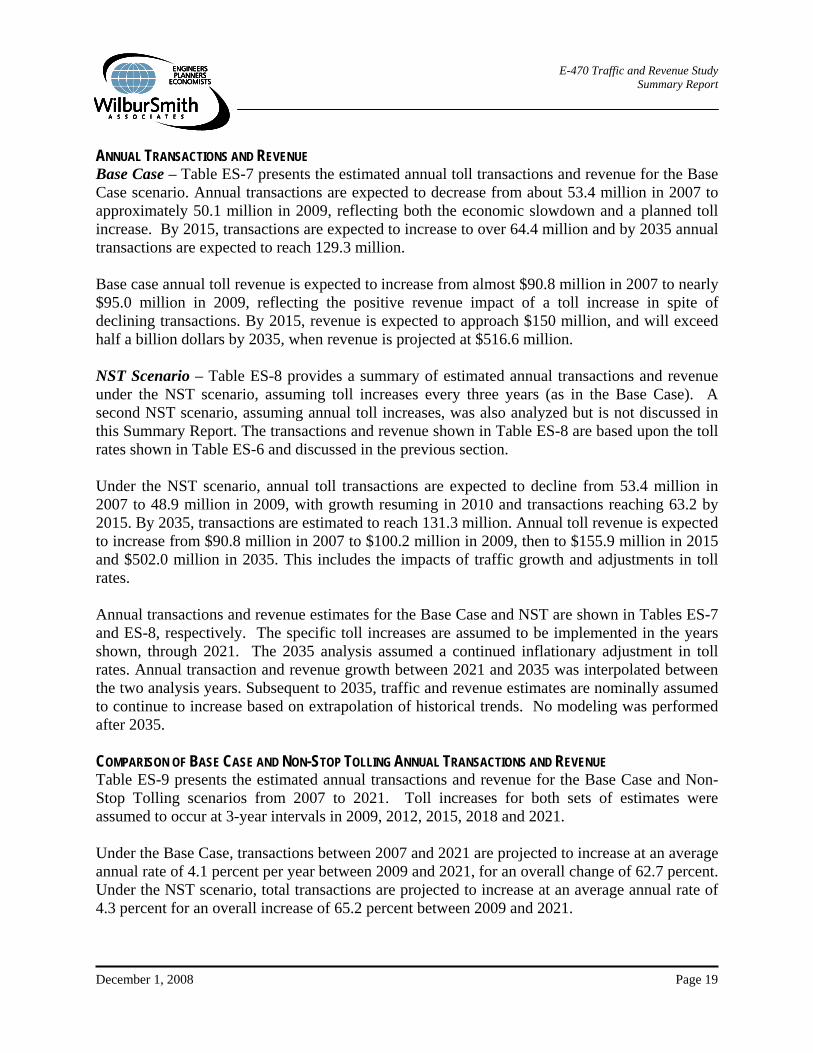
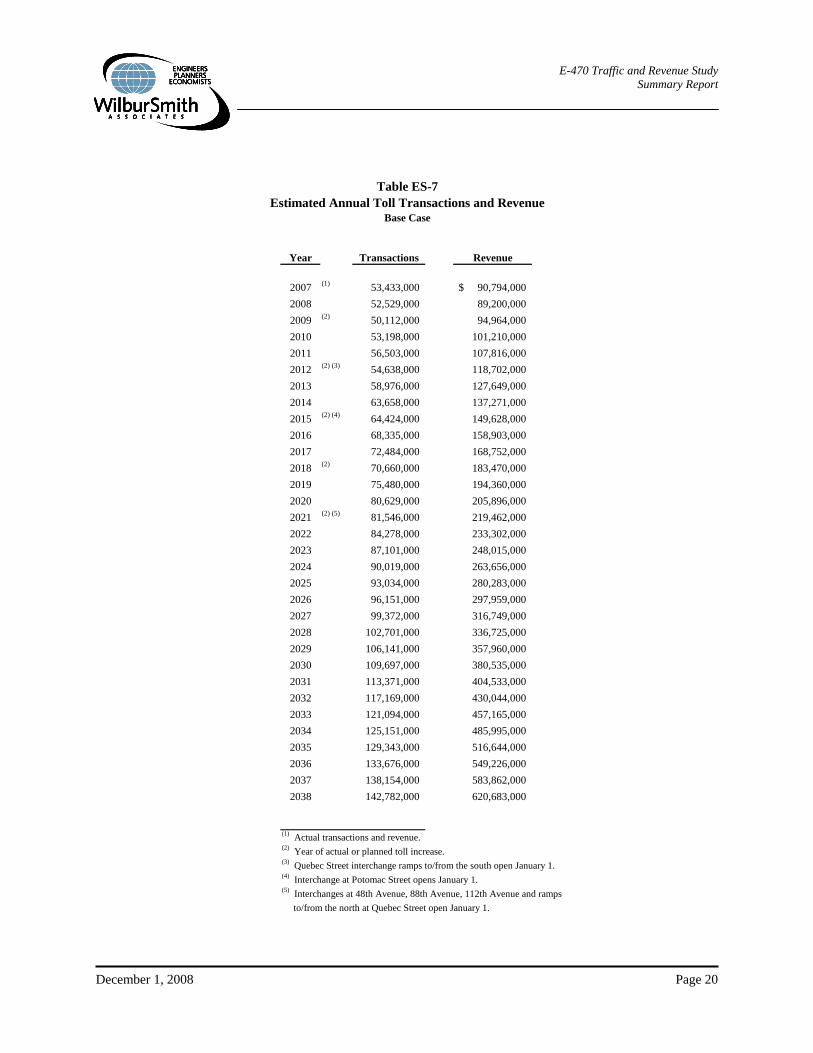
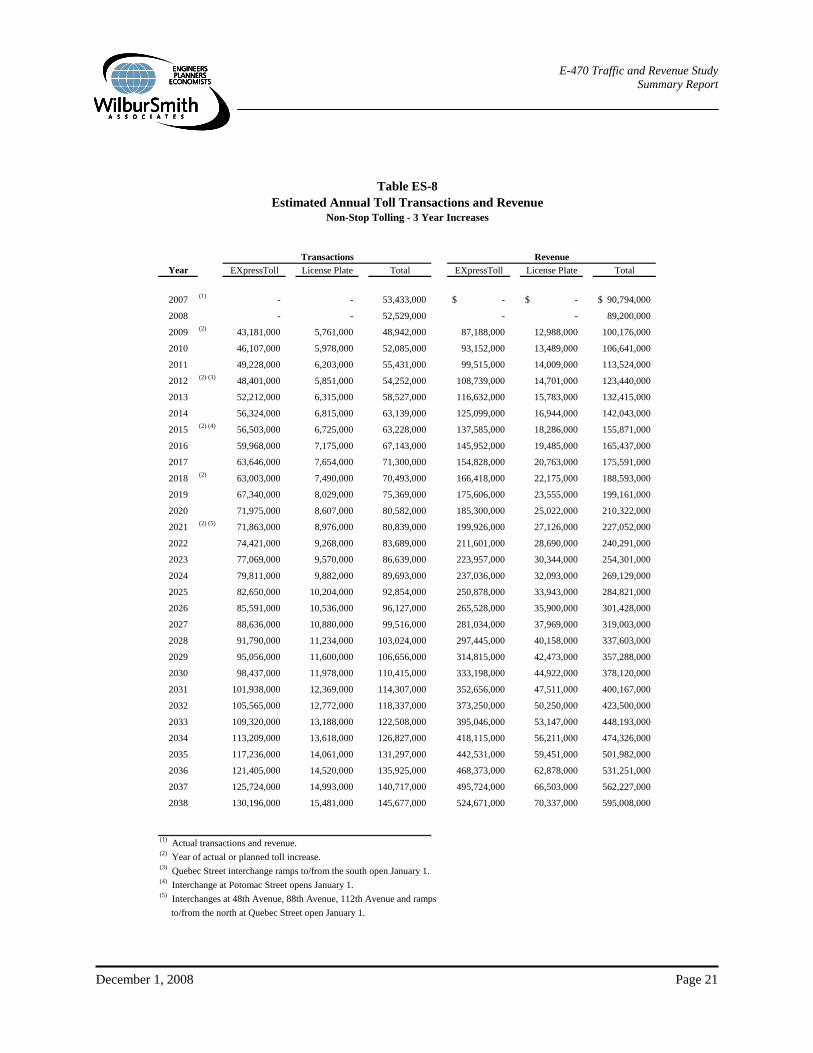
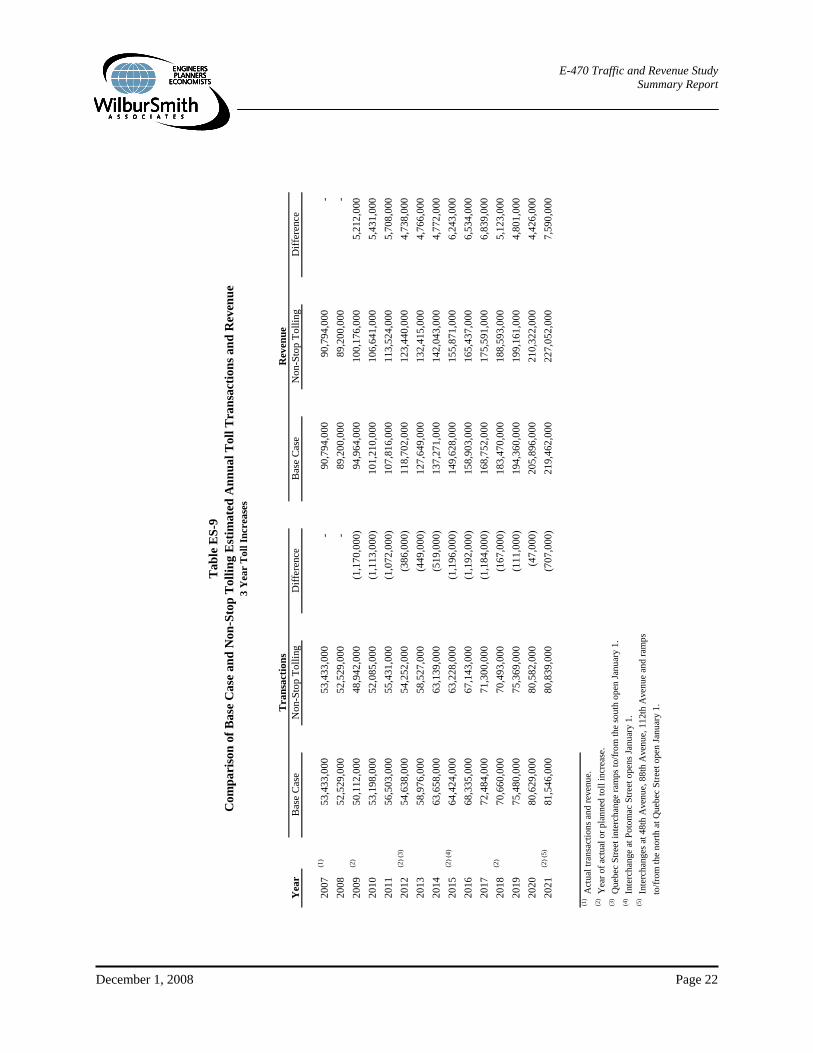
ANNUAL TRANSACTIONS AND REVENUE Base Case – Table ES-7 presents the estimated annual toll transactions and revenue for the Base Case scenario. Annual transactions are expected to decrease from about 53.4 million in 2007 to approximately 50.1 million in 2009, reflecting both the economic slowdown and a planned toll increase. By 2015, transactions are expected to increase to over 64.4 million and by 2035 annual transactions are expected to reach 129.3 million. Base case annual toll revenue is expected to increase from almost $90.8 million in 2007 to nearly $95.0 million in 2009, reflecting the positive revenue impact of a toll increase in spite of declining transactions. By 2015, revenue is expected to approach $150 million, and will exceed half a billion dollars by 2035, when revenue is projected at $516.6 million. NST Scenario – Table ES-8 provides a summary of estimated annual transactions and revenue under the NST scenario, assuming toll increases every three years (as in the Base Case). A second NST scenario, assuming annual toll increases, was also analyzed but is not discussed in this Summary Report. The transactions and revenue shown in Table ES-8 are based upon the toll rates shown in Table ES-6 and discussed in the previous section. Under the NST scenario, annual toll transactions are expected to decline from 53.4 million in 2007 to 48.9 million in 2009, with growth resuming in 2010 and transactions reaching 63.2 by 2015. By 2035, transactions are estimated to reach 131.3 million. Annual toll revenue is expected to increase from $90.8 million in 2007 to $100.2 million in 2009, then to $155.9 million in 2015 and $502.0 million in 2035. This includes the impacts of traffic growth and adjustments in toll rates. Annual transactions and revenue estimates for the Base Case and NST are shown in Tables ES-7 and ES-8, respectively. The specific toll increases are assumed to be implemented in the years shown, through 2021. The 2035 analysis assumed a continued inflationary adjustment in toll rates. Annual transaction and revenue growth between 2021 and 2035 was interpolated between the two analysis years. Subsequent to 2035, traffic and revenue estimates are nominally assumed to continue to increase based on extrapolation of historical trends. No modeling was performed after 2035. COMPARISON OF BASE CASE AND NON-STOP TOLLING ANNUAL TRANSACTIONS AND REVENUE Table ES-9 presents the estimated annual transactions and revenue for the Base Case and Non-Stop Tolling scenarios from 2007 to 2021. Toll increases for both sets of estimates were assumed to occur at 3-year intervals in 2009, 2012, 2015, 2018 and 2021. Under the Base Case, transactions between 2007 and 2021 are projected to increase at an average annual rate of 4.1 percent per year between 2009 and 2021, for an overall change of 62.7 percent. Under the NST scenario, total transactions are projected to increase at an average annual rate of 4.3 percent for an overall increase of 65.2 percent between 2009 and 2021.
E-470 Traffic and Revenue Study Summary Report
December 1, 2008 Page 20
Table ES-7Estimated Annual Toll Transactions and Revenue
Base Case
Year Transactions Revenue
2007 (1) 53,433,000 90,794,000$ 2008 52,529,000 89,200,000 2009 (2) 50,112,000 94,964,000 2010 53,198,000 101,210,000 2011 56,503,000 107,816,000 2012 (2) (3) 54,638,000 118,702,000 2013 58,976,000 127,649,000 2014 63,658,000 137,271,000 2015 (2) (4) 64,424,000 149,628,000 2016 68,335,000 158,903,000 2017 72,484,000 168,752,000 2018 (2) 70,660,000 183,470,000 2019 75,480,000 194,360,000 2020 80,629,000 205,896,000 2021 (2) (5) 81,546,000 219,462,000 2022 84,278,000 233,302,000 2023 87,101,000 248,015,000 2024 90,019,000 263,656,000 2025 93,034,000 280,283,000 2026 96,151,000 297,959,000 2027 99,372,000 316,749,000 2028 102,701,000 336,725,000 2029 106,141,000 357,960,000 2030 109,697,000 380,535,000 2031 113,371,000 404,533,000 2032 117,169,000 430,044,000 2033 121,094,000 457,165,000 2034 125,151,000 485,995,000 2035 129,343,000 516,644,000 2036 133,676,000 549,226,000 2037 138,154,000 583,862,000 2038 142,782,000 620,683,000
(1) Actual transactions and revenue.(2) Year of actual or planned toll increase.(3) Quebec Street interchange ramps to/from the south open January 1.(4) Interchange at Potomac Street opens January 1.(5) Interchanges at 48th Avenue, 88th Avenue, 112th Avenue and ramps to/from the north at Quebec Street open January 1.
E-470 Traffic and Revenue Study Summary Report
December 1, 2008 Page 21
Table ES-8Estimated Annual Toll Transactions and Revenue
Non-Stop Tolling - 3 Year Increases
Transactions RevenueYear EXpressToll License Plate Total EXpressToll License Plate Total
2007 (1) - - 53,433,000 -$ -$ 90,794,000$
2008 - - 52,529,000 - - 89,200,000
2009 (2) 43,181,000 5,761,000 48,942,000 87,188,000 12,988,000 100,176,000
2010 46,107,000 5,978,000 52,085,000 93,152,000 13,489,000 106,641,000
2011 49,228,000 6,203,000 55,431,000 99,515,000 14,009,000 113,524,000
2012 (2) (3) 48,401,000 5,851,000 54,252,000 108,739,000 14,701,000 123,440,000
2013 52,212,000 6,315,000 58,527,000 116,632,000 15,783,000 132,415,000
2014 56,324,000 6,815,000 63,139,000 125,099,000 16,944,000 142,043,000
2015 (2) (4) 56,503,000 6,725,000 63,228,000 137,585,000 18,286,000 155,871,000
2016 59,968,000 7,175,000 67,143,000 145,952,000 19,485,000 165,437,000
2017 63,646,000 7,654,000 71,300,000 154,828,000 20,763,000 175,591,000
2018 (2) 63,003,000 7,490,000 70,493,000 166,418,000 22,175,000 188,593,000
2019 67,340,000 8,029,000 75,369,000 175,606,000 23,555,000 199,161,000
2020 71,975,000 8,607,000 80,582,000 185,300,000 25,022,000 210,322,000
2021 (2) (5) 71,863,000 8,976,000 80,839,000 199,926,000 27,126,000 227,052,000
2022 74,421,000 9,268,000 83,689,000 211,601,000 28,690,000 240,291,000
2023 77,069,000 9,570,000 86,639,000 223,957,000 30,344,000 254,301,000
2024 79,811,000 9,882,000 89,693,000 237,036,000 32,093,000 269,129,000
2025 82,650,000 10,204,000 92,854,000 250,878,000 33,943,000 284,821,000
2026 85,591,000 10,536,000 96,127,000 265,528,000 35,900,000 301,428,000
2027 88,636,000 10,880,000 99,516,000 281,034,000 37,969,000 319,003,000
2028 91,790,000 11,234,000 103,024,000 297,445,000 40,158,000 337,603,000
2029 95,056,000 11,600,000 106,656,000 314,815,000 42,473,000 357,288,000
2030 98,437,000 11,978,000 110,415,000 333,198,000 44,922,000 378,120,000
2031 101,938,000 12,369,000 114,307,000 352,656,000 47,511,000 400,167,000
2032 105,565,000 12,772,000 118,337,000 373,250,000 50,250,000 423,500,000
2033 109,320,000 13,188,000 122,508,000 395,046,000 53,147,000 448,193,000
2034 113,209,000 13,618,000 126,827,000 418,115,000 56,211,000 474,326,000
2035 117,236,000 14,061,000 131,297,000 442,531,000 59,451,000 501,982,000
2036 121,405,000 14,520,000 135,925,000 468,373,000 62,878,000 531,251,000
2037 125,724,000 14,993,000 140,717,000 495,724,000 66,503,000 562,227,000
2038 130,196,000 15,481,000 145,677,000 524,671,000 70,337,000 595,008,000
(1) Actual transactions and revenue.(2) Year of actual or planned toll increase.(3) Quebec Street interchange ramps to/from the south open January 1.(4) Interchange at Potomac Street opens January 1.(5) Interchanges at 48th Avenue, 88th Avenue, 112th Avenue and ramps to/from the north at Quebec Street open January 1.
E-470 Traffic and Revenue Study Summary Report
December 1, 2008 Page 22
Tab
le E
S-9
Com
pari
son
of B
ase
Cas
e an
d N
on-S
top
Tol
ling
Est
imat
ed A
nnua
l Tol
l Tra
nsac
tions
and
Rev
enue
3 Y
ear
Tol
l Inc
reas
es
Yea
rB
ase
Cas
eN
on-S
top
Tolli
ngD
iffer
ence
Bas
e C
ase
Non
-Sto
p To
lling
Diff
eren
ce
2007
(1)
53,4
33,0
00
53
,433
,000
-
90
,794
,000
90,7
94,0
00
-
2008
52,5
29,0
00
52
,529
,000
-
89
,200
,000
89,2
00,0
00
-
2009
(2)
50,1
12,0
00
48
,942
,000
(1,1
70,0
00)
94,9
64,0
00
10
0,17
6,00
0
5,21
2,00
0
2010
53,1
98,0
00
52
,085
,000
(1,1
13,0
00)
101,
210,
000
10
6,64
1,00
0
5,43
1,00
0
2011
56,5
03,0
00
55
,431
,000
(1,0
72,0
00)
107,
816,
000
11
3,52
4,00
0
5,70
8,00
0
2012
(2) (
3)54
,638
,000
54,2
52,0
00
(3
86,0
00)
11
8,70
2,00
0
123,
440,
000
4,
738,
000
20
1358
,976
,000
58,5
27,0
00
(4
49,0
00)
12
7,64
9,00
0
132,
415,
000
4,
766,
000
20
1463
,658
,000
63,1
39,0
00
(5
19,0
00)
13
7,27
1,00
0
142,
043,
000
4,
772,
000
20
15(2
) (4)
64,4
24,0
00
63
,228
,000
(1,1
96,0
00)
149,
628,
000
15
5,87
1,00
0
6,24
3,00
0
2016
68,3
35,0
00
67
,143
,000
(1,1
92,0
00)
158,
903,
000
16
5,43
7,00
0
6,53
4,00
0
2017
72,4
84,0
00
71
,300
,000
(1,1
84,0
00)
168,
752,
000
17
5,59
1,00
0
6,83
9,00
0
2018
(2)
70,6
60,0
00
70
,493
,000
(167
,000
)
183,
470,
000
18
8,59
3,00
0
5,12
3,00
0
2019
75,4
80,0
00
75
,369
,000
(111
,000
)
194,
360,
000
19
9,16
1,00
0
4,80
1,00
0
2020
80,6
29,0
00
80
,582
,000
(47,
000)
205,
896,
000
21
0,32
2,00
0
4,42
6,00
0
2021
(2) (
5)81
,546
,000
80,8
39,0
00
(7
07,0
00)
21
9,46
2,00
0
227,
052,
000
7,
590,
000
(1) A
ctua
l tra
nsac
tions
and
reve
nue.
(2) Y
ear o
f act
ual o
r pla
nned
toll
incr
ease
.(3
) Que
bec
Stre
et in
terc
hang
e ra
mps
to/fr
om th
e so
uth
open
Janu
ary
1.(4
) Int
erch
ange
at P
otom
ac S
treet
ope
ns Ja
nuar
y 1.
(5) I
nter
chan
ges a
t 48t
h A
venu
e, 8
8th
Ave
nue,
112
th A
venu
e an
d ra
mps
to/fr
om th
e no
rth a
t Que
bec
Stre
et o
pen
Janu
ary
1.Tra
nsac
tions
Rev
enue
E-470 Traffic and Revenue Study Summary Report
December 1, 2008 Page 23
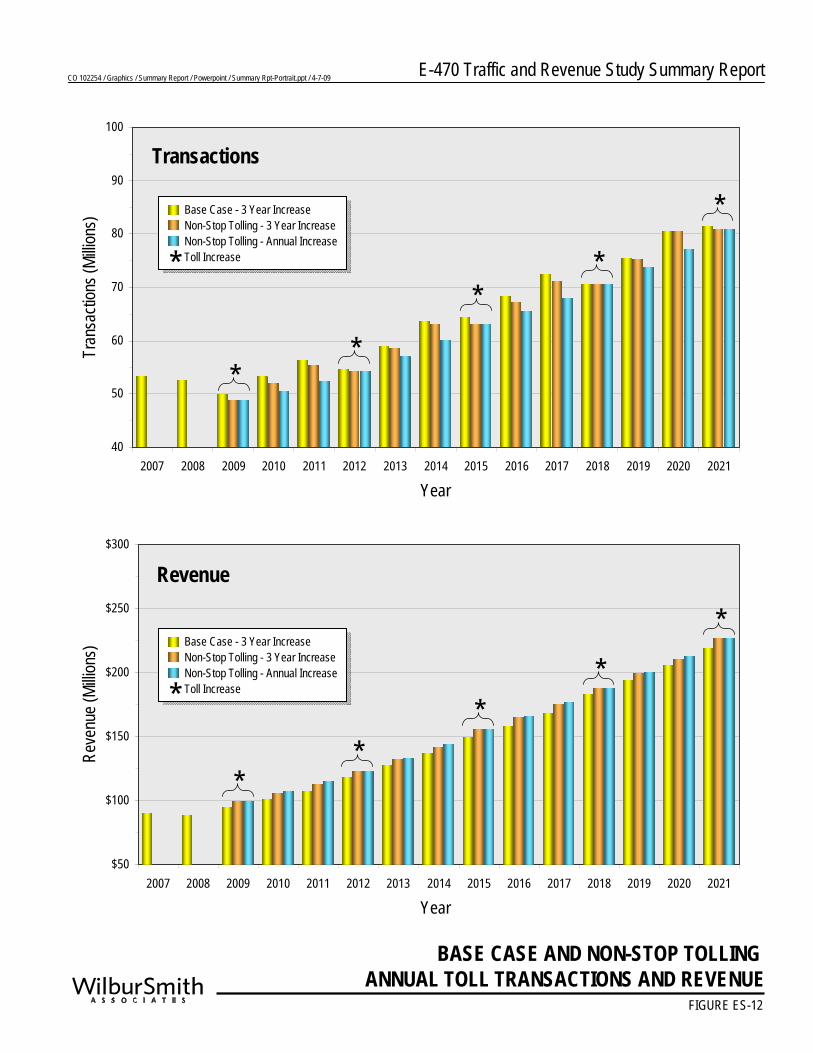
As a result of the surcharge imposed on license plate customers, some will divert to non-tolled parallel routes under the NST scenario, resulting in fewer total transactions than under the Base Case. This discrepancy peaks at nearly 1.2 million transactions in 2015, when a number of new competing routes are expected to come online. Under the Base Case, revenue is projected to increase at an average annual rate of 7.2 percent per year between 2009 and 2021, for a total increase of 131.1 percent, while NST revenue is projected to increase at 7.1 percent annually over the same period, for a total increase of 126.7 percent. However, while the annual rate of revenue growth under NST is comparable to the Base Case, NST is estimated to generate between $4.7 million to $7.6 million more revenue annually during the 2009 to 2021 forecast period shown in Table ES-9. Figure ES-12 compares the changes in annual transactions and revenue from 2007 to 2021 for three scenarios: the Base Case, NST with toll increases every three years, and NST with annual toll increases. For further discussion of the NST annual increase scenario, see Chapter 5 of the full report.
E-470 FUTURE WIDENING REQUIREMENTS
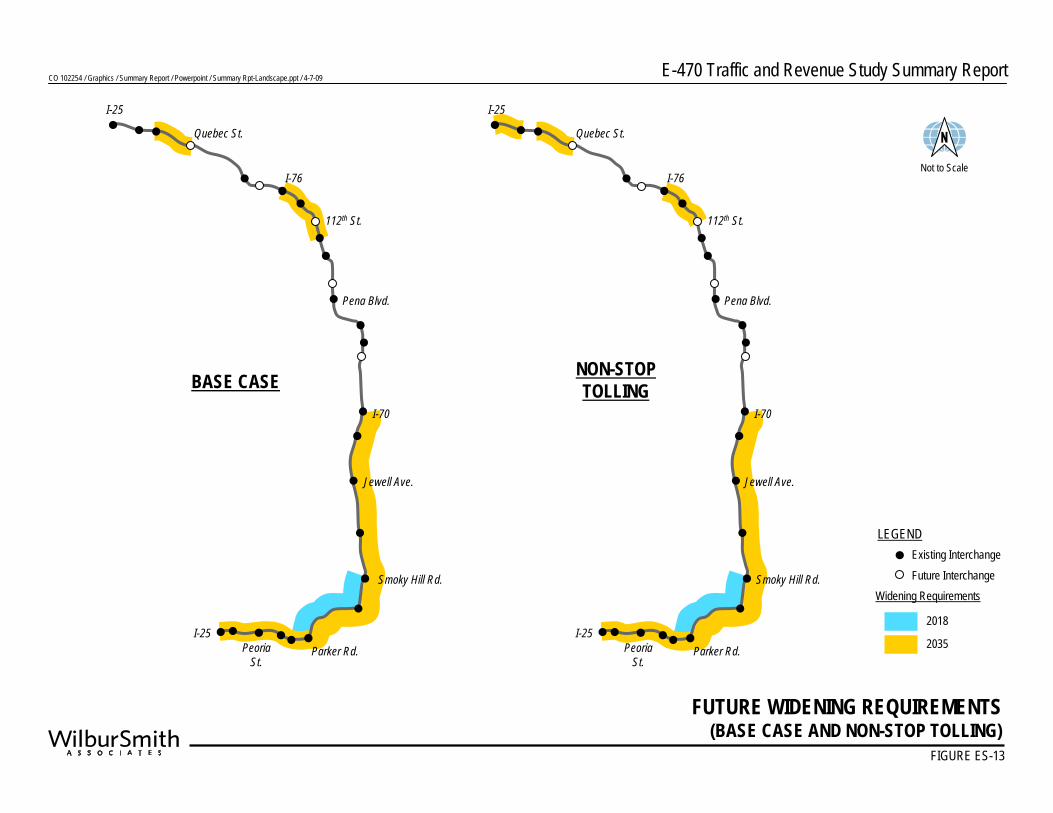
Two future-year mainline level-of-service (LOS) analyses, along with recommendations for future lane requirements for the Authority to maintain a Level of Service (LOS) C on E-470 were analyzed. The first LOS analysis was based on the results of the Base Case model results which reflect high levels of toll sensitivity, essentially constraining future traffic volumes based on the compounding effects of the large number of toll increases assumed over the forecast period. The second LOS analysis performed was based on traffic volumes associated with the NST scenario and which are generally slightly lower due to higher levels of traffic diversion from the non-EXpressToll portions of the total traffic potential to E-470. FHU performed a level of service (LOS) analysis using the Base Case and NST traffic and revenue forecasts, together with hourly traffic variations and other elements of the current traffic profile developed as part of this study. Figure ES-13 provides a graphic comparison of general future widening requirements for both the Base Case and NST scenarios. These future widening projects assume that the Authority will want to maintain a high level of service, generally characterized by a threshold of LOS C and D. This is a slightly higher performance level threshold than many urban freeway facilities are able to maintain; however, this is appropriate given the fact that E-470 is a toll road and is expected to provide its customers with improved operating conditions. BASE CASE WIDENING REQUIREMENTS In the Base Case, widening is expected to be needed beginning in 2018, with the segment between Smoky Hill Road and Parker Road. By 2035 improvements will need to be made to several segments along the E-470 corridor. Most of the toll road segments from I-70 to I-25 on
E-470 Traffic and Revenue Study Summary ReportCO 102254 / Graphics / Summary Report / Powerpoint / Summary Rpt-Portrait.ppt / 4-7-09
BASE CASE AND NON-STOP TOLLING ANNUAL TOLL TRANSACTIONS AND REVENUE
FIGURE ES-12
40
50
60
70
80
90
100
2007 2008 2009 2010 2011 2012 2013 2014 2015 2016 2017 2018 2019 2020 2021
Tran
sacti
ons (
Millio
ns)
Year
$50
$100
$150
$200
$250
$300
2007 2008 2009 2010 2011 2012 2013 2014 2015 2016 2017 2018 2019 2020 2021
Reve
nue (
Millio
ns)
Year
Transactions
Revenue
**
**
Base Case - 3 Year IncreaseNon-Stop Tolling - 3 Year IncreaseNon-Stop Tolling - Annual IncreaseToll Increase*
*
**
**
*
Base Case - 3 Year IncreaseNon-Stop Tolling - 3 Year IncreaseNon-Stop Tolling - Annual IncreaseToll Increase*
CO 102254 / Graphics / Summary Report / Powerpoint / Summary Rpt-Landscape.ppt / 4-7-09 E-470 Traffic and Revenue Study Summary Report
Quebec St.
I-25
I-76
112th St.
Pena Blvd.
I-70
Jewell Ave.
Smoky Hill Rd.
Parker Rd.Peoria St.
I-25
BASE CASE
Quebec St.
I-25
I-76
112th St.
Pena Blvd.
I-70
Jewell Ave.
Smoky Hill Rd.
Parker Rd.Peoria St.
I-25
NON-STOP TOLLING
FUTURE WIDENING REQUIREMENTS(BASE CASE AND NON-STOP TOLLING)
FIGURE ES-13
Not to Scale
2018
2035
LEGEND
Widening Requirements
Existing InterchangeFuture Interchange
E-470 Traffic and Revenue Study Summary Report
December 1, 2008 Page 24
the south end will operate at LOS D or worse by 2035. The segment from I-70 to Parker Road will need to have a constant six lane section with one auxiliary lane each direction between two interchanges on this segment. From Parker Road to I-25 an eight lane section is necessary to maintain LOS C or better in 2035. For the segment of E-470 from I-70 to I-25 on the north end, 8 of the 24 existing four lane sections will need to be widened to six lane sections to maintain LOS C or better. Based on these results, the majority of the roadway improvements along the corridor will not need to be made until some time between 2021 and 2035 with the widening of a few segments occurring between 2015 and 2021. In addition, it should be recognized that the performance target of LOS C is a high level; it may be possible to operate at LOS D for a year or two without seriously degrading customer service. NST WIDENING REQUIREMENTS Based on the results of the NST scenario level of service analysis, as with the Base condition, the existing geometry would likely provide sufficient capacity to maintain LOS C through the year 2015. As in the Base Case, the first segment that reaches LOS D is at the Chambers Road Interchange in the year 2015 followed by LOS D from Gartrell Road to Parker Road in the year 2018. By the year 2021, the Jordan Road Interchange is also expected to operate at LOS D. With widening improvements the corridor will likely operate at LOS C or better through the year 2021. By 2035, which is also the condition in the Base Case, improvements will need to be made to several segments along the E-470 corridor. Most of the toll road segments from I-70 to I-25 on the south end will operate at LOS D or worse by 2035. The segment from I-70 to Parker Road will need to have a constant six lane section with one auxiliary lane each direction between two interchanges on this segment. From Parker Road to I-25 an eight lane section is necessary to maintain LOS C or better in 2035. For the segment of E-470 from I-70 to I-25 on the north end, 9 of the 24 existing four lane sections, one more section than the Base Case will need to be widened to six lane sections to maintain LOS C or better. The one additional segment that would need to be widened is the segment from York Street to I-25.