Embed Size (px)
Citation preview

ORIGINALRESEARCH
Final Cerebral Infarct Volume Is Predictable byMR Imaging at 1 Week
T. TourdiasP. Renou
I. SibonJ. Asselineau
L. BracoudM. Dumoulin
F. RouanetJ.M. Orgogozo
V. Dousset
BACKGROUND AND PURPOSE: Stroke volume, an increasingly used end point in phase II trials, isconsidered stationary at least 30 days after the ictus. We investigated whether information conveyedby MR imaging measurements of the “final” infarct volume could be assessed as early as thesubacute stage (days 3–6), rather than waiting for the chronic stage (days 30–45).
MATERIALS AND METHODS: Ninety-five patients with middle cerebral artery stroke prospectivelyincluded in a multicenter study underwent MR imaging during the first 12 hours (MR imaging-1),between days 3 and 6 (MR imaging-2), and between days 30 and 45 (MR imaging-3). We firstinvestigated the relationship between subacute (FLAIR-2) and chronic volumes (FLAIR-3), by using alinear regression model. We then tested the relationship between FLAIR volumes (either FLAIR-2 orFLAIR-3) and functional disability, measured by the mRS at the time of MR imaging-3, by using logisticregression. The performances of the models were assessed by using the AUC in ROC.
RESULTS: A linear association between log FLAIR-2 and log FLAIR-3 volumes was observed. Theproportion of FLAIR-3 variation, explained by FLAIR-2, was high (R2 � 81%), without a covariate thatimproved this percentage. Both FLAIR-2 and FLAIR-3 were independent predictors of mRS (OR, 0.79and 0.73; 95% CI, 0.64–0.97 and 0.56–0.96; P � .026 and .023). The performances of the models forthe association between either FLAIR volume and mRS did not differ (AUC � 0.897 for FLAIR-2 and0.888 for FLAIR-3).
CONCLUSIONS: Stroke damage may be assessed by a subacute volume because subacute volumepredicts the “true” final volume and provides the same clinical prognosis.
ABBREVIATIONS: ADC � apparent diffusion coefficient; AUC � area under the curve; BI � Barthelindex; CI � confidence interval; DWI � diffusion-weighted imaging; ECASS � European Cooper-ative Acute Stroke Study; EPITHET � Echo-Planar Imaging Thrombolytic Evaluation Trial; FLAIR �fluid-attenuated inversion recovery; ICA � internal carotid artery; log � logarithmic; MRA � MRangiography; mRS � modified Rankin Scale, NIHSS � National Institutes of Health Stroke Scale;OR � odds ratio; PH � parenchymal hematoma; PWI � perfusion-weighted imaging; Q1-Q3 � firstand third quartile of interquartile range; ROC � receiver operating characteristic analysis; TP � timepoint; TTP � time-to-peak; VIRAGE � Valeur predictive des parametres IRM a la phase aigue del’Accident vasculaire cerebral: application a la Gestion des Essais therapeutiques
Infarct volume is a direct measurement of 1 of the finalpathologic steps leading to the clinical deficits caused by an
ischemic stroke.1 Therefore, final infarct volume derived fromMR imaging represents an objective and valid measurement ofstroke consequences. Infarct volume has been proposed as analternative (surrogate end point) to classic disability or hand-icap scales,2,3 being able to improve the efficacy of phase IItrials by increasing their statistical power and, therefore, their
ability to reach conclusions about the potential benefits oftherapy.4 The same marker is also frequently used in concep-tual studies, particularly in penumbra proof-of-concept stud-ies, which consider the fate of “at risk” tissue as an outcomevariable.5
Nevertheless, there is currently no consensus as to the ap-propriate timing for final infarct volume measurements. Typ-ically, outcome scans are performed relatively late, between 30days6 and 90 days2,7 following the insult when the infarct vol-ume is considered as fixed. It was recently shown that changesin volume between day 30 and day 90 were insignificant, prov-ing that a time span of 30 days following ictus is sufficient toassess final infarct volume.8 An earlier measurement, con-ducted during the first week, is thought to overestimate strokelesions due to vasogenic edema.9 Nevertheless, such earlymeasurements, taken before the patient’s discharge from thehospital, could greatly facilitate future studies and trials be-cause this early end point could decrease the study duration,costs, and the number of patients lost to follow-up.
Our study’s aim was to evaluate whether information pro-vided by MR imaging measurements of “final” cerebral infarctvolume could be assessed as early as the subacute stage (days3– 6), rather than waiting for the chronic stage (days 30 – 45),thereby leading to an earlier outcome marker.
Received April 7, 2010; accepted after revision July 3.
From the Service de NeuroImagerie Diagnostique et Therapeutique (T.T., V.D.) and Pole desNeurosciences Cliniques (P.R., I.S., F.R., J.M.O.), Universite Victor Segalen Bordeaux 2, CHUde Bordeaux, Bordeaux, France; Unite de Soutien Methodologique a la Recherche Cliniqueet Epidemiologique (J.A., M.D.), CHU de Bordeaux, Bordeaux, France; and Bio-ImagingTechnologies SAS (L.B.), Bioparc, Lyon, France.
VIRAGE was part of an approved national research and clinical hospital project funded in2003 by a public national grant.
Paper previously presented at: European Congress of Radiology, March 4 – 8, 2010; Vienna,Austria.
Please address correspondence to Thomas Tourdias, MD, Universite Victor SegalenBordeaux 2, CHU de Bordeaux, Service de NeuroImagerie Diagnostique et Therapeutique,Place Amelie Raba-Leon, Bordeaux, F-33076 France; e-mail: [email protected]
Indicates open access to non-subscribers at www.ajnr.org
Indicates article with a supplemental on-line figure.
DOI 10.3174/ajnr.A2271
352 Tourdias � AJNR 32 � Feb 2011 � www.ajnr.org

Materials and Methods
PatientsA total of 95 patients with first middle cerebral artery acute ischemic
stroke were included in a prospective national multicenter observa-
tional cohort study called VIRAGE. The study was approved by the
institutional review board, and written informed consent was ob-
tained from all participants. Four university hospitals in France re-
cruited patients between September 2003 and June 2008. Primary
inclusion criteria were as follows: men and women, older than 18
years, with a clinical diagnosis of minor-to-severe cerebral infarct
(NIHSS scores between 4 and 20) in the left or right middle cerebral
artery territory evolving for �12 hours. Exclusion criteria were the
following: coma, transient ischemic attacks or lacunar syndrome,
pregnant or breast-feeding women or women without a negative
pregnancy test, and contraindications to MR imaging.
Patients were examined at 3 predefined TPs following the insult:
TP1, � 12 hours; TP2, between day 3 and day 6; and TP3, between day
30 and day 45. MR imaging was performed at each TP. The NIHSS
Score was recorded at TP1, whereas BI and mRS were assessed at TP2
and TP3. NIHSS, BI, and mRS were evaluated by neurologists with
expertise in the administration of these scales, who were unaware of
the volume measurements. Clinical and biologic data were collected
via electronic case report forms.
MR Imaging ProtocolMR imaging studies were performed on 1.5T magnets (Intera and
Achieva, Philips Healthcare, Best, the Netherlands; and Magnetom
Vision, Siemens, Erlangen, Germany). Sequence parameters were
standardized across centers and summarized in detail elsewhere.10
TP1 and TP2 scans included DWI (DWI-1 and DWI-2), dynamic
susceptibility PWI (PWI-1 and PWI-2), time-of-flight MRA (MRA-1
and MRA-2), and FLAIR (FLAIR-1 and FLAIR-2). At chronic fol-
low-up (TP3), FLAIR-3, and DWI-3 were analyzed. T2* gradient re-
called-echo was also available at each TP.
Data Processing and Image AnalysisMR imaging studies were centralized by using an independent core
laboratory (Bio-Imaging, Lyon, France), which developed dedicated
software tools for randomized image-review sessions. All MR images
were read at the coordinating center by investigators blinded to the
clinical information. Results were automatically extracted by Bio-Im-
aging and then sent directly to the core statistical unit to ensure safety
against post hoc changes because the data could no longer be modi-
fied after transfer.
DWI and FLAIR Volumes. Stroke volumes were assessed by a
neuroradiologist (T.T.) outlining FLAIR and DWI abnormalities at
each TP. Both sequences were viewed simultaneously on a single
screen, together with ADC-1 at TP1 and ADC-2 at TP2. This allowed
the reader to edit lesion borders on DWI hyperintensity with de-
creased ADC and FLAIR hyperintensity in the corresponding topog-
raphy. For TP3, FLAIR-3 and DWI-3 were shown with FLAIR-1 and
DWI-1 to edit lesion borders on FLAIR-3 hyperintensity correspond-
ing to the infarcted territory on DWI-1, with particular attention
being paid to avoid replication of pre-existing chronic lesions present
on FLAIR-1. If present, the volume of hemorrhagic transformation
was included, and its subtype was noted according to the ECASS
radiologic classification based on a T2* gradient-recalled sequence.11
The order of appearance on the screens was randomized so that vol-
umes at TP2 were analyzed by readers blinded to the measurements at
TP3. All volumes were pre-detected by using an automatic unsuper-
vised 3D segmentation algorithm (Bio-Imaging), followed by a man-
ual validation by the reader, by using interactive drawing tools. We
previously reported a very good reproducibility (intraclass correla-
tion coefficients between 0.86 and 0.96) for such quantitative volume
measurements on the first 30 patients from the VIRAGE data base.12
PWI Analyses. Perfusion deficit volumes were estimated by the
same reader at TP1 and TP2, according to the time-to-peak maps
computed by Bio-Imaging randomly displayed along with the corre-
sponding DWI sequences. A 4-second threshold was chosen as a reli-
able estimate of penumbral flow,13 according to a previously de-
scribed method.14
MRA Analyses. A second reader (P.R.) reviewed all MRAs at TP1
and TP2 in a randomized order, including the native images recon-
structed in 3 orthogonal planes, maximum intensity projections, and
DWI-1 to indicate the infarct side. Scoring of the distal ICA and the
middle cerebral artery M1 and M2 status was categorized as follows:
1 � normal, 2 � disturbed flow, 3 � occluded, and 4 � technically
inadequate.
Statistical AnalysesThe descriptive statistics used were mean � SD or medians and quar-
tiles (Q1–Q3). Volume comparisons were performed by using the
nonparametric paired-sample Wilcoxon signed rank test.
To address the main issue, we first evaluated whether a subacute
measure could predict the fixed (eg, chronic) volume and, second,
whether a subacute measure could provide the same prognostic in-
formation on the “true” clinical outcome as a chronic measure could.
The association between the chronic volume (FLAIR-3) and
the subacute volume (FLAIR-2) was first estimated by using a
Spearman rank correlation coefficient. Then, for the prediction of
FLAIR-3 by the measurement of FLAIR-2, a multivariable linear
model was used according to a backward stepwise method,15 with
the independent variables listed in Table 1. Assumptions of nor-
mality and homoscedasticity of residuals (the difference between
the observed values and the values predicted by the model) were
graphically checked. The adjusted coefficient of determination,
Table 1: Independent variablesa
VariablesClinical
Age Quantitative variableSex Categorized: 1) male, 2) femaleInitial glycemia Quantitative variableFibrinolytic treatment Categorized: 1) yes, 2) noInitial NIHSS score Quantitative variable
ImagingFLAIR volume Quantitative variablePersistent occlusionb Categorized: 1) yes, 2) noPercentage of reperfusionc Categorized: 0) no significant abnormality
on PWI-1,d 1) reperfusion between TP1 andTP2 �90%; 2) Reperfusion between TP1and TP2 � 90%
a Independent variables were introduced in multivariable analyses because of their poten-tial association with final infarct volume and clinical recovery.34 –36 Quantitative variableswere introduced as continuous variables or by class according to quartiles if the hypothesisof linearity was not graphically met.b Persistent occlusion was defined as an occluded artery on MRA-1 remaining occluded onMRA-2 in an acute stroke territory.c Reperfusion definition was based on PWI at TP1 and TP2, calculated as follows: (PWI-1 �PWI-2)/PWI-1 � 100. Ninety percent was chosen as a threshold because it was previouslyreported to be associated with final volume and clinical outcome.36
d PWI abnormalities were considered on TTP maps using a delay of 4 seconds or more. TP1indicates �12 hours; TP2, days 3– 6.
BRA
INORIGIN
ALRESEARCH
AJNR Am J Neuroradiol 32:352–58 � Feb 2011 � www.ajnr.org 353

R2, was used to assess the percentage of variability explained by the
variables included in the model.
Last, the association between functional disability at days 30 – 45
and either FLAIR-2 or FLAIR-3 volumes was estimated by using mul-
tivariable logistic regression according to a backward stepwise meth-
od,15 with the independent variables listed in Table 1. For this pur-
pose, disability was assessed by mRS dichotomized at a cutoff of 1 for
2 major reasons: First, mRS was a better tool after mild stroke (as seen
in the VIRAGE population) than BI16; and second, a full recovery
defined as mRS � 1 was the criterion used in the main studies dem-
onstrating the efficacy of alteplase.17,18 Results with mRS dichoto-
mized at a cutoff of 2 were also presented as secondary analyses. The
performances of the models were assessed by using the AUC in an
ROC for both models.
All analyses were performed by using SAS Software, Version 9.1.3
(SAS Institute, Cary, North Carolina).
Results
Patient Characteristics and Neuroimaging VariablesOf the 95 patients, 4 were excluded from analyses because bothMR imaging-2 and MR imaging-3 data were missing. Twopatients were transferred to another hospital and lost to fol-low-up, 1 died, and 1 underwent pacemaker implantation af-ter MR imaging-1, contraindicating other MR imaging scans.The remaining 91 patients underwent a total of 267 MR imag-ing examinations (91 MR imaging-1, 90 MR imaging-2, and86 MR imaging-3). One MR imaging at TP2 was technicallyinadequate for FLAIR volume, due to motion artifacts. At TP3,2 MR images were technically inadequate, 2 patients died be-fore TP3, and 1 patient was not able to undergo MR imag-ing-3, due to clinical deterioration.
Table 2 features the patient characteristics. Neuroimagingvariables were as follows: MR imaging-1 was performed after amean delay of 6.3 � 3.3 hours following stroke onset (n � 91).In total, 17 patients (18.7%) were examined during the first3 hours, 29 (31.9%) between 3 and 6 hours, and 44 (48.4%)between 6 and 12 hours. MR imaging-2 was performed after amean delay of 4.2 � 1.1 days (n � 90), and MR imaging-3,after a mean delay of 37.9 � 13.5 days (n � 86). Median lesionvolume significantly increased from DWI-1 (13.4 cm3) toFLAIR-2 (25 cm3, P � .05; n � 90) and then significantlyregressed to FLAIR-3 (20 cm3, P � .05; n � 86). Figure 1 showsan illustrative case of the volume time course, and Table 3provides details on volume measurements and reperfusion
Fig 1. Example of time course of volumes. Axial FLAIR and axial DWI acquired within thefirst 12 hours following stroke onset (FLAIR-1 and DWI-1), between 3 and 6 days (FLAIR-2and DWI-2), and between 30 and 45 days (FLAIR-3 and DWI-3). Typically, the pattern ofvolume change includes an increase at the subacute stage and a secondary decreasebetween the subacute and chronic stages.
Table 2: Patient characteristics, VIRAGE study
Characteristics ValuesMean age (yr) (SD) 63.0 (13.1)Sex, female (No.) (%) 37 (40.7)Mean glycemia (mmol/L) (�SD) 7.0 (2.5)Intravenous fibrinolytic treatment (No.) (%) 42 (46.2)Median NIHSS score at presentation (Q1–Q3) 11 (6–17)mRS score at TP3 (Q1–Q3) 2 (1–3)
mRS �1, (No.) (%)/mRS �1 (No.) (%) 54 (59.3)/36 (39.6)mRS �2, (No.) (%)/mRS �2 (No.) (%) 32 (35.2)/58 (63.7)
Table 3: Imaging characteristics, VIRAGE study
Characteristics Values
Median (Q1–Q3) RangeDWI-1 volume (cm3) 13.4 (4.1–34.9) 0–164.7PWI-1 volume (cm3) 34.9 (6.9–87.8) 0–243.8FLAIR-2 volume (cm3) 25 (8–60) 0–308FLAIR-3 volume (cm3) 20 (6–45) 0–211Occlusion
No persistent (No.) (%) 76 (83.5)Persistent (No.) (%)a 15 (16.5)
ICA 9 (9.9)M1 4 (4.4)M2 2 (2.2)
ReperfusionNo significant perfusion
abnormality at TP1, n (%)21 (23.1)
Reperfusion �90% 35 (38.5)Reperfusion �90% 33 (36.3)Technically inadequate 2 (2.2)
a Persistent occlusion was defined as an occluded artery on MRA-1 remaining occluded onMRA-2 in an acute stroke territory.
354 Tourdias � AJNR 32 � Feb 2011 � www.ajnr.org
data. At TP2, 30 patients exhibited hemorrhagic transforma-tion (33%). Most had hemorrhagic petechia (HI1, n � 15, andHI2, n � 8, according to the ECASS classification), and 7 hadPH (PH1, n � 7, and PH2, n � 0).
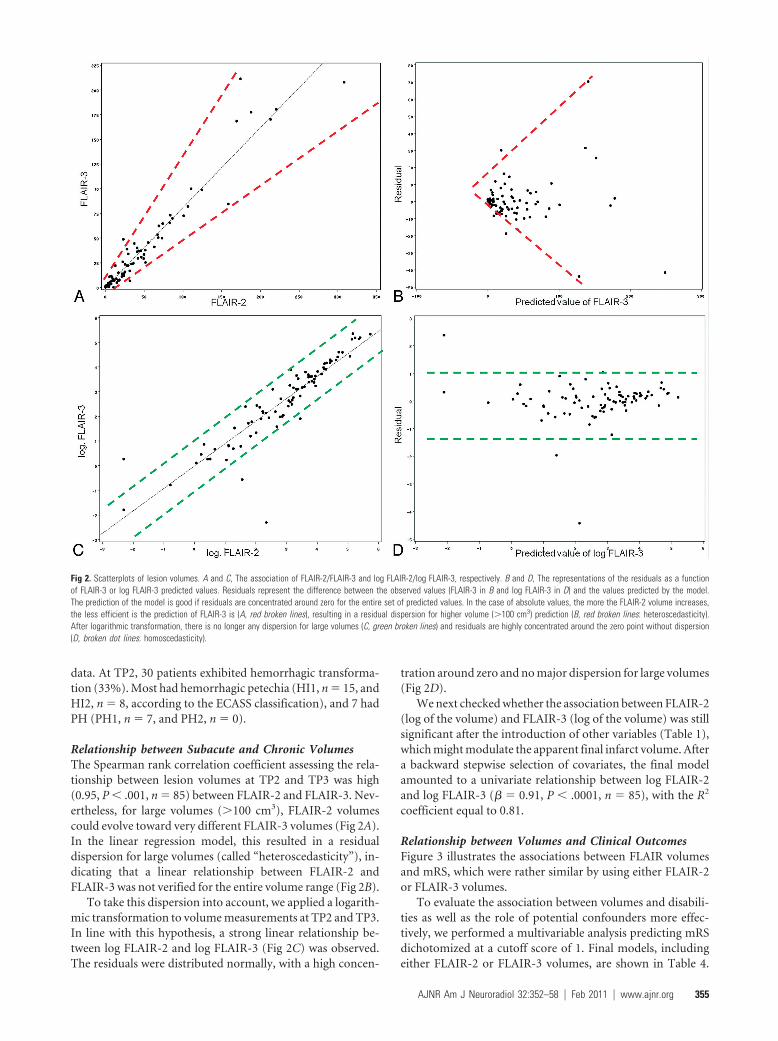
Relationship between Subacute and Chronic VolumesThe Spearman rank correlation coefficient assessing the rela-tionship between lesion volumes at TP2 and TP3 was high(0.95, P � .001, n � 85) between FLAIR-2 and FLAIR-3. Nev-ertheless, for large volumes (�100 cm3), FLAIR-2 volumescould evolve toward very different FLAIR-3 volumes (Fig 2A).In the linear regression model, this resulted in a residualdispersion for large volumes (called “heteroscedasticity”), in-dicating that a linear relationship between FLAIR-2 andFLAIR-3 was not verified for the entire volume range (Fig 2B).
To take this dispersion into account, we applied a logarith-mic transformation to volume measurements at TP2 and TP3.In line with this hypothesis, a strong linear relationship be-tween log FLAIR-2 and log FLAIR-3 (Fig 2C) was observed.The residuals were distributed normally, with a high concen-
tration around zero and no major dispersion for large volumes(Fig 2D).
We next checked whether the association between FLAIR-2(log of the volume) and FLAIR-3 (log of the volume) was stillsignificant after the introduction of other variables (Table 1),which might modulate the apparent final infarct volume. Aftera backward stepwise selection of covariates, the final modelamounted to a univariate relationship between log FLAIR-2and log FLAIR-3 (� � 0.91, P � .0001, n � 85), with the R2
coefficient equal to 0.81.
Relationship between Volumes and Clinical OutcomesFigure 3 illustrates the associations between FLAIR volumesand mRS, which were rather similar by using either FLAIR-2or FLAIR-3 volumes.
To evaluate the association between volumes and disabili-ties as well as the role of potential confounders more effec-tively, we performed a multivariable analysis predicting mRSdichotomized at a cutoff score of 1. Final models, includingeither FLAIR-2 or FLAIR-3 volumes, are shown in Table 4.
Fig 2. Scatterplots of lesion volumes. A and C, The association of FLAIR-2/FLAIR-3 and log FLAIR-2/log FLAIR-3, respectively. B and D, The representations of the residuals as a functionof FLAIR-3 or log FLAIR-3 predicted values. Residuals represent the difference between the observed values (FLAIR-3 in B and log FLAIR-3 in D) and the values predicted by the model.The prediction of the model is good if residuals are concentrated around zero for the entire set of predicted values. In the case of absolute values, the more the FLAIR-2 volume increases,the less efficient is the prediction of FLAIR-3 is (A, red broken lines), resulting in a residual dispersion for higher volume (�100 cm3) prediction (B, red broken lines: heteroscedasticity).After logarithmic transformation, there is no longer any dispersion for large volumes (C, green broken lines) and residuals are highly concentrated around the zero point without dispersion(D, broken dot lines: homoscedasticity).
AJNR Am J Neuroradiol 32:352–58 � Feb 2011 � www.ajnr.org 355

Age (introduced by class according to quartiles), initial NIHSSScore reperfusion, and FLAIR volumes (either FLAIR-2 orFLAIR-3) were independent predictors of mRS. However, theassociation of either FLAIR-2 or FLAIR-3 with disability wasweak (OR, 0.79 and 0.73; 95% CI, 0.64 – 0.97 and 0.56 – 0.96;P � .026 and .023). The performances of the models weresimilar after introducing either FLAIR-2 (AUC � 0.897) orFLAIR-3 (AUC � 0.888) volumes.
When we changed the mRS threshold from 1 to 2, FLAIRvolumes remained significantly associated with mRS (OR �0.86 and 0.83; P � .002 for FLAIR-2 and FLAIR-3, respec-tively), in univariate analysis. When we used the mRS thresh-old at a cutoff of 2, multivariate models (FLAIR volume �
initial NIHSS Score � persistent occlusion) provided the sameperformance, introducing either FLAIR-2 (AUC � 0.870) orFLAIR-3 (AU � 0.887) volumes. With this cutoff at 2, thevariable “persistent occlusion” was the stronger predictor, andFLAIR-2 and FLAIR-3 volumes did not reach significance,while FLAIR volumes were associated with the variable occlu-sion (median FLAIR-2 � 96.4 cm3 versus 38.7 cm3, P � .017;FLAIR-3 � 90.6 cm3 versus 27.9 cm3, P � .006 for patientswith persistent occlusion versus patients without persistentocclusion).
DiscussionIn this study, we found evidence for an early (�7 days) mea-surement of poststroke consequences because subacute vol-umes, even if they were overestimated by vasogenic edema,made it possible to accurately predict chronic (eg, fixed, after30 days) volumes; subacute volumes provided the same esti-mation of clinical outcome as chronic volumes.
This finding could greatly improve the feasibility of phaseII drug trials and proof-of-concept studies,5,7 thereby facilitat-ing the translation from preclinical studies in which infarctvolume is traditionally used as the primary end point.19 Nine-teen percent of the variance of FLAIR-3 unexplained byFLAIR-2 (R2 � 81%) could be considered as an acceptable lossof information when using subacute measurements. The ad-vantages obtained would largely compensate for the loss ofinformation: these are decreased study duration and costs,lower likelihood of confounding events unrelated to the inter-vention (such as another stroke), decreased loss to follow-up,and the lack of outcome measurements possibly leading to abiased and difficult interpretation of the study results. As anexample, in our study, the outcome assessment at days 30 – 45led to the loss of 5 patients, compared with only 1 patient atdays 3– 6; up to 30% of the patients were unable to undergo a90-day MR imaging scan in the EPITHET study.7 Earlier prog-nostic estimates can also assist with anticipating rehabilitationneeds and can provide earlier information for patients andtheir relatives.
During the first week after insult, the apparent brain in-farct, which is a dynamic process, has a tendency to expand,due to both vasogenic edema and increasing ischemic brain
Fig 3. FLAIR volumes (either FLAIR-2 in part A or FLAIR-3 in part B) according to disability assessed by mRS. The cross inside the box represents the mean. The middle bar is the median.Upper and lower extremities of the box are Q1 and Q3, respectively. Maximum and minimum values are represented by extreme lines. Larger FLAIR volumes are associated with worseclinical prognosis with a similar tendency by using either FLAIR-2 or FLAIR-3.
Table 4: Final models of prediction of mRS <1 including eitherFLAIR-2 volume (model 1) or FLAIR-3 volume (model 2)a
Variables OR 95% CI P ValueFinal model including FLAIR-2 volume
(model 1)FLAIR-2 volume (per 10 cm3 increase) 0.79 0.64–0.97 .026
AgeBetween 54 and 64 vs �54 years 0.05 0.01–0.32 .017Between 64 and 74 vs �54 years 1.18 0.22–6.39Older than 74 vs �54 years 0.09 0.01–0.66
Initial NIHSS score 0.82 0.72–0.93 .003Reperfusionb
Reperfusion �90% vs no abnormality 1.47 0.34–6.45 .005Reperfusion �90% vs no abnormality 0.06 0.01–0.40
Final model including FLAIR-3 volume(model 2)
FLAIR-3 volume (per 10 cm3 increase) 0.73 0.56–0.96 .023Age
Between 54 and 64 vs �54 years 0.06 0.01–0.47 .025Between 64 and 74 vs �54 years 1.54 0.28–8.51Older than 74 vs �54 years 0.12 0.02–0.81
Initial NIHSS score 0.82 0.71–0.93 .003Reperfusionb
Reperfusion �90% vs no abnormality 1.32 0.31–5.67 .008Reperfusion �90% vs no abnormality 0.06 0.01–0.43
a The Hosmer-Lemeshow test findings were nonsignificant (P � .213 and .969 for models1 and 2, respectively), indicating a good model fit. The AUC was 0.897 for model 1 and0.888 for model 2.b If one changed the threshold from 1 to 2, the variable “persistent occlusion” appeared tobe strongly related to the clinical outcome (OR, 0.08; 95% CI, 0.01– 0.44; P � .004 formodel 1; OR, 0.06; 95% CI, 0.01– 0.36; P � .002 for model 2)
356 Tourdias � AJNR 32 � Feb 2011 � www.ajnr.org

tissue injury. The subsequent decrease may be explained by acombination of edema resolution, decrease of the inflamma-tory process, and atrophy.9 Recently, Gaudinski et al8 demon-strated that infarct volume did not vary significantly betweendays 30 and 90. This finding raised the question of whether itwas possible to predict this fixed stage as early as days 3– 6.Following this hypothesis, we found a good correlation be-tween subacute and chronic volumes in line with previouswork,20,21 which nevertheless failed to take into accountwhether statistical conditions of a linear relationship were metfor the full spectrum of volumes. Indeed, the estimation ofFLAIR-3 was less efficient in the case of large volumes, result-ing in a dispersion of the residuals. This could be accounted forby an evolution of the lesions, which was not uniform amongpatients, particularly in the case of large volumes in whichearly edema and later atrophy were predominant. We showedthat a logarithmic transformation corrected this issue with ahighly significant linear relation between log FLAIR-2 and logFLAIR-3, allowing us to conclude that the fixed infarct volumewas predictable at days 3– 6. Moreover, all covariates ceased tohave an impact on volumes between TP2 and TP3, with mostof the variability of FLAIR-3 explained by FLAIR-2 (R2 �81%).
As a potential surrogate marker, infarct volumes must becorrelates of the expected clinical outcomes.4 Therefore, ourstudy dealt with the relationship between volumes and clinicaloutcomes. We found that FLAIR volumes were significant andindependent predictors of clinical outcomes. The correlationswere not very strong, a point largely reported in the litera-ture22-24 and easy to understand, considering the numerousadditional factors that can influence clinical outcomes at thedisability/handicap level (On-line Fig 1).25-27 Here, other clin-ical (initial stroke severity, age) or neuroimaging (recanaliza-tion, reperfusion) variables were significantly associated withthe outcome, in line with previous studies.25,28 The relativelyweak association between infarct volumes and clinical out-comes does not necessarily discredit volume as a surrogatemarker. In fact, treatment efficacy is certainly easier to dem-onstrate at this first hierarchical level (level of volumes inOn-line Fig 1) in phase II studies, while it could be “diluted” ata higher levels (levels of disability or handicap in On-line Fig1). An analogy could be made with multiple sclerosis. In thisinstance, the correlation between MR imaging�measuredplaque volumes and clinical scales was even weaker, these vol-umes, nevertheless, being one of the most influential endpoints in neurologic pharmaceutical trials.29
More interesting than the radioclinical correlation per se,we evaluated the first direct comparison between volumesmeasured at different TPs and disability. The major result wasthat FLAIR-3 did not provide additional information becausethe strength of the association between FLAIR-3 and mRS wassimilar to that between FLAIR-2 and mRS. This was an addi-tional argument in favor of not waiting longer than 1 week toassess final infarct volumes. This result was in line with a suba-nalysis from the EPITHET population, which found the sameprognostic value for subacute or chronic volumes in predict-ing day 90 NIHSS scores.21 Here, we extended these data bychoosing mRS, a global measurement of disability and hand-icap widely used in phase III trials,17,18 instead of NIHSS,
which is used to measure neurologic deficits and is not neces-sarily correlated with an individual’s functional recovery.16,30
The dataset used in this study presents some limitations.First, reperfusion and recanalization were assessed at days3– 6, which is suboptimal for this end point because numerouspatients exhibit spontaneous recanalization before this timespan.7 However, by choosing the “persistent occlusion” vari-able rather than recanalization in an effort to avoid mergingearly and late recanalization, we took into account this latterimportant factor. Second, disability scales were measured after30 – 45 days, which may be too early because recovery onlyreaches a plateau 5– 6 months after a stroke.16 Functional andglobal scales are more valid in the long-term assessment ofstroke consequences,31 and this feature could have decreasedthe relationship between FLAIR volumes and mRS. Third, ourpatient sample was not representative of the full spectrum ofpatients with stroke, particularly because it included few se-vere strokes. This could limit the generalization of the ob-tained results to the entire stroke population. Nevertheless,similar characteristics, particularly initial NIHSS Score, can befound in most of the previous studies with multiple MR im-aging6 or in recent therapeutic trials.18 Last, one must keep inmind that a correlation (between surrogate and clinical endpoints) is not sufficient for a surrogate to be valid.4,32 Properjustification for such a replacement requires that the effect ofthe intervention on the surrogate end point predicts the effecton the clinical outcome.4,32 It should be valid for recanaliza-tion therapy, such as fibrinolysis, which directly decreases thefollow-up FLAIR lesion volume from the acute DWI-lesionvolume.33 More attention should be paid to other strategieslike neuroprotectors or neurotrophic factors, which could in-fluence disability or handicap levels, while the mean volumemay remain unchanged.
ConclusionsPoststroke consequences could be assessed by FLAIR volumeduring the first week (days 3– 6) rather than waiting for thechronic stage. The current study represents the first step in thecomplex process of the validation of MR imaging metrics formonitoring treatment effects, but it provides encouraging re-sults and will have to be considered in future therapeutic trials,which could include a subacute infarct volume to assess othersurrogacy criteria4,32 before the definitive validation of thismeasure.
AcknowledgmentsWe thank V. Sesay from the department of neuroradiology atthe University Hospital of Bordeaux, France, who supervisedthe VIRAGE data base. VIRAGE is a multicenter data basecoordinated by the University Hospital of Bordeaux. We alsothank the contributors from the University Hospitals ofGrenoble (A. Jaillard and M. Hommel from the neurovasculardepartment; J.F. Le Bas and S. Grand from the neuroradiologydepartment), Montpellier (D. Milhaud from the neurovascu-lar department, A. Bonafe from the neuroradiology depart-ment), and Toulouse (J.F. Albucher from the neurovasculardepartment, C. Manelfe and C. Cognard from the neuroradi-ology department) who participated in patient recruitmentfor the VIRAGE study.
AJNR Am J Neuroradiol 32:352–58 � Feb 2011 � www.ajnr.org 357

References1. Phan TG, Donnan GA, Davis SM, et al. Proof-of-principle phase II MRI studies
in stroke: sample size estimates from dichotomous and continuous data.Stroke 2006;37:2521–25
2. Warach S, Pettigrew LC, Dashe JF, et al. Effect of citicoline on ischemic lesionsas measured by diffusion-weighted magnetic resonance imaging: citicoline010 investigators. Ann Neurol 2000;48:713–22
3. Warach S, Kaufman D, Chiu D, et al. Effect of the glycine antagonist gavestinelon cerebral infarcts in acute stroke patients, a randomized placebo-controlledtrial: The Gain MRI Substudy. Cerebrovasc Dis 2006;21:106 –11. Epub 2005 Dec9
4. Smith JJ, Sorensen AG, Thrall JH. Biomarkers in imaging: realizing radiology’sfuture. Radiology 2003;227:633–38
5. Wintermark M, Albers GW, Alexandrov AV, et al. Acute stroke imaging re-search roadmap. Stroke 2008;39:1621–28
6. Albers GW, Thijs VN, Wechsler L, et al. Magnetic resonance imaging profilespredict clinical response to early reperfusion: the diffusion and perfusion im-aging evaluation for understanding stroke evolution (defuse) study. Ann Neu-rol 2006;60:508 –17
7. Davis SM, Donnan GA, Parsons MW, et al. Effects of alteplase beyond 3 h afterstroke in the echo-planar imaging thrombolytic evaluation trial (EPITHET): aplacebo-controlled randomised trial. Lancet Neurol 2008;7:299 –309
8. Gaudinski MR, Henning EC, Miracle A, et al. Establishing final infarct volume:stroke lesion evolution past 30 days is insignificant. Stroke 2008;39:2765– 68
9. Lansberg MG, O’Brien MW, Tong DC, et al. Evolution of cerebral infarct vol-ume assessed by diffusion-weighted magnetic resonance imaging. Arch Neu-rol 2001;58:613–17
10. Tourdias T, Dousset V, Sibon I, et al. Magnetization transfer imaging showstissue abnormalities in the reversible penumbra. Stroke 2007;38:3165–71
11. Renou P, Sibon I, Tourdias T, et al. Reliability of the ECASS radiological clas-sification of postthrombolysis brain haemorrhage: a comparison of CT andthree MRI sequences. Cerebrovasc Dis 2010;29:597– 604. Epub 2010 Apr 23
12. Sibon I, Menegon P, Orgogozo JM, et al. Inter- and intraobserver reliability offive MRI sequences in the evaluation of the final volume of cerebral infarct. JMagn Reson Imaging 2009;29:1280 – 84
13. Sobesky J, Zaro Weber O, Lehnhardt FG, et al. Which time-to-peak thresholdbest identifies penumbral flow? A comparison of perfusion-weighted mag-netic resonance imaging and positron emission tomography in acute isch-emic stroke. Stroke 2004;35:2843– 47
14. Neumann-Haefelin T, Wittsack HJ, Wenserski F, et al. Diffusion- and perfu-sion-weighted MRI: the DWI/PWI mismatch region in acute stroke. Stroke1999;30:1591–97
15. Hosmer D, Lemeshow S. Applied Logistic Regression. 2nd ed. New York: JohnWiley and Sons; 2000
16. Kasner SE. Clinical interpretation and use of stroke scales. Lancet Neurol2006;5:603–12
17. Tissue plasminogen activator for acute ischemic stroke: The National Insti-tute of Neurological Disorders and Stroke rt-PA Stroke Study Group. N EnglJ Med 1995;333:1581– 87
18. Hacke W, Kaste M, Bluhmki E, et al. Thrombolysis with alteplase 3 to 4.5 hoursafter acute ischemic stroke. N Engl J Med 2008;359:1317–29
19. van der Worp HB, Kappelle LJ, Algra A, et al; the TESS Investigators; TESS II
Investigators. The effect of tirilazad mesylate on infarct volume of patientswith acute ischemic stroke. Neurology 2002;58:133–35
20. Beaulieu C, de Crespigny A, Tong DC, et al. Longitudinal magnetic resonanceimaging study of perfusion and diffusion in stroke: evolution of lesion volumeand correlation with clinical outcome. Ann Neurol 1999;46:568 –78
21. Ebinger M, Christensen S, De Silva DA, et al. Expediting MRI-based proof-of-concept stroke trials using an earlier imaging end point. Stroke2009;40:1353–58
22. Schiemanck SK, Post MW, Kwakkel G, et al. Ischemic lesion volume correlateswith long-term functional outcome and quality of life of middle cerebral ar-tery stroke survivors. Restor Neurol Neurosci 2005;23:257– 63
23. Saver JL, Johnston KC, Homer D, et al. Infarct volume as a surrogate or auxil-iary outcome measure in ischemic stroke clinical trials: The RANTTAS Inves-tigators. Stroke 1999;30:293–98
24. Barrett KM, Ding YH, Wagner DP, et al; ASAP Investigators. Change in diffu-sion-weighted imaging infarct volume predicts neurologic outcome at 90days: results of the Acute Stroke Accurate Prediction (ASAP) trial serial imag-ing substudy. Stroke 2009;40:2422–7. Epub 2009 May 14
25. Thijs VN, Lansberg MG, Beaulieu C, et al. Is early ischemic lesion volume ondiffusion-weighted imaging an independent predictor of stroke outcome? Amultivariable analysis. Stroke 2000;31:2597– 602
26. Pillai JJ. Insights into adult postlesional language cortical plasticity providedby cerebral blood oxygen level-dependent functional MR imaging. AJNR Am JNeuroradiol 2010;31:990 –96. Epub 2009 Dec 10
27. Cipriano LE, Steinberg ML, Gazelle GS, et al. Comparing and predicting thecosts and outcomes of patients with major and minor stroke using the BostonAcute Stroke Imaging Scale neuroimaging classification system. AJNR Am JNeuroradiol 2009;30:703– 09. Epub 2009 Jan 22
28. Rha JH, Saver JL. The impact of recanalization on ischemic stroke outcome: ameta-analysis. Stroke 2007;38:967–73
29. Sormani MP, Bruzzi P, Comi G, et al. MRI metrics as surrogate markers forclinical relapse rate in relapsing-remitting MS patients. Neurology2002;58:417–21
30. Orgogozo JM. The concepts of impairment, disability and handicap. Cerebro-vasc Dis 1994;4(suppl):2– 6
31. Duncan PW, Jorgensen HS, Wade DT. Outcome measures in acute stroketrials: a systematic review and some recommendations to improve practice.Stroke 2000;31:1429 –38
32. Prentice RL. Surrogate endpoints in clinical trials: definition and operationalcriteria. Stat Med 1989;8:431– 40
33. Merino JG, Latour LL, Todd JW, et al. Lesion volume change after treatmentwith tissue plasminogen activator can discriminate clinical responders fromnonresponders. Stroke 2007;38:2919 –23
34. Rother J, Schellinger PD, Gass A, et al. Effect of intravenous thrombolysis onMRI parameters and functional outcome in acute stroke <6 hours. Stroke2002;33:2438 – 45
35. Chalela JA, Kang DW, Luby M, et al. Early magnetic resonance imaging find-ings in patients receiving tissue plasminogen activator predict outcome: in-sights into the pathophysiology of acute stroke in the thrombolysis era. AnnNeurol 2004;55:105–12
36. Barber PA, Parsons MW, Desmond PM, et al. The use of PWI and DWI mea-sures in the design of “proof-of-concept” stroke trials. J Neuroimaging 2004;14:123–32
358 Tourdias � AJNR 32 � Feb 2011 � www.ajnr.org