Embed Size (px)
Citation preview
9 November 2006
Final Draft Technical Memorandum
To: Mr. Dennis O. Lamb, Director of Engineering and Operations Vallecitos Water District
From: Sandra Carlson, P.E. and Fred Massabki, P.E., Kennedy/Jenks Consultants
Subject: Technical Memorandum Merriam Mountain Phased Wastewater Flow Impact Report Kennedy/Jenks Project No. 0687115*00
Executive Summary
Kennedy/Jenks Consultants (K/J) studied the impact that the projected wastewater flows generated by the proposed Merriam Mountain Project (Merriam Mountain) will have upon the wastewater collection and treatment facilities in the Vallecitos Water District (VWD). The projected average wastewater flows were generated for the land area in the 2002 Water, Wastewater and Water Reclamation Master Plan Update (2002 Master Plan). The 2002 Master Plan relied on existing zoning information to assign different land use categories to the Merriam Mountain Project site. Utilizing the phasing information and updated land use acreages provided by Fuscoe Engineering (Fuscoe Engineering Data) in July 2006 and the wastewater duty factors presented in the 2002 Master Plan, a second set of projected average flows were generated. These two sets of projections can be summarized as follows:
• 2002 Master Plan Land Use with 2002 Duty Factors, as presented in the 2002 Master Plan
• Fuscoe Engineering Data, with 2006 phasing Information and updated Land Use provided by Fuscoe Engineering with 2002 Duty Factors
K/J studied the impact that Merriam Mountain will have upon the existing gravity mains in VWD extending from the existing 8-inch gravity main in Twin Oaks Valley Road just north of the intersection with Deer Springs Road, to the existing 42-inch gravity main in San Marcos Blvd near Lift Station No. 1. For this analysis, only the existing and proposed parallel outfall for the conveyance of peak flows to the Encina Water Pollution Control Facility (EWPCF) was examined. The wastewater flow impact of Merriam Mountain upon the District’s existing and proposed parallel outfall was identified. Finally, impacts to VWD’s ultimate liquid and solids treatment capacity at the EWPCF were quantified.
The proposed phasing of the Merriam Moutain Project, provided by Fuscoe Engineering, indicates buildout will be complete for the Project by 2014. Following the methodology outlined in the 2002 Master Plan, peak wastewater flows which accounted for daily usage patterns, as

Final Draft Technical Memorandum Mr. Dennis O. Lamb, Director of Engineering and Operations 9 November 2006 Page 2
well as Infiltration and Inflow (I&I), were analyzed using the hydraulic model developed as part of the 2002 Master Plan for the 2006, 2020 and Ultimate (build-out) time increments.
Excluding facilities associated with the proposed Parallel Outfall, the costs attributed to Merriam Mountain are presented in Table 1. The District has decided to accommodate peak flows by conveying them to the EWPCF through the Existing and Proposed Parallel Land Outfall; however, the increased cost attributed to Merriam Mountain has yet to be determined by the District for the Parallel Outfall Facility.
Table 1 - Wastewater Facility Costs Attributed to Merriam Mountain (Excluding Parallel Outfall Facility)
Facility Cost Attributed to Merriam Mountain
Project Gravity Mains $1,789,296
Treatment Capacity $7,236,924 Parallel Land Outfall To be determined
TOTAL $9,026,220
The analysis indicates that due to the additional wastewater flows from Merriam Mountain, the following impacts affect the Existing/Proposed Parallel Outfall:
1. The parallel outfall is estimated to be required in 2013 with the additional Merriam Mountain Development wastewater flows, instead of 2014 with the 2002 Master Plan ultimate flow projections. This projection is calculated assuming a linear increase in wastewater flow projections and a linear decrease in Meadowlark excess capacity, between 2006 and 2020.
2. One pipe segment (approximately 320 feet in length) will exceed the Sewer System Design Criteria within the Proposed Parallel Land Outfall just before reaching the EWPCF. While the pipe does not surcharge, the d/D is greater than 0.75 for this pipeline. For the remaining pipelines in the Proposed Parallel Land Outfall, the Merriam Mountain wastewater flows do not impact the size of the project. However, while the sizes are not impacted, the capacity of the parallel outfall is still being utilized by the Merriam Mountain Project. Therefore, there should be a cost attributed to Merriam Mountain for the Parallel Outfall Improvements. However, at this time, the District has not determined what the associated cost will be for exceeding the design criteria for the 320 feet pipe segment or for using the Parallel Land Outfall.
The option of mitigating the peak flows by increasing storage at Lift Station No. 1, as opposed to constructing a parallel outfall was evaluated for the additional flow generated by Merriam Mountain in combination with other proposed developments. The results indicate the use of a peak storage basin at Lift Station No. 1 is not feasible as projected flows increase beyond the
Final Draft Technical Memorandum Mr. Dennis O. Lamb, Director of Engineering and Operations 9 November 2006 Page 3
2002 Master Plan levels. Therefore, the District has decided not to pursue the peak storage option and will continue forward with the parallel land outfall.
Study Area
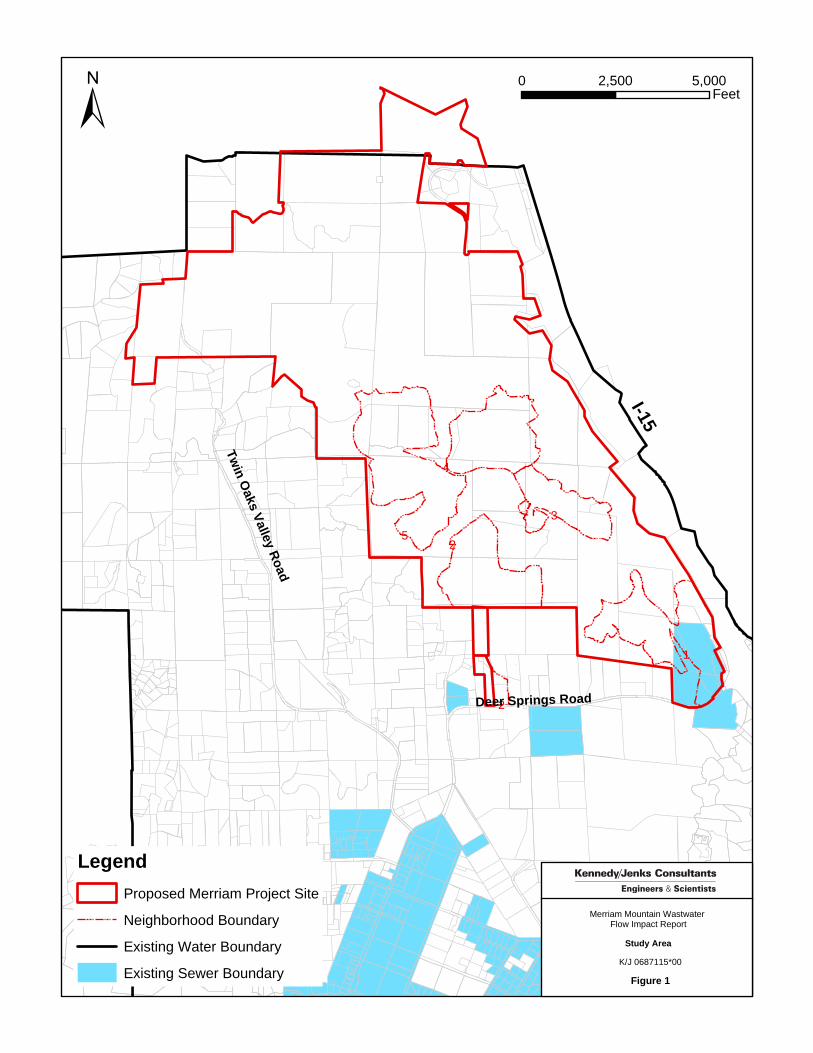
Figure 1, attached at the end of this Technical Memorandum (TM), illustrates the location of the proposed Merriam Mountain site, as well as the sewer service boundaries for VWD. A portion of Merriam Mountain (APN 172-091-25) lies outside of VWD. This parcel will utilize septic service or a flow transfer agreement with an agency to the northeast for its projected wastewater flows, according to the Draft Master Plan of Sewer for the Merriam Mountains Project (Dexter Wilson Report), prepared by Dexter Wilson Engineering in February, 2006. All other parcels within the proposed Merriam Mountain site are discussed in this TM.
Wastewater Flow Projections
The methodology developed by K/J for the 2002 Master Plan was utilized for the purposes of developing projected wastewater flows for Merriam Mountain.
Land Use Categories and Average Wastewater Flow
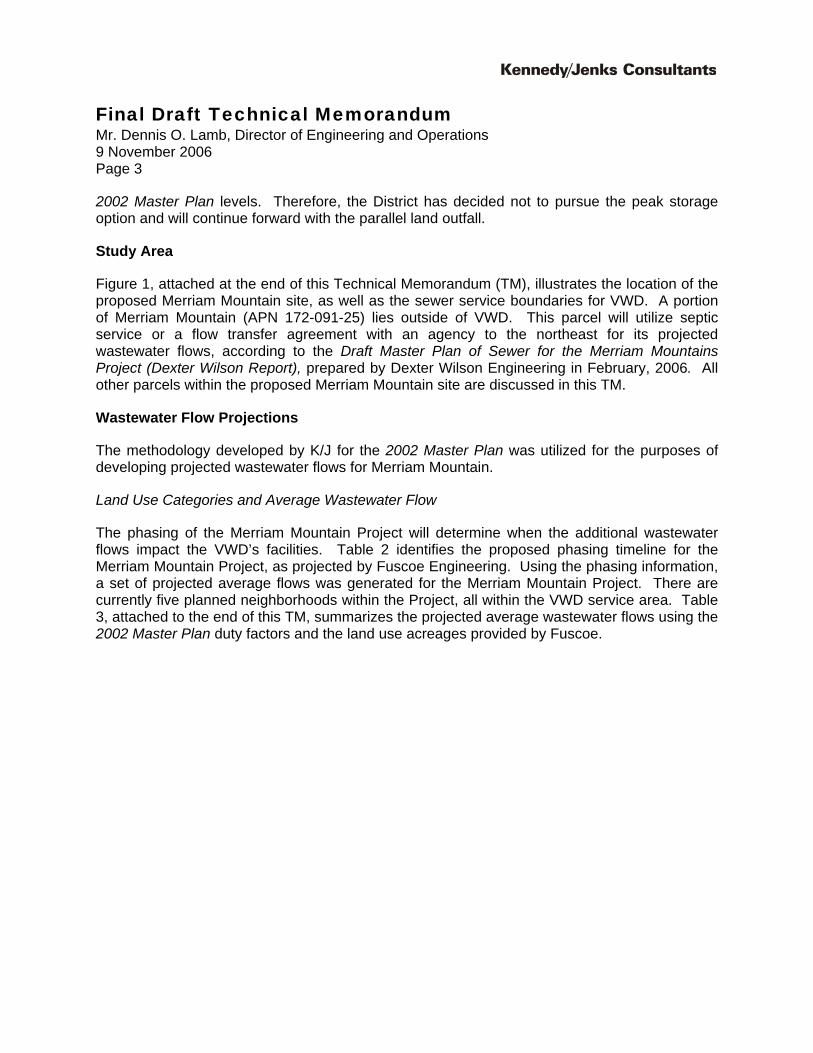
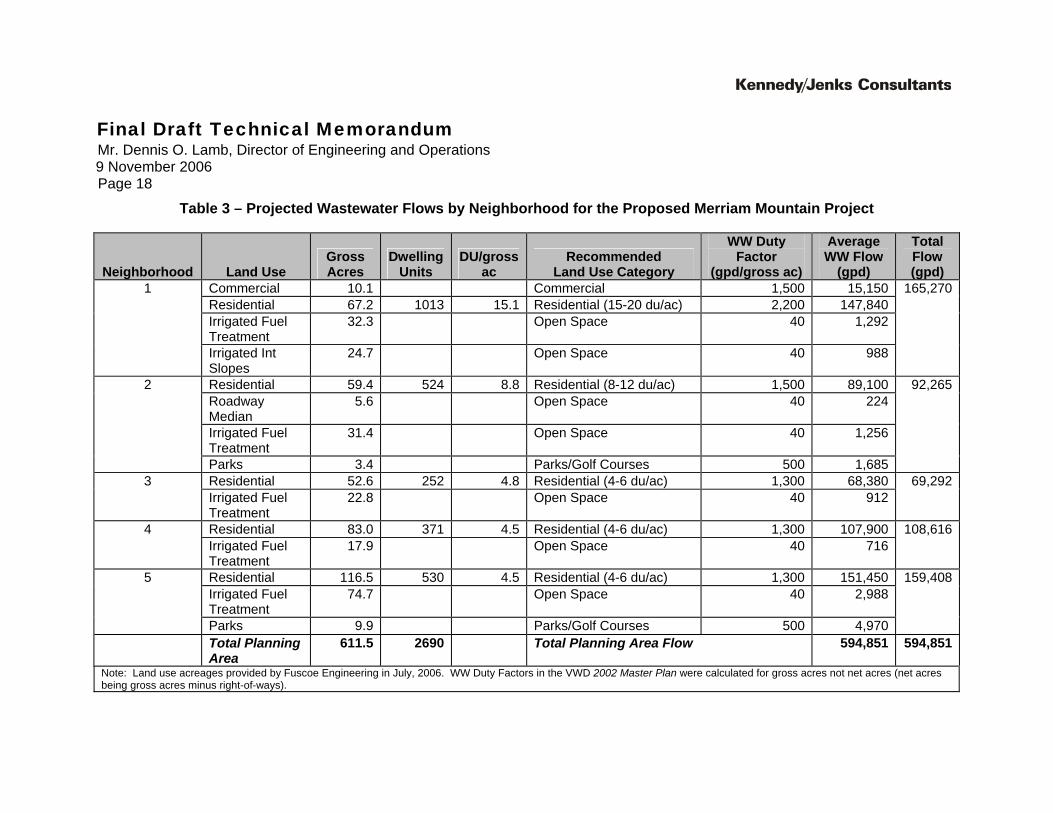
The phasing of the Merriam Mountain Project will determine when the additional wastewater flows impact the VWD’s facilities. Table 2 identifies the proposed phasing timeline for the Merriam Mountain Project, as projected by Fuscoe Engineering. Using the phasing information, a set of projected average flows was generated for the Merriam Mountain Project. There are currently five planned neighborhoods within the Project, all within the VWD service area. Table 3, attached to the end of this TM, summarizes the projected average wastewater flows using the 2002 Master Plan duty factors and the land use acreages provided by Fuscoe.
Final Draft Technical Memorandum Mr. Dennis O. Lamb, Director of Engineering and Operations 9 November 2006 Page 4
Table 2 – Merriam Mountains Preliminary Phasing for Sewer Planning
Neighborhood Dwelling
Units 2009 2010 2011 2012 2013 2014 Entitlement Phase/EIR – (2006-2007) Prepare construction plans and specifications – (2007-2008) Construct Phase 1 infrastructure – (2008-2009) Neighborhood 1 Residential (du’s) 1,013 du's 173 200 200 200 200 40Neighborhood 1 Commercial (sq. ft.) 110,000 sq. ft. 110,000Neighborhood 2 (du’s) * 524 du's 77 200 200 47 Neighborhood 3 (du’s) 252 du's 100 100 52 Neighborhood 4 (du’s) 371 du's 201 170 Neighborhood 5 (du’s) 530 du's 130 400
TOTAL RESIDENTIAL 2,690 du's
* For Neighborhood 2, PA 6, assume 50 units in 2009 and 55 units in 2010.
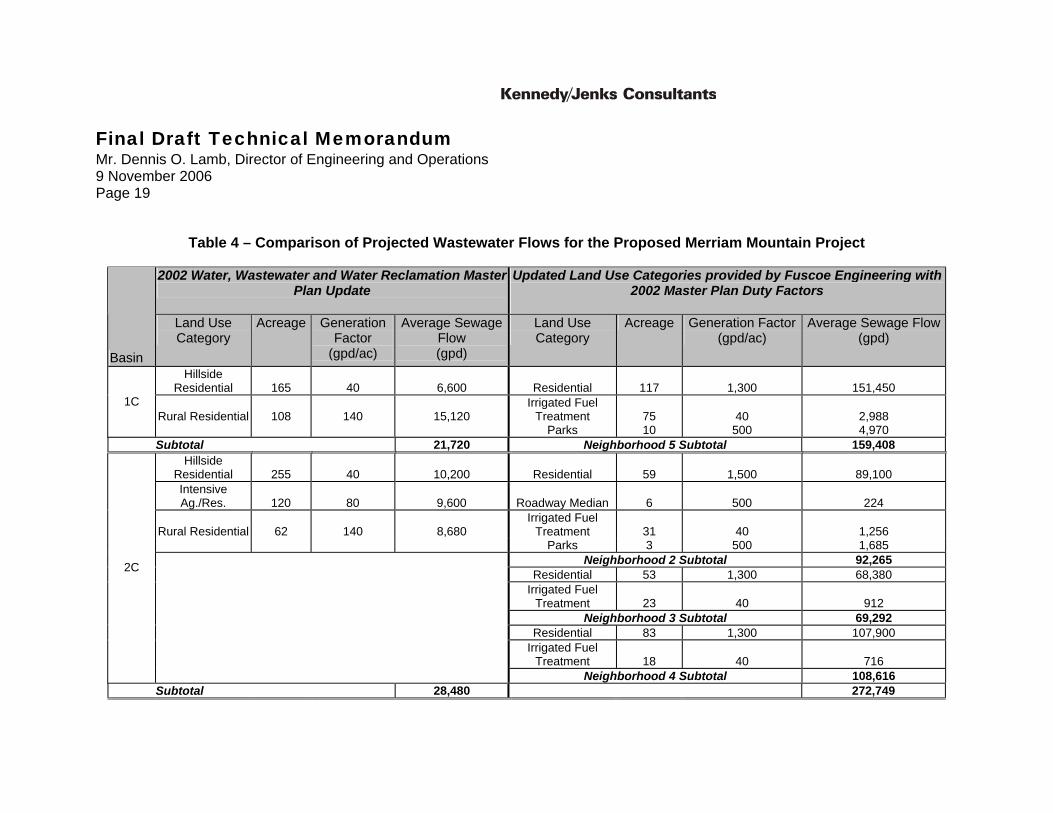
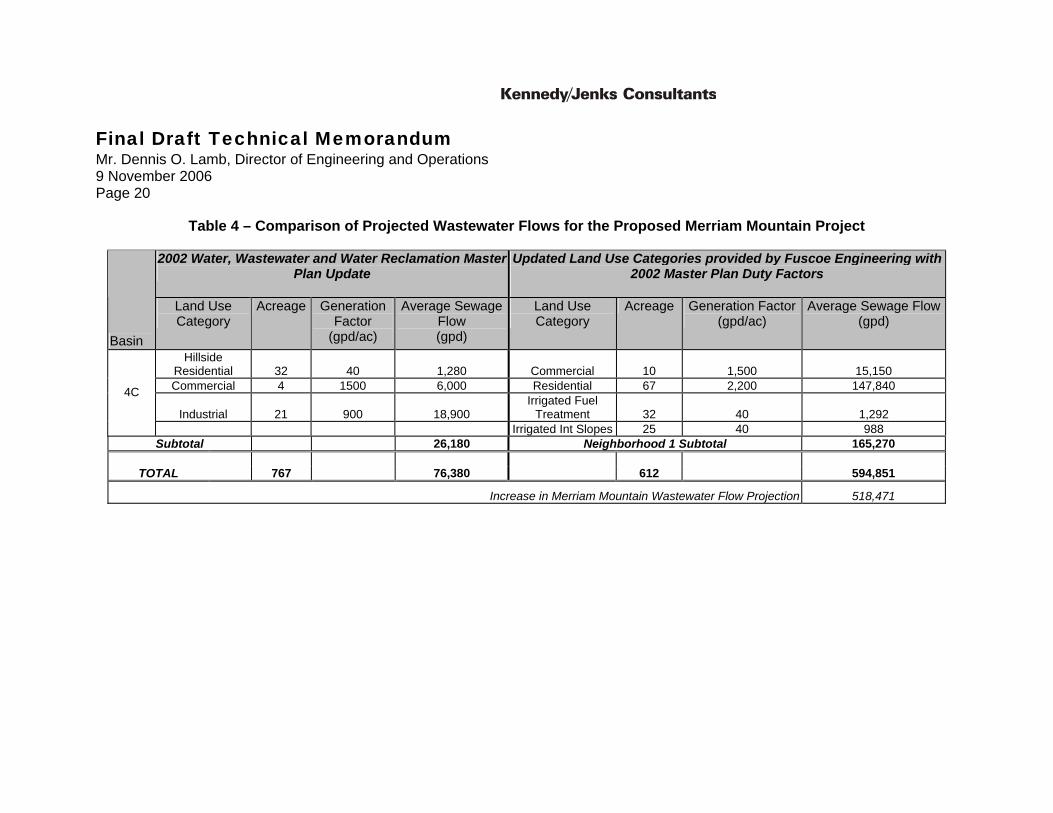
The proposed Merriam Mountain Project site lies within portions of three sewer basins 1C, 2C and 4C, as identified in the 2002 Master Plan. The 2002 Master Plan projected the average wastewater flows for the Merriam Mountain land area using existing zoning information to assign different land use categories to the Merriam Mountain site. This set of flows were compared to the Fuscoe flows presented in Table 3 for projected average flows generated, as shown in Table 4, attached to the end of this TM. For this impact flow report, the Fuscoe set of wastewater flow projections was utilized.
As can be seen from Table 4, for the three sewer basins already serviced by VWD, the 2002 Master Plan projected that the Merriam Mountain Project area would generate 76,380 gpd of ultimate average daily wastewater flow requiring treatment by VWD. Based on the updated Fuscoe land use files and 2002 Master Plan duty factors, Merriam Mountain is now projected to generate an ultimate average daily wastewater flow of 594,851 gpd, an increase of 0.52 mgd (518,471 gpd).
Diurnal Patterns and Infiltration & Inflow (I&I)
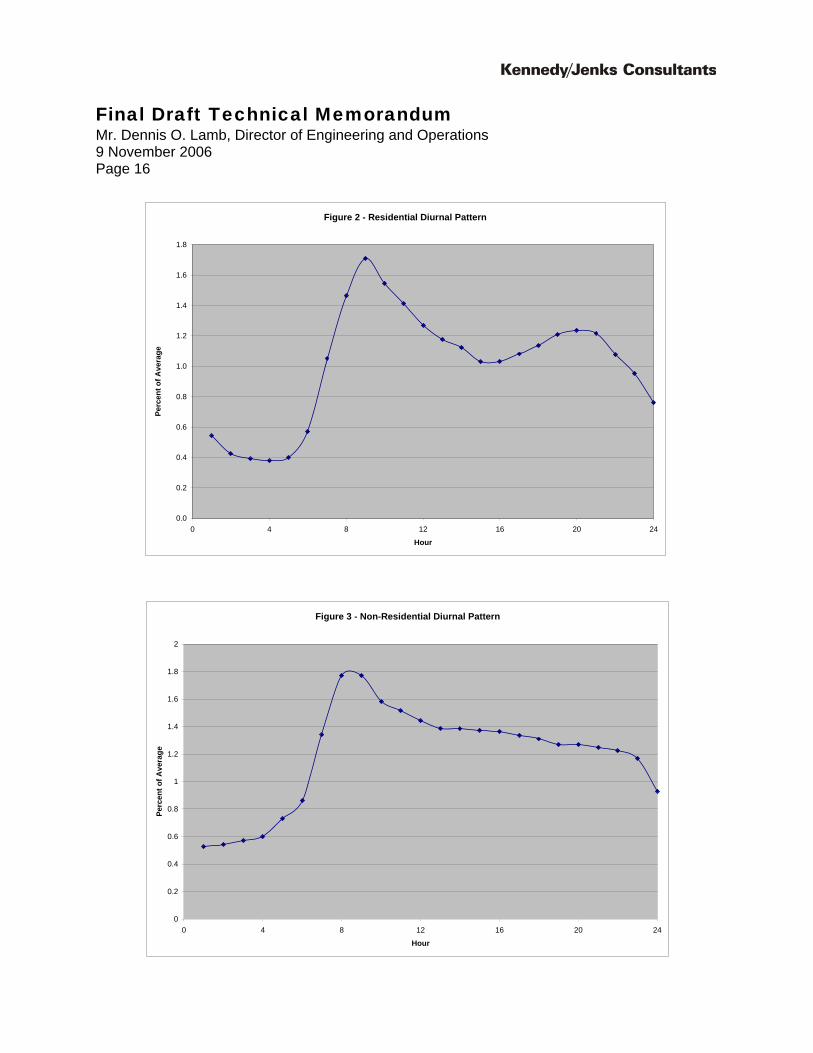
A determination of the adequacy of the wastewater system is based upon the ability of the system to convey peak wastewater flows. To analyze the District’s collection system over a specified time period, a SewerCAD 96-hour (4 day) Extended Period Simulation (EPS) was used. To add greater accuracy to the system model, allowances for travel of flow over time are made which affects downstream peaks. The residential and non-residential diurnal use patterns adopted by VWD in the 2002 Master Plan were applied to the projected average wastewater flows for this purpose. The patterns are illustrated on Figures 2 and 3, attached to the end of this document. The results of the SewerCAD EPS include the maximum flow entering into VWD’s wastewater collection system. This flow is the peak dry weather flow of the system.
Final Draft Technical Memorandum Mr. Dennis O. Lamb, Director of Engineering and Operations 9 November 2006 Page 5
K/J applied the methodology utilized in the 2002 Master Plan for loading infiltration and inflow into the wastewater system model for this TM. This methodology is described below:
1. Peak Dry Weather Flow (PDWF) at each time step was routed through the existing hydraulic model using the recommended diurnal patterns defined above. The volume at each outfall point (i.e. Land Outfall and Meadowlark Water Reclamation Facility (MRF)) was then totaled.
2. The Peak Wet Weather Flow (PWWF) for each time step was calculated based upon the VWD recommended peak wet weather flow curve shown below, where the Average Dry Weather Flow Rate is in mgd:
Peak Wet Weather Factor = 2.78 x (Average Dry Weather Flow Rate)-0.087
3. The difference between the calculated PWWF and the modeled PDWF was assumed to be attributed to I&I.
4. The total volume of I&I was distributed to each sewershed area based upon a weighted average of rainfall dependent Infiltration/Inflow (RDI/I) rates established in the 2002 Master Plan (i.e. the sewersheds exhibiting the largest RDI/I rate were loaded with the largest proportionate share of the total I/I).
5. After the I&I for each sewershed was calculated, the I&I was distributed proportionally within the sewershed based upon area.
6. Steps 1 through 3 were then repeated with the projected average residential and non –residential wastewater flows, generated by Merriam Mountain, assigned to two manholes near the intersection of Deer Springs Road and Twin Oaks Valley Road. All wastewater flows previously attributed to the area comprising Merriam Mountain were removed from the hydraulic model.
7. The difference between the calculated I&I with Merriam Mountain, and the I&I calculated previously in the 2002 Master Plan (step 3), is the increase in I&I due to the proposed Merriam Project.
This method provides a calibrated PWWF through the wastewater collection system based upon the 2002 Master Plan recommended PWWF curve.
Sewer System Design Criteria
In analyzing a wastewater system, it is necessary to derive standards regarding the amount of flow that may be efficiently conveyed by a given wastewater pipeline. In an effort to provide reliable gravity sewer service while minimizing excessive wear or energy usage through force mains and lift stations, sanitary sewers shall be designed according to the design criteria used in the 2002 Master Plan:
Final Draft Technical Memorandum Mr. Dennis O. Lamb, Director of Engineering and Operations 9 November 2006 Page 6
• Pipes 12-inches in diameter and smaller: ½ full at peak flow
• Pipes over 12-inches in diameter: ¾ full at peak flow
• Minimum velocity: 2 feet per second
• Maximum velocity: 10 feet per second
• Manning’s n for gravity pipes: .013
• Manning’s n for siphons: .012
Hydraulic Modeling
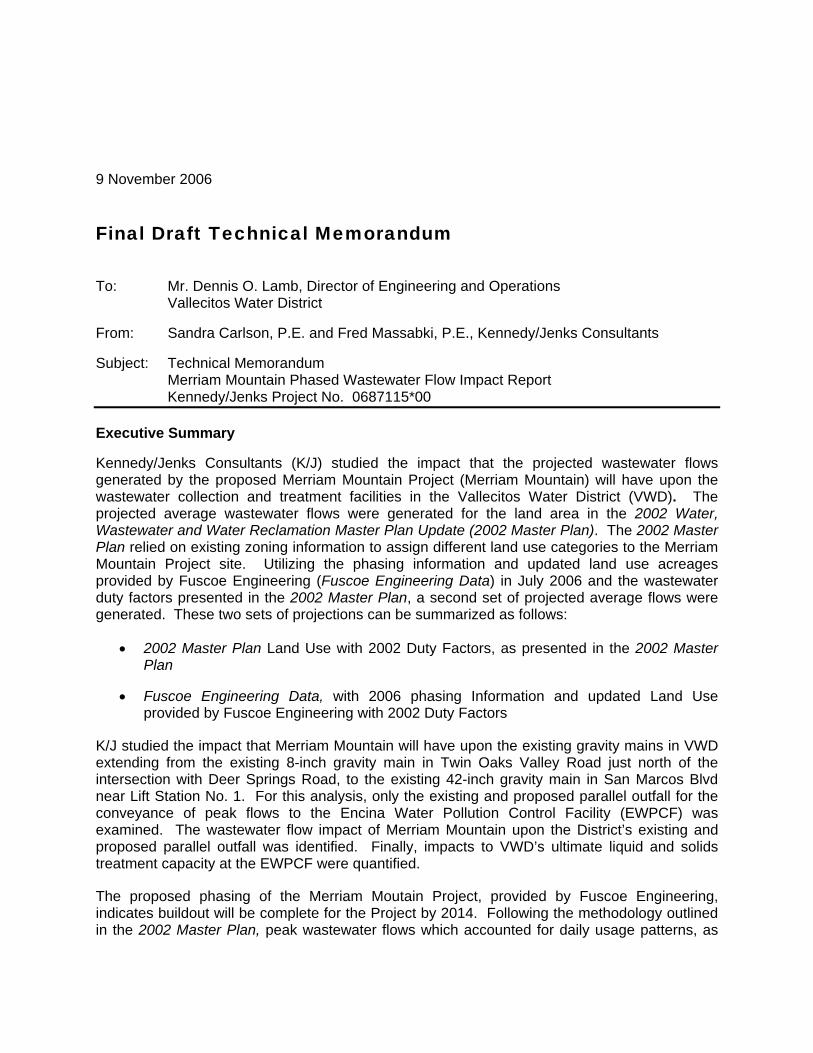
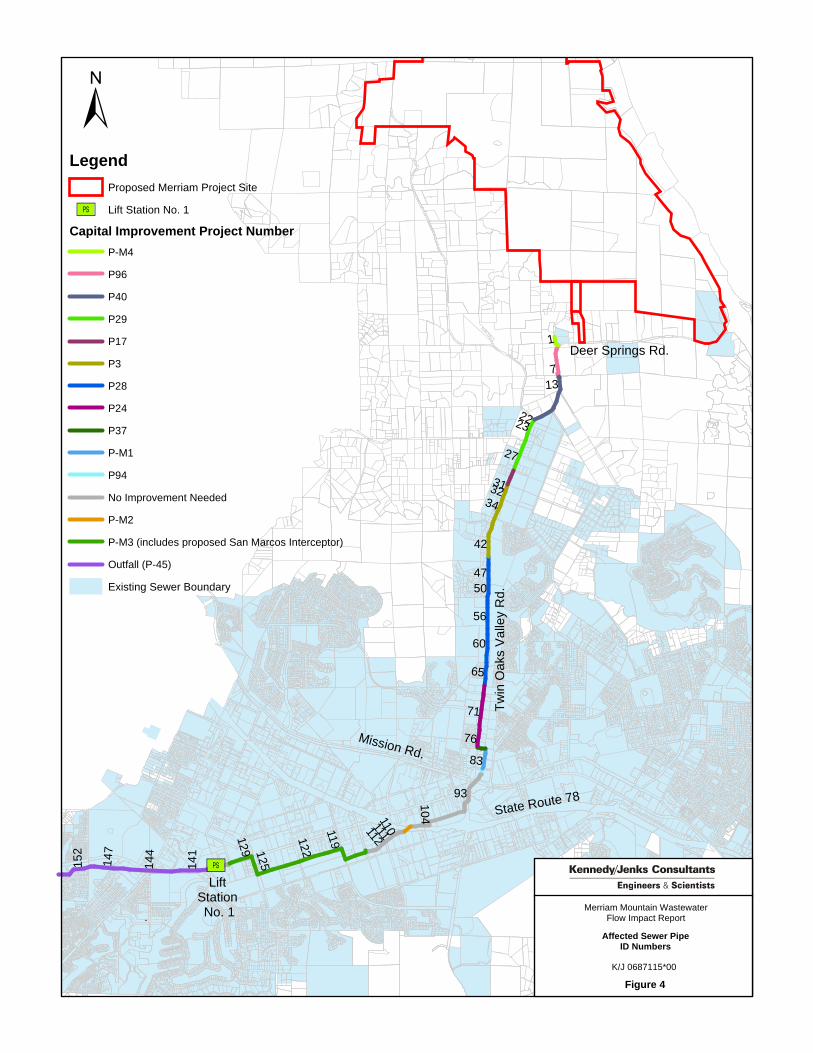
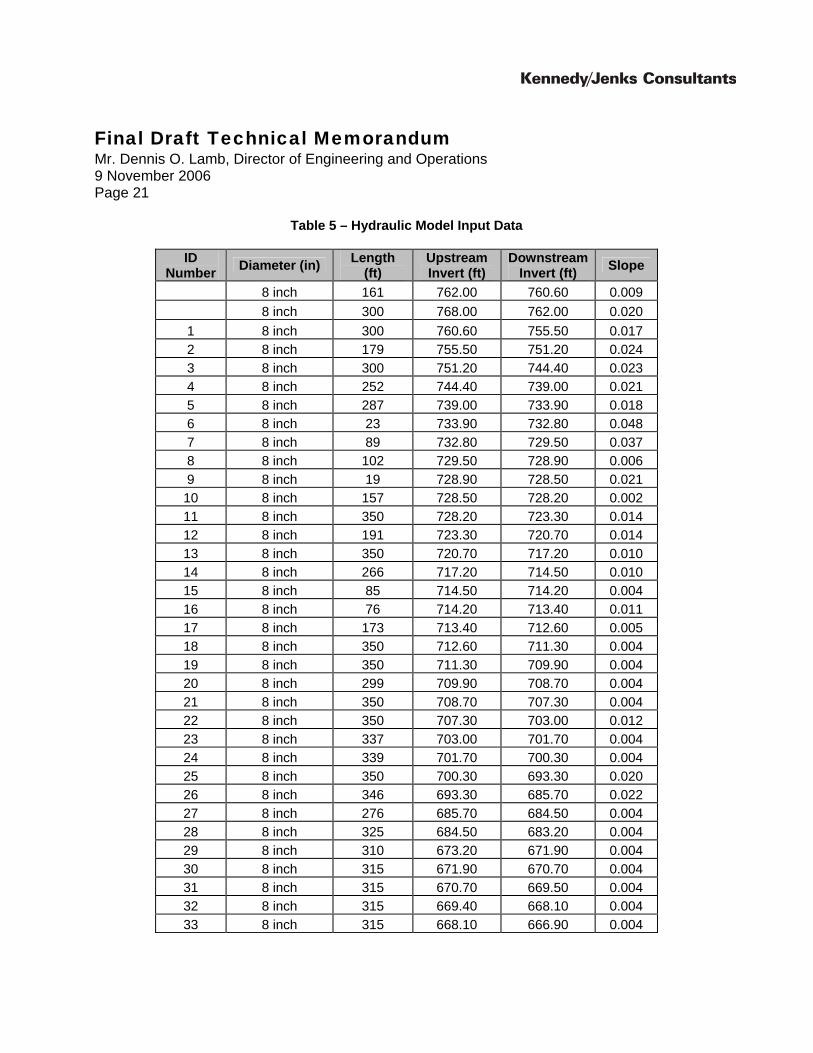
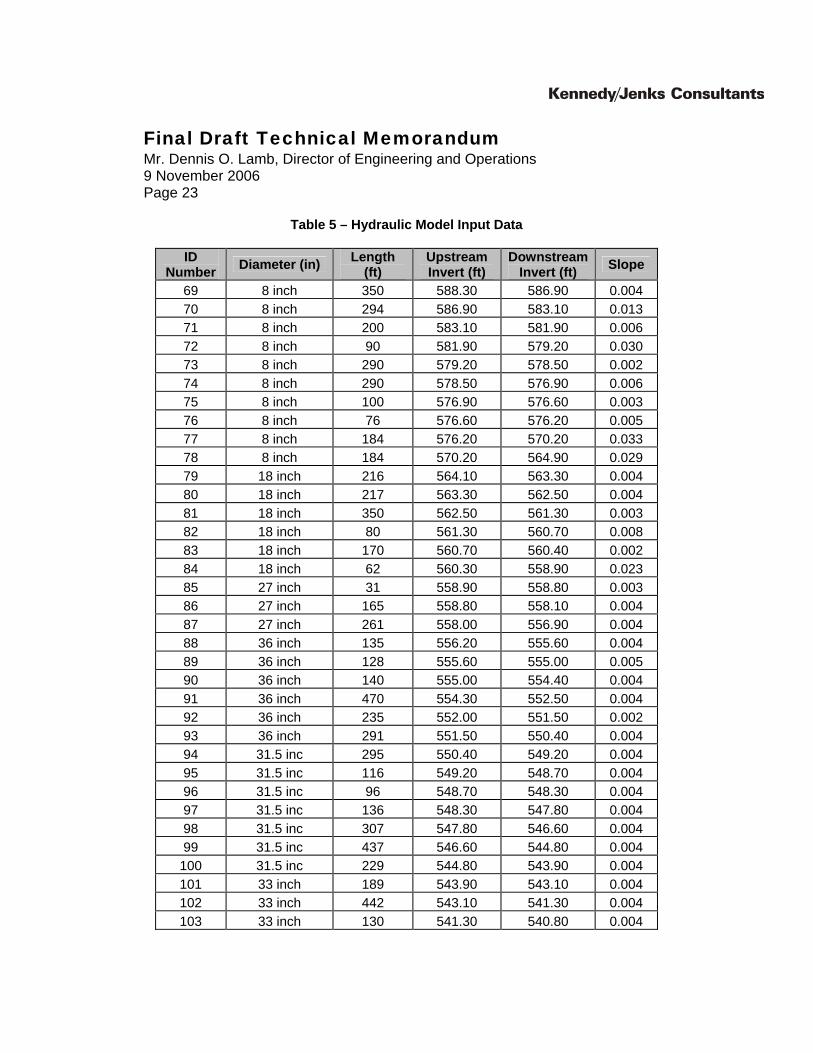
Each pipe segment affected by Merriam Mountain, extending from the existing 8-inch gravity main in Twin Oaks Valley Road north of the intersection with Deer Springs Road, to the existing 30-inch gravity main near the Encina Outfall was assigned a Pipe ID number, as illustrated on Figure 4. The hydraulic model input data for these pipes, as obtained from the District’s GIS database, is shown in Table 5. Figure 4 and Table 5 are both at the end of this document.
Two scenarios for 2006, 2020 and ultimate (buildout) condition Peak Wet Weather Flows were modeled for all contributing parcels in VWD utilizing the SewerCAD EPS hydraulic model developed as part of the 2002 Master Plan. The first scenario modeled the wastewater flow projections for each time increment as presented in the 2002 Master Plan, for all contributing parcels in VWD. In the second scenario, the projected wastewater flows generated by Merriam Mountain were assigned to the 8-inch gravity main on Twin Oaks Valley Road, at two manholes located near the intersection of Deer Springs Road. Results of these scenarios describe the PWWF wastewater flow impact that Merriam Mountain has upon the District’s facilities.
Unit Costs
The capital cost estimates for the proposed facilities were developed based on the Engineering New Record Construction Cost Index for Los Angeles, California area (ENR-CCI-LA). The ENR-CCI is an inflation index used to adjust prices from one time period to another. The cost estimates presented in this TM are based upon an ENR-CCI-LA cost index of 8563, for July 2006. Costs estimated herein for recommended facilities should be adjusted in the future either by making new estimates or by comparing the future ENR-CCI-LA index to 8563.
The capital costs provided in this Section are based on unit costs obtained from recently designed and constructed projects. These unit construction costs are approximate planning costs and include miscellaneous work necessary for complete and operable facilities, but they do not include right-of-way or site acquisition.
Engineering, administration services and contingencies have been included as a percentage of total construction costs. A factor of 20 percent of total construction cost has been used for engineering and administration, which includes but is not limited to the following:
Final Draft Technical Memorandum Mr. Dennis O. Lamb, Director of Engineering and Operations 9 November 2006 Page 7
• Planning and design reports • Design • CEQA Compliance • Permits • Surveying • Services during construction (submittals, as-builts) • Inspection
A factor of 20 percent of construction costs has been used to develop the total project cost.
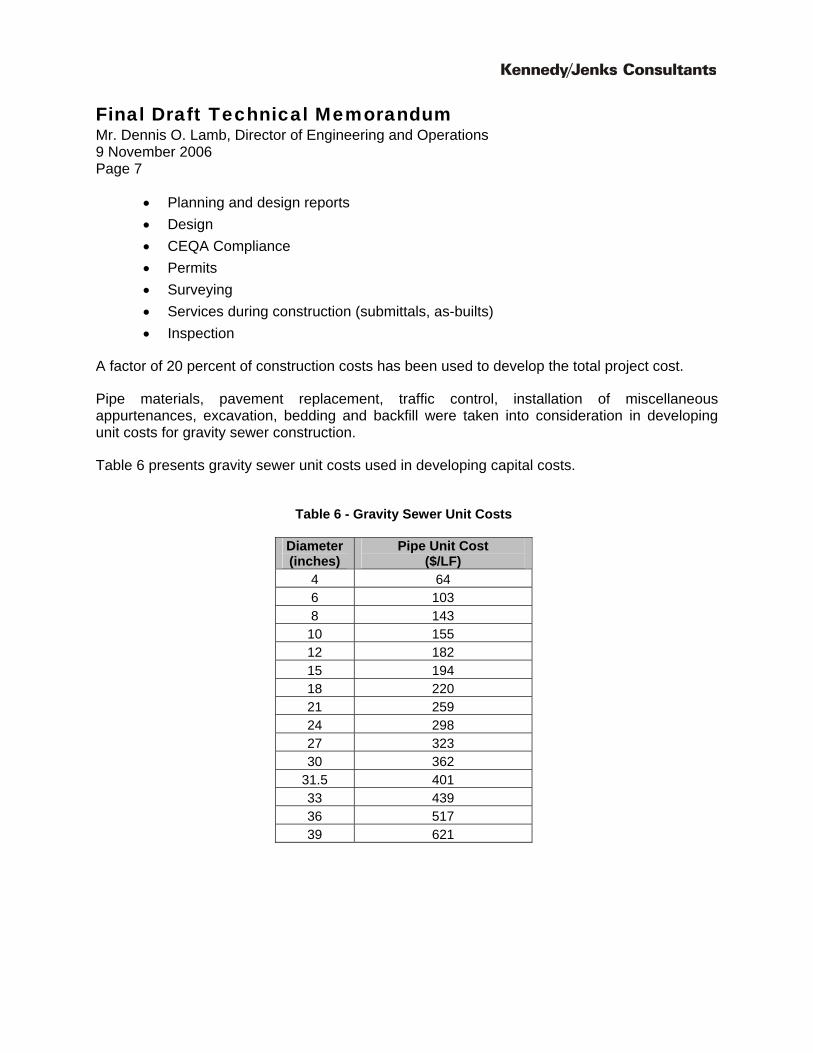
Pipe materials, pavement replacement, traffic control, installation of miscellaneous appurtenances, excavation, bedding and backfill were taken into consideration in developing unit costs for gravity sewer construction.
Table 6 presents gravity sewer unit costs used in developing capital costs.
Table 6 - Gravity Sewer Unit Costs
Diameter (inches)
Pipe Unit Cost ($/LF)
4 64 6 103 8 143
10 155 12 182 15 194 18 220 21 259 24 298 27 323 30 362
31.5 401 33 439 36 517 39 621
Final Draft Technical Memorandum Mr. Dennis O. Lamb, Director of Engineering and Operations 9 November 2006 Page 8
Wastewater Treatment Unit Costs are classified as eventual solids or liquids treatment requirements at the EWPCF. The unit cost for solids treatment of $3.90/gallon is based upon cost estimates for the District’s current Phase V expansion at the EWPCF. Liquid treatment unit costs are assumed to be $10/gallon.
Gravity Main Analysis (Excluding Outfall)
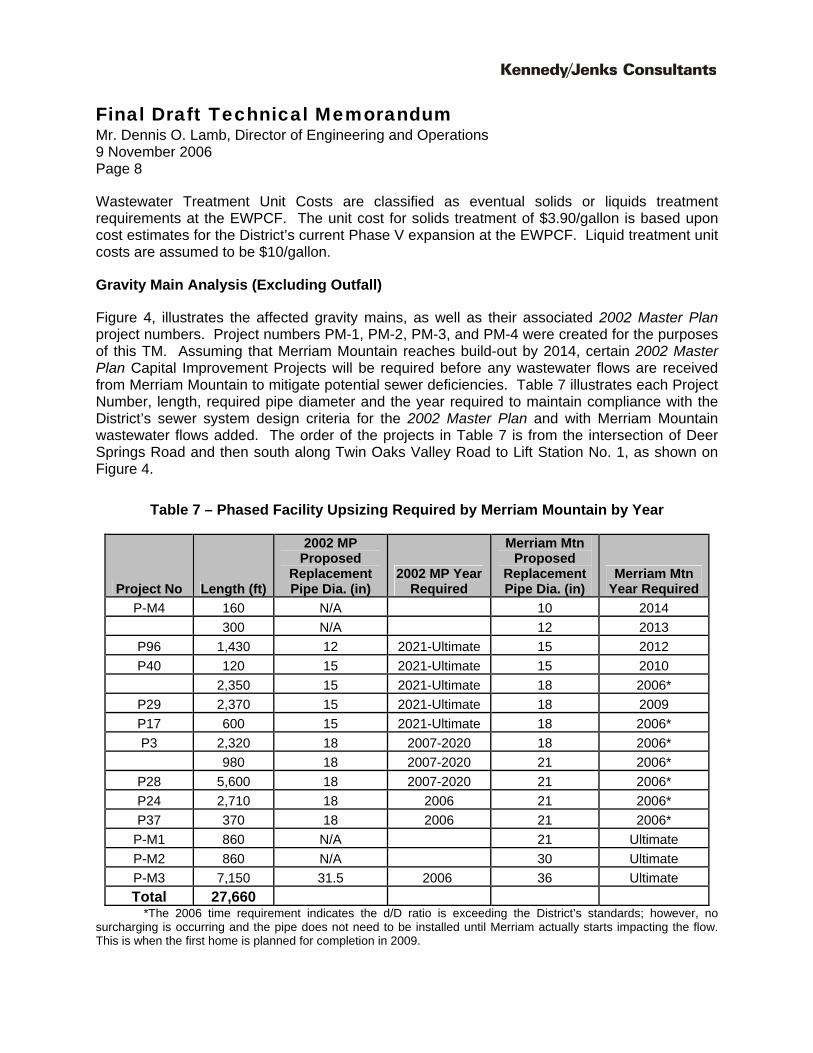
Figure 4, illustrates the affected gravity mains, as well as their associated 2002 Master Plan project numbers. Project numbers PM-1, PM-2, PM-3, and PM-4 were created for the purposes of this TM. Assuming that Merriam Mountain reaches build-out by 2014, certain 2002 Master Plan Capital Improvement Projects will be required before any wastewater flows are received from Merriam Mountain to mitigate potential sewer deficiencies. Table 7 illustrates each Project Number, length, required pipe diameter and the year required to maintain compliance with the District’s sewer system design criteria for the 2002 Master Plan and with Merriam Mountain wastewater flows added. The order of the projects in Table 7 is from the intersection of Deer Springs Road and then south along Twin Oaks Valley Road to Lift Station No. 1, as shown on Figure 4.
Table 7 – Phased Facility Upsizing Required by Merriam Mountain by Year
Project No Length (ft)
2002 MP Proposed
Replacement Pipe Dia. (in)
2002 MP Year Required
Merriam Mtn Proposed
Replacement Pipe Dia. (in)
Merriam Mtn Year Required
P-M4 160 N/A 10 2014 300 N/A 12 2013
P96 1,430 12 2021-Ultimate 15 2012 P40 120 15 2021-Ultimate 15 2010
2,350 15 2021-Ultimate 18 2006* P29 2,370 15 2021-Ultimate 18 2009 P17 600 15 2021-Ultimate 18 2006* P3 2,320 18 2007-2020 18 2006*
980 18 2007-2020 21 2006* P28 5,600 18 2007-2020 21 2006* P24 2,710 18 2006 21 2006* P37 370 18 2006 21 2006*
P-M1 860 N/A 21 Ultimate P-M2 860 N/A 30 Ultimate P-M3 7,150 31.5 2006 36 Ultimate Total 27,660
*The 2006 time requirement indicates the d/D ratio is exceeding the District’s standards; however, no surcharging is occurring and the pipe does not need to be installed until Merriam actually starts impacting the flow. This is when the first home is planned for completion in 2009.
Final Draft Technical Memorandum Mr. Dennis O. Lamb, Director of Engineering and Operations 9 November 2006 Page 9
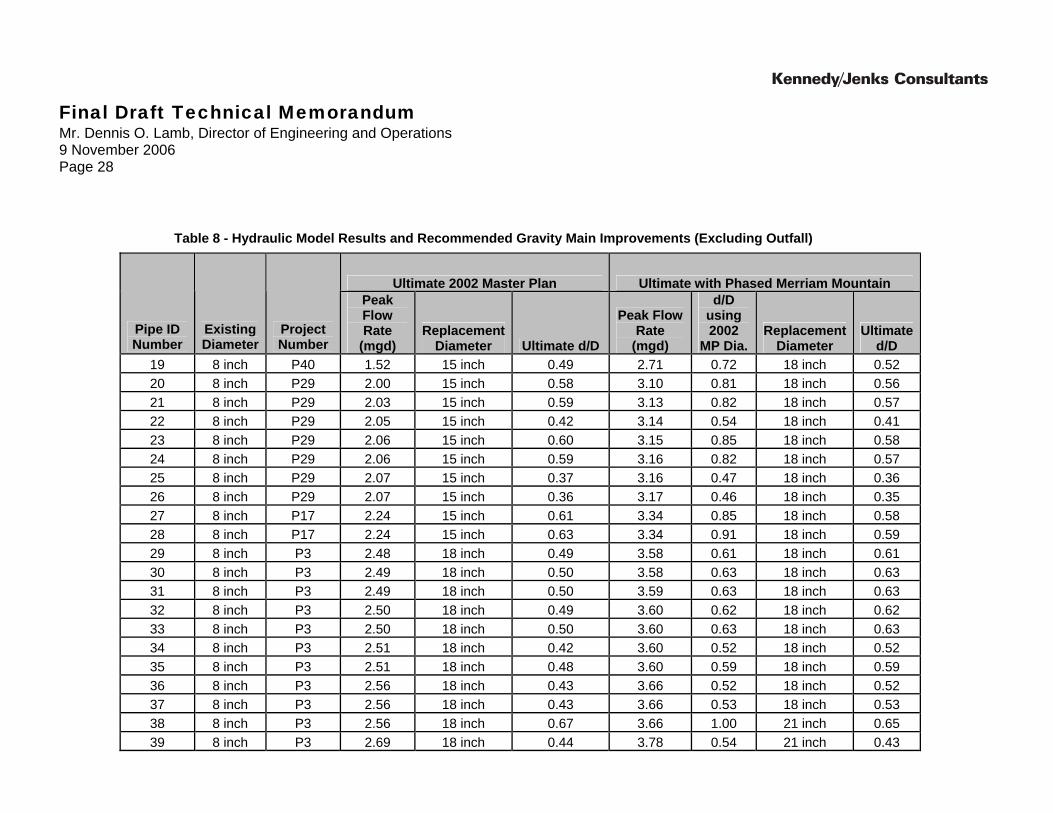
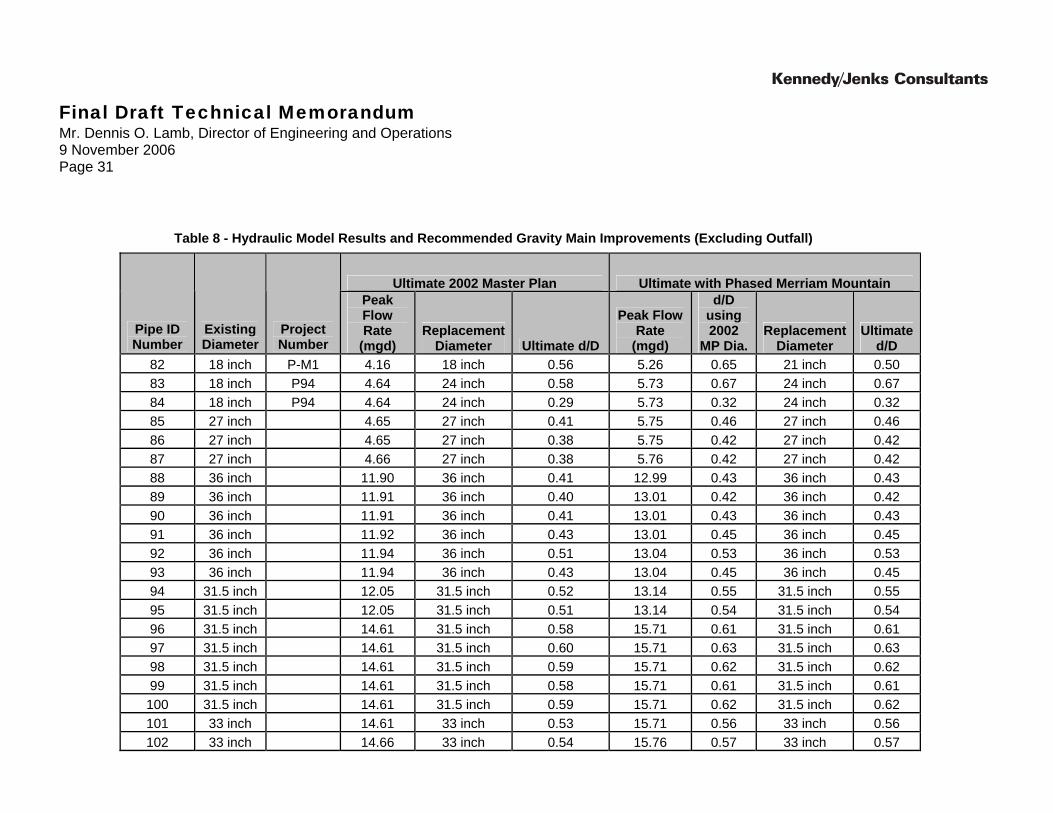
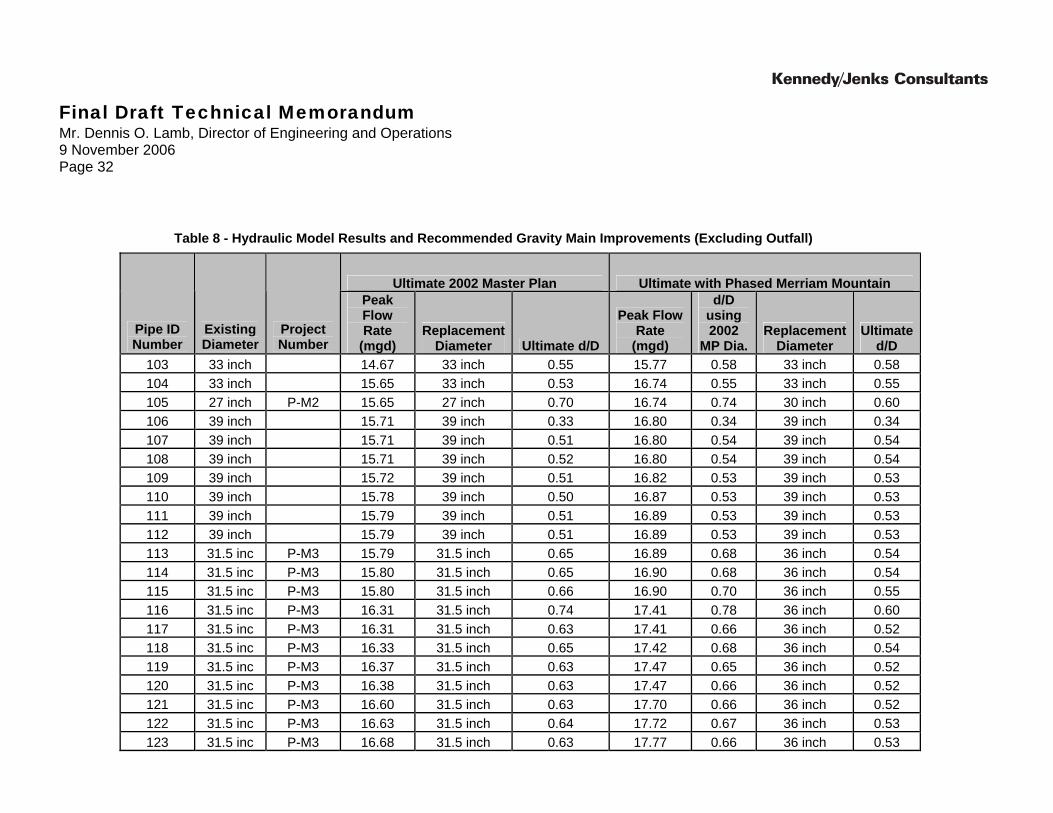
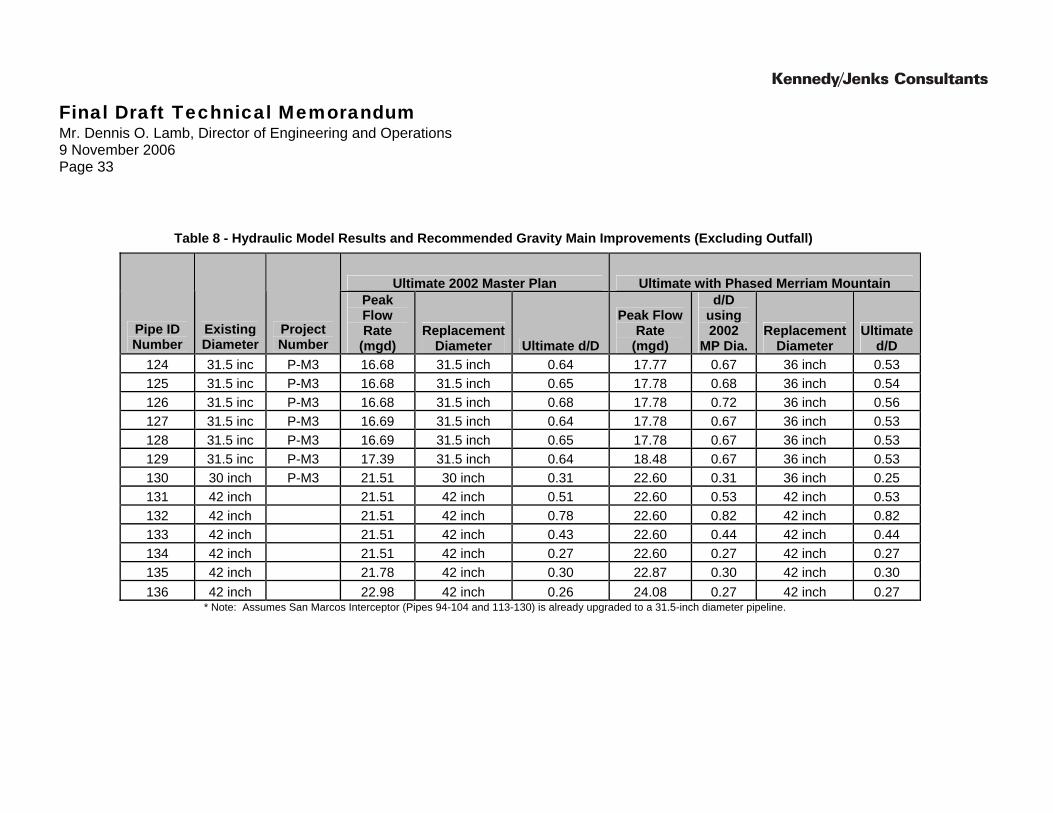
Table 8, attached to the end of this document, compares the ultimate gravity sewer size requirements in the 2002 Master Plan with the ultimate sizes required after the addition of Merriam Mountain’s flows. In addition to presenting ultimate diameters, Table 8 also illustrates the projected flow rates and corresponding depth-to-Diameter ratios for both hydraulic model scenarios. All pipe diameters presented satisfy the District’s sewer system design criteria in ultimate (build-out) conditions. Results in Table 8 are given for the gravity mains extending from the 8-inch gravity main in Twin Oaks Valley Road near the intersection with Deer Springs Road, to the 42-inch gravity main in San Marcos Blvd near Lift Station No. 1.
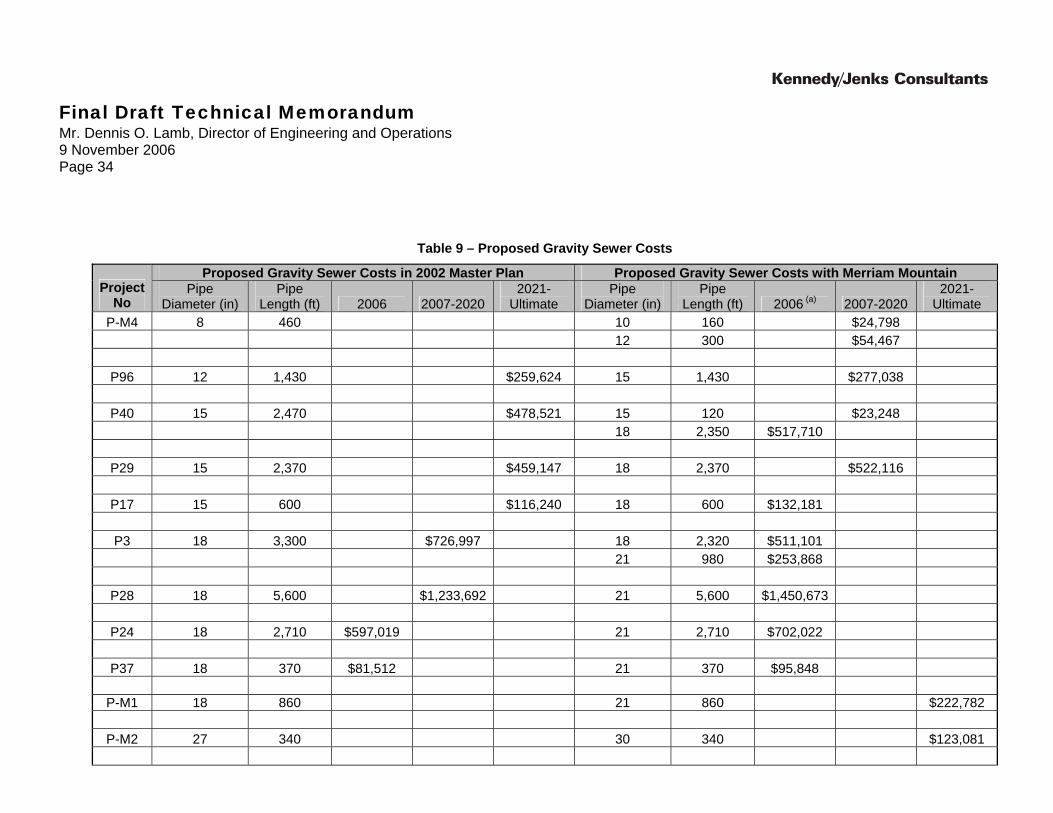
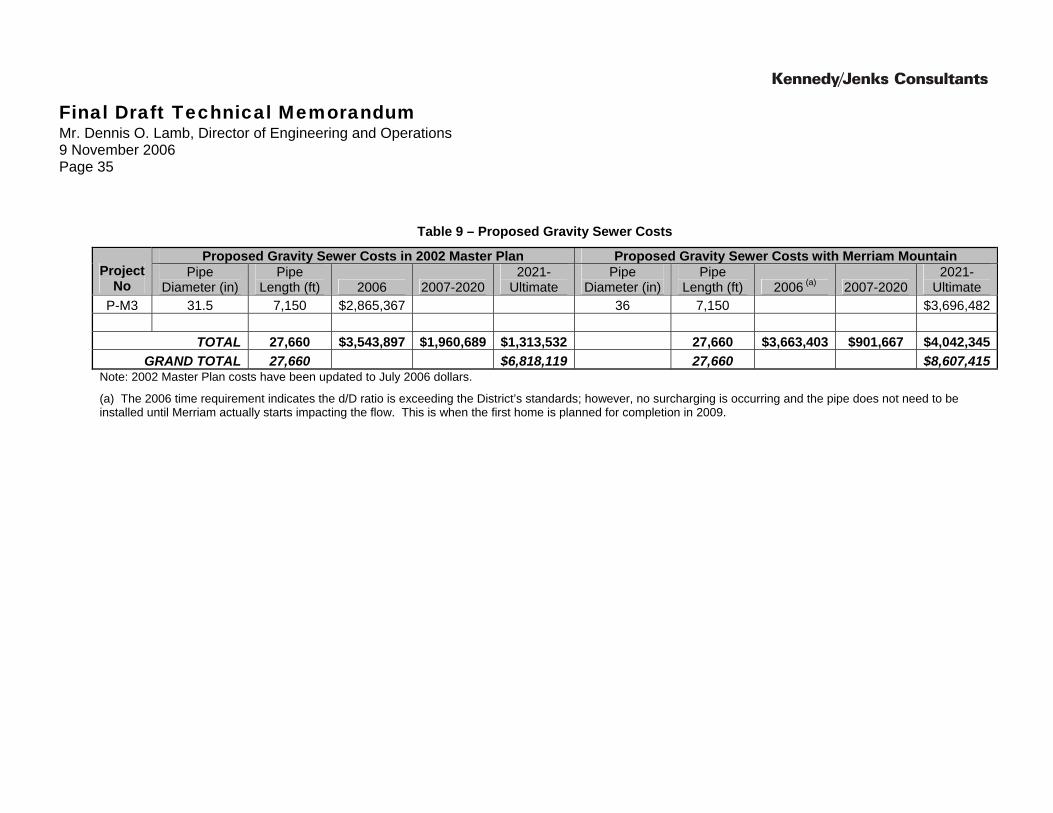
Table 9, attached to the end of this document, compares the ultimate gravity main Capital Improvement Program (CIP) costs presented in the 2002 Master Plan with those required after the addition of Merriam Mountain. Costs are allocated to the first time increment in which the existing pipe diameter would fail to meet the District’s sewer system design criteria. Compared with the 2002 Master Plan escalated costs, the gravity main CIP costs have increased by $1,789,296, from $6,818,119 to $8,607,415. Outfall Analysis
The conveyance of peak flows to the EWPCF through the existing and a proposed parallel land outfall has been incorporated into this analysis. It was decided by the District that the alternative of providing peak flow storage at Lift Station No. 1 was not viable and therefore, was not evaluated in this analysis. Figure 5, attached at the end of this document, illustrates the components of the land outfall examined as a portion of this wastewater flow impact TM.
The land outfall alternative was analyzed using a combination of spreadsheet analysis and the District’s SewerCAD model. The following sections summarize the basic assumptions and results of the land outfall peak flow analysis.
Land Outfall Assumptions
A set of basic assumptions for analyzing the land outfall improvements was developed in the 2002 Master Plan. The basic assumptions define the design parameters, wastewater flows, and existing capacities used in the peak flow analysis. Preliminary hydraulic analysis simulations were analyzed to establish existing pipeline capacities within the land outfall. The basic assumptions used for this analysis are as follows:
• All gravity mains were modeled with a Manning’s n of 0.013 and all siphons were modeled with a Manning’s n of 0.012.
• The Palomar Joint Land Outfall Interceptor Interagency Agreement dated January 8, 1985 established the following Capacity Ownership percentages in the land outfall:

Final Draft Technical Memorandum Mr. Dennis O. Lamb, Director of Engineering and Operations 9 November 2006 Page 10
Table 10 – Capacity Ownership Percentage by Agency
Agency Percentage (%)
Capacity (mgd)
Carlsbad 23.98 5.00
Vista 17.99 3.75
VWD 58.03 12.10
TOTALS 100.00 20.85
Therefore, 8.75 mgd of PWWF from Vista and Carlsbad was loaded in the model downstream of the District’s existing El Camino Real peroxide station.
• The Meadowlark Reclamation Facility is currently in construction to be expanded from a capacity of 2.0 mgd to a capacity of 5.0 mgd, with a peak capacity of 8.0 mgd. The Lake San Marcos Lift Station was assumed to contribute 1,792 gpm or 2.58 mgd during peak wet weather conditions. The remaining 5.42 mgd of peak capacity was used to serve the area tributary to MRF and any excess capacity was used to accommodate peak flow from Lift Station No. 1 during the next decade or so. For 2020 and buildout conditions, the Meadowlark Service Area will require the 8.0 mgd of peak capacity to accommodate peak flow, with no excess capacity available for Lift Station No. 1.
• At a design capacity of 5.0 mgd, the MRF is assumed to contribute approximately 10% or 0.5 mgd of solids to the land outfall. Therefore, 0.5 mgd was loaded in the model at the existing solids connection.
• All model runs and storage calculations were performed over a 96-hour (4 day) extended period simulation. One significant rainfall event was assumed to occur within the first 8 hours of the simulation and contribute rainfall dependent I&I (RDII) diurnally over the next 48 hours. Following the 48-hour time step, normal peak dry weather flows were resumed. Diurnal patterns for residential and commercial flows are presented on Figures 2 and 3.
Land Outfall Analysis Conclusions
VWD has decided to convey all PWWF through the existing land outfall to the EWPCF. No peak flow storage is used as part of this analysis; however the existing capacity at Lift Station No. 1 and design capacity of MRF were used to mitigate peak flows for 2006 flow conditions only.
Final Draft Technical Memorandum Mr. Dennis O. Lamb, Director of Engineering and Operations 9 November 2006 Page 11
During 2006 peak wet weather conditions, the existing land outfall has adequate capacity to convey all peak flows, provided that Lift Station No. 1 and the excess capacity at the MRF is used to mitigate peak flows above 10.78 mgd from the Central tributary area.
Following are the results of the analysis:
• There are two reaches of 30-inch diameter gravity pipeline between Lift Station No. 1 and Siphon A, with a diameter of 30-inches and a slope of 0.002 that have a design capacity of 10.78 mgd. As presented in Table 5, these are pipes 149, 152 and 153. Accordingly, 10.78 mgd was used as the design capacity of the District-owned portion of the outfall for analysis.
• Using a Manning’s n of 0.012 for the siphons, the first siphon has a capacity of 13.4 mgd.
• As discussed above, during 2006 peak wet conditions and using Lift Station No. 1 to convey peak flows above 10.78 mgd to MRF, no improvements to the existing land outfall are necessary. It will, however, be necessary to parallel the land outfall in order to adequately convey 2020 and ultimate peak wet weather flows to the EWPCF.
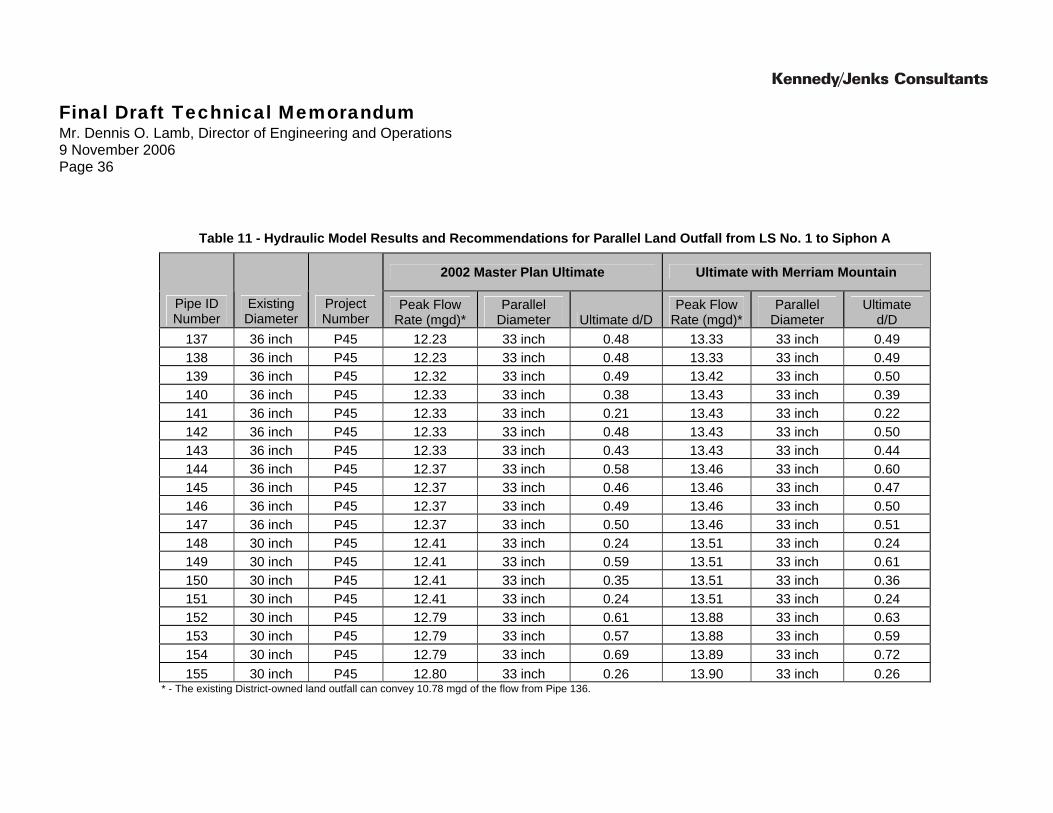
• Table 11, attached to the end of this document, presents the ultimate sizing requirements of the parallel land outfall, from Lift Station No. 1 to the first siphon, necessary to convey the Ultimate Peak Wet Weather Flows presented in the 2002 Master Plan and those predicted with the addition of Merriam Mountain. In addition to ultimate sizes, flow rates and depth-to-diameter ratios are also presented. Assuming that the parallel land outfall will have the same slopes as the existing District owned outfall, Table 11 illustrates that there is no impact to the ultimate sizing of these gravity mains attributed to Merriam Mountain.
• The existing capacity of the tunnel section of the land outfall between Lift Station No. 1 and the 1st siphon is 17.55 mgd, based upon a d/D of 0.75. During 2006 and 2020 peak wet weather conditions, the PWWF is below 17.55 mgd. However, the ultimate PWWF including the Merriam Mountain development is 24.21 mgd (at the entrance to the tunnel), compared to 23.11 as stated in the 2002 Master Plan. If the tunnel section is not paralleled, the existing tunnel section will be flowing full with a surcharge of over 6 feet at the entrance of the tunnel section at a flow of 24.21 mgd. The existing tunnel section was designed as a gravity flow pipeline and operating this section of pipe under surcharged conditions is not preferred. If the tunnel section is not paralleled, it is recommended that the potential impacts and possible mitigation measures be studied prior to operating this pipeline under a surcharged condition.
• In order to adequately convey peak flows during 2020 and ultimate conditions, all three siphons and gravity sections of the outfall, as shown on Figure 5, will need to be paralleled. The additional wastewater flows generated by the proposed Merriam Mountain project cause one pipe segment (approximately 320 feet in length) to exceed
Final Draft Technical Memorandum Mr. Dennis O. Lamb, Director of Engineering and Operations 9 November 2006 Page 12
the Sewer System Design Criteria within the Proposed Parallel Land Outfall just before reaching the EWPCF. While the pipe does not surcharge, the d/D is greater than 0.75 for this pipeline. No other proposed parallel pipelines are impacted by the Merriam Mountain wastewater flows, including the sizes of the parallel siphons, which are 18-inch.
Land Outfall Cost Recommendations
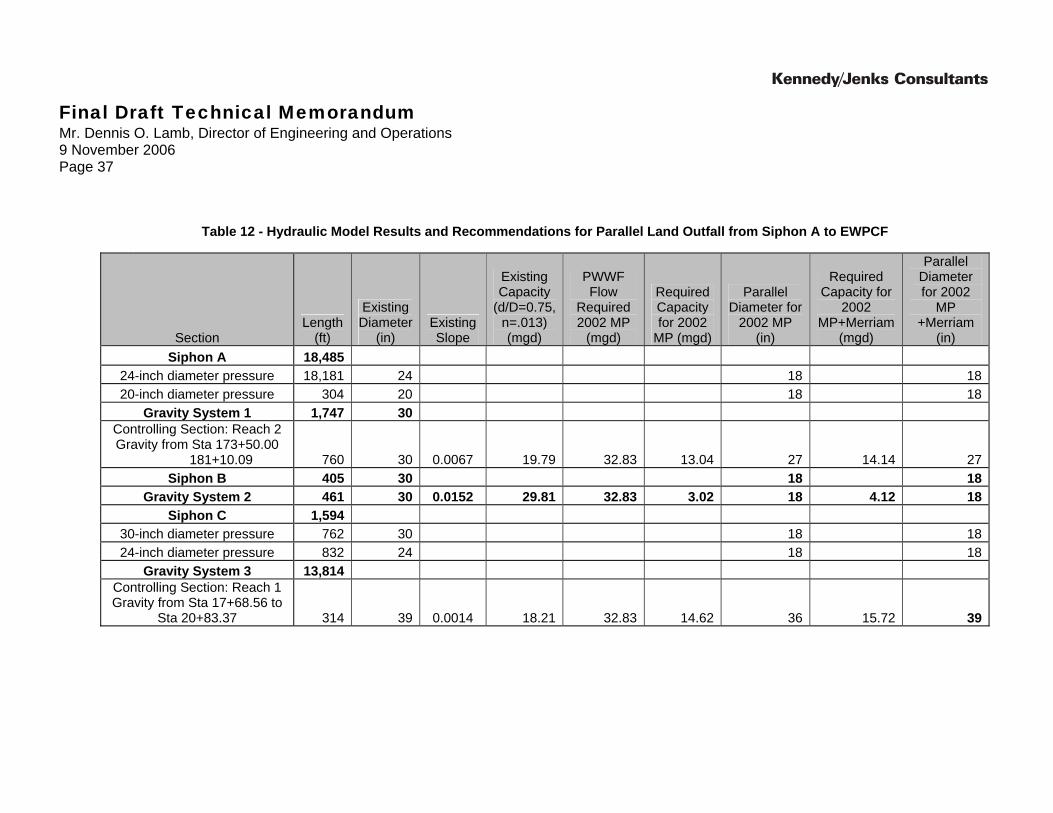
The analysis indicates as shown in Table 12, attached to the end of this document, that due to the additional wastewater flows from Merriam Mountain, one pipe segment (approximately 320 feet in length) will exceed the Sewer System Design Criteria within the Proposed Parallel Land Outfall just before reaching the EWPCF. While the pipe does not surcharge, the d/D is greater than 0.75 for this pipeline. For the remaining pipelines in the Proposed Parallel Land Outfall, the Merriam Mountain wastewater flows do not impact the size or required schedule of the project. However, while the sizes are not impacted, the capacity of the parallel outfall is still being utilized by the Merriam Mountain Project. Therefore, there should be a cost attributed to Merriam Mountain for the Parallel Outfall Improvements. However, at this time, the District has not determined the associated cost for exceeding the design criteria for the 320 feet pipe segment or for using the Parallel Land Outfall.
The District should explore the impacts of exceeding their contractual capacity limitation of 12.1 mgd in the lower outfall per the Palomar Joint Land Outfall Interceptor Interagency Agreement, dated January 8, 1985. The Merriam Mountain Development will be responsible for their portion of treatment costs which is discussed in the following section.
Wastewater Treatment Facility Analysis
The District is currently participating in the Phase V expansion to the EWPCF. The phase V expansion is primarily solids driven and the District has requested 10.5 mgd of total solids handling capacity. In the 2002 Master Plan, the District was projected to generate 13.27 mgd of ultimate average daily wastewater flow, which will require solids treatment. With Merriam Mountain, an additional 0.52 mgd of wastewater will require solids treatment.
The District current Unit I capacity rights at the EPWCF include 7.54 mgd of liquids treatment capacity. This treatment capacity, combined with the 5.0 mgd treated capacity of the MRF, gives the District a total current treated capacity of 12.54 mgd. The 2002 Master Plan projected that VWD would require a total of 8.77 mgd of liquid treatment capacity at EWPCF in ultimate (build-out) conditions. With the additional wastewater generated by Merriam Mountain, the ultimate liquids treatment capacity at the EWPCF will require an increase of 0.52 mgd.
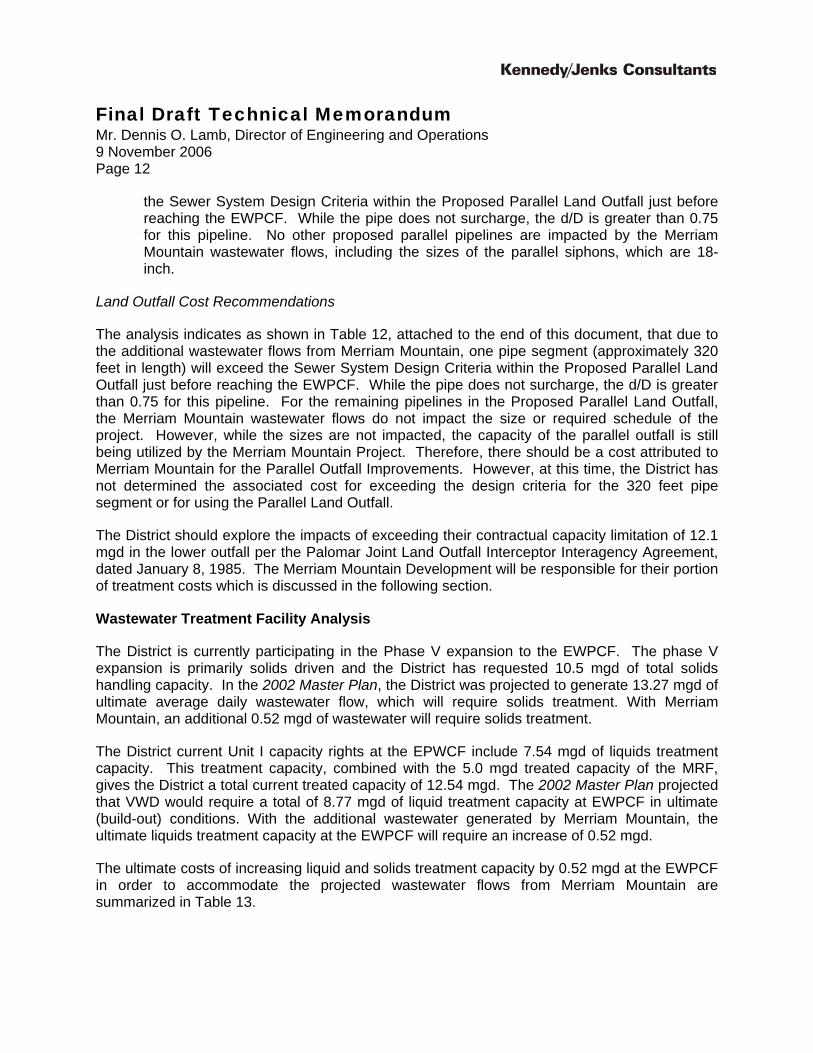
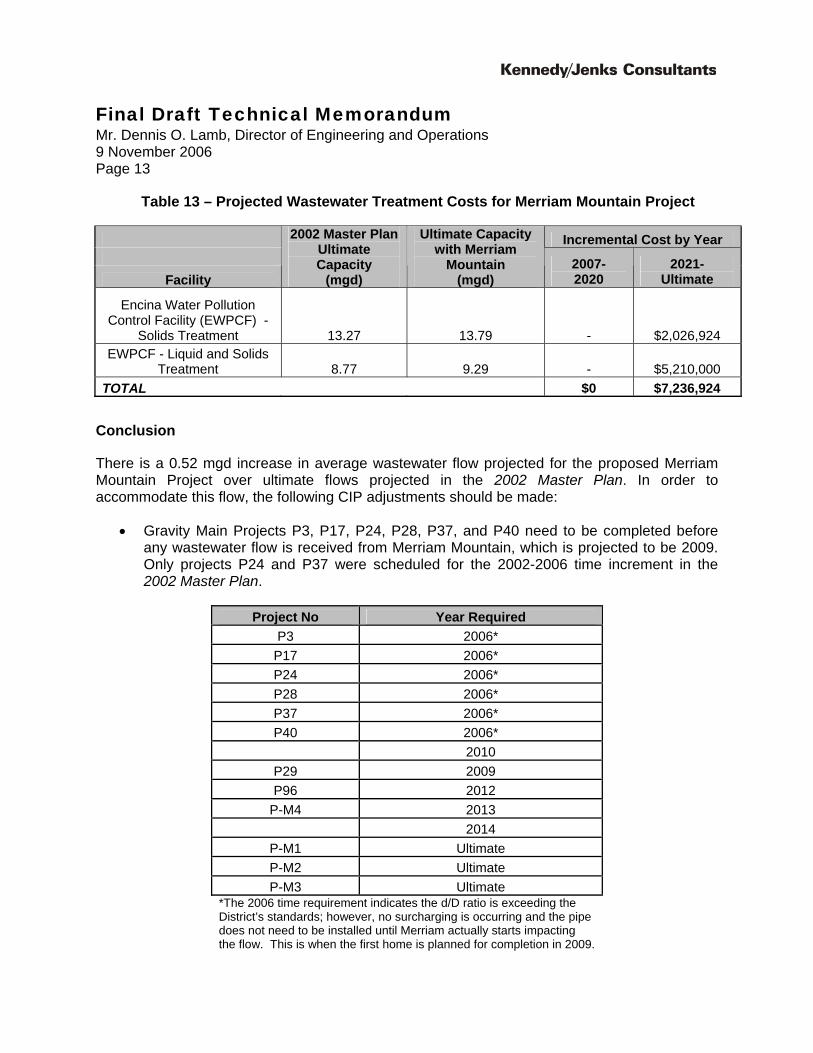
The ultimate costs of increasing liquid and solids treatment capacity by 0.52 mgd at the EWPCF in order to accommodate the projected wastewater flows from Merriam Mountain are summarized in Table 13.
Final Draft Technical Memorandum Mr. Dennis O. Lamb, Director of Engineering and Operations 9 November 2006 Page 13
Table 13 – Projected Wastewater Treatment Costs for Merriam Mountain Project
Incremental Cost by Year
Facility
2002 Master Plan Ultimate Capacity
(mgd)
Ultimate Capacity with Merriam
Mountain (mgd)
2007- 2020
2021- Ultimate
Encina Water Pollution Control Facility (EWPCF) -
Solids Treatment 13.27 13.79 - $2,026,924 EWPCF - Liquid and Solids
Treatment 8.77 9.29 - $5,210,000 TOTAL $0 $7,236,924
Conclusion
There is a 0.52 mgd increase in average wastewater flow projected for the proposed Merriam Mountain Project over ultimate flows projected in the 2002 Master Plan. In order to accommodate this flow, the following CIP adjustments should be made:
• Gravity Main Projects P3, P17, P24, P28, P37, and P40 need to be completed before any wastewater flow is received from Merriam Mountain, which is projected to be 2009. Only projects P24 and P37 were scheduled for the 2002-2006 time increment in the 2002 Master Plan.
Project No Year Required P3 2006*
P17 2006* P24 2006* P28 2006* P37 2006* P40 2006*
2010 P29 2009 P96 2012
P-M4 2013 2014
P-M1 Ultimate P-M2 Ultimate P-M3 Ultimate
*The 2006 time requirement indicates the d/D ratio is exceeding the District’s standards; however, no surcharging is occurring and the pipe does not need to be installed until Merriam actually starts impacting the flow. This is when the first home is planned for completion in 2009.
Final Draft Technical Memorandum Mr. Dennis O. Lamb, Director of Engineering and Operations 9 November 2006 Page 14
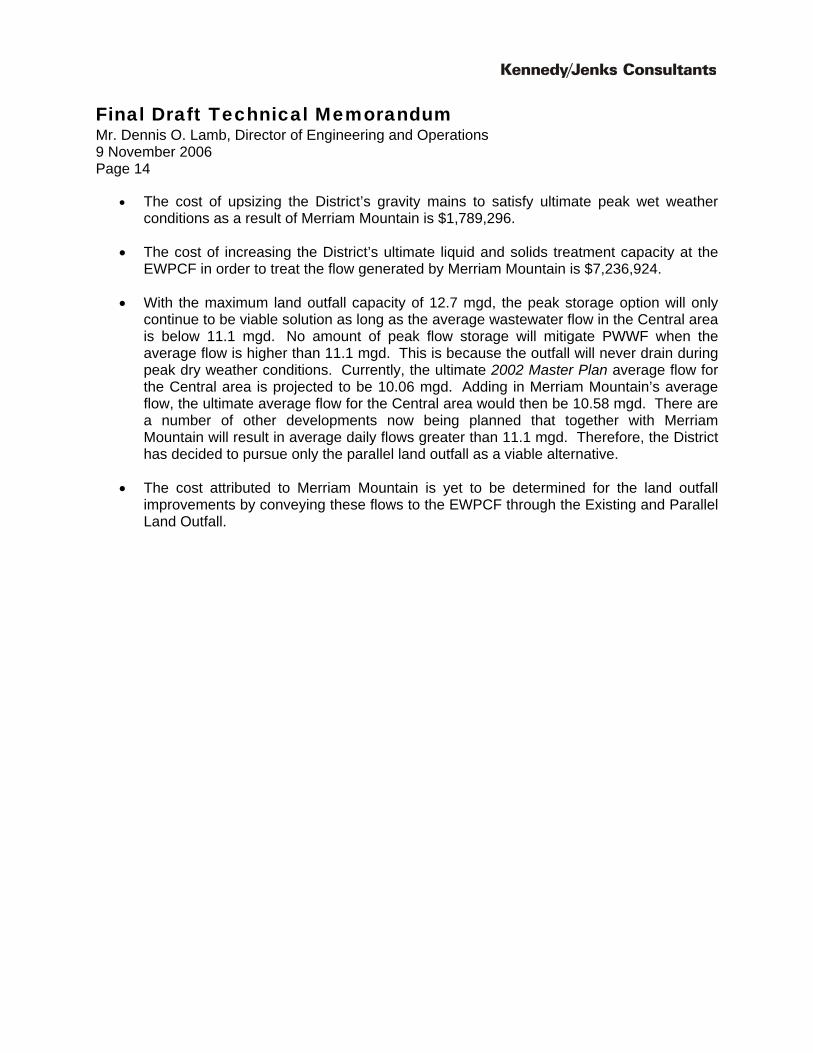
• The cost of upsizing the District’s gravity mains to satisfy ultimate peak wet weather conditions as a result of Merriam Mountain is $1,789,296.
• The cost of increasing the District’s ultimate liquid and solids treatment capacity at the EWPCF in order to treat the flow generated by Merriam Mountain is $7,236,924.
• With the maximum land outfall capacity of 12.7 mgd, the peak storage option will only continue to be viable solution as long as the average wastewater flow in the Central area is below 11.1 mgd. No amount of peak flow storage will mitigate PWWF when the average flow is higher than 11.1 mgd. This is because the outfall will never drain during peak dry weather conditions. Currently, the ultimate 2002 Master Plan average flow for the Central area is projected to be 10.06 mgd. Adding in Merriam Mountain’s average flow, the ultimate average flow for the Central area would then be 10.58 mgd. There are a number of other developments now being planned that together with Merriam Mountain will result in average daily flows greater than 11.1 mgd. Therefore, the District has decided to pursue only the parallel land outfall as a viable alternative.
• The cost attributed to Merriam Mountain is yet to be determined for the land outfall improvements by conveying these flows to the EWPCF through the Existing and Parallel Land Outfall.
1
5
3
2
4
2
Merriam Mountain Wastwater Flow Impact Report
Study Area
Figure 1
K/J 0687115*00
Deer Springs Road
Twin O
aks Valley Road
I-15
LegendProposed Merriam Project Site
Neighborhood Boundary
Existing Water Boundary
Existing Sewer Boundary
±0 5,0002,500
Feet
Final Draft Technical Memorandum Mr. Dennis O. Lamb, Director of Engineering and Operations 9 November 2006 Page 16
Figure 2 - Residential Diurnal Pattern
0.0
0.2
0.4
0.6
0.8
1.0
1.2
1.4
1.6
1.8
0 4 8 12 16 20 24
Hour
Perc
ent o
f Ave
rage
Figure 3 - Non-Residential Diurnal Pattern
0
0.2
0.4
0.6
0.8
1
1.2
1.4
1.6
1.8
2
0 4 8 12 16 20 24
Hour
Perc
ent o
f Ave
rage
[Ú144 125
122
119129
152
93
112
147
104
1 41
71
27
65
50
23
13
83
47
343231
42
60
22
1
56
111
7
76
110
Merriam Mountain WastewaterFlow Impact Report
Affected Sewer PipeID Numbers
Figure 4K/J 0687115*00
±Legend
Proposed Merriam Project Site
[Ú Lift Station No. 1
Capital Improvement Project NumberP-M4
P96
P40
P29
P17
P3
P28
P24
P37
P-M1
P94
No Improvement Needed
P-M2
P-M3 (includes proposed San Marcos Interceptor)
Outfall (P-45)
Existing Sewer Boundary
Deer Springs Rd.
Twin
Oak
s V
alle
y R
d.
State Route 78
Mission Rd.
Lift Station No. 1
Final Draft Technical Memorandum Mr. Dennis O. Lamb, Director of Engineering and Operations
9 November 2006 Page 18
Table 3 – Projected Wastewater Flows by Neighborhood for the Proposed Merriam Mountain Project
Neighborhood Land Use Gross Acres
Dwelling Units
DU/gross ac
Recommended Land Use Category
WW Duty Factor
(gpd/gross ac)
Average WW Flow
(gpd)
Total Flow (gpd)
1 Commercial 10.1 Commercial 1,500 15,150 Residential 67.2 1013 15.1 Residential (15-20 du/ac) 2,200 147,840 Irrigated Fuel
Treatment 32.3 Open Space 40 1,292
Irrigated Int Slopes
24.7 Open Space 40 988
165,270
2 Residential 59.4 524 8.8 Residential (8-12 du/ac) 1,500 89,100 Roadway
Median 5.6 Open Space 40 224
Irrigated Fuel Treatment
31.4 Open Space 40 1,256
Parks 3.4 Parks/Golf Courses 500 1,685
92,265
3 Residential 52.6 252 4.8 Residential (4-6 du/ac) 1,300 68,380 Irrigated Fuel
Treatment 22.8 Open Space 40 912
69,292
4 Residential 83.0 371 4.5 Residential (4-6 du/ac) 1,300 107,900 Irrigated Fuel
Treatment 17.9 Open Space 40 716
108,616
5 Residential 116.5 530 4.5 Residential (4-6 du/ac) 1,300 151,450 Irrigated Fuel
Treatment 74.7 Open Space 40 2,988
Parks 9.9 Parks/Golf Courses 500 4,970
159,408
Total Planning Area
611.5 2690 Total Planning Area Flow 594,851 594,851
Note: Land use acreages provided by Fuscoe Engineering in July, 2006. WW Duty Factors in the VWD 2002 Master Plan were calculated for gross acres not net acres (net acres being gross acres minus right-of-ways).
Final Draft Technical Memorandum Mr. Dennis O. Lamb, Director of Engineering and Operations 9 November 2006 Page 19
Table 4 – Comparison of Projected Wastewater Flows for the Proposed Merriam Mountain Project
2002 Water, Wastewater and Water Reclamation Master Plan Update
Updated Land Use Categories provided by Fuscoe Engineering with 2002 Master Plan Duty Factors
Basin
Land Use Category
Acreage Generation Factor
(gpd/ac)
Average Sewage Flow (gpd)
Land Use Category
Acreage Generation Factor (gpd/ac)
Average Sewage Flow (gpd)
Hillside Residential 165 40 6,600 Residential 117 1,300 151,450
Rural Residential 108 140 15,120 Irrigated Fuel
Treatment 75 40 2,988 1C
Parks 10 500 4,970 Subtotal 21,720 Neighborhood 5 Subtotal 159,408
Hillside Residential 255 40 10,200 Residential 59 1,500 89,100 Intensive Ag./Res. 120 80 9,600 Roadway Median 6 500 224
Rural Residential 62 140 8,680 Irrigated Fuel
Treatment 31 40 1,256 Parks 3 500 1,685
Neighborhood 2 Subtotal 92,265 Residential 53 1,300 68,380
Irrigated Fuel Treatment 23 40 912
Neighborhood 3 Subtotal 69,292 Residential 83 1,300 107,900
Irrigated Fuel Treatment 18 40 716
2C
Neighborhood 4 Subtotal 108,616 Subtotal 28,480 272,749
Final Draft Technical Memorandum Mr. Dennis O. Lamb, Director of Engineering and Operations 9 November 2006 Page 20
Table 4 – Comparison of Projected Wastewater Flows for the Proposed Merriam Mountain Project
2002 Water, Wastewater and Water Reclamation Master Plan Update
Updated Land Use Categories provided by Fuscoe Engineering with 2002 Master Plan Duty Factors
Basin
Land Use Category
Acreage Generation Factor
(gpd/ac)
Average Sewage Flow (gpd)
Land Use Category
Acreage Generation Factor (gpd/ac)
Average Sewage Flow (gpd)
Hillside Residential 32 40 1,280 Commercial 10 1,500 15,150 Commercial 4 1500 6,000 Residential 67 2,200 147,840
Industrial 21 900 18,900 Irrigated Fuel
Treatment 32 40 1,292
4C
Irrigated Int Slopes 25 40 988 Subtotal 26,180 Neighborhood 1 Subtotal 165,270
TOTAL 767 76,380 612 594,851
Increase in Merriam Mountain Wastewater Flow Projection 518,471
Final Draft Technical Memorandum Mr. Dennis O. Lamb, Director of Engineering and Operations 9 November 2006 Page 21
Table 5 – Hydraulic Model Input Data
ID Number Diameter (in) Length
(ft) Upstream Invert (ft)
Downstream Invert (ft) Slope
8 inch 161 762.00 760.60 0.009 8 inch 300 768.00 762.00 0.020
1 8 inch 300 760.60 755.50 0.017 2 8 inch 179 755.50 751.20 0.024 3 8 inch 300 751.20 744.40 0.023 4 8 inch 252 744.40 739.00 0.021 5 8 inch 287 739.00 733.90 0.018 6 8 inch 23 733.90 732.80 0.048 7 8 inch 89 732.80 729.50 0.037 8 8 inch 102 729.50 728.90 0.006 9 8 inch 19 728.90 728.50 0.021 10 8 inch 157 728.50 728.20 0.002 11 8 inch 350 728.20 723.30 0.014 12 8 inch 191 723.30 720.70 0.014 13 8 inch 350 720.70 717.20 0.010 14 8 inch 266 717.20 714.50 0.010 15 8 inch 85 714.50 714.20 0.004 16 8 inch 76 714.20 713.40 0.011 17 8 inch 173 713.40 712.60 0.005 18 8 inch 350 712.60 711.30 0.004 19 8 inch 350 711.30 709.90 0.004 20 8 inch 299 709.90 708.70 0.004 21 8 inch 350 708.70 707.30 0.004 22 8 inch 350 707.30 703.00 0.012 23 8 inch 337 703.00 701.70 0.004 24 8 inch 339 701.70 700.30 0.004 25 8 inch 350 700.30 693.30 0.020 26 8 inch 346 693.30 685.70 0.022 27 8 inch 276 685.70 684.50 0.004 28 8 inch 325 684.50 683.20 0.004 29 8 inch 310 673.20 671.90 0.004 30 8 inch 315 671.90 670.70 0.004 31 8 inch 315 670.70 669.50 0.004 32 8 inch 315 669.40 668.10 0.004 33 8 inch 315 668.10 666.90 0.004

Final Draft Technical Memorandum Mr. Dennis O. Lamb, Director of Engineering and Operations 9 November 2006 Page 22
Table 5 – Hydraulic Model Input Data
ID Number Diameter (in) Length
(ft) Upstream Invert (ft)
Downstream Invert (ft) Slope
34 8 inch 225 663.30 661.70 0.007 35 8 inch 43 661.70 661.50 0.005 36 8 inch 182 661.50 660.20 0.007 37 8 inch 306 660.20 658.10 0.007 38 8 inch 62 658.10 658.00 0.002 39 8 inch 306 658.10 656.00 0.007 40 8 inch 305 656.00 654.00 0.007 41 8 inch 305 654.00 645.80 0.027 42 8 inch 305 645.80 644.60 0.004 43 8 inch 83 644.60 644.30 0.004 44 8 inch 222 644.30 643.30 0.005 45 8 inch 305 643.30 639.80 0.011 46 8 inch 110 639.80 638.50 0.012 47 8 inch 225 638.50 636.60 0.008 48 8 inch 335 636.60 633.40 0.010 49 8 inch 190 633.40 632.10 0.007 50 8 inch 160 632.10 630.00 0.013 51 8 inch 130 630.00 629.80 0.002 52 8 inch 147 629.80 628.00 0.012 53 8 inch 300 628.00 623.80 0.014 54 8 inch 300 623.80 622.60 0.004 55 8 inch 300 622.60 621.40 0.004 56 8 inch 295 621.40 620.30 0.004 57 8 inch 290 620.30 618.60 0.006 58 8 inch 290 618.50 614.90 0.012 59 8 inch 290 614.90 611.30 0.012 60 8 inch 303 611.30 608.80 0.008 61 8 inch 183 608.80 605.10 0.020 62 8 inch 153 605.10 603.00 0.014 63 8 inch 340 603.00 597.40 0.016 64 8 inch 340 597.40 592.40 0.015 65 8 inch 340 592.40 591.00 0.004 66 8 inch 64 591.00 590.60 0.006 67 8 inch 276 590.60 589.70 0.003 68 8 inch 336 589.70 588.30 0.004
Final Draft Technical Memorandum Mr. Dennis O. Lamb, Director of Engineering and Operations 9 November 2006 Page 23
Table 5 – Hydraulic Model Input Data
ID Number Diameter (in) Length
(ft) Upstream Invert (ft)
Downstream Invert (ft) Slope
69 8 inch 350 588.30 586.90 0.004 70 8 inch 294 586.90 583.10 0.013 71 8 inch 200 583.10 581.90 0.006 72 8 inch 90 581.90 579.20 0.030 73 8 inch 290 579.20 578.50 0.002 74 8 inch 290 578.50 576.90 0.006 75 8 inch 100 576.90 576.60 0.003 76 8 inch 76 576.60 576.20 0.005 77 8 inch 184 576.20 570.20 0.033 78 8 inch 184 570.20 564.90 0.029 79 18 inch 216 564.10 563.30 0.004 80 18 inch 217 563.30 562.50 0.004 81 18 inch 350 562.50 561.30 0.003 82 18 inch 80 561.30 560.70 0.008 83 18 inch 170 560.70 560.40 0.002 84 18 inch 62 560.30 558.90 0.023 85 27 inch 31 558.90 558.80 0.003 86 27 inch 165 558.80 558.10 0.004 87 27 inch 261 558.00 556.90 0.004 88 36 inch 135 556.20 555.60 0.004 89 36 inch 128 555.60 555.00 0.005 90 36 inch 140 555.00 554.40 0.004 91 36 inch 470 554.30 552.50 0.004 92 36 inch 235 552.00 551.50 0.002 93 36 inch 291 551.50 550.40 0.004 94 31.5 inc 295 550.40 549.20 0.004 95 31.5 inc 116 549.20 548.70 0.004 96 31.5 inc 96 548.70 548.30 0.004 97 31.5 inc 136 548.30 547.80 0.004 98 31.5 inc 307 547.80 546.60 0.004 99 31.5 inc 437 546.60 544.80 0.004
100 31.5 inc 229 544.80 543.90 0.004 101 33 inch 189 543.90 543.10 0.004 102 33 inch 442 543.10 541.30 0.004 103 33 inch 130 541.30 540.80 0.004

Final Draft Technical Memorandum Mr. Dennis O. Lamb, Director of Engineering and Operations 9 November 2006 Page 24
Table 5 – Hydraulic Model Input Data
ID Number Diameter (in) Length
(ft) Upstream Invert (ft)
Downstream Invert (ft) Slope
104 33 inch 261 540.80 539.50 0.005 105 27 inch 335 539.50 537.40 0.006 106 39 inch 210 537.40 535.10 0.011 107 39 inch 176 535.10 534.70 0.002 108 39 inch 271 534.70 534.10 0.002 109 39 inch 297 534.10 533.40 0.002 110 39 inch 452 533.40 532.30 0.002 111 39 inch 337 532.30 531.50 0.002 112 39 inch 123 531.50 531.20 0.002 113 31.5 inc 88 531.20 530.90 0.003 114 31.5 inc 470 530.90 529.30 0.003 115 31.5 inc 464 529.30 527.80 0.003 116 31.5 inc 493 527.80 526.50 0.003 117 31.5 inc 619 526.50 524.00 0.004 118 31.5 inc 164 524.00 523.40 0.004 119 31.5 inc 485 523.40 521.40 0.004 120 31.5 inc 645 521.40 518.80 0.004 121 31.5 inc 581 518.80 516.40 0.004 122 31.5 inc 650 516.40 513.80 0.004 123 31.5 inc 677 513.80 511.00 0.004 124 31.5 inc 373 511.00 509.50 0.004 125 31.5 inc 420 509.50 507.90 0.004 126 31.5 inc 30 507.90 507.80 0.003 127 31.5 inc 478 507.80 505.90 0.004 128 31.5 inc 383 505.90 504.40 0.004 129 31.5 inc 117 504.40 503.90 0.004 130 30 inch 15 503.90 502.20 0.113 131 42 inch 138 502.20 501.80 0.003 132 42 inch 347 501.80 501.50 0.001 133 42 inch 18 501.50 501.40 0.006 134 42 inch 9 501.40 501.10 0.033 135 42 inch 9 501.10 500.90 0.022 136 42 inch 120 500.90 496.00 0.041 137 36 inch 328 496.00 495.34 0.002 138 36 inch 401 495.34 494.53 0.002

Final Draft Technical Memorandum Mr. Dennis O. Lamb, Director of Engineering and Operations 9 November 2006 Page 25
Table 5 – Hydraulic Model Input Data
ID Number Diameter (in) Length
(ft) Upstream Invert (ft)
Downstream Invert (ft) Slope
139 36 inch 392 494.53 493.76 0.002 140 36 inch 353 493.76 492.10 0.005 141 36 inch 368 492.10 474.90 0.047 142 36 inch 1,840 474.90 471.20 0.002 143 36 inch 225 471.20 470.50 0.003 144 36 inch 465 470.50 470.00 0.001 145 36 inch 445 470.00 468.90 0.002 146 36 inch 415 468.90 468.10 0.002 147 36 inch 55 468.10 468.00 0.002 148 30 inch 131 468.00 459.80 0.063 149 30 inch 286 459.80 459.20 0.002 150 30 inch 480 459.20 452.90 0.013 151 30 inch 293 452.90 435.00 0.061 152 30 inch 300 435.00 434.40 0.002 153 30 inch 81 434.40 434.20 0.002 154 30 inch 72 434.20 434.10 0.001 155 30 inch 45 434.10 432.00 0.047
* Note: Lengths equal distance between manholes as provided by VWD geodatabase. Also, assumes San Marcos Interceptor (Pipes 94-104 and 113-130) is already upgraded to a 31.5-inch diameter pipeline.

lMcClellan-PalomarMcClellan-Palomar
Batiquitos Lagoon
Aqua Hedionda
Merriam Moutnain WastewaterFlow Impact Report
Land Outfall
Figure 5
K/J 0687115*00
±
LegendSiphon
Gravity System
Gravity System *
Roads
EPWCF
GravitySystem #1(7,000 ft)
Siphon A(18,485 ft)
Siphon B(405 ft)
Siphon C(1,594 ft)
Gravity System #2(1,747 ft)
Gravity System #3
(461 ft)
Gravity System #4(13,814 ft)
El Camino Real
El Camino Real
District Owned Outfall: Gravity System #1 Siphon A
Joint Outfall: Gravity System #2 Siphon B Gravity System #3 Siphon C Gravity System #4
* Proposed Parallel Land Outfall gravity pipemay require larger diameter pipe than originallymodeled in VWD MP due to Merriam Mtn flows

Final Draft Technical Memorandum Mr. Dennis O. Lamb, Director of Engineering and Operations 9 November 2006 Page 27
Table 8 - Hydraulic Model Results and Recommended Gravity Main Improvements (Excluding Outfall)
Ultimate 2002 Master Plan Ultimate with Phased Merriam Mountain
Pipe ID Number
Existing Diameter
Project Number
Peak Flow Rate
(mgd) Replacement
Diameter Ultimate d/D
Peak Flow Rate
(mgd)
d/D using 2002
MP Dia. Replacement
Diameter Ultimate
d/D 8 inch P-M4 0.39 8 inch 0.38 0.95 0.63 10 inch 0.44 8 inch P-M4 0.40 8 inch 0.48 0.95 1.00 12 inch 0.43 1 8 inch P96 0.95 12 inch 0.35 2.18 0.57 15 inch 0.40 2 8 inch P96 0.95 12 inch 0.32 2.18 0.51 15 inch 0.37 3 8 inch P96 0.99 12 inch 0.33 2.22 0.53 15 inch 0.38 4 8 inch P96 0.99 12 inch 0.34 2.23 0.53 15 inch 0.38 5 8 inch P96 0.99 12 inch 0.36 2.23 0.57 15 inch 0.40 6 8 inch P96 0.99 12 inch 0.28 2.23 0.42 15 inch 0.31 7 8 inch P96 1.01 12 inch 0.30 2.24 0.46 15 inch 0.33 8 8 inch P40 1.47 15 inch 0.43 2.67 0.62 15 inch 0.62 9 8 inch P40 1.48 15 inch 0.31 2.67 0.42 15 inch 0.42
10 8 inch P40 1.48 15 inch 0.61 2.67 1.00 18 inch 0.65 11 8 inch P40 1.48 15 inch 0.34 2.67 0.48 18 inch 0.36 12 8 inch P40 1.48 15 inch 0.35 2.67 0.48 18 inch 0.37 13 8 inch P40 1.49 15 inch 0.38 2.68 0.53 18 inch 0.40 14 8 inch P40 1.49 15 inch 0.38 2.68 0.52 18 inch 0.40 15 8 inch P40 1.50 15 inch 0.51 2.70 0.76 18 inch 0.54 16 8 inch P40 1.50 15 inch 0.37 2.70 0.52 18 inch 0.39 17 8 inch P40 1.51 15 inch 0.47 2.70 0.68 18 inch 0.50 18 8 inch P40 1.52 15 inch 0.50 2.71 0.74 18 inch 0.53
Final Draft Technical Memorandum Mr. Dennis O. Lamb, Director of Engineering and Operations 9 November 2006 Page 28
Table 8 - Hydraulic Model Results and Recommended Gravity Main Improvements (Excluding Outfall)
Ultimate 2002 Master Plan Ultimate with Phased Merriam Mountain
Pipe ID Number
Existing Diameter
Project Number
Peak Flow Rate
(mgd) Replacement
Diameter Ultimate d/D
Peak Flow Rate
(mgd)
d/D using 2002
MP Dia. Replacement
Diameter Ultimate
d/D 19 8 inch P40 1.52 15 inch 0.49 2.71 0.72 18 inch 0.52 20 8 inch P29 2.00 15 inch 0.58 3.10 0.81 18 inch 0.56 21 8 inch P29 2.03 15 inch 0.59 3.13 0.82 18 inch 0.57 22 8 inch P29 2.05 15 inch 0.42 3.14 0.54 18 inch 0.41 23 8 inch P29 2.06 15 inch 0.60 3.15 0.85 18 inch 0.58 24 8 inch P29 2.06 15 inch 0.59 3.16 0.82 18 inch 0.57 25 8 inch P29 2.07 15 inch 0.37 3.16 0.47 18 inch 0.36 26 8 inch P29 2.07 15 inch 0.36 3.17 0.46 18 inch 0.35 27 8 inch P17 2.24 15 inch 0.61 3.34 0.85 18 inch 0.58 28 8 inch P17 2.24 15 inch 0.63 3.34 0.91 18 inch 0.59 29 8 inch P3 2.48 18 inch 0.49 3.58 0.61 18 inch 0.61 30 8 inch P3 2.49 18 inch 0.50 3.58 0.63 18 inch 0.63 31 8 inch P3 2.49 18 inch 0.50 3.59 0.63 18 inch 0.63 32 8 inch P3 2.50 18 inch 0.49 3.60 0.62 18 inch 0.62 33 8 inch P3 2.50 18 inch 0.50 3.60 0.63 18 inch 0.63 34 8 inch P3 2.51 18 inch 0.42 3.60 0.52 18 inch 0.52 35 8 inch P3 2.51 18 inch 0.48 3.60 0.59 18 inch 0.59 36 8 inch P3 2.56 18 inch 0.43 3.66 0.52 18 inch 0.52 37 8 inch P3 2.56 18 inch 0.43 3.66 0.53 18 inch 0.53 38 8 inch P3 2.56 18 inch 0.67 3.66 1.00 21 inch 0.65 39 8 inch P3 2.69 18 inch 0.44 3.78 0.54 21 inch 0.43

Final Draft Technical Memorandum Mr. Dennis O. Lamb, Director of Engineering and Operations 9 November 2006 Page 29
Table 8 - Hydraulic Model Results and Recommended Gravity Main Improvements (Excluding Outfall)
Ultimate 2002 Master Plan Ultimate with Phased Merriam Mountain
Pipe ID Number
Existing Diameter
Project Number
Peak Flow Rate
(mgd) Replacement
Diameter Ultimate d/D
Peak Flow Rate
(mgd)
d/D using 2002
MP Dia. Replacement
Diameter Ultimate
d/D 40 8 inch P3 2.69 18 inch 0.45 3.78 0.55 21 inch 0.43 41 8 inch P3 2.69 18 inch 0.31 3.79 0.37 21 inch 0.30 42 8 inch P28 2.69 18 inch 0.52 3.79 0.65 21 inch 0.50 43 8 inch P28 2.69 18 inch 0.53 3.79 0.67 21 inch 0.51 44 8 inch P28 2.69 18 inch 0.50 3.79 0.62 21 inch 0.48 45 8 inch P28 2.69 18 inch 0.39 3.79 0.47 21 inch 0.37 46 8 inch P28 2.69 18 inch 0.38 3.79 0.46 21 inch 0.37 47 8 inch P28 2.79 18 inch 0.43 3.88 0.52 21 inch 0.41 48 8 inch P28 2.79 18 inch 0.41 3.88 0.50 21 inch 0.39 49 8 inch P28 2.79 18 inch 0.45 3.88 0.55 21 inch 0.43 50 8 inch P28 2.82 18 inch 0.38 3.91 0.46 21 inch 0.36 51 8 inch P28 2.82 18 inch 0.74 3.91 1.00 21 inch 0.69 52 8 inch P28 2.82 18 inch 0.39 3.91 0.47 21 inch 0.37 53 8 inch P28 2.82 18 inch 0.37 3.91 0.45 21 inch 0.36 54 8 inch P28 2.82 18 inch 0.53 3.91 0.66 21 inch 0.51 55 8 inch P28 2.84 18 inch 0.54 3.94 0.66 21 inch 0.51 56 8 inch P28 2.85 18 inch 0.55 3.94 0.68 21 inch 0.52 57 8 inch P28 2.85 18 inch 0.48 3.95 0.58 21 inch 0.46 58 8 inch P28 2.85 18 inch 0.39 3.95 0.47 21 inch 0.37 59 8 inch P28 2.85 18 inch 0.39 3.95 0.47 21 inch 0.37 60 8 inch P28 2.89 18 inch 0.44 3.98 0.53 21 inch 0.42
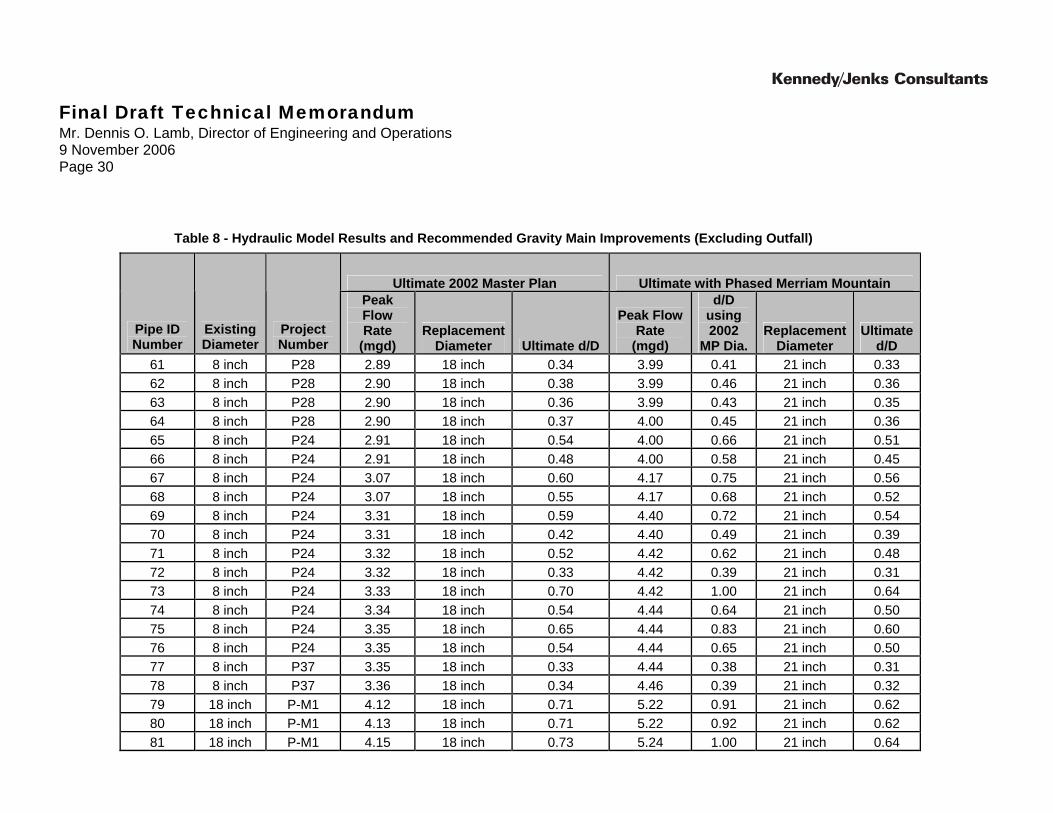
Final Draft Technical Memorandum Mr. Dennis O. Lamb, Director of Engineering and Operations 9 November 2006 Page 30
Table 8 - Hydraulic Model Results and Recommended Gravity Main Improvements (Excluding Outfall)
Ultimate 2002 Master Plan Ultimate with Phased Merriam Mountain
Pipe ID Number
Existing Diameter
Project Number
Peak Flow Rate
(mgd) Replacement
Diameter Ultimate d/D
Peak Flow Rate
(mgd)
d/D using 2002
MP Dia. Replacement
Diameter Ultimate
d/D 61 8 inch P28 2.89 18 inch 0.34 3.99 0.41 21 inch 0.33 62 8 inch P28 2.90 18 inch 0.38 3.99 0.46 21 inch 0.36 63 8 inch P28 2.90 18 inch 0.36 3.99 0.43 21 inch 0.35 64 8 inch P28 2.90 18 inch 0.37 4.00 0.45 21 inch 0.36 65 8 inch P24 2.91 18 inch 0.54 4.00 0.66 21 inch 0.51 66 8 inch P24 2.91 18 inch 0.48 4.00 0.58 21 inch 0.45 67 8 inch P24 3.07 18 inch 0.60 4.17 0.75 21 inch 0.56 68 8 inch P24 3.07 18 inch 0.55 4.17 0.68 21 inch 0.52 69 8 inch P24 3.31 18 inch 0.59 4.40 0.72 21 inch 0.54 70 8 inch P24 3.31 18 inch 0.42 4.40 0.49 21 inch 0.39 71 8 inch P24 3.32 18 inch 0.52 4.42 0.62 21 inch 0.48 72 8 inch P24 3.32 18 inch 0.33 4.42 0.39 21 inch 0.31 73 8 inch P24 3.33 18 inch 0.70 4.42 1.00 21 inch 0.64 74 8 inch P24 3.34 18 inch 0.54 4.44 0.64 21 inch 0.50 75 8 inch P24 3.35 18 inch 0.65 4.44 0.83 21 inch 0.60 76 8 inch P24 3.35 18 inch 0.54 4.44 0.65 21 inch 0.50 77 8 inch P37 3.35 18 inch 0.33 4.44 0.38 21 inch 0.31 78 8 inch P37 3.36 18 inch 0.34 4.46 0.39 21 inch 0.32 79 18 inch P-M1 4.12 18 inch 0.71 5.22 0.91 21 inch 0.62 80 18 inch P-M1 4.13 18 inch 0.71 5.22 0.92 21 inch 0.62 81 18 inch P-M1 4.15 18 inch 0.73 5.24 1.00 21 inch 0.64
Final Draft Technical Memorandum Mr. Dennis O. Lamb, Director of Engineering and Operations 9 November 2006 Page 31
Table 8 - Hydraulic Model Results and Recommended Gravity Main Improvements (Excluding Outfall)
Ultimate 2002 Master Plan Ultimate with Phased Merriam Mountain
Pipe ID Number
Existing Diameter
Project Number
Peak Flow Rate
(mgd) Replacement
Diameter Ultimate d/D
Peak Flow Rate
(mgd)
d/D using 2002
MP Dia. Replacement
Diameter Ultimate
d/D 82 18 inch P-M1 4.16 18 inch 0.56 5.26 0.65 21 inch 0.50 83 18 inch P94 4.64 24 inch 0.58 5.73 0.67 24 inch 0.67 84 18 inch P94 4.64 24 inch 0.29 5.73 0.32 24 inch 0.32 85 27 inch 4.65 27 inch 0.41 5.75 0.46 27 inch 0.46 86 27 inch 4.65 27 inch 0.38 5.75 0.42 27 inch 0.42 87 27 inch 4.66 27 inch 0.38 5.76 0.42 27 inch 0.42 88 36 inch 11.90 36 inch 0.41 12.99 0.43 36 inch 0.43 89 36 inch 11.91 36 inch 0.40 13.01 0.42 36 inch 0.42 90 36 inch 11.91 36 inch 0.41 13.01 0.43 36 inch 0.43 91 36 inch 11.92 36 inch 0.43 13.01 0.45 36 inch 0.45 92 36 inch 11.94 36 inch 0.51 13.04 0.53 36 inch 0.53 93 36 inch 11.94 36 inch 0.43 13.04 0.45 36 inch 0.45 94 31.5 inch 12.05 31.5 inch 0.52 13.14 0.55 31.5 inch 0.55 95 31.5 inch 12.05 31.5 inch 0.51 13.14 0.54 31.5 inch 0.54 96 31.5 inch 14.61 31.5 inch 0.58 15.71 0.61 31.5 inch 0.61 97 31.5 inch 14.61 31.5 inch 0.60 15.71 0.63 31.5 inch 0.63 98 31.5 inch 14.61 31.5 inch 0.59 15.71 0.62 31.5 inch 0.62 99 31.5 inch 14.61 31.5 inch 0.58 15.71 0.61 31.5 inch 0.61 100 31.5 inch 14.61 31.5 inch 0.59 15.71 0.62 31.5 inch 0.62 101 33 inch 14.61 33 inch 0.53 15.71 0.56 33 inch 0.56 102 33 inch 14.66 33 inch 0.54 15.76 0.57 33 inch 0.57
Final Draft Technical Memorandum Mr. Dennis O. Lamb, Director of Engineering and Operations 9 November 2006 Page 32
Table 8 - Hydraulic Model Results and Recommended Gravity Main Improvements (Excluding Outfall)
Ultimate 2002 Master Plan Ultimate with Phased Merriam Mountain
Pipe ID Number
Existing Diameter
Project Number
Peak Flow Rate
(mgd) Replacement
Diameter Ultimate d/D
Peak Flow Rate
(mgd)
d/D using 2002
MP Dia. Replacement
Diameter Ultimate
d/D 103 33 inch 14.67 33 inch 0.55 15.77 0.58 33 inch 0.58 104 33 inch 15.65 33 inch 0.53 16.74 0.55 33 inch 0.55 105 27 inch P-M2 15.65 27 inch 0.70 16.74 0.74 30 inch 0.60 106 39 inch 15.71 39 inch 0.33 16.80 0.34 39 inch 0.34 107 39 inch 15.71 39 inch 0.51 16.80 0.54 39 inch 0.54 108 39 inch 15.71 39 inch 0.52 16.80 0.54 39 inch 0.54 109 39 inch 15.72 39 inch 0.51 16.82 0.53 39 inch 0.53 110 39 inch 15.78 39 inch 0.50 16.87 0.53 39 inch 0.53 111 39 inch 15.79 39 inch 0.51 16.89 0.53 39 inch 0.53 112 39 inch 15.79 39 inch 0.51 16.89 0.53 39 inch 0.53 113 31.5 inc P-M3 15.79 31.5 inch 0.65 16.89 0.68 36 inch 0.54 114 31.5 inc P-M3 15.80 31.5 inch 0.65 16.90 0.68 36 inch 0.54 115 31.5 inc P-M3 15.80 31.5 inch 0.66 16.90 0.70 36 inch 0.55 116 31.5 inc P-M3 16.31 31.5 inch 0.74 17.41 0.78 36 inch 0.60 117 31.5 inc P-M3 16.31 31.5 inch 0.63 17.41 0.66 36 inch 0.52 118 31.5 inc P-M3 16.33 31.5 inch 0.65 17.42 0.68 36 inch 0.54 119 31.5 inc P-M3 16.37 31.5 inch 0.63 17.47 0.65 36 inch 0.52 120 31.5 inc P-M3 16.38 31.5 inch 0.63 17.47 0.66 36 inch 0.52 121 31.5 inc P-M3 16.60 31.5 inch 0.63 17.70 0.66 36 inch 0.52 122 31.5 inc P-M3 16.63 31.5 inch 0.64 17.72 0.67 36 inch 0.53 123 31.5 inc P-M3 16.68 31.5 inch 0.63 17.77 0.66 36 inch 0.53
Final Draft Technical Memorandum Mr. Dennis O. Lamb, Director of Engineering and Operations 9 November 2006 Page 33
Table 8 - Hydraulic Model Results and Recommended Gravity Main Improvements (Excluding Outfall)
Ultimate 2002 Master Plan Ultimate with Phased Merriam Mountain
Pipe ID Number
Existing Diameter
Project Number
Peak Flow Rate
(mgd) Replacement
Diameter Ultimate d/D
Peak Flow Rate
(mgd)
d/D using 2002
MP Dia. Replacement
Diameter Ultimate
d/D 124 31.5 inc P-M3 16.68 31.5 inch 0.64 17.77 0.67 36 inch 0.53 125 31.5 inc P-M3 16.68 31.5 inch 0.65 17.78 0.68 36 inch 0.54 126 31.5 inc P-M3 16.68 31.5 inch 0.68 17.78 0.72 36 inch 0.56 127 31.5 inc P-M3 16.69 31.5 inch 0.64 17.78 0.67 36 inch 0.53 128 31.5 inc P-M3 16.69 31.5 inch 0.65 17.78 0.67 36 inch 0.53 129 31.5 inc P-M3 17.39 31.5 inch 0.64 18.48 0.67 36 inch 0.53 130 30 inch P-M3 21.51 30 inch 0.31 22.60 0.31 36 inch 0.25 131 42 inch 21.51 42 inch 0.51 22.60 0.53 42 inch 0.53 132 42 inch 21.51 42 inch 0.78 22.60 0.82 42 inch 0.82 133 42 inch 21.51 42 inch 0.43 22.60 0.44 42 inch 0.44 134 42 inch 21.51 42 inch 0.27 22.60 0.27 42 inch 0.27 135 42 inch 21.78 42 inch 0.30 22.87 0.30 42 inch 0.30 136 42 inch 22.98 42 inch 0.26 24.08 0.27 42 inch 0.27
* Note: Assumes San Marcos Interceptor (Pipes 94-104 and 113-130) is already upgraded to a 31.5-inch diameter pipeline.
Final Draft Technical Memorandum Mr. Dennis O. Lamb, Director of Engineering and Operations 9 November 2006 Page 34
Table 9 – Proposed Gravity Sewer Costs
Proposed Gravity Sewer Costs in 2002 Master Plan Proposed Gravity Sewer Costs with Merriam Mountain Project
No Pipe
Diameter (in) Pipe
Length (ft) 2006 2007-2020 2021-
Ultimate Pipe
Diameter (in) Pipe
Length (ft) 2006 (a) 2007-2020 2021-
Ultimate P-M4 8 460 10 160 $24,798
12 300 $54,467
P96 12 1,430 $259,624 15 1,430 $277,038
P40 15 2,470 $478,521 15 120 $23,248 18 2,350 $517,710
P29 15 2,370 $459,147 18 2,370 $522,116
P17 15 600 $116,240 18 600 $132,181
P3 18 3,300 $726,997 18 2,320 $511,101 21 980 $253,868
P28 18 5,600 $1,233,692 21 5,600 $1,450,673
P24 18 2,710 $597,019 21 2,710 $702,022
P37 18 370 $81,512 21 370 $95,848
P-M1 18 860 21 860 $222,782
P-M2 27 340 30 340 $123,081
Final Draft Technical Memorandum Mr. Dennis O. Lamb, Director of Engineering and Operations 9 November 2006 Page 35
Table 9 – Proposed Gravity Sewer Costs
Proposed Gravity Sewer Costs in 2002 Master Plan Proposed Gravity Sewer Costs with Merriam Mountain Project
No Pipe
Diameter (in) Pipe
Length (ft) 2006 2007-2020 2021-
Ultimate Pipe
Diameter (in) Pipe
Length (ft) 2006 (a) 2007-2020 2021-
Ultimate P-M3 31.5 7,150 $2,865,367 36 7,150 $3,696,482
TOTAL 27,660 $3,543,897 $1,960,689 $1,313,532 27,660 $3,663,403 $901,667 $4,042,345
GRAND TOTAL 27,660 $6,818,119 27,660 $8,607,415 Note: 2002 Master Plan costs have been updated to July 2006 dollars.
(a) The 2006 time requirement indicates the d/D ratio is exceeding the District’s standards; however, no surcharging is occurring and the pipe does not need to be installed until Merriam actually starts impacting the flow. This is when the first home is planned for completion in 2009.
Final Draft Technical Memorandum Mr. Dennis O. Lamb, Director of Engineering and Operations 9 November 2006 Page 36
Table 11 - Hydraulic Model Results and Recommendations for Parallel Land Outfall from LS No. 1 to Siphon A
2002 Master Plan Ultimate Ultimate with Merriam Mountain
Pipe ID Number
Existing Diameter
Project Number
Peak Flow Rate (mgd)*
Parallel Diameter Ultimate d/D
Peak Flow Rate (mgd)*
Parallel Diameter
Ultimate d/D
137 36 inch P45 12.23 33 inch 0.48 13.33 33 inch 0.49 138 36 inch P45 12.23 33 inch 0.48 13.33 33 inch 0.49 139 36 inch P45 12.32 33 inch 0.49 13.42 33 inch 0.50 140 36 inch P45 12.33 33 inch 0.38 13.43 33 inch 0.39 141 36 inch P45 12.33 33 inch 0.21 13.43 33 inch 0.22 142 36 inch P45 12.33 33 inch 0.48 13.43 33 inch 0.50 143 36 inch P45 12.33 33 inch 0.43 13.43 33 inch 0.44 144 36 inch P45 12.37 33 inch 0.58 13.46 33 inch 0.60 145 36 inch P45 12.37 33 inch 0.46 13.46 33 inch 0.47 146 36 inch P45 12.37 33 inch 0.49 13.46 33 inch 0.50 147 36 inch P45 12.37 33 inch 0.50 13.46 33 inch 0.51 148 30 inch P45 12.41 33 inch 0.24 13.51 33 inch 0.24 149 30 inch P45 12.41 33 inch 0.59 13.51 33 inch 0.61 150 30 inch P45 12.41 33 inch 0.35 13.51 33 inch 0.36 151 30 inch P45 12.41 33 inch 0.24 13.51 33 inch 0.24 152 30 inch P45 12.79 33 inch 0.61 13.88 33 inch 0.63 153 30 inch P45 12.79 33 inch 0.57 13.88 33 inch 0.59 154 30 inch P45 12.79 33 inch 0.69 13.89 33 inch 0.72 155 30 inch P45 12.80 33 inch 0.26 13.90 33 inch 0.26
* - The existing District-owned land outfall can convey 10.78 mgd of the flow from Pipe 136.
Final Draft Technical Memorandum Mr. Dennis O. Lamb, Director of Engineering and Operations 9 November 2006 Page 37
Table 12 - Hydraulic Model Results and Recommendations for Parallel Land Outfall from Siphon A to EWPCF
Section Length
(ft)
Existing Diameter
(in) Existing Slope
Existing Capacity
(d/D=0.75, n=.013) (mgd)
PWWF Flow
Required 2002 MP
(mgd)
Required Capacity for 2002
MP (mgd)
Parallel Diameter for
2002 MP (in)
Required Capacity for
2002 MP+Merriam
(mgd)
Parallel Diameter for 2002
MP +Merriam
(in) Siphon A 18,485
24-inch diameter pressure 18,181 24 18 18 20-inch diameter pressure 304 20 18 18
Gravity System 1 1,747 30 Controlling Section: Reach 2 Gravity from Sta 173+50.00
181+10.09 760 30 0.0067 19.79 32.83 13.04 27 14.14 27 Siphon B 405 30 18 18
Gravity System 2 461 30 0.0152 29.81 32.83 3.02 18 4.12 18 Siphon C 1,594
30-inch diameter pressure 762 30 18 18 24-inch diameter pressure 832 24 18 18
Gravity System 3 13,814 Controlling Section: Reach 1 Gravity from Sta 17+68.56 to
Sta 20+83.37 314 39 0.0014 18.21 32.83 14.62 36 15.72 39