Embed Size (px)
Citation preview
Final Environmental Assessment
C&H Hog Farms
Newton County, Arkansas
Prepared by:
United States Department of Agriculture Farm Service Agency
United States Small Business Administration
December 2015
Draft Finding of No Significant Impact
C&H Hog Farms
Newton County, Arkansas
December 2015
Introduction
The United States Department of Agriculture Farm Service Agency (FSA) and the Small Business
Administration (SBA) have jointly prepared an Environmental Assessment (EA), which is incorporated by
reference, in response to the Court’s holding in Buffalo River Watershed Alliance v. United States Dep’t
of Agriculture, No. 4-13-cv-450-DPM (Eastern District Arkansas), that the FSA and SBA issued guarantees
to Farm Credit Services of Western Arkansas for that bank’s loans to C&H Hog Farms for the
construction of a privately owned hog farm near Mt. Judea in Newton County, Arkansas, without first
fully complying with the National Environmental Policy Act (NEPA). Consistent with the Court’s ruling,
NEPA, the implementing regulations adopted by the Council on Environmental Quality, and FSA and SBA
rules and regulations, the EA examined the environmental effects of C&H Hog Farms.
C&H Hog Farms is a Concentrated Animal Feeding Operation (CAFO) located in Newton County,
Arkansas. CAFOs are regulated by the United States Environmental Protection Agency under the Clean
Water Act to control the discharge of pollutants into surface waters through issuance of National
Pollutant Discharge Elimination System (NPDES) Permits, which include extensive operating
requirements designed to reduce and eliminate adverse impacts.
In 2012, the owners of C&H Hog Farms applied for loans from Farm Credit Services of Western Arkansas,
a lender which then sought guarantees from the SBA and FSA. Using the loans, the owners of C&H Hog
Farms purchased 23.43 acres and on that site, constructed gestational and farrowing barns and two
ponds, which store waste that is used as fertilizer on nearby land. Construction began in December of
2012, operations began in April of 2013, and land application of fertilizer derived from the farm began in
late December 2013. In August of 2013, environmental groups filed a complaint against the SBA and the
FSA and in December of 2014, the Court enjoined the Agencies from making payment on their loan
guarantees should the owners default on their loans, until the agencies comply fully with NEPA and the
Endangered Species Act. The farm operations continue in accordance with the terms of the facility’s
NPDES General Permit.
Proposed Action and Alternatives
The No Action Alternative would vacate Federal loan guarantees from SBA and FSA, C&H Hog Farms and
its lender, Farm Credit Services of Western Arkansas, would be free to continue their financial
relationship without Federal guarantees and C&H Hog Farms could continue its operations in
compliance with its NPDES General Permit. Operations are detailed in Section 2.1 of the EA and include:
the operation of the farm, which can house up to 6,503 swine in two barns; collection of waste and
wash water from the facility in engineered holding ponds that exceed regulatory requirements;
application of wastes as fertilizer to nearby hay fields and pasture in accordance with strict terms of the
farm’s NPDES General Permit; and adherence to a number of reporting, maintenance, and operations
requirements.
The Proposed Action would continue the Federal guarantees from the SBA and the FSA to loans made to
C&H Hog Farms. Operations, land application of fertilizer, maintenance, reporting requirements, and
operating requirements, which currently occur in compliance with the farm’s NPDES General Permit,
would continue. Consistent with the Purpose and Need, no other alternatives were considered in detail.
Reasons for Finding of No Significant Impact
In consideration of the analysis documented in the EA and in accordance with the Council on
Environmental Quality regulations, FSA and SBA have determined that the proposed action would not
constitute a major action affecting the human and natural environment. This determination is based the
analysis detailed in Chapter 3 of the EA, including the following:
1. Water quality data collected before and after operation of the farm began and at sites upstream
and downstream from the farm, as well as data collected by a study designed specifically to
monitor the water quality effects of the farm, show no evidence of adverse impacts.
Concentrations of toxic organic and inorganic compounds monitored downstream of the farm are
not at levels expected to cause mortality or sub-lethal effects to freshwater bivalves or aquatic
invertebrates. Since the application of fertilizer from C&H Hog Farms is more closely managed
under the NPDES General Permit requirements, there is the potential for improved water quality
conditions, as historically fields have been fertilized at rates not governed by such requirements.
2. Setbacks from wetlands and closely managed application of fertilizer are required by the farm’s
NPDES General Permit. Therefore, runoff of nutrients into wetland areas is unlikely and no direct
or indirect impacts to wetlands are anticipated.
3. No significant direct or indirect impacts to groundwater quality are expected based on protections
provided by rigid adherence to the farm’s NPDES General Permit requirements as well as
additional voluntary measures employed by the operators.
4. No impacts to soils or geology would result from farm operations.
5. The United States Fish and Wildlife Service concurs that the farm operations are not expected to
adversely affect threatened and endangered species.
6. The operation of C&H Hog Farms does not violate the Buffalo River Enabling Act, as the farm is not
a water resources project. Based on water quality data, as well as park visitation metrics since the
farm began operating, no impacts to the Buffalo National River are anticipated.
7. The proposed action would not result in significant odor impacts since agriculture, including
grazing, pasture management, and application of manure as fertilizer, are not unusual in the area.
The farm employs a number of best management practices to reduce or control odor.
8. Operation of C&H Hog farms would not adversely affect the demography, population, income,
employment, government revenues, or expenditures in the region. The farm provides the
community with nine jobs, annual property taxes, and contributes to the local farm economy by
supplying fertilizer to nearby producers, providing local options and reducing input costs to those
producers.
9. There would be no disproportionate effects to low-income populations because the operation of
C&H Hog Farms within the terms of its NPDES General Permit and other environmental
regulations to protect public health and welfare effectively prevent significant impacts.
10. The proposed action would not adversely affect sites eligible for listing in the National Register of
Historic Places.
11. The proposed action does not set precedent for FSA or SBA and would not normally require an EIS.
12. The proposed action’s contribution to cumulative impacts of other past, present or foreseeable
future actions are not expected to be significant.
Public Availability of FONSI
Prior to making a final determination, the Final EA and draft FONSI will be made available for public
review for 30 days in compliance with 40 CFR 1501.4(e)(2). Notifications will be published in newspapers
and copies will be made available at the Arkansas State FSA office, the Boone County FSA office, the
Newton County Library, and on the FSA NEPA website (http://www.fsa.usda.gov/programs-and-
services/environmental-cultural-resource/nepa/current-nepa-documents/index). Written comments will
be accepted by mail at: C&H Hog Farms EA, c/o Cardno, Inc., 501 Butler Farm Road, Suite H, Hampton,
VA 23666; and by email at: [email protected].
Determination
Based on the analysis and information contained in the EA prepared for this proposed action, it is my
determination that the subject proposal will not significantly affect the quality of the human and natural
environment and does not constitute a major Federal action affecting the quality of the human and
natural environment. Therefore, the preparation of an Environmental Impact Statement is not
necessary. I also find that the EA properly documents the proposal’s compliance with environmental
laws and requirement listed therein.
Approved
___________________________________
Farm Service Agency Administrator
___________________________________
Small Business Administration
Cover Sheet
Proposed Action: The United States Department of Agriculture (USDA) Farm Service Agency (FSA) Farm Loan Programs (FLP) and the Small Business Administration (SBA) have jointly prepared this Environmental in response to the Court’s holding in Buffalo River Watershed Alliance v. United States Dep’t of Agriculture, No. 4‐13‐cv‐450‐DPM (Eastern District Arkansas), that the FSA and SBA issued guarantees to Farm Credit Services of Western Arkansas for that bank’s loans to C&H Hog Farms for the construction of a privately owned hog farm near Mt. Judea in Newton County, Arkansas, without first fully complying with the NEPA. This EA examines the environmental effects of C&H Hog Farms.
Type of Document: Final Environmental Assessment
Lead Agencies: Farm Service Agency and Small Business Administration
Further Information: Nell Fuller USDA FSA National Environmental Compliance Manager 202‐720‐6303
Comments: The Final Environmental Assessment was prepared in accordance with the USDA Farm Service Agency National Environmental Policy Act implementation procedures found in 7 Code of Federal Regulations 799, as well as the National Environmental Policy Act of 1969, Public Law 91‐190, 42 United States Code 4321‐4347, as amended. The FSA will provide a public review and comment period prior to any final decision. Copies of this Final Environmental Assessment will be available for review at the Arkansas State FSA Office, the Boone County (which serves Newton County) FSA Office, the Newton County Library, and on the FSA NEPA website: http://www.fsa.usda.gov/programs‐and‐services/environmental‐cultural‐resource/nepa/current‐nepa‐documents/index. Mailed written comments regarding this EA shall be submitted to:
C&H Hog Farms EA c/o Cardno, Inc. 501 Butler Farm Rd. Suite H Hampton, VA 23666
Or emailed to: CHHogFarmComments@cardno‐gs.com
Final Environmental Assessment i
Table of Contents
1. Introduction ................................................................................................................................. 1‐1
1.1 Background .................................................................................................................................. 1‐1
1.1.1 FSA Farm Loan Programs .................................................................................................. 1‐1
1.1.2 Small Business Administration Loans ............................................................................... 1‐1
1.1.3 C&H Hog Farms ................................................................................................................. 1‐1
1.2 Scope of this EA ........................................................................................................................... 1‐4
1.3 Purpose and Need for Action ....................................................................................................... 1‐5
1.4 Decision to be Made .................................................................................................................... 1‐6
1.5 Regulatory Compliance ................................................................................................................ 1‐6
1.6 Public Involvement ...................................................................................................................... 1‐6
1.7 Organization of EA ....................................................................................................................... 1‐7
2. Description of Proposed Action and Alternatives .......................................................................... 2‐1
2.1 No Action Alternative .................................................................................................................. 2‐1
2.1.1 C&H Hog Farms ................................................................................................................. 2‐1
2.1.2 Land Application of Waste ................................................................................................ 2‐1
2.1.3 Operating Requirements .................................................................................................. 2‐4
2.1.4 Proposed Modifications .................................................................................................... 2‐6
2.2 Proposed Action ........................................................................................................................... 2‐7
3. Existing Environment and Environmental Consequences .............................................................. 3‐1
3.1 Issues Eliminated from Consideration ......................................................................................... 3‐1
3.2 Water Resources .......................................................................................................................... 3‐3
3.2.1 Affected Environment ...................................................................................................... 3‐6
3.2.2 Impacts from Alternative A: No Action Alternative ........................................................ 3‐13
3.2.3 Impacts from Alternative B: Proposed Action ................................................................ 3‐25
3.3 Soils and Geology ....................................................................................................................... 3‐26
3.3.1 Affected Environment .................................................................................................... 3‐26
3.3.2 Impacts from Alternative A: No Action Alternative ........................................................ 3‐29
3.3.3 Impacts from Alternative B: Proposed Action ................................................................ 3‐29
3.4 Threatened and Endangered Species ........................................................................................ 3‐30
3.4.1 Affected Environment .................................................................................................... 3‐30
3.4.2 Impacts from Alternative A: No Action Alternative ........................................................ 3‐39
3.4.3 Impacts from Alternative B: Proposed Action ................................................................ 3‐42
Final Environmental Assessment ii
3.5 Buffalo National River ................................................................................................................ 3‐42
3.5.1 Affected Environment .................................................................................................... 3‐42
3.5.2 Impacts from Alternative A: No Action Alternative ........................................................ 3‐43
3.5.3 Impacts from Alternative B: Proposed Action ................................................................ 3‐43
3.6 Odor ........................................................................................................................................... 3‐44
3.6.1 Affected Environment .................................................................................................... 3‐44
3.6.2 Impacts from Alternative A: No Action Alternative ........................................................ 3‐44
3.6.3 Impacts from Alternative B: Proposed Action ................................................................ 3‐45
3.7 Socioeconomics ......................................................................................................................... 3‐45
3.7.1 Affected Environment .................................................................................................... 3‐45
3.7.2 Impacts from Alternative A: No Action Alternative ........................................................ 3‐48
3.7.3 Impacts from Alternative B: Proposed Action ................................................................ 3‐48
3.8 Environmental Justice ................................................................................................................ 3‐48
3.8.1 Affected Environment .................................................................................................... 3‐48
3.8.2 Impacts from Alternative A: No Action Alternative ........................................................ 3‐49
3.8.3 Impacts from Alternative B: Proposed Action ................................................................ 3‐49
4. Cumulative Impacts and Irreversible and Irretrievable Resource Commitments ........................... 4‐1
4.1 Past, Present, and Reasonably Foreseeable Actions ................................................................... 4‐1
4.2 Cumulative Impacts ..................................................................................................................... 4‐5
4.2.1 Water Resources ............................................................................................................... 4‐5
4.2.2 Soils and Geology .............................................................................................................. 4‐6
4.2.3 Threatened and Endangered Species ............................................................................... 4‐6
4.2.4 Buffalo National River ....................................................................................................... 4‐7
4.2.5 Odor .................................................................................................................................. 4‐7
4.2.6 Socioeconomics ................................................................................................................ 4‐7
4.2.7 Environmental Justice ....................................................................................................... 4‐8
4.3 Irreversible and Irretrievable Resource Commitments ............................................................... 4‐8
5. Consultation, Coordination, Preparers .......................................................................................... 5‐1
6. References ................................................................................................................................... 6‐2
Appendix A – Maps ........................................................................................................................... A‐1
Appendix B – Comment Summary Report ......................................................................................... B‐1
Appendix C – USFWS Concurrence on Effects Determinations ........................................................... C‐1
Final Environmental Assessment iii
List of Tables
Table 2‐1. Location and size of fields where wastes from C&H Hog Farms are applied ........................... 2‐3
Table 3‐1. Comparison of ammonium‐N and percent unionized ammonia concentrations measured at
the upstream and downstream sites pre and post C&H Hog Farms operation (September 15,
2013 to June 1, 2015) ............................................................................................................. 3‐19
Table 3‐2. Summary water quality statistics monitored by the National Park Service at the BUFT06 site
on Big Creek from 1990 to 2014 ............................................................................................ 3‐20
Table 3‐3. Comparison of electrical conductivity, total nitrogen and phosphorus between the manure
slurry and water quality monitoring in the collection trench ................................................ 3‐25
Table 3‐4. Soil types, location, and average slope in the project area .................................................... 3‐26
Table 3‐5. Soil laboratory results from the C&H Hog Farms geologic investigation ................................ 3‐28
Table 3‐6. Federally listed species with the potential to occur in Newton County, Arkansas and C&H Hog
Farms ...................................................................................................................................... 3‐32
Table 3‐7. Population and Demographics Summary ............................................................................... 3‐46
Table 3‐8. Employment and Income Summary ........................................................................................ 3‐46
List of Figures
Figure 3‐1. USGS 07055790 Big Creek near Mt. Judea, AR station data from January to July 16, 2015 ... 3‐9
Figure 3‐2. Difference in dissolved P concentrations in Big Creek downstream and upstream of C&H Hog
Farms between September 15, 2013 and June 1, 2015 ........................................................ 3‐16
Figure 3‐3. Difference in total P concentrations in Big Creek downstream and upstream of C&H Hog
Farms between September 15, 2013 and June 1, 2015 ........................................................ 3‐17
Figure 3‐4. Difference in nitrate‐N concentrations in Big Creek downstream and upstream of C&H Hog
Farms between September 15, 2013 and June 1, 2015 ........................................................ 3‐18
Figure 3‐5. Difference in total N concentrations in Big Creek downstream and upstream of C&H Hog
Farms between September 15, 2013 and June 1, 2015 ........................................................ 3‐18
Figure 3‐6. Difference in E. coli concentrations in Big Creek downstream and upstream of C&H Hog
Farms between September 15, 2013 and June 1, 2015 ........................................................ 3‐21
Figure 3‐7. Difference in total coliform concentrations in Big Creek downstream and upstream of C&H
Hog Farms between September 15, 2013 and June 1, 2015 ................................................. 3‐21
List of Maps
Map 1. C&H Hog Farms Vicinity Map ........................................................................................................ A‐2
Map 2. C&H Hog Farms Parcel Before and After Construction ................................................................ A‐3
Map 3. Project Area .................................................................................................................................. A‐4
Map 4. Buffalo River Watershed ............................................................................................................... A‐5
Map 5. Water Quality Monitoring Stations .............................................................................................. A‐6
Map 6. Rabbitsfoot Mussel Critical Habitat .............................................................................................. A‐7
Final Environmental Assessment iv
Abbreviations and Acronyms
°C degrees Celsius
µmho/cm micromhos per centimeter
ADEQ Arkansas Department of Environmental Quality
AHPP Arkansas Historic Preservation Program
ANHC Arkansas Natural Heritage Commission
ANRC Arkansas Natural Resources Commission
APE Area of Potential Effect
BCRET Big Creek Research and Extension Team
bgs below ground surface
BMP best management practice
CAFO Concentrated Animal Feeding Operation
CEQ Council on Environmental Quality
CFR Code of Federal Regulations
CNMP Certified Nutrient Management Planner
col fecal bacteria colonies
CWA Clean Water Act
EA Environmental Assessment
EIS Environmental Impact Statement
EO Executive Order
EPA United States Environmental Protection Agency
ERI electrical resistivity imaging
ERW Extraordinary Resource Waters
ESA Endangered Species Act
ESW Ecologically Sensitive Waterbodies
FLP Farm Loan Program
FONSI Finding of No Significant Impact
FSA Farm Service Agency
GHG greenhouse gas
HDPE high‐density polyethylene
HEL Highly Erodible Land
HELC Highly Erodible Land Conservation
HUC hydrologic unit code
mg/L milligrams per liter
mil millimeter
ml milliliters
MMP Mortality Management Plan
N nitrogen
NAWQA National Water Quality Assessment
NEPA National Environmental Policy Act
NH3 ammonia
NH4 ammonium
Final Environmental Assessment v
NHPA National Historic Preservation Act
nitrate‐N nitrate plus nitrite
NMP Nutrient Management Plan
NO2 nitrite
NO3 nitrate
NOC Notice of Coverage
NOI Notice of Intent
N‐org organic nitrogen
NPDES National Pollutant Discharge Elimination System
NPS National Park Service
NRCS Natural Resources Conservation Service
NRHP National Register of Historic Places
NSW Natural and Scenic Waterways
P phosphorus
pH chemical symbol that is a numeric scale used to specify the acidity or alkalinity of an aqueous solution
P‐Index Phosphorus Index
PL Public Law
RUSLE‐2 revised universal soil loss equation
SBA Small Business Administration
sf square foot
SHPO State Historic Preservation Officer
SUP Special Use Permit
TAN/L total ammonia nitrogen per liter
THPO Tribal Historic Preservation Officer
TMDL total maximum daily load
TSP technical service provider
USACE United States Army Corps of Engineers
USDA United States Department of Agriculture
USFWS United States Fish and Wildlife Service
USGS United States Geological Survey
WMA Wildlife Management Area

Final Environmental Assessment 1‐1
1. INTRODUCTION
The United States Department of Agriculture (USDA) Farm Service Agency (FSA) Farm Loan Programs
(FLP) and the Small Business Administration (SBA) have jointly prepared this Environmental Assessment
(EA) under the National Environmental Policy Act (NEPA) (Public Law [PL] 91‐190) in response to the
Court’s holding in Buffalo River Watershed Alliance v. United States Dep’t of Agriculture, No. 4‐13‐cv‐
450‐DPM (Eastern District Arkansas), that the FSA and SBA issued guarantees to Farm Credit Services of
Western Arkansas for that bank’s loans to C&H Hog Farms for the construction of a privately owned hog
farm near Mt. Judea in Newton County, Arkansas, without first fully complying with the NEPA.
Consistent with the Court’s ruling, NEPA, the implementing regulations adopted by the Council on
Environmental Quality (CEQ) (40 Code of Federal Regulations [CFR] 1500‐1508), and FSA and SBA rules
and regulations, this EA examines the environmental effects of C&H Hog Farms.
1.1 Background
1.1.1 FSA Farm Loan Programs
The FSA’s FLP provides loans and loan guarantees to farmers and ranchers, who are unable to obtain
credit elsewhere to start, purchase, sustain, or expand operations. Unlike loans from a commercial
lender, FSA loans provide temporary credit, with the goal to aid producers who are unable to obtain a
loan without a guarantee, in establishing credit from a commercial lender. The Guaranteed Loan
Program loans are made and serviced by commercial lenders. FSA guarantees the lender’s loan against
loss, up to 95 percent. The FLP requires extensive due diligence including financial and land ownership
history investigation, production reporting, and environmental compliance documentation.
Administration of the FLP is described in 7 CFR 761, and FSA Handbooks 1‐FLP General Program
Administration and 2‐FLP Guaranteed Loan Making and Servicing.
1.1.2 Small Business Administration Loans
The SBA provides a number of financial assistance programs for small businesses that are designed to
meet key financing needs. Under the SBA Guaranteed Loan Programs, the SBA does not make direct
loans to small businesses but, rather, in accordance with applicable regulations set out in 13 CFR Part
120, issues guarantees to certain private lenders that extend loans to eligible small businesses.
1.1.3 C&H Hog Farms
C&H Hog Farms (AFIN 51‐00164, Permit No. ARG590001) is a Concentrated Animal Feeding Operation
(CAFO) located approximately 0.7 mile west of Mount Judea in Newton County, Arkansas. Using loans
from Farm Credit Services of Western Arkansas backed by guarantees from the SBA and FSA, the owners
of C&H Hog Farms purchased 23.43 acres and constructed new facilities on that site including
gestational and farrowing barns and two waste holding ponds. Waste from the farm is applied as
fertilizer to nearby land. Section 2.1 provides a detailed description of facilities and operations.
The farm site is located on an approximately 23‐acre parcel in the southwest ¼ of the northwest ¼ of
Section 26, Township 15 North, Range 20 West of Newton County, Arkansas (see Map 1 in Appendix A).
Final Environmental Assessment 1‐2
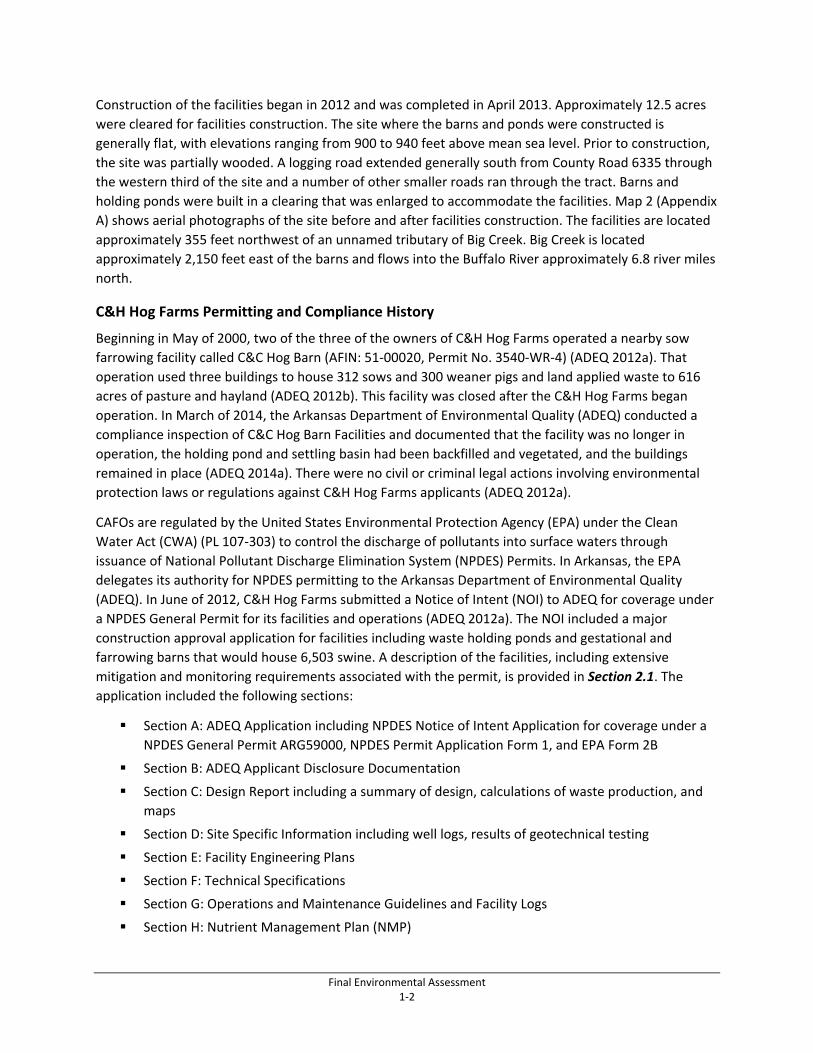
Construction of the facilities began in 2012 and was completed in April 2013. Approximately 12.5 acres
were cleared for facilities construction. The site where the barns and ponds were constructed is
generally flat, with elevations ranging from 900 to 940 feet above mean sea level. Prior to construction,
the site was partially wooded. A logging road extended generally south from County Road 6335 through
the western third of the site and a number of other smaller roads ran through the tract. Barns and
holding ponds were built in a clearing that was enlarged to accommodate the facilities. Map 2 (Appendix
A) shows aerial photographs of the site before and after facilities construction. The facilities are located
approximately 355 feet northwest of an unnamed tributary of Big Creek. Big Creek is located
approximately 2,150 feet east of the barns and flows into the Buffalo River approximately 6.8 river miles
north.
C&H Hog Farms Permitting and Compliance History
Beginning in May of 2000, two of the three of the owners of C&H Hog Farms operated a nearby sow
farrowing facility called C&C Hog Barn (AFIN: 51‐00020, Permit No. 3540‐WR‐4) (ADEQ 2012a). That
operation used three buildings to house 312 sows and 300 weaner pigs and land applied waste to 616
acres of pasture and hayland (ADEQ 2012b). This facility was closed after the C&H Hog Farms began
operation. In March of 2014, the Arkansas Department of Environmental Quality (ADEQ) conducted a
compliance inspection of C&C Hog Barn Facilities and documented that the facility was no longer in
operation, the holding pond and settling basin had been backfilled and vegetated, and the buildings
remained in place (ADEQ 2014a). There were no civil or criminal legal actions involving environmental
protection laws or regulations against C&H Hog Farms applicants (ADEQ 2012a).
CAFOs are regulated by the United States Environmental Protection Agency (EPA) under the Clean
Water Act (CWA) (PL 107‐303) to control the discharge of pollutants into surface waters through
issuance of National Pollutant Discharge Elimination System (NPDES) Permits. In Arkansas, the EPA
delegates its authority for NPDES permitting to the Arkansas Department of Environmental Quality
(ADEQ). In June of 2012, C&H Hog Farms submitted a Notice of Intent (NOI) to ADEQ for coverage under
a NPDES General Permit for its facilities and operations (ADEQ 2012a). The NOI included a major
construction approval application for facilities including waste holding ponds and gestational and
farrowing barns that would house 6,503 swine. A description of the facilities, including extensive
mitigation and monitoring requirements associated with the permit, is provided in Section 2.1. The
application included the following sections:
Section A: ADEQ Application including NPDES Notice of Intent Application for coverage under a
NPDES General Permit ARG59000, NPDES Permit Application Form 1, and EPA Form 2B
Section B: ADEQ Applicant Disclosure Documentation
Section C: Design Report including a summary of design, calculations of waste production, and
maps
Section D: Site Specific Information including well logs, results of geotechnical testing
Section E: Facility Engineering Plans
Section F: Technical Specifications
Section G: Operations and Maintenance Guidelines and Facility Logs
Section H: Nutrient Management Plan (NMP)
Final Environmental Assessment 1‐3
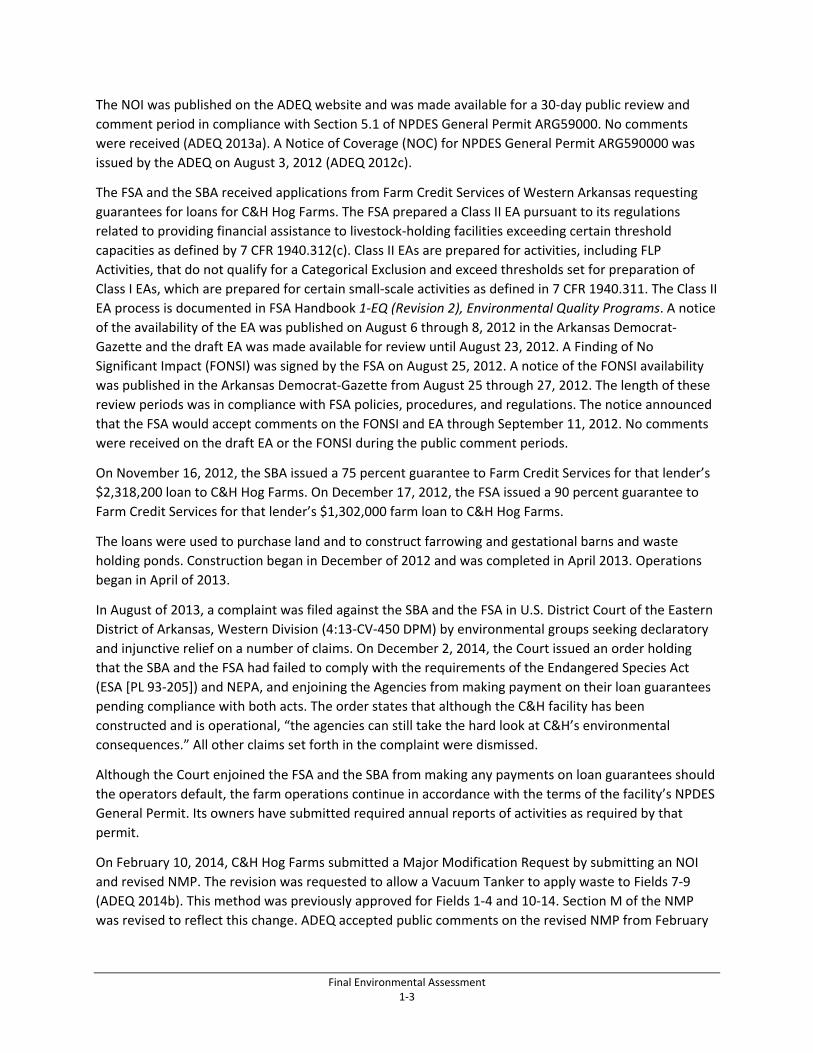
The NOI was published on the ADEQ website and was made available for a 30‐day public review and
comment period in compliance with Section 5.1 of NPDES General Permit ARG59000. No comments
were received (ADEQ 2013a). A Notice of Coverage (NOC) for NPDES General Permit ARG590000 was
issued by the ADEQ on August 3, 2012 (ADEQ 2012c).
The FSA and the SBA received applications from Farm Credit Services of Western Arkansas requesting
guarantees for loans for C&H Hog Farms. The FSA prepared a Class II EA pursuant to its regulations
related to providing financial assistance to livestock‐holding facilities exceeding certain threshold
capacities as defined by 7 CFR 1940.312(c). Class II EAs are prepared for activities, including FLP
Activities, that do not qualify for a Categorical Exclusion and exceed thresholds set for preparation of
Class I EAs, which are prepared for certain small‐scale activities as defined in 7 CFR 1940.311. The Class II
EA process is documented in FSA Handbook 1‐EQ (Revision 2), Environmental Quality Programs. A notice
of the availability of the EA was published on August 6 through 8, 2012 in the Arkansas Democrat‐
Gazette and the draft EA was made available for review until August 23, 2012. A Finding of No
Significant Impact (FONSI) was signed by the FSA on August 25, 2012. A notice of the FONSI availability
was published in the Arkansas Democrat‐Gazette from August 25 through 27, 2012. The length of these
review periods was in compliance with FSA policies, procedures, and regulations. The notice announced
that the FSA would accept comments on the FONSI and EA through September 11, 2012. No comments
were received on the draft EA or the FONSI during the public comment periods.
On November 16, 2012, the SBA issued a 75 percent guarantee to Farm Credit Services for that lender’s
$2,318,200 loan to C&H Hog Farms. On December 17, 2012, the FSA issued a 90 percent guarantee to
Farm Credit Services for that lender’s $1,302,000 farm loan to C&H Hog Farms.
The loans were used to purchase land and to construct farrowing and gestational barns and waste
holding ponds. Construction began in December of 2012 and was completed in April 2013. Operations
began in April of 2013.
In August of 2013, a complaint was filed against the SBA and the FSA in U.S. District Court of the Eastern
District of Arkansas, Western Division (4:13‐CV‐450 DPM) by environmental groups seeking declaratory
and injunctive relief on a number of claims. On December 2, 2014, the Court issued an order holding
that the SBA and the FSA had failed to comply with the requirements of the Endangered Species Act
(ESA [PL 93‐205]) and NEPA, and enjoining the Agencies from making payment on their loan guarantees
pending compliance with both acts. The order states that although the C&H facility has been
constructed and is operational, “the agencies can still take the hard look at C&H’s environmental
consequences.” All other claims set forth in the complaint were dismissed.
Although the Court enjoined the FSA and the SBA from making any payments on loan guarantees should
the operators default, the farm operations continue in accordance with the terms of the facility’s NPDES
General Permit. Its owners have submitted required annual reports of activities as required by that
permit.
On February 10, 2014, C&H Hog Farms submitted a Major Modification Request by submitting an NOI
and revised NMP. The revision was requested to allow a Vacuum Tanker to apply waste to Fields 7‐9
(ADEQ 2014b). This method was previously approved for Fields 1‐4 and 10‐14. Section M of the NMP
was revised to reflect this change. ADEQ accepted public comments on the revised NMP from February
Final Environmental Assessment 1‐4
19 to March 24, 2014 and held one public meeting. ADEQ issued a NOC for the Substantial Change
effective June 4, 2014 (ADEQ 2014c).
From April 15 through 17, 2014, the EPA Region 6 Compliance Assurance and Enforcement Division
made an unannounced inspection to determine compliance with the facility’s ADEQ General Permit
(Tracking Number ARG590001). The inspection included review of the physical site conditions, required
recordkeeping, and soil and water sampling. Waste holding ponds were found to be in good condition,
with turf reinforcement mats installed on the inside of the holding ponds to establish vegetative cover
and control erosion. The ponds were found to have adequate capacity to contain a 25‐year 24‐hour
storm event. The operators planted approximately 1,000 loblolly pine (Pinus taeda) trees around the
perimeter of the facility. Water samples were collected from various streams upgradient and
downgradient of the facility. Soil samples were taken from all land applications sites that were approved
at that time. No areas of concern were identified and it was noted that recordkeeping was well managed
and available on‐site (EPA 2014).
On February 26, 2015, C&H submitted a Major Modification Request by submitting an NOI and revised
NMP (ADEQ 2015a). The revision was requested to allow land application of wastewater via Tank Wagon
to be used in Waste Pond 2. This method was previously approved for Waste Pond 1. Section M of the
NMP was revised to reflect this change. ADEQ accepted public comments on the revised NMP from
March 18, 2015 through April 20, 2015 and held one public meeting. ADEQ issued a NOC for the
Substantial Change effective May 12, 2015 (ADEQ 2015b).
On May 7, 2015, C&H Hog Farms submitted a Major Modification Request to ADEQ to install 60‐mil high‐
density polyethylene (HDPE) liners over a geotextile base material in both waste ponds and to install an
80‐mil HDPE cover and methane flare system on Pond 1 (ADEQ 2015c). These modifications would
reduce the potential for seepage of wastes into groundwater, would control odor, and would convert
methane into carbon dioxide, a far less potent greenhouse gas. This voluntary measure by the owners is
not a change mandated by ADEQ or any other regulatory agency. As with the farm’s previous requests
for Major Modifications to the facility’s NPDES General Permit, a decision‐making process and public
comment period will follow the submittal. This process could take up to 180 days to complete.
1.2 Scope of this EA This EA is being prepared in response to the court’s order to take a “hard look” at the environmental
impacts of the C&H Hog Farms to aid the SBA and the FSA’s decision making related to their loan
guarantees. Specifically, the SBA and the FSA have to determine whether to void their existing loan
guarantees, to continue to back their guarantees, or to add additional conditions to the guarantees.
The fact that the C&H facility has already been constructed and this analysis is being undertaken after
the fact, complicates the presentation of the effects of the No Action and Proposed Action Alternatives.
If the SBA and the FSA decide to void the loan guarantees, C&H Hog Farms and its lender, Farm Credit
Services of Western Arkansas, are free to continue their financial relationship without Federal
guarantees and C&H Hog Farms can continue its operations.
CEQ regulations implementing NEPA require that alternatives considered by agencies “include the
alternative of no action” (40 CFR 1502.14(d)). CEQ has further clarified in its Memorandum to Agencies:
Final Environmental Assessment 1‐5
Forty Most Asked Questions Concerning CEQ's National Environmental Policy Act Regulations (CEQ 1981)
that:
“Section 1502.14(d) requires the alternatives analysis in the EIS to "include the
alternative of no action." There are two distinct interpretations of "no action" that must
be considered, depending on the nature of the proposal being evaluated. The first
situation might involve an action such as updating a land management plan where
ongoing programs initiated under existing legislation and regulations will continue, even
as new plans are developed. In these cases "no action" is "no change" from current
management direction or level of management intensity. To construct an alternative
that is based on no management at all would be a useless academic exercise. Therefore,
the "no action" alternative may be thought of in terms of continuing with the present
course of action until that action is changed.”
Based on CEQ guidance, the decision to be made by the SBA and the FSA, and the fact that C&H Hog
Farms has been built, is in operation, and would likely continue to operate regardless of government
guarantees of loans made in 2012 and used for land acquisition and facilities construction in 2012 and
2013, the No Action Alternative and the Proposed Action are, in fact, very similar. If SBA and FSA
decision makers decide to void their loan guarantees, the farm will likely continue to operate according
to the terms of its NPDES General Permit. Effectively, the operation of the farm in compliance with its
Permit, and absent Federal loan guarantees exemplifies CEQ’s “ongoing programs initiated under
existing legislation and regulations.” If the FSA and the SBA continue to back loans, the farm would also
continue to operate.
Given that the facilities have been constructed and are currently in operation, it is not possible to
conduct fieldwork or sampling to characterize conditions as they were prior to the land acquisition and
construction that occurred in 2012 and 2013, and ongoing operations, which commenced in April of
2013. In order to meet the “hard look” mandated by NEPA and show the impact of the C&H facility,
Chapter 3 of this document uses historical data, where they are available, to characterize the pre‐
construction environmental conditions. Data gathered after that time are used as well to characterize
impacts.
By utilizing this approach, this EA takes the mandated “hard look” at the impacts of the facility while
acknowledging the fact that the farm is operating under the terms of its ADEQ permit and can continue
to operate with or without Federal backing of loans.
1.3 Purpose and Need for Action The purpose of the Proposed Action is to reinstate FSA and SBA guarantees for loans made to C&H Hog
Farms pursuant to those Agencies’ mandates for providing assistance to agriculture producers and/or
small businesses. The need for the Proposed Action is to fulfil FSA’s and SBA’s responsibilities where
appropriate under 7 CFR 761 (Farm Loan Programs; General Program Administration) and 13 CFR 101
(Business Credit and Assistance: General Administration), respectively. The analysis in this EA, which has
been undertaken pursuant to the Court’s holding in Buffalo River Watershed Alliance v. United States
Dep’t of Agriculture, No. 4‐13‐cv‐450‐DPM (Eastern District Arkansas), considers the environmental
impacts of the C&H Hog Farms facility to assist the Agencies in determining whether the guarantees for
the loans to C&H Hog Farms are expected to have significant impacts on the human environment.
Final Environmental Assessment 1‐6
1.4 Decision to be Made Based on the information in this EA, the SBA and the FSA will decide whether:
To void the loan guarantees
To continue to back the loan guarantees on the existing terms
To back the loan guarantees with additional conditions
To undertake an Environmental Impact Statement (EIS) to further analyze the effects of the loan
guarantees
1.5 Regulatory Compliance The operators of C&H Hog Farms would be required to comply with all applicable Federal, State, and
local laws and regulations including:
Clean Air Act, as amended (PL 88‐206; 42 USC § 7401 et seq.)
Clean Water Act, as amended (PL 107‐303; 33 USC § 1251, et seq.)
Endangered Species Act of 1973 (PL 93‐205; 16 USC § 1531 et seq.)
Executive Order 11988 Floodplain Management
Executive Order 11990 Protection of Wetlands
Executive Order 12898 Environmental Justice
Section 106 of the National Historic Preservation Act of 1966 (PL 89‐665; 80 Stat. 915; 16 USC
470 et seq.), as amended (implemented under regulations of the Advisory Council on Historic
Preservation, 36 CFR Part 800)
1.6 Public Involvement For this project, the Draft EA was available for public review and comment for 30 days—from August 6
through September 4, 2015. A public meeting was held at the Jasper School, located on South Street off
Highway 7 in Jasper, Arkansas on Thursday, August 27, 2015 from 6:00 p.m. to 9:00 p.m. A Notice that
the Draft EA was available for public review and that a public meeting would be held was published in
the Arkansas Democrat‐Gazette, the Newton County Times, and the Harrison Daily Times. Copies of the
Draft EA were made available at the Arkansas State FSA Office, the Boone County (which serves Newton
County) FSA Office, the Newton County Library, and on the FSA NEPA website. Stakeholders and
interested parties were notified of the availability of the EA for review and comment by letter in
compliance with 7 CRF 1940.331.
Verbal comments on the Draft EA were recorded at the project public meeting and written comments
were accepted by mail at: C&H Hog Farms EA, c/o Cardno, Inc., 501 Butler Farm Rd., Suite H, Hampton,
VA 23666; and by email at CHHogFarmComments@cardno‐gs.com.
Eighteen people provided comments at the public meeting and 1,828 letters were received during the
public comment period. Comments included form letters (1,716), individually prepared statements,
State and Federal agency comments, information and literature reviews, and statements submitted on
behalf of interest groups. A comment summary report (provided in Appendix B) was prepared.
Final Environmental Assessment 1‐7
The Final EA (this document) and FONSI are being made available for public review for 30 days in
compliance with 40 CFR 1501.4(e)(2). Notifications will be published in newspapers and copies will be
made available at the Arkansas State FSA office, the Boone County FSA office, the Newton County
Library, and on the FSA NEPA website (http://www.fsa.usda.gov/programs‐and‐services/environmental‐
cultural‐resource/nepa/current‐nepa‐documents/index). Written comments will be accepted by mail at:
C&H Hog Farms EA, c/o Carndo, Inc., 501 Butler Farm Road, Suite H, Hampton, VA 23666; and by email
at CHHogFarmComments@cardno‐gs.com.
1.7 Organization of EA This EA assesses the potential effects of the Proposed Action and the No Action Alternative on
environmental and economic resources. Chapter 1.0 provides background information and the purpose
and need of the Proposed Action. Chapter 2.0 describes the No Action Alternative and the Proposed
Action. Chapter 3.0 describes the existing conditions (i.e., the baseline conditions against which
potential impacts of the Proposed Action and alternatives are measured) for each of the potentially
affected resources; the potential direct and indirect impacts on these resources; and any necessary
mitigation measures required to ensure no significant impacts to resources occur. Chapter 4.0 describes
cumulative impacts and irreversible and irretrievable resource commitments. Chapter 5.0 lists the
preparers of this document and contains a list of the persons and agencies contacted during the
preparation of this document and Chapter 6.0 contains references. Appendix A contains maps. Appendix
B is the comment summary report prepared for the project.
Final Environmental Assessment 2‐1
2. DESCRIPTION OF PROPOSED ACTION AND ALTERNATIVES
2.1 No Action Alternative The C&H Hog Farms facilities have been built with federally backed loans approved in 2012. The facility
began operations in April of 2013 and continues to operate. The No Action Alternative would involve the
SBA and the FSA decision makers voiding their loan guarantees. In this case, the farm will likely continue
to operate. The owners provided substantial collateral to secure the loans, including cash and property,
which could be lost in the case of default. They are repaying the loan, including interest that was
negotiated with the lender, according to loan terms. C&H Hog Farms and its lender, Farm Credit Services
of Western Arkansas, are free to continue their financial relationship without Federal guarantees and
C&H Hog Farms can continue its operations.
2.1.1 C&H Hog Farms
C&H Hog Farms’ facilities include an approximately 49,503‐square foot (sf) gestation barn and 30,286 sf
farrowing barn. The barns can house up to 6,503 swine including 2,503 over 55 pounds (boars, gestating
and lactating sows) and 4,000 under 55 pounds (nursery pigs). The barns have slatted floors over 2‐foot
deep concrete‐lined pits. Waste from the barns is washed into the pits under the barns, which have a
capacity of 101,543 cubic feet. Once every 3 to 5 weeks, these pits are gravity drained into Waste
Storage Pond 1, through a 15‐inch pipe and then an overflow spillway into Waste Storage Pond 2. The
ponds are earthen and are lined with 18 inches of compacted low permeability soil derived on‐site at
depths of 7‐11 feet, which met compaction and permeability requirements. At installation, liners were
tested and met with specifications of ASTM D‐698, Standard Test Methods for Laboratory Compaction
Characteristics of Soil, to ensure that the soil used met engineering specifications for permeability
(ADEQ 2015a). The ponds are entirely below ground level, and are surrounded by berms that slope
outward to direct rainfall away from the ponds.
The required 180‐day capacity of storage ponds is 279,436 cubic feet (2,090,326 gallons). This volume is
calculated based on the amount of waste produced by the maximum number of animals permitted at
the facility, washwater, rainfall from a 24‐hour, 25‐year event, and 180‐day net precipitation (which
accounts for expected precipitation and evaporation).. Together, the ponds have a storage capacity of
2,735,922 gallons. This capacity equates to 270 days of storage, exceeding ADEQ’s storage requirement
of 180 days by 50 percent (ADEQ 2015a).
C&H Hog Farms monitors sludge depth and periodically removes sludge from the ponds. Methods for
removing sludge and the frequency of removing sludge are not specified in the farm’s permit. This
complies with ADEQ standards. To slow the accumulation of sludge in the pond, there are agitators at
the ends of the pumps that remove the waste from ponds for land application. Sludge can also be land
applied according to NPDES General Permit terms.
2.1.2 Land Application of Waste
Waste from the ponds is periodically pumped down and applied onto nearby fields that are used for
pasture and hay production, thus consuming the nutrients in a full cycle system. The fields where wastes
are applied are either owned or leased by C&H Hog Farms. Owners of these fields enter into land use
Final Environmental Assessment 2‐2
contracts with C&H Hog Farms. The contracts can include specific guidelines and requirements related
to waste application, which can be added to by the landowners. None of the landowners specified any
such requirement in this instance.
A Natural Resources Conservation Service (NRCS) Certified Nutrient Management Planner (CNMP) and
Technical Service Provider (TSP)—DeHaan, Grabs and Associates—prepared the NPDES General Permit
application including a NMP. The application was submitted to ADEQ on June 7, 2012. Infiltration
capabilities of soils were assessed for each field by the TSP. The University of Arkansas, Division of
Agriculture, conducted an assessment of baseline soil chemistry. In addition, NRCS Revised Universal Soil
Loss Equation (RUSLE‐2) was used to predict erosion.
As described in Section 3.2.5.2 of C&H Hog Farm’s NPDES General Permit (ARG590001), the NMP for the
facility uses the Narrative Approach for applying manure as fertilizer. This approach allows for
application rates to be calculated prior to each application using the Arkansas Phosphorus Index (P‐
Index) to ensure that land where manure is applied is at low risk for runoff of nutrients. The P‐Index is
used to calculate appropriate application rates prior to each land application based on the most recent
data available including soil and manure chemistry, land use, and land characteristics in the areas where
waste is applied. Inputs to P‐Index change based on site‐specific soil and manure chemistry,
characteristics of land where manure is applied (including slope, pasture use, timing of application, and
best management practices employed). While the NMP allows for fertilizer applications year round,
winter application is permitted at reduced rates consistent with the P‐Index.
Manure sampling and analysis are conducted prior to each land application by laboratories identified in
the NMP. The NMP provides methodologies for soil and manure sampling and analysis (ADEQ 2015a).
Section C (Land Application Calculations) of C&H Hog Farms’ Nutrient Management Plan (ADEQ 2015d)
contains the initial calculations of land application rates based on predicted waste characteristics, since
at the time of the development of the NMP there was no waste to be sampled. Subsequently,
application rates have been recalculated using the P‐Index as is required by the Narrative Approach
before each land application. These are reported in C&H Hog Farms’ Annual Reports.
Buffer strips are maintained between fields where waste is applied and streams, sinkholes, or other
conduits to surface waters (100 feet); property boundaries (50 feet); and occupied dwellings (500 feet).
This and other elements of the design described in Section 2.1.3 are designed to prevent runoff of
wastes into surrounding areas.
It is not known how the land application fields were managed and maintained prior to their inclusion in
C&H Hog Farms NMP. Because they lie outside the area identified by the Arkansas General Assembly as
a Nutrient Surplus Area, development of NMPs is not required (Arkansas Code § 15‐20‐1104). It is likely
that they were periodically seeded, cut, tilled, and fertilized to maximize forage value. Because the fields
were not governed by terms of an NMP, soil testing prior to application of fertilizer was not required nor
were setbacks, timing restrictions, or any of the operating requirements that C&H Hog Farms must
follow (see Section 2.1.3). The frequency, application rate, location, timing, and application method of
fertilizer not derived from C&H Hog Farms is not known.
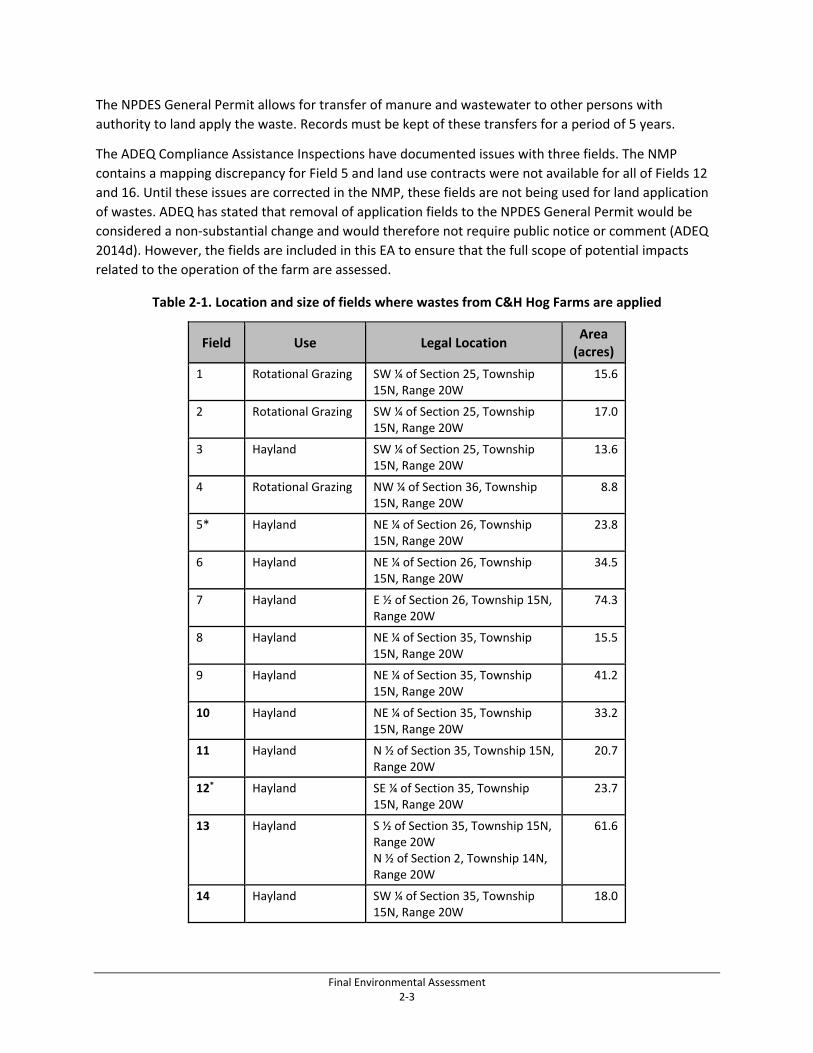
Table 2‐1 describes the location, use, and size of fields identified in the NMP where wastes could be
applied (ADEQ 2015a). These are also shown on Map 3 (Appendix A). The acreages given represent the
total acreage of each field. Required buffers and setbacks reduce the area where waste can be applied.
Final Environmental Assessment 2‐3
The NPDES General Permit allows for transfer of manure and wastewater to other persons with
authority to land apply the waste. Records must be kept of these transfers for a period of 5 years.
The ADEQ Compliance Assistance Inspections have documented issues with three fields. The NMP
contains a mapping discrepancy for Field 5 and land use contracts were not available for all of Fields 12
and 16. Until these issues are corrected in the NMP, these fields are not being used for land application
of wastes. ADEQ has stated that removal of application fields to the NPDES General Permit would be
considered a non‐substantial change and would therefore not require public notice or comment (ADEQ
2014d). However, the fields are included in this EA to ensure that the full scope of potential impacts
related to the operation of the farm are assessed.
Table 2‐1. Location and size of fields where wastes from C&H Hog Farms are applied
Field Use Legal Location Area (acres)
1 Rotational Grazing SW ¼ of Section 25, Township 15N, Range 20W
15.6
2 Rotational Grazing SW ¼ of Section 25, Township 15N, Range 20W
17.0
3 Hayland SW ¼ of Section 25, Township 15N, Range 20W
13.6
4 Rotational Grazing NW ¼ of Section 36, Township 15N, Range 20W
8.8
5* Hayland NE ¼ of Section 26, Township 15N, Range 20W
23.8
6 Hayland NE ¼ of Section 26, Township 15N, Range 20W
34.5
7 Hayland E ½ of Section 26, Township 15N, Range 20W
74.3
8 Hayland NE ¼ of Section 35, Township 15N, Range 20W
15.5
9 Hayland NE ¼ of Section 35, Township 15N, Range 20W
41.2
10 Hayland NE ¼ of Section 35, Township 15N, Range 20W
33.2
11 Hayland N ½ of Section 35, Township 15N, Range 20W
20.7
12* Hayland SE ¼ of Section 35, Township 15N, Range 20W
23.7
13 Hayland S ½ of Section 35, Township 15N, Range 20W N ½ of Section 2, Township 14N, Range 20W
61.6
14 Hayland SW ¼ of Section 35, Township 15N, Range 20W
18.0
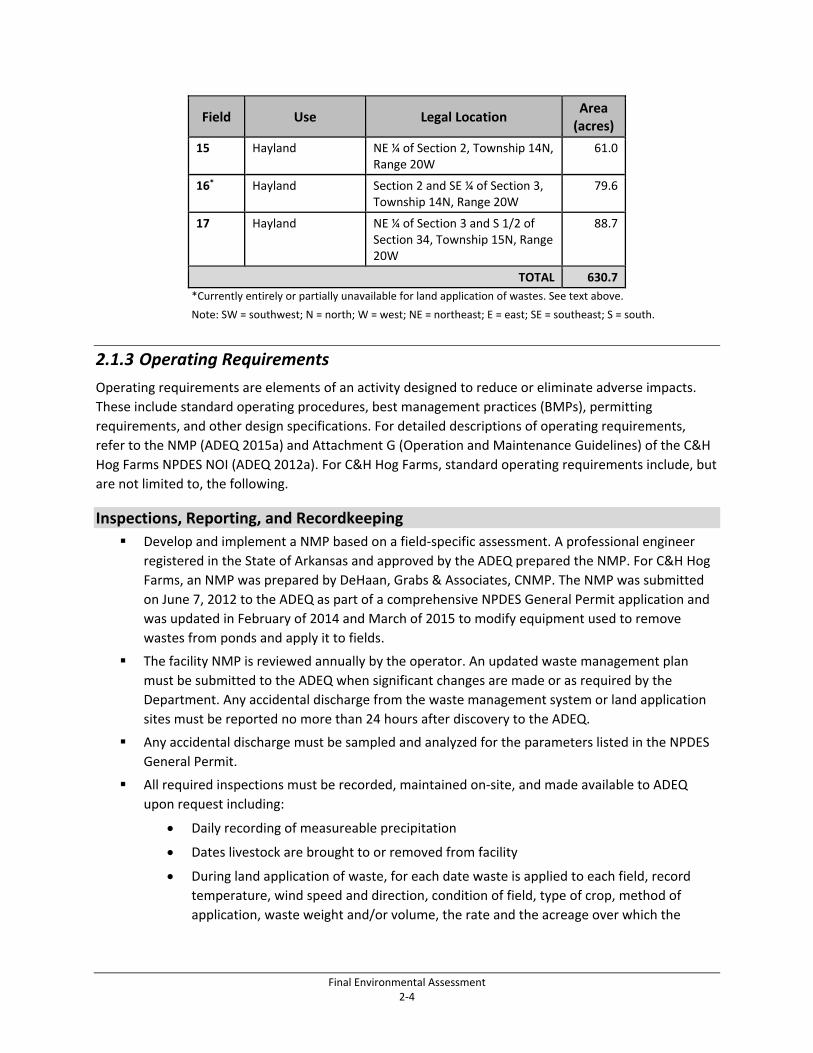
Final Environmental Assessment 2‐4
Field Use Legal Location Area (acres)
15 Hayland NE ¼ of Section 2, Township 14N, Range 20W
61.0
16* Hayland Section 2 and SE ¼ of Section 3, Township 14N, Range 20W
79.6
17 Hayland NE ¼ of Section 3 and S 1/2 of Section 34, Township 15N, Range 20W
88.7
TOTAL 630.7
*Currently entirely or partially unavailable for land application of wastes. See text above.
Note: SW = southwest; N = north; W = west; NE = northeast; E = east; SE = southeast; S = south.
2.1.3 Operating Requirements
Operating requirements are elements of an activity designed to reduce or eliminate adverse impacts.
These include standard operating procedures, best management practices (BMPs), permitting
requirements, and other design specifications. For detailed descriptions of operating requirements,
refer to the NMP (ADEQ 2015a) and Attachment G (Operation and Maintenance Guidelines) of the C&H
Hog Farms NPDES NOI (ADEQ 2012a). For C&H Hog Farms, standard operating requirements include, but
are not limited to, the following.
Inspections, Reporting, and Recordkeeping
Develop and implement a NMP based on a field‐specific assessment. A professional engineer
registered in the State of Arkansas and approved by the ADEQ prepared the NMP. For C&H Hog
Farms, an NMP was prepared by DeHaan, Grabs & Associates, CNMP. The NMP was submitted
on June 7, 2012 to the ADEQ as part of a comprehensive NPDES General Permit application and
was updated in February of 2014 and March of 2015 to modify equipment used to remove
wastes from ponds and apply it to fields.
The facility NMP is reviewed annually by the operator. An updated waste management plan
must be submitted to the ADEQ when significant changes are made or as required by the
Department. Any accidental discharge from the waste management system or land application
sites must be reported no more than 24 hours after discovery to the ADEQ.
Any accidental discharge must be sampled and analyzed for the parameters listed in the NPDES
General Permit.
All required inspections must be recorded, maintained on‐site, and made available to ADEQ
upon request including:
Daily recording of measureable precipitation
Dates livestock are brought to or removed from facility
During land application of waste, for each date waste is applied to each field, record
temperature, wind speed and direction, condition of field, type of crop, method of
application, waste weight and/or volume, the rate and the acreage over which the
Final Environmental Assessment 2‐5
waste/wastewater is applied, condition of equipment being used, condition of pond
liner and embankment when wastes are pumped down
Weekly inspection of risers and pipes to ensure they are not plugged or damaged
Weekly inspection of ponds for signs of leaking or seeping, excessive settling, vegetation
growth or damage
Weekly inspection of fences and signage
Weekly recording of livestock mortalities and carcass disposal pursuant to the Mortality
Management Plan
Annual soil and waste/wastewater nutrient testing conducted as outlined in the NMP
and as required by NPDES General Permit ARG590000.
Annual reporting to ADEQ must include the following: waste/wastewater analyses conducted;
locations, volumes, and application rates for the previous year; methods of application; and
types of crops grown on each land application site.
Maintain on‐site a current copy of the approved General Water Pollution Control Permit for
CAFO Application and the NMP.
Maintain on‐site the previous 5 years of reports of all required inspections, soil and manure
nutrient tests, calculations of allowable manure application rates and actual rates applied;
documentation of any action taken to correct deficiencies; documentation of any discharge,
steps taken to correct.
Facilities Operations and Maintenance
Vehicular travel is confined to designated areas to prevent erosion and damage to vegetation.
Growth of trees around holding ponds is prevented. Vegetation growth in the holding ponds
below the Must Pumpdown level is controlled to prevent damage to pond liner.
Components of the waste management system are maintained to ensure all contaminated
runoff enters containment ponds.
The containment ponds are designed, constructed, operated, and maintained to contain all
waste/wastewater including the runoff and the direct precipitation from a 25‐year, 24‐hour
rainfall event.
Pens are maintained to prevent or minimize standing water.
A pesticide program is undertaken to control insects, if necessary, following EPA standards and
consistent with manufacturing labels and guidelines.
Mortalities are disposed of promptly in accordance with the Mortality Management Plan.
Land application of waste is planned and carried out to prevent holding pond levels from rising
above the Must Pumpdown level.
Land Application of Waste
Waste/wastewater is not applied to land classified as highly erodible, saturated, or frozen
ground, or during rainfall events.
When possible, land application is downwind from residences and will avoid calm and humid
days when conditions restrict the dispersal and dilution of odors.
Final Environmental Assessment 2‐6
Land application avoids, when possible, weekends and holidays when people are more likely to
be outdoors.
Wastes are not applied on snow or frozen ground unless unavoidable. If unavoidable, such
application must comply with conditions specified in NPDES General Permit ARG590000.
Wastes are not applied immediately after rain or within 12 hours of forecasted rain unless it can
be immediately incorporated into the soil. A vacuum tanker may be used to knife inject the
nutrients for soil incorporation.
Waste/wastewater is evenly distributed over application sites at the rates specified in the site
management plan. Weather conditions and nutrient holding capacity of the soil determine the
timing and rate of waste application. All land application areas receive application at rates
consistent with infiltration capabilities of the native soil such that there is no runoff to
surrounding areas.
Liquid manure is applied at agronomic rates for phosphorus (P) application, which follows the
Arkansas Nutrient Management Planner phosphorous index risk assessment to ensure there is
no risk of surface water pollution.
Waste/wastewater is not applied within 100 feet to any downgradient surface waters, open tile
line intake structures, sinkholes, agricultural wellheads, or other conduits to surface waters.
Waste application does not occur within 100 feet of any water well.
Application of waste/wastewater is not made within 50 feet of property lines or 500 feet of
neighboring occupied buildings existing as of the date of the permit. The restrictions regarding
property lines or neighboring occupied buildings do not apply if the adjoining property is also
approved as a land application site under a permit issued by the ADEQ or if the adjoining
property owner consents in writing.
Other
Operators notify the appropriate fish and wildlife agency in the event of fish, wildlife, or
migratory bird or endangered species kill or die‐off on or near a retention pond or in the fields
where waste has been applied and which could reasonably have resulted from waste
management at the facility.
2.1.4 Proposed Modifications
On May 7, 2015, C&H submitted a Major Modification Request to the ADEQ to install 60‐mil HDPE liners
over a geotextile base material in both waste ponds and to install an 80‐mil HDPE cover and methane
flare system on Pond 1 (ADEQ 2015c). The geotextile is designed to allow gasses to travel between the
clay liner and the HDPE liner and escape, preventing the formation of bubbles beneath the liner. Sludge
would be removed from the ponds prior to installation of the liners as is currently allowed under the
terms of the farm’s NPDES General Permit. These modifications would address concerns about potential
seepage of wastes into groundwater, would control odor, and would convert methane into carbon
dioxide, a far less potent greenhouse gas. As with the farm’s previous requests for Major Modifications
to the facility NPDES General Permit, a decision‐making process and public comment period will follow
the submittal. This process could take up to 180 days to complete and it is not clear when or whether
the changes would be approved. However, since the modifications requested in the 2015 NOI have the
Final Environmental Assessment 2‐7
potential to occur, this document will discuss potential impacts with and without the requested
modification.
2.2 Proposed Action The Proposed Action would continue the Federal guarantees from the SBA and the FSA to loans made to
C&H Hog Farms. Operations, land application of waste, maintenance, reporting requirements, and
design features would be the same as those described for the No Action Alternative in accordance with
the ADEQ requirements. If additional mitigations are required to reduce impacts, those would be
incorporated into the proposed action.
Final Environmental Assessment 3‐1
3. EXISTING ENVIRONMENT AND ENVIRONMENTAL CONSEQUENCES
This section describes the environment affected by implementation of the alternatives described in
Chapter 2 and describes the potential for direct and indirect impacts as well as mitigation measures
required to ensure that significant environmental and social impacts do not occur. Since it is not possible
to conduct fieldwork or sampling to characterize pre‐construction conditions at the C&H Hog Farm site,
historic data are included, where they are available, in the existing environment sections for each
resource.
3.1 Issues Eliminated from Consideration CEQ regulations (40 CFR 1501.7) state that the lead agency shall identify and eliminate from detailed
study the issues that are not significant or that have been covered by prior environmental review,
narrowing the discussion of these issues in the document to a brief presentation of why they would not
have a significant effect on the human or natural environment or providing a reference to their coverage
elsewhere. For C&H Hog Farms, such issues include the following.
Cultural Resources
As part of the Class II EA process and in compliance with Section 106 of the National Historic
Preservation Act (NHPA), the Arkansas Historic Preservation Program (AHPP) was consulted and on July
27, 2012, the Deputy State Historic Preservation Officer (SHPO) issued a statement that no known
historic properties would be affected by the undertaking (AHPP 2012). In April of 2013, the SHPO
provided comments on the FSA’s EA. The letter stated again that no known historic properties would be
affected by the undertaking and clarified that discoveries of unknown archaeological sites encountered
during construction must be reported to SHPO and any affected Tribal Historic Preservation Officer
(THPO) within 48 hours in compliance with 36 CFR 800.13, Protection of Historic Properties (AHPP
2013a). In a letter to the FSA dated May 8, 2013, the SHPO requested topographic maps of the fields
where wastes from C&H Hog Farms would be applied, stating that these areas are also part of the Area
of Potential Effect (APE) in addition to the site where facilities were constructed (AHPP 2013b). On May
16, 2013, the FSA provided a response with additional information (FSA 2013a). On May 22, 2013, SHPO
responded that although the exact boundaries of the waste disposal fields was not known, there are
three archaeological sites and two structures in or adjacent to the APE, which includes both the 23‐acre
farm site and the lands where waste could be applied. The letter stated that one site and one structure
are eligible for inclusion in the National Register of Historic Places (NRHP) and two sites are potentially
eligible and recommended that the eligible and potentially eligible sites be avoided and protected (AHPP
2013c). On June 5, 2013, a letter from the FSA to the SHPO documented ongoing discussions with SHPO
office staff, which confirmed that the two potentially eligible sites are actually located outside the APE,
and are thus avoided. One of the two NRHP‐eligible sites—a cemetery—lies approximately 255 feet
south of Field 7, which is separated by a wooded area and road. This site lies west‐northwest of Field 8
and is separated from Field 8 by the 500‐foot buffer around an adjacent occupied dwelling, as required
by the NPDES General Permit. The other potentially eligible site is a 19th century Arkansas vernacular
structure, which is also protected by a 500‐foot buffer by the terms of its NPDES General Permit. Thus,
all known NRHP‐eligible and potentially eligible sites are protected from potential impacts of the
operations of C&H Hog Farms (FSA 2013b). On June 13, 2013, a letter from FSA provided the Osage
Nation THPO with background information on C&H Hog Farms project and requested input, constraints,
Final Environmental Assessment 3‐2
and concerns (FSA 2013c). No response was received (pers. comm. Linda Newkirk 2015). If loans were
not federally backed or if Federal guarantees are voided, consultation in compliance with Section 106 of
the NHPA would not be required.
Floodplains
As part of the Class II EA process, both USDA Form RD 1940‐20 and the NMP for C&H Hog Farms (ADEQ
2012a) documented that there were no floodplains present at the facility. Portions of the application
fields may be located within the floodplain of Big Creek. There are no Federal Emergency Management
Agency flood maps for the area. Application of manure will not occur within 100 feet of any
downgradient surface waters in compliance with the NPDES General Permit setbacks. While some of the
application fields may be within the floodplain of Big Creek, the Proposed Action would not alter the
morphology or channel characteristics of the Big Creek floodplain.
Wilderness Areas, Coastal Barriers, and Coastal Zones
There are no designated Wilderness Areas, Coastal Barriers, or Coastal Zones in or near C&H Hog Farms.
Noise
Construction and operation of C&H Hog Farms would not permanently increase ambient noise levels at
or adjacent to the farm site or fields where wastes are land applied. It is likely that increased noise levels
were associated with construction of the farm facilities, but this noise was temporary and localized. The
farm site is surrounded by forest and is located 0.7 mile from Mt. Judea School, the nearest occupied
dwelling. Newton County is rural, and the vicinity of the farm and land application fields are sparsely
populated. The land application fields were hay and pasture land prior to being used as part of C&H Hog
Farms NMP, and they continue to be used for that purpose. Noise from heavy equipment is common on
agricultural lands.
Air Quality
C&H Hog Farms lies in the Northwest Arkansas Intrastate Air Quality Control Region, which is in
attainment for all criteria pollutants established by the EPA in compliance with the Clean Air Act.
Primary air emission sources associated with C&H Hog Farms include the barns incinerator, and mobile
sources such as equipment used during land application of manure. An air permit for the facility is not
required since the stationary source emissions do not exceed threshold criteria defined in the Arkansas
Air Pollution Control Code, Regulation 18.301. The potential emission sources are controlled by
operating and maintenance requirements included in the NPDES General Permit and associated NMP.
Combustion emissions from the incinerator are controlled by the Mortality Management Plan (MMP),
which meets standards set by the Arkansas Livestock & Poultry Commission’s regulations for the
disposal of large animal carcasses (ALPC 2004). Best management practices included in the NMP control
dust emissions from land application of manure. The NMP, MMP, and the Operation and Maintenance
Guidelines for C&H Hog Farms are part of the NPDES General Permit. Therefore, air quality is controlled
through compliance with operation and maintenance requirements defined in the Permit, which
prevents significant air quality impacts.
This EA addresses greenhouse gas (GHG) emissions consistent with the CEQ’s Revised Draft Guidance for
Federal Departments and Agencies on Consideration of Greenhouse Gas Emissions and the Effects of
Climate Change in NEPA Reviews (CEQ 2014). The Proposed Action is not expected to emit more than
Final Environmental Assessment 3‐3
25,000 metric tons of GHG annually; therefore, a quantitative analysis is not warranted. Individual
sources of anthropogenic GHG emissions are not large enough to have an appreciable effect on climate
change. For this reason, emissions of GHGs from the proposed action alone would not cause appreciable
global warming that would lead to climate change. The proposed major modification to C&H Hog Farm’s
NPDES General Permit would reduce air emissions from operations by capturing and combusting
methane in a flare. This would effectively convert methane emissions to combustion emissions such as
water and carbon dioxide, thus reducing GHG emissions from the CAFO operations.
Vegetation and Wildlife
Vegetation and wildlife are the flora and fauna, both native and introduced that characterize an area.
Approximately 12.5 acres of the 23‐acre tract purchased for construction of the C&H Hog Farms facilities
were cleared to accommodate the facilities. Vegetation on the site was primarily a mix of coniferous and
deciduous trees common to the area with some open areas including a logging road that ran north to
south through the eastern third of the tract. See Map 2 in Appendix A for aerial photography before and
after the facilities construction. Fields where wastes could be land applied have been cleared of native
vegetation at some time in the past. Prior to inclusion in the C&H Hog Farms NMP, the hay and pasture
were established on these fields, which have been managed for forage production. Wildlife that
characterize the north central Arkansas including the Boston Mountains ecoregion vegetation
community include white‐tailed deer (Odocoileus virginianus), raccoon (Procyon lotor), opossum
(Didelphis virginiana), bobcat (Lynx rufus), mink (Neovison vison), black bear (Ursus americanus), and
beaver (Castor canadensis) along with increasing numbers of feral pigs (Sus scrofa) (USDA/FSSR 2005).
Elk (Cervus canadensis) populations have slowly increased since their re‐introduction in the Buffalo
National River in 1981 and 1985 and have since expanded into the adjacent Gene Rush Wilderness and
some private lands (Arkansas Game and Fish Commission 2015). Construction of the C&H Hog Farms
facilities resulted in the loss of approximately 12.5 acres of vegetation and wildlife habitat. Ongoing
operations of C&H Hog Farms would not affect any vegetation or wildlife on the waste application fields,
as these fields have been historically managed for forage production.
3.2 Water Resources For this assessment, water resources include surface water, wetlands, and groundwater including sole
source aquifers.
Surface Water
Surface waters include rivers, streams, creeks, lakes, reservoirs, and other impoundments that support
everyday life through provision of water for drinking and other public uses, irrigation, and industry. The
principal law governing pollution of the nation’s surface water resources is the CWA of 1977. The CWA
utilizes water quality standards, permitting requirements, and monitoring to protect water quality. The
EPA sets the standards for water pollution abatement for all Waters of the U.S. under the CWA
programs, but in most cases, gives qualified states the authority to issue and enforce water quality
certification permits. Arkansas’ water quality standards (Regulation 2) are based on the physical,
chemical, and biological characteristics of least disturbed streams within ecoregions established using
landforms, potential natural vegetation, soils types, and land uses.
Final Environmental Assessment 3‐4
The EPA has established conditions under which separate storm sewers and CAFOs are considered point
sources of pollution subject to NPDES General Permit requirements. Operators of point source
discharges must obtain a permit specifying allowable amounts and constituents of effluents. Most
agricultural activities are not point sources of pollution subject to NPDES permits. In Arkansas, the EPA
delegates its authority for NPDES permitting to ADEQ. The NPDES program is guided by the State’s
Water Quality Management Plan and the State’s Surface Water Quality Standards.
Animal waste can impact surface water quality from organic matter, nutrients, and fecal bacteria.
Arkansas water quality standards for nutrients (phosphorus [P] and N) are:
“Materials stimulating algal growth shall not be present in concentrations sufficient to
cause objectionable algal densities or other nuisance aquatic vegetation or otherwise
impair any designated use of the waterbody. Impairment of a waterbody from excess
nutrients are dependent on the natural waterbody characteristics such as stream flow,
residence time, stream slope, substrate type, canopy, riparian vegetation, primary use
of waterbody, season of the year and ecoregion water chemistry. Because nutrient
water column concentrations do not always correlate directly with stream impairments,
impairments will be assessed by a combination of factors such as water clarity,
periphyton or phytoplankton production, dissolved oxygen values, dissolved oxygen
saturation, diurnal dissolved oxygen fluctuations, pH values, aquatic‐life community
structure, and possibly others. However, when excess nutrients result in an impairment,
based upon Department assessment methodology, by any established, numeric water
quality standard, the waterbody will be determined to be impaired by nutrients.”
The EPA standard for nitrate (NO3) in drinking water is 10 milligrams per liter (mg/L). There are no
Federal water quality criteria for the protection of aquatic life for nitrate or nitrite. For aquatic life in
freshwater, the EPA recommends an acute criterion magnitude of 17 milligrams (mg) total ammonia
nitrogen per liter (TAN)/L and a chronic criterion magnitude of 1.9 mg TAN/L at pH 7 and 20 degrees
Celsius (°C), with the stipulation that the chronic criterion cannot exceed 4.8 mg TAN/L for a 4‐day
average. All criteria magnitudes are recommended not to be exceeded more than once in 3 years on
average. The EPA recommends a value of 0.01 mg/L total P for streams and rivers in aggregate
ecoregion XI, which includes the Buffalo Watershed (EPA 2000).
The Arkansas standard for bacteria is calculated as a geometric mean. A geometric mean is a type of
mean (or average) that indicates the central tendency or typical value of a set of numbers by using the
product of their values (as opposed to the arithmetic mean, which uses their sum). Bacteria
concentrations can be highly variable, thus using a geometric mean reduces the effects of the higher
and lower values. The EPA and ADEQ calculate the geometric mean from at least five samples collected
within 30 days at evenly spaced time intervals during the 30‐day period.
The Arkansas water quality standard for bacteria is:
A. Primary Contact Waters – Between May 1 and September 30, the maximum allowable fecal
coliform criteria, calculated as a geometric mean, shall be 200 fecal bacteria colonies (col)/100
milliliters (ml) and the single‐sample maximum shall be 400 col/100 ml. Alternatively, in these
waters, the maximum allowable Escherichia coli (E. coli) criteria, calculated as a geometric mean,
shall be 126 col/100 ml and the single‐sample maximum shall be 298 col/100 ml in lakes,
Final Environmental Assessment 3‐5
reservoirs, Extraordinary Resource Waters (ERW), Ecologically Sensitive Waterbodies (ESW), and
Natural and Scenic Waterways (NSW), or 410 col/100 ml in all other rivers and streams. During
the remainder of the calendar year, these criteria may be exceeded, but at no time shall these
counts exceed the level necessary to support secondary contact recreation (below).
B. Secondary Contact Waters – The maximum allowable fecal coliform criteria, calculated as a
geometric mean, shall be 1000 col/100 ml and the single‐sample maximum shall be 2000
col/100 ml. Alternatively, the maximum allowable E. coli criteria, calculated as a geometric
mean, shall be 630 col/100 ml and the single‐sample maximum shall be 1490 col/100 ml for
lakes, reservoirs, ERWs, ESWs, and NSWs or 2050 col/100 ml for all other rivers and streams.
C. For assessment of ambient waters as impaired by bacteria, the above listed applicable values for
E. coli shall not be exceeded in more than 25 percent of samples in no less than eight samples
taken during the primary contact season or during the secondary contact season.
Under Section 303(d) of the CWA, States, territories, and authorized Tribes are required to develop lists
of impaired waters. These waters do not meet water quality standards that have been set for them,
even after point sources of pollution have installed the minimum required levels of pollution control
technology. The law requires that these jurisdictions establish priority rankings for waters on the lists
and develop estimates of the Total Maximum Daily Load (TMDL) for these waters. A TMDL is a
calculation of the maximum amount of a pollutant that a water body can receive and still safely meet
water quality standards.
Wetlands
Wetlands are defined by United States Army Corp of Engineers (USACE) as those areas characterized by
a prevalence of vegetation adapted to saturated soil conditions and that are identified based on specific
soil, hydrology, and vegetation criteria defined by USACE (USACE 1987, 2010). Wetlands associated with
running water systems and typically found along rivers, creeks, and drainage ways, with a defined
channel and floodplain are referred to as riparian wetlands. The CWA established a program to regulate
the discharge of dredged or fill material into wetlands. The CWA further provides for regulations and
procedures for the protection of wetlands and compensation for unavoidable impacts. Executive Order
(EO) 11990 provides another layer of wetland protection. The purpose of EO 11990 is to "minimize the
destruction, loss, or degradation of wetlands and to preserve and enhance the natural and beneficial
values of wetlands." To meet these objectives, the EO requires Federal agencies, in planning their
actions, to consider alternatives to wetland sites and limit potential damage if an activity affecting a
wetland cannot be avoided. The EO applies to the acquisition, management, and disposition of Federal
lands and facilities construction and improvement projects that are undertaken, financed or assisted by
Federal agencies; any Federal activities and programs affecting land use.
Groundwater
Groundwater is water that is stored underground in natural geologic formations called aquifers. The
Safe Drinking Water Act is the main Federal law that protects the quality of drinking water. The EPA
designates “sole source” aquifers that supply at least 50 percent of the drinking water consumed in an
area overlying the aquifer. Under the Safe Drinking Water Act, the EPA sets standards for drinking water
quality and oversees the States, localities, and water suppliers who implement those standards.
Final Environmental Assessment 3‐6
This analysis focuses on groundwater quality and quantity. Arkansas relies on several programs to
protect and maintain groundwater use and quality. These include programs established under the
Arkansas Ground Water Protection and Management Act (§15‐22‐901 et seq.) (ANRC 2015a), the major
statute dealing with groundwater use and management at the State level, as well as other programs and
actions taken under the State law and regulations. In addition, the State cooperates with the Federal
government on various groundwater pollution control programs derived from Federal mandates. For
instance, the ADEQ issues environmental permits as authorized by the EPA (40 CFR §122.28).
3.2.1 Affected Environment
Surface Water
C&H Hog Farms is located in the Buffalo Watershed (8‐digit hydrologic unit code [HUC] 11010005)
draining approximately 1,340 square miles. As shown on Map 4 (Appendix A), the entire farm and the
fields where wastes are applied are contained within the Headwaters Big Creek‐Buffalo River sub‐
watershed (12 digit HUC 110100050302), which encompasses approximately 45 square miles. Big Creek
drains the Headwaters Big Creek‐Buffalo River sub‐watershed and is fed by several perennial or
intermittent tributaries including Dry, Campbell, Cow, and Tilly creeks. Nutrient management fields 3, 5,
6, 7, 8, 9, 10, and 12 are located adjacent to Big Creek. Fields 1, 2, and 4 are located near two unnamed
tributaries of Big Creek. The Waste Ponds 1 and 2 are located approximately 2,200 feet west of Big
Creek (Map 2; Appendix A). Big Creek flows into the Buffalo River approximately 6.8 river miles north of
the C&H barns and ponds.
In the Buffalo Watershed, surface water quality and streamflow are monitored by ADEQ, the United
States Geological Survey (USGS), and the National Park Service (NPS). As shown on Map 5 (Appendix A),
there are 79 monitoring stations in the Buffalo watershed. There are two USGS gaging stations located
within the Headwaters Big Creek‐Buffalo River sub‐watershed both of which are downstream of the
farm. There is one NPS water quality monitoring site (BUFT06) located on Big Creek approximately 6
miles downstream of the farm. The NPS began monitoring water quality on the Buffalo River and its
tributaries within the boundaries of the park in 1985. Between 1985 and 1990, water quality monitoring
for metals and nutrients was conducted once each season. Between 1991 and 1995, sites were sampled
every other month. Since 1996, most sites have been consistently sampled on a quarterly basis (Mott
and Laurans 2004, Usrey 2013).
The Buffalo River has been designated as an Outstanding National Resource Water and Extraordinary
Resource Water; therefore, it is subject to more stringent water quality standards than undesignated
streams. In 2008, two segments of the Buffalo River were assessed and listed on the State 303(d) list.
Stream segment 1 was found to be impaired for temperature and stream segment 5 was found to be
impaired for dissolved oxygen (ADEQ 2008). The State’s 303(d) Reports for 2010, 2012, and 2014 are still
in draft, as the EPA has not approved them. In 2010, the ADEQ proposed removing Segment 5 and in
2012 proposed removing Segment 1 from the list of impaired waters. The EPA has not approved the
removal of these stream segments from the 303(d) list; therefore, they are still considered impaired.
Stream segment 5 is located approximately 83 river miles downstream of the confluence of Big Creek
and the Buffalo River. Stream segment 1 is located approximately 94 river miles downstream of the
confluence of Big Creek and Buffalo River. Big Creek is located approximately 2,150 feet east of the C&H
barns and flows into the Buffalo River approximately 6.8 river miles north.
Final Environmental Assessment 3‐7
A Nutrient Surplus Area is an area that has been designated by the Arkansas General Assembly as having
such high concentrations of one or more nutrients that continued unrestricted application of the
nutrient could negatively impact soil fertility and waters of the State. In Nutrient Surplus Areas, private
landowners who plan to fertilize an area of 2.5 acres or more with litter, sewage sludge, or commercial
fertilizer are required to prepare a NMP and become certified as a private applicator or hire a
commercial applicator to apply the nutrients. Regulations requiring NMPs in Nutrient Surplus Areas
were implemented to eliminate or minimize the transport of nutrients into waterways and reduced soil
fertility from over application. The Buffalo Watershed is not identified as a Nutrient Surplus Area.
Buffalo River water quality is generally very good with the exception of the two stream segments listed
on the 303(d) list (ADEQ 2008). Bacteria levels monitored in the river are well below State water quality
standards (Mott and Laurans 2004, Usrey 2013). Mott and Laurans (2004) reported that nitrate
concentrations tended to increase near the middle of the river and may be attributed to land use.
However, only two monitoring sites near the headwaters of the river had a statistically supported
increase in nitrate concentrations over time (between 1985 and 2001). Spring discharge may be
contributing to increased nitrate levels at these sites on the Buffalo River. There is evidence to indicate
that nitrate contamination may be coming from sources outside the river’s surface water drainage area.
Ammonia and orthophosphate values have been found to be minimal and no significant changes over
time were observed for these parameters (Mott and Laurans 2004).
Tributaries to the river discharge at lower volumes and land use tends to be more concentrated along
these streams. Therefore, there is greater potential for higher concentrations of contaminants in
tributaries such as Big Creek. As of 2012, NPS recorded E. coli concentrations in the Buffalo River are
well below the state standards. While E. coli concentrations in some tributaries were found to be twice
as high as those recorded in the mainstem, the concentrations are also well below the State water
quality standards (Usrey 2013).
Although the NPS water quality monitoring program may indicate chronic conditions or long‐term
trends, quarterly sampling for nutrients and bacteria is insufficient data to capture actual conditions in
the dynamic stream system, particularly given the highly variable concentrations of nutrients and
bacteria in relation to stream flow volumes (Usrey 2013). The nearest NPS sampling site (BUFFT06)
located on Big Creek is approximately 6 river miles downstream of C&H Hog Farms and is located in the
Outlet Big Creek‐Buffalo River sub‐watershed (HUC 110100050304) which encompasses approximately
40 square miles. Approximately 6 square miles of the Outlet Big Creek‐Buffalo river sub‐watershed
drains directly into Big Creek above the sampling site and the eastern portion of the Piercetown
community occurs within that drainage area. Additionally, the entire Left Fork Creek sub‐watershed
(HUC 110100050301) encompassing approximately 38 square miles, empties into Big Creek above the
sampling site. Therefore, land use and development occurring in these sub‐watersheds (or portions of)
are contributing to the concentrations of nutrients and bacteria sampled at the BUFT06 monitoring site.
Thus, any change in concentrations of nutrients or bacteria recorded at the BUFFT06 sampling site
cannot be directly attributed to the C&H Hog Farms. Data collected at this site are given below in Table
3‐2.
To accurately assess the potential point source impacts from C&H Hog Farms on water quality,
concentrations of nutrients and bacteria would need to be monitored at and adjacent to the site and the
fields where nutrients are applied. By monitoring immediately upstream and downstream of the farm
Final Environmental Assessment 3‐8
and at the fields, any measurable increase in nutrient or bacteria concentrations discharging from the
operations would be recorded and the contribution from other sources would be eliminated or
minimized.
An independent, in‐depth case study of C&H Hog Farms is currently being conducted by scientists from
the University of Arkansas System Division of Agriculture. The Big Creek Research and Extension Team
(BCRET) is comprised of faculty and staff from the Division, USGS specialists, Newton County Extension
agents, and several technicians. The team includes the region’s foremost experts in the fields of
agricultural impacts to water quality, livestock nutrient management, soil quality and sustainability, and
ecosystems. The team members and their qualifications can be accessed on the BCRET website:
http://cars.uark.edu/bcret_home/bios/.
The first year of the 5‐year study was funded by the State of Arkansas. Research began in October 2013.
The BCRET report their findings on a quarterly basis to the ADEQ and the Governor’s office (BCRET
2013). The quarterly reports can be accessed online at http://www.bigcreekresearch.org/. The study
was designed to evaluate the potential impact and sustainable management of the C&H Hog Farms
operation. The major study tasks are: to monitor the fate and transport of N, P, sediment, and bacteria
from land‐applied swine effluent to pastures; to assess the potential impact of farming operations on
the water quality of Big Creek below the farm; and to determine the effectiveness and sustainability of
alternative manure management techniques (BCRET 2014a). The study has been peer‐reviewed by a
panel of four independent, out‐of‐state water quality experts (BCRET 2014b).
While the BCRET study does have limited baseline data, it has been ongoing for 21 months, was
developed to specifically evaluate C&H Hog Farms potential impacts to water quality, and is considered
the best available scientific information.
The BCRET study currently has eight monitoring stations that are sampled on a weekly basis and
following storm flow events (Map 5). Ten stations have been established over the course of the study;
however, one station was abandoned following vandalism and one due to access issues. The two
locations upstream and downstream of the farm on Big Creek and the spring located below Field 1 have
been sampled since September 2013. Runoff from three of the application fields is also sampled; Field 1
(pasture/slurry applied), Field 12 (hay/slurry applied), and Field 5a (hay/no slurry applied) (BCRET
2014b). Field 5a somewhat serves as a control since no slurry from the farm is applied, but it is likely the
landowner does fertilize the field on a routine basis using chicken litter and/or Triple 19 or another
commercial product (pers. comm. Sharpley 2015). Field 5a is not a natural baseline but can be compared
to the fields where slurry is applied at a managed rate to evaluate the differences in nutrient or bacteria
contributions to surface water. The three fields give a range in landscape position, topography, and soil
fertility levels and are considered a representative strata of all the fields where C&H Hog Farms is
permitted to apply nutrients (BCRET 2013). An interceptor trench to sample water quality and flow was
installed below the manure‐holding ponds in the summer of 2014 (BCRET 2014b). A water well adjacent
to the barns is also sampled (BCRET 2014c).
In May/June 2015, an additional monitoring station was established in Left Fork as it enters Big Creek
and the USGS has installed height gage at that location (USGS 07055792). Nutrient and bacteria
concentrations from this location, which drains a watershed similar to Big Creek but does not contain a
CAFO operation, can be compared to the concentrations sampled at the site downstream of the farm
(BCRET 2015b).
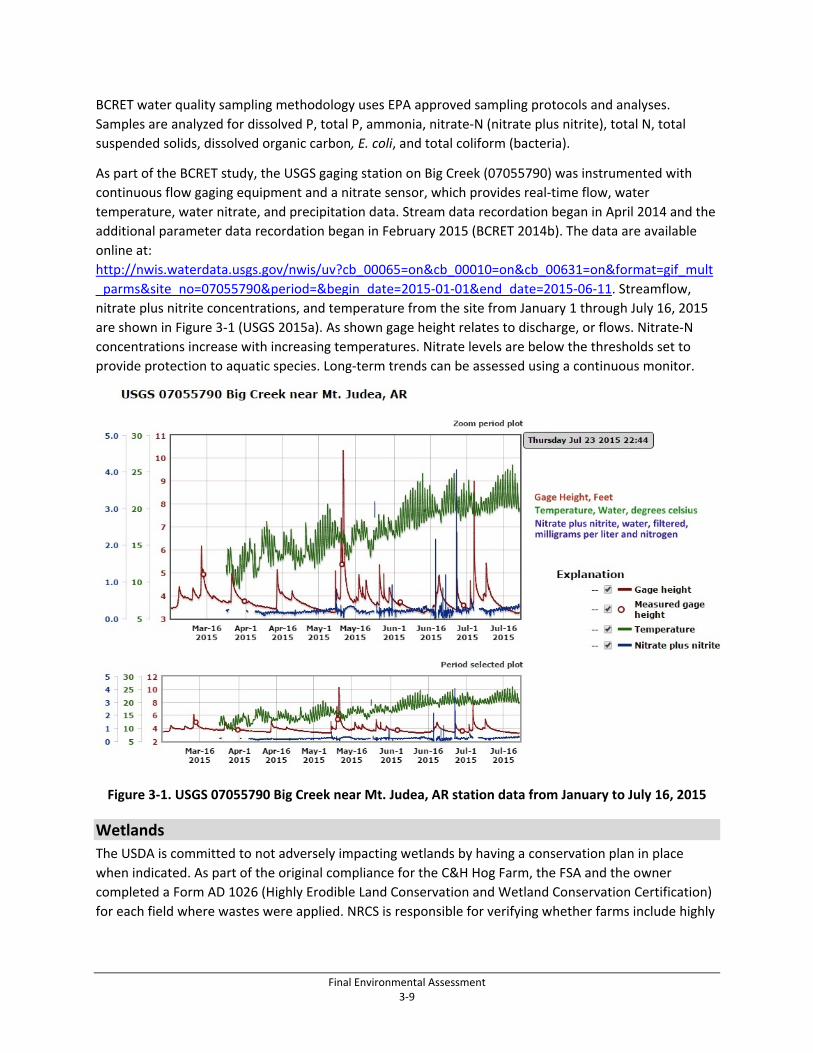
Final Environmental Assessment 3‐9
BCRET water quality sampling methodology uses EPA approved sampling protocols and analyses.
Samples are analyzed for dissolved P, total P, ammonia, nitrate‐N (nitrate plus nitrite), total N, total
suspended solids, dissolved organic carbon, E. coli, and total coliform (bacteria).
As part of the BCRET study, the USGS gaging station on Big Creek (07055790) was instrumented with
continuous flow gaging equipment and a nitrate sensor, which provides real‐time flow, water
temperature, water nitrate, and precipitation data. Stream data recordation began in April 2014 and the
additional parameter data recordation began in February 2015 (BCRET 2014b). The data are available
online at:
http://nwis.waterdata.usgs.gov/nwis/uv?cb_00065=on&cb_00010=on&cb_00631=on&format=gif_mult
_parms&site_no=07055790&period=&begin_date=2015‐01‐01&end_date=2015‐06‐11. Streamflow,
nitrate plus nitrite concentrations, and temperature from the site from January 1 through July 16, 2015
are shown in Figure 3‐1 (USGS 2015a). As shown gage height relates to discharge, or flows. Nitrate‐N
concentrations increase with increasing temperatures. Nitrate levels are below the thresholds set to
provide protection to aquatic species. Long‐term trends can be assessed using a continuous monitor.
Figure 3‐1. USGS 07055790 Big Creek near Mt. Judea, AR station data from January to July 16, 2015
Wetlands
The USDA is committed to not adversely impacting wetlands by having a conservation plan in place
when indicated. As part of the original compliance for the C&H Hog Farm, the FSA and the owner
completed a Form AD 1026 (Highly Erodible Land Conservation and Wetland Conservation Certification)
for each field where wastes were applied. NRCS is responsible for verifying whether farms include highly
Final Environmental Assessment 3‐10
erodible lands or wetlands. Any wetlands or farmed wetlands must have a determination for setback
requirements and all fields permitted to receive nutrients must have a completed Form AD 1026 on file.
Groundwater
Regional Groundwater Supply and Sources
C&H Hog Farms is located in the Ozark Plateau aquifer system, which consists of three regional aquifers:
from shallowest to deepest, the regional aquifers are the Springfield Plateau, the Ozark, and the St.
Francois aquifers (Imes and Emmett 1994; Adamski et al. 1995; Renken 1998). Specifically, the farm is
located on the regional Springfield Plateau aquifer system.
The Springfield Plateau aquifer crops out along the southern and western perimeter of the Springfield
Plateau as a narrow belt 5‐ to 10‐miles wide in north‐central Arkansas, but it exposed in a more than 50‐
mile wide band in northwestern Arkansas (Renken 1998). Springfield Plateau aquifer generally ranges
from 200‐ to 400‐feet thick throughout northern Arkansas and is composed entirely of limestones and
cherty limestones of the Mississippian‐age Boone Formation and its basal member, the St. Joe
Limestone (Adamski et al. 1995).
The surface of the unconfined Springfield Plateau aquifer generally reflects overlying topography (Imes
and Emmett 1994; Adamski et al. 1995). The unconfined Springfield Plateau aquifer is recharged nearly
everywhere by precipitation. Groundwater flows mostly laterally and then discharges into springs and
seeps along streams (Adamski et al. 1995).
The primary Springfield Plateau Aquifer of the region, which consists locally of Boone Formation
limestone, is characterized by moderate to high secondary porosity. Karst features and springs are more
abundant in the nonchert‐bearing limestones, such as the St. Joe Limestone of the Boone Formation.
The number of sinkholes in the Springfield Plateau generally averages less than 1 per 100 miles2 , except
near the city of Springfield, Missouri, where there are more than 10 sinkholes per 100 miles2 (Adamski et
al. 1995).
Groundwater flow rates are difficult to model and quantify in karst systems due to complex dissolution
features and preferential flow. As reported by Soto (2014), groundwater dye trace studies have been
conducted in eight watershed areas around the area of the Buffalo National River to determine the
sources of water that feed the river. Groundwater flow in karst systems can cross the surface watershed
boundaries, and may not correspond with surficial drainage basin divides (Soto 2014). Such conditions
are not observed in the southern part of the Buffalo River watershed where the farm is located.
The eight watershed areas involved in the studies included (1) the Mitch Hill Spring Research Area, (2)
the Fitton Cave and Van Dyke Spring Recharge Area, (3) Springs in the Mill Creek Topographic Area, (4)
the Dogpatch Springs Topographic Basin, (5) the Davis Creek Topographic Area, (6) the John Eddings
Cave/Elm Spring Recharge Area, (7) the Gilbert Spring and the Gilbert Community, and (8) the
Tomahawk Creek Area. All the watersheds studied are located on the north side of the Buffalo National
River, except for the John Eddings Cave/Elm Spring Recharge Area (Soto 2014). Results of the Buffalo
National River dye trace studies indicate that not all caves and /or springs in the Buffalo area appear to
share watersheds (Soto 2014). In 1999, field observations and dye‐tracer studies conducted in the
Buffalo National River indicated that water discharged from some springs in the Buffalo River watershed
Final Environmental Assessment 3‐11
originated in the Bull Shoals Lake watershed and traveled at velocities exceeding 640 meters per day
(Murray and Hudson 2002). The Bull Shoals Lake Watershed is located northeast of the C&H Hog Farms.
Wells drilled into the Springfield Plateau aquifer generally have yields of less than 20 gallons/minute;
therefore, most wells are used primarily for domestic water supply and for watering livestock (Imes and
Emmett 1994).
The Springfield Plateau aquifer is not part of an EPA Sole Source Aquifer (EPA 2015a), nor an Arkansas
Natural Resources Commission’s (ANRC) Critical Groundwater Area (ANRC 2015b). A Sole Source Aquifer
is located in an area with few or no alternative sources to groundwater resources. A Critical
Groundwater Area is an area determined by the Arkansas Natural Resources Commission to have
significant groundwater depletion or degradation and would be subject to limitations of withdrawals.
Regional Groundwater Quality
The importance of the Ozark Plateau aquifers led to their inclusion as one of the initial study units in the
USGS National Water‐Quality Assessment (NAWQA), a program with the goal of describing the status
and trends in the quality of the Nation’s water resources. The results of the sampling program indicated
that dissolved solids were less than the NAWQA national median; pesticides were detected less
frequently than other aquifers; and nitrate concentrations in parts of the Springfield Plateau were higher
than in most other aquifers and were attributed to agricultural areas and chicken houses (Cox et al.
1980; Peterson et al. 1998).
Because much of the Bull Shoals watershed is covered by agricultural land, consisting mostly of livestock
operations, it is possible that nutrient contaminants from these agricultural activities reach the Buffalo
River by interbasin transfer of groundwater (Murray and Hudson 2002).
Site Groundwater Quality and Use
The soluble nature of limestones gives rise to karst terrain in the southern Ozarks region. Highly soluble
conditions in certain areas of the Buffalo River watershed, distant from the site, including the western
and north‐central parts of the watershed, have produced pervasive occurrence of karst features,
including caves, sinkholes, springs, and sinking streams (Hudson et al. 2001, Soto 2014). However, the
C&H Hog Farms site and vicinity do not exhibit strongly developed karst landforms as demonstrated by a
review of the Mt. Judea USGS 7.5 minute topographic quadrangle map and online aerial photograph
information. The topographic and aerial photography review indicated that limited numbers of karst
ponds are located on upper reaches of floodplains, where a separation of shallow perched groundwater
in alluvial and epikarst (Hudson et al. 2001) from deeper groundwater in the Boone Formation may
explain development of sinkhole ponds in overburden, due to dewatered secondary porosity in the
underlying bedrock. Although a hydraulic connection of surface water and groundwater typifies large‐
scale features of the Boone Formation (Kresse et al. 2014) in areas of significant karst landform
development or at streams that have incised alluvium or overburden, the western floodplain and basal
hillslopes above the floodplain in the vicinity of the C&H Hog Farms do not appear to match this
characterization.
Big Creek’s elevation and comparison to intermittent streams on the topographic map suggest that it
lies below the regional water table elevation and is therefore not a sinking stream. Sinking streams have
a channel that flows across a karst feature that is sufficiently large to drain the entire base‐flow volume,
Final Environmental Assessment 3‐12
if the underlying karst aquifer water level is below the stream elevation. That is, if a losing stream
condition applies, so that a losing stream condition and a feature large enough are present, the stream
disappears into the underlying formation. A losing stream condition is one where the surface water is
recharging the underlying aquifer. A gaining stream is one that is gaining water from discharge of the
aquifer. Due to the proximity of higher terrain to the east and west, it would be expected that localized
recharge of the Boone Formation would result in discharge/gaining stream conditions in the base of a
valley, except in very dry conditions. Therefore, Big Creek is likely a gaining stream at most locations and
at most times, and the USGS topographic quadrangle map supports this conclusion by showing Big Creek
as a perennial stream. More detailed hydrogeological and hydraulic evaluation would be needed to
establish a history of losing/gaining stream conditions on a seasonal basis.
The BCRET study conducted a Ground Penetrating Radar of Fields 1, 5, and 12 (BCRET 2013, 2014a).
However, due to the sensitivity of the equipment and the dampening effect of clay particles the results
were inconclusive in confirming the presence of karst features (pers. comm. A. N. Sharpley 2015).
Piezometers were installed in the three monitored fields by the BCRET team. These were flooded in the
spring and currently the private landowner has denied access. There are no quality data available for
this study effort (pers. comm. A. N. Sharpley 2015).
An electrical resistivity imaging (ERI) analysis of Fields 5a and 12 was initiated in December 2014 by the
School of Geology, Oklahoma State University. The preliminary analysis showed that additional data
were needed and a second field effort was conducted in May 2015 (BCRET 2014c, pers. comm. A. N.
Sharpley 2015). For the second quarter of 2015, a preliminary report on the December 2014 analysis
was completed. The results of the May surveys are not yet available. The 2014 ERI surveys confirmed
the soil thickness, presence, extent, and depth of epikarst features and bedrock material. The average
epikarst thickness underlying the two fields was found to be highly variable ranging from 6 to 75 feet
thick. There appears to be a large doline feature, a closed topographic depression caused by dissolution
or collapse of underlying rock or soil, within the weathered bedrock underlying Field 12. Additional
analysis could enhance the delineation of possible karst features and further information is needed to
have a more complete view of the field to understand connections between surface and groundwater
(Fields and Halihan 2015). These studies need ground truthing to determine the correlation of ERI data
to epikarst and alluvium and especially to characterize those units' hydraulic characteristics.
A groundwater characterization, karst inventory, and a fluorescent dye tracing study are being
conducted on Big Creek. However, no published data or results are available from these studies (Soto
2014). Dr. John Van Brahana provided a comment on the Draft EA that referenced an experiment
conducted near the C&H barns and application fields. Dr. Van Brahana’s comment, along with a
preliminary white paper and PowerPoint presentation that are available online, were reviewed. The
experiment involved injecting dye into a “dug well” and then observing the dye in nearby springs and
surface waters to identify the direction and velocity of subsurface water flow. While scientific
methodology, assumptions, and data are not provided, the available documents state that preliminary
calculations at the locations where the experiment was conducted indicate rapid subsurface flow and a
connection to surface water. Water quality data collected by the Karst Hydrogeology of the Buffalo
National River (Dr. Van Brahana’s team) is not available through the USGS or EPA water quality
databases. Sections 3.2.2 and 3.2.3 present surface water quality data collected by the NPS and BCRET
before and after construction of the farm and collected upstream and downstream after construction of
the farm and demonstrate no change in surface water quality.
Final Environmental Assessment 3‐13
As part of the NPDES General Permit application, Geotechnical & Testing Services conducted a geologic
investigation of the barn and pond locations. The geologic investigation bored test holes to depths
ranging from 11.5 to 18.5 feet. No water was encountered in the boreholes. No limestone was
encountered. The third boring encountered refusal at 11.5 feet, but characterization of the refusal as
bedrock limestone was not provided. (ADEQ 2015a). The geotechnical investigation did not encounter
karst features beneath the C&H Hog Farms facilities. The abundance of chert indicates a lower
propensity for large‐scale karst landform development compared to other parts of the Buffalo River
watershed (Hudson et al. 2001).
The BCRET study team has installed an interceptor trench below the ponds and is sampling water quality
at that location to determine whether the holding ponds are leaking (BCRET 2014b, 2014c). There are
few methods to accurately quantify potential pond leakage and the methodology is confounded given
the small amount of potential leakage and variable evaporation and precipitation rates. The study team
is collecting electrical conductivity tests during water quality sampling, which may help determine
whether the water sampled is groundwater or wastewater (pers. comm. A. N. Sharpley 2015). Available
data to date are presented in Table 3‐3 and discussed in the paragraph preceding the table.
One groundwater well (ID# 93043955545) is located adjacent to the farm buildings and supports farm
operations (ANRC 2015c). The well was completed in 2013. It was drilled to a total depth of 325 feet
below ground surface (bgs), and the static water level in the well was 138 feet bgs. The well yields 30
gallons per minute. The upper three formations were water bearing (ANRC 2015c). According to the
state Water Well Construction Commission, there are five other water wells located within ½ mile of the
C&H Hog Farms and application fields. These wells have all been drilled since 1997. The wells
(#930357355418, #920407355339, #930517355424, #930355365453, and #930407355335) were drilled
to depths ranging from 205 feet to 1,035 feet bgs with static water levels ranging from 65 feet to 310
feet below bgs. The wells yield from 8 to 100 gallons per minute (ANRC 2015d). The water well yielding
100 gallons per minute with a static water level of 65 feet bgs is located approximately 2 miles south
(upstream) of the C&H Hog Farms.
3.2.2 Impacts from Alternative A: No Action Alternative
Direct and Indirect Impacts
Surface Water
Nutrients, fecal bacteria, and organic matter are the primary constituents of animal waste that can
impact surface water. Nitrogen and P are the principal nutrients of concern.
Nitrogen is found in soils, water, and air and is part of all living organisms. Nitrogen is converted
between its various chemical forms through the nitrogen cycle. The conversion process is usually the
result of bacterial processes. In the environment, N is present in the organic nitrogen (N‐org),
ammonium (NH4), nitrite (NO2), nitrate (NO3) as well as other forms. In water quality analyses, total N
includes N‐org, total ammonia (NH3 + NH4), NO2, and NO3. The nitrite form of N is a transitory phase and
very little is normally detected in soil or most natural waters. Nitrogen is essential for plants, but
elementary N cannot be taken up directly. Nitrogen must first be bound and converted. During the
nitrification process, which is carried out by bacteria, ammonia and ammonium are converted to NO2
and NO3. Nitrates are readily mobile in soils (USDA 2012).
Final Environmental Assessment 3‐14
Phosphorus is also part of all living organisms and is required for plant growth. Organic P is the principal
form found in the wastes of most animals. Soluble P is the form used by all plants and is also subject to
leaching. Attached P includes those compounds that are formed when negative charged forms of
dissolved P become attached to cations, such as iron, aluminum, and calcium. Attached P includes labile
(or loosely bound) and fixed (or tightly adsorbed) forms on or within individual soil particles. Loosely
bound P remains in equilibrium with soluble P. Therefore, when the concentration of soluble P is
reduced (removed by plants) some of the labile P is converted to a soluble form. Over time, if organic P
is applied at rates that exceed the uptake rate of plants, P levels will accumulate. This results in
increased concentrations of both soluble and labile P, which can either leach downward to a zone that
has more attachment sites and then be converted to labile or fixed P or it can be transported off the
land in surface runoff (USDA 2012).
The EPA has identified eutrophication as the main cause of impaired surface water quality (EPA 1996).
Together N and P support the growth of algae and aquatic plants, which provide food and habitat for
fish, shellfish, and other aquatic organisms. Excess nutrients can promote excessive algae growth. As the
algae die and decompose, high levels of organic matter can deplete dissolved oxygen concentrations,
reduce transparency, and change the biotic community composition. Eutrophication can also increase
the incidence of harmful algal blooms, which may endanger human health through the production of
toxins that can contaminate drinking water sources (EPA 2015b).
Human waterborne diseases often result from exposure to water that is contaminated with the feces of
warm‐blooded animals, including humans. E. coli is a bacterial species commonly found in the feces of
humans and warm‐blooded animals. Most varieties of E. coli are harmless, but certain strains can cause
serious human illness. Other bacteria, viruses, and organisms may be present in fecal sources that can
also cause illness. Most fecal pathogens from human and animal waste usually die very quickly. Two to 3
months is sufficient in most cases to reduce pathogens to negligible numbers once they have been
excreted or land‐applied in animal wastes (Mubiru et al. 2000)
A comprehensive NMP plan was prepared and approved for the operation of C&H Hog Farms. The site‐
specific plan calculated a nutrient budget for N and P that considered all potential sources of nutrients
and the estimated crop yield. A field‐specific assessment was conducted to designate the form, source,
amount, timing, and method of application of manure on each field in order to minimize the potential
for any discharge to surface waters. Testing of both soil and manure prior to field application is required,
so the application rates can be adjusted to levels of nutrients that can be completely taken up by plants
and utilized for growth. The land application rates are based on the Arkansas Phosphorus Index (P‐
Index), which takes into consideration the concentration of P in the soil and waste. The soil P
concentration is only one of the factors taken into consideration when evaluating runoff potential.
Other factors include soil erosion, soil runoff, flooding, application method and timing, and best
management practices are also included in the P‐Index calculation for a site. The P‐Index, as a risk‐based
calculator, takes a worst‐case scenario approach of assuming that no P is lost and all is applied. All land
application areas receive application at rates consistent with infiltration capabilities of the native soil
such that there is no runoff to surrounding areas. Buffer strips (100 feet) are maintained between fields
where waste is applied and streams to prevent waste runoff into surrounding areas. Wastes/wastewater
are not applied to land classified as highly erodible, saturated, or frozen ground, or during rainfall events
or when it is likely to rain.
Final Environmental Assessment 3‐15
The ADEQ General Permit imposes a rigorous series of recordkeeping and inspection requirements for
CAFOs like the C&H Hog Farms operation. C&H Hog Farms is operating in compliance with the ADEQ
General Permit. It is possible that over time a P imbalance in one or more of the fields could occur. A P
imbalance is a condition where soil P levels are greater than the output in farm production. The purpose
of the NMP is to avoid P imbalance and to apply fertilizer at rates that minimizes P runoff. In this
situation, there is the potential that excess P could be mobilized off‐site during precipitation events.
Some management options to address the potential for a P imbalance could include:
Feed additives to increase nutrient utilization by animals
Changes in land application techniques to redistribute P through the soil
Manure amendments to reduce P
Soil amendments
Resting fields for greater periods since the farm has 630.7 acres of pasture/cropland permitted
to apply wastes and only an estimated 251 acres is needed based on the amount of wastes
being produced
Cover crops/residues
Off‐site transport of wastes
In April 2014, EPA Region 6 Compliance Assurance and Enforcement Division made an unannounced
inspection. The inspection included review of the physical site conditions, records required by the
NPDES General Permit, and soil and water sampling. Waste holding ponds were found to be in good
condition, with turf reinforcement mats installed on the inside of the holding ponds to establish
vegetative cover and control erosion. Water samples were collected from various streams up‐ and
down‐gradient of the facility. Soil samples were taken from all currently approved land applications
sites. No areas of concern were identified and it was noted that recordkeeping was well managed and
available on‐site (EPA 2014).
Since C&H Hog Farms and the fields where wastes are applied are located along a waterway, it is
reasonable to assume that there is localized recharge and discharge of surface and groundwater in the
area. If the waste ponds were leaking, or nutrients or bacteria applied to fields were leaching into upper
alluvial groundwater, any measurable contribution of those pollutants would be realized at the
downstream water quality monitoring station or the field monitoring stations.
The concentration of dissolved P, total P, nitrate‐N, total N, E. coli, and total coliform measured in Big
Creek above (upstream) and below (downstream) C&H Hog Farms from the beginning of the BCRET
study (September 12, 2013) through June 1, 2015 are presented graphically in Figures 3‐2 through 3‐7.
The figures show variations in concentration over time and the difference between upstream and
downstream concentrations for the same sampling date. These measurements were taken during base
flow (normal flow) and storm flow following precipitation events or snowmelt. The measurements have
been more routinely taken after installation of samplers at the USGS gaging station was completed in
March 2014.
Figures 3‐2 and 3‐3 show the difference between the upstream and the downstream concentrations of
dissolved P and total P, respectively. As in all the figures, the x‐axis is time from the beginning of BRCET
water quality sampling (September 2013 to June 1, 2015). The y‐axis is the concentration of the sampled
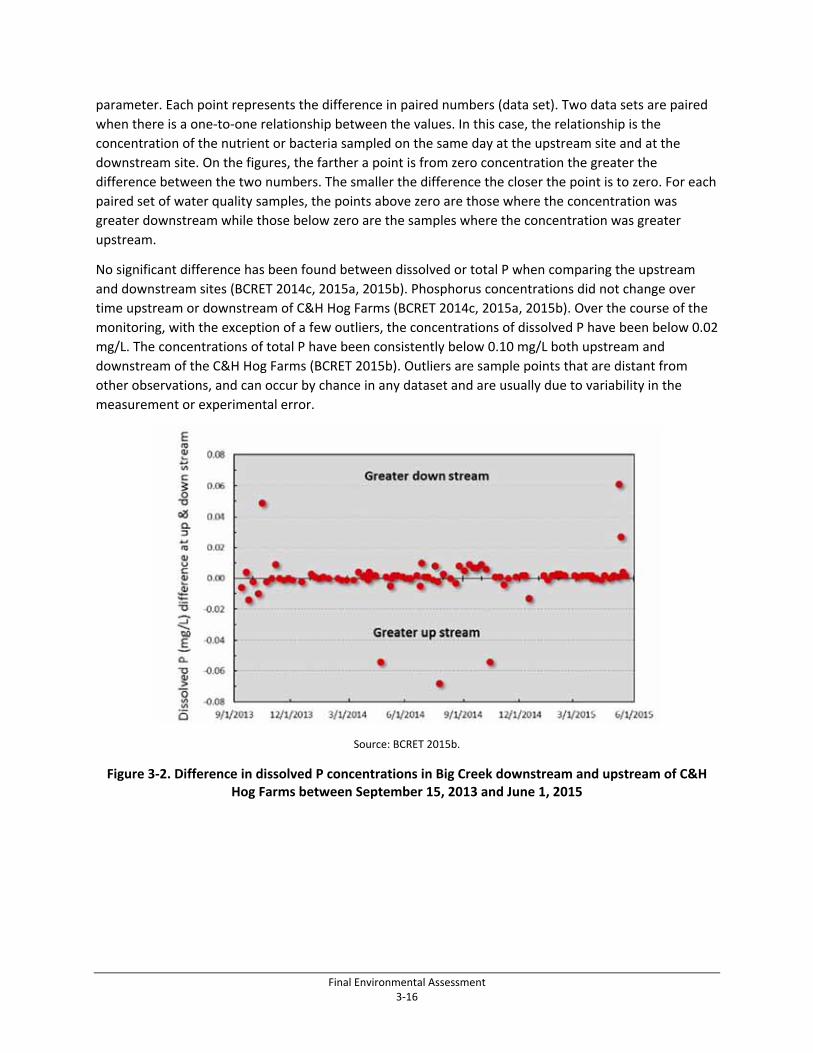
Final Environmental Assessment 3‐16
parameter. Each point represents the difference in paired numbers (data set). Two data sets are paired
when there is a one‐to‐one relationship between the values. In this case, the relationship is the
concentration of the nutrient or bacteria sampled on the same day at the upstream site and at the
downstream site. On the figures, the farther a point is from zero concentration the greater the
difference between the two numbers. The smaller the difference the closer the point is to zero. For each
paired set of water quality samples, the points above zero are those where the concentration was
greater downstream while those below zero are the samples where the concentration was greater
upstream.
No significant difference has been found between dissolved or total P when comparing the upstream
and downstream sites (BCRET 2014c, 2015a, 2015b). Phosphorus concentrations did not change over
time upstream or downstream of C&H Hog Farms (BCRET 2014c, 2015a, 2015b). Over the course of the
monitoring, with the exception of a few outliers, the concentrations of dissolved P have been below 0.02
mg/L. The concentrations of total P have been consistently below 0.10 mg/L both upstream and
downstream of the C&H Hog Farms (BCRET 2015b). Outliers are sample points that are distant from
other observations, and can occur by chance in any dataset and are usually due to variability in the
measurement or experimental error.
Source: BCRET 2015b.
Figure 3‐2. Difference in dissolved P concentrations in Big Creek downstream and upstream of C&H Hog Farms between September 15, 2013 and June 1, 2015
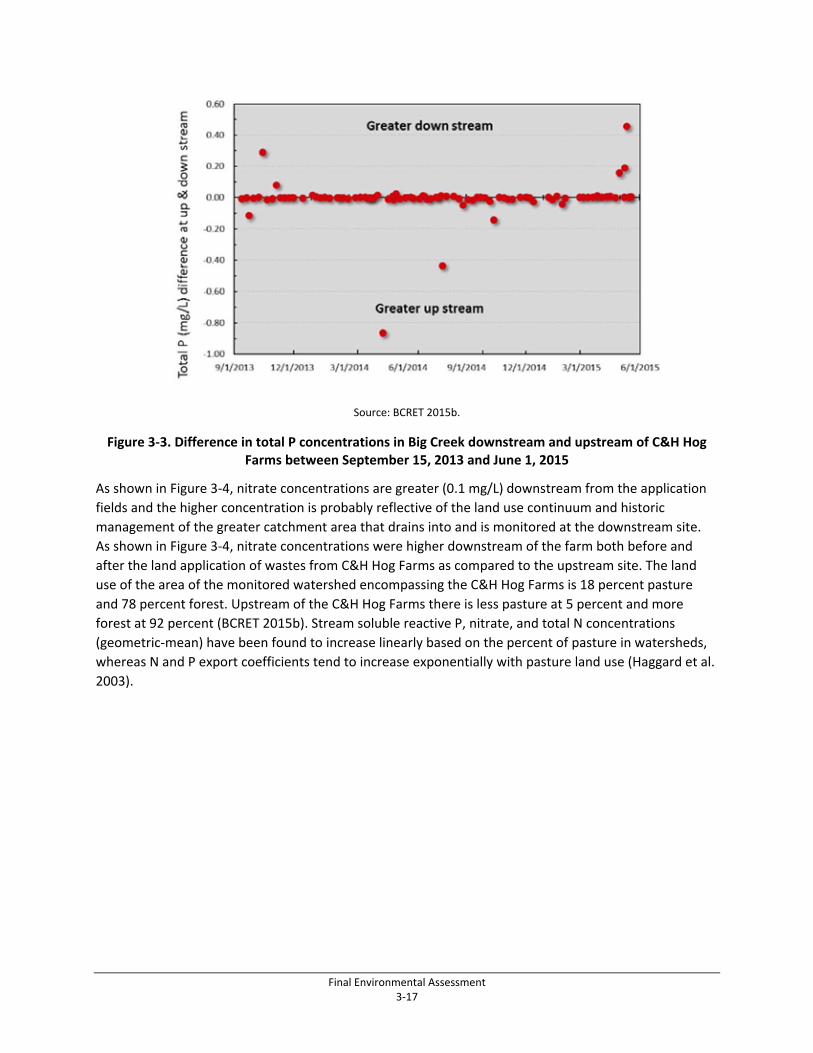
Final Environmental Assessment 3‐17
Source: BCRET 2015b.
Figure 3‐3. Difference in total P concentrations in Big Creek downstream and upstream of C&H Hog Farms between September 15, 2013 and June 1, 2015
As shown in Figure 3‐4, nitrate concentrations are greater (0.1 mg/L) downstream from the application
fields and the higher concentration is probably reflective of the land use continuum and historic
management of the greater catchment area that drains into and is monitored at the downstream site.
As shown in Figure 3‐4, nitrate concentrations were higher downstream of the farm both before and
after the land application of wastes from C&H Hog Farms as compared to the upstream site. The land
use of the area of the monitored watershed encompassing the C&H Hog Farms is 18 percent pasture
and 78 percent forest. Upstream of the C&H Hog Farms there is less pasture at 5 percent and more
forest at 92 percent (BCRET 2015b). Stream soluble reactive P, nitrate, and total N concentrations
(geometric‐mean) have been found to increase linearly based on the percent of pasture in watersheds,
whereas N and P export coefficients tend to increase exponentially with pasture land use (Haggard et al.
2003).
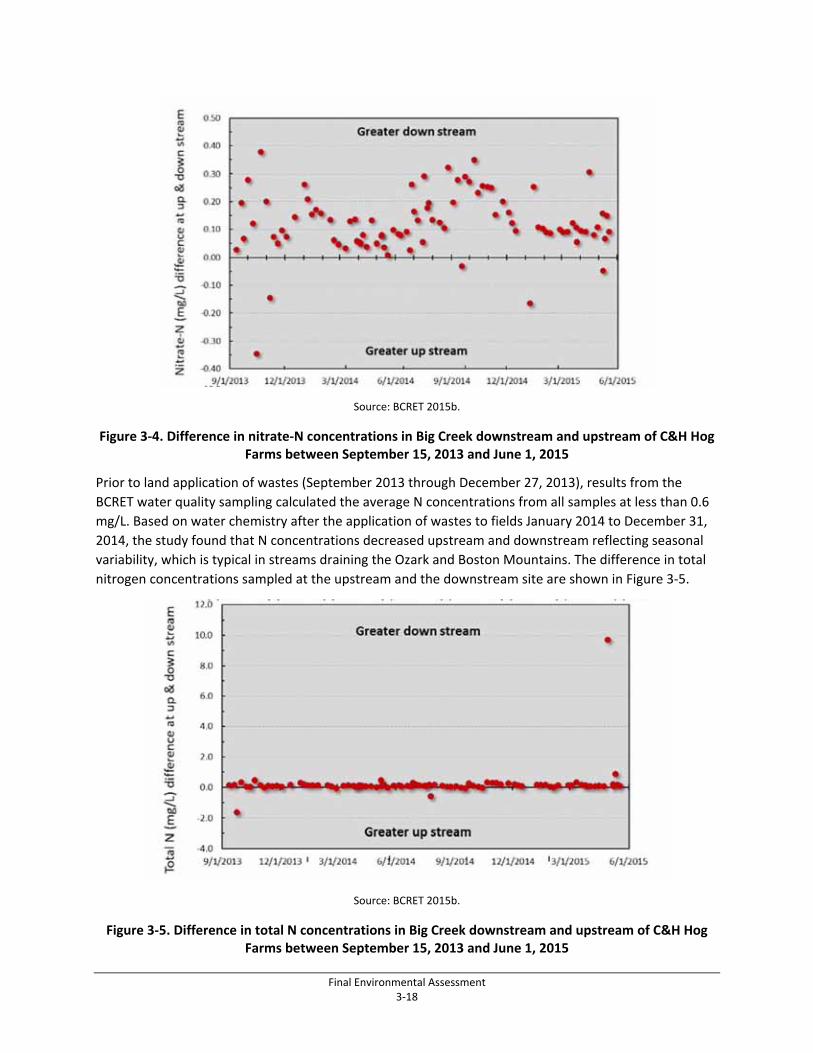
Final Environmental Assessment 3‐18
Source: BCRET 2015b.
Figure 3‐4. Difference in nitrate‐N concentrations in Big Creek downstream and upstream of C&H Hog Farms between September 15, 2013 and June 1, 2015
Prior to land application of wastes (September 2013 through December 27, 2013), results from the
BCRET water quality sampling calculated the average N concentrations from all samples at less than 0.6
mg/L. Based on water chemistry after the application of wastes to fields January 2014 to December 31,
2014, the study found that N concentrations decreased upstream and downstream reflecting seasonal
variability, which is typical in streams draining the Ozark and Boston Mountains. The difference in total
nitrogen concentrations sampled at the upstream and the downstream site are shown in Figure 3‐5.
Source: BCRET 2015b.
Figure 3‐5. Difference in total N concentrations in Big Creek downstream and upstream of C&H Hog Farms between September 15, 2013 and June 1, 2015
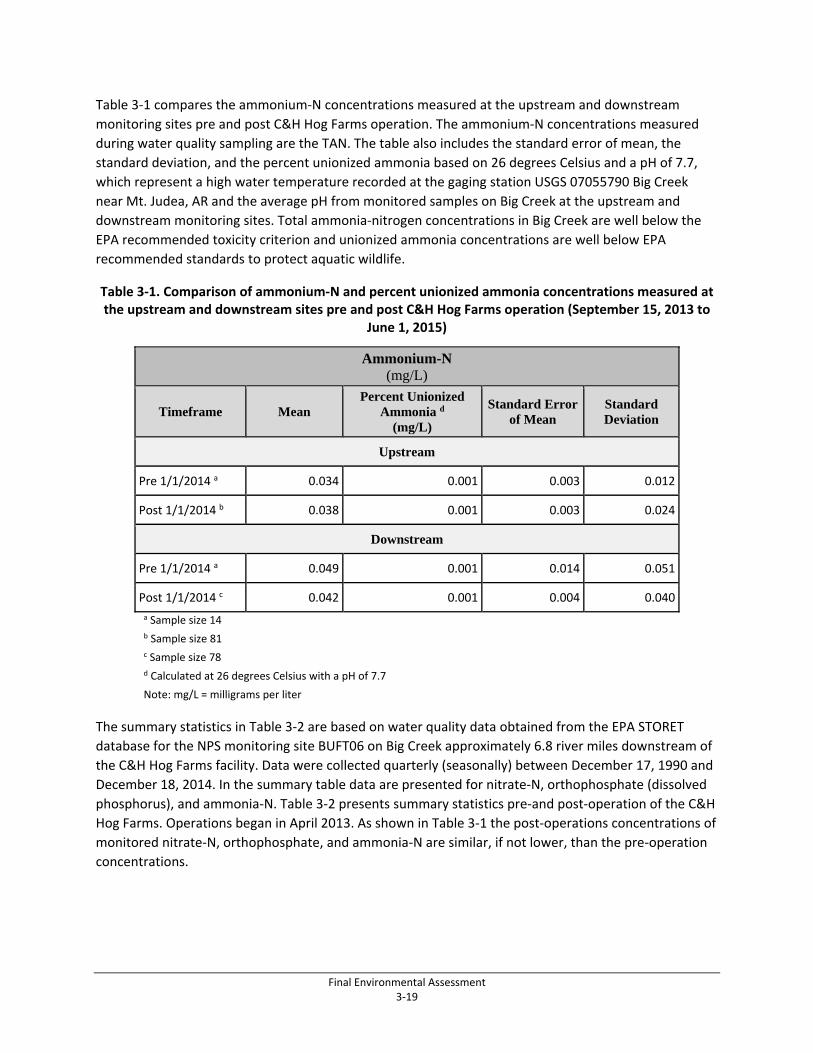
Final Environmental Assessment 3‐19
Table 3‐1 compares the ammonium‐N concentrations measured at the upstream and downstream
monitoring sites pre and post C&H Hog Farms operation. The ammonium‐N concentrations measured
during water quality sampling are the TAN. The table also includes the standard error of mean, the
standard deviation, and the percent unionized ammonia based on 26 degrees Celsius and a pH of 7.7,
which represent a high water temperature recorded at the gaging station USGS 07055790 Big Creek
near Mt. Judea, AR and the average pH from monitored samples on Big Creek at the upstream and
downstream monitoring sites. Total ammonia‐nitrogen concentrations in Big Creek are well below the
EPA recommended toxicity criterion and unionized ammonia concentrations are well below EPA
recommended standards to protect aquatic wildlife.
Table 3‐1. Comparison of ammonium‐N and percent unionized ammonia concentrations measured at the upstream and downstream sites pre and post C&H Hog Farms operation (September 15, 2013 to
June 1, 2015)
Ammonium-N (mg/L)
Timeframe Mean Percent Unionized
Ammonia d (mg/L)
Standard Error of Mean
Standard Deviation
Upstream
Pre 1/1/2014 a 0.034 0.001 0.003 0.012
Post 1/1/2014 b 0.038 0.001 0.003 0.024
Downstream
Pre 1/1/2014 a 0.049 0.001 0.014 0.051
Post 1/1/2014 c 0.042 0.001 0.004 0.040
a Sample size 14 b Sample size 81 c Sample size 78 d Calculated at 26 degrees Celsius with a pH of 7.7
Note: mg/L = milligrams per liter
The summary statistics in Table 3‐2 are based on water quality data obtained from the EPA STORET
database for the NPS monitoring site BUFT06 on Big Creek approximately 6.8 river miles downstream of
the C&H Hog Farms facility. Data were collected quarterly (seasonally) between December 17, 1990 and
December 18, 2014. In the summary table data are presented for nitrate‐N, orthophosphate (dissolved
phosphorus), and ammonia‐N. Table 3‐2 presents summary statistics pre‐and post‐operation of the C&H
Hog Farms. Operations began in April 2013. As shown in Table 3‐1 the post‐operations concentrations of
monitored nitrate‐N, orthophosphate, and ammonia‐N are similar, if not lower, than the pre‐operation
concentrations.
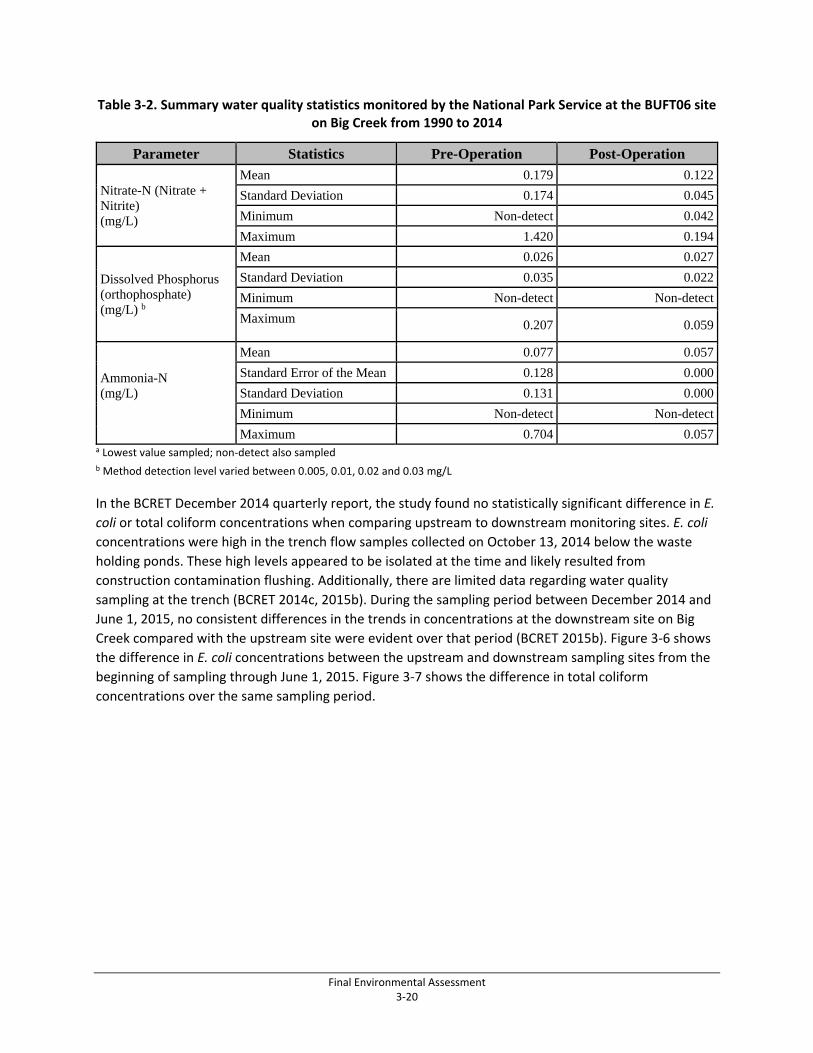
Final Environmental Assessment 3‐20
Table 3‐2. Summary water quality statistics monitored by the National Park Service at the BUFT06 site on Big Creek from 1990 to 2014
Parameter Statistics Pre-Operation Post-Operation
Nitrate-N (Nitrate + Nitrite) (mg/L)
Mean 0.179 0.122
Standard Deviation 0.174 0.045
Minimum Non-detect 0.042
Maximum 1.420 0.194
Dissolved Phosphorus (orthophosphate) (mg/L) b
Mean 0.026 0.027
Standard Deviation 0.035 0.022
Minimum Non-detect Non-detect
Maximum 0.207 0.059
Ammonia-N (mg/L)
Mean 0.077 0.057
Standard Error of the Mean 0.128 0.000
Standard Deviation 0.131 0.000
Minimum Non-detect Non-detect
Maximum 0.704 0.057a Lowest value sampled; non‐detect also sampled b Method detection level varied between 0.005, 0.01, 0.02 and 0.03 mg/L
In the BCRET December 2014 quarterly report, the study found no statistically significant difference in E.
coli or total coliform concentrations when comparing upstream to downstream monitoring sites. E. coli
concentrations were high in the trench flow samples collected on October 13, 2014 below the waste
holding ponds. These high levels appeared to be isolated at the time and likely resulted from
construction contamination flushing. Additionally, there are limited data regarding water quality
sampling at the trench (BCRET 2014c, 2015b). During the sampling period between December 2014 and
June 1, 2015, no consistent differences in the trends in concentrations at the downstream site on Big
Creek compared with the upstream site were evident over that period (BCRET 2015b). Figure 3‐6 shows
the difference in E. coli concentrations between the upstream and downstream sampling sites from the
beginning of sampling through June 1, 2015. Figure 3‐7 shows the difference in total coliform
concentrations over the same sampling period.
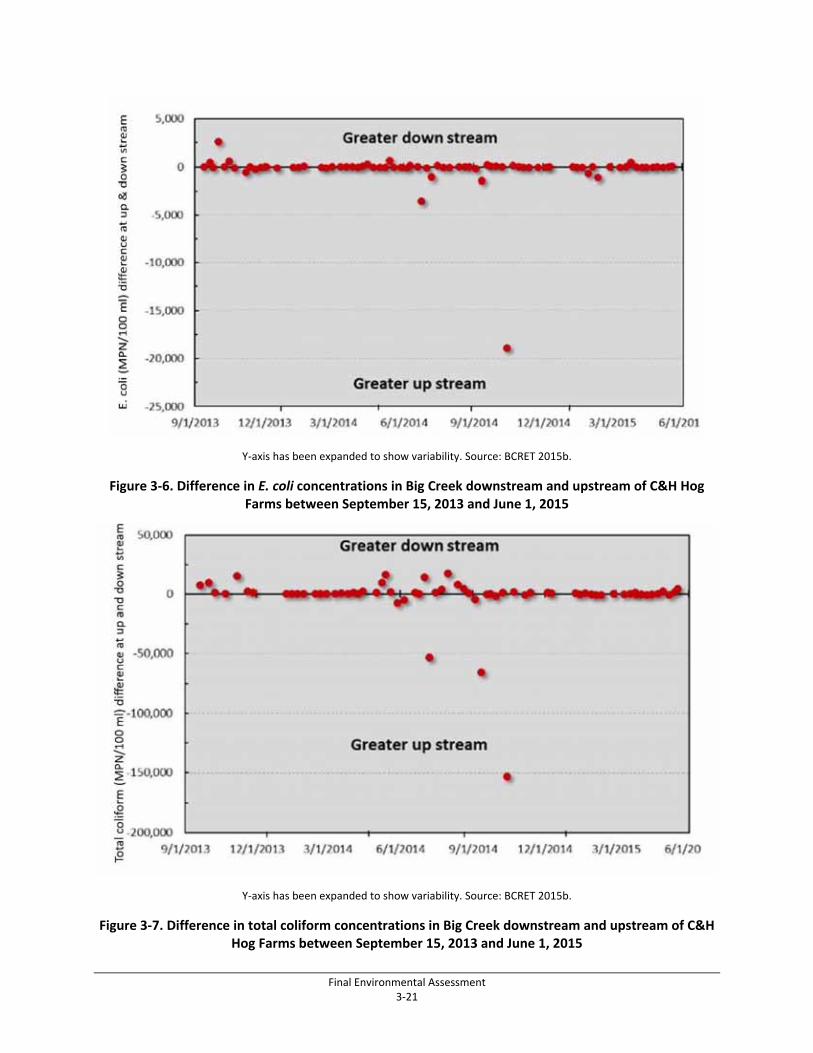
Final Environmental Assessment 3‐21
Y‐axis has been expanded to show variability. Source: BCRET 2015b.
Figure 3‐6. Difference in E. coli concentrations in Big Creek downstream and upstream of C&H Hog Farms between September 15, 2013 and June 1, 2015
Y‐axis has been expanded to show variability. Source: BCRET 2015b.
Figure 3‐7. Difference in total coliform concentrations in Big Creek downstream and upstream of C&H Hog Farms between September 15, 2013 and June 1, 2015
Final Environmental Assessment 3‐22
The standard for primary contact (May 1 through September 30) of E. coli from individual samples is 410
(col/100 mL). Based on BCRET water quality monitoring through June 30, 2015, during the primary
contact season (May 1 to September 30) in 2014 there were six exceedances at the upstream
monitoring site and seven at the downstream site of the 410 MPN/100 mL single sample limit. Five of
the exceedances upstream and six downstream were sampled during storm events. (BCRET 2015b).
There are no observable trends related to the timing of slurry applications and nutrient or bacterial
concentrations recorded during water quality sampling (BCRET 2014c, pers. comm. A. N. Sharpley 2015).
During the April 1 to June 30, 2015 (2nd quarter 2015) monitoring period, there were no consistent
differences in the trends in concentrations at the downstream site on Big Creek compared with the
upstream site (BCRET 2015b).
There are no data or other evidence to indicate that the operation of C&H Hog Farms is adversely
affecting surface water quality. While it is recognized that the available data are somewhat limited,
these data are considered sufficient to conclude that if the farm’s operation over the last 18 months was
contributing measureable concentrations of nutrients or bacteria then it would be apparent in the water
quality monitoring data collected to date, or be observed in emerging trends.
Since the application of manure to up to 630 acres of fields utilized by C&H Hog Farms is more closely
managed under the NPDES General Permit stipulations, there is the potential for improved water quality
conditions as historically those fields have been fertilized at rates not governed by the terms of an NMP,
which account for season, soil and manure chemistry, site characteristics, land use and other factors,
and without other protective requirements of the NPDES General Permit including buffers near
waterways and other BMPs.
The ADEQ’s CAFO NPDES General Permit prohibits, with a narrow exception, all discharge of manure or
process wastewater from the production facilities into the waters. Consistent with the EPA’s CAFO
regulations, the General Permit makes an exception for discharges resulting from an overflow caused by
precipitation, so long as the facility has been designed and constructed with the capacity to hold all
effluent generated by the facility as well as the water generated by a once‐every 25‐year, 24‐hour
rainfall event. As designed, the C&H facility has approximately 50 percent more liquid waste holding
capacity then ADEQ requires for a facility of this size. The ponds have been engineered and constructed
to avoid a breach even at maximum capacity.
Because the ponds are designed to divert stormwater from entering the ponds, during a rainfall event
the amount of water entering the ponds would be limited to what is falling directly over the ponds. This
further minimizes the potential for the ponds to overflow. The ponds have much greater capacity than a
25‐year, 24 hour flood event (6.96 inches). The amount of rainfall in a 100‐year, 24‐hour storm event
would be approximately 8.48 inches (NOAA 2015). The 1 foot of freeboard above the 25‐year, 24‐hour
storage level has a volume of greater than 425,000 gallons. Based on the total square footage at the top
of the ponds, 1 inch of rainfall would equate to approximately 35,000 gallons. Therefore, including the
freeboard, the ponds have sufficient storage to hold the volume generated by a 100‐year, 24‐hour storm
event.
Given the implementation of BMPs and the engineered design and over‐capacity of the holding ponds, it
is highly unlikely that an overflow from the ponds would occur even in a severe flood event or a series of
Final Environmental Assessment 3‐23
heavy rainfall events. There is no potential risk from Big Creek flooding the ponds because of the
distance to the creek and the ponds are elevated well above the creek.
Any discharge during a rainfall event would be restricted to an overflow minimizing the volume of
discharge; the entire contents of the ponds would not be discharged. An overflow during a significant
rainfall event could have short‐term impacts to surface water quality since nutrients and bacteria
concentrations would dilute or be available for biological uptake during downstream transport through
the system. However, stream volumes and velocities would be greater during a severe weather event
and nutrients and sediment would dilute and disperse at rates much greater than base flow and would
move rapidly through the system.
It is also possible there could be an accidental discharge of waste, which could reach surface waters that
may result in short‐term impacts to surface water quality. The honey tankers used to transport the
fertilizer from the ponds to the application fields carry up to 3,000 gallons. Depending on the location
and amount, an accidental discharge, if one were to occur, may not reach surface waters. Surface water
quality could be impacted on a short‐term basis, depending on the amount and location of an accidental
discharge, but based on the potential discharge volume (3,000 gallons), any changes to nutrient
concentrations or sediment would be expected to dilute or be biologically taken up with increasing
distance downstream of the source. These types of discharges would not result in long‐term (chronic) or
significant impacts to surface water quality.
In summary, C&H Hog Farms operates in compliance with its approved NPDES General Permit. Under
the terms and conditions of the permit, a site‐specific comprehensive NMP plan was prepared. The NMP
is a flexible management tool designed to avoid impacts to surface water and requires testing of both
soil and manure prior to field application so that application rates can be adjusted to the levels where
plant uptake completes the cycle. All land application areas receive application at rates consistent with
infiltration capabilities of the native soil such that there is a low risk of runoff to surrounding areas.
Numerous BMPs are implemented to protect surface water including buffer strips (100 feet) maintained
between fields where waste is applied and streams and no applications to land classified as highly
erodible, saturated, or frozen ground, or during rainfall events or when it is likely to rain. The application
of fertilizer to the waste application fields is managed under the NMP as opposed to the historical
management. The ponds were engineered to specifications to avoid rupture and minimize leakage. The
proposed modification that would line the waste holding ponds would further protect water quality
from increased nutrient and bacterial concentrations.
An intensive scientific study has been ongoing since September 2013 to determine if the C&H Hog Farms
operation is adversely affecting surface water quality. Water quality samples are taken weekly and
following storm events at eight locations on the farm, including three of the fields, nearby waterways,
and a spring. The monitoring sites include sites on Big Creek upstream and downstream of the
operation. There are no observable trends related to the timing of slurry applications and nutrient or
bacterial concentrations recorded during water quality sampling (BCRET 2014c, pers. comm. A. N.
Sharpley 2015). There have been no consistent or significant differences in the concentrations of
nutrients or bacteria between the upstream and downstream sites. There have been no measurable
increases in the concentrations of nutrients or bacteria downstream of the operation (BCRET 2014c,
2015b). National Park Service data from the BUFT06 site on Big Creek do not show any increases in the
nitrate‐N, dissolved P, or ammonia‐N.
Final Environmental Assessment 3‐24
The holding ponds are designed to avoid a breach. It is highly unlikely there would be an overflow of
waste from the holding ponds in a significant rainfall given the ponds over‐capacity. There is the
potential for an accidental spill of waste. There are extensive safeguards and BMPs to minimize the risk
of discharges off‐site and into waterways. During its operation, C&H Hog Farms has not had an
accidental discharge. Given the volume, and depending on location and distance to surface water,
accidental discharges would not result in long‐term (chronic) or significant impacts to surface water
quality.
Wetlands
Setbacks from wetlands or farmed wetlands were identified in the NPDES General Permit application
approved in 2012. These setbacks were implemented to avoid impacts to wetlands from land
application of nutrients. Testing of both soil and manure prior to field application is required, so the
application rates can be adjusted to ensure that all nutrients are utilized by plant growth. Therefore,
runoff of nutrients into wetland areas is unlikely. With the implementation of the NPDES General Permit
stipulations, no direct or indirect impacts to wetlands are anticipated.
Groundwater
The waste storage ponds are designed per the USDA‐NRCS National Engineering Handbook Part 651
Agricultural Waste Management Field Handbook in accordance with the Arkansas Pollution Control and
Ecology Commission Regulation 6.202(B) (ADEQ 2013b). The NPDES General Permit limits potential
seepage from the waste holding ponds to 5,000 gallons/acre/day. At pond installation, liners were
tested and met with specifications of ASTM D‐698, Standard Test Methods for Laboratory Compaction
Characteristics of Soil, to ensure that soil used met engineering specifications for impermeability. While
the General Permit has a limit for potential seepage that does not necessarily mean the C&H Hog Farms
waste ponds are seeping fluids at that rate or at any rate. To date there are no data available to
determine whether the ponds are leaking at a measurable rate. The pre‐construction geotechnical
investigations boring logs encountered no karst features in the area where the buildings or holding
ponds were constructed. Clays with variable and generally low chert or sand content beneath the ponds
as indicated in the geotechnical report (ADEQ 2012a) would suggest low hydraulic conductivity and low
propensity for vadose zone leaching of agricultural contaminants. No water bearing soils or formations
were encountered during the geotechnical investigation. There is no evident conduit for surface water
to reach groundwater in the area of the ponds.
A manure slurry chemical analysis was conducted in 2013 on the C&H Hog Farms holding ponds and the
results for monitored electrical conductivity, total N, and total P are listed in Table 3‐3 (BCRET 2013).
Water quality monitoring has been ongoing in the trench placed below the ponds, which was designed
to intercept any subsurface flow of seepage moving along a restricting or less permeable layer. This type
of trench collection system has been widely used to monitor shallow subsurface flows in karst systems
and in the past to monitor seepage from a swine lagoon (BCRET 2014c). The mean concentrations of
total N and P, and the electrical conductivity from water sampled from the trench are also shown in
Table 3‐3 (BCRET 2015b). Any seepage from the ponds would be expected to have similar
concentrations of total N and P, and electrical conductivity properties. However, the water quality
sampled in the trench is significantly different from the slurry composition, indicating that no
measurable seepage from the pond is occurring and that no significant adverse impacts to groundwater
quality are occurring. Given its characteristics, the water monitored in the trench is groundwater.
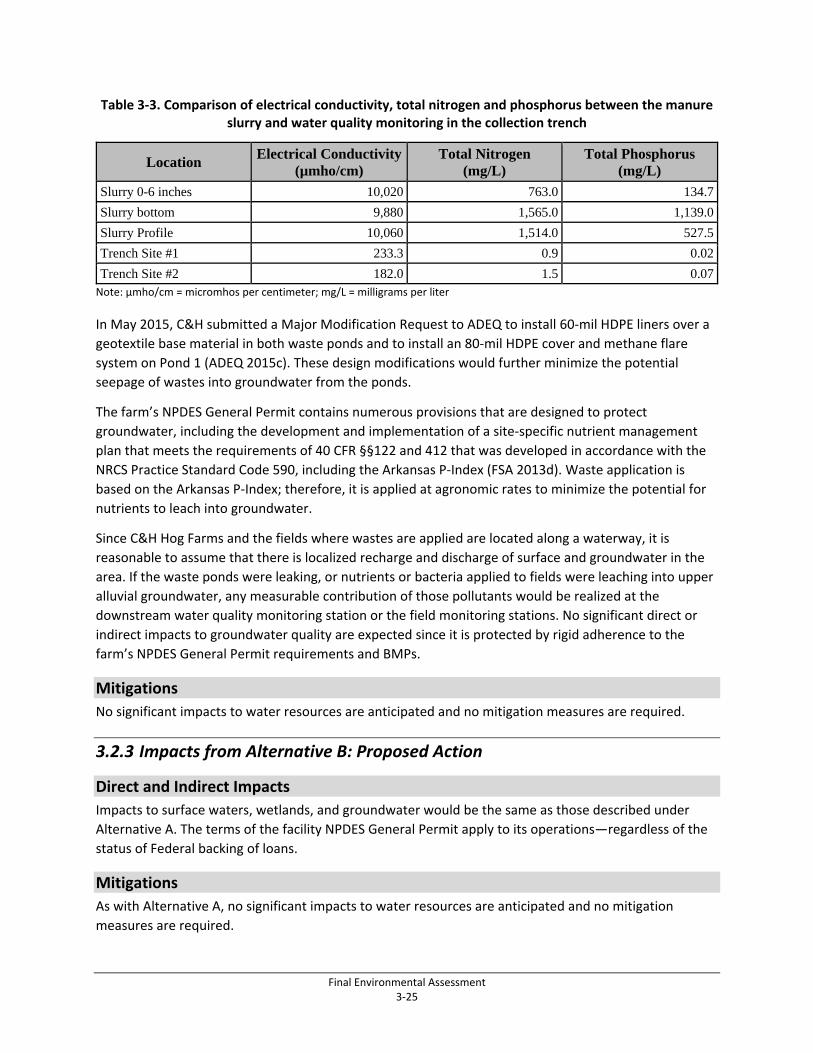
Final Environmental Assessment 3‐25
Table 3‐3. Comparison of electrical conductivity, total nitrogen and phosphorus between the manure slurry and water quality monitoring in the collection trench
Location Electrical Conductivity
(µmho/cm) Total Nitrogen
(mg/L) Total Phosphorus
(mg/L)
Slurry 0-6 inches 10,020 763.0 134.7
Slurry bottom 9,880 1,565.0 1,139.0
Slurry Profile 10,060 1,514.0 527.5
Trench Site #1 233.3 0.9 0.02
Trench Site #2 182.0 1.5 0.07Note: µmho/cm = micromhos per centimeter; mg/L = milligrams per liter
In May 2015, C&H submitted a Major Modification Request to ADEQ to install 60‐mil HDPE liners over a
geotextile base material in both waste ponds and to install an 80‐mil HDPE cover and methane flare
system on Pond 1 (ADEQ 2015c). These design modifications would further minimize the potential
seepage of wastes into groundwater from the ponds.
The farm’s NPDES General Permit contains numerous provisions that are designed to protect
groundwater, including the development and implementation of a site‐specific nutrient management
plan that meets the requirements of 40 CFR §§122 and 412 that was developed in accordance with the
NRCS Practice Standard Code 590, including the Arkansas P‐Index (FSA 2013d). Waste application is
based on the Arkansas P‐Index; therefore, it is applied at agronomic rates to minimize the potential for
nutrients to leach into groundwater.
Since C&H Hog Farms and the fields where wastes are applied are located along a waterway, it is
reasonable to assume that there is localized recharge and discharge of surface and groundwater in the
area. If the waste ponds were leaking, or nutrients or bacteria applied to fields were leaching into upper
alluvial groundwater, any measurable contribution of those pollutants would be realized at the
downstream water quality monitoring station or the field monitoring stations. No significant direct or
indirect impacts to groundwater quality are expected since it is protected by rigid adherence to the
farm’s NPDES General Permit requirements and BMPs.
Mitigations
No significant impacts to water resources are anticipated and no mitigation measures are required.
3.2.3 Impacts from Alternative B: Proposed Action
Direct and Indirect Impacts
Impacts to surface waters, wetlands, and groundwater would be the same as those described under
Alternative A. The terms of the facility NPDES General Permit apply to its operations—regardless of the
status of Federal backing of loans.
Mitigations
As with Alternative A, no significant impacts to water resources are anticipated and no mitigation
measures are required.
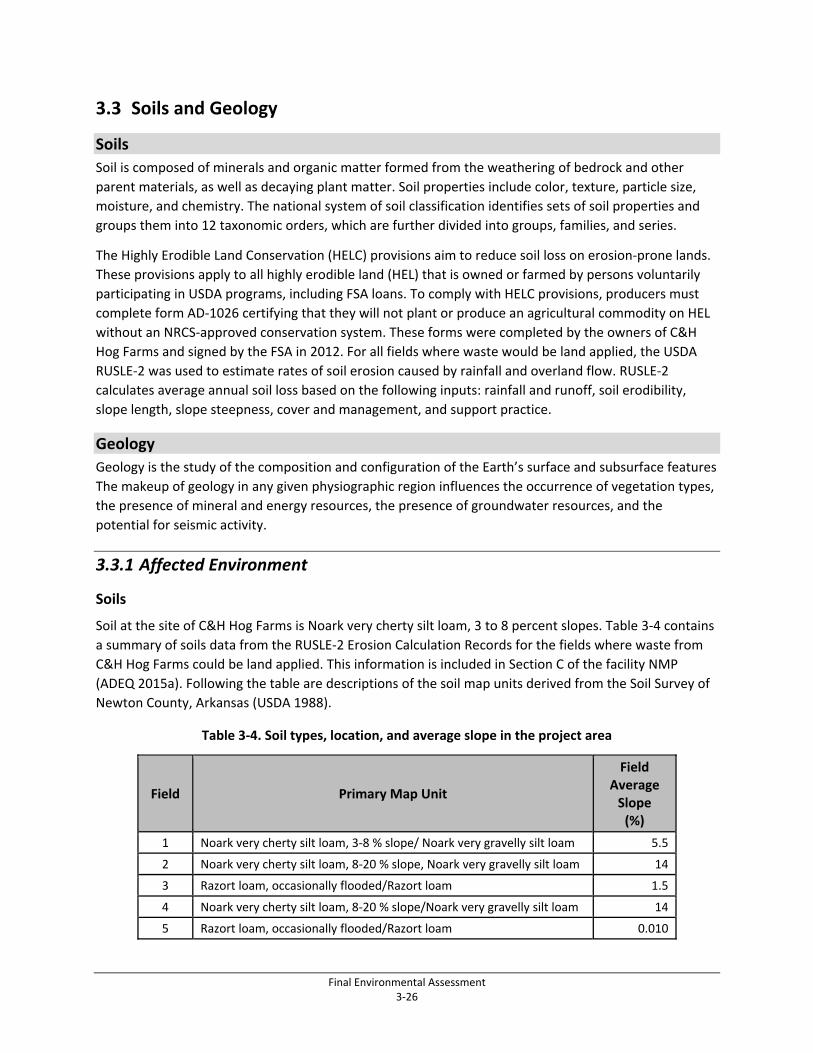
Final Environmental Assessment 3‐26
3.3 Soils and Geology
Soils
Soil is composed of minerals and organic matter formed from the weathering of bedrock and other
parent materials, as well as decaying plant matter. Soil properties include color, texture, particle size,
moisture, and chemistry. The national system of soil classification identifies sets of soil properties and
groups them into 12 taxonomic orders, which are further divided into groups, families, and series.
The Highly Erodible Land Conservation (HELC) provisions aim to reduce soil loss on erosion‐prone lands.
These provisions apply to all highly erodible land (HEL) that is owned or farmed by persons voluntarily
participating in USDA programs, including FSA loans. To comply with HELC provisions, producers must
complete form AD‐1026 certifying that they will not plant or produce an agricultural commodity on HEL
without an NRCS‐approved conservation system. These forms were completed by the owners of C&H
Hog Farms and signed by the FSA in 2012. For all fields where waste would be land applied, the USDA
RUSLE‐2 was used to estimate rates of soil erosion caused by rainfall and overland flow. RUSLE‐2
calculates average annual soil loss based on the following inputs: rainfall and runoff, soil erodibility,
slope length, slope steepness, cover and management, and support practice.
Geology
Geology is the study of the composition and configuration of the Earth’s surface and subsurface features
The makeup of geology in any given physiographic region influences the occurrence of vegetation types,
the presence of mineral and energy resources, the presence of groundwater resources, and the
potential for seismic activity.
3.3.1 Affected Environment
Soils
Soil at the site of C&H Hog Farms is Noark very cherty silt loam, 3 to 8 percent slopes. Table 3‐4 contains
a summary of soils data from the RUSLE‐2 Erosion Calculation Records for the fields where waste from
C&H Hog Farms could be land applied. This information is included in Section C of the facility NMP
(ADEQ 2015a). Following the table are descriptions of the soil map units derived from the Soil Survey of
Newton County, Arkansas (USDA 1988).
Table 3‐4. Soil types, location, and average slope in the project area
Field Primary Map Unit
Field Average Slope (%)
1 Noark very cherty silt loam, 3‐8 % slope/ Noark very gravelly silt loam 5.5
2 Noark very cherty silt loam, 8‐20 % slope, Noark very gravelly silt loam 14
3 Razort loam, occasionally flooded/Razort loam 1.5
4 Noark very cherty silt loam, 8‐20 % slope/Noark very gravelly silt loam 14
5 Razort loam, occasionally flooded/Razort loam 0.010
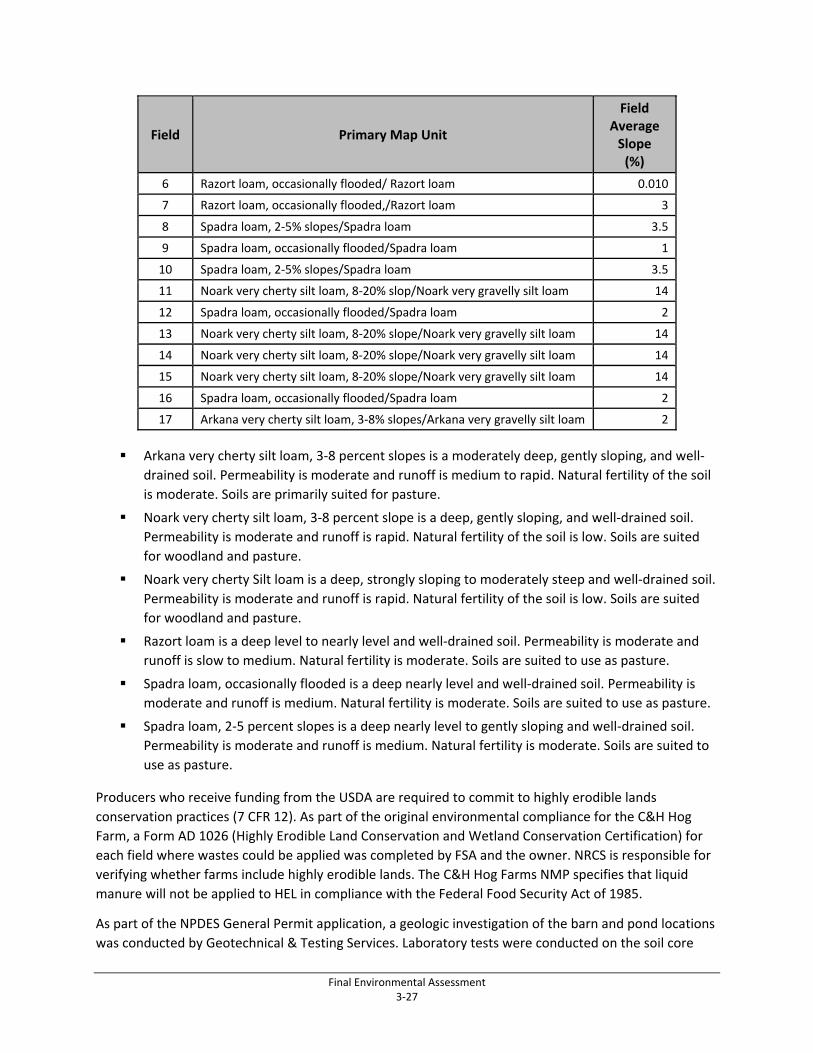
Final Environmental Assessment 3‐27
Field Primary Map Unit
Field Average Slope (%)
6 Razort loam, occasionally flooded/ Razort loam 0.010
7 Razort loam, occasionally flooded,/Razort loam 3
8 Spadra loam, 2‐5% slopes/Spadra loam 3.5
9 Spadra loam, occasionally flooded/Spadra loam 1
10 Spadra loam, 2‐5% slopes/Spadra loam 3.5
11 Noark very cherty silt loam, 8‐20% slop/Noark very gravelly silt loam 14
12 Spadra loam, occasionally flooded/Spadra loam 2
13 Noark very cherty silt loam, 8‐20% slope/Noark very gravelly silt loam 14
14 Noark very cherty silt loam, 8‐20% slope/Noark very gravelly silt loam 14
15 Noark very cherty silt loam, 8‐20% slope/Noark very gravelly silt loam 14
16 Spadra loam, occasionally flooded/Spadra loam 2
17 Arkana very cherty silt loam, 3‐8% slopes/Arkana very gravelly silt loam 2
Arkana very cherty silt loam, 3‐8 percent slopes is a moderately deep, gently sloping, and well‐
drained soil. Permeability is moderate and runoff is medium to rapid. Natural fertility of the soil
is moderate. Soils are primarily suited for pasture.
Noark very cherty silt loam, 3‐8 percent slope is a deep, gently sloping, and well‐drained soil.
Permeability is moderate and runoff is rapid. Natural fertility of the soil is low. Soils are suited
for woodland and pasture.
Noark very cherty Silt loam is a deep, strongly sloping to moderately steep and well‐drained soil.
Permeability is moderate and runoff is rapid. Natural fertility of the soil is low. Soils are suited
for woodland and pasture.
Razort loam is a deep level to nearly level and well‐drained soil. Permeability is moderate and
runoff is slow to medium. Natural fertility is moderate. Soils are suited to use as pasture.
Spadra loam, occasionally flooded is a deep nearly level and well‐drained soil. Permeability is
moderate and runoff is medium. Natural fertility is moderate. Soils are suited to use as pasture.
Spadra loam, 2‐5 percent slopes is a deep nearly level to gently sloping and well‐drained soil.
Permeability is moderate and runoff is medium. Natural fertility is moderate. Soils are suited to
use as pasture.
Producers who receive funding from the USDA are required to commit to highly erodible lands
conservation practices (7 CFR 12). As part of the original environmental compliance for the C&H Hog
Farm, a Form AD 1026 (Highly Erodible Land Conservation and Wetland Conservation Certification) for
each field where wastes could be applied was completed by FSA and the owner. NRCS is responsible for
verifying whether farms include highly erodible lands. The C&H Hog Farms NMP specifies that liquid
manure will not be applied to HEL in compliance with the Federal Food Security Act of 1985.
As part of the NPDES General Permit application, a geologic investigation of the barn and pond locations
was conducted by Geotechnical & Testing Services. Laboratory tests were conducted on the soil core
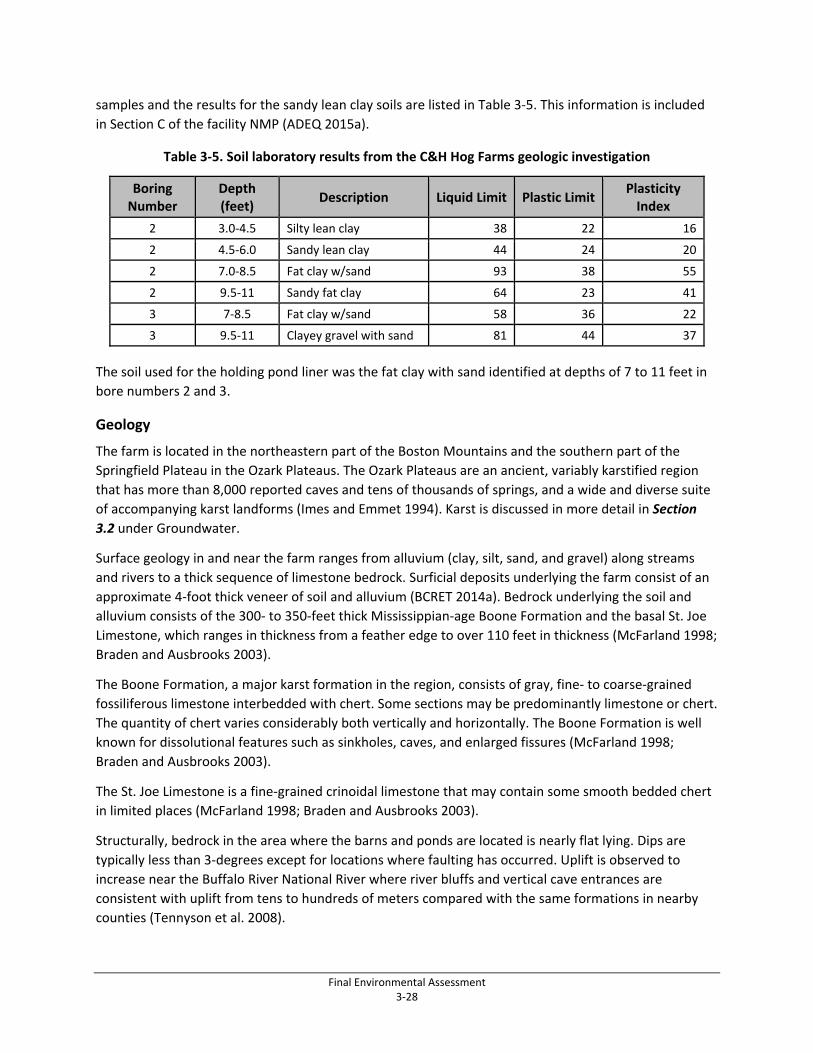
Final Environmental Assessment 3‐28
samples and the results for the sandy lean clay soils are listed in Table 3‐5. This information is included
in Section C of the facility NMP (ADEQ 2015a).
Table 3‐5. Soil laboratory results from the C&H Hog Farms geologic investigation
Boring Number
Depth (feet)
Description Liquid Limit Plastic Limit Plasticity Index
2 3.0‐4.5 Silty lean clay 38 22 16
2 4.5‐6.0 Sandy lean clay 44 24 20
2 7.0‐8.5 Fat clay w/sand 93 38 55
2 9.5‐11 Sandy fat clay 64 23 41
3 7‐8.5 Fat clay w/sand 58 36 22
3 9.5‐11 Clayey gravel with sand 81 44 37
The soil used for the holding pond liner was the fat clay with sand identified at depths of 7 to 11 feet in
bore numbers 2 and 3.
Geology
The farm is located in the northeastern part of the Boston Mountains and the southern part of the
Springfield Plateau in the Ozark Plateaus. The Ozark Plateaus are an ancient, variably karstified region
that has more than 8,000 reported caves and tens of thousands of springs, and a wide and diverse suite
of accompanying karst landforms (Imes and Emmet 1994). Karst is discussed in more detail in Section
3.2 under Groundwater.
Surface geology in and near the farm ranges from alluvium (clay, silt, sand, and gravel) along streams
and rivers to a thick sequence of limestone bedrock. Surficial deposits underlying the farm consist of an
approximate 4‐foot thick veneer of soil and alluvium (BCRET 2014a). Bedrock underlying the soil and
alluvium consists of the 300‐ to 350‐feet thick Mississippian‐age Boone Formation and the basal St. Joe
Limestone, which ranges in thickness from a feather edge to over 110 feet in thickness (McFarland 1998;
Braden and Ausbrooks 2003).
The Boone Formation, a major karst formation in the region, consists of gray, fine‐ to coarse‐grained
fossiliferous limestone interbedded with chert. Some sections may be predominantly limestone or chert.
The quantity of chert varies considerably both vertically and horizontally. The Boone Formation is well
known for dissolutional features such as sinkholes, caves, and enlarged fissures (McFarland 1998;
Braden and Ausbrooks 2003).
The St. Joe Limestone is a fine‐grained crinoidal limestone that may contain some smooth bedded chert
in limited places (McFarland 1998; Braden and Ausbrooks 2003).
Structurally, bedrock in the area where the barns and ponds are located is nearly flat lying. Dips are
typically less than 3‐degrees except for locations where faulting has occurred. Uplift is observed to
increase near the Buffalo River National River where river bluffs and vertical cave entrances are
consistent with uplift from tens to hundreds of meters compared with the same formations in nearby
counties (Tennyson et al. 2008).
Final Environmental Assessment 3‐29
3.3.2 Impacts from Alternative A: No Action Alternative
Direct and Indirect Impacts
Soils
Construction of the C&H Hog Farms facilities resulted in excavation and mixing of soils on the site. The
slopes of the holding ponds have been seeded and matted to reduce erosion in compliance with the
General Permit. The area around the barns has been planted with loblolly pine seedlings to reclaim lands
cleared to accommodate the facilities. This reclamation will stabilize soils and reduce runoff.
The fields where wastes from C&H Hog Farms could be land applied as fertilizer were actively managed
for forage production prior to their inclusion in the C&H Hog Farms NMP. Impacts from such
management include soil disturbance, mixing, and compaction.
Soils at C&H Hog Farms facilities and fields where wastes are land applied are protected by the terms of
the NPDES General Permit as outlined in the NMP, including operating requirements listed in Section
2.1.3. The C&H Hog Farms NMP specifies that liquid manure will not be applied to HEL in compliance
with the Federal Food Security Act of 1985. Therefore, no impacts to HEL would result from operations
of the C&H Hog Farm. Fields where wastes could be land applied as fertilizer were assessed using RUSLE‐
2 to ensure management practices would minimize soil loss to erosion and avoid the discharge of
nutrients or other contaminants.
Waste holding ponds were lined with 18 inches of compacted low permeability soil to meet technical
specifications for the site. These specifications were designed to ensure seepage does not exceed rates
set by ADEQ and minimize risk of soil contamination. The proposed lining of the waste holding ponds
would further protect soils from increased nutrient concentrations.
Geology
Application of wastes to fields would have no effects to geology. The geotechnical investigation did not
encounter karst features beneath the C&H Hog Farms facilities. There would be no direct and indirect
impacts to geology since disruption of underlying bedrock would not occur from farm operations.
Mitigations
No significant impacts to soils or geology are anticipated and no mitigation measures are required.
3.3.3 Impacts from Alternative B: Proposed Action
Direct and Indirect Impacts
The terms of C&H Hog Farms NPDES General Permit would apply to operations regardless of the source
of funding used to construct and operate the facility. Therefore, impacts to soils and geology are the
same as those described for Alternative A.
Mitigations
As with Alternative A, no significant impacts to soils or geology are anticipated and no mitigation
measures are required.
Final Environmental Assessment 3‐30
3.4 Threatened and Endangered Species Threatened and Endangered species are those species federally designated as threatened or
endangered under the ESA and their designated Critical Habitat, and species that are considered
candidates for being listed as threatened or endangered. Critical habitat is an area, defined by the
United States Fish and Wildlife Service (USFWS), that contains features essential to the conservation of a
threatened or endangered species and that may require special management and protection.
The ESA requires Federal agencies to ensure that the actions they authorize, fund, or carry out are not
likely to jeopardize the continued existence of any endangered or threatened species, or result in the
destruction or adverse modification of their critical habitat.
3.4.1 Affected Environment
On June 26, 2012, Farm Credit Services of Western Arkansas contacted the USFWS to initiate
consultation over the proposed C&H Hog Farms facility (reference # TA0629). On July 5, 2012, USFWS
advised Farm Credit Services that two federally listed species—the gray bat (Myotis grisescens) and the
Indiana bat (Myotis sodalis)—and one candidate for listing—the rabbitsfoot mussel (Quadrula cylindrical
cylindrical)—are known to occur in this region. On February 8, 2013, the USFWS responded again to the
2012 request to include the potential for snuffbox (Epioblasma triquetra) to occur in the region and the
proposed critical habitat designation for the Buffalo River.
In May 2015, requests for species occurrence records and other data or information were made to the
USFWS Arkansas Ecological Services Office and the NPS. An information request was submitted to the
Arkansas Natural Heritage Commission (ANHC), an agency of the Department of Arkansas Heritage to
obtain species occurrence data. The ANHC has no records of any federally listed or other special status
species of concern occurring on the C&H Hog Farms (ANHC No.: P‐CF..‐15‐031). The Arkansas Game and
Fish Commission was also contacted for information related to federally listed species occurrence
records within the area.
Currently, the USFWS Arkansas Ecological Services Office lists eight threatened and endangered species
with the potential to occur in Newton County. A current list of species was obtained from the USFWS
IPaC‐Information, Planning, and Conservation System (USFWS 2015). Table 3‐6 lists these species, their
conservation status, habitat associations, and their potential to occur in the project area.
Impacts to listed species from the C&H Hog Farms operations would be limited to the potential for
adverse changes to water quality from increased nutrients that could lead to eutrophication of aquatic
habitats. Several different nitrogenous compounds can be taken up directly by aquatic wildlife from
ambient water and at high concentrations can be toxic.
Of the eight listed species, four are bats, which are terrestrial species. All four of the listed bat species
have been recorded as roosting or hibernating within approximately 2.75 to 10 miles from the C&H Hog
Farms (Table 3‐6). Given their home range size, these species would be expected to forage in the action
area (NPS 2015a, 2015b; USFWS 2015c). Prior to the construction of the C&H Hog Farms, vegetation on
the site was primarily a mix of coniferous and deciduous trees common to the area with some open
areas including a logging road that ran north to south through the eastern third of the tract. This type of
vegetation would not have been considered suitable roosting habitat for the four listed bat species
based on its fragmented nature, previous disturbance, and tree age and overall composition. There are
Final Environmental Assessment 3‐31
no caves within the C&H Hog Farms parcel. The presence of foraging bats on the C&H Hog Farms or the
application fields does not mean that they would be adversely impacted by the farm operation.
All four of the listed bat species have been recorded as roosting or hibernating within approximately
2.75 to 10 miles from the C&H Hog Farms (Table 4‐3). Given their home range size, these species would
be expected to forage in the action area (NPS 2015c, 2015d; USFWS 2015c). An independent acoustic
survey for threatened and endangered bat species was conducted between August 19 and 20, 2015 on
Big Creek (Gore 2015a). The survey data were reviewed by the USFWS and Indiana bat, gray bat, and
northern long‐eared bat presence was confirmed in the study area using acoustic methods for
detection. An independent survey was also conducted between September 12 and 13, 2015 on the Left
Fork of Big Creek. The three bat species were also recorded during surveys on Left Fork Big Creek (Gore
2015b).
The presence of foraging bats on the C&H Hog Farms or the application fields does not mean that they
would be adversely impacted by the farm operation. The C&H Hog Farms operation is not expected to
inhibit or modify the movement of foraging bat species that may incidentally occur in the area. No
effects to Indiana bat, Ozark big‐eared bat, or northern long‐eared bat are expected to result from the
proposed action. These three bat species are included in Table 3‐6, but are not analyzed further in this
document.
Significant changes in water quality could adversely affect macroinvertebrate populations occurring in
Big Creek, which indirectly could affect bat species through a reduction in prey base. However, no
measureable adverse impacts to surface water quality in Big Creek have been identified based on the
BCRET and NPS water quality monitoring data. Gray bat foraging is strongly related with open water of
rivers, streams, lakes, and reservoirs. Gray bats feed primarily on aquatic insects, particularly mayflies,
caddisflies, and stoneflies; they may also eat beetles and moths (Brady et al. 2009).
The Ozark cavefish (Amblyopsis rosae) and the spectaclecase mussel (Cumberlandia monodonta) do not
occur in the Buffalo Watershed. They are in included in Table 3‐6, but are not analyzed further in this
document.
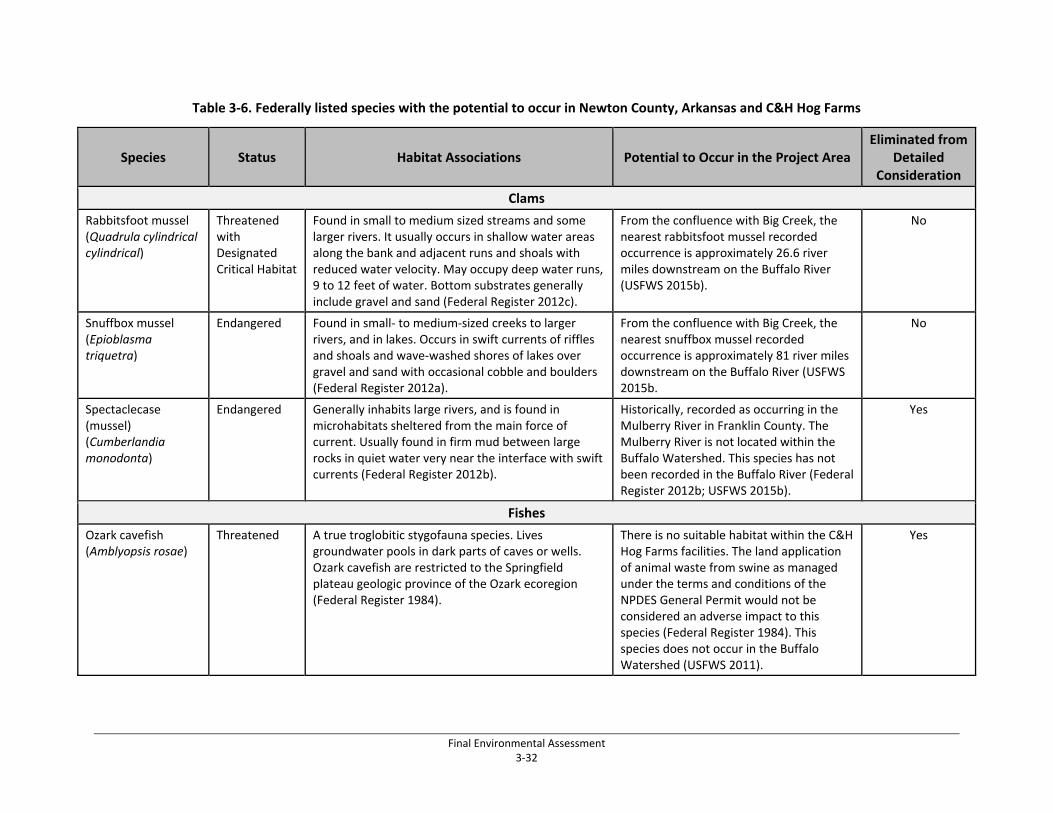
Final Environmental Assessment 3‐32
Table 3‐6. Federally listed species with the potential to occur in Newton County, Arkansas and C&H Hog Farms
Species Status Habitat Associations Potential to Occur in the Project Area Eliminated from
Detailed Consideration
Clams
Rabbitsfoot mussel (Quadrula cylindrical cylindrical)
Threatened with Designated Critical Habitat
Found in small to medium sized streams and some larger rivers. It usually occurs in shallow water areas along the bank and adjacent runs and shoals with reduced water velocity. May occupy deep water runs, 9 to 12 feet of water. Bottom substrates generally include gravel and sand (Federal Register 2012c).
From the confluence with Big Creek, the nearest rabbitsfoot mussel recorded occurrence is approximately 26.6 river miles downstream on the Buffalo River (USFWS 2015b).
No
Snuffbox mussel (Epioblasma triquetra)
Endangered Found in small‐ to medium‐sized creeks to larger rivers, and in lakes. Occurs in swift currents of riffles and shoals and wave‐washed shores of lakes over gravel and sand with occasional cobble and boulders (Federal Register 2012a).
From the confluence with Big Creek, the nearest snuffbox mussel recorded occurrence is approximately 81 river miles downstream on the Buffalo River (USFWS 2015b.
No
Spectaclecase (mussel) (Cumberlandia monodonta)
Endangered Generally inhabits large rivers, and is found in microhabitats sheltered from the main force of current. Usually found in firm mud between large rocks in quiet water very near the interface with swift currents (Federal Register 2012b).
Historically, recorded as occurring in the Mulberry River in Franklin County. The Mulberry River is not located within the Buffalo Watershed. This species has not been recorded in the Buffalo River (Federal Register 2012b; USFWS 2015b).
Yes
Fishes
Ozark cavefish (Amblyopsis rosae)
Threatened A true troglobitic stygofauna species. Lives groundwater pools in dark parts of caves or wells. Ozark cavefish are restricted to the Springfield plateau geologic province of the Ozark ecoregion (Federal Register 1984).
There is no suitable habitat within the C&H Hog Farms facilities. The land application of animal waste from swine as managed under the terms and conditions of the NPDES General Permit would not be considered an adverse impact to this species (Federal Register 1984). This species does not occur in the Buffalo Watershed (USFWS 2011).
Yes
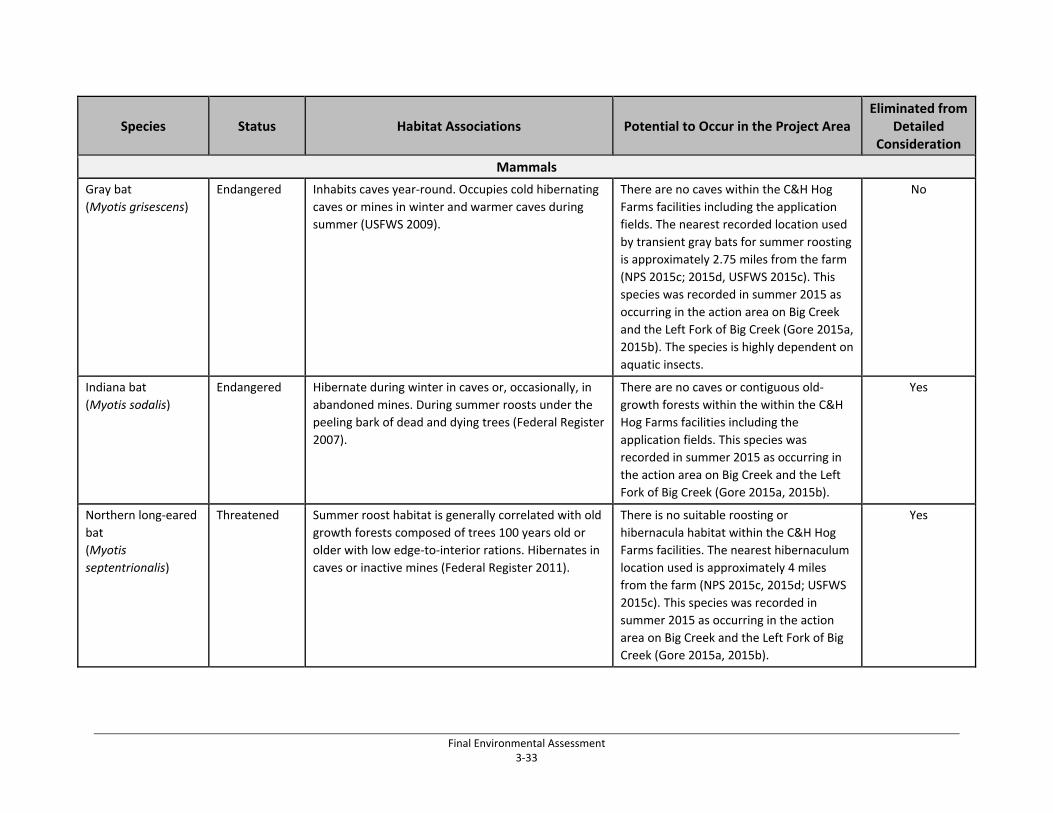
Final Environmental Assessment 3‐33
Species Status Habitat Associations Potential to Occur in the Project Area Eliminated from
Detailed Consideration
Mammals
Gray bat
(Myotis grisescens)
Endangered Inhabits caves year‐round. Occupies cold hibernating
caves or mines in winter and warmer caves during
summer (USFWS 2009).
There are no caves within the C&H Hog
Farms facilities including the application
fields. The nearest recorded location used
by transient gray bats for summer roosting
is approximately 2.75 miles from the farm
(NPS 2015c; 2015d, USFWS 2015c). This species was recorded in summer 2015 as
occurring in the action area on Big Creek
and the Left Fork of Big Creek (Gore 2015a,
2015b). The species is highly dependent on aquatic insects.
No
Indiana bat
(Myotis sodalis)
Endangered Hibernate during winter in caves or, occasionally, in
abandoned mines. During summer roosts under the
peeling bark of dead and dying trees (Federal Register
2007).
There are no caves or contiguous old‐
growth forests within the within the C&H
Hog Farms facilities including the
application fields. This species was
recorded in summer 2015 as occurring in
the action area on Big Creek and the Left
Fork of Big Creek (Gore 2015a, 2015b).
Yes
Northern long‐eared
bat
(Myotis
septentrionalis)
Threatened Summer roost habitat is generally correlated with old
growth forests composed of trees 100 years old or
older with low edge‐to‐interior rations. Hibernates in
caves or inactive mines (Federal Register 2011).
There is no suitable roosting or
hibernacula habitat within the C&H Hog
Farms facilities. The nearest hibernaculum
location used is approximately 4 miles
from the farm (NPS 2015c, 2015d; USFWS
2015c). This species was recorded in summer 2015 as occurring in the action
area on Big Creek and the Left Fork of Big
Creek (Gore 2015a, 2015b).
Yes
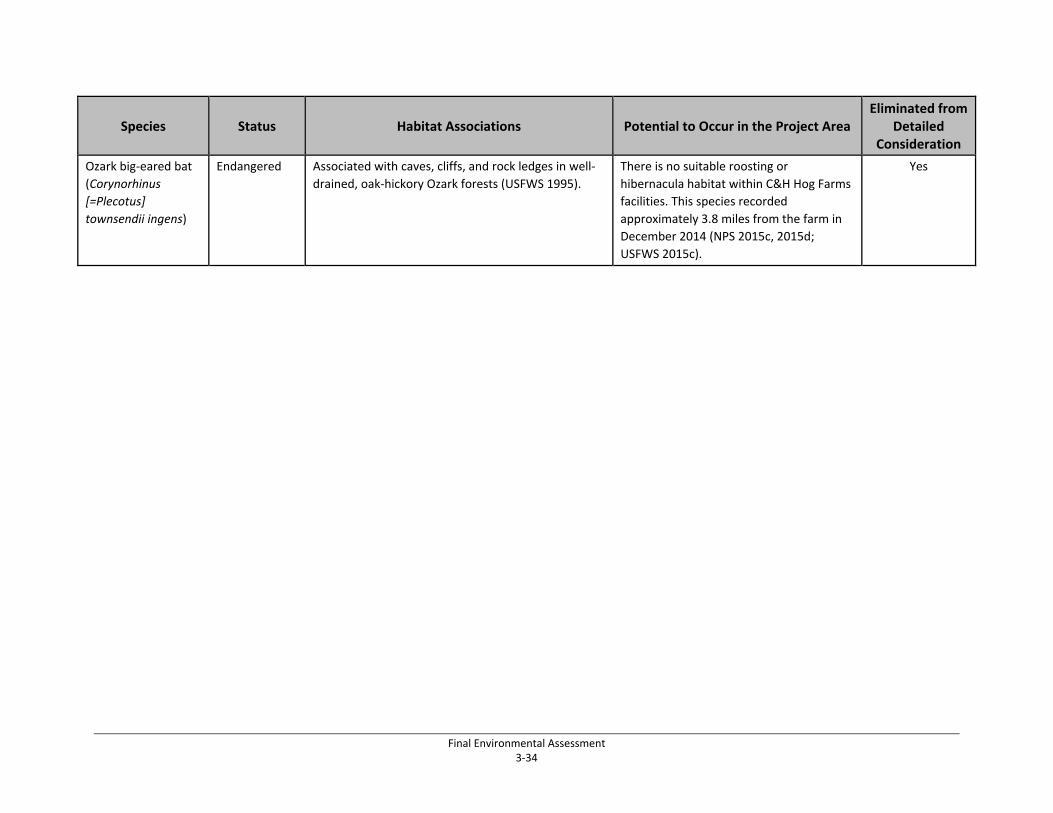
Final Environmental Assessment 3‐34
Species Status Habitat Associations Potential to Occur in the Project Area Eliminated from
Detailed Consideration
Ozark big‐eared bat
(Corynorhinus
[=Plecotus]
townsendii ingens)
Endangered Associated with caves, cliffs, and rock ledges in well‐
drained, oak‐hickory Ozark forests (USFWS 1995).
There is no suitable roosting or
hibernacula habitat within C&H Hog Farms
facilities. This species recorded
approximately 3.8 miles from the farm in
December 2014 (NPS 2015c, 2015d;
USFWS 2015c).
Yes
Final Environmental Assessment 3‐35
Rabbitsfoot Mussel
Description and Life History
The rabbitsfoot is a medium to large mussel, elongated and rectangular, reaching 6 inches in length. The
external shell surface is generally smooth and yellowish, greenish, or olive in color becoming darker and
yellowish‐brown with age and usually covered with dark green or nearly black chevrons and triangles
pointed ventrally. Adults are filter feeders that siphon water into their shells and across four gills that
are specialized for respiration and food collection. Food items include algae, bacteria, detritus
(disintegrated organic debris), and microscopic animals (Federal Register 2012c).
Sperm is released by the males and are siphoned in by the females during feeding and respiration.
Fertilization occurs inside the shell, and success is apparently influenced by mussel density and water
flow conditions. The eggs are retained in the gills of the female until they develop into mature larvae
called glochidia. The glochidia then have a parasitic stage during which they attach to the gills, fins, or
skin of a fish to transform into a juvenile mussel. Blacktail shiner (Cyprinella venusta), cardinal shiner
(Luxilus cardinalis), red shiner (C. lutrensis), spotfin shiner (C. spiloptera), and bluntface shiner (C.
camura) have been identified as host fish (Federal Register 2012c).
Habitat
The rabbitsfoot mussel is found in small to medium sized streams and some larger rivers. It usually
occurs in shallow water areas along the bank and adjacent runs and shoals with reduced water velocity.
It may also occupy water runs 9 to 12 feet deep. Bottom substrates generally include gravel and sand
(Federal Register 2012c). Population density is greatest in areas where velocity and flow is low allowing
sediments to remain stable during flooding. Since rabbitsfoot mussels remain in the same general
location for their life span these refuge areas are highly important. The rabbitsfoot typically does not
burrow like other freshwater mussels making it more susceptible to displacement into unsuitable
habitat during high flows (Federal Register 2012c).
Primary threats to the rabbitsfoot include impoundments, channelization, sedimentation, chemical
contaminants, mining, oil and natural gas development, invasive non‐indigenous species, temperature,
and climate change (Federal Register 2015).
Distribution and Status
Rabbitsfoot historically occurred in 140 streams within the lower Great Lakes Subbasin and Mississippi
River Basin. The Buffalo River is a western White River tributary. Historically, 13 rivers within the White
River system contained rabbitsfoot populations. Since 1985, live or fresh dead individuals have been
recorded in 9 of 13 rivers in the White River system. At one time, the main stem of White River and 11
of its tributaries had a large metapopulation of rabbitsfoot. A metapopulation is a group of spatially
separated populations of the same species, which interact at some level. The Black, Spring, and
Strawberry rivers may still contain a metapopulation. Declining populations are reported from the
Buffalo, Black, Spring, and South Fork Spring tributaries. Many of the tributaries to these streams appear
to have declining populations (Federal Register 2012c).
Rabbitsfoot was first documented in the Buffalo River in 1910 with nearly all specimens located in the
lower reaches within Searcy County, Arkansas. In comprehensive surveys in 1995 and 2004 to 2005, live
Final Environmental Assessment 3‐36
rabbitsfoot specimens were found concentrated between Arkansas Highway 7 in Newton County to near
the Cedar Creek confluence downstream of Rush, Arkansas. NPS staff collected four live rabbitsfoot in
2008 from a site near the Cedar Creek. In 2011, the same site was surveyed; however, due to changes in
channel morphology, few live individuals were recorded. Two live individuals and 23 weathered shells
were located at a site downstream. In 2011, two live rabbitsfoot were collected at two sites located
between Arkansas Highway 7 and U.S. Highway 65. Populations in the Buffalo River are small and
susceptible to extirpation (Federal Register 2012c).
The current population status of rabbitsfoot is declining. It is estimated that the species has been
extirpated from approximately 64 percent of its historical range. Of the 51 populations where the
species remains, only 11 (8 percent) are viable, 23 populations (45 percent) are at risk of extirpation,
and 17 populations (33 percent) show limited recruitment with little evidence of sustainability. The last
observation on the Buffalo River was 1995 (Federal Register 2012c).
Designated Critical Habitat
Approximately 1,437 river miles in the Arkansas River system has been designated as critical habitat for
the rabbitsfoot mussel. Approximately 70.6 river miles of the Buffalo River from Cove Creek confluence
southeast of Erbie, Arkansas, downstream to U.S. Highway 65 west of Gilbert, Arkansas and Highway 14
southeast of Mull, Arkansas downstream to Leatherwood Creek confluence in the lower Buffalo
Wilderness Area are designated critical habitat (Federal Register 2015). The Buffalo River and critical
habitat occurs approximately 6.7 miles downstream of the C&H Hog Farms as shown on Map 6
(Appendix A).
Primary constituent elements are those specific elements of the physical or biological features that
provide for a species’ life history processes and are essential to the conservation of these species. For
the rabbitsfoot the primary constituent elements are:
1. Geomorphically stable river channels and banks (channels that maintain lateral dimensions,
longitudinal profiles, and sinuosity patterns over time without an aggrading or degrading bed
elevation) with habitats that support a diversity of freshwater mussel and native fish (such as
stable riffles, sometimes with runs, and mid‐channel island habitats that provide flow refuges
consisting of gravel and sand substrates with low to moderate amounts of fine sediment and
attached filamentous algae).
2. A hydrologic flow regime (the severity, frequency, duration, and seasonality of discharge over
time) necessary to maintain benthic habitats where the species are found and to maintain
connectivity of rivers with the floodplain, allowing the exchange of nutrients and sediment for
maintenance of the mussels’ and fish host’s habitat, food availability, spawning habitat for
native fishes, and the ability for newly transformed juveniles to settle and become established in
their habitats.
3. Water and sediment quality (including, but not limited to, conductivity, hardness, turbidity,
temperature, pH, ammonia, heavy metals, and chemical constituents) necessary to sustain
natural physiological processes for normal behavior, growth, and viability of all life stages.
4. The occurrence of natural fish assemblages, reflected by fish species richness, relative
abundance, and community composition, for each inhabited river or creek that will serve as an
indication of appropriate presence and abundance of fish hosts necessary for recruitment of the
Final Environmental Assessment 3‐37
Neosho mucket and rabbitsfoot. Suitable fish host for rabbitsfoot may include, but are not
limited to, blacktail shiner from the Black and Little River and cardinal shiner, red shiner, spotfin
shiner, bluntface shiner, rainbow darter (Etheostoma caeruleum), rosyface shiner (Notropis
rubellus), striped shiner (L. chrysocephalus), and emerald shiner (N. atherinoides).
5. Competitive or predaceous invasive (nonnative) species in quantities low enough to have
minimal effect on survival of freshwater mussels.
Snuffbox Mussel
Description and Life History
The snuffbox is a small‐ to medium‐sized mussel, with males reaching up to 2.8 inches in length. The
maximum length of females is about 1.8 inches. The shape of the shell is somewhat triangular (females),
oblong, or ovate (males), with the valves solid, thick, and very inflated. The external shell is generally
smooth and yellowish or yellowish‐green in young individuals, becoming darker with age. Green,
squarish, triangular, or chevron‐shaped marks cover the umbone (the inflated area of the shell along the
dorsal margin), but become poorly delineated stripes with age (Federal Register 2012a).
The snuffbox is a freshwater mussel with a similar life history to the rabbitsfoot mussel. Adults are
suspension‐feeders spending their entire lives partially or completely buried within the stream bottom.
They generally burrow deep into the substrate, except when spawning or attempting to attract a host.
They feed on algae, bacteria, detritus, microscopic animals, and dissolved organic material. There is
evidence to indicate that they may also deposit‐feed on particles in sediment. Juvenile mussels employ
foot (pedal) feeding, consuming settled algae and detritus. Little is known about the specific life‐history
requirements of the snuffbox. In laboratory tests, juvenile snuffboxes have successfully transformed on
logperch (Percina caprodes), blackside darter (P. maculata), rainbow darter, Iowa darter (E. exile),
blackspotted topminnow (Fundulus olivaceus), mottled sculpin (Cottus bairdii), banded sculpin (C.
carolinae), Ozark sculpin (C. hypselurus), largemouth bass (Micropterus salmoides), and brook
stickleback (Culaea inconstans) (Federal Register 2012a).
The age of sexual maturity is unknown, but for other freshwater mussels, it can be highly variable
ranging from between 0 to 9 years and can be sex dependent. The snuffbox is thought to brood from
September to May (Federal Register 2012a).
Primary threats to the snuffbox include impoundments, dredging and channelization, chemical
contaminants, mining, oil and natural gas development, siltation, fragmentation and isolation of
populations, and exotic species invasion (Federal Register 2012a).
Habitat
The snuffbox is found in small‐ to medium‐sized creeks, to larger rivers, and in lakes. It occurs in swift
currents of riffles and shoals and wave‐washed shores of lakes over gravel and sand with occasional
cobble and boulders (Federal Register 2012a). As with other bivalves, refuge areas are highly important.
Species‐specific ecological requirements have not been determined (e.g., minimum water flow and
effects of particular pollutants). The snuffbox reproductive biology, such as age and size at earliest
maturity, reproductive longevity, and the level of recruitment needed for species’ survival and long‐term
viability are unknown (Federal Register 2012a).
Final Environmental Assessment 3‐38
Distribution and Status
Historically, the snuffbox occurred in 210 streams and lakes in 18 states and one Canadian province.
Remaining populations occur in 79 streams in 14 states and one Canadian province. In Arkansas, the
species is found in the Buffalo, Spring, and Strawberry rivers. The species status has declined
significantly range‐wide at an estimated 62 percent. Populations are highly fragmented and restricted to
short reaches. Approximately 32 percent of streams where populations remain are represented by only
one or two recent live or fresh dead individuals (Federal Register 2012a).
The remaining populations have been categorized into three groups. Stronghold populations are defined
as having sizeable populations generally distributed over a significant and more or less contiguous
length of stream (30 river miles or greater), with ample evidence of recent recruitment, and currently
considered viable. Significant populations are defined as small generally restricted populations with
limited recent recruitment and viability. Marginal populations are defined as those which are very small
and highly restricted, with no evidence of recent recruitment, of questionable viability, and that may be
on the verge of extirpation in the immediate future. Based on these criteria, there are 7 stronghold
populations, 24 significant populations, and 48 marginal populations of snuffbox (Federal Register
2012a).
The species status in the Buffalo River is marginal. Snuffbox was last observed in 2006 in the Buffalo in a
small population. The population trend and viability in the Buffalo River is unknown. (Federal Register
2012a).
Gray Bat
Description and Life History
The gray bat is the largest member of the Myotis genus in the eastern U.S. The forearms measure
between 1.6 and 1.8 inches. The species is distinguished from other bats within its range by its uniform
color. Gray bats are dark gray following molt in July or August, but they may bleach to chestnut brown
or russet between molts. The wing membrane connects to the foot at the ankle instead of the base of
the first toe as in other species in this genus and is distinguished by a notch in the claws of the hind feet
(Brady et al. 1982; USFWS 2009). Gray bat life span is approximately 14 to 17 years and sexual maturity
is reached at 2 years of age (USFWS 2009).
The primary threats to gray bat are human disturbance, deforestation, chemical contamination from
pesticides, and white‐nose syndrome. Natural and manmade flooding remains a secondary threat at
some gray bat sites (USFWS 2009). Human activities that have resulted in major impacts to bat colonies
include cave exploration, cave commercialization, and vandalism (Brady et al. 1982, USACE 2007).
White‐nose syndrome is a disease that affects hibernating bats. Since its discovery in 2006, white‐nose
syndrome has killed millions of bats in the U.S. White‐nose syndrome has rapidly spread from the
northeastern to the central U.S. to include 25 states and north into the five Canadian provinces (Blehart
et al. 2011, USGS 2015b). In 2012, white‐nose syndrome was confirmed in gray bat populations in two
Tennessee counties (USFWS 2015).
Final Environmental Assessment 3‐39
Habitat
Gray bats inhabit caves year‐round; occupying cold caves or mines in winter and warmer caves during
summer. Hibernacula are deep vertical caves that trap large volumes of cold air with temperatures
approximately 41 to 48 degrees Fahrenheit, and have multiple entrances with good airflow. Wintering
caves are often hundreds of miles from summer range. Individuals regularly migrate between 10.5 and
272 miles. This species has a strong loyalty to both summering and wintering sites. Because of their
specific roost requirements, only about 5 percent of available caves are suitable for occupancy (USFWS
2009; Brady et al. 1982).
Courtship and mating occur in the fall. Females enter hibernation first in September and October after
mating, but do not become pregnant until emergence from hibernation in late March or early April.
Males remain active until November 10 before entering hibernation. In summer, maternity colonies are
formed containing a few hundred to thousands of bats. Nursery colonies are formed in caves with
domed ceilings where the temperature ranges between 57 and 77 degrees Fahrenheit (USFWS 2009;
Brady et al. 1982). A single pup is born in late May or early June and clings to the female for about a
week, then remains in the nursery cave while females forage. Most young become volant by 4 weeks of
age. Foraging colonies are usually located between 0.6 and 2.5 miles from foraging habitat (USFWS
2009).
Distribution and Status
Gray bat distribution is primarily in the cave regions of Alabama, Arkansas, Kentucky, Missouri, and
Tennessee, with smaller populations found in adjacent states such as Indiana (USFWS 2009). An
estimated 95 percent of the species range‐wide population is confined to only nine hibernacula caves.
Wide population fluctuations of gray bat numbers have been documented at many maternity sites
across the species’ range, but there have been significant population increases in some of the major
hibernacula. However, these increases at some hibernacula may be due to movements from other
caves. Overall, gray bat populations have increased and recovered in many areas throughout its range.
As of 2009, the USFWS determined that populations at 13 sites (45 percent) throughout its range have
been stable or increasing (USFWS 2009).
The nearest recorded location used for summer roosting by transient gray bats is approximately 2.75
miles from the farm (NPS 2015c, 2015d; USFWS 2015c). This species was recorded in summer 2015 as
foraging in the action area on Big Creek and the Left Fork of Big Creek (Gore 2015a, 2015b). The
population trends of gray bat in the action area are unknown.
3.4.2 Impacts from Alternative A: No Action Alternative
Direct and Indirect Impacts
From the confluence with Big Creek, the nearest rabbitsfoot mussel recorded occurrence is
approximately 26.6 river miles downstream, on the Buffalo River. The rabbitsfoot has not been recorded
as occurring within Big Creek and it is not considered suitable habitat since it is dry for periods of time
and exhibits generally cobbled, rocky substrate for much of its reach. There is no designated critical
habitat within or adjacent to C&H Hog Farms or the application fields.
Final Environmental Assessment 3‐40
Snuffbox mussel has not been recorded as occurring in Big Creek and it is not considered suitable habitat
since it is dry for periods of time during the warmer months and exhibits generally cobbled, rocky
substrate for much of its reach.
Gray bat is known to forage and roost in the action area. No caves occur within the C&H Hog Farms
facilities or the application fields. There would be no direct effects to gray bat or roosting or foraging
habitat. The operation of the C&H Hog Farms would have no indirect adverse effects to maternity or
summer roost caves.
C&H Hog Farms has been in operation (waste applied to fields) for more than 18 months and water
quality sampling has been ongoing. There are no data to suggest the operation is negatively affecting
water quality by increasing the concentrations of total N and P, dissolved P, ammonia‐N or nitrate‐N in
Big Creek or the Buffalo River. Monitored levels of nitrate, nitrite, and total phosphorus downstream of
the C&H Hog Farms are not at levels expected to cause mortality or sub‐lethal effects to freshwater
bivalves or other aquatic invertebrates. NPS data collected at Big Creek (BUFT06) do not show any
emerging trends in nutrient related parameters or any measurable increases. Dissolved oxygen levels
measured downstream on Big Creek near Carver (USGS 07055814) appear to be within normal variation
and similar to concentrations in other Buffalo River tributaries. These nutrient and dissolved oxygen
levels are not expected to cause adverse effects to aquatic insects. Refer to Section 3.2.2 for further
information on surface and groundwater quality. The application of wastes to fields adjacent to Big
Creek is closely managed under the terms and conditions of the NPDES General Permit. Monitored
water quality parameters on Big Creek are well below those criteria established to protect aquatic
wildlife.
A NMP was prepared by C&H Hog Farms and approved by ADEQ for the operation of the C&H Hog
Farms. The site‐specific plan calculated a nutrient budget for N and P that considered all potential
sources of nutrients and the estimated crop yield. A field‐specific assessment was conducted to
designate the form, source, amount, timing, and method of application of manure on each field in order
to minimize the potential for any discharge to surface waters. Testing of both soil and manure prior to
field application is required, so the application rates can be adjusted so that nutrients are utilized by
plant growth. All land application areas receive application at rates consistent with infiltration
capabilities of the native soil such that there is no runoff to surrounding areas. Buffer strips (100 feet)
are maintained between fields and streams where waste is applied to prevent waste runoff into
surrounding areas. Wastes/wastewater are not applied to land classified as highly erodible, saturated, or
frozen ground, or during rainfall events or when it is likely to rain.
Since the application of manure to up to 630 acres of fields utilized by C&H Hog Farms is more
stringently managed under the General Permit stipulations, there is the potential for improved water
quality conditions since historically those fields have been fertilized at rates not governed by the terms
of an NMP, which account for season, soil and manure chemistry, site characteristics, land use and other
factors, at un‐managed rates and without buffers near waterways or the implementation of other BMPs.
The farm’s General Permit contains numerous provisions that are designed to protect groundwater,
including the development and implementation of a site‐specific NMP. Waste and nutrient application
are applied at agronomic rates according to the Arkansas P‐Index (FSA 2013d). Therefore, nutrients are
not expected to leach into groundwater from the application of wastes to fields in the area.
Final Environmental Assessment 3‐41
Including the freeboard, the ponds have sufficient storage to hold the volume generated by a 100‐year,
24‐hour storm event. Any discharge during a rainfall event would be restricted to an overflow; the entire
contents of the ponds would not be discharged. The amount of overflow would be directly related to the
amount of rainfall (1 inch equates to approximately 35,000 gallons) and that overflow would be diluted
from its normal concentration. A discharge during a significant rainfall event would have short‐term
impacts to surface water quality since nutrients concentrations would dilute or be available for
biological uptake during downstream transport through the system. It is also possible that there could
be an accidental discharge of waste that could reach surface waters. Surface water quality could be
impacted on a short‐term basis, depending on the amount and location of an accidental discharge, but
based on the potential maximum discharge volume any changes to nutrient concentrations or sediment
would be expected to dilute or be biologically taken up with increasing distance downstream of the
source. Nutrient concentrations may increase and dissolved oxygen concentrations may decrease for a
short time, but would be expected to return to normal conditions. This type of discharge would not
result in long‐term (chronic) impacts to surface water quality.
The NPDES General Permit limits potential seepage from the waste holding ponds to 5,000
gallons/acre/day. At pond installation, liners were tested and met with specifications to ensure that soil
used met engineering specifications for permeability. While the NPDES General Permit has a limit for
potential seepage that does not necessarily mean the C&H Hog Farms waste ponds are seeping fluids at
that rate or at any rate. There is no evident conduit for surface water to reach ground water in the
location of the ponds. The trench system below the ponds serves as a leak detection system. There is no
indication that the waste holding ponds are seeping at a measurable rate or adversely affecting surface
or groundwater quality.
In May 2015, C&H submitted a Major Modification Request to ADEQ to install 60‐mil HDPE liners over a
geotextile base material in both waste ponds and to install an 80‐mil HDPE cover and methane flare
system on Pond 1 (ADEQ 2015c). These design modifications would further minimize the potential
seepage of wastes into groundwater from the ponds.
Pre‐construction geotechnical investigations did not encounter any limestone or water‐bearing
formations, which would indicate karst topography and the abundance of chert at the site indicates a
lower propensity for large‐scale karst landform development (see Section 3.2.2 for more details). How
surface water and groundwater discharge/recharge within the C&H Hog Farms and application fields is
unclear. However, even with the assumptions that localized recharge and discharge of surface and
groundwater occurs in the area, no adverse impacts to groundwater quality are anticipated given the
requirements of the NPDES General Permit and the rigorously managed farm operations.
Based on the potential for short‐term changes in water quality from an accidental discharge, the
Proposed Action may affect but is not likely to adversely affect rabbitsfoot mussel. The Proposed Action
may affect but is not likely to adversely affect designated critical habitat for rabbitsfoot mussel.
Based on the potential for short‐term changes in water quality from an accidental discharge, the
Proposed Action may affect but is not likely to adversely affect snuffbox mussel.
Based on the implementation of the NMP and adaptive management options, operational requirements
and BMPs, the proposed action may affect, is not likely to adversely affect gray bat.
Final Environmental Assessment 3‐42
The USFWS letter of concurrence for the determinations for effects to federally listed species from the
proposed action is provided in Appendix C.
Mitigations
No significant impacts to threatened and endangered species are anticipated and no mitigation
measures are required.
3.4.3 Impacts from Alternative B: Proposed Action
Direct and Indirect Impacts
The terms of C&H Hog Farms NPDES General Permit would apply to operations regardless of the source
of funding used to construct and operate the facility. Therefore, potential impacts to threatened and
endangered species and designated critical habitat are the same as those described for Alternative A.
Mitigations
As with Alternative A, no significant impacts to threatened and endangered species are anticipated and
no mitigation measures are required. The USFWS letter of concurrence for the determinations for
effects to federally listed species from the proposed action is provided in Appendix C.
3.5 Buffalo National River The Buffalo National River, managed by the NPS, was established in 1972 as the first national river for
“purposes of conserving and interpreting an area containing unique scenic and scientific features, and
preserving as a free flowing stream an important segment of the Buffalo River in Arkansas” (PL 92‐237).
The Buffalo River Enabling Act provides that:
“no department or agency of the United States shall assist by loan, grant, license, or
otherwise in the construction of any water resources project that would have direct and
adverse effect on the values for which such river is established, as determined by the
Secretary.”
The District Court’s Order (Case 4:13‐cv‐00450‐DP, Document 58) noted that C&H Hog Farms is not a
Federal water resources project:
“The farm doesn’t withdraw anything from the river or discharge anything into it. The
farm is just too far from the Buffalo to qualify as a water resources project.”
As such, the construction and operation of C&H Hog Farms, with or without Federal loan guarantees,
does not violate the Buffalo River Enabling Act.
3.5.1 Affected Environment
The Buffalo National River encompasses 135 miles of the Buffalo River, one of the few undammed rivers
in the lower 48 states, from its headwaters in the Boston Mountains to its confluence with the White
River to the east. The Park includes more than 94,000 acres divided into three management districts.
Three Wilderness Areas—the Upper Buffalo Wilderness Area, the Ponca Wilderness Area, and the Lower
Buffalo Wilderness Area—are located within the park boundaries.
Final Environmental Assessment 3‐43
Park visitation in 2014 was 13,357,057 (NPS 2015a). Recreational opportunities include water‐based
activities such as swimming, tubing, canoeing, kayaking, and fishing as well as land‐based activities like
hiking and horseback riding along more than 100 miles of trail, hunting, wildlife viewing, photography,
camping, and ranger led programs. There are sixteen campgrounds in the park ranging from primitive
sites to those that accommodate horses, some with vault toilets, and some with full restrooms and
water systems. One location offers cabins, a lodge, and restaurant. Three of the campgrounds are
located on gravel bars in the river. There are 21 boat launch locations along the river within the park.
Development of a General Management Plan for the Buffalo National River was initiated in 2009;
however, the plan and associated NEPA analysis were not completed due to budget cuts.
C&H Hog Farms is located approximately 2,200 feet west of Big Creek, a tributary of the Buffalo River.
The Buffalo River lies approximately 6.8 river miles north of C&H Hog Farms. Fields where waste is land
applied lie along Big Creek and unnamed tributaries of Big Creek.
3.5.2 Impacts from Alternative A: No Action Alternative
Direct and Indirect Impacts
If Federal loan guarantees were voided, the facility would likely continue to operate in accordance with
the environmental protections specified in its NPDES General Permit. C&H Hog Farms has been in
operation and wastes have been land applied for more than 18 months. Water quality sampling has
been ongoing. Section 3.2 of this document presents a discussion of water quality baseline conditions
and potential impacts to surface waters resulting from the operation of C&H Hog Farms in accordance
with the terms of its NPDES General Permit and the operating requirements. There are no data to
suggest the operation is negatively affecting water quality by increasing the concentrations of nutrients
or bacteria in Big Creek, a tributary to the Buffalo National River. The application of wastes to fields
adjacent to Big Creek is closely managed to ensure there is a low risk of runoff of nutrients and that
setbacks from surface waters are employed.
Installation of liners in waste storage ponds would provide further protection to surface and
groundwater beyond those practices currently employed on the facility and waste application fields.
Mitigations
No significant impacts to the Buffalo National River are anticipated and no mitigation measures are
required.
3.5.3 Impacts from Alternative B: Proposed Action
Direct and Indirect Impacts
The direct and indirect impacts associated with the Proposed Action would be the same as those
described for Alternative A.
Mitigations
As with Alternative A, no significant impacts to the Buffalo National River are anticipated and no
mitigation measures are required.
Final Environmental Assessment 3‐44
3.6 Odor Odor is a subjective issue often regulated under nuisance ordinances or the use of exclusionary zoning
at the local level. No such ordinances exist in Newton County, Arkansas. The State of Arkansas’ Right to
Farm Law (Ark. Code Ann. § 24101) protects farming operations from nuisance claims when they meet
certain conditions including operations that employ “methods or practices that are commonly or
reasonably associated with agricultural production.”
3.6.1 Affected Environment
Newton County is a sparsely populated rural area where agriculture, including CAFOs and livestock
grazing and haying operations, is common. The tract of land where the C&H Hog Farms facilities were
built was partially wooded prior to construction. The land application fields were previously grazed and
managed for pasture and forage production, which included application of fertilizers. Because the area
is not designated a Nutrient Surplus Area by the Arkansas General Assembly, an NMP was not required
prior to the use of fertilizer from C&H Hog Farms. Therefore, the historical type, source, frequency and
location of fertilizer or manure application is not known.
3.6.2 Impacts from Alternative A: No Action Alternative
Direct and Indirect Impacts
Odor sources associated with the operation of C&H Hog Farms include the gestational and farrowing
barns, waste storage ponds, and fields where land application of wastes occurs. The Mt. Judea School is
the closest occupied dwelling to the farm barns and waste ponds. It is located approximately 0.7 mile
east, separated by two forested areas, a ridge, and Field 7. The fields where wastes could be land
applied as fertilizer are shown in Map 3 in Appendix A. The owners of each tract of land where wastes
could be land applied entered Land Use Contracts with the operators of C&H Hog Farms. The contracts
specified wastes would be applied according to the NMP and ADEQ guidelines and allowed owners to
add additional requirements. None were specified by any of the landowners (ADEQ 2012a).
Complaints related to C&H Hog Farms submitted to ADEQ were reviewed. Over the nearly 3 years that
C&H has been operating, seven odor and air quality complaints have been reported to ADEQ by three
individuals (ADEQ 2015e). While ADEQ has no regulations for odor, follow‐on investigations and site
visits were done in response to each complaint. These investigations confirmed the facility was
operating within normal permitted operations and no violations were reported. ADEQ contacted the
complainants to inform them that ADEQ has no regulations preventing odors from livestock operations.
In addition, ADEQ informed the complainants that the Air Pollution portion of the Arkansas Water and
Air Pollution Control Act exempts "Agricultural operations in the growing or harvesting of crops and the
raising of fowls or animals" and "Use of equipment in agricultural operations in the growth of crops or
the raising of fowls or animals.”
While C&H Hog Farms is not required to have an air permit, it does employ a number of mitigation
measures to reduce or control odor. These are described in Section 2.3.1. Section L of the NMP (ADEQ
2015a) and Operation and Maintenance Guidelines for C&H Hog Farms (ADEQ 2012a) include operating
procedures designed to reduce odor at the farm facilities and land application sites. Procedures include
setbacks from occupied buildings and property lines, timing and weather restrictions to reduce impacts
Final Environmental Assessment 3‐45
to neighboring residents. At the farm, standing water is minimized, pipes and other components of the
facility are inspected regularly, and a mortality management plan is in place to provide for the prompt
disposal of carcasses. C&H Hog Farms has planted approximately 1,000 loblolly pine trees around the
operations to further minimize odor.
Agriculture including grazing, pasture management, and application of manure as fertilizer are common
in the area. Complaints about odor have been relatively few (seven complaints from three individuals) in
relation to the population of Newton County (8,484 in 2012). Compliance with the terms of the General
Permit would prevent significant odor impacts from operations. The proposed major modification to the
NPDES General Permit, which would allow for installation of a floating cover and methane flare system,
would further reduce odor at the C&H Hog Farms’ waste storage ponds.
Mitigations
No significant odor impacts are anticipated and no mitigation measures are required. The terms of the
facility NPDES General Permit apply to its operations—regardless of the status of Federal backing of
loans.
3.6.3 Impacts from Alternative B: Proposed Action
Direct and Indirect Impacts
The direct and indirect impacts associated with the Proposed Action would be the same as those
described for Alternative A.
Mitigations
As with Alternative A, no significant odor impacts are anticipated and no mitigation measures are
required.
3.7 Socioeconomics Social and economic indicators are used to measure the effects of projects to the human environment.
Socioeconomic analyses evaluate how the conditions of a community or region are affected by a project
through changes in the rate of population growth, changes in the demographic characteristics, and
changes to employment and income in the affected area.
3.7.1 Affected Environment
The affected area for socioeconomic impacts is defined by the communities where the enterprise and its
employees reside, make purchases, and generate tax revenues. For this EA, the affected area for
socioeconomics is Newton County, Arkansas. Baseline social and economic indicators including rate of
population growth and changes to employment and income are evaluated to determine socioeconomic
impacts. These baseline indicators are compared to results for each alternative and to the North
Arkansas Region that includes Carroll, Boone, Marion, Newton, and Searcy counties as well as the State
as a whole to determine the level of effects. The location of these counties are shown in Map 1 in
Appendix A.
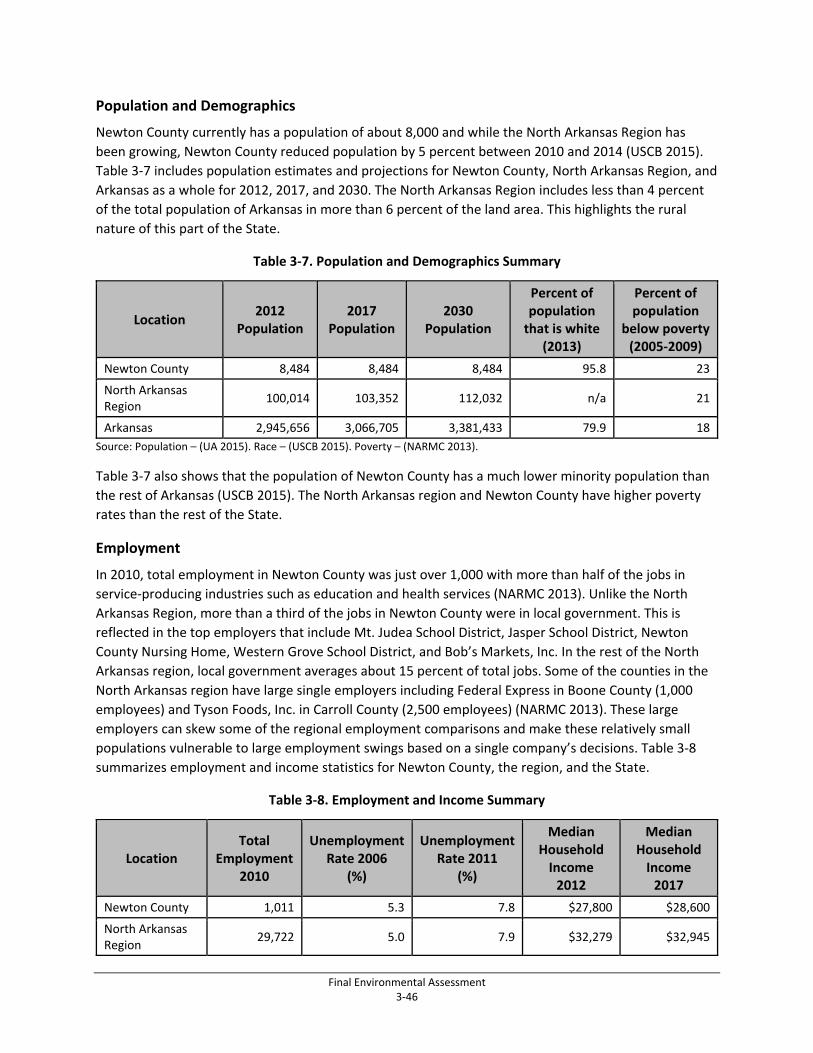
Final Environmental Assessment 3‐46
Population and Demographics
Newton County currently has a population of about 8,000 and while the North Arkansas Region has
been growing, Newton County reduced population by 5 percent between 2010 and 2014 (USCB 2015).
Table 3‐7 includes population estimates and projections for Newton County, North Arkansas Region, and
Arkansas as a whole for 2012, 2017, and 2030. The North Arkansas Region includes less than 4 percent
of the total population of Arkansas in more than 6 percent of the land area. This highlights the rural
nature of this part of the State.
Table 3‐7. Population and Demographics Summary
Location 2012
Population 2017
Population 2030
Population
Percent of population that is white
(2013)
Percent of population
below poverty (2005‐2009)
Newton County 8,484 8,484 8,484 95.8 23
North Arkansas Region
100,014 103,352 112,032 n/a 21
Arkansas 2,945,656 3,066,705 3,381,433 79.9 18
Source: Population – (UA 2015). Race – (USCB 2015). Poverty – (NARMC 2013).
Table 3‐7 also shows that the population of Newton County has a much lower minority population than
the rest of Arkansas (USCB 2015). The North Arkansas region and Newton County have higher poverty
rates than the rest of the State.
Employment
In 2010, total employment in Newton County was just over 1,000 with more than half of the jobs in
service‐producing industries such as education and health services (NARMC 2013). Unlike the North
Arkansas Region, more than a third of the jobs in Newton County were in local government. This is
reflected in the top employers that include Mt. Judea School District, Jasper School District, Newton
County Nursing Home, Western Grove School District, and Bob’s Markets, Inc. In the rest of the North
Arkansas region, local government averages about 15 percent of total jobs. Some of the counties in the
North Arkansas region have large single employers including Federal Express in Boone County (1,000
employees) and Tyson Foods, Inc. in Carroll County (2,500 employees) (NARMC 2013). These large
employers can skew some of the regional employment comparisons and make these relatively small
populations vulnerable to large employment swings based on a single company’s decisions. Table 3‐8
summarizes employment and income statistics for Newton County, the region, and the State.
Table 3‐8. Employment and Income Summary
Location Total
Employment 2010
Unemployment Rate 2006
(%)
Unemployment Rate 2011
(%)
Median Household Income 2012
Median Household Income 2017
Newton County 1,011 5.3 7.8 $27,800 $28,600
North Arkansas Region
29,722 5.0 7.9 $32,279 $32,945
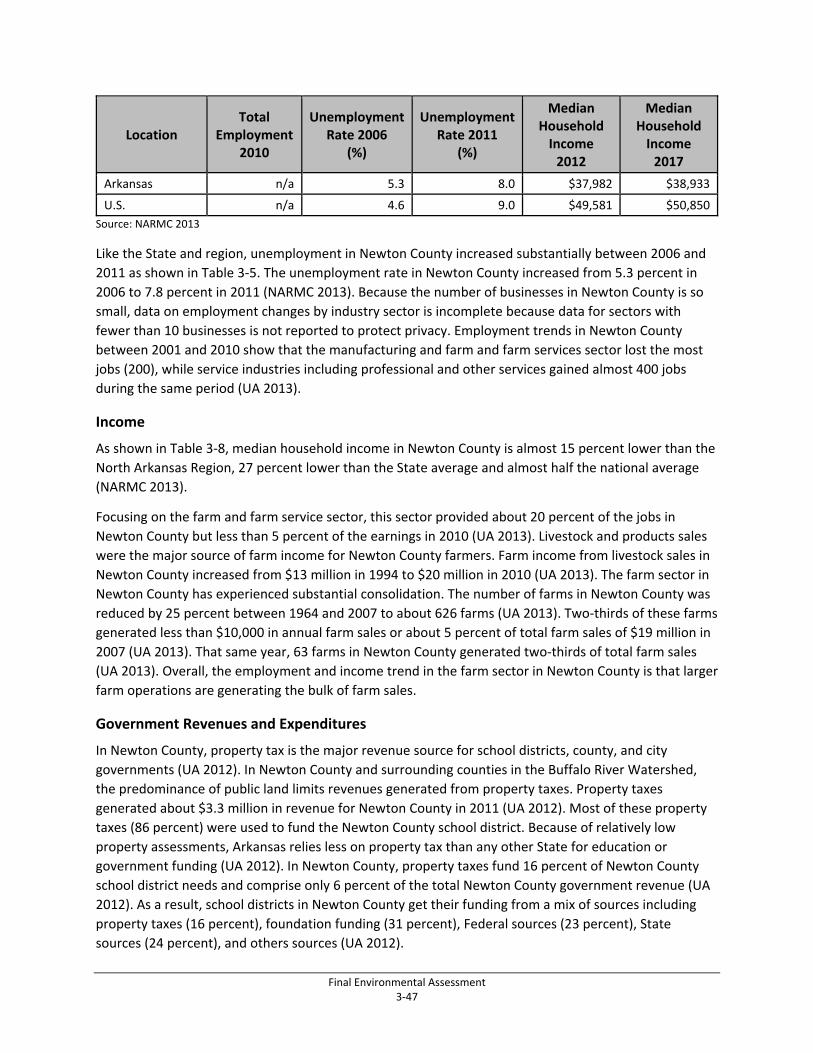
Final Environmental Assessment 3‐47
Location Total
Employment 2010
Unemployment Rate 2006
(%)
Unemployment Rate 2011
(%)
Median Household Income 2012
Median Household Income 2017
Arkansas n/a 5.3 8.0 $37,982 $38,933
U.S. n/a 4.6 9.0 $49,581 $50,850
Source: NARMC 2013
Like the State and region, unemployment in Newton County increased substantially between 2006 and
2011 as shown in Table 3‐5. The unemployment rate in Newton County increased from 5.3 percent in
2006 to 7.8 percent in 2011 (NARMC 2013). Because the number of businesses in Newton County is so
small, data on employment changes by industry sector is incomplete because data for sectors with
fewer than 10 businesses is not reported to protect privacy. Employment trends in Newton County
between 2001 and 2010 show that the manufacturing and farm and farm services sector lost the most
jobs (200), while service industries including professional and other services gained almost 400 jobs
during the same period (UA 2013).
Income
As shown in Table 3‐8, median household income in Newton County is almost 15 percent lower than the
North Arkansas Region, 27 percent lower than the State average and almost half the national average
(NARMC 2013).
Focusing on the farm and farm service sector, this sector provided about 20 percent of the jobs in
Newton County but less than 5 percent of the earnings in 2010 (UA 2013). Livestock and products sales
were the major source of farm income for Newton County farmers. Farm income from livestock sales in
Newton County increased from $13 million in 1994 to $20 million in 2010 (UA 2013). The farm sector in
Newton County has experienced substantial consolidation. The number of farms in Newton County was
reduced by 25 percent between 1964 and 2007 to about 626 farms (UA 2013). Two‐thirds of these farms
generated less than $10,000 in annual farm sales or about 5 percent of total farm sales of $19 million in
2007 (UA 2013). That same year, 63 farms in Newton County generated two‐thirds of total farm sales
(UA 2013). Overall, the employment and income trend in the farm sector in Newton County is that larger
farm operations are generating the bulk of farm sales.
Government Revenues and Expenditures
In Newton County, property tax is the major revenue source for school districts, county, and city
governments (UA 2012). In Newton County and surrounding counties in the Buffalo River Watershed,
the predominance of public land limits revenues generated from property taxes. Property taxes
generated about $3.3 million in revenue for Newton County in 2011 (UA 2012). Most of these property
taxes (86 percent) were used to fund the Newton County school district. Because of relatively low
property assessments, Arkansas relies less on property tax than any other State for education or
government funding (UA 2012). In Newton County, property taxes fund 16 percent of Newton County
school district needs and comprise only 6 percent of the total Newton County government revenue (UA
2012). As a result, school districts in Newton County get their funding from a mix of sources including
property taxes (16 percent), foundation funding (31 percent), Federal sources (23 percent), State
sources (24 percent), and others sources (UA 2012).
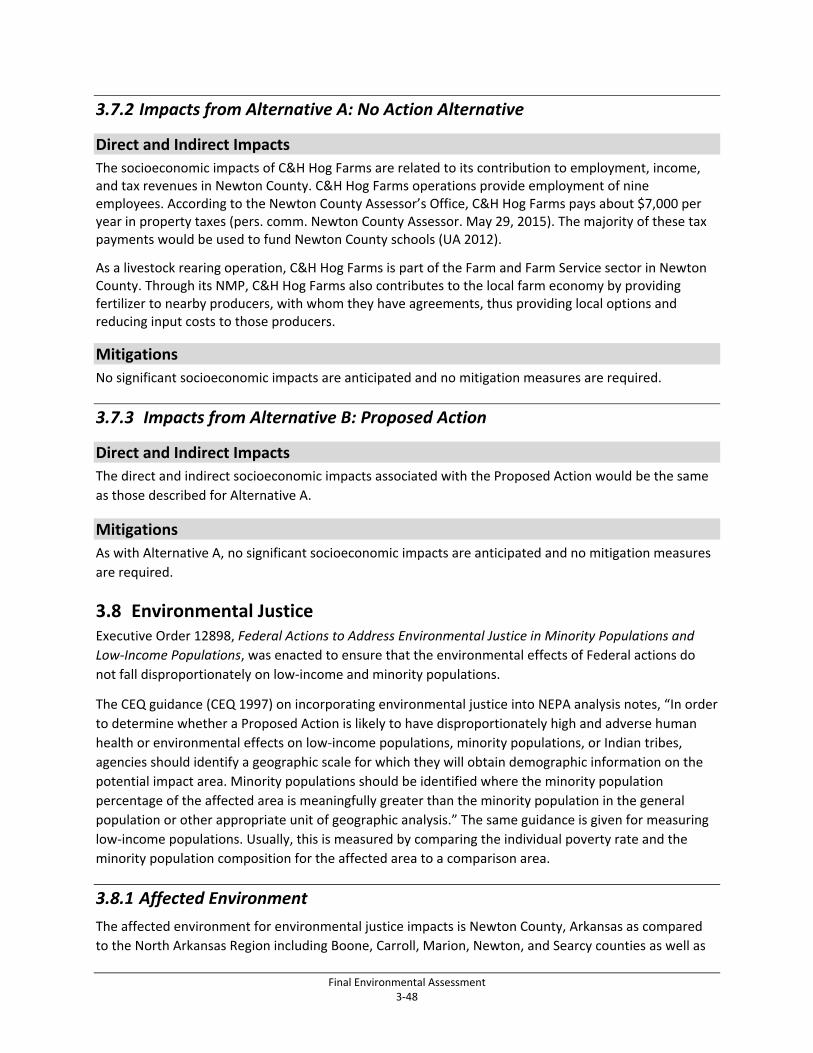
Final Environmental Assessment 3‐48
3.7.2 Impacts from Alternative A: No Action Alternative
Direct and Indirect Impacts
The socioeconomic impacts of C&H Hog Farms are related to its contribution to employment, income, and tax revenues in Newton County. C&H Hog Farms operations provide employment of nine employees. According to the Newton County Assessor’s Office, C&H Hog Farms pays about $7,000 per year in property taxes (pers. comm. Newton County Assessor. May 29, 2015). The majority of these tax payments would be used to fund Newton County schools (UA 2012).
As a livestock rearing operation, C&H Hog Farms is part of the Farm and Farm Service sector in Newton County. Through its NMP, C&H Hog Farms also contributes to the local farm economy by providing fertilizer to nearby producers, with whom they have agreements, thus providing local options and reducing input costs to those producers.
Mitigations
No significant socioeconomic impacts are anticipated and no mitigation measures are required.
3.7.3 Impacts from Alternative B: Proposed Action
Direct and Indirect Impacts
The direct and indirect socioeconomic impacts associated with the Proposed Action would be the same
as those described for Alternative A.
Mitigations
As with Alternative A, no significant socioeconomic impacts are anticipated and no mitigation measures
are required.
3.8 Environmental Justice Executive Order 12898, Federal Actions to Address Environmental Justice in Minority Populations and
Low‐Income Populations, was enacted to ensure that the environmental effects of Federal actions do
not fall disproportionately on low‐income and minority populations.
The CEQ guidance (CEQ 1997) on incorporating environmental justice into NEPA analysis notes, “In order
to determine whether a Proposed Action is likely to have disproportionately high and adverse human
health or environmental effects on low‐income populations, minority populations, or Indian tribes,
agencies should identify a geographic scale for which they will obtain demographic information on the
potential impact area. Minority populations should be identified where the minority population
percentage of the affected area is meaningfully greater than the minority population in the general
population or other appropriate unit of geographic analysis.” The same guidance is given for measuring
low‐income populations. Usually, this is measured by comparing the individual poverty rate and the
minority population composition for the affected area to a comparison area.
3.8.1 Affected Environment
The affected environment for environmental justice impacts is Newton County, Arkansas as compared
to the North Arkansas Region including Boone, Carroll, Marion, Newton, and Searcy counties as well as
Final Environmental Assessment 3‐49
the State as a whole. As shown in Table 3‐1, Newton County has a lower minority population than the
region or State. However, between 2005 and 2009, Newton County had a higher poverty rate (23
percent) than the region (21 percent) and the State (18 percent) as shown in Table 3‐7. Therefore, it is
important to consider potential disproportionate impacts to low‐income populations.
3.8.2 Impacts from Alternative A: No Action Alternative
Direct and Indirect Impacts
There would be no disproportionate effects to low‐income populations because C&H Hog Farms
operates within the terms of its NPDES General Permit and other environmental regulations that protect
public health and welfare, effectively preventing significant impacts as demonstrated in this EA. In
addition, the relatively small socioeconomic impacts of C&H Hog Farms operations on county tax
revenues and employment benefit the entire County with no distinction for low‐income residents.
Surrounding farmers that participate in the NMP, benefit from free soil amendment for their haying and
grazing operations. Since C&H Hog Farms would not change operations under the No Action Alternative,
employment and tax revenues would be the same as baseline conditions. There would be no effects to
low‐income or the rest of the population in the Newton County.
Mitigations
No impacts to minority or low‐income populations are anticipated and no mitigation measures are
required.
3.8.3 Impacts from Alternative B: Proposed Action
Direct and Indirect Impacts
The direct and indirect environmental justice impacts for the Proposed Action would be same as those
described for Alternative A.
Mitigations
As with Alternative A, no impacts to minority or low‐income populations are anticipated and no
mitigation measures are required.
Final Environmental Assessment 4‐1
4. CUMULATIVE IMPACTS AND IRREVERSIBLE AND IRRETRIEVABLE RESOURCE COMMITMENTS
CEQ regulations stipulate that cumulative effects impacts analysis consider the potential environmental
impacts resulting from the incremental impacts of a Proposed Action when added to other past,
present, and reasonably foreseeable actions regardless of what agency or person undertakes such other
actions. Cumulative effects impacts most likely arise when a relationship exists between a Proposed
Action and other actions expected to occur in a similar location or during a similar time period. Actions
overlapping with or in proximity to the Proposed Action would be expected to have more potential for a
relationship than those more geographically separated. Similarly, actions that coincide in time, even
partially, tend to have the potential for cumulative effects impacts.
4.1 Past, Present, and Reasonably Foreseeable Actions Federal, State, local, and private activities that are currently taking place, have occurred in the past, or
may reasonably be assumed to take place in the future in Newton County and the Buffalo Watershed
are listed below. Approximately 39 percent of the land in the Buffalo Watershed is within the
boundaries of the Buffalo National River (11 percent), Ozark National Forest (27 percent), or is managed
by the Arkansas Game and Fish Commission (1 percent). The remaining 61 percent of the land in the
watershed is privately owned. Of this land, approximately 73 percent (686,782 acres) is forest; 25
percent (214,955 acres) is agriculture; 1.5 percent (13,058 acres) is urban, barren, transportation, power
or communication infrastructure, and less than 1 percent is water (2,812 acres) (Mott and Laurans
2004).
Buffalo National River
The Buffalo National River, managed by the NPS, lies north of the farm. It encompasses approximately
94,000 acres surrounding 135 miles of the Buffalo River. Park visitation totaled 13,357,057 visitors in
2014. The park provides 16 campground facilities ranging from primitive to full service, cabins and a
lodge, a restaurant, multiple boat launches and river access sites, and miles of hiking, and horse and off
road trails. According to the NPS Planning, Environment, and Public Comment Website (NPS 2015b),
there are six recent or ongoing projects at the Buffalo National River that require NEPA compliance:
1. Development of a General Management Plan for the Buffalo National River was initiated in
2009; however, the plan and associated NEPA analysis were not completed due to budget cuts.
Therefore, a comprehensive plan of development, operations, and maintenance activities is not
available.
2. An Elk Management Plan is under development.
3. A facilities improvement EA was completed in 2010 to assess the impacts of road, trail, and
parking lot construction and maintenance, and installation of vault toilets at a river access site.
4. An EA was completed in 2013 to assess the impacts of repairs to the Lost Valley Trail and
Campground, including replacement of a bridge over Clark Creek and improvements to trails and
parking areas, following damage caused by flooding.
5. Repair and safety improvements to Highway 7 passing lanes are planned.
6. Repairs of the Woolum Highbanks Road are planned.
Final Environmental Assessment 4‐2
The Park also has a Water Resources Management Plan that provides a summary of water management
within the park and an assessment of contributors to water quality issues in the river’s watershed (Mott
and Laurans 2004).
The NPS awards Special Use Permits (SUPs) for parcels within portions of the Buffalo National River Park
in Newton and Searcy Counties. The SUPs are typically awarded for 5‐year terms and are offered for
agricultural use (hay cutting). Under the permit conditions, permit holders are responsible for applying
the minimum recommended amounts of fertilizer and lime. In 2014, the NPS awarded approximately
1,256 acres within the park as agricultural SUPs. Wildlife Enhancement Plans for selected parcels were
developed by the NPS and the Arkansas Game and Fish Commission. Wildlife Habitat Enhancement
Plans require various tasks, including bush‐hogging, disking, applying lime, fertilizer, and seeds to
establish and maintain habitats (NPS 2013).
Ozark National Forest
The Ozark National Forest lies south of the farm, encompassing 1.2 million acres including the southern
portion of Newton County. Visitors to the Forest enjoy camping, hiking, biking, and horseback riding
along 230 miles of trail, camping, hunting and fishing, swimming, and scenic drives. Like all National
Forests, the Ozark is managed for multiples uses. Cattle grazing, timber harvests, firewood cutting,
natural gas development, and related projects take place in the Forest. The Revised Land and Resource
Management Plan for the Ozark‐St. Francis National Forests (USDA/FSSR 2005) describes the strategy
for and objectives of managing Forest resources including vegetation, wildlife, recreation, soil, water,
air, cultural as well as transportation and access, education, law enforcement, fire management, and
commodities (timber and minerals) management. The U.S. Forest Service’s Schedule of Proposed
Actions (USFS 2015) provides a summary of activities that are currently planned, being undertaken, or
have occurred in the recent past. These include recreation projects, vegetation management, fuels
management, invasive species treatments, timber sales, natural gas well development, and pipeline
installation. A summary of activities occurring in the Ozark National Forest in Newton County follows.
1. Big Piney Fuels Management Project EA would reduce fuels, improve forest health, and restore
ecosystems. This project includes activities such as prescribed burning, commercial and
noncommercial thinning, herbicide use to control non‐native invasive species and to control
understory species. Expected implementation: October 2015.
2. Bee Ridge Forest Health, Timber Project EA would harvest pine and hardwood, provide wildlife
habitat fishery improvements, road stability, protection of heritage resources, fuel reduction,
and non‐native invasive species control. Expected implementation: October 2017.
3. Pleasant Hill Wildlife Habitat Improvement EA would include fuel treatments, vegetation
improvements, species habitat improvements, noxious weed treatments, and watershed
improvements. The project decision was signed on March 4, 2015.
4. Categorical Exclusions for 13 different linear special use requests that are existing but have not
been permitted by a Special Use Permit include access roads, water lines, and power lines.
Expected implementation: April 2014.
5. Categorical Exclusion for re‐issuance of electric highline utility right‐of‐way. The project decision
was signed: March 22, 2013.
Final Environmental Assessment 4‐3
Gene Rush Wildlife Management Area
The Gene Rush Wildlife Management Area (WMA) lies northeast of the farm and is bordered on the
north by the Buffalo National River and by the Ozark National Forest on the south. It is managed by the
Arkansas Game and Fish Commission. Activities include primitive camping, horseback riding, wildlife
viewing, and hunting (primarily deer, black bear, wild turkey, elk, rabbit, and squirrel). Wildlife habitat in
the WMA is managed using timber harvest, controlled burning, stand improvement, and creation of
canopy openings and waterholes.
Agriculture
The Buffalo National River Water Resources Management Plan (Mott and Laurans 2004) cites conversion
of land to pasture in the Buffalo Watershed and increasing poultry production and use of waste as land
applied fertilizer as factors affecting water quality in the Buffalo Watershed. The 2012 Census of
Agriculture profile for Newton County documents 648 farms in the county totaling more than 114,000
acres of land in 2012 (USDA 2012). These numbers represent 2 percent increase in the number of farms
and a 1 percent increase in the farmland acreage over 2007 data. By area, 41 percent of farmland is
pastureland. The top crop, based on market value, is forage land. The top livestock is turkey, followed by
cattle and calves. There are also broiler, layer, and rooster operations in the county, though numbers
are withheld in the report to avoid disclosing data on individual operations. According to the ADEQ
Water Division Final Permits website (ADEQ 2015d), there are four other swine CAFOs and one dairy in
Newton County all of which are permitted to land apply wastes in accordance with the terms of their
permits. Hog operations in Arkansas have been declining in recent years. In 2014, hog production
statewide was approximately 110,000 head compared to 866,000 in 1997. Similarly, cattle numbers
have declined from 2002 (1,802,653) by nearly 200,000 head and poultry (layers and broilers) have
declined by 17 percent from 2002 to 2012 (USDA NASS 2015).
In July 2014, EC Farm (Permit No. 3540‐WR‐6) applied for a Major Modification to become a land
application site only permit. All land proposed for application has been permitted in the past to receive
swine nutrients. The swine fertilizer would be obtained from C&H Hog Farms. A Site Management Plan
was developed by a certified planner for the Major Modification request. If approved, the Major
Modification would allow for application of swine waste using the P‐Index to 596.5 acres, of which 38.7
acres will be removed as the P‐Index calculations place these fields in the high or very high range. Those
fields will be included in the Site Management Plan and retested for future revisions to the plan. A total
of 557.8 acres would be available to apply swine nutrients. The fields are pastureland or hayland and are
located in Newton County, Arkansas. This proposal is in the approval process. The ADEQ is the agency
responsible for evaluating the permit including its potential effects to threatened and endangered
species. The addition of these fields for land application of C&H Hog Farms manure would allow for
greater flexibility in land application and decreased applications on those fields already approved for
application.
Swine Demonstration Project
The ADEQ was awarded a grant from the EPA to conduct 5‐year study; the Buffalo River Liquid Waste
Management System Demonstration Project (Swine Demonstration Project). In 1992, there were 39
confined animal operations within the Buffalo Watershed, including 12 swine farrowing operations, 1
broiler operation, and 26 dairy facilities. All of the swine operations and 10 of the dairy facilities had
Final Environmental Assessment 4‐4
Liquid Animal Waste Management Systems. The Swine Demonstration Project was initiated in 1995 with
the purpose insuring the protection of the Buffalo River by working with local farmers, industry, and
government agencies to identify and address problems associated with manure management (Formica
et al. 2001). Low but slowly increasing fecal coliform bacteria levels within the main channel of the
Buffalo River had been indicated during NPS water quality monitoring between 1985 and 1995.
However, base flow water quality conditions in the Buffalo River and its tributaries were found to be
below state standards (Mott 1997). Through data collection and problem identification, the Swine
Demonstration Project, found that
Swine facilities can contribute nutrients and other contaminants to surface water when sound
manure practices are not implemented.
Swine farms in the Buffalo watershed were primarily impacting surface water.
The local geologic setting plays an important role in the integrity of the manure storage
structures helping to limit impacts to ground water quality.
The project was successful in identifying new or improving BMPs and assisted swine farmers in changing
their manure management practices to minimize environmental impacts. At one facility, preliminary
estimates showed that flow‐weighted concentrations of nutrients prior to and following BMP
implementation decreased 85 percent for total N and 92 percent for total P (Formica et al. 2001).
Additionally, the project was effective in addressing manure management issues beyond the watershed
to the state and national level. The participating partners in the project received an EPA Region 6
Partnerships for Environmental Excellence Award in 1998.
Development and Industry
The ADEQ Water Division’s 2004 Integrated Water Quality Monitoring and Assessment Report (ADEQ
2004) identifies a number of sources of surface and groundwater contamination including centralized
and decentralized municipal water and waste water facilities, septic systems, food processing, industrial
facilities, landfills, underground storage tanks, and petroleum development. Such facilities in Newton
County that require permits from the ADEQ Water Division include five sawmills and lumberyards, a car
wash, municipal water and wastewater treatment plants including the City of Jasper and the Deer,
Marble Falls and Nail‐Swain Water Associations, a number of road improvement and construction
projects, and the septic system for Mt. Judea schools. The municipal water and wastewater treatment
facilities handle waste products in a number of ways including hauling to municipal landfill and land
application. Permit information is accessible on the ADEQ Water Division Final Permit website (ADEQ
2015d). The Buffalo National River Water Resources Management Plan (Mott and Laurans 2004) lists
septic tanks that are poorly constructed, malfunctioning, or constructed in cherty soils or in karst areas
as potential sources of contamination of groundwater. The Arkansas Oil and Gas Commission has
records of 20 oil and gas wells, mostly abandoned, in Newton and Searcy Counties, most of which lie in
the Buffalo Watershed (AOGC 2015).
Feral Swine
Feral swine are not native to the U.S. and are a harmful and destructive invasive species causing
significant damage to property, agriculture, native species, ecosystems, and cultural resources (USDA
APHIS 2015). Currently, no population estimates or densities exist for Arkansas; the Arkansas Game and
Fish Commission acknowledges feral swine presence in the area, with variable levels of infestation based
Final Environmental Assessment 4‐5
on habitat, available resources and other external factors. Feral swine have variable home ranges, which
complicates estimating populations or densities in a given area over time. The Arkansas Game and Fish
Commission could not provide specific information related to locations of populations of feral swine due
to the potential for trap disturbance or recreational pursuit, which can affect trap success in the area.
The Arkansas Game and Fish Commission has implemented a trapping program as well as other control
measures on Gene Rush Wildlife Management Area (AGFC personal communication 2015). The USDA
Animal and Plant Health Information Service National Feral Swine Mapping System shows that
populations of feral swine have expanded from some locations southern Arkansas in 2004 into nearly
every county in the state and north and west into Missouri and Oklahoma in 2014 (USDA APHIS 2015).
4.2 Cumulative Impacts As detailed in Chapter 3, no significant direct or indirect negative impacts to natural or social resources
resulted from the construction of C&H Hog Farms nor are any expected to result from its continuing
operation in compliance with the terms of its NPDES General Permit. The General Permit conditions,
detailed in Section 2.1.3, are designed to prevent impacts to environmental resources, including surface
and groundwater quality.
The following analysis of potential cumulative impacts associated with the alternatives is organized by
resource area in the same order of resource discussions in presented in Chapters 3. Relevant activities are based on potential geographical and temporal relationships with the proposed action. Potential
cumulative effects can be positive and/or negative, short or long term. Cumulative effects can also be
additive (effects of the action together with other past, present, reasonably foreseeable actions produce
a total effect), countervailing (effects of some activities balance or mitigate the effects of others), or
synergistic (effects of activities together is greater than the sum of their individual effects).
For this analysis, the geographic scope of the potential cumulative impact of the project varies by
resource and is based on the area where impacts to the resource resulting from the project could occur.
4.2.1 Water Resources
For water resources, the cumulative impacts analysis area is the Buffalo watershed. Baseline water
quality data presented in Section 3.2 represent the collective positive and negative effects of past and
present activities that affect water quality in the Buffalo Watershed. Past and present activities with the
potential to result in negative effects to water resources include public land management (including
timber harvesting, game/wildlife, livestock grazing, and agricultural management on public lands and
infrastructure development in support of tourism), recreation, agriculture, development and industry,
and feral swine. In the watershed, historic activities with positive effects on water resources are
improvements in water and wastewater management, downward trends in livestock production,
improvements in manure management and the development of successful BMPs. In the northeastern
portion of the watershed, agriculture, development, and other activities in adjoining Buffalo Shoals
Watershed may also be affecting water quality in the Buffalo Watershed through the movement of karst
groundwater across watershed boundaries.
In the case of C&H Hog Farms, it is not necessary to predict the effects of operations on water quality
because its operations are ongoing and any contribution to cumulative effects are represented in water
quality data collected since 2013. As detailed in Section 3.2, a review of water quality data do not
Final Environmental Assessment 4‐6
indicate any measureable negative effects from the operation of the farm, in fact, forage and pasture
management under the terms of an NMP could result in cumulative positive effects to water quality as a
result of carefully controlled application rates and manure management practices.
Reasonably foreseeable future activities that could contribute to impacts to water quality could include
deleterious effects of increasing feral hog and elk populations; anticipated population increases in
northern Arkansas that can be expected to result in greater pressure on municipal water and waste
water systems and an increase in septic systems; continued increased visitation and use of the Buffalo
National River. Changes to agricultural practices and continued downward trends in animal production
could result in positive cumulative effects to water quality. Any increase in lands managed under the
terms of an NMP, which uses the P‐Index to calculate appropriate rates of fertilizer application would be
expected to result in water quality improvements.
Cumulative effects on water quality from the Proposed Action would be indirect, long‐term, and
synergistic. No significant negative cumulative contribution to water quality is anticipated.
4.2.2 Soils and Geology
The geographic scope of impacts to soils and geology includes C&H Hog Farms site and application fields.
Past, present, and reasonably foreseeable agricultural use of the application fields and the range
expansion of feral swine into the area are expected to have contributed to and would continue to
contribute to cumulative effects to soils. The application fields had previously been cleared of
vegetation and were being managed as pasture and for forage production. Soils had been and are
affected (mixed, compacted, and periodically exposed to erosion) by past and ongoing agricultural
activities including disking, seeding, and compaction from livestock and farm machinery used to fertilize,
plant, and harvest the fields. Feral swine, if present in the application fields, could contribute to soil
disturbance and erosion. Conversion of farmland to building sites for residential or industrial
development could also contribute to cumulative impacts to soils, though with populations in Newton
County expected to remain stable through 2030, it is unlikely this effect would be appreciable. As stated
in Section 3.3.2, construction of the C&H Hog Farms facilities resulted in excavation and mixing of soils.
The area has since been planted with loblolly pine seedlings to stabilize soils and reduce runoff. Feral
swine could affect soils on the farm site as described for the application fields.
The geology of the application fields and farm site was not affected by construction of C&H Hog Farms
and would not be affected by its continuing operation. The past, present, and reasonably foreseeable
activities listed in Section 4.1 would not contribute to impacts to geology, with the exception of oil and
gas development, which has not occurred on the farm site or application fields.
Cumulative effects on soils and geology from the Proposed Action would be indirect, long‐term, and
synergistic. No significant negative cumulative impacts to soils or geology is anticipated.
4.2.3 Threatened and Endangered Species
The cumulative impacts analysis area for effects to threatened and endangered species includes the
farm and application fields as well as downstream reaches on the Buffalo River. Primary threats to the
rabbitsfoot include impoundments, channelization, sedimentation, chemical contaminants, mining, oil
and natural gas development, invasive non‐indigenous species, temperature, and climate change
Final Environmental Assessment 4‐7
(Federal Register 2015). Primary threats to the snuffbox include impoundments, dredging and
channelization, chemical contaminants, mining, oil and natural gas development, siltation,
fragmentation and isolation of populations, and exotic species invasion (Federal Register 2012a). The
primary threats to gray bat are human disturbance, deforestation, chemical contamination from
pesticides, and white‐nose syndrome (USFWS 2009). Within the analysis area, past and present activities
include wastewater treatment plants, septic systems, livestock grazing, recreation, agriculture,
development and industry, and feral swine. These activities have and would continue to affect water
quality through the introduction of contaminants, sedimentation, and changes to channel morphology
within suitable habitat. Recreation activities, such as boating, can introduce exotic species, which may
outcompete native species.
Reasonably foreseeable future activities that could contribute to impacts to these species by affecting
water quality could include increasing feral hog and elk populations; population increases in northern
Arkansas, which could result in greater pressure on municipal water and waste water systems and an
increase in septic systems; agriculture; and continued increased visitation and use of the Buffalo
National River. Climate change may also result in greater or more frequent precipitation events, or a
shift in the timing of precipitation events, which could result in flooding, which could change channel
morphologies and increase sedimentation and siltation in suitable habitat. Changes to agricultural
practices such as implementing BMPs and NMPs as well as continued downward trends in animal
production could result in positive cumulative effects to water quality.
Cumulative effects on threatened and endangered species from the Proposed Action would be indirect,
long‐term, and synergistic. No significant negative cumulative impacts to threatened and endangered
species is anticipated.
4.2.4 Buffalo National River
As stated in Section 3.5, C&H Hog Farms is not a “water resources project that would have direct and
adverse effect” on the Buffalo National River, nor are any of the past, present, or reasonably foreseeable
activities listed in Section 4.1. Cumulative water quality impacts are discussed in Section 4.2.1.
4.2.5 Odor
The cumulative impacts analysis area for odor is Newton County. Past, present, and reasonably
foreseeable activities that are contributors to odor in Newton County are agriculture and municipal
waste water treatment facilities. Agriculture accounts for roughly 114,000 acres of land in Newton
County and 215,000 acres (approximately 15 percent) of the Buffalo River watershed pastureland
accounts for 41 percent of farmland in Newton County, there are also poultry and livestock operations.
Land application of waste including hog, cattle, and poultry is a common practice. Cumulative effects on
odor from the Proposed Action would be direct, long‐term, and additive. No significant negative
cumulative contribution to odor is anticipated.
4.2.6 Socioeconomics
The cumulative impacts analysis area for socioeconomics is Newton County and the general region. The
population of Newton County has been stable since 2012 and is predicted to remain the same through
2030. Populations have increased and are expected to continue to increase in the Northern Arkansas
Final Environmental Assessment 4‐8
Region and Arkansas as a whole. Unemployment has increased in the county, region, and state since
2006, while household income has remained stable. Observed reductions in agriculture may contribute
to these trends. The predominance of Federal land in the county and in the Buffalo River Watershed
may limit industrial growth but could also provide opportunities for development of tourism‐based jobs.
The county income from property tax is also limited since Federal lands are not subject. Continued
operation of the farm is not expected to affect the population or economy of the county or region.
Cumulative effects on socioeconomics from the Proposed Action would be direct, long‐term, and
additive. No significant negative contribution to socioeconomics is anticipated.
4.2.7 Environmental Justice
The Proposed Action would not result in any disproportionate impacts low‐income populations;
therefore, the Proposed Action would not contribute to cumulative effects to low‐income populations.
4.3 Irreversible and Irretrievable Resource Commitments NEPA requires that environmental analysis include identification of any irreversible and irretrievable
commitments of resources, which would be involved should an action be implemented. Irreversible and
irretrievable resource commitments are related to the use of nonrenewable resources and the effects
that the use of these resources has on future generations. Irreversible effects primarily result from the
use or destruction of a specific resource that cannot be replaced within a reasonable time frame.
Irretrievable resource commitments involve the loss in value of an affected resource that cannot be
restored because of the action. The construction and ongoing operation of the C&H Hog Farms did not
and is not expected to result in any irreversible or irretrievable resource commitments.
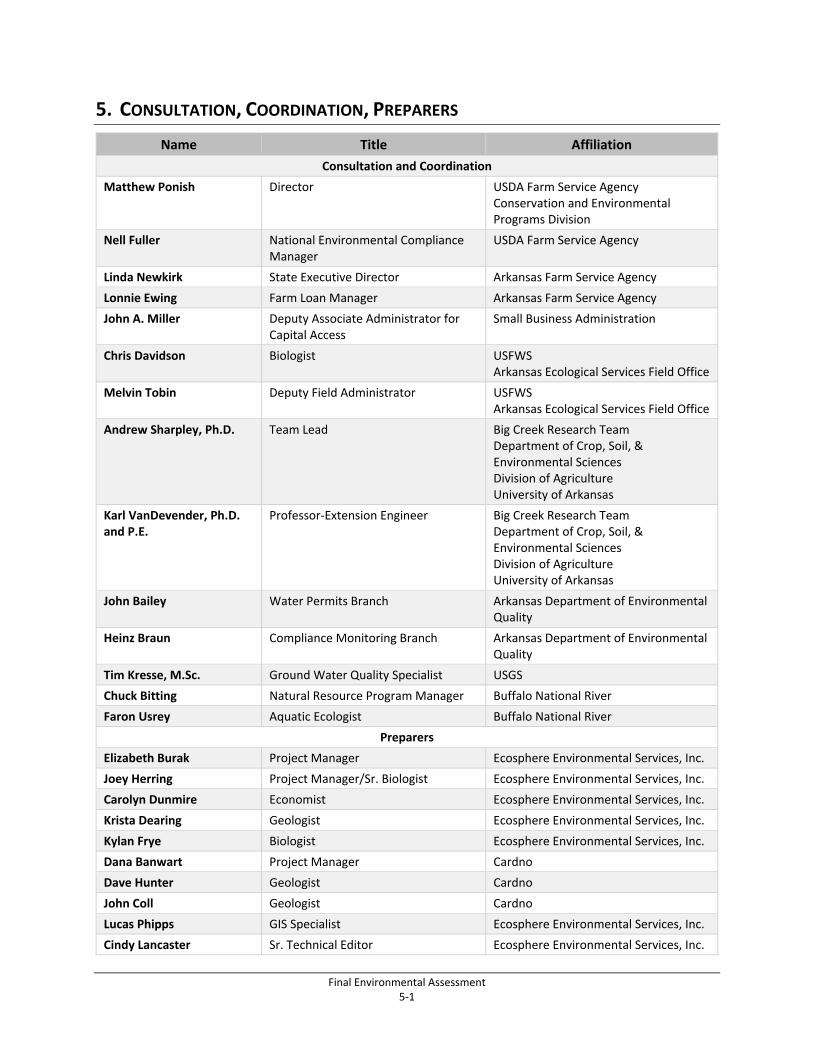
Final Environmental Assessment 5‐1
5. CONSULTATION, COORDINATION, PREPARERS
Name Title Affiliation
Consultation and Coordination
Matthew Ponish Director USDA Farm Service Agency Conservation and Environmental Programs Division
Nell Fuller National Environmental Compliance Manager
USDA Farm Service Agency
Linda Newkirk State Executive Director Arkansas Farm Service Agency
Lonnie Ewing Farm Loan Manager Arkansas Farm Service Agency
John A. Miller
Deputy Associate Administrator for Capital Access
Small Business Administration
Chris Davidson Biologist USFWSArkansas Ecological Services Field Office
Melvin Tobin Deputy Field Administrator USFWSArkansas Ecological Services Field Office
Andrew Sharpley, Ph.D. Team Lead Big Creek Research Team Department of Crop, Soil, & Environmental Sciences Division of Agriculture University of Arkansas
Karl VanDevender, Ph.D. and P.E.
Professor‐Extension Engineer Big Creek Research Team Department of Crop, Soil, & Environmental Sciences Division of Agriculture University of Arkansas
John Bailey Water Permits Branch Arkansas Department of Environmental Quality
Heinz Braun Compliance Monitoring Branch Arkansas Department of Environmental Quality
Tim Kresse, M.Sc. Ground Water Quality Specialist USGS
Chuck Bitting Natural Resource Program Manager Buffalo National River
Faron Usrey Aquatic Ecologist Buffalo National River
Preparers
Elizabeth Burak Project Manager Ecosphere Environmental Services, Inc.
Joey Herring Project Manager/Sr. Biologist Ecosphere Environmental Services, Inc.
Carolyn Dunmire Economist Ecosphere Environmental Services, Inc.
Krista Dearing Geologist Ecosphere Environmental Services, Inc.
Kylan Frye Biologist Ecosphere Environmental Services, Inc.
Dana Banwart Project Manager Cardno
Dave Hunter Geologist Cardno
John Coll Geologist Cardno
Lucas Phipps GIS Specialist Ecosphere Environmental Services, Inc.
Cindy Lancaster Sr. Technical Editor Ecosphere Environmental Services, Inc.
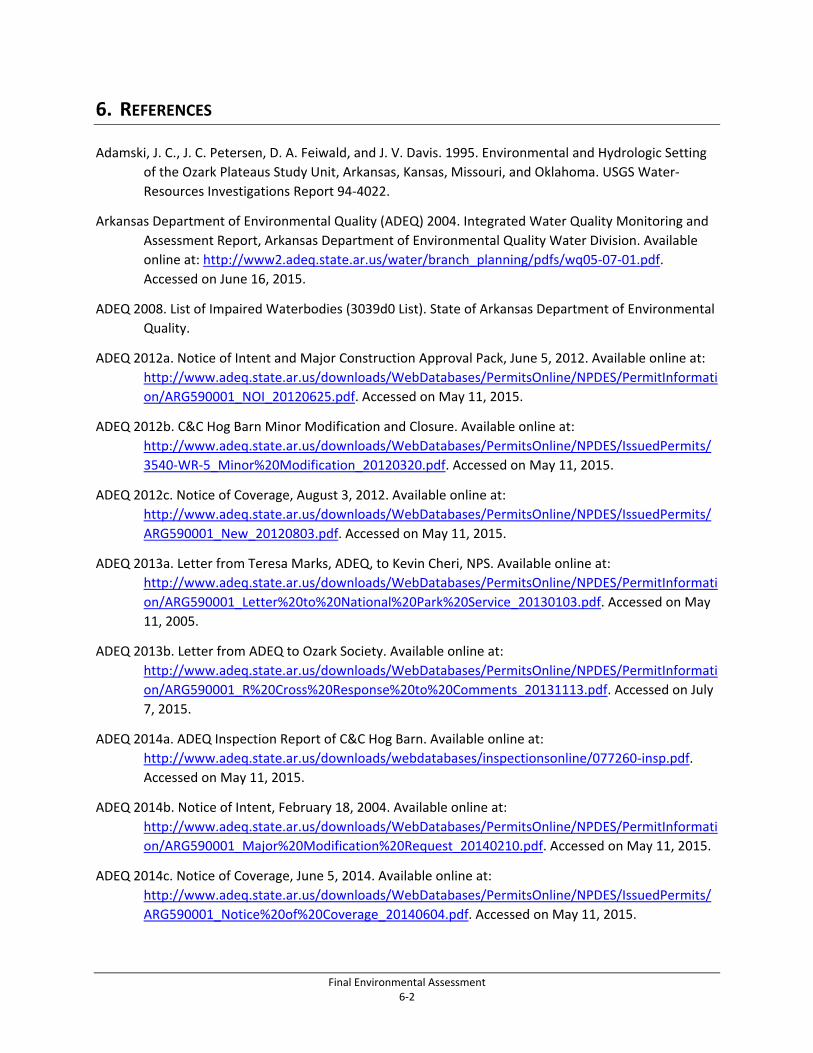
Final Environmental Assessment 6‐2
6. REFERENCES
Adamski, J. C., J. C. Petersen, D. A. Feiwald, and J. V. Davis. 1995. Environmental and Hydrologic Setting
of the Ozark Plateaus Study Unit, Arkansas, Kansas, Missouri, and Oklahoma. USGS Water‐
Resources Investigations Report 94‐4022.
Arkansas Department of Environmental Quality (ADEQ) 2004. Integrated Water Quality Monitoring and
Assessment Report, Arkansas Department of Environmental Quality Water Division. Available
online at: http://www2.adeq.state.ar.us/water/branch_planning/pdfs/wq05‐07‐01.pdf.
Accessed on June 16, 2015.
ADEQ 2008. List of Impaired Waterbodies (3039d0 List). State of Arkansas Department of Environmental
Quality.
ADEQ 2012a. Notice of Intent and Major Construction Approval Pack, June 5, 2012. Available online at:
http://www.adeq.state.ar.us/downloads/WebDatabases/PermitsOnline/NPDES/PermitInformati
on/ARG590001_NOI_20120625.pdf. Accessed on May 11, 2015.
ADEQ 2012b. C&C Hog Barn Minor Modification and Closure. Available online at:
http://www.adeq.state.ar.us/downloads/WebDatabases/PermitsOnline/NPDES/IssuedPermits/
3540‐WR‐5_Minor%20Modification_20120320.pdf. Accessed on May 11, 2015.
ADEQ 2012c. Notice of Coverage, August 3, 2012. Available online at:
http://www.adeq.state.ar.us/downloads/WebDatabases/PermitsOnline/NPDES/IssuedPermits/
ARG590001_New_20120803.pdf. Accessed on May 11, 2015.
ADEQ 2013a. Letter from Teresa Marks, ADEQ, to Kevin Cheri, NPS. Available online at:
http://www.adeq.state.ar.us/downloads/WebDatabases/PermitsOnline/NPDES/PermitInformati
on/ARG590001_Letter%20to%20National%20Park%20Service_20130103.pdf. Accessed on May
11, 2005.
ADEQ 2013b. Letter from ADEQ to Ozark Society. Available online at:
http://www.adeq.state.ar.us/downloads/WebDatabases/PermitsOnline/NPDES/PermitInformati
on/ARG590001_R%20Cross%20Response%20to%20Comments_20131113.pdf. Accessed on July
7, 2015.
ADEQ 2014a. ADEQ Inspection Report of C&C Hog Barn. Available online at:
http://www.adeq.state.ar.us/downloads/webdatabases/inspectionsonline/077260‐insp.pdf.
Accessed on May 11, 2015.
ADEQ 2014b. Notice of Intent, February 18, 2004. Available online at:
http://www.adeq.state.ar.us/downloads/WebDatabases/PermitsOnline/NPDES/PermitInformati
on/ARG590001_Major%20Modification%20Request_20140210.pdf. Accessed on May 11, 2015.
ADEQ 2014c. Notice of Coverage, June 5, 2014. Available online at:
http://www.adeq.state.ar.us/downloads/WebDatabases/PermitsOnline/NPDES/IssuedPermits/
ARG590001_Notice%20of%20Coverage_20140604.pdf. Accessed on May 11, 2015.
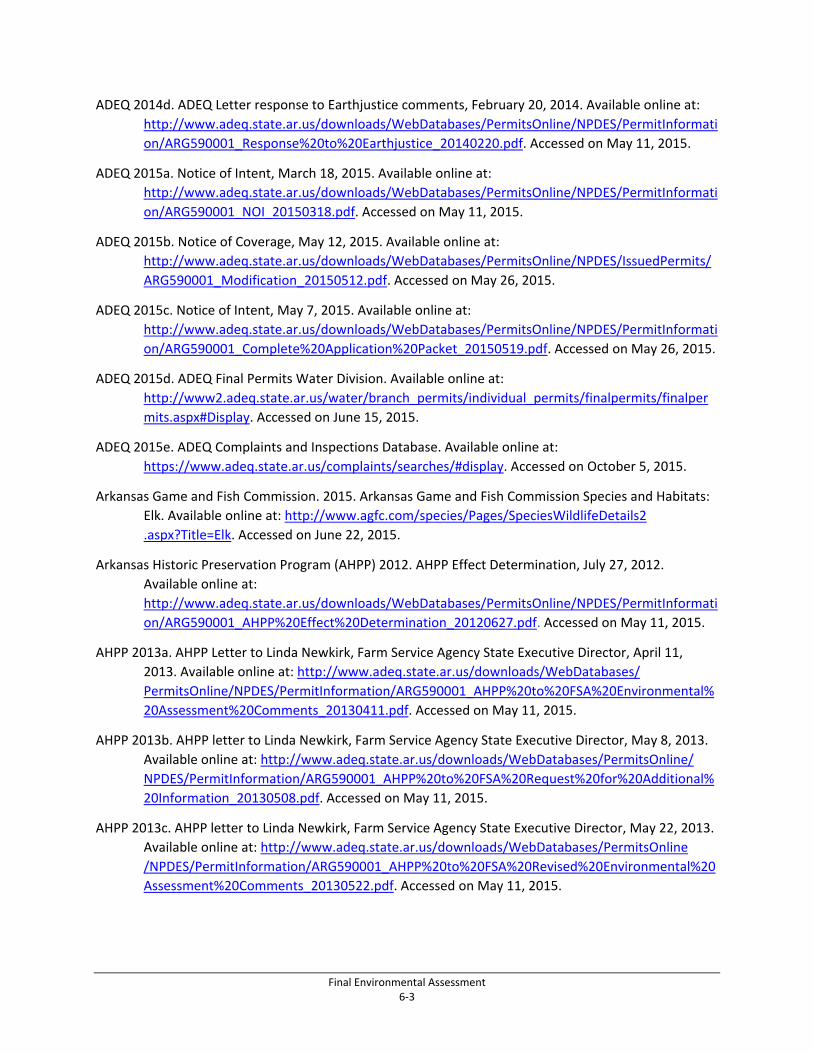
Final Environmental Assessment 6‐3
ADEQ 2014d. ADEQ Letter response to Earthjustice comments, February 20, 2014. Available online at:
http://www.adeq.state.ar.us/downloads/WebDatabases/PermitsOnline/NPDES/PermitInformati
on/ARG590001_Response%20to%20Earthjustice_20140220.pdf. Accessed on May 11, 2015.
ADEQ 2015a. Notice of Intent, March 18, 2015. Available online at:
http://www.adeq.state.ar.us/downloads/WebDatabases/PermitsOnline/NPDES/PermitInformati
on/ARG590001_NOI_20150318.pdf. Accessed on May 11, 2015.
ADEQ 2015b. Notice of Coverage, May 12, 2015. Available online at:
http://www.adeq.state.ar.us/downloads/WebDatabases/PermitsOnline/NPDES/IssuedPermits/
ARG590001_Modification_20150512.pdf. Accessed on May 26, 2015.
ADEQ 2015c. Notice of Intent, May 7, 2015. Available online at:
http://www.adeq.state.ar.us/downloads/WebDatabases/PermitsOnline/NPDES/PermitInformati
on/ARG590001_Complete%20Application%20Packet_20150519.pdf. Accessed on May 26, 2015.
ADEQ 2015d. ADEQ Final Permits Water Division. Available online at:
http://www2.adeq.state.ar.us/water/branch_permits/individual_permits/finalpermits/finalper
mits.aspx#Display. Accessed on June 15, 2015.
ADEQ 2015e. ADEQ Complaints and Inspections Database. Available online at:
https://www.adeq.state.ar.us/complaints/searches/#display. Accessed on October 5, 2015.
Arkansas Game and Fish Commission. 2015. Arkansas Game and Fish Commission Species and Habitats:
Elk. Available online at: http://www.agfc.com/species/Pages/SpeciesWildlifeDetails2
.aspx?Title=Elk. Accessed on June 22, 2015.
Arkansas Historic Preservation Program (AHPP) 2012. AHPP Effect Determination, July 27, 2012.
Available online at:
http://www.adeq.state.ar.us/downloads/WebDatabases/PermitsOnline/NPDES/PermitInformati
on/ARG590001_AHPP%20Effect%20Determination_20120627.pdf. Accessed on May 11, 2015.
AHPP 2013a. AHPP Letter to Linda Newkirk, Farm Service Agency State Executive Director, April 11,
2013. Available online at: http://www.adeq.state.ar.us/downloads/WebDatabases/
PermitsOnline/NPDES/PermitInformation/ARG590001_AHPP%20to%20FSA%20Environmental%
20Assessment%20Comments_20130411.pdf. Accessed on May 11, 2015.
AHPP 2013b. AHPP letter to Linda Newkirk, Farm Service Agency State Executive Director, May 8, 2013.
Available online at: http://www.adeq.state.ar.us/downloads/WebDatabases/PermitsOnline/
NPDES/PermitInformation/ARG590001_AHPP%20to%20FSA%20Request%20for%20Additional%
20Information_20130508.pdf. Accessed on May 11, 2015.
AHPP 2013c. AHPP letter to Linda Newkirk, Farm Service Agency State Executive Director, May 22, 2013.
Available online at: http://www.adeq.state.ar.us/downloads/WebDatabases/PermitsOnline
/NPDES/PermitInformation/ARG590001_AHPP%20to%20FSA%20Revised%20Environmental%20
Assessment%20Comments_20130522.pdf. Accessed on May 11, 2015.
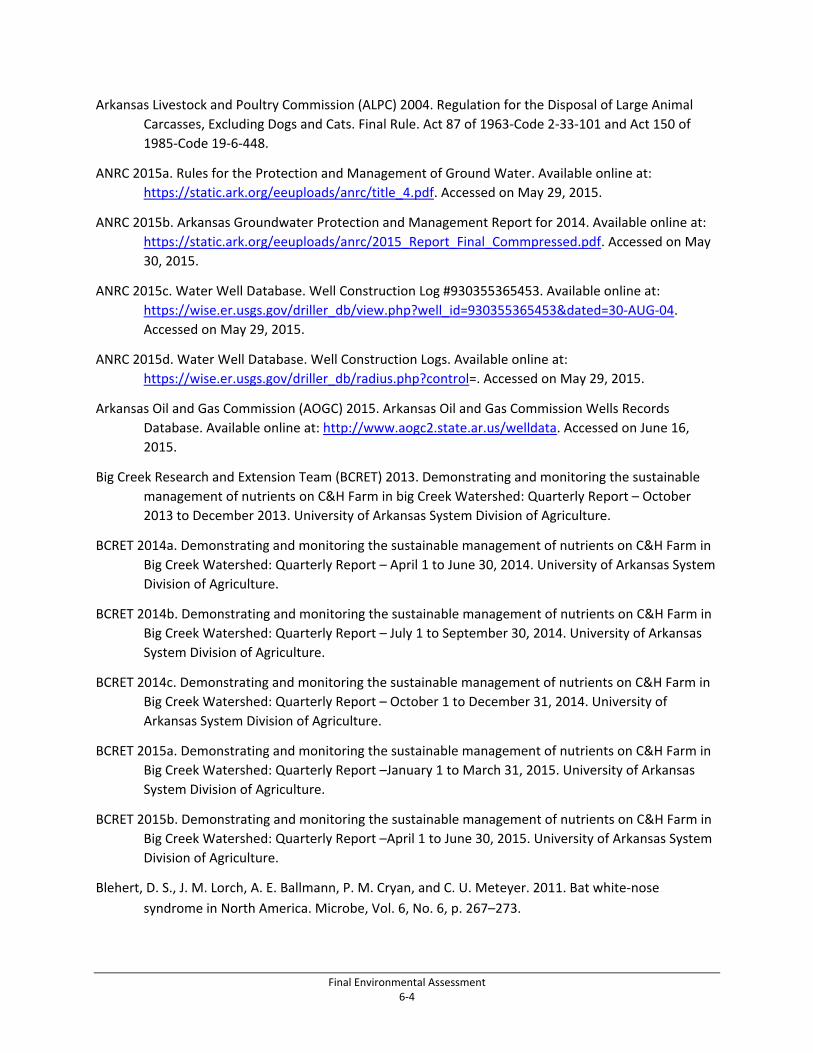
Final Environmental Assessment 6‐4
Arkansas Livestock and Poultry Commission (ALPC) 2004. Regulation for the Disposal of Large Animal
Carcasses, Excluding Dogs and Cats. Final Rule. Act 87 of 1963‐Code 2‐33‐101 and Act 150 of
1985‐Code 19‐6‐448.
ANRC 2015a. Rules for the Protection and Management of Ground Water. Available online at:
https://static.ark.org/eeuploads/anrc/title_4.pdf. Accessed on May 29, 2015.
ANRC 2015b. Arkansas Groundwater Protection and Management Report for 2014. Available online at:
https://static.ark.org/eeuploads/anrc/2015_Report_Final_Commpressed.pdf. Accessed on May
30, 2015.
ANRC 2015c. Water Well Database. Well Construction Log #930355365453. Available online at:
https://wise.er.usgs.gov/driller_db/view.php?well_id=930355365453&dated=30‐AUG‐04.
Accessed on May 29, 2015.
ANRC 2015d. Water Well Database. Well Construction Logs. Available online at:
https://wise.er.usgs.gov/driller_db/radius.php?control=. Accessed on May 29, 2015.
Arkansas Oil and Gas Commission (AOGC) 2015. Arkansas Oil and Gas Commission Wells Records
Database. Available online at: http://www.aogc2.state.ar.us/welldata. Accessed on June 16,
2015.
Big Creek Research and Extension Team (BCRET) 2013. Demonstrating and monitoring the sustainable
management of nutrients on C&H Farm in big Creek Watershed: Quarterly Report – October
2013 to December 2013. University of Arkansas System Division of Agriculture.
BCRET 2014a. Demonstrating and monitoring the sustainable management of nutrients on C&H Farm in
Big Creek Watershed: Quarterly Report – April 1 to June 30, 2014. University of Arkansas System
Division of Agriculture.
BCRET 2014b. Demonstrating and monitoring the sustainable management of nutrients on C&H Farm in
Big Creek Watershed: Quarterly Report – July 1 to September 30, 2014. University of Arkansas
System Division of Agriculture.
BCRET 2014c. Demonstrating and monitoring the sustainable management of nutrients on C&H Farm in
Big Creek Watershed: Quarterly Report – October 1 to December 31, 2014. University of
Arkansas System Division of Agriculture.
BCRET 2015a. Demonstrating and monitoring the sustainable management of nutrients on C&H Farm in
Big Creek Watershed: Quarterly Report –January 1 to March 31, 2015. University of Arkansas
System Division of Agriculture.
BCRET 2015b. Demonstrating and monitoring the sustainable management of nutrients on C&H Farm in
Big Creek Watershed: Quarterly Report –April 1 to June 30, 2015. University of Arkansas System
Division of Agriculture.
Blehert, D. S., J. M. Lorch, A. E. Ballmann, P. M. Cryan, and C. U. Meteyer. 2011. Bat white‐nose
syndrome in North America. Microbe, Vol. 6, No. 6, p. 267–273.
Final Environmental Assessment 6‐5
Braden, A. K., and S. M. Ausbrooks. 2003. Geologic Map of the Mt. Judea Quadrangle, Newton County,
Arkansas: Arkansas Geological Commission Digital Geologic Quadrangle Map DGM‐AR‐00590,
Scale 1:24:000. Available online at:
http://www.geology.ar.gov/maps_pdf/geologic/24k_maps/Mount%20Judea.pdf. Accessed on
May 28, 2015.
Brady, J., T. Kunz, M. D. Tuttle, and D. Wilson. 1982. Gray Bat Recovery Plan. U.S. Fish Wildlife Service
140 pp.
Council on Environmental Quality (CEQ) 1981. Council on Environmental Quality’s Forty Most Asked
Questions Concerning CEQ’s National Environmental Policy Act Regulations, 46 FR `18026,
March 23, 1981.
CEQ 1997. Environmental Justice: Guidance Under the National Environmental Policy Act. Available
online at:
http://www.epa.gov/environmentaljustice/resources/policy/ej_guidance_nepa_ceq1297.pdf.
CEQ 2014. Revised Draft Guidance for Federal Departments and Agencies on Consideration of
Greenhouse Gas Emissions and the Effects of climate Change in NEPA Reviews. Washington, D.C.
Cox, G. D., A. E. Ogden, and G. Slavik. 1980. Contamination of Boone‐St. Joe Limestone Groundwater by
Septic Tanks and Chicken Houses: Arkansas Academy of Science Proceedings, v. 34. Available
online at: http://libinfo.uark.edu/aas/issues/1980v34/v34a11.pdf. Accessed on May 18, 2015.
United States Environmental Protection Agency (EPA) 1996. Environmental indicators of water quality in
the United States. EPA 841–R–96–002.
EPA 2000. Ambient water quality criteria recommendations. Information supporting the development of
state and tribal nutrient criteria for rivers and streams in Nutrient Ecoregion XI the Central and
Eastern Forested Uplands. EPA 822‐B‐00‐020. Office of Water, Office of Science and Technology,
Health and Ecological Criteria Division: Washington, DC.
EPA 2014. EPA Inspection Report of C&H Hog Farms, June 2014. Available online at:
http://www.adeq.state.ar.us/downloads/WebDatabases/InspectionsOnline/078360‐insp.pdf.
Accessed on May 11, 2015.
EPA 2015a. EPA Region 6 Sole Source Aquifer Map. Available online at:
http://www.epa.gov/region6/water/swp/ssa/maps/ssa_r6.pdf. Accessed on May 28, 2015.
EPA 2015b. Preventing eutrophication: Scientific support for dual nutrient criteria. United States
Environmental Protection Agency office of water. EPA‐820‐S‐15‐001.
Farm Service Agency (FSA). 2013a. FSA letter to Martha Miller, Arkansas State Historic Preservation
Officer, May 16, 2013. Available online at:
http://www.adeq.state.ar.us/downloads/WebDatabases/PermitsOnline/NPDES/PermitInformati
on/ARG590001_FSA%20to%20AHPP%20Additional%20Information_20130516.pdf. Accessed on
May 11, 2015.
Final Environmental Assessment 6‐6
FSA 2013b. Letter to Martha Miller, Arkansas State Historic Preservation Officer, June 5, 2013. Available
online at:
http://www.adeq.state.ar.us/downloads/WebDatabases/PermitsOnline/NPDES/PermitInformati
on/ARG590001_FSA%20to%20AHPP%20Reply%20to%20EA%20Comments_20130605.pdf.
Accessed on May 11, 2015.
FSA 2013c. Letter to Andrea Hunter, Osage Nation Tribal Preservation Officer, June 13, 2013. Available
online at:
http://www.adeq.state.ar.us/downloads/WebDatabases/PermitsOnline/NPDES/PermitInformati
on/ARG590001_FSA%20to%20Osage%20Nation_20130613.pdf. Accessed on May 11, 2015.
FSA 2013d. FSA Letter in Response to National Park Service Comments to FSA Class II Environmental
Assessment, C&H Hog Farms, Inc., Newton County, Arkansas. Available online at:
http://www.adeq.state.ar.us/downloads/WebDatabases/PermitsOnline/NPDES/PermitInformati
on/ARG590001_FSA%20to%20NPS%20Regarding%20Environmental%20Assessment_20130329.
pdf. Accessed on May 18, 2015.
Federal Register 1984. Endangered and Threatened Wildlife and Plants: Determination of Threatened
Status for the Ozark Cavefish (Amblyopsis rosae); Final Rule. Department of the Interior Fish and
Wildlife Service. Vol. 29. No. 213. November 1, 1984.
Federal Register 2007. Draft Indiana Bat Recovery Plan, First Revision; Draft Survey Protocol.
Department of the Interior Fish and Wildlife Service. Vol. 72. No. 72. April 16, 2007.
Federal Register 2011. Endangered and Threatened Wildlife and Plants; 90‐Day Finding on a Petition To
List the Eastern Small‐Footed Bat and the Northern Long‐Eared Bat as Threatened or
Endangered. Department of the Interior Fish and Wildlife Service. Vol. 76. No. 125. June 29,
2011.
Federal Register 2012a. Endangered and Threatened Wildlife and Plants; Determination of Endangered
Status for the Rayed Bean and Snuffbox Mussels Throughout Their Ranges; Final Rule.
Department of the Interior Fish and Wildlife Service. Vol. 77 No. 30. February 14, 2012.
Federal Register 2012b. Endangered and Threatened Wildlife and Plants; Determination of Endangered
Status for the Sheepnose and Spectaclecase Mussels Throughout Their Range; Final Rule.
Department of the Interior Fish and Wildlife Service. Vol. 77. No. 49. March 13, 2012.
Federal Register 2012c. Endangered and Threatened Wildlife and Plants; Proposed Endangered Status
for the Neosho Mucket, Threatened Status for the Rabbitsfoot, and Designation of Critical
Habitat for Both Species; Proposed Rule. Department of the Interior Fish and Wildlife Service.
Vol. 77 No. 200. October 16, 2012.
Federal Register 2015. Endangered and Threatened Wildlife and Plants; Designation of Critical Habitat
for Neosho Mucket and Rabbitsfoot; Final Rule. Department of the Interior Fish and Wildlife
Service. Vol. 80. No. 83. April 30, 2015.
Fields, J. and T. Halihan. 2015. Preliminary Electrical resistivity Surveys of Mount Judea Alluvial sites. 2nd
Quarter 2015 Report. Oklahoma State University Boone Pickens School of Geology. Stillwater,
OK. Available online at: http://www.bigcreekresearch.org/OSU%20ER%20Report%202015.pdf.
Final Environmental Assessment 6‐7
Formica, S. J., T. Morris, M. A. Van Eps, T. Kresse, M. Anderson, and J. Giese. 2001. Using Data,
Communication, and Education to Improve Swine Waste Management in the Buffalo River
Watershed. From the Proceedings of the 2nd National Conference: Nonpoint Source Pollution
Information and Education Programs. Chicago, IL.
Gore, J. W. 2015a. Survey of Threatened and Endangered Bat Species on Big Creek. Prepared for the
Buffalo River Watershed Alliance.
Gore, J. W. 2015b. Survey of Threatened and Endangered Bat Species on Left Fork Big Creek. Prepared
for the Buffalo River Watershed Alliance.
Haggard, B. E., P. A. Moore Jr., I. Chaubey, E. H. Stanley. 2003. Nitrogen and Phosphorus Concentrations
and Export from an Ozark Plateau Catchment in the United States. Biosystems Engineering
86(1).
Hudson, M. R., D. N. Mott, C. J. Bitting. 2001. Geologic Framework of Karst Features in Western Buffalo
National River, Northern Arkansas. U. S. Geological Survey Karst Interest Group Proceedings,
Water‐Resources Investigations Report 01‐4011.
Imes, J. L., and L. F. Emmett. 1994. Geohydrology of the Ozark Plateaus Aquifer System in Parts of
Missouri, Arkansas, Oklahoma, and Kansas: USGS Professional Paper 1414‐D. Available online at:
http://pubs.usgs.gov/pp/1414d/report.pdf. Accessed on May 18, 2015.
Kresse, T. M., P. D. Hays, K. R. Merriman, J. A. Gillip, D. T. Fugitt, J. L. Spellman, A. M. Nottmeir, D. A.
Westerman, J. M. Blackstock, and J. L. Battreal. 2014. Aquifers of Arkansas – Protection,
Management, and Hydrologic and Geochemical Characteristics of Groundwater Resources in
Arkansas. USGS Scientific Investigations Report 2014‐5149. Available online at:
http://pubs.usgs.gov/sir/2014/5149/pdf/sir2014‐5149.pdf. Accessed on May 28, 2015.
McFarland, J. D. 1998. Stratigraphic Summary of Arkansas. Available online at:
http://www.geology.ar.gov/pdf/IC‐36_v.pdf. Accessed on May 18, 2015.
Mott, D. N. and J. Laurans. 2004. Water Resources Management Plan Buffalo National River Arkansas.
U.S. Department of the Interior, National Park Service, Buffalo National River. Harrison,
Arkansas.
Mott, D. N. 1997. Buffalo National River, Arkansas Ten Years of Water Quality Monitoring. U.S.,
Department of the Interior, National Park Service, Buffalo National River. Harrison, Arkansas.
Mubiru, D. N., M. S. Coyne, and J. H. Grove. 2000. Mortality of Escherichia coli Pathogen O157:H7 in two
soils with different physical and chemical properties. Agronomy Notes Vol. 30. No. 3. Plant and
Soil Sciences Faculty Publications. Paper 7. Available online at:
http://uknowledge.uky.edu/pss_facpub/7. Accessed July 15, 2015.
Murray, K. E. and M. R. Hudson. 2002. Three‐Dimensional Geologic Framework Modeling for a Karst
Region in the Buffalo National River, Arkansas. In USGS Karst Interest Group Proceedings,
Shepherdstown, West Virginia August 20‐22, 2002: USGS Water Resources Investigations Report
02‐4174. Available online at: http://water.usgs.gov/ogw/karst/kig2002/pdffiles/kem.wrir02‐
4174.pdf. Accessed on May 28, 2015.
Final Environmental Assessment 6‐8
National Oceanic and Atmospheric Administration (NOAA). 2015. Point Precipitation Frequency
Estimates. NOAA Atlas 14, Volume 9, Version 2. Location: Vendor, Arkansas, U.S. Available
online at: http://hdsc.nws.noaa.gov/. Accessed September 29, 2015.
National Park Service (NPS). 2013. Solicitation: An Opportunity for Agricultural Hay Field Special Use
Permits MWR‐BUFF‐1000‐XXX. Buffalo National River. Harrison, Arkansas.
NPS 2015a. Buffalo National River Recreation Visitors Website. https://irma.nps.gov/Stats/SSRSReports/
Park%20Specific%20Reports/Annual%20Park%20Recreation%20Visitation%20(1904%20‐
%20Last%20Calendar%20Year)?Park=BUFF. Accessed on September 22, 2015.
NPS 2015b. National Park Service Planning, Environment, and Public Comment website.
http://parkplanning.nps.gov/parkHome.cfm?setViewType=basic&parkID=119. Accessed on June
10, 2015.
NPS. 2015c. Bat caves within 10‐mile radius of the C&H Hog Farms. U.S. Department of the Interior,
National Park Service, Buffalo Nation River. Harrison, Arkansas. Unpublished data, June 10,
2015.
NPS. 2015d. Acoustic bat monitoring results. U.S. Department of the Interior, National Park Service,
Buffalo Nation River. Harrison, Arkansas. Unpublished data, June 10, 2015.
North Arkansas Regional Medical Center (NARMC). 2013. Community Health Needs Assessment – 2013.
March 2013. Available online at:
https://www.narmc.com/assets/NARMC2013CHNA_FINAL.pdf.Downloaded on May 15, 2015.
Personal communication by email with Linda Newkirk, FSA State Executive Director, May 11, 2015.
Personal communication. Newton County Assessor. May 29 2015.
Personal communication between Joey Herring (Ecosphere) and A. Sharpley, (Big Creek Research and
Extension Team, University of Arkansas) on June 4, 2015.
Personal communication. Arkansas Game and Fish Commission regarding feral hogs. September 21,
2015.
Peterson, J. C., J. C. Adamski, R. C. Bell, J. V. Davis, S. R. Femmer, D. A. Freiwald, and R. L. Joseph 1998.
Water Quality in the Ozark Plateaus, Arkansas, Kansas, Missouri, and Oklahoma, 1992 – 1995.
USGS Circular 1158. Available online at: http://pubs.usgs.gov/circ/circ1158. Accessed on May
29, 2015.
Renken, R. A. 1998. Ground Water Atlas of the United States, Segment 5, Arkansas, Louisiana,
Mississippi. USGS Hydrologic Investigations Atlas 730‐F. Available online at:
http://pubs.usgs.gov/ha/ha730/ch_f/index.html. Accessed on May 18, 2015.
Soto, L. 2014. Draft summary of previous dye tracing reports in the area of the Buffalo National River,
Arkansas. Prepared for Geologic Features and Systems Branch, Geologic Resources Division.
National Park Service, Natural Resources Stewardship and Science.
Final Environmental Assessment 6‐9
Tennyson, R., J. Terry, Van Brahana, P. Hays, and E. Pollock. 2008. Tectonic Control of Hypogene
Speleogenesis in the Southern Ozarks – Implications for NAWQA and Beyond. In USGS Karst
Interest Group Proceedings, Bowling Green, Kentucky, May 27 – 29, 2008: USGS Scientific
Investigations Report 2008‐5023. Available online at: http://pubs.usgs.gov/sir/2008/5023/pdf/
09tennyson.pdf. Accessed on May 28, 2015.
U.S. Army Corps of Engineers (USACE) 1987. Corps of Engineers Wetland Delineation Manual. Technical
Report Y‐87‐1 January 1987. Environmental Laboratory, Vicksburg, Mississippi.
USACE. 2007. Assessment of the population status of the Gray Bat (Myotis grisescens). Status review,
DoD initiatives, and results of a multi‐agency effort to survey wintering populations at major
hibernacula, 2005‐2007. ERDC/EL TR‐07‐22.
USACE 2010. Regional Supplement to the U.S. Army Corps of Engineers: Western Mountains, Valleys,
and Coast Region (Version 2.0). Technical Report ERDC/EL TR‐10‐3, U.S. Army Engineer Research
and Development Center, Vicksburg, Mississippi.
United States Census Bureau (USCB) 2015. U.S. Census Bureau. State and County Quickfacts. Available
online at: http://quickfacts.census.gov/qfd/states/05/05101.html. Downloaded on May 22,
2015.
United States Department of Agriculture (USDA). 1988. USDA Soil Conservation Service, Soil Survey of
Newton County, Arkansas.
USDA. 2012. Part 651 Agricultural Waste Management Field Handbook. United States Department of
Agriculture Natural Resources Conservation Service. 210‐VI‐AWMFh, Amend. 52., February
2012.
USDA. 2012. Census of Agriculture County Profile, Newton County, Arkansas. Available online at:
http://www.agcensus.usda.gov/Publications/2012/Online_Resources/County_Profiles/Arkansas
/cp05101.pdf. Downloaded on June 15, 2015.
U.S. Department of Agriculture, Animal and Plant Health Inspection Service (USDA AHPIS). 2015. Final
Environmental Impact Statement Feral Swine Damage Management: A National Approach. U.S.
Department of Agriculture, Animal and Plant Health Inspection Service. Washington, D.C.
United States Department of Agriculture Forest Service Southern Region (USDA/FSSR) 2005. Revised
Land and Resource Management Plan Ozark‐St. Francis National Forests. Management Bulletin
R8‐MB 125A. Russellville, Arkansas.
United States Department of Agriculture National Agriculture Statistics Service (USDA NASS) 2015.
Available online at: http://www.nass.usda.gov/Statistics_by_State/Arkansas/Publications/
Livestock_Releases/Hog/2014/index.asp. Downloaded on October 7, 2015.
United States Forest Service (USFS) 2015. U.S. Forest Service Schedule of Proposed Actions for the
Ozark‐St. Francis National Forests. Available online at: http://www.fs.fed.us/sopa/forest‐
level.php?110810. Accessed June 15, 2015.
United States Fish and Wildlife Service (USFWS). 1995. Ozark big‐eared bat (Plecotus townsendii ingens)
Revised Recovery Plan. Oklahoma Ecological Field Services Field Office: Tulsa, Oklahoma.
Final Environmental Assessment 6‐10
USFWS 2009. Gray Bat (Myotis grisescens) 5‐Year Review: Summary and Evaluation. Midwest Region;
Columbia, Missouri Ecological Services Office. Columbia, Missouri.
USFWS. 2011. Ozark cavefish (Amblyopsis rosae Eigenmann 1898) 5‐Year Review: Summary and
Evaluation. U.S. Fish and Wildlife Service Southeast Region. Arkansas Ecological Services Field
Office. Conway, Arkansas.
USFWS 2015. IPaC‐Information, Planning and Conservation System. Listed and Sensitive Species in
Newton County, Arkansas. [Website] U.S. Fish and Wildlife Service Environmental Conservation
Online System. Available online at: http://ecos.fws.gov/ipac/project/
TOMTNPJ3YBCSJOWIGCP3C5N4MQ/resources. Accessed May 2015.
USFWS. 2015b. Mussel species and locations. Arkansas Ecological Field Services. Conway, Arkansas.
Unpublished data, May 12, 2015.
USFWS. 2015c. Bat occurrence data. Arkansas Ecological Field Services. Conway, Arkansas. Unpublished
data, June 1, 2015.
U.S. Geological Survey (USGS). 2015a. National Water information System: Web Interface. USGS
07055790 Big Creek near Mt. Judea, AR. Available online at: http://nwis.waterdata.usgs.gov/
nwis/uv?cb_00065=on&cb_00010=on&cb_00631=on&format=gif_mult_parms&site_no=07055
790&period=&begin_date=2015‐01‐01&end_date=2015‐06‐11.
USGS. 2015b. White‐Nose Syndrome (WNS). National Wildlife Health Center. Available online at:
http://www.nwhc.usgs.gov/disease_information/white‐nose_syndrome/University of Arkansas
(UA). 2012. University of Arkansas. Division of Agriculture. Research and Extension. Arkansas
Property Tax: Revenue, Assessment, & Rates. Newton County. December 2012. Available online
at: http://www.uaex.edu/business‐communities/Newton.pdf. Downloaded on May 22, 2015.
UA 2013. Division of Agriculture. Research and Extension. Newton County Profile 2013. Located:
https://www.uaex.edu/business‐communities/strategic‐planning/docs/county‐profiles/newton‐
county‐profile.pdf. Downloaded on May 15, 2015.
UA 2015. University of Arkansas at Little Rock, Institute for Economic Advancement. Population
Estimates and Projects. Located: http://iea.ualr.edu/population‐estimates‐a‐projections.htm.
Accessed on May 22, 2015.
Usrey, F. D. 2013. Assessment of Escherichia coli Concentrations in the Surface Waters of the Buffalo
National River 2009 to 2012. Buffalo National River Report NPS/B‐0100/2013. U.S. Department
of the Interior, National Park Service, Buffalo National River. Harrison, Arkansas.
Final Environmental Assessment A‐1
Appendix A – Maps
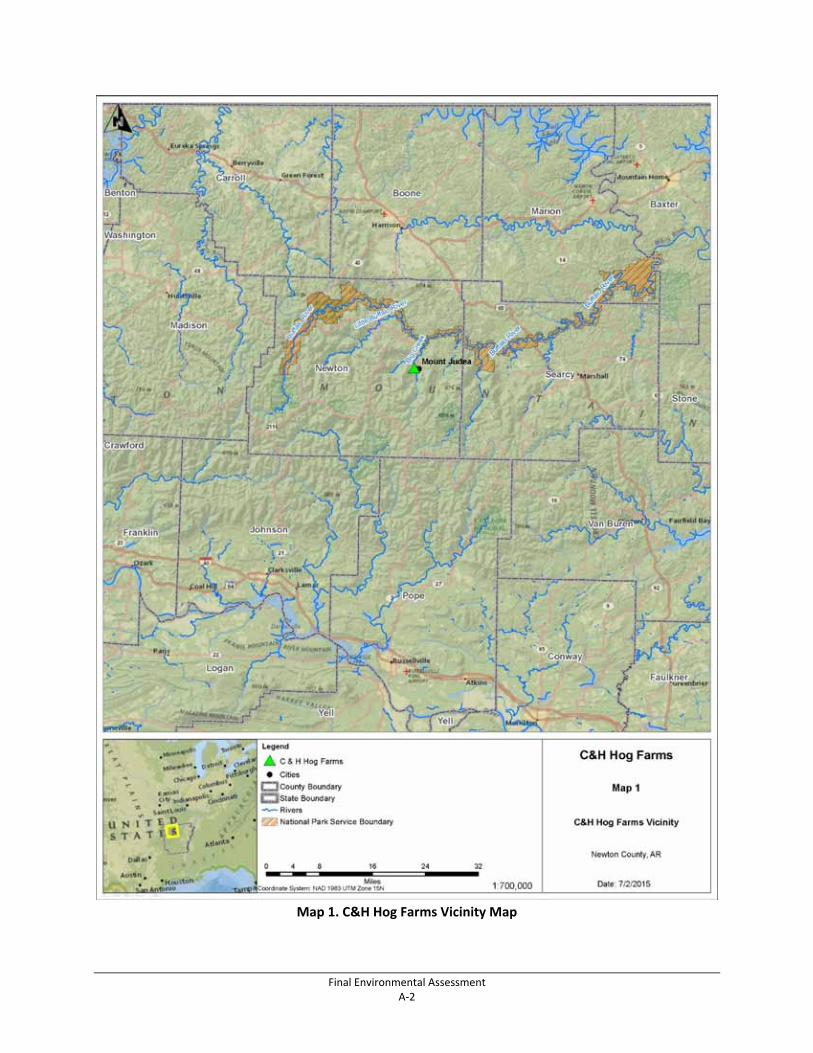
Final Environmental Assessment A‐2
Map 1. C&H Hog Farms Vicinity Map
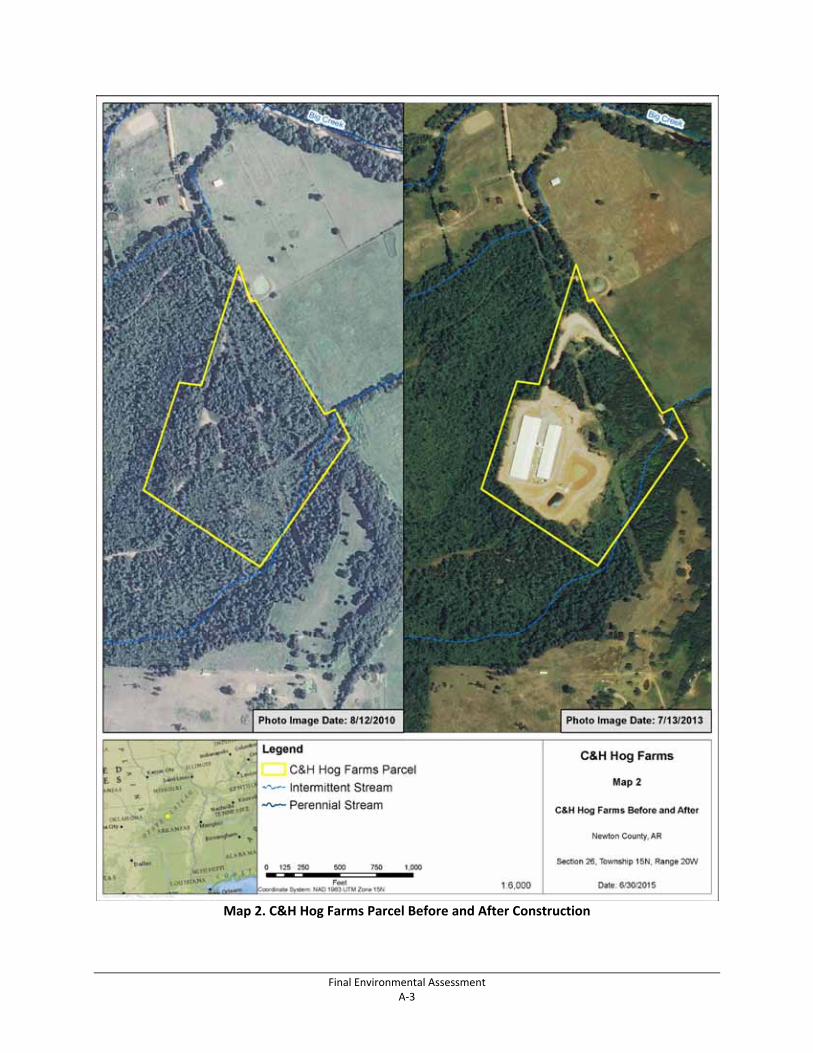
Final Environmental Assessment A‐3
Map 2. C&H Hog Farms Parcel Before and After Construction
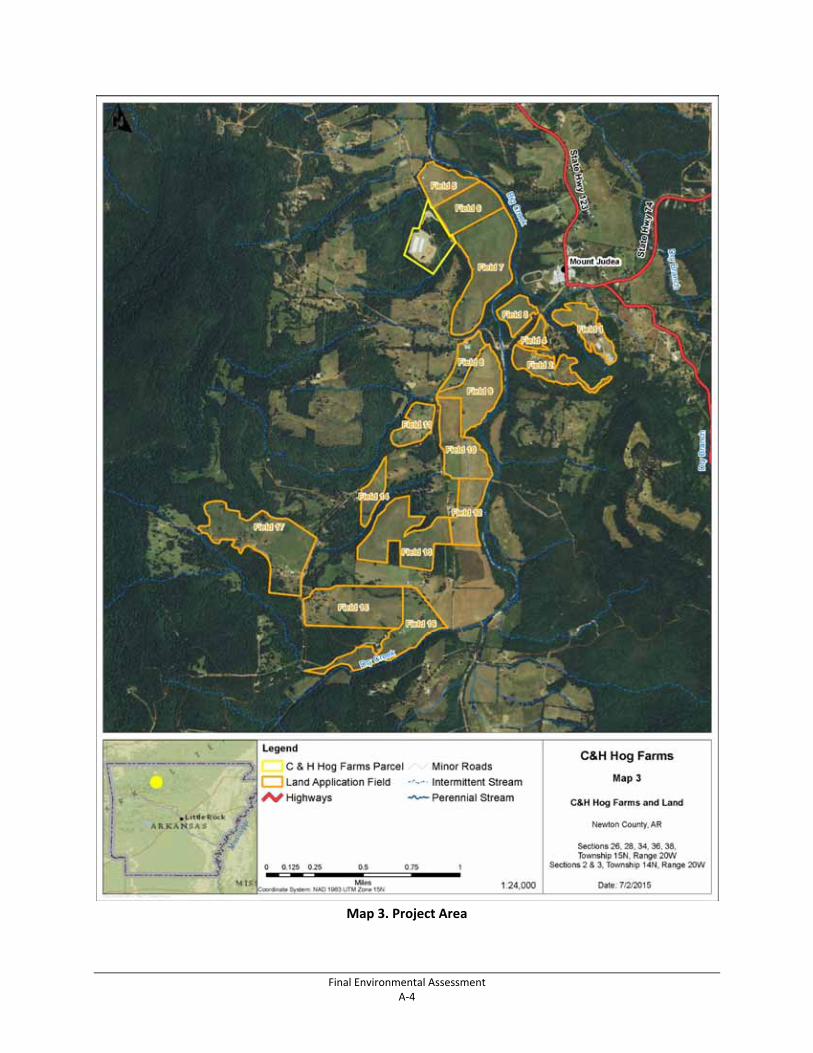
Final Environmental Assessment A‐4
Map 3. Project Area
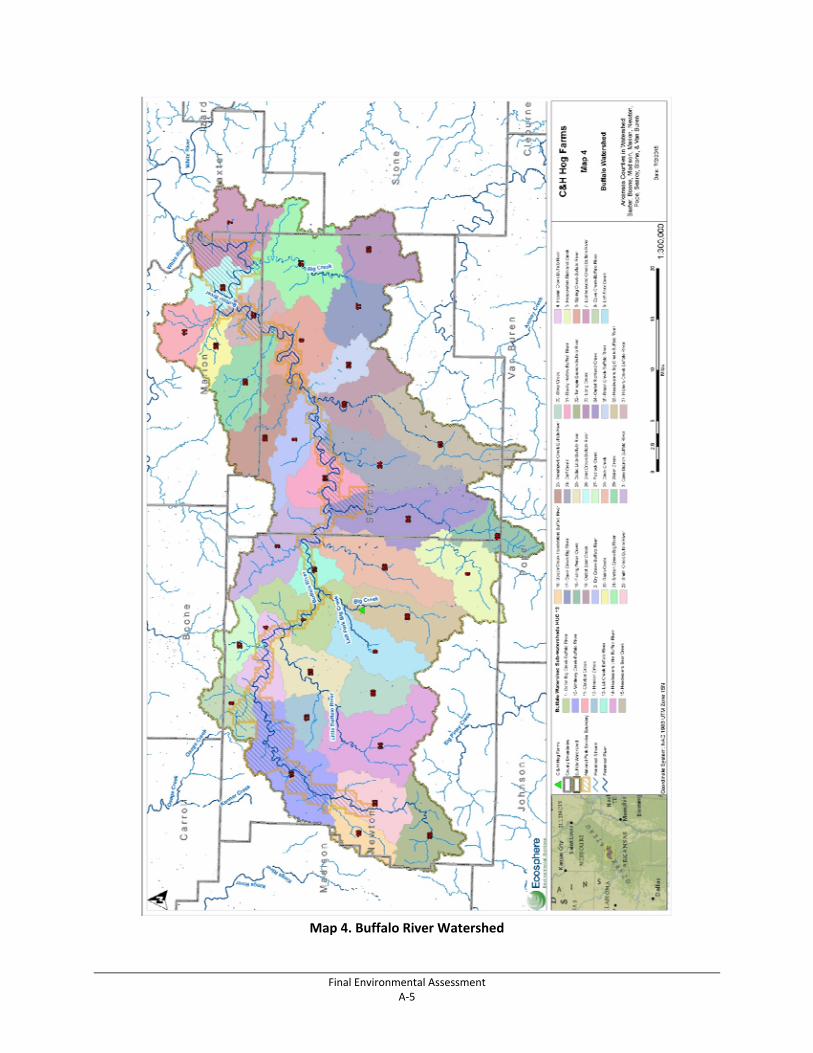
Final Environmental Assessment A‐5
Map 4. Buffalo River Watershed
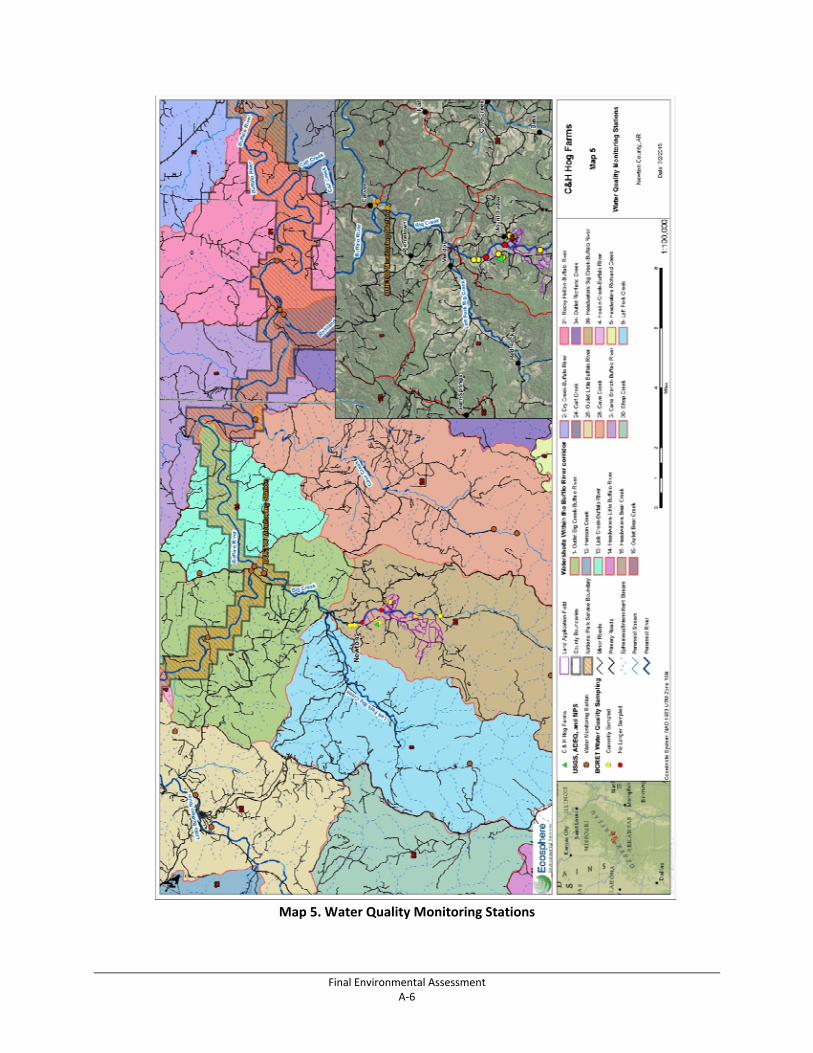
Final Environmental Assessment A‐6
Map 5. Water Quality Monitoring Stations
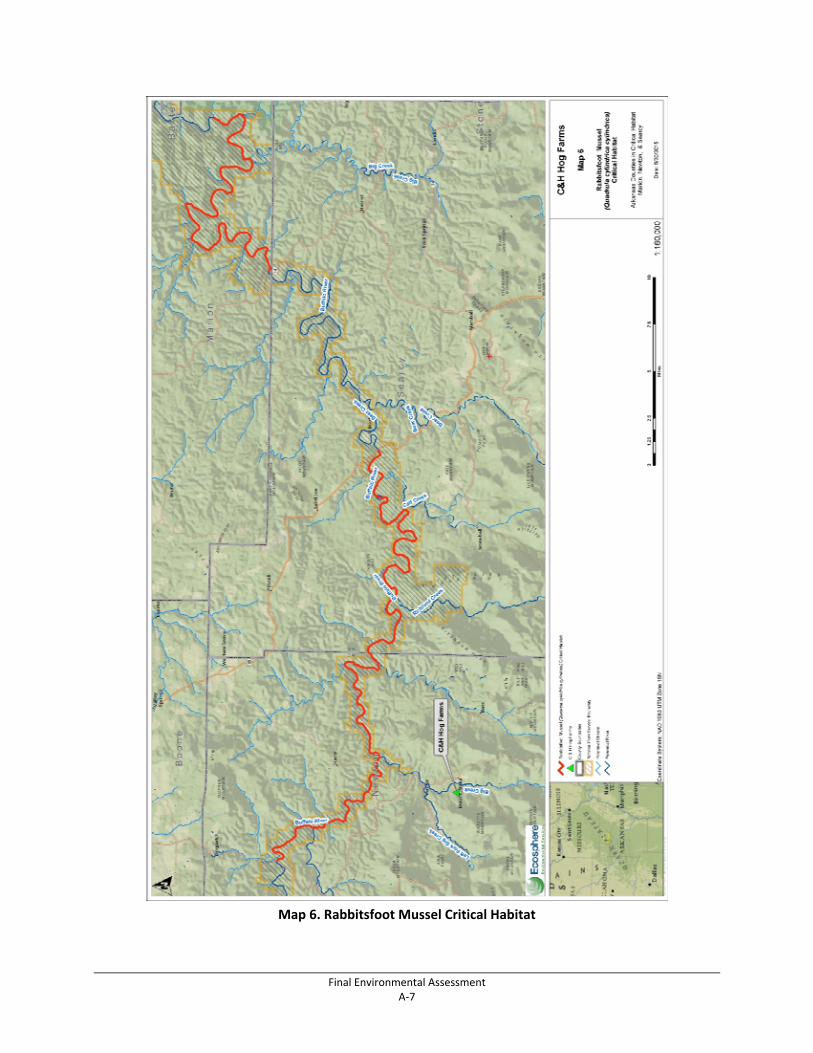
Final Environmental Assessment A‐7
Map 6. Rabbitsfoot Mussel Critical Habitat
Final Environmental Assessment B‐1
Appendix B – Comment Summary Report
COMMENT SUMMARY REPORT
DRAFT ENVIRONMENTAL ASSESSMENT FOR C&H HOG FARMS
DECEMBER 2015
Comment Summary Report for Draft EA for C&H Hog Farms
December 2015 i
TABLE OF CONTENTS
1. Introduction ............................................................................................................................................ 1
2. Public Involvement ................................................................................................................................ 2
3. Summary of Comments ......................................................................................................................... 3
3.1 National Environmental Policy Act Process ................................................................................... 3
Environmental Impact Statement ................................................................................................. 3
Risk, Worst Case Scenario ........................................................................................................... 3
No Action Alternative .................................................................................................................. 4
Additional Alternatives ................................................................................................................. 4
Permit Modifications .................................................................................................................... 6
Hard Look ..................................................................................................................................... 6
Hay and Pasture Management before C&H Hog Farms ............................................................... 6
Mitigation Measures ..................................................................................................................... 7
Reliance on NPDES General Permit Terms ................................................................................. 7
Cumulative Impacts ...................................................................................................................... 8
3.2 Data and Studies ............................................................................................................................. 8
Additional Studies ........................................................................................................................ 8
Data Sources ................................................................................................................................. 8
Big Creek Research and Extension Team and Study Design ....................................................... 9
3.3 Nutrient Management Plan ........................................................................................................... 10
NMP Land Application Terms ................................................................................................... 10
Land Application Fields ............................................................................................................. 11
3.4 Manure Storage Ponds .................................................................................................................. 11
Pond Seepage .............................................................................................................................. 11
Pond Liners ................................................................................................................................. 12
Emergency Situation ................................................................................................................... 13
3.5 Surface Water ............................................................................................................................... 13
Water Quality ............................................................................................................................. 13
BCRET Monitoring Fields ......................................................................................................... 14
BCRET Control Sites ................................................................................................................. 14
Other Water Quality Data ........................................................................................................... 14
Nitrates........................................................................................................................................ 15
Ammonia .................................................................................................................................... 17
Comment Summary Report for Draft EA for C&H Hog Farms
December 2015 ii
Dissolved Oxygen ....................................................................................................................... 17
Nutrient spikes ............................................................................................................................ 18
E. coli .......................................................................................................................................... 18
Phosphorus.................................................................................................................................. 20
Degradation from Runoff ........................................................................................................... 20
Antidegradation Policy ............................................................................................................... 20
Floodplains ................................................................................................................................. 21
3.6 Ground Water and Karst ............................................................................................................... 21
Water Well Contamination ......................................................................................................... 21
Groundwater Movement ............................................................................................................. 21
Karst ........................................................................................................................................... 22
Karst in Application Fields ......................................................................................................... 23
3.7 Protected Species .......................................................................................................................... 23
Endangered Species Act Consultation ........................................................................................ 23
Impacts to Threatened and Endangered Bats .............................................................................. 24
Impacts to Threatened and Endangered Mussels ........................................................................ 24
Species of Greatest Conservation Concern ................................................................................. 25
3.8 Air Quality .................................................................................................................................... 25
Air Quality .................................................................................................................................. 25
Green House Gas and Climate Change ...................................................................................... 26
3.9 Social Issues .................................................................................................................................. 26
Odor ............................................................................................................................................ 26
Public Health .............................................................................................................................. 28
Tourism Economy ...................................................................................................................... 28
Poverty and Environmental Justice. ........................................................................................... 29
Property Value ............................................................................................................................ 29
4. References ............................................................................................................................................. 31
Newspaper Notices ........................................................................................................... A-1
Comment Summary Report for Draft EA for C&H Hog Farms
December 2015 iii
List of Tables
Table 1. Newspapers and dates of publication of notice of Draft EA availability for review and comment .................................................................................................................................. 2
Table 2. Land use in the Big Creek watershed and sub-watersheds ........................................................... 15 Table 3. Comparison of nitrate concentrations measured at the upstream and downstream sites pre and
post C&H Hog Farms operation (9/15/13-6/1/15) ....................................................................... 16
List of Figures
Figure 1. Dissolved oxygen levels at Bear Creek near Silver Hill, AR ...................................................... 17 Figure 2. Dissolved oxygen levels at Big Creek at Carver, AR .................................................................. 18 Figure 3. E. coli numbers compared to precipitation and turbidity at the BUFT06 monitoring site .......... 19
Abbreviations and Acronyms
ADEQ Arkansas Department of Environmental Quality AUM animal unit month BA Biological Assessment BCRET Big Creek Research and Extension Team BMP best management practices CAFO concentrated animal feeding operation CEQ Council on Environmental Quality CFR Code of Federal Regulations CO2e carbon dioxide equivalent DO dissolved oxygen EA Environmental Assessment EIS Environmental Impact Statement EPA United States Environmental Protection Agency ERI Electrical Resistivity ESA Endangered Species Act FSA Farm Service Agency GHG greenhouse gas HDPE high density polyethylene kg kilograms mg/L milligrams per liter ml milliliter mpn most probable number NEPA National Environmental Policy Act NMP Nutrient Management Plan NOA Notice of Availability NPDES National Pollutant Discharge Elimination SystemNPS National Park Service P phosphorus SBA Small Business Administration T&E threatened and endangered USFWS United States Fish and Wildlife Service USGS United States Geological Survey
Comment Summary Report for Draft EA for C&H Hog Farms
December 2015 1
1. INTRODUCTION
This report provides a summary of comments received following the publication of the Draft Environmental Assessment (EA) prepared by the Farm Service Agency (FSA) and Small Business Administration (SBA) (Agencies) to determine the potential effects of and identify any additional reasonable alternatives to the operation of C&H Hog Farms. The EA was prepared jointly by FSA and SBA (the Agencies) in accordance with the National Environmental Policy Act (NEPA) (Public Law 91-190), implementing regulations adopted by the Council on Environmental Quality (CEQ) (40 Code of Federal Regulations [CFR] 1500-1508), and Agency rules and regulations. This comment summary report provides an overview of the project public involvement process and a summary of issues raised in comments and responses to those issues. It is appended to the Final EA for C&H Hog Farms as recommended in 40 CFR 1503.4.
Comment Summary Report for Draft EA for C&H Hog Farms
December 2015 2
2. PUBLIC INVOLVEMENT
The Draft EA was available for public review and comment for 30 days, from August 6 through September 4, 2015. A public meeting was held at the Jasper School, located on South Street off Highway 7 in Jasper, Arkansas on Thursday, August 27, 2015 from 6 to 9 pm. Notice that the Draft EA was available for public review and that a public meeting would be held, as well as instructions on providing comments on the Draft EA, was published in the Arkansas Democrat-Gazette, Harrison Daily Times (daily newspapers), and the Newton County Times (weekly newspaper).Table 1 provides the newspapers and the dates the NOA was published. Copies of the advertisements are provided in Attachment A. Copies of Draft EA were made available at the Arkansas State FSA Office, the Boone County (which serves Newton County) FSA Office, the Newton County Library, and on the FSA NEPA website (http://www.fsa.usda.gov/FSA/webapp?area=home&subject=ecrc&topic=nep-cd). Agencies and stakeholders parties were notified by letter of the availability of the Draft EA for review and comment in compliance with 7 CRF 1940.331.
Table 1. Newspapers and dates of publication of notice of Draft EA availability for review and comment
Newspaper Dates of Publication
Arkansas Democrat-Gazette August 5, 6, and 7, 2015
Newton County August 5 and 12, 2015
Harrison Daily August 5, 6, and 7, 2015
At the public meeting, a presentation was given that described the project, the NEPA process, and the findings of the EA. At the conclusion of the presentation, meeting participants were given the opportunity to provide a verbal comment. A court reporter recorded the meeting so that all comments were accurately transcribed for consideration. Attendees were asked to sign in at the welcome table and to indicate whether they would like to provide a verbal comment at the meeting; however, this was not a requirement. Fifty-six individuals signed in at the meeting.
In addition to verbal comments recorded at the public meeting, written comments on the Draft EA were accepted by email and mail during the 30-day public comment period. All comments received or postmarked on or before September 4, 2015 were reviewed and considered in the preparation of the Final EA.
Comment Summary Report for Draft EA for C&H Hog Farms
December 2015 3
3. SUMMARY OF COMMENTS
Eighteen people provided comments at the public meeting and 1,828 letters were received during the public comment period. Comments included form letters (1,716), individually prepared statements, State and Federal agency comments, information and literature reviews, and statements submitted on behalf of interest groups. All comments fell into a number of categories, which are described in the following sections along with responses and a description on any changes that were made to the EA. Factual and typographical errors were corrected in the Final EA.
3.1 National Environmental Policy Act Process
Environmental Impact Statement
Comment: An Environmental Impact Statement (EIS) should have been/should be prepared. The farm will have significant impacts. The context and intensity of a large concentrated animal feeding operation (CAFO) in the Buffalo River watershed demand a conclusion of significant impacts and the preparation of an EIS based on 40 CFR 1508.27.
Response: EISs are prepared for “major Federal actions significantly affecting the quality of the human environment” [Section 102(2)(C) of the NEPA]. 40 CFR 1508.27 refers to the context and intensity of impacts, rather than how common or unique a proposed action is. Through the development of an EA, in accordance with in 40 CFR 1508.9, the Agencies have determined that the preparation of an EIS is not appropriate because the EA has revealed no significant effects are expected to result from operation of the farm.
Change to the EA: No change.
Risk, Worst Case Scenario
Comment: Several comments were received that related to the risk of a catastrophic event (collapse or breach of holding ponds, severe weather event) that would result in adverse impacts on water quality, tourism, the economy.
Response: NEPA does not require analysis of a worst case scenario, rather it requires an assessment of the reasonably foreseeable impacts of a proposed action. The Agencies have determined that given the engineering design of the site, including the 50 percent greater than required capacity of the holding ponds, the protective terms and conditions of the National Pollutant Discharge Elimination System (NPDES) General Permit, and the review of the available science, that such a scenario is not reasonably foreseeable.
The waste storage ponds are engineered per the USDA-NRCS National Engineering Handbook Part 651 Agricultural Waste Management Field Handbook in accordance with the Arkansas Pollution Control and Ecology Commission Regulation 6.202(B) (ADEQ 2013). The ponds have been engineered and constructed to avoid a breach even at maximum capacity. As noted in Burkholder et al. (1997), incidents of ponds rupturing or overflowing in North Carolina during the 1990s were related to poor design,
Comment Summary Report for Draft EA for C&H Hog Farms
December 2015 4
inadequate liners, improper management, no or minimal monitoring, and/or post construction pond modification that weakened the pond structure.
As is described in the EA, land application is planned and carried out to prevent the holding pond levels from rising above the Must Pumpdown level. The entire waste management system is inspected weekly, and following rainfall events, to record the depth of water in the evaporative ponds, inspect risers and pipes, check the waste ponds for signs of leaking or seepage, excessive settling, damage from vehicles or other equipment, rodents, or erosion.
There is no potential risk from Big Creek flooding the ponds because of the distance to the creek and because the ponds are elevated well above the creek.
Because the ponds are designed to divert stormwater from entering the ponds, during a rainfall event the amount of water entering the ponds would be limited to what is falling directly over the ponds. This further minimizes the potential for the ponds to overflow. The ponds have much greater capacity than a 25-year, 24 hour flood event (6.96 inches rainfall). The amount of rainfall in a 100-year, 24-hour storm event would be approximately 8.48 inches (NOAA 2015). The 1 foot of freeboard above the 25-year, 24-hour storage level has a volume greater than 425,000 gallons. Based on the total square footage at the top of the ponds, 1 inch of rainfall would equate to approximately 35,000 gallons. Including the freeboard, the ponds have sufficient storage to hold the volume generated by a 100-year, 24-hour storm event.
Change to the EA: No change.
No Action Alternative
Comment: The No Action Alternative should consider that the farm is not built and operating. The No Action and Proposed Action should not be the same. The existing condition cannot/should not be used as the baseline.
Response: As discussed in Section 1.2 of the EA, the Agencies cannot affect the closure of the facility, nor the details of its operating permit, which are overseen by the Arkansas Department of Environmental Quality (ADEQ), the agency to which the United States Environmental Protection Agency (EPA) has delegated authority for administering Section 402 NPDES of the Clean Water Act. The No Action Alternative as described in Sections 1.2 and 2.1 of the EA, would involve “no change from current management direction,” pursuant to CEQ guidance provided in question 3 of its Executive Office of the President Memorandum to Agencies: Forty Most Asked Questions Concerning CEQ’s National Environmental Policy Act Regulations (1981). In this case, the No Action Alternative is the continued operation of the farm under the terms of its NPDES General Permit. To ensure that the effects of the farm’s operation are considered, historic data are used where available to characterize conditions before the farm was built. See responses below under heading “Hard Look.”
Change to the EA: No change.
Additional Alternatives
Comment: Several commenters stated that NEPA requires alternatives in addition to the Proposed Action. Comments related to this topic include the following.
Comment Summary Report for Draft EA for C&H Hog Farms
December 2015 5
40 CFR 1502.14(c) and 40 CFR 1508.25(b)(2) require actions ‘not within the jurisdiction of the agency’ to be included and require ‘other courses of action’ be considered, respectively.
Farm Service Agency NEPA regulation (7 CFR 1940) was also cited as stating Class II EAs must: “[d]iscuss the feasibility of alternatives to the project and their environmental impacts,” including “(a) alternative locations, (b) alternative designs, [and] (c) alternative projects having similar benefits.”
Closure of the farm should be an alternative. The draft EA provides no information on whether to back the loan guarantees with additional
conditions, because no such additional conditions are considered in the analysis of alternatives.
Response: 40 CFR 1502.14(c) and 1508.25(b)(2) refer to preparation of EISs. EISs are prepared for “major Federal actions significantly affecting the quality of the human environment” [Section 102(2)(C) of the NEPA]. 40 CFR 1502.2(e), which also applies to the preparation of EISs, states “the range of alternatives discussed in environmental impact statements shall encompass those to be considered by the ultimate agency decision-maker.” As clarified in question 2b of CEQ’s Executive Office of the President Memorandum to Agencies: Forty Most Asked Questions Concerning CEQ's National Environmental Policy Act Regulations (1981) “an alternative that is outside the legal jurisdiction of the lead agency must still be analyzed in the EIS if it is reasonable.”
Alternatives must meet the purpose and need for the proposed action. In the case of this EA, as described in Section 1.3 of the EA, the purpose is to determine whether the Agencies will continue to provide backing to loans made to C&H Hog Farms. The need for the action relates to the Agencies’ responsibilities under their respective loan programs. The loan applicants found land for sale in their community and applied for loans to purchase the land and construct the farm facilities. The lender sought backing of those loans from FSA and SBA. It would be unreasonable and beyond the scope of the agencies’ loan programs to identify or ask a loan applicant to identify other land for sale.
As discussed in Section 1.2 of the EA, the Agencies cannot affect the closure of the facility, nor the details of its operating permit, which are overseen by the ADEQ, the agency to which the EPA has delegated authority for enforcing the Clean Water Act. The Agencies consider closure of the farm as a result of their decision to be exceedingly speculative and unreasonable.
The cited FSA requirement is from 7 CFR 1940.302(h) which defines practicable alternatives as: “an alternative that is capable of attainment within the confines of relevant constraints…practicability depends upon the particulars of the situation under consideration.” In the case of C&H Hog Farms’ loan guarantees, the Agencies are responding to a specific request from a lending institution, as is their responsibility under their loan programs.
As stated in Section 1.4 of the EA, the decision to be made by the Agencies is whether to: void loan guarantees, continue to back loan guarantees on existing terms, to back loan guarantees with additional conditions, or to undertake an EIS. The Agencies, through the process of preparing this EA have determined that no additional conditions are necessary to ensure significant effects do not occur. Had the evaluation indicated that additional terms or mitigations were required, these could have been adopted as part of the Proposed Action.
Change to the EA: No Change.
Comment Summary Report for Draft EA for C&H Hog Farms
December 2015 6
Permit Modifications
Comment: Modifications to the farm’s original NPDES permit should be part of the Proposed Action and not the No Action Alternative since these modifications occurred after the court’s December 2, 2014 ruling.
Response: The farm operates under the terms of a NPDES General Permit issued by the ADEQ, the agency to which EPA has delegated its authority in Arkansas to administer the NPDES permit program. As detailed in Section 1.1 of the EA, ADEQ has received three requests to modify the C&H Hog farms NPDES General Permit. Two of these modifications have been approved following an evaluation process by ADEQ (including public comment periods and public meetings). The third request is currently being evaluated. These modifications are outside the decision-making authority of SBA and FSA, which have prepared an EA with the purpose of helping the Agencies decide whether to reinstate or vacate loan guarantees. As such, the Proposed Action must reflect the current operation of the farm so that the effects of its operation can be evaluated. The No Action Alternative as described in Sections 1.2 and 2.1 of the EA would involve “no change from current management direction,” as described by CEQ (1981) in question 3 of its Executive Office of the President Memorandum to Agencies: Forty Most Asked Questions Concerning CEQ’s National Environmental Policy Act Regulations. In this case, that is the operation of the farm under the terms of its NPDES General Permit.
Change to the EA: No change.
Hard Look
Comment: The EA must take a hard look at conditions before the farm was built.
Response. The EA uses historical data to meet NEPA’s hard look mandate. Section 1.3 states: “given that the facilities have been constructed and are currently in operation, it is not possible to conduct fieldwork or sampling to characterize conditions as they were prior to the land acquisition and construction that occurred in 2012 and 2013, and ongoing operations, which commenced in April of 2013. In order to meet the “hard look” mandated by NEPA and show the impact of the C&H facility, Chapter 3 of this document uses historical data, where they are available, to characterize the pre-construction environmental conditions. Data gathered after that time are used as well to characterize impacts.” Such available data are used in Chapter 3 of the EA.
Change to the EA: No change.
Hay and Pasture Management before C&H Hog Farms
Comment: It is not appropriate to state that waste application fields have historically been fertilized at unmanaged rates without setbacks/buffers or protective measures. Landowners are still free to apply fertilizer from sources other than C&H Hog Farms.
Response: The court required the agencies to take a “hard look” at the impacts of the farm. That hard look requires using available data and information that provide information on pre-construction conditions (that is conditions that existed before C&H Hog Farms’ operation). The EA states what is known about hay and pasture management in the fields where waste from C&H can be applied in Section 2.1.2 of the EA: “It is not known how these fields were managed and maintained prior to their inclusion
Comment Summary Report for Draft EA for C&H Hog Farms
December 2015 7
in C&H Hog Farms Nutrient Management Plan (NMP). Because they lie outside the area identified by the Arkansas General Assembly as a Nutrient Surplus Area, development of NMPs is not required (Arkansas Code § 15-20-1104). It is likely that they were periodically seeded, cut, tilled, and fertilized to maximize forage value. Because the fields were not governed by terms of an NMP, soil testing prior to application of fertilizer was not required nor were setbacks, timing restrictions, or any of the operating requirements that C&H Hog Farms must follow. The frequency, application rate, location, timing, and application method of fertilizer not derived from C&H Hog Farms is not known.”
It is true that owners of the C&H Hog Farms land application fields are free to apply fertilizers from other sources. However, land application of manure from C&H Hog Farms is governed by the terms of its NPDES General Permit and its NMP, which require use of the Arkansas Phosphorus (P)-Index to calculate rates of application. The Arkansas P-Index takes into account a number of factors including soil chemistry, which is tested prior to each land application of manure from C&H. When soil phosphorus levels are elevated (by the application of fertilizer regardless of source) the application rate of manure from C&H is lowered to ensure the risk of runoff of phosphorus is low and the nutrient is effectively taken up by plants. Essentially, soil sampling and analysis and calculation of manure application rates prior to application ensure that the risk of runoff of phosphorus from fields where manure from C&H is applied is low.
Change to EA: Language has been added to clarify where necessary.
Mitigation Measures
Comment: Several comments stated that no mitigation measures are prescribed by the EA. NEPA and FSA regulations require consideration of means to mitigate adverse environmental impacts.
Response: Through development of the EA, the Agencies have considered mitigations, as required by 40 CFR 1508.20 and 7 CFR 1940.318(g), and have determined that no mitigations are required, as is noted in Chapter 3 of the EA. The terms of C&H Hog Farm’s NPDES General Permit are issued by the ADEQ, the permitting agency, and are designed to minimize impacts to water resources and the surrounding community. The EA refers to these as Operating Requirements (see Section 2.1.3 of the EA). Effectively, the operating requirements are mitigation measures built in to the Proposed Action and meet the standard of “reducing or eliminating the impact over time by preservation and maintenance operations during the life of the action” [40 CFR 1508.20(d)]. These are included as part of the No Action and Proposed Action because they apply to the farm regardless of FSA and SBA relationship to the farm.
Change to the EA: No change.
Reliance on NPDES General Permit Terms
Comment: The EA relies on NPDES General Permit terms to conclude that protective measures are in place that will prevent impacts.
Response: In order to evaluate the potential effects of their decision to continue to provide guarantees to loans made to C&H Hog Farms or to vacate those loan guarantees, the Agencies have examined the effects of the Farm’s operation under the terms of its NPDES General Permit. The NPDES General Permit (and the NMP that is part of it) contains a number of protective measures that are designed to prevent impacts. Compliance with terms of the NPDES General Permit is required if the farm is to remain
Comment Summary Report for Draft EA for C&H Hog Farms
December 2015 8
open. As such, these protective measures are part of the alternatives evaluated in the EA. The Agencies must rely on the permitting authority and expertise of the State and Federal agencies charged with protection of the human environment under Federal regulations and related State regulations. As such, they have determined that compliance with Federal and State regulations protecting the human environment supports the determination that the farm would cause no significant impacts. The farmers have constructed ponds with a 50 percent greater capacity than what regulations require. Additionally, they have applied to install high-density polyethylene liners under the ponds and a cover and methane flare on pond one to allay concerns about contamination and odor.
Change to the EA: No change.
Cumulative Impacts
Comment: EA does not adequately cover cumulative impacts. There will be cumulative impacts to water and air quality, threatened and endangered species, environmental justice.
Response: Section 4.2 of the EA has been revised to further discuss the potential cumulative impacts to those resources carried forward for detailed analysis.
Change to EA: Section 4.2 of the EA has been revised.
3.2 Data and Studies
Additional Studies
Comment: Several commenters suggest that additional environmental testing and study should be done including isotope tracing, DNA/genetic marking, microbial tracers, electrical resistivity or ground penetrating radar surveys on other fields that have not been studied, among others.
Response: In some cases, data and information that are required by agencies in evaluating reasonably foreseeable significant adverse effects may not be available. When such information is essential, supportive studies and surveys can be conducted and incorporated into NEPA documentation in order to provide information necessary for agencies to make their decisions (7 CFR 1502.22). In the case of C&H Hog Farms, the Agencies have determined that available data are sufficient to make a determination that no significant impacts are expected to result from the proposed action.
Change to the EA: No change.
Data Sources
Comment: Some comments recommend the use of unpublished data, state that data were excluded from the EA, that the EA relies on Big Creek Research and Extension Team (BCRET) reports to the exclusion of other data.
Response: 40 CFR 1502.24 requires Agencies preparing NEPA documents to “insure the professional integrity, including scientific integrity, of the discussions and analyses.” In preparing this EA, the Agencies have used the best scientific information that is available. This includes: published peer reviewed primary literature; reports from land and resource management agencies including management plans, EAs, and compliance documents; and reviewed data and information gathered from agencies
Comment Summary Report for Draft EA for C&H Hog Farms
December 2015 9
though standard coordination and consultation processes. Some information referenced in the public comments is not included in the Final EA because it does not meet these standards.
Dr. John Van Brahana provided a comment on the Draft EA that referenced an experiment conducted near the C&H barns and application fields. Dr. Van Brahana’s comment, along with a preliminary white paper and PowerPoint presentation available online, were reviewed. The experiment involved injecting dye into a “dug well” and then observing the dye in nearby springs and surface waters to identify the direction and velocity of subsurface water flow. While scientific methodology, assumptions, and data are not provided, the available documents state that preliminary calculations at the locations where the experiment was conducted indicate rapid subsurface flow and a connection to surface water. Water quality data collected by the Karst Hydrogeology of the Buffalo National River (Dr. Van Brahana’s team) is not available through the USGS or EPA water quality databases. Sections 3.2.2 and 3.2.3 of the EA present surface water quality data collected by the NPS and BCRET before and after construction of the farm and collected upstream and downstream after construction of the farm and demonstrate no change in surface water quality.
The Draft EA included water quality data from the BCRET study because it is an independent, in-depth case study that focuses specifically on C&H Hog Farms. The team includes internationally recognized experts in the fields of agricultural impacts to water quality, livestock nutrient management, soil quality and sustainability, and ecosystems including scientists from the University of Arkansas System Division of Agriculture, United States Geological Survey (USGS) specialists, and Newton County Extension agents.
In response to comments, the following additional data are included the Final EA:
Surface water quality data collected by the National Park Service (NPS) monitoring station BUFT06. The Draft EA discussed these data.
The United States Fish and Wildlife Service (USFWS) provided additional Threatened and Endangered (T&E) species occurrence data in August and September 2015 derived from surveys conducted in August and September 2015, after the publication of the Draft EA. These data were considered in the preparation of the Final EA as well as the project Biological Assessment (BA).
Commenters suggested that odor complaint records should be included in the EA. These records have been searched and the text of the EA updated to reflect complaints and results of investigations.
Information from the “Preliminary Electrical Resistivity Surveys of Mount Judea Alluvial Sites, 2nd Quarter 2015 Report” (Fields and Halihan 2015) has been incorporated into the EA. This report became available after the Draft EA was available for public comment.
Change to the EA: Additional data incorporated as described.
Big Creek Research and Extension Team and Study Design
Comment: Several comments were made about the BCRET study. The study is flawed, politically directed, inadequate, the study has questionable methodologies, etc.
Response: The Agencies have no influence over the BCRET study design. The BCRET study is an independent study. The Memorandum of Agreement between the ADEQ and the University of Arkansas System Division of Agriculture, which commissioned the study states the study “shall meet the
Comment Summary Report for Draft EA for C&H Hog Farms
December 2015 10
requirements of an independent study conducted by professionals in the field of water quality.” The study was requested in the summer of 2013 by the C&H Hog Farms owners and later by the Governor of Arkansas. In September 2013, funding for the research was approved by a subcommittee of the Arkansas General Assembly. The BCRET is comprised of faculty and staff from the University of Arkansas System Division of Agriculture, USGS specialists, Newton County Extension agents, and several technicians. The team includes the region’s foremost experts, including 14 members with Doctorate degrees in the fields of agricultural impacts to water quality, groundwater, engineering, livestock nutrient management, soil quality and sustainability, and ecosystems. The team has a history of providing research and educations programs aimed at protecting the environment. The study design has been peer-reviewed by a panel of four independent, out-of-state water quality experts. While some of the expert panel’s suggestions have been implemented, others were not, given budgetary constraints or that recommendations were outside the scope of the study.
Change to the EA: No change.
3.3 Nutrient Management Plan
NMP Land Application Terms
Comment: Some comments suggested that there has been an over-application of fertilizer, an unchecked use of manure as fertilizer, that the operators are not adhering to limits of waste application set in the NMP and are applying more nutrient than crop requires, that the NMP does not include details of manure and soil sampling prior to each land application, that application is occurring during times it is not permitted (winter).
Response: As described in Section 3.2.5.2 of C&H Hog Farm’s NPDES General Permit (ARG590001), the Nutrient Management Plan for the facility uses the Narrative Approach for applying manure as fertilizer. This approach requires that application rates be calculated prior to each application. The NMP provides methodologies for soil and manure sampling and analysis.
Application rates for C&H Hog Farms are calculated using the Arkansas Phosphorus Index (P-Index) to ensure that land where manure is applied is at low risk for runoff of nutrients. This is explained ADEQ’s ‘C&H Hog Farms, Inc. Frequently Asked Questions’ (ADEQ 2015a). The P-Index is used to assess risk of phosphorus runoff from pastures and hayland as part of a NMP and to determine maximum application rates of phosphorus. The NMP allows for applications year round. Timing is a factor that is input into the P-Index calculation. Winter application is permitted, but at a reduced rate consistent with the P-Index. Plants require less phosphorus than nitrogen. Therefore, less nitrogen is being applied than is required by the crops.
Section C (Land Application Calculations) of C&H Hog Farms’ Nutrient Management Plan (ADEQ 2015b) contains the initial calculations of land application rates based on predicted waste characteristics, since at the time of the development of the NMP there was no waste to be sampled. These tables are labeled “Nutrient Management Planner” (versus Nutrient Management Plan) and contain data that were used as inputs to the P-Index calculations. Subsequently, application rates have been recalculated using the P-Index as is required by the Narrative Approach before each land application. These are reported in C&H Hog Farms’ Annual Reports as tables labeled “Nutrient Management Planner.”
Comment Summary Report for Draft EA for C&H Hog Farms
December 2015 11
There is one NMP for the facility. It was developed in 2012. The changes made to that NMP are limited to the two modification requests detailed in the EA. These resulted in modifications to the Application Equipment List in Section M (Management of Waste Storage Ponds).
As one commenter notes, inputs to P-Index can change based on soil and manure chemistry, characteristics of land where manure is applied. These inputs include slope, pasture use, timing of application, best management practices employed. This is not an inconsistency in the NMP. Rather this is how the Narrative Approach employed in the NMP is designed to be implemented—appropriate application rates are calculated prior to each land application of manure and those rates are based on the most recent data available including soil and manure chemistry, land use, land characteristics in the areas where waste is applied.
Change to the EA: Clarification has been added to Section 2.1.2 of the EA.
Land Application Fields
Comment: Commenters stated that there are discrepancies in field size, number of fields available, and the land use of fields has changed from what was stated in the NMP.
Response: As noted in the EA, all fields that are included in the NMP are included in the EA so that the full geographic extent of the project can be assessed. If and when discrepancies are corrected by the operator and ADEQ, it is the Agencies’ understanding that these fields could be used as described in the NMP.
Regarding the land use given Table 2-1, as the EA states, those are the land uses provided in the NMP. The documents attached to the farm’s annual reports are “Nutrient Management Planner” tables (versus Nutrient Management Plan) and contain the data used in the calculation of P-Index, which is required before each land application of waste. One of the factors the P-Index uses (as seen in the Nutrient Management Planner tables) is the type of pasture use (hayland, rotational grazing, continuously grazed at less than 0.75 animal unit month (AUM), or continuously grazed at greater than 0.75 AUM) so that changes to land use can be taken into account when calculating appropriate application rates.
Change to the EA: No change.
3.4 Manure Storage Ponds
Pond Seepage
Comment: There are no data on actual pond seepage.
Response: Seepage from the holding ponds is expressed in terms of maximum rates allowable under terms of NPDES General Permit. The maximum rate is based on the hydraulic pressure exerted on liners when ponds are full. In reality, the terms of the NPDES General Permit requires liquid levels in the ponds be below the “Must Pumpdown level,” which equates to 6.5 feet below the top of the pond. Allowable leakage rates, along with permeability, liquid limit, and plasticity index values of soils, were factors used in determining the suitability of in-situ soils for the liner and in calculating the thickness of pond liners. There are no data available on actual rates of seepage. BCRET has installed an interceptor trench on the slope below the ponds to detect seepage.
Comment Summary Report for Draft EA for C&H Hog Farms
December 2015 12
Post construction certification of the soils showed permeability met the allowable seepage rate to be protective of groundwater. The results of this soil testing were submitted and are available on the ADEQ website. Clays with variable and generally low chert or sand content as indicated in the geotechnical report (ADEQ 2012) would suggest low hydraulic conductivity and low propensity for vadose zone leaching of agricultural contaminants.
Water quality monitoring has been ongoing in the trench placed below the ponds, which was designed to intercept any subsurface flow of seepage moving along a restricting or less permeable layer. The mean concentrations of total nitrogen and phosphorus, and the electrical conductivity from water sampled from the trench are being monitored. Any seepage from the ponds would be expected to have similar concentrations of total nitrogen and phosphorus, and electrical conductivity properties. However, the water quality sampled in the trench is significantly different from the slurry composition and does not show any elevated values, indicating that there is no measurable seepage from the pond.
Change to the EA: Language and data have been added to the EA to clarify monitored water quality parameters at the trench in comparison to the manure slurry.
Pond Liners
Comment: The EA should describe removal of sludge that would have to occur before pond liners are installed. How will bubbles beneath liner be prevented? The liners will leak. Will there be leak detection technology installed?
Response: Under the terms of the existing NPDES General Permit, C&H Hog Farms monitors sludge depth and periodically removes sludge from the ponds, as needed. Methods for removing sludge and the frequency of removing sludge are not specified in the Farm’s permit. This is in compliance with ADEQ regulations. To slow the accumulation of sludge in the pond, there are agitators at the ends of the pumps that remove the waste from ponds for land application. Like the periodic removal of sludge, removing sludge prior to installation of pond liners would be governed by the terms of the NPDES General Permit, which does not specify any methodology. Like all waste from C&H, the sludge would be tested and could be land applied at rates determined by the Arkansas P-Index.
The proposed modification includes installation of a geotextile composite material between the High Density Polyethylene (HDPE) liners and the ponds’ existing clay liners. The geotextile is designed to allow gasses to travel between the clay liner and the HDPE liner and escape, preventing the formation of bubbles beneath the liner.
The HDPE pond liners would be subject to the same requirements, including seepage limitations, as the existing clay liners, under the terms of the farm’s NPDES General Permit. Seepage limitations describe the maximum allowable seepage rather than actual seepage.
There is no additional leak detection technology proposed at this time and none is required by ADEQ.
Change to the EA: Additional information on installation of pond liners has been added to the EA.
Comment Summary Report for Draft EA for C&H Hog Farms
December 2015 13
Emergency Situation
Comment: The second pond has no stabilized emergency outlet, EA assumes the ponds overtopping can be avoided by pumping wastes to a designated area, lack of equipment.
Response: According to the specifications in the USDA-NRCS National Engineering Handbook Part 651 Agricultural Waste Management Field Handbook, the pond is not required to have an outlet. Although an emergency situation is unlikely to occur given monitoring and operational requirements, Field 7 has been identified in the Plan for Pumping Waste Storage Ponds for emergency application in accordance with ADEQ regulations. Given the implementation of best management practices (BMPs), the engineered design and over-capacity of the holding ponds, it is highly unlikely that an overflow from the ponds would occur even in a severe flood event or a series of heavy rainfall events. C&H Hog Farms has sufficient equipment to operate in compliance with their NPDES General Permit.
Change to EA: No change.
3.5 Surface Water
Water Quality
Comment: Commenters suggested the farm operations are resulting in significant adverse effects to water quality, the BCRET data were “cherry picked” or incomplete.
Response: The Agencies must rely on the permitting authority and expertise of the State and Federal agencies charged with protection of water quality under the Federal Clean Water Act and related State regulations. As such, they have determined that compliance with Federal and State regulations protecting water quality supports the determination that the farm would cause no significant impact to water quality. The EA uses the best available data. Since C&H Hog Farms has been in operation since 2013, the EA did not have to predict potential impacts, rather the EA analysis was able to rely on existing data collected by an independent study specifically tailored to analyze potential water quality impacts from the farm. Not all of the BRCET data are presented in the Draft EA as not all data are needed to adequately assess water quality impacts. There are no data or other evidence to indicate that the operation of C&H Hog Farms is adversely affecting surface water quality in Big Creek. There is no indication from the monitored water quality downstream at the NPS BUFT06 station that any adverse changes to water quality are occurring that can be attributed to the farm. No measurable increases in concentrations of nitrogen, nitrates, ammonia, or phosphorus in Big Creek have been identified during the course of water quality monitoring at C&H Hog Farms over the last 21 months. Surface water quality data from both the BCRET study and the NPS do not support the conclusion that groundwater quality is being adversely affected. Monitored water quality parameters on Big Creek are well below those criteria established to protect aquatic wildlife. Additionally, a 2014 surprise inspection by the EPA, which included collection and assessment of multiple soil and water samples, did not identify any areas of concern (see Section 1.1.3 of EA).
Change to EA: No change.
Comment Summary Report for Draft EA for C&H Hog Farms
December 2015 14
BCRET Monitoring Fields
Comment: Fields monitored by BCRET are not representative. The three fields do not give representative strata of all the fields where hog waste will be applied. They do not cover all of the soil types, or geologic formations present in the spreading fields. Field 5a cannot be considered a control because data indicate it is compromised.
Response: While funding does not allow monitoring every field, the study is monitoring land necessary to conduct its research. Monitoring every field is not needed to cost-effectively conduct an accurate assessment. The fields for which the BCRET were given permission are well suited for the study. As discussed in the EA, Field 5a serves to provide data for comparative assessment because it does not receive manure applications from the C&H Hog Farm, but it is likely the landowner does fertilize the field on a routine basis using chicken litter.
Change to EA: No change.
BCRET Control Sites
Comment: The BCRET team failed to ensure that its “upstream control” station location is not compromised by multiple manure applications or local pollution.
Response: The upstream monitoring site is well upstream and up gradient of the monitoring fields and serves as a control site; it is not considered compromised by local pollution or disturbance. The upstream site is located far enough upstream of the land application fields that is not influenced by application of wastes to the fields. The downstream site is not considered to be “buffered” simply because it is immediately downstream of fields that are not subject to manure applications. All of the application fields are located upstream of the downstream monitoring site, and any contribution of nutrients or bacteria discharging from the fields would be monitored at the downstream site.
Regardless of how many applications are applied to a field in a calendar year, the applications are governed by the NMP and there is a limit to the total amount applied based on the P-Index. Multiple applications to a field do not suggest or indicate over application.
The BCRET study is independent and the Agencies have no influence over the study design.
Change to EA: No change.
Other Water Quality Data
Comment: National Park Service (NPS) water quality data were not used.
Response: National Park Service data from the BUFT06 monitoring site, which is co-located with the USGS Monitoring Station 07055814 Big Creek at Carver have been incorporated into the Final EA. They show no measurable increases in nitrate-N (nitrate plus nitrite), orthophosphate (dissolved phosphorus), and ammonia-N concentrations post-operation of the C&H Hog Farms.
Change to the EA: Summary statistics from the NPS BUFT06 site have been incorporated into the EA.
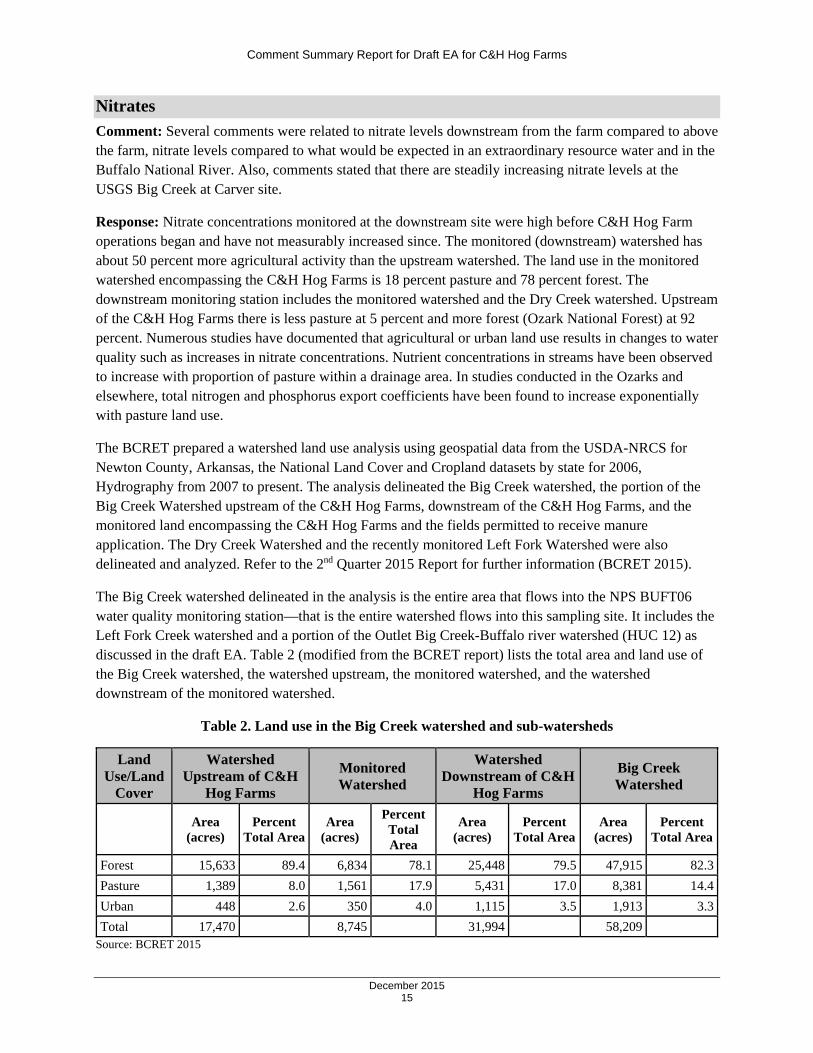
Comment Summary Report for Draft EA for C&H Hog Farms
December 2015 15
Nitrates
Comment: Several comments were related to nitrate levels downstream from the farm compared to above the farm, nitrate levels compared to what would be expected in an extraordinary resource water and in the Buffalo National River. Also, comments stated that there are steadily increasing nitrate levels at the USGS Big Creek at Carver site.
Response: Nitrate concentrations monitored at the downstream site were high before C&H Hog Farm operations began and have not measurably increased since. The monitored (downstream) watershed has about 50 percent more agricultural activity than the upstream watershed. The land use in the monitored watershed encompassing the C&H Hog Farms is 18 percent pasture and 78 percent forest. The downstream monitoring station includes the monitored watershed and the Dry Creek watershed. Upstream of the C&H Hog Farms there is less pasture at 5 percent and more forest (Ozark National Forest) at 92 percent. Numerous studies have documented that agricultural or urban land use results in changes to water quality such as increases in nitrate concentrations. Nutrient concentrations in streams have been observed to increase with proportion of pasture within a drainage area. In studies conducted in the Ozarks and elsewhere, total nitrogen and phosphorus export coefficients have been found to increase exponentially with pasture land use.
The BCRET prepared a watershed land use analysis using geospatial data from the USDA-NRCS for Newton County, Arkansas, the National Land Cover and Cropland datasets by state for 2006, Hydrography from 2007 to present. The analysis delineated the Big Creek watershed, the portion of the Big Creek Watershed upstream of the C&H Hog Farms, downstream of the C&H Hog Farms, and the monitored land encompassing the C&H Hog Farms and the fields permitted to receive manure application. The Dry Creek Watershed and the recently monitored Left Fork Watershed were also delineated and analyzed. Refer to the 2nd Quarter 2015 Report for further information (BCRET 2015).
The Big Creek watershed delineated in the analysis is the entire area that flows into the NPS BUFT06 water quality monitoring station—that is the entire watershed flows into this sampling site. It includes the Left Fork Creek watershed and a portion of the Outlet Big Creek-Buffalo river watershed (HUC 12) as discussed in the draft EA. Table 2 (modified from the BCRET report) lists the total area and land use of the Big Creek watershed, the watershed upstream, the monitored watershed, and the watershed downstream of the monitored watershed.
Table 2. Land use in the Big Creek watershed and sub-watersheds
Land Use/Land
Cover
Watershed Upstream of C&H
Hog Farms
Monitored Watershed
Watershed Downstream of C&H
Hog Farms
Big Creek Watershed
Area
(acres) Percent
Total Area Area
(acres)
Percent Total Area
Area (acres)
Percent Total Area
Area (acres)
Percent Total Area
Forest 15,633 89.4 6,834 78.1 25,448 79.5 47,915 82.3
Pasture 1,389 8.0 1,561 17.9 5,431 17.0 8,381 14.4
Urban 448 2.6 350 4.0 1,115 3.5 1,913 3.3
Total 17,470 8,745 31,994 58,209 Source: BCRET 2015
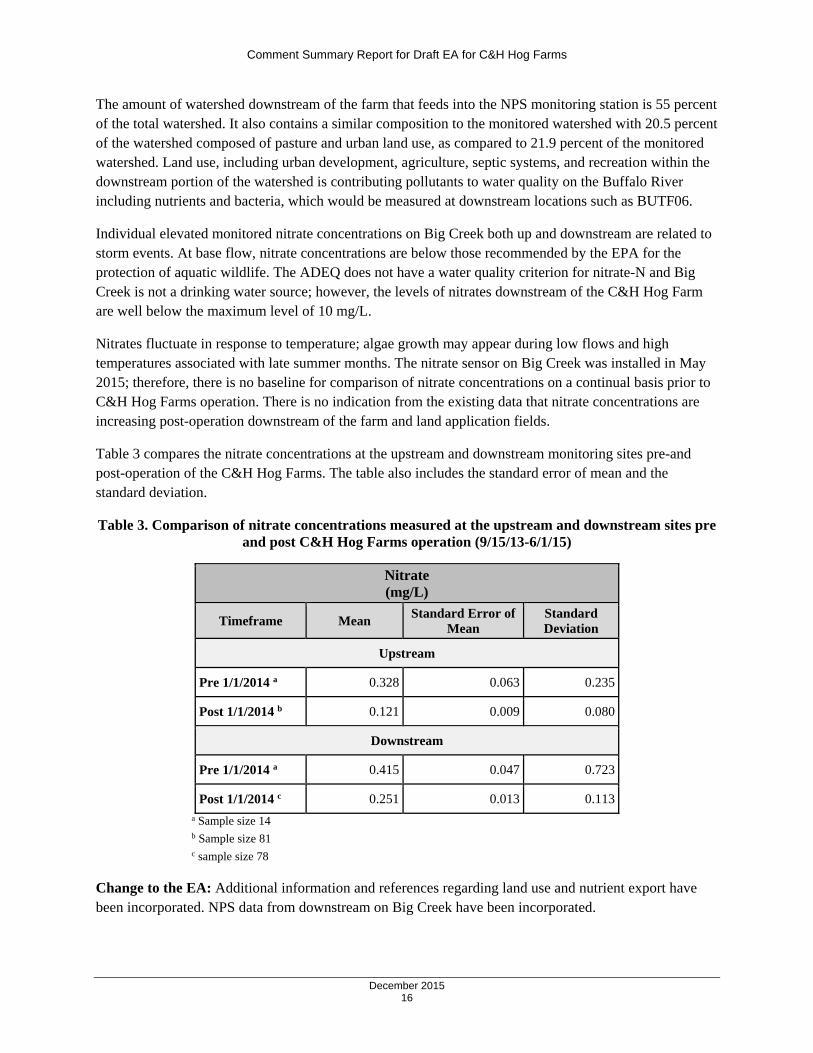
Comment Summary Report for Draft EA for C&H Hog Farms
December 2015 16
The amount of watershed downstream of the farm that feeds into the NPS monitoring station is 55 percent of the total watershed. It also contains a similar composition to the monitored watershed with 20.5 percent of the watershed composed of pasture and urban land use, as compared to 21.9 percent of the monitored watershed. Land use, including urban development, agriculture, septic systems, and recreation within the downstream portion of the watershed is contributing pollutants to water quality on the Buffalo River including nutrients and bacteria, which would be measured at downstream locations such as BUTF06.
Individual elevated monitored nitrate concentrations on Big Creek both up and downstream are related to storm events. At base flow, nitrate concentrations are below those recommended by the EPA for the protection of aquatic wildlife. The ADEQ does not have a water quality criterion for nitrate-N and Big Creek is not a drinking water source; however, the levels of nitrates downstream of the C&H Hog Farm are well below the maximum level of 10 mg/L.
Nitrates fluctuate in response to temperature; algae growth may appear during low flows and high temperatures associated with late summer months. The nitrate sensor on Big Creek was installed in May 2015; therefore, there is no baseline for comparison of nitrate concentrations on a continual basis prior to C&H Hog Farms operation. There is no indication from the existing data that nitrate concentrations are increasing post-operation downstream of the farm and land application fields.
Table 3 compares the nitrate concentrations at the upstream and downstream monitoring sites pre-and post-operation of the C&H Hog Farms. The table also includes the standard error of mean and the standard deviation.
Table 3. Comparison of nitrate concentrations measured at the upstream and downstream sites pre and post C&H Hog Farms operation (9/15/13-6/1/15)
Nitrate (mg/L)
Timeframe Mean Standard Error of
Mean Standard Deviation
Upstream
Pre 1/1/2014 a 0.328 0.063 0.235
Post 1/1/2014 b 0.121 0.009 0.080
Downstream
Pre 1/1/2014 a 0.415 0.047 0.723
Post 1/1/2014 c 0.251 0.013 0.113 a Sample size 14 b Sample size 81 c sample size 78
Change to the EA: Additional information and references regarding land use and nutrient export have been incorporated. NPS data from downstream on Big Creek have been incorporated.
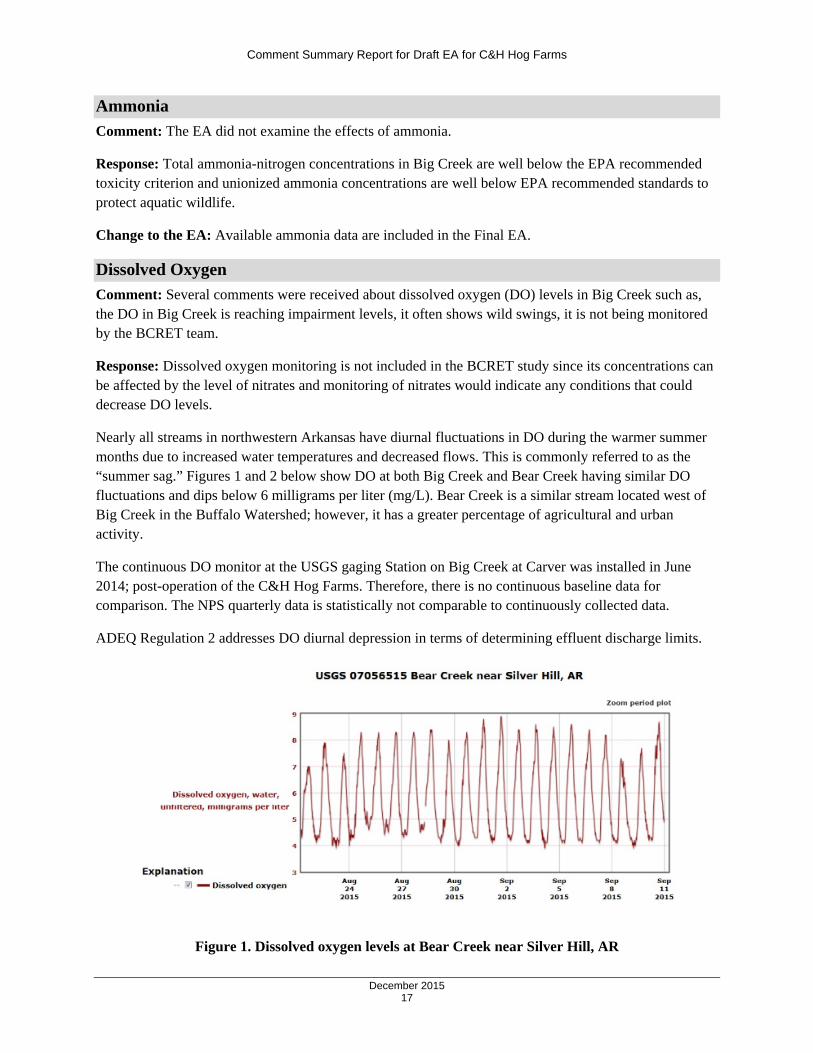
Comment Summary Report for Draft EA for C&H Hog Farms
December 2015 17
Ammonia
Comment: The EA did not examine the effects of ammonia.
Response: Total ammonia-nitrogen concentrations in Big Creek are well below the EPA recommended toxicity criterion and unionized ammonia concentrations are well below EPA recommended standards to protect aquatic wildlife.
Change to the EA: Available ammonia data are included in the Final EA.
Dissolved Oxygen
Comment: Several comments were received about dissolved oxygen (DO) levels in Big Creek such as, the DO in Big Creek is reaching impairment levels, it often shows wild swings, it is not being monitored by the BCRET team.
Response: Dissolved oxygen monitoring is not included in the BCRET study since its concentrations can be affected by the level of nitrates and monitoring of nitrates would indicate any conditions that could decrease DO levels.
Nearly all streams in northwestern Arkansas have diurnal fluctuations in DO during the warmer summer months due to increased water temperatures and decreased flows. This is commonly referred to as the “summer sag.” Figures 1 and 2 below show DO at both Big Creek and Bear Creek having similar DO fluctuations and dips below 6 milligrams per liter (mg/L). Bear Creek is a similar stream located west of Big Creek in the Buffalo Watershed; however, it has a greater percentage of agricultural and urban activity.
The continuous DO monitor at the USGS gaging Station on Big Creek at Carver was installed in June 2014; post-operation of the C&H Hog Farms. Therefore, there is no continuous baseline data for comparison. The NPS quarterly data is statistically not comparable to continuously collected data.
ADEQ Regulation 2 addresses DO diurnal depression in terms of determining effluent discharge limits.
Figure 1. Dissolved oxygen levels at Bear Creek near Silver Hill, AR
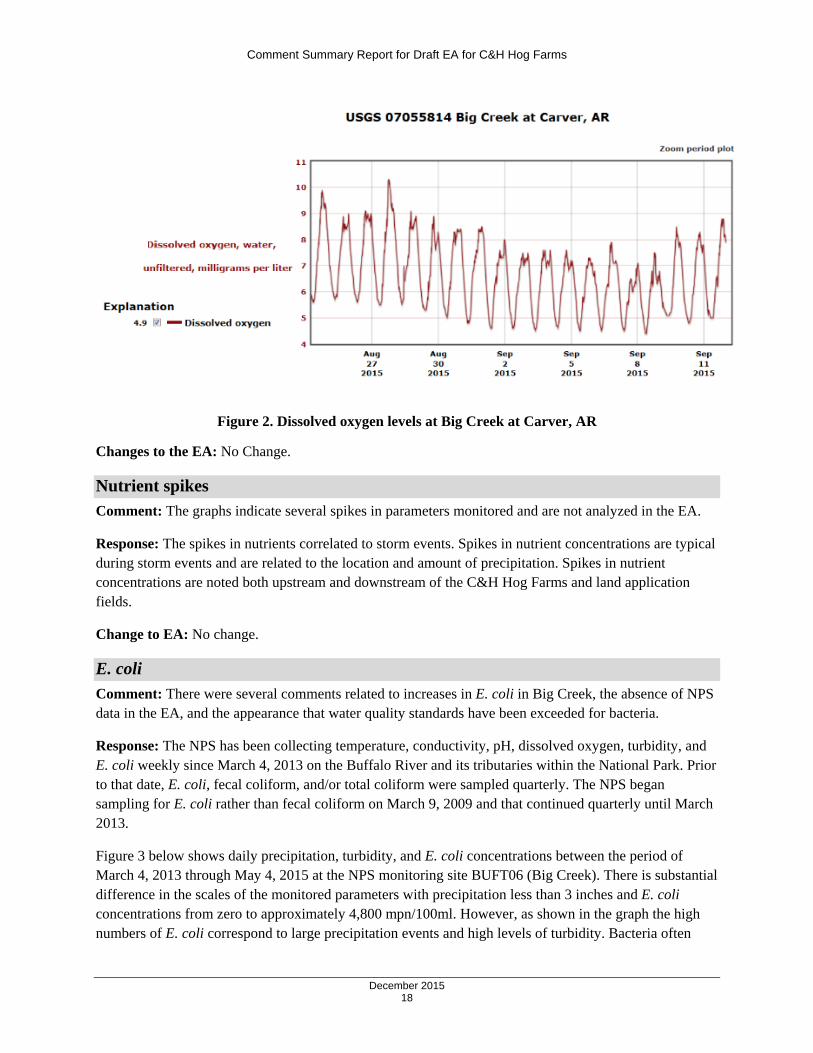
Comment Summary Report for Draft EA for C&H Hog Farms
December 2015 18
Figure 2. Dissolved oxygen levels at Big Creek at Carver, AR
Changes to the EA: No Change.
Nutrient spikes
Comment: The graphs indicate several spikes in parameters monitored and are not analyzed in the EA.
Response: The spikes in nutrients correlated to storm events. Spikes in nutrient concentrations are typical during storm events and are related to the location and amount of precipitation. Spikes in nutrient concentrations are noted both upstream and downstream of the C&H Hog Farms and land application fields.
Change to EA: No change.
E. coli
Comment: There were several comments related to increases in E. coli in Big Creek, the absence of NPS data in the EA, and the appearance that water quality standards have been exceeded for bacteria.
Response: The NPS has been collecting temperature, conductivity, pH, dissolved oxygen, turbidity, and E. coli weekly since March 4, 2013 on the Buffalo River and its tributaries within the National Park. Prior to that date, E. coli, fecal coliform, and/or total coliform were sampled quarterly. The NPS began sampling for E. coli rather than fecal coliform on March 9, 2009 and that continued quarterly until March 2013.
Figure 3 below shows daily precipitation, turbidity, and E. coli concentrations between the period of March 4, 2013 through May 4, 2015 at the NPS monitoring site BUFT06 (Big Creek). There is substantial difference in the scales of the monitored parameters with precipitation less than 3 inches and E. coli concentrations from zero to approximately 4,800 mpn/100ml. However, as shown in the graph the high numbers of E. coli correspond to large precipitation events and high levels of turbidity. Bacteria often
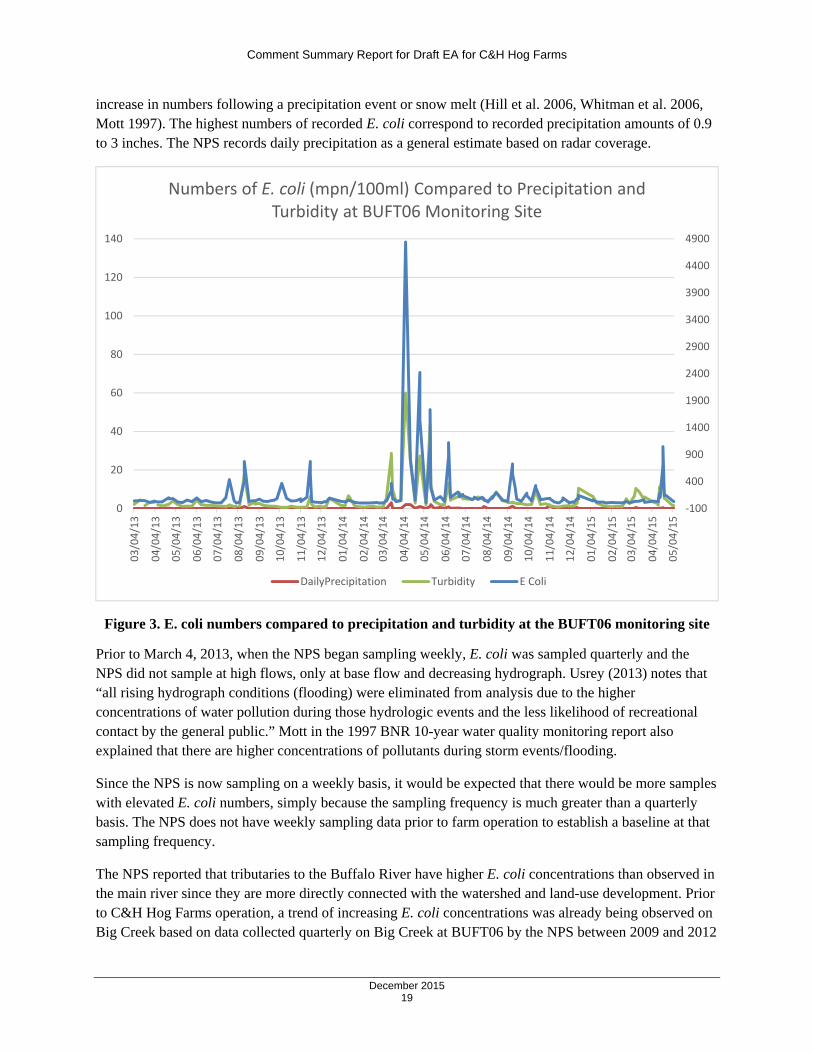
Comment Summary Report for Draft EA for C&H Hog Farms
December 2015 19
increase in numbers following a precipitation event or snow melt (Hill et al. 2006, Whitman et al. 2006, Mott 1997). The highest numbers of recorded E. coli correspond to recorded precipitation amounts of 0.9 to 3 inches. The NPS records daily precipitation as a general estimate based on radar coverage.
Figure 3. E. coli numbers compared to precipitation and turbidity at the BUFT06 monitoring site
Prior to March 4, 2013, when the NPS began sampling weekly, E. coli was sampled quarterly and the NPS did not sample at high flows, only at base flow and decreasing hydrograph. Usrey (2013) notes that “all rising hydrograph conditions (flooding) were eliminated from analysis due to the higher concentrations of water pollution during those hydrologic events and the less likelihood of recreational contact by the general public.” Mott in the 1997 BNR 10-year water quality monitoring report also explained that there are higher concentrations of pollutants during storm events/flooding.
Since the NPS is now sampling on a weekly basis, it would be expected that there would be more samples with elevated E. coli numbers, simply because the sampling frequency is much greater than a quarterly basis. The NPS does not have weekly sampling data prior to farm operation to establish a baseline at that sampling frequency.
The NPS reported that tributaries to the Buffalo River have higher E. coli concentrations than observed in the main river since they are more directly connected with the watershed and land-use development. Prior to C&H Hog Farms operation, a trend of increasing E. coli concentrations was already being observed on Big Creek based on data collected quarterly on Big Creek at BUFT06 by the NPS between 2009 and 2012
‐100
400
900
1400
1900
2400
2900
3400
3900
4400
4900
0
20
40
60
80
100
120
140
03/04/13
04/04/13
05/04/13
06/04/13
07/04/13
08/04/13
09/04/13
10/04/13
11/04/13
12/04/13
01/04/14
02/04/14
03/04/14
04/04/14
05/04/14
06/04/14
07/04/14
08/04/14
09/04/14
10/04/14
11/04/14
12/04/14
01/04/15
02/04/15
03/04/15
04/04/15
05/04/15
Numbers of E. coli (mpn/100ml) Compared to Precipitation and Turbidity at BUFT06 Monitoring Site
DailyPrecipitation Turbidity E Coli
Comment Summary Report for Draft EA for C&H Hog Farms
December 2015 20
(Usrey 2013). The amount of watershed downstream of the farm that feeds into the NPS monitoring station is 55 percent of the total watershed. It should also be noted that all urban and agricultural activities within the monitored watershed are contributing pollutants during precipitation events having large stream flows and the increased numbers cannot be directly attributable to the operation of C&H Hog Farms.
E. coli data from the BCRET study were reexamined and during the primary contact season (May 1 to September 30) in 2014, there were six exceedances upstream and seven downstream of the 410 MPN/100 mL single sample limit. Five of the exceedances upstream and six downstream were sampled during storm events. This information has been included in the Final EA.
Change to EA: The surface water quality section will be revised regarding E. coli exceedances.
Phosphorus
Comment: A comment was received that the total phosphorus levels are significantly higher than 0.02 mg/L as reported in the EA. The comment also cites data presented from the “2015 April 11-June 30 monitoring period.”
Response: As discussed in the EA (Section 3.2.2), over the course of the monitoring, with the exception of a few elevated values, the concentrations of dissolved phosphorus (P) have been below 0.02 mg/L. The actual non-weighted average of dissolved P has been 0.015 mg/L (between 1/1/2014 to 6/1/2015). The Draft EA did not report any data beyond June 1, 2015 as it was unavailable.
Change to the EA: No change.
Degradation from Runoff
Comment: Several comments were received regarding surface water degradation from runoff from Fields 1 and 12, monitored concentrations of nutrients, E. coli, and total suspended solids, in the culvert (ephemeral stream), and in the trench below the ponds.
Response: Fields used for livestock pasture, hayland, or crops are subject to greater nutrient discharge than undeveloped or forest lands. The measured runoff from these fields monitored by the BCRET are not higher than expected due to land use (ADEQ 2002, Wallace et al. 2014, among others). In comparison to before the farm operations began, there are no data to suggest that land application of wastes is resulting in surface water quality degradation. Under the Clean Water Act, pollutant discharges to waterbodies from agriculture are not subject to NPDES regulation since it is considered a non-point source. The Clean Water Act does require states to establish water quality standards and total maximum daily loads that can be used by the states to address agricultural water pollution through regulatory or non-regulatory mechanisms.
Change to the EA: No change.
Antidegradation Policy
Comment: The EA does not address the Anitdegradation Policy for Extraordinary Resource Waters.
Comment Summary Report for Draft EA for C&H Hog Farms
December 2015 21
Response: Under state regulation, Extraordinary Resource Waters shall be protected by (1) water quality controls, (2) maintenance of natural flow regime, (3) protection of instream habitat, and (4) encouragement of land management practices protective of the watershed. However, according to Arkansas Pollution Control and Ecology Commission Regulation 2.203, it is not the intent of the Extraordinary Resource Water designated use definition to imply that its status dictates regulatory authority over private land within the watershed, other than what exists under local, State, or Federal law. There are no data to indicate that operation of C&H Hog Farms is resulting in degradation of surface water quality. In compliance with the Federal Clean Water Act, the farm operates under the terms of a NPDES General Permit issued by the ADEQ, the agency to which the EPA has delegated its authority in Arkansas to administer the NPDES permit program.
Change to the EA: No change.
Floodplains
Comment: Some of the application fields are within the floodplain of Big Creek.
Response: There are no Federal Emergency Management Agency floodplain maps available for the area. While some of the application fields may be within the floodplain of Big Creek, the Proposed Action would not alter the morphology or channel characteristics of the Big Creek floodplain; therefore, floodplains were eliminated from detailed study in compliance with CEQ regulations (40 CFR 1501.7) as stated in Section 3.1 of the EA. Surface water quality impacts are discussed in Sections 3.2.2 and 3.2.3 of the EA)
Change to EA: Clarification regarding the location of application fields in relationship to the Big Creek floodplain.
3.6 Ground Water and Karst
Water Well Contamination
Comment: Several comments noted the presence of E. coli in the well water sampled.
Response: Monitoring has identified E. coli in the water obtained from the on-site well. However, the well has not been sampled at the wellhead. The BCRET team was unaware that the well pump and pipe were removed and transported for repairs and then reinstalled, creating the opportunity for contamination. Since the water is also stored in a cistern, there is also potential for contamination. The BRCET team has been in the process of changing their sampling protocol by installing a new line to sample directly at the wellhead. The ADEQ has reviewed the data from the BCRET and found the current data do not show persistent contamination of groundwater (ADEQ 2015c).
Change to EA: No change.
Groundwater Movement
Comment: Karst groundwater could bypass the downstream water quality monitoring station.
Response: Groundwater flow in karst systems often crosses the surface watershed boundaries, and does not correspond with surficial drainage basin divides (Soto 2014). Such conditions have not been
Comment Summary Report for Draft EA for C&H Hog Farms
December 2015 22
demonstrated in the southern part of the Buffalo River watershed. In general terms, unless regional units with elevation changes from the recharge to the discharge areas are present to produce cross watershed flow, the rough direction of groundwater flow in most karst aquifers is in general conformance with topography, with potential overlay of local anomalies. Thus, the Boone Formation groundwater is likely flowing toward Big Creek with a down-valley vector component, even if there is separation between the epikarst and alluvial zones and the water table in the upper Boone. Therefore, it is unlikely groundwater is bypassing the downstream monitoring station or the NPS BUFT06 monitoring station located further downstream.
Change to EA: No change.
Karst
Comment: Comments variously state features are present in the application fields, present on farm site under the ponds, Big Creek is a sinking stream, that the EA claims there is no karst.
Response: As stated in Section 3.3 of the EA, the soluble nature of limestones gives rise to karst terrain in the southern Ozarks region. Highly soluble conditions in certain areas of the Buffalo River watershed, distant from the C&H Farms, including the western and north-central parts of the watershed, have produced pervasive occurrence of karst features, including caves, sinkholes, springs, and sinking streams (Hudson et al. 2001 and Soto 2014). However, the C&H Hog Farms site and vicinity do not exhibit strongly developed karst landforms as demonstrated by a review of the Mt. Judea USGS 7.5 Minute Topographic Quadrangle Map and aerial photograph information. Our topographic and aerial photography review indicates that limited numbers of karst ponds are located on upper reaches of floodplains, where a separation of shallow perched groundwater in alluvial and epikarst (Hudson et al. 2013) from deeper groundwater in the Boone Formation may explain development of sinkhole ponds in overburden, due to dewatered secondary porosity in the underlying bedrock. Although a hydraulic connection of surface water and groundwater typifies large-scale features of the Boone Formation (Kresse et al. 2014) in areas of significant karst landform development or at streams that have incised alluvium or overburden, the western floodplain and basal hillslopes above the floodplain near the farm do not appear to match this characterization.
Parts of the Boone Formation are fairly rich in chert, and some information (Hudson et al. 2013) suggests that the C&H Hog Farms would be one of these. While the presence of chert fragments in the weathered epikarst matrix may somewhat increase local overburden permeability, its prevalence in the area points to a limestone that is more chemically resistant to dissolution due to the silica content associated with the chert. Thus, the farm and vicinity would be less susceptible to formation of large-scale karst features that would adversely affect the site suitability. The lack of large karst features observed on the topographic map also supports this expectation.
The ponds on the upper floodplain and hillslope margins have a distinctive karst appearance; however, they are modest in number and size and application of spray irrigation waste near them is prohibited by the terms of the NPDES General Permit 100 foot buffer of wetlands features. The small ponds may indeed be sinkholes, but their direct connection to the Springfield Plateau Aquifer would likely be limited, or they would be dry during dry periods.
Comment Summary Report for Draft EA for C&H Hog Farms
December 2015 23
Big Creek’s elevation and comparison to other intermittent streams on the topographic map suggest that it lies above the regional water table elevation and is therefore not a sinking stream. Sinking streams have a base that flows across a karst feature that is sufficiently large to drain the entire base-flow volume, if the underlying karst aquifer water level is below the stream elevation. That is, if a losing stream condition applies, the stream disappears into the underlying formation. A losing stream condition is one where the surface water is recharging the underlying aquifer. A gaining stream is one that is gaining water from discharge of the aquifer. Due to the proximity of higher terrain to the east and west, we would expect that localized recharge of the Boone Formation would result in discharge/gaining stream conditions in the base of a valley, except in very dry conditions. Therefore, Big Creek is likely a gaining stream at most locations and at most times, and the USGS topographic quadrangle map supports this conclusion by showing Big Creek as a perennial stream.
Pre-construction geotechnical investigation boring logs conducted at the farm site did not reveal karst features beneath the C&H Hog Farms facilities (ponds) and the abundance of chert indicates a lower propensity for large scale karst landform development compared to other parts of the Buffalo River watershed (Hudson et al. 2001).
Refer to Section 3.2 Data and Studies of this document for discussion of data sources.
Change to EA: Language has been added to Section 3.3 of the EA to clarify presence of karst.
Karst in Application Fields
Comment: Karst features beneath waste application to fields will result in impacts to groundwater.
Response: The preliminary Electrical Resistivity (ERI) study suggests a veneer of alluvial material with variable but mostly still shallow epikarst, with relatively shallow underlying bedrock (Fields and Halihan 2015). Direct investigation of the subsurface along the ERI transects/sections is needed to calibrate their findings and thereby potentially yield an accurate site hydrostratigraphic model.
Epikarst is generally taken to be the overburden or regolith material that derives from weathering and perhaps localized erosion of the limestone bedrock. In many areas, including at the C&H Hog Farms site, based on the geotechnical borings, epikarst is rich in clay minerals and often has moderately low to very low permeability, which would be beneficial for preventing migration of pollutants.
We expect that the shallow subsurface in the application fields contains alluvium and underlying epikarst, and the generally low permeability in epikarst would be a beneficial condition to the use of spray application. As stated in the EA, springs or other water features are avoided during manure application given the setback requirement of the NPDES General Permit.
Change to the EA: No change.
3.7 Protected Species
Endangered Species Act Consultation
Comment: Consultation under Section 7 of the Endangered Species Act is required. The public has been deprived of the opportunity to understand and weigh in on the agencies’ consideration of impacts on protected species.
Comment Summary Report for Draft EA for C&H Hog Farms
December 2015 24
Response: Coordination with the USFWS has been occurring since May 2015 for this project as is noted in Section 3.4.1 of the EA. Section 7 consultation with USFWS is a separate process that is underway. There is no public review component of Endangered Species Act (ESA) Section 7 Consultation. The Agencies’ determinations of impacts to Threatened and Endangered Species and their Critical Habitat are included in Section 3.4 of the EA to provide the public opportunity to review and comment.
Change to the EA: No Change.
Impacts to Threatened and Endangered Bats
Comment: Bats should not be eliminated from detailed consideration in the EA. Bats occur near the farm and fields. Several commenters reference an acoustic survey by Gore that was conducted in August of 2015. Their prey is dependent on water quality. Groundwater pollution could affect caves inhabited by bats.
Response: It is the Agencies’ responsibility under the ESA to make a determination of effect on T&E species and to coordinate that determination with USFWS to gain concurrence. The Agencies are in the process of consulting with USFWS on their determinations of effect. The determinations are summarized in Section 3.4 of the EA.
The Draft EA stated that no federally listed species occur within 2 miles of the farm and fields based on data and information obtained by USFWS and the NPS as part of project coordination and consultation. Since publication of the draft EA, USFWS has provided an additional data set on the occurrence of bats based on two surveys that were conducted by Gore in August and September of 2015. USFWS received data from Gore and provided the Agencies with the newly available location information in accordance with standard ESA coordination and consultation process. These occurrence data were considered in preparation of the Final EA and the BA.
Gray bat foraging is strongly related with open water of rivers, streams, lakes, and reservoirs. Gray bats feed primarily on aquatic insects, particularly mayflies, caddisflies, and stoneflies; they may also eat beetles and moths (Brady et al. 2009). Therefore, potential impacts to this species are analyzed in more detail in the Final EA and BA. The USFWS has concurred with the effects determinations to bats in the Final BA.
Change to the EA: NPS water quality data added to Section 3.2 of the EA. Potential impacts to gray bat analyzed in more detail and a conclusion of may affect, not likely to adversely affect has been added, per concurrence of USFWS.
Impacts to Threatened and Endangered Mussels
Comment: Impacts to threatened and endangered mussels will result from water quality impacts from the farm.
Response: BCRET data presented in the EA do not show any measurable negative impacts to surface water quality. The Final EA and the project BA incorporate a NPS water quality data set (that contains samples taken quarterly) collected at a site downstream from the C&H Hog Farm on Big Creek. Neither of these datasets supports the conclusion that water quality is being impaired by operation of the C&H Hog Farms. The available science does not support the conclusion that threatened and endangered species
Comment Summary Report for Draft EA for C&H Hog Farms
December 2015 25
are being adversely impacted by farm operations. The ESA requires the use of the best available scientific data in making conclusions. Based on these water quality data sets, it is not possible to conclude that threatened and endangered mussels are being adversely affected by pollution from the farm. Monitored water quality parameters on Big Creek are below those criteria recommended to protect aquatic wildlife. The USFWS has concurred with the effects determinations to mussel species as described in the project BA.
Change to the EA: No change.
Species of Greatest Conservation Concern
Comment: A comment was received that State of Arkansas listed Species of Greatest Conservation Concern were not addressed in the EA.
Response: Ozark shiner (Notropis ozarcanus), slippershell mussel (Alasmidonta viridis), and bleedingtooth mussel (Venustaconcha pleasii) have been recorded from Big Creek and the Buffalo River near its confluence with Big Creek. There is no mandate for the federal government to protect state species of concern. The Proposed Action is not expected to result in adverse impacts to water quality or to these species of concern. Monitored water quality parameters on Big Creek are below those criteria recommended to protect aquatic wildlife.
Change to the EA: No Change.
3.8 Air Quality
Air Quality
Comment: Air quality should not have been removed from the EA as a topic. NPDES Permits are not designed to control air pollution. Response: As stated in Section 3.1 of the EA, C&H Hog Farms lies in the Northwest Arkansas Intrastate Air Quality Control Region, which is in attainment for all criteria pollutants established by the EPA in compliance with the Clean Air Act (CAA). Based on this attainment status and because the farm’s minimal emissions are not expected to cause a violation of CAA standards, there is no requirement for CAA permitting. C&H Hog Farms is also not required to obtain an air permit in accordance with Arkansas Air Pollution Control Regulations 18.301 since air emissions for defined criteria pollutants at the facility do not exceed the permitting threshold. The intent of the Air Pollution Control Regulations are to ensure: (1) the least possible injury will be done to human, plant, or animal life, or to property; (2) the public enjoyment of the State’s air quality resources will be maintained; and (3) the resolution is consistent with the economic and industrial well-being of the State. The Agencies must rely on the permitting authority and expertise of the State and Federal agencies charged with protection of air quality under the CAA and related State regulations. As such, they have determined that compliance with Federal and State regulations protecting air quality supports the determination that the farm would cause no significant impact to air quality. Even though C&H Hog Farms is not required to have State or Federal air permits, mitigation measures to reduce and control emissions and odor are included in the farm’s NPDES General Permit. These are
Comment Summary Report for Draft EA for C&H Hog Farms
December 2015 26
described as operating requirements in Section 2.3.1 of the EA. Therefore, air quality is controlled through compliance with operation and maintenance requirements, which prevent significant air quality impacts associated with operations. Change to the EA: Added Air Pollution Control Regulation citation and information to Section 3.1.
Green House Gas and Climate Change
Comment: Comments were received that the EA did not address greenhouse gas emissions and climate change.
Response: Greenhouse gases (GHGs) are compounds that contribute to the greenhouse effect. The GHGs produced by swine rearing operations (animals and manure) are carbon dioxide, methane, and nitrous oxide.
Greenhouse gas emissions were addressed consistent with the CEQ’s Revised Draft Guidance for Federal Departments and Agencies on Consideration of Greenhouse Gas Emissions and the Effects of Climate Change in NEPA Reviews (CEQ 2014). CEQ guidance provides a reference point of an annual emission rate of 25,000 metric tons of CO2-e (carbon dioxide equivalent) below which a quantitative analysis of GHG emissions is not warranted unless quantification below that reference point is easily accomplished. This reference point allows agencies to focus their attention on projects with potentially large GHG emissions (CEQ 2014).
Based on estimates of carbon dioxide equivalent emissions 4.87 kilograms (kg) CO2-e per carcass from slaughter pigs and 12 kg of methane/head/year for gas releases from swine manure (Philippe and Nicks 2014)., the operation of C&H Hog Farms is not expected to emit more than 25,000 metric tons of GHG. The estimate was conservative since direct carbon dioxide emissions from animals and from manure are usually excluded from GHG assessments because it is assumed that they are compensated by consumption through the photosynthesis of plants used as feed and because the gestation, lactation and weaning period each contribute about 10 percent of total emissions. C&H Hog Farms does not finish (raise) pigs for slaughter; it is a farrow-to-wean facility. Wean-to-finish farms purchase weaned pigs from farrow-to-wean farms and grow them until they reach market weights. Finishing pigs for slaughter requires more time than producing weaners and would therefore result in greater emissions (Phillippe and Nicks 2014).
Individual sources of anthropogenic GHG emissions from C&H Hog Farms are not large enough to have an appreciable effect on climate change. For this reason, emissions of GHGs from the Proposed Action alone would not cause appreciable global warming that would lead to climate change.
Change to EA: Statement about GHG emissions was added to Section 3.1 of the EA.
3.9 Social Issues
Odor
Comment: Odor prevents enjoyment of outdoor activities. The Draft EA does not address complaints made to the ADEQ about odors from C&H Hog Farms. There are reports of strong hog odor between Hasty and Carver on the Buffalo National River. The FSA NEPA Handbook [1-EQ Environmental
Comment Summary Report for Draft EA for C&H Hog Farms
December 2015 27
Quality Programs for State and County Offices] requires FSA to implement “feasible mitigation measures to reduce odor concerns” during the NEPA review process.
Response: As stated in Section 3.6 of the EA, Newton County is a sparsely populated rural area where agriculture, including CAFOs and livestock grazing and haying operations, is common. The land application fields were previously grazed and managed for pasture and forage production, which included application of fertilizers. Odor is often regulated under nuisance ordinances and the use of exclusionary zoning at the local level. No such ordinances exist in Newton County where agriculture, including livestock operations, is common. Additionally, in Arkansas, Air Permits are issued to facilities in accordance with Arkansas Air Pollution Control Regulation 18.301 to ensure that “public enjoyment of the State’s air quality resources will be maintained.” Under these regulations, no permit is required by C&H Hog Farms since air emissions for defined pollutants at the facility do not exceed designated thresholds. The Agencies must rely on the permitting authority and expertise of the State and Federal agencies charged with protection of air quality under CAA and related State regulations. As such, they have determined that compliance with Federal and State regulations protecting air quality supports the determination that the farm would cause no significant odor impacts.
Complaints related to C&H Hog Farms submitted to ADEQ were reviewed. Over the nearly 3 years C&H has been operating, seven odor and air quality complaints have been reported to ADEQ by three individuals. As is documented in the complaints, ADEQ followed-up each complaint with a site visit to the C&H facility and documented that it was operating in compliance with the terms of its NPDES General Permit and that no violations were observed (ADEQ 2015d). Following each odor or air quality complaint, ADEQ contacted the complainants to inform them that ADEQ has no regulations preventing odors from livestock operations. In addition, ADEQ informed the complainants that the Arkansas Water and Air Pollution Control Act exempts "Agricultural operations in the growing or harvesting of crops and the raising of fowls or animals" and "Use of equipment in agricultural operations in the growth of crops or the raising of fowls or animals." While C&H Hog Farms is not required to have an air permit, it does employ a number of mitigation measures to reduce or control odor. These are described in Section 2.3.1 of the EA.
Agriculture including grazing, pasture management, application of manure as fertilizer are common in the area. Complaints about odor have been relatively few (seven complaints from three individuals) in relation to the population of Newton County (8,484 in 2012) and the annual visitation to the Buffalo National River (13,357,057 in 2014).
A review of data available on the National Park Service Visitor Use Statistics Website indicate visitation to the Upper District, where Hasty and Carver are located, year to date totals of visitors by automobile, canoe, and raft for 2015 are up over 2014 (NPS 2015). There is no indication that park visitation overall or to the upper district in particular, has been affected by operation of C&H Hog Farms.
Feasible mitigation measures to control and minimize odor are being employed by the operators of C&H Hog Farms. The recommendations and requirements contained in the farm’s NPDES General Permit are meant to minimize and control odor.
Change to the EA: Revised Section 3.6.2 to include the review of complaints submitted to ADEQ regarding odor.
Comment Summary Report for Draft EA for C&H Hog Farms
December 2015 28
Public Health
Comment: Some comments suggested that the farm will have impacts to public health, resulting from air and water pollution, antibiotics and hormones, and worker health resulting from exposure to hogs on the farm site. Articles on the effects of CAFOs on public health were provided.
Response: Available scientific data do not indicate contamination of nearby water sources. There is no evidence that water quality is being impacted by operation of C&H Hog Farms. As noted above, concern over air quality impacts from operation of C&H Hog Farms is unfounded based on standards set by State and Federal regulations. The facility is antibiotic free and hormones are not used in pork production in the United States. The NPDES General Permit defines requirements and mitigation measures designed to eliminate or minimize the potential air, surface and ground water impacts resulting from the farm’s operations. The air emissions at the facility do not warrant an air permit from ADEQ in accordance with Regulation 18.301, the intent of which is to ensure “the least possible injury will be done to human, plant, or animal life, or to property.” The Agencies must rely on the permitting authority and expertise of the State and Federal agencies charged with protection of air and water quality under CAA, CWA, and related State regulations. Given that there is no evidence of water or air impacts associated with operation of the facility, the Agencies have determined that compliance with Federal and State regulations protecting these resources supports the determination that the farm is not and would not cause significant impacts to public health.
A number of articles about the community health concerns of confined animal feeding operations were provided. Many were based on research conducted in eastern North Carolina in response to the substantial consolidation and growth of industrial hog farm operations in the region in the late 1980s to early 1990s. Over 2,500 industrial hog farms are concentrated in a geographically small area of southeastern North Carolina. These are not specifically relevant to the situation at the C&H Hog Farms for a number of reasons. Newton County lacks the dense concentration of industrial hog farms present in southeastern North Carolina. The facilities in that area are older (significant growth observed from 1982-2006) than the C&H Hog Farms and were constructed under different or no permit requirements. Given the unique circumstances at the C&H Hog Farms, it is unwarranted to anticipate the same scale of air quality impacts observed in the research provided.
Change to the EA: No change.
Tourism Economy
Comment: EA does not provide data on the economic contribution of visitation to the Buffalo National River and the potential negative effects resulting from odor/air and water quality impacts. The tourism economy is at risk from the farm’s operation.
Response: Based on NPS data for the Buffalo National River, there is no indication that operation of C&H Hog Farms has negatively affected tourism. Visitation in 2013 and 2014 were greater than the previous year. As stated in the EA, there is no evidence of adverse water quality impacts and no violations of Clean Air Act or state air quality standards resulting from the operation of the farm. The Agencies have determined that a catastrophic event is not likely to occur given the engineering design of the site, including the 50 percent greater than required capacity of the holding ponds, the protective terms of the
Comment Summary Report for Draft EA for C&H Hog Farms
December 2015 29
NPDES General Permit, and the review of the available science. Please refer to the Risk, Worst Case Scenario comment and response in Section 3.1 of this document for a review of NEPA requirements.
Change to the EA: No change.
Poverty and Environmental Justice.
Comment: Poverty is a persistent, multigenerational issue in Newton County. Federal land, which cannot be taxed, accounts for more than half of the land in Newton County. This “seriously undermines the robustness of the county’s public coffers” and “narrows the types of jobs available to residents.” C&H Hog Farms and Cargill are taking advantage of the desperation of Newton County’s residents for jobs and economic opportunity.
Response: Section 3.7 of the EA notes that Newton County, Arkansas has a poverty rate higher than that of the North Arkansas Region or the state as a whole and a median household income well below that of the region, state, and nation. Section 3.8 of the EA states that because of the higher poverty rate, the Agencies must consider whether environmental effects fall disproportionately on low-income populations, as is required by Executive Order 12898.
The Agencies, though the development of this EA, are responding to a specific request to guarantee loans made through a local lending institution to a family of farmers who have lived and farmed in the region for nine generations. Rather than taking advantage of desperation, the Agencies’ programs—the Farm Loan Program and the Small Business Administration Guaranteed Loan Program—are designed to promote small businesses and family farms in support of local economic development. The EA states the impacts of C&H Hog Farms to the local community – 9 jobs and $7,000 in property taxes. Section 3.8.2 acknowledges this as a relatively small beneficial socioeconomic effect to the region.
Given that there is no evidence of adverse water or air impacts associated with operation of the facility or impacts to the tourism economy, the Agencies have determined that compliance with Federal and State regulations protecting these resources supports the determination that the farm is not and would not cause significant impacts to air and water quality and, therefore, no potential for disproportionate impacts to low-income or minority communities. The Agencies must rely on the permitting authority and expertise of the State and Federal agencies charged with protection of air and water quality under CAA, CWA, and related State regulations.
Change to EA: No change.
Property Value
Comment: Property values are/will be negatively affected by the farm.
Response: While it is a common perception of those living near CAFOS that their property values have decreased, some studies have found that real estate values were not affected, some have found that values decrease or increase slightly, still other studies suggest that the age and design of the facility are important predictors of effect and that larger operations and ones built to modern standards may be beneficial to surrounding farmland values (NALBH 2010; Keeney 208; Tonser 2015). C&H Hog Farms is located in a rural area where agriculture, including livestock production is common. Before the existence of C&H Hog Farms, the application fields were used for livestock and forage production, and subject to the

Comment Summary Report for Draft EA for C&H Hog Farms
December 2015 30
application of fertilizers including chicken litter. The existence of the farm and use of manure from the farm as fertilizer has not changed the rural character of the region nor patterns of land use and management.
Change to EA: No change.
Comment Summary Report for Draft EA for C&H Hog Farms
December 2015 31
4. REFERENCES
ADEQ 2002. Final report land application of accumulated solids from liquid waste systems demonstration project. EPA 319(h) FY 1997 Project 700. Arkansas Department of Environmental Quality, Environmental Preservation Division.
ADEQ 2012. Notice of Intent and Major Construction Approval Pack, June 5, 2012. Available online at: http://www.adeq.state.ar.us/downloads/WebDatabases/PermitsOnline/NPDES/PermitInformation/ARG590001_NOI_20120625.pdf. Accessed on May 11, 2015.
ADEQ 2013. Letter from ADEQ to Ozark Society. Available online at: http://www.adeq.state.ar.us/downloads/WebDatabases/PermitsOnline/NPDES/PermitInformation/ARG590001_R%20Cross%20Response%20to%20Comments_20131113.pdf. Accessed on July 7, 2015.
ADEQ 2015a. C&H Hog Farms, Inc. Frequently Asked Questions. Available online at: http://www2.adeq.state.ar.us/water/branch_permits/general_permits/pdfs/arg590001_frequently_asked_questions_20140605.pdf. Accessed May 13, 2015.
ADEQ 2015b. ADEQ Final Permits Water Division. Available online at: http://www2.adeq.state.ar.us/water/branch_permits/individual_permits/finalpermits/finalpermits.aspx#Display. Accessed on June 15, 2015.
ADEQ 2015c. Response to complaint against C&H Hog Farms, Inc. Letter to Buffalo River Watershed Alliance. Arkansas Department of Environmental Quality. North Little Rock, Arkansas. Available online at: https://www.adeq.state.ar.us/downloads/WebDatabases/PermitsOnline/NPDES/PermitInformation/ARG590001_Letter%20Re%20Complaint%20against%20C%26H%20Hog%20Farms%2C%20Inc_20150821.pdf. Accessed on September 3, 2015.
ADEQ 2015d. ADEQ Complaints and Inspections Database. Available online at: https://www.adeq.state.ar.us/complaints/searches/#display. Accessed on October 5, 2015.
Big Creek Research and Extension Team (BCRET) 2015. Demonstrating and monitoring the sustainable management of nutrients on C&H Farm in Big Creek Watershed: Quarterly Report –April 1 to June 30, 2015. University of Arkansas System Division of Agriculture.
Brady, J., T. Kunz, M. D. Tuttle, and D. Wilson. 1982. Gray Bat Recovery Plan. U.S. Fish Wildlife Service 140 pp.
Burkholder, J. M., M. A. Mallin, H. B. Glasgow Jr., L. M. Larsen, M. R. McIver, G. C. Shank, N. Deamer-Melia, D. S. Briley, J. Springer, B. W. Touchette, and E. K. Hannon. 1997. Impacts to a coastal river and estuary from rupture of a large swine waste holding lagoon. Journal of Environmental Quality. Vol. 26, No. 6.
Comment Summary Report for Draft EA for C&H Hog Farms
December 2015 32
Council on Environmental Quality (CEQ) 1981. Council on Environmental Quality’s Forty Most Asked Questions Concerning CEQ’s National Environmental Policy Act Regulations, 46 FR `18026, March 23, 1981.
CEQ 2014. Revised Draft Guidance for Federal Departments and Agencies on Consideration of Greenhouse Gas Emissions and the Effects of Climate Change in NEPA Reviews.
Fields, J. and T. Halihan. 2015. Preliminary Electrical resistivity Surveys of Mount Judea Alluvial sites. 2nd Quarter 2015 Report. Oklahoma State University Boone Pickens School of Geology. Stillwater, OK. Available online at: http://www.bigcreekresearch.org/OSU%20ER%20Report%202015.pdf,
Hudson, M. R., D. N. Mott, C. J. Bitting. 2001. Geologic Framework of Karst Features in Western Buffalo National River, Northern Arkansas. U. S. Geological Survey Karst Interest Group Proceedings, Water-Resources Investigations Report 01-4011.
Hill. D. D., W. E. Owens, and P. B. Tchounwou. 2006. The Impact of Rainfall on Fecal Coliform Bacteria in Bayou Dorcheat (North Louisiana). International Journal of Environmental Research and Public Health. 3(1). Pp. 114-117.
Keeney, R. 2008. Community Impacts of CAFOs: Property Values. Available online at: https://www.extension.purdue.edu/extmedia/ID/ID-363-W.pdf. Accessed on October 7, 2015.
Kresse, T. M., P. D. Hays, K. R. Merriman, J. A. Gillip, D. T. Fugitt, J. L. Spellman, A. M. Nottmeir, D. A. Westerman, J. M. Blackstock, and J. L. Battreal. 2014. Aquifers of Arkansas – Protection, Management, and Hydrologic and Geochemical Characteristics of Groundwater Resources in Arkansas. USGS Scientific Investigations Report 2014-5149. Available online at: http://pubs.usgs.gov/sir/2014/5149/pdf/sir2014-5149.pdf. Accessed on May 28, 2015.
National Association of Local Boards of Health. 2010. Understanding Concentrated Animal Feeding Operations and Their Impacts on Communities. Available online at: http://www.cdc.gov/nceh/ehs/docs/understanding_cafos_nalboh.pdf. Accessed on October 15, 2015.
National Oceanic and Atmospheric Administration (NOAA). 2015. Point Precipitation Frequency Estimates. NOAA Atlas 14, Volume 9, Version 2. Location: Vendor, Arkansas, U.S. Available online at: http://hdsc.nws.noaa.gov/. Accessed September 29, 2015.
Mott, D. N. 1997. Buffalo National River, Arkansas Ten Years of Water Quality Monitoring. United States Department of the Interior, National Park Service, Buffalo National River, Harrison, Arkansas.
National Park Service 2015. National Park Service Visitor Use Statistics. Available online at: https://irma.nps.gov/Stats/Reports/Park/BUFF. Accessed on October 8, 2015.
Philippe, F. –X. and B. Nicks. 2014. Review on greenhouse gas emissions from pig houses: production of carbon dioxide, methane and nitrous oxide by animals and mature. Agriculture, Ecosystems, and Environment. 199.
Comment Summary Report for Draft EA for C&H Hog Farms
December 2015 33
Soto, L. 2014. Draft summary of previous dye tracing reports in the area of the Buffalo National River, Arkansas. Prepared for Geologic Features and Systems Branch, Geologic Resources Division. National Park Service, Natural Resources Stewardship and Science.
Tonser, G. 2015. Animal Agriculture and the Environment: Economic Impacts of Hog Operations. Available online at: http://animalagteam.msu.edu/uploads/files/20/Economic.pdf. Accessed on October 8, 2015.
Usrey, F. D. 2013. Assessment of Escherichia coli Concentrations in the Surface Waters of the Buffalo National River 2009 to 2012. Buffalo National River Report NPS/B-0100/2013. U.S. Department of the Interior, National Park Service, Buffalo National River. Harrison, Arkansas.
Wallace, C. B., M. G. Burton, S. G. Hefner, and T. A. Dewitt. Sediment, Nutrient, and Bacterial Runoff from Biosolids and Mineral Fertilizer applied to Mixed Cool- and Native Warem-Season Grassland in the Ozark Mountains. Applied and Environmental Soil Science. Vol. 2014, 147818.
Whitman, R. L., M. B. Nevers, and M. N. Byappanahalli. 2006. Examination of the Watershed-wide Distribution of Escherichia coli along Southern Lake Michigan: an Integrated Approach. Applied and Environmental Microbiology. Vol. 72, No. 11.
Comment Summary Report for Draft EA for C&H Hog Farms
December 2015 A-1
NEWSPAPER NOTICES
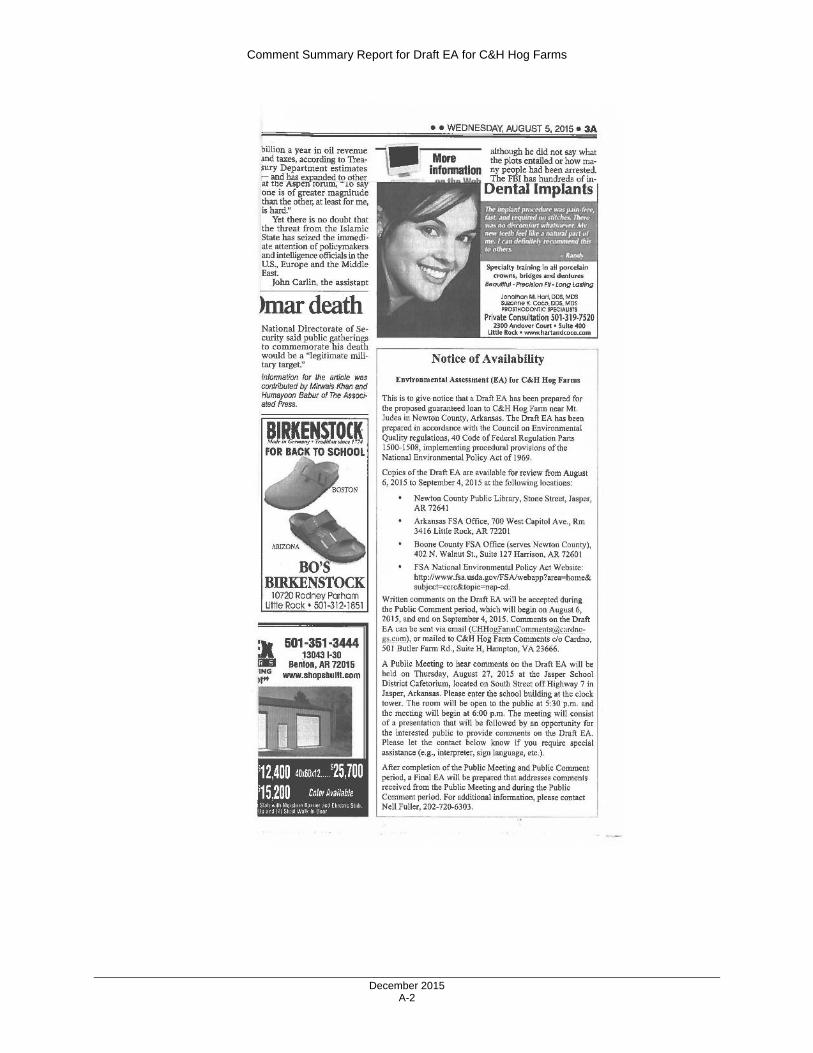
Comment Summary Report for Draft EA for C&H Hog Farms
December 2015 A-2
Comment Summary Report for Draft EA for C&H Hog Farms
December 2015 A-3
Comment Summary Report for Draft EA for C&H Hog Farms
December 2015 A-4
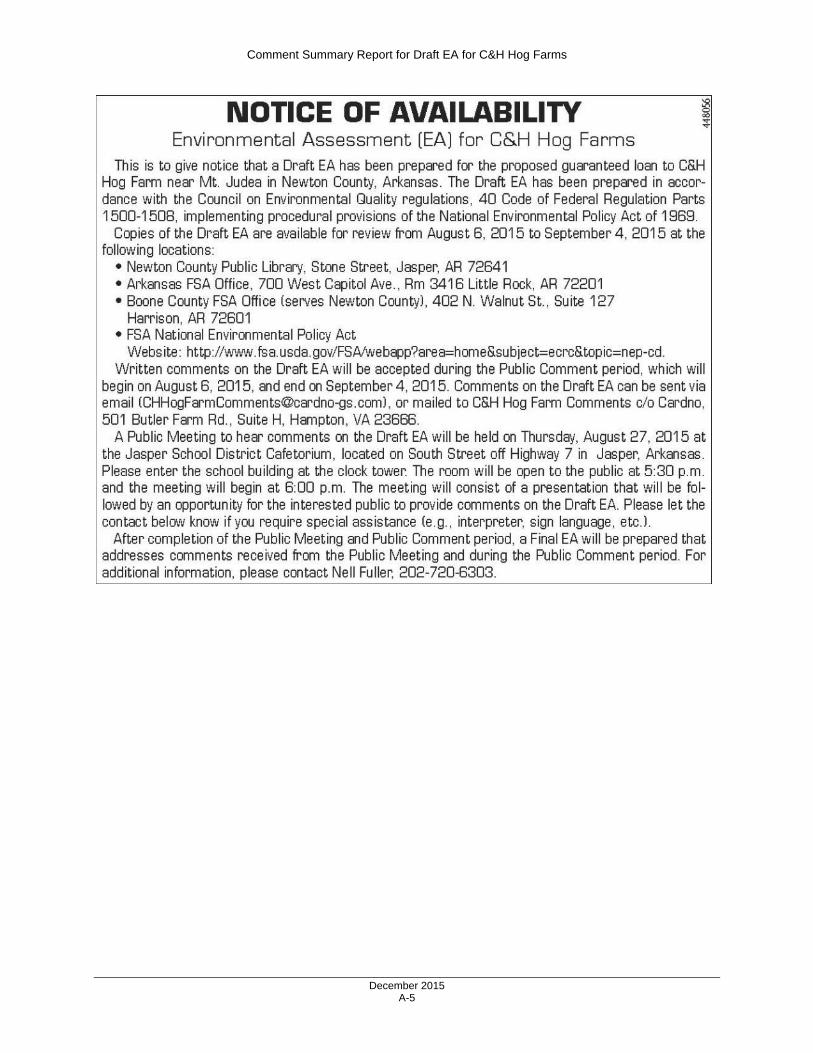
Comment Summary Report for Draft EA for C&H Hog Farms
December 2015 A-5
Final Environmental Assessment C‐1
Appendix C – USFWS Concurrence on Effects Determinations