Embed Size (px)
Citation preview

FINAL ENVIRONMENTAL IMPLEMENTATION REPORT
Mount Pleasant Sub-Area 51-1 within the
Mount Pleasant Secondary Plan Area North West Brampton
Prepared By:
Stonybrook Consulting Inc.
Urbantech Consulting R.J. Burnside & Associates Limited
Savanta Inc. JTB Environmental Systems G + L Urban Planners Ltd.
STLA Inc.
September 2011

Final Environmental Implementation Report Mount Pleasant Sub-Area 51-1
September 2011
TOC-1
TABLE OF CONTENTS
1.0 INTRODUCTION ......................................................................................... 1-1
1.1 Study Purpose ...................................................................................................... 1.2 Study Area ........................................................................................................... 1.3 Background Studies and Secondary Plan Implementation Principles ...........................
1.3.1 Landscape Scale Analysis .......................................................................... 1.3.2 Huttonville and Fletcher’s Creeks Subwatershed Study (HFSWS) ................... 1.3.3 Mount Pleasant Secondary Plan Implementation Principles ........................... 1.3.4 Conceptual Fisheries Compensation Plan (CFCP) .........................................
1.4 Block Plan ............................................................................................................ 1.5 EIR Workshops ..................................................................................................... 1.6 Phased EIR Format and Schedule ...........................................................................
1-11-31-51-51-61-71-8
1-101-111-12
2.0 EXISTING CONDITIONS ............................................................................. 2-1
2.1 Geology and Hydrogeology ................................................................................... 2-12.1.1 Scope of Work ........................................................................................ 2.1.2 Physiography.......................................................................................... 2.1.3 Topography ........................................................................................... 2.1.4 Surface Drainage .................................................................................... 2.1.5 Geological Setting and Stratigraphy .......................................................... 2.1.6 Surficial Geology ..................................................................................... 2.1.7 Bedrock Geology .................................................................................... 2.1.8 Hydrogeology .........................................................................................
2-12-42-52-52-62-72-82-8
2.1.8.1 Hydraulic Conductivity ................................................................. 2.1.8.2 Groundwater Levels .................................................................... 2.1.8.3 Groundwater Flow Conditions....................................................... 2.1.8.4 Groundwater Conditions in Terrestrial Features .............................
2-82-9
2-112-13
2.1.9 Surface Water Flow Conditions................................................................. 2.1.10 Groundwater Quality ............................................................................... 2.1.11 Surface Water Quality ............................................................................. 2.1.12 Local Groundwater Use ........................................................................... 2.1.13 Subwatershed Water Budget ...................................................................
2-142-162-172-182-20
2.2 Aquatic Resources and Fish Habitat ...................................................................... 2-212.2.1 Background Information .......................................................................... 2.2.2 Field Results from the Huttonville and Fletcher’s Creeks
Subwatershed Study and EIR Assessment ................................................. 2.2.2.1 Assessment of Aquatic Habitat and Fish Community .................... 2.2.2.2 Fish Habitat and Classification ................................................... 2.2.2.3 Existing Fish Community Management Zones ............................. 2.2.2.4 Regulated Redside Dace Habitat ................................................
2.2.3 CFCP Estimated Net Gain in Fish Productive Capacity .................................
2-21
2-252-252-302-322-332-36
2.3 Terrestrial Resources ........................................................................................... 2-372.3.1 Vegetation ............................................................................................... 2-40
2.3.1.1 Vegetation Communities ........................................................... 2.3.1.2 Vascular Plant Species ..............................................................
2.3.2 Wildlife .................................................................................................. 2.3.2.1 Winter Wildlife Surveys ............................................................. 2.3.2.2 Breeding Anurans (Frogs and Toads) and Road Crossing Surveys.
2-402-452-552-562-58

Final Environmental Implementation Report Mount Pleasant Sub-Area 51-1
September 2011
TOC-2
2.0 EXISTING CONDITIONS (cont’d) 2.3.2.3 Raptor Surveys ....................................................................... 2.3.2.4 Breeding Bird Observations ...................................................... 2.3.2.5 Waterfowl Observations ...........................................................
2-612-612-69
2.3.3 Wetlands ................................................................................................. 2-702.4 Provincial Policy Statement – Natural Heritage Features ........................................ 2-70
2.4.1 Significant Valleylands ............................................................................ 2.4.2 Significant Wetlands .............................................................................. 2.4.3 Significant Woodlands ............................................................................ 2.4.4 Significant Wildlife Habitat ...................................................................... 2.4.5 Significant Habitat of Endangered and Threatened Species ........................ 2.4.6 Areas of Natural and Scientific Interest (ANSI) ......................................... 2.4.7 Environmentally Sensitive or Significant Areas ..........................................
2.5 Existing Regulatory Floodplain ............................................................................
2-712-722-732-742-752-762-762-76
3.0 NATURAL HERITAGE SYSTEM BOUDARIES ............................................... 3-1
3.1 Mount Pleasant Secondary Plan NHS ..................................................................... 3.2 Elements of the Final NHS .................................................................................... 3.3 Environmental Features Boundaries ....................................................................... 3.4 Final NHS Boundaries ...........................................................................................
3-13-23-43-4
3.4.1 NHS Vignettes ....................................................................................... 3.4.2 Bovaird Drive to the CNR Final NHS Boundary .......................................... 3.4.3 CNR to TCPL Final NHS Boundary ............................................................ 3.4.4 TCPL to the Sandalwood Woodland Final NHS Boundary ........................... 3.4.5 Sandalwood Woodland to Wanless Drive Final NHS Boundary .................... 3.4.6 Wanless Drive to Mayfield Road Final NHS Boundary ................................
3.5 Future Regulated Redside Dace Habitat ............................................................... 3.6 Green System Trail ............................................................................................
3.6.1 Location of Green System Trail within the NHS ......................................... 3.6.2 Trail Design Elements ............................................................................ 3.6.3 Impact Assessment of Green System Trail on the NHS ..............................
3-53-83-83-9
3-143-163-173-173-203-213-22
4.0 NATURAL CHANNEL DESIGN ..................................................................... 4-1
4.1 Introduction ........................................................................................................ 4.2 HFSWS Phase 3 Stream Management Strategy ....................................................... 4.3 General Design Principles ..................................................................................... 4.4 Agency Discussions and Site Tour .........................................................................
4.4.1 Site Tour ................................................................................................ 4.4.2 Natural Channel Design Workshop – August 16, 2011 .................................
4.5 Channel Alignment, Lowering and Width ................................................................ 4.5.1 Potential Impacts of Channel Lowering ......................................................
4.6 Natural Channel Design ........................................................................................
4-14-24-34-54-54-64-74-9
4-114.6.1 Channel/Floodplain Relationships ............................................................ 4.6.2 Design Components ............................................................................... 4.6.3 Preliminary Channel Profile: Positioning of Channel Features ..................... 4.6.4 Transitions from Runs/Riffles to Pools in Construction ............................... 4.6.5 Channel Substrate Materials ................................................................... 4.6.6 Channel Form in Culverts ....................................................................... 4.6.7 Aquatic Habitat Components (Side-slope and
Floodplain Features) .............................................................................. 4.6.8 Accessory Habitat Components ...............................................................
4.6.8.1 Aquatic Habitat Components ....................................................
4-114-124-144-194-194-20
4-214-214-23
4.7 Creditview Park Channel ...................................................................................... 4-24

Final Environmental Implementation Report Mount Pleasant Sub-Area 51-1
September 2011
TOC-3
4.0 NATURAL CHANNEL DESIGN (cont’d) 4.8 Channel Hydraulics ..............................................................................................
4.8.1 HFSWS Riparian Storage Calculations ......................................................... 4.8.2 Updated Existing Huttonville Creek Floodplain and
Riparian Storage Calculations ..................................................................... 4.8.3 Proposed Conditions Floodplain Model ........................................................ 4.8.4 Online Regional Storm Storage ...................................................................
4.9 Flooding of Woodlands and Wetlands ..................................................................
4-264-26
4-264-284-304-34
5.0 NATURAL HERITAGE SYSTEM RESTORATION ............................................ 5-1
5.1 Proposed Natural Heritage System – Input from Background Studies .............................................................................................................. 5.1.1 Subwatershed Study ............................................................................... 5.1.2 EIR Workshops .......................................................................................
5-15-15-1
5.2 Regional Landscape Context ................................................................................ 5.2.1 Landscape Scale Analysis of Current and Potential Wetlands
in CVC and TRCA Jurisdictions ................................................................. 5.2.2 Local Landscape Context ......................................................................... 5.2.3 Existing and Future Wildlife Features and Functions ...................................
5.3 Reference Landscape for Restoration ................................................................... 5.4 Natural Heritage System Objectives ..................................................................... 5.5 Restoration Principles ......................................................................................... 5.6 Envisioned Natural Heritage System .....................................................................
5.6.1 Planned Features ....................................................................................
5-2
5-25-25-35-35-45-45-55-5
5.7 Proposed Restoration Design ................................................................................. 5.7.1 Vignette 1 – Mayfield Road to Wanless Drive .............................................
5.7.1.1 Feature 1a: New Woodlot/Forest Restoration ................................. 5.7.1.2 Area 1c: Woodland Channel between Mayfield
Woodlands A and B .................................................................. 5.7.1.3 Area 4c: Grassland Channel ..........................................................
5.7.2 Vignette 2 – Wanless Drive to South of Buick Boulevard .............................. 5.7.2.1 Area 4c: Grassland Channel ...................................................... 5.7.2.2 Area 4a: Grassland Creation ......................................................
5.7.3 Vignette 3 – South of Buick Boulevard to the City Park Woodlands................ 5.7.3.1 Area 4c: Grassland Channel ...................................................... 5.7.3.2 Area 1a: New Woodlot/Forest Restoration .................................. 5.7.3.3 Area 1c: Woodland Channel ...................................................... 5.7.3.4 Area 3: Open Water/Marsh Wetland .......................................... 5.7.3.5 Area 4a: Grassland Creation (north of TCPL and
west of Spine Road) ................................................................. 5.7.3.6 Area 5a: Fish Foraging Habitat ..................................................
5.7.4 Vignette 4 – City Park Woodlands and TCPL to the CNR ............................... 5.7.5 Wetland 13a, 13b and “Tooth” Restoration .................................................
5.8 Role of Natural Succession in the NHS Post-Restoration ........................................... 5.9 Net Benefit Analysis of Implementing the NHS .........................................................
5.9.1 Alterations to Vegetation Communities and Wildlife Habitat .......................... 5.9.2 Changes to Aquatic Habitat ....................................................................... 5.9.3 Alterations to Wildlife Movement, Linkages and Corridors .............................
5-65-75-7
5-85-9
5-105-105-115-115-125-125-125-13
5-155-165-165-175-185-195-195-205-21
5.9.4 Increased Human Activity Adjacent To, and Within, the NHS ..................... 5-225.9.5 Changes to Groundwater and Surface Water Quantity and Quality .............. 5-23

Final Environmental Implementation Report Mount Pleasant Sub-Area 51-1
September 2011
TOC-4
6.0 WETLANDS ................................................................................................ 6-1
6.1 Wetland Boundaries ............................................................................................... 6.2 Wetland Water Conditions ......................................................................................
6.2.1 Wetland Types .......................................................................................... 6.2.2 Wetland History ......................................................................................... 6.2.3 Monitoring ................................................................................................ 6.2.4 Hydroperiods ............................................................................................. 6.2.5 Sources of Water ....................................................................................... 6.2.6 Wetland Inlet and Outlets ........................................................................... 6.2.7 Existing Open Water Wetlands ....................................................................
6-26-36-36-36-46-56-56-66-7
6.3 Terrestrial Conditions ............................................................................................. 6.3.1 Monitoring .............................................................................................
6.4 Wetland Water Budgets ...................................................................................... 6.4.1 HFSWS Recommendations .......................................................................... 6.4.2 EIR Workshop Discussions .......................................................................... 6.4.3 Wetlands Requiring Water Budget Calculations .............................................
6.5 Water Budget Methodology ................................................................................. 6.5.1 Model Description and Background .............................................................. 6.5.2 Use of EPA – SWMM for Water Balance Analysis ........................................ 6.5.3 Model Approach ...................................................................................... 6.5.4 Comparison of Simulated Water Levels to Observed Water Levels ...............
6.6 Existing Conditions, Water Budget and Mitigative Measures .................................... 6.6.1 Wetland 1 (Mayfield Woodland A) ............................................................
6.6.1.1 Existing Conditions and Management Objectives ......................... 6.6.1.2 Hydrologic Characterization of Wetland 1 ................................... 6.6.1.3 Mitigation Requirements ...........................................................
6.6.2 Wetland 2 (Mayfield Wetland A) ............................................................... 6.6.2.1 Existing Conditions and Management Objectives ......................... 6.6.2.2 Hydrologic Characterization of Wetland 2 ................................... 6.6.2.3 Mitigation Requirements ...........................................................
6.6.3 Wetland 3 (Mayfield Woodland A) ............................................................ 6.6.3.1 Existing Conditions and Management Objectives ......................... 6.6.3.2 Hydrologic Characterization of Wetland 3 ................................... 6.6.3.3 Mitigation Requirements ...........................................................
6.6.4 Wetland 4 .............................................................................................. 6.6.4.1 Existing Conditions and Management Objectives ......................... 6.6.4.2 Hydrologic Characterization of Wetland 4 ................................... 6.6.4.3 Mitigation Requirements ...........................................................
6.6.5 Wetland 5 .............................................................................................. 6.6.5.1 Existing Conditions and Management Objectives .........................
6.6.6 Wetland 6 .............................................................................................. 6.6.6.1 Existing Conditions and Management Objectives ......................... 6.6.6.2 Hydrologic Characterization of Wetland 6 ................................... 6.6.6.3 Mitigation Requirements ...........................................................
6.6.7 Wetland 7 .............................................................................................. 6.6.7.1 Existing Conditions and Management Objectives ......................... 6.6.7.2 Hydrologic Characterization of Wetland 7a ................................. 6.6.7.3 Wetland 7a Mitigation Requirements .......................................... 6.6.7.4 Hydrologic Characterization of Existing Wetland 7b ..................... 6.6.7.5 Wetland 7b Mitigation Requirements .......................................... 6.6.7.6 Hydrologic Characterization of Existing Wetland 7c ..................... 6.6.7.7 Wetland 7c Mitigation Requirements ..........................................
6-86-86-96-96-9
6-106-126-126-136-146-166-176-186-186-206-216-226-226-246-246-256-256-276-286-286-286-326-336-336-336-356-356-366-376-386-386-416-426-436-436-436-44

Final Environmental Implementation Report Mount Pleasant Sub-Area 51-1
September 2011
TOC-5
6.0 WETLANDS (cont’d) 6.6.7.8 Hydrologic Characterization of Existing Wetland 7d ..................... 6.6.7.9 Wetland 7d Mitigation Requirements ..........................................
6.6.8 Wetland 8 .............................................................................................. 6.6.8.1 Existing Conditions and Management Objectives ......................... 6.6.8.2 Hydrologic Characterization of Wetland 8 ................................... 6.6.8.3 Mitigation Requirements ...........................................................
6.6.9 Wetland 9 .............................................................................................. 6.6.9.1 Existing Conditions and Management Objectives ......................... 6.6.9.2 Hydrologic Characterization of Wetland 9 ................................... 6.6.9.3 Mitigation Requirements ...........................................................
6.6.10 Wetland 10 ............................................................................................ 6.6.10.1 Existing Conditions and Management Objectives ......................... 6.6.10.2 Mitigation Requirements ...........................................................
6.6.11 Wetland 11 ............................................................................................ 6.6.11.1 Existing Conditions and Management Objectives ......................... 6.6.11.2 Mitigation Requirements ...........................................................
6.6.12 Wetland 12 ............................................................................................ 6.6.12.1 Existing Conditions and Management Objectives ......................... 6.6.12.2 Mitigation Requirements ...........................................................
6.6.13 Wetland 13 ............................................................................................ 6.6.13.1 Existing Conditions and Management Objectives ......................... 6.6.13.2 Hydrologic Characterization of Existing Wetland .......................... 6.6.13.3 Mitigation Requirements ...........................................................
6.6.14 Wetland 14 ............................................................................................ 6.6.14.1 .. Existing Conditions and Management Objectives………………………..
6.7 .... Creation of Open Water/Marsh Wetland……………………………………………………………….
6-456-466-476-476-496-506-516-516-546-556-566-566-586-596-596-606-616-616-636-656-656-706-706-716-716-73
7.0 TABLELAND CONSERVATION PLAN ............................................................ 7-1 8.0 DRAINAGE DENSITY .................................................................................. 8-1
8.1 HFSWS Analyses and Recommendations ................................................................. 8.2 Block Plan Calculations ..........................................................................................
8-18-4
8.2.1 East Huttonville Creek Subwatershed ........................................................ 8.2.2 Fletcher’s Creek Subwatershed ................................................................
8-48-5
9.0 STORMWATER MANAGEMENT .................................................................... 9-1
9.1 HFSWS Recommendations .................................................................................. 9.2 Design and Location of SWM Facilities .................................................................. 9.3 Detailed Impervious and Pervious Area Calculations .............................................. 9.4 Erosion Control and Extended Detention ...............................................................
9.4.1 .... Erosion Thresholds……………………………………………………………………………….. 9.4.1.1 Additional Work to Conform Fletcher’s Creek Erosion
Thresholds………………………………………………………………………………9.4.1.2 Additional Data from CVC............................................................ 9.4.1.3 .... Results……………………………………………………………………………………9.4.1.4 .... Summary………………………………………………………………………………..
9.5 Quantity Control ................................................................................................. 9.6 Pond Design Criteria ...........................................................................................
9-19-19-29-39-4
9-59-59-59-89-9
9-109.7 Pond Stage-Storage-Discharge Characteristics ...................................................... 9.8 Inlet and Outlet Design ....................................................................................... 9.9 Thermal Mitigation ..............................................................................................
9.0 STORMWATER MANAGEMENT (cont’d)
9-129-169-17

Final Environmental Implementation Report Mount Pleasant Sub-Area 51-1
September 2011
TOC-6
9.10 Pond Restoration ................................................................................................ 9.11 Low Impact Development Criteria ........................................................................
9.11.1 Additional Topsoil Depth .......................................................................... 9.11.2 NHS LID Measures .................................................................................. 9.11.3 Mississauga Road Swale ..........................................................................
9-219-229-239-259-25
10.0 ROAD/CNR CROSSINGS OF NATURAL HERITAGE SYSTEM ..................... 10-1
10.1 HFSWS Recommendations for Road Crossings ...................................................... 10.2 Implementation Principles ................................................................................... 10.3 Block Plan Transportation Study .......................................................................... 10.4 Future Road Crossing Design ...............................................................................
10.4.1 Design Principles .................................................................................... 10.4.2 Road Alignments and Culvert Sizing .........................................................
10.4.2.1 East-West Spine Road………………………………………………………… 10.4.2.2 Buick Boulevard…………………………………………………………………. 10.4.2.3 Sandalwood Parkway Extension………………………………………….. 10.4.2.4 North-South Spine Road……………………………………………………..
10.4.3 Road Design for Wildlife Movement .......................................................... 10.5 CNR Improvements ............................................................................................
10.5.1 Existing and Historic Conditions ............................................................... 10.5.2 Proposed Culvert Improvements ..............................................................
10-110-110-210-210-210-310-310-410-410-910-9
10-1210-1210-13
11.0 GRADING AND MUNICIPAL SERVICING .................................................. 11-1
11.1 General Site Grading ........................................................................................... 11.2 TransCanada and Enbridge Gas Pipeline Constraints .............................................. 11.3 Storm Drainage ..................................................................................................
11.3.1 Major and Minor System Drainage ............................................................ 11.3.2 Foundation Drain and Roof Collector Systems ...........................................
11.4 Water and Wastewater Servicing ......................................................................... 11.4.1 Wastewater Servicing .............................................................................. 11.4.2 Water Servicing .......................................................................................
11.5 Construction Below Water Table ..........................................................................
11-111-211-211-211-211-311-311-411-5
12.0 IMPLEMENTATION ................................................................................... 12-1
12.1 Implementation Considerations ............................................................................ 12.2 Growth Management Staging and Sequencing ...................................................... 12.3 Permitting Requirements to Agencies or Other Parties ........................................... 12.4 Construction Considerations ................................................................................
12.4.1 Dewatering Requirements ....................................................................... 12.4.2 Water Table Lowering ............................................................................. 12.4.3 Private Well Water Supplies ..................................................................... 12.4.4 Well Decommissioning ............................................................................
12.5 Monitoring Program ............................................................................................
12-112-512-6
12-1512-1512-1512-1612-1712-17
13.0 EIR SUMMARY .......................................................................................... 13-1
13.1 Summary of EIR Recommendations ..................................................................... 13.2 EIR Conformity With Subwatershed Study Recommendations .................................
13-113-2
14.0 REFERENCES

Final Environmental Implementation Report Mount Pleasant Sub-Area 51-1
September 2011
TOC-7
LIST OF TABLES
Table 1.6A Block Plan and EIR Timetable Table 2.1A Summary of MOE Water Well Records Table2.1B Summary of Groundwater Recharge Volumes Table 2.2A Predicted Change in the Length (m) of Each Class of Fish Habitat in the East Huttonville
Area Table 2.3A ELC Vegetation Types in the Study Area Table 2.3B Local or Regional Vegetation Species of Interest observed by MNR in North West
Brampton Area or Dougan & Associates in the HFSWS Area: Current Local and Regional Designation
Table 2.3C Co-efficients of Conservatism for each Vegetation Community in the Study Area Table 2.3D Winter Wildlife Species Observed Table 2.3E Breeding Amphibian Species Observed in 2008 & 2009 Surveys Table 2.3F 2008/2009 Bird Observations within North West Brampton (Savanta Inc.) Table 2.4A Summary of Significant Features and Habitat by Terrestrial Unit Area Table 2.5A Comparison of HFSWS and Urbantech (EIR) Existing Regional Storm Flood Elevations Table 2.13 Application of Watercourse Management Strategy on a Reach Basis (Source: HFSWS) Table 2.5 Comparison of Water Channel Block Width Requirements (Source: HFSWS) Table 4.5A Recommended Channel Block Widths, East Huttonville Creek Table 4.6A Reach Locations, Channel Slopes and Dimensions for 25mm and 2-year Flows Table 4.6B Channel Depths – Runs/Riffles and Pools by Reach: Depths in Metres Table 4.6C Details for Positioning of Channel Elements as Pre-Detailed Design Table 2.6 Comparison of Watercourse Riparian Storage (m3) (Source: HFSWS) Table 4.8A Riparian Storage Targets – East Huttonville Creek Table 4.8B Riparian Storage – East Huttonville Creek Table 4.8C Flows and Water Levels in the Proposed Corridor Table 6.4A Wetlands Requiring Water Balance Analyses Table 6.6A W1 – Summary of Existing Wetland Conditions Table 6.6B W2 - Summary of Existing Wetland Conditions Table 6.6C W3 - Summary of Existing Wetland Conditions Table 6.6D W4 - Summary of Existing Wetland Conditions Table 6.6E W5 - Summary of Existing Wetland Conditions Table 6.6F W6 - Summary of Existing Wetland Conditions Table 6.6G W7 - Summary of Existing Wetland Conditions Table 6.6H W8 - Summary of Existing Wetland Conditions Table 6.6I W9 - Summary of Existing Wetland Conditions Table 6.6J W10 - Summary of Existing Wetland Conditions Table 6.6K W11 - Summary of Existing Wetland Conditions Table 6.6L W12 - Summary of Existing Wetland Conditions Table 6.6M W13 - Summary of Existing Wetland Conditions Table 6.6N W14 - Summary of Existing Wetland Conditions Table 8.1A Channel Types for drainage Density Calculations from the HFSWS Phase 2 Report Table 8.1B Identified Channel Types within the 3G Land Use Plan Table 8.1C 3G Plan Drainage Density Assessment Table 8.2A Channel Lengths, East Huttonville Creek Table 8.2B Fletcher’s Creek Swale Lengths, Subcatchments 521 and 522 Table 10.4A New Road Crossing Sizes and Elevations Table 11.4A Maximum and Minimum Pressure within Sub-Area 51-1
Table 11.4B Summary of Fire Flow Analysis with Sub-Area 51-1

Final Environmental Implementation Report Mount Pleasant Sub-Area 51-1
September 2011
TOC-8
LIST OF FIGURES
Figure 1.1.1 Mount Pleasant Secondary Plan Land Use Schedule Figure 1.2.1 Mount Pleasant Secondary Plan Area Figure 1.2.2 Block Plan/EIR Study Area and Subwatershed Boundaries Figure 1.2.3 Landownership Plan Figure 1.4.1 Sub- Area 51-1 Block Plan Schedule A Secondary Plan Natural Heritage System Figure 2.0.1 Natural Heritage Features Terminology Figure 2.1.1 MOE Wells, Geotechnical Boreholes and Test Pits Figure 2.1.2 Monitoring Locations Figure 2.1.3 Topography and Drainage Figure 2.1.4 Surficial Geology Figure 2.1.5 Bedrock Topography Figure 2.1.6 Cross Section Location Key Figure 2.1.7 Cross Section A-A’ Figure 2.1.8 Cross Section B-B’ Figure 2.1.9 Cross Section C-C’ Figure 2.1.10 Cross Section D-D’ and E-E’ Figure 2.1.11 Cross Section F-F’ and G-G’ Figure 2.1.12 Cross Section H-H’ and I-I’ Figure 2.1.13 Interpreted Groundwater Flow Figure 2.1.14 Well Survey Area Figure 2.2.1 Historical Alignment of Huttonville and Fletcher’s Creek Figure 2.2.2 Existing Features and Fish Habitat Classification Figure 2.2.3 Existing Fish Community Management Zones Figure 2.2.4 Existing Regulated Redside Dace Habitat Figure 2.3.1 Vegetation (ELC) Communities Figure 2.3.2 Occurrence of Rare and Invasive Species by Natural System Integration Unit Figure 2.3.3 2008-2009 Winter Wildlife Transects Figure 2.3.4 2008-2009 Winter Wildlife Survey Results Figure 2.3.5 2008-2009 Amphibian Breeding Monitoring Stations Figure 2.3.6 2008 Breeding Amphibian Call Survey Results Figure 2.3.7 2009 Breeding Amphibian Call Survey Results Figure 2.3.8 2008 Amphibian Road Crossing Survey Results Figure 2.3.9 2009 Amphibian road Crossing Survey Results Figure 2.4.1 Significant Features and Habitat by Natural System Integration Unit as per Provincial
Policy Statement Figure 3.5.1 Future Regulated Redside Dace Habitat Figure 6.6.1.1 Existing Conditions W1 Figure 6.6.1.2 W1 Existing Conditions Simulation Figure 6.6.1.3 W1 Post-Development Simulation Figure 6.6.2.1 Existing Conditions W2 Figure 6.6.2.2 W2 Existing Conditions Simulation Figure 6.6.2.3 W2 Post-Development Simulation Figure 6.6.3.1 Existing Conditions W3 Figure 6.6.3.2 W3 Existing Conditions Simulation Figure 6.6.3.3 W3 Post-Development Simulation Figure 6.6.4.1 Existing Conditions W4 Figure 6.6.4.2 W4 Existing Conditions Simulation

Final Environmental Implementation Report Mount Pleasant Sub-Area 51-1
September 2011
TOC-9
LIST OF FIGURES (cont’d)
Figure 6.6.5.1 Existing Conditions W5 Figure 6.6.6.1 Existing Conditions W6 Figure 6.6.6.2 W6 Existing Conditions Simulation Figure 6.6.6.3 W6 Post-Development Simulation Figure 6.6.7.1 Existing Conditions W7a Figure 6.6.7.2 W7a Existing Conditions Simulation Figure 6.6.7.3 W7a Post-Development Simulation Figure 6.6.7.4 Existing Conditions W7b Figure 6.6.7.5 Existing Conditions W7c Figure 6.6.7.7 W7c Existing Conditions Simulation Figure 6.6.7.8 W7c Post-Development Simulation Figure 6.6.7.9 Existing Conditions W7d Figure 6.6.7.10 W7d Existing Conditions Simulation Figure 6.6.7.11 W7d Post-Development Simulation Figure 6.6.8.1 Existing Conditions W8 Figure 6.6.8.2 W8 Existing Conditions Simulation Figure 6.6.8.3 W8 Post-Development Simulation Figure 6.6.9.1 Existing Conditions W9 Figure 6.6.9.2 W9 Existing Conditions Simulation Figure 6.6.9.3 W9 Post-Development Simulation Figure 6.6.10.1 Existing Conditions W10 Figure 6.6.11.1 Existing Conditions W11 Figure 6.6.12.1 Existing Conditions W12 Figure 6.6.13.1 Existing Conditions W13a Figure 6.6.13.2 W13a Existing Conditions Simulation Figure 6.6.13.3 Existing Conditions W13b Figure 6.6.13.4 W13b Existing Conditions Simulation Figure 6.6.13.5 Existing Conditions W13c Figure 6.6.13.6 W13c Existing Conditions Simulation Figure 6.6.14.1 Existing Conditions W14 Figure 6.6.15.1 OWM Post-Development Simulation Figure 9.9.1 Thermal Mitigation Alternative 1 (Plan View) Figure 9.9.2 Thermal Mitigation Alternative 1 (Details) Figure 9.9.3 Thermal Mitigation Alternative 2 (Plan View) Figure 9.9.4 Thermal Mitigation Alternative 2 (Details) Figure 9.11.1 LID Measures on Private Property Figure 9.11.2 NHS LID Measures Figure 10.4.1 2009 Vignette Figure 10.4.2 Sandalwood Parkway Alignment Figure 10.4.3 Wetland 9 ELC Communities Figure 10.5.1 CNR Culvert Crossing Plan View – Option 1 Figure 10.5.2 CNR Culvert Crossing Plan View – Option 2 Figure 12.2.1 Growth Management Phasing Areas

Final Environmental Implementation Report Mount Pleasant Sub-Area 51-1
September 2011
TOC-10
LIST OF DRAWINGS
Drawing 2.5.1 Existing Subcatchments and Surface Drainage Patterns Drawing 2.5.2 Existing Floodplain Drawing 3.3.1 Mayfield Woodlands A & B Wetlands 1, 2, 3 and 4, Agency Staking Survey Drawing 3.3.2 Wanless Woodlands A & B Wetland 7, Agency Staking Survey Drawing 3.3.3 Sandalwood Woodland Wetlands 8, 9, 10, 11, 12 and 48 Agency Staking Survey Drawing 3.3.4 Park Woodlands a, B and C and Wetlands 13, Agency Staking Survey Drawing 3.3.5 CNR Woodland, Wetland 14 and Huttonville Creek Top-of-Bank
Agency Staking Survey Drawing 3.4.2 NHS Boundary South of CNR Drawing 3.4.3 NSH Restoration Concept Vignette Area 4 Drawing 3.4.3A NSH Boundary North of CNR Drawing 3.4.4 NHS Restoration Concept Vignette Area 3 Drawing 3.4.5 NHS Restoration Concept Vignette Area 2 Drawing 3.4.6 NHS Restoration Concept Vignette Area 1 Drawing 3.5 Proposed Trail Locations Drawing 4.5 Pre-Developments vs. Post Development Channel Profiles Drawing 4.6A Natural Channel Design Drawing 4.6B Natural Channel Design Drawing 4.6C Natural Channel Design Drawing 4.6D Natural Channel Design Drawing 4.6E Natural Channel Design Drawing 4.6F Natural Channel Design Drawing 4.6G NHS Restoration Concept Elevations Drawing 4.6.7.1A Grading Cross Sections Drawing 4.6.7.1B Grading Cross Sections Drawing 4.6.7.1C Grading Cross Sections Drawing 4.6.7.1D Grading Cross Sections Drawing 4.6.2A Typical Low Flow Details Drawing 4.6.2B Typical Low Flow Details Drawing 4.6.2C Typical Low Flow Details Drawing 4.6.2D Typical Low Flow Details Drawing 4.8.2 Existing HEC-RAS Cross Sections Drawing 4.8.3 Proposed HEC-RAS Cross Sections Drawing 4.8.4 On-Line Regional Storage Schematic Drawing 4.9.1 Existing and Proposed Floodlines Through Wetland 4 Drawing 4.9.2 Existing and Proposed Floodlines Through Wetland 9 Drawing 4.9.3 Existing and Proposed Floodlines Through Wetland 13 Drawing 6.3.1 Existing Wetlands and Contributing Drainage Areas Drawing 8.2.1 Drainage Density Drawing 9.2.1 SWM Facility F-1 Drawing 9.2.1A Typical Pond Cross-Section Drawing 9.2.2 SWM Facility HE-1 Drawing 9.2.3 SWM Facility HE-2 Drawing 9.2.4 SWM Facility HE-3 Drawing 9.2.5 SWM Facility HE-4 Drawing 9.2.6 SWM Facility HE-5

Final Environmental Implementation Report Mount Pleasant Sub-Area 51-1
September 2011
TOC-11
LIST OF DRAWINGS (cont’d)
Drawing 9.9.3.1 Block 51-1 Diversion Swale with Existing Mississauga Road Conditions Drawing 9.9.3.2 Block 51-1 Diversion Swale with Ultimate Mississauga Road Conditions Drawing 9.9.3.3 Block 51-1 Diversion Swale with Existing Mississauga Road Conditions Drawing 9.9.3.4 Block 51-1 Diversion Swale with Ultimate Mississauga Road Conditions Drawing 10.4.1 Road Crossing (Typical Details) Drawing 10.5.2A CN Crossing Details Drawing 10.5.2B CN Cross-Sections Drawing10.5.2C CN Cross-Sections Drawing 11.1.1 Grading Plan 1 Drawing 11.1.2 Grading Plan 2 Drawing 11.1.3 Grading Plan 3 Drawing 11.1.4 Grading Plan 4 Drawing 11.2 Gas Pipeline Ultimate Crossings Drawing 11.3.1A Minor System Drainage Drawing 11.3.1B Major System Drainage Drawing 11.3.2 Foundation Drain and Roof Drain Collector Systems Drawing 11.4.1A Internal Sanitary Drainage Plan Drawing11.4.1B External Sanitary Drainage Plan Drawing 11.4.2 Water Servicing Drawing 12.1 Diversion Channel Construction and Sequencing Drawing 12.2 NHS Implementation and Construction Staging

Final Environmental Implementation Report Mount Pleasant Sub-Area 51-1
September 2011
TOC 12
LIST OF APPENDICES Appendix A Background Documents
Appendix A-1 EIR Terms of Reference Appendix A-2 Implementation Principles, Appendix F, Secondary Plan Appendix A-3 EIR Workshop Notes and Other Correspondence
Appendix B Geology and Hydrogeology Appendix B-1 Ministry of the Environment Water Well Records Appendix B-2 Monitoring Well Logs Appendix B-3 Hydraulic Conductivity Tests Appendix B-4 Groundwater Elevations Appendix B-5 Surface Water Flow Monitoring Appendix B-6 Wetland Monitoring Appendix B-7 Water Quality Appendix B-8 Groundwater Balance
Appendix C Terrestrial Data Appendix C-1 HFSWS Botanical Inventory Summary Tables Appendix C-2 EIR 2008-2009 Breeding and Road Crossing Amphibian Summary Tables Appendix C-3 Wetland Photographs
Appendix D Hydraulics Appendix D-1 Existing East Huttonville Creek HEC-RAS Results (Riparian) Appendix D-2 Re-aligned East Huttonville Creek HEC-RAS Results (Riparian) Appendix D-3 Existing East Huttonville Creek HEC-RAS Results (with Culverts) Appendix D-4 Re-aligned East Huttonville Creek HEC-RAS Results (with Culverts) Appendix D-5 Huttonville Creek Downstream of Bovaird Dr. HEC-RAS Results (Uncontrolled Flows) Appendix D-6 Post Development Hydrology VO2 Results (Regional Flow) Appendix D-7 Re-aligned East Huttonville Creek HEC-RAS Results (Dynamic, Riparian) Appendix D-8 Realigned East Huttonville Creek HEC-RAS Results (Dynamic, with Culverts)
Appendix E Fluvial Geomorphology Appendix F Vegetation Conservation Plan Appendix G Stormwater Management
Appendix G-1 Storm Sewer Design Sheets Appendix G-2 Impervious Calculations Appendix G-3 SWMM Model Parameters Appendix G-4 Observed vs. Simulated Wetland Water Level Results (Normalized) Appendix G-5 Huttonville Creek Drainage Diversion Memo (AMEC, February 2010)
Appendix H Water Distribution Model Appendix I Wastewater Design Sheets Appendix J Geotechnical Reports

Final Environmental Implementation Report Mount Pleasant Sub-Area 51-1
September 2011
TOC 13
LIST OF ACRONYMS
A Areas of Natural and Scientific Interest ANSIs B Borehole BH C Certificate of Approval CofA City of Brampton City Coefficients of Conservatism CC Community Design Guidelines CDG Conceptual Fisheries Compensation Plan CFCP Corrugated Steel Pipe CSP Course Wood Debris CWD Credit River Fisheries Management Plan CRFMP Credit Valley Conservation CVC Creditview Park City Park D Department of Fisheries and Oceans DFO Diameter at Breast Height DBH Ditch Inlet Catchbasin DICB E Ecological Land Classification ELC Effectiveness Monitoring Strategy EMS Environmental Assessment EA Environmental Implementation Reports EIRs Environmentally Sensitive or Significant Areas ESAs Environmental Study Report ESR F Final Natural Heritage System final NHS Foundation Drain Collector FDCFunctional Servicing Reports FSRs G Geographic Information Systems GIS H Harmful Alteration, Destruction of Disturbance HADD Huttonville and Fletcher’s Creek Subwatershed Study
HFSWS
L Landscape Scale Analysis LSA Low Impact Development LID

Final Environmental Implementation Report Mount Pleasant Sub-Area 51-1
September 2011
TOC 14
M Master Environmental Servicing Plans (MESPs)
Milligrams per Litre mg/L Ministry of Natural Resources MNR Monitoring Well MW Mount Pleasant Secondary Plan MPSP Mount Pleasant Village MPV Mount Pleasant Landowners Group MPLG Mount Pleasant Secondary Plan Natural Heritage System
SPNHS
N Natural Areas and Corridors NAC Natural Heritage System NHS Natural Heritage Information Centre NHIC Natural Heritage Reference Manual NHRM North West Brampton NWB North West Brampton Landowners’ Group NWBLG O Ontario Drinking Water Quality Standards ODWQS P Permit to Take Water PTTW Piezometer PZ Point of Departure POD Potential Natural Areas and Corridors PNAC Provincial Policy Statement PPS Provincial Water Quality Objectives PWQO Provincially Significant Wetland PSW R Rady Pentek & Edward Surveying Ltd. RPE Region of Peel Region Right-of-Way ROW Roof Drain Collector RDC S Second Generation 2G Species at Risk SAR Stormwater Management SWM Stormwater Management Model SWMM Stormwater Ponds SWP Subwatershed Study SWS T Technical Advisory Committee TAC Terms of Reference TOR Test Pits TP Third Generation 3G Total Suspended Solids TSS Total Dissolved Solids TDS

Final Environmental Implementation Report Mount Pleasant Sub-Area 51-1
September 2011
TOC 15
Toronto Region and Conservation Authority TRCA TransCanada/Enbridge Pipeline TCPL Transportation Master Plan TMP U U.S. Army Corps of Engineers' River Analysis System
HEC-RAS
W Water Well Information System WWIS Wetland W#

Final Environmental Implementation Report Mount Pleasant Sub-Area 51-1
September 2011
1-1
1.0 INTRODUCTION
1.1 Study Purpose
On February 10, 2010, Council of the City of Brampton (City) adopted the Mount Pleasant
Secondary Plan (MPSP) through Amendment OP2006-038. The MPSP Area consists of approximately 845 ha bounded by Mississauga Road, Mayfield Road, McLaughlin Road,
Wanless Drive, Creditview Road/James Potter Road and Bovaird Drive West.
The purpose of the MPSP is “…to implement the policies of the City of Brampton Official Plan by establishing, in accordance with Section 5.4 and Section 4.14 of the Official Plan and the City's Growth Management Program, a policy framework and direction for detailed land use planning to guide the future development of a new community in the City of Brampton as outlined on Schedule SP 51(a), and to specify desired land use patterns, a transportation network, a Natural Heritage System and related policies to achieve superior, efficient, orderly and ecologically responsible urban development. Further, it sets out the planning controls to be used in implementing these policies”. The MPSP is intended to be a transit oriented and pedestrian friendly community that
promotes environmental sustainability and superior community design. The MPSP Land Use Schedule SP1a is provided in Figure 1.1.1. As illustrated, a number of major
structural elements define the community, including:
• a Natural Heritage System (NHS) that identifies, protects, restores and enhances
the diversity and connectivity of natural areas and features;
• a transit supportive Spine Road linking the community to the Mount Pleasant GO
Station;
• an integrated, safe, effective and efficient transportation and transit system that
includes Sandalwood Parkway, Creditview Road and the northerly extension of
James Potter Road and an internal collector road network;
• a variety of housing types and densities, including live-work units in strategic
locations;
• mixed-use Nodes located along the transit spine, creating compact urban forms
of housing, retail, commercial, office, as well as places of worship and live-work
units;
• community uses and features including elementary, middle and secondary
schools;
• a retail hierarchy consisting of district, neighbourhood, convenience and motor
vehicle retail/commercial sites; and,
• places of worship.

Final Environmental Implementation Report Mount Pleasant Sub-Area 51-1
September 2011
1-2
The City has advanced an initiative within the MPSP involving a Modified Block Planning
Process aimed at streamlining the approvals process. The goal is to approach community planning in a more comprehensive manner which will include the concurrent
processing of subdivision applications. Community Block Plans are meant to implement the policies of Secondary Plans on a sub-area basis by coordinating the completion of
detailed environmental, servicing, transportation, urban design and growth management
analyses and approvals. Specific component studies are required at the Block Plan Stage, while a separate set of reports are required in support of Draft Plan of Subdivision
approval. An Environmental Implementation Report (EIR), Land Use Justification Report, Growth Management Report, Transportation Study and Community Design Guidelines are
required in support of a Block Plan.
With respect to the EIR, Policy 10.1.4 of the MPSP states:
“10.1.4 As part of the Block Plan process, an Environmental Implementation
Report shall be prepared to demonstrate that issues of stormwater management and infiltration, and confirmation of the limits of the Natural Heritage System, including the constraints of watercourse corridors, woodlands, wetlands, hedgerows and field swales are addressed. Detailed studies will be addressed in accordance with the recommendations of the approved North West Brampton Landscape Scale Analysis and Subwatershed Study. The EIR shall consist of three parts: Existing Conditions and Constraint Mapping, Detailed Studies, and Stormwater Management”.
An EIR must be prepared to the satisfaction of the City, in consultation with the Credit Valley Conservation (CVC) and the Region of Peel (Region). As identified in the City’s
Official Plan, the scope of an EIR, “will be determined based on the policies in Sections 4.5.2.1, 4.5.2.2, 4.5.2.3 and 4.5.2.4”. These sections of the City’s Official Plan are reproduced below:
“4.5.2.1 Environmental Implementation Reports (EIRs) (or Master Environmental
Servicing Plans (MESPs) as appropriate) shall be required to address the impacts of development on the natural environment and to implement the recommendations of subwatershed studies. EIRs shall be completed to the satisfaction of the City of Brampton in consultation with the relevant agencies prior to approval of a community block plan.
4.5.2.2 Environmental Implementation Reports (or Master Environmental Servicing Plans as appropriate) will include but are not limited to: (i) Inventories and analysis of the natural heritage features, functions
and linkages including vegetation, fish and wildlife habitat, topography, soils, groundwater and surface water hydrology, fluvial geomorphic processes, and natural hazards including flooding, erosion and meander belt width, slope stability, etc;
(ii) An analysis of the individual and cumulative environmental effects
that are expected to occur as a result of the proposed development and future uses;

Final Environmental Implementation Report Mount Pleasant Sub-Area 51-1
September 2011
1-3
(iii) The consideration and evaluation of alternatives including land use, engineering, subdivision design and infrastructure, and mitigation, enhancement and restoration measures; and,
(iv) A commitment to implementing Adaptive Environmental Monitoring
(AEM) including measures for compliance and long term monitoring and the ongoing management of measures for the protection, maintenance, and enhancement of natural features, functions and linkages to achieve long term ecosystem health.
4.5.2.3 Environmental Implementation Reports (or Master Environmental
Servicing Plans (MESPs) as appropriate) will be prepared to the satisfaction of the City of Brampton in consultation with the local area Conservation Authority and the Region of Peel. Adjacent municipalities will be consulted if there is likely to be potential impact on downstream watercourses.
4.5.2.4 In some instances, the City in consultation with the area Conservation Authority may determine that a scoped Environmental Implementation Report is appropriate.”
The EIR Terms of Reference (TOR), specific to the preparation of the EIR for
Sub-Area 51-1, were prepared and approved by the City, the CVC and the Ministry of Natural Resources (MNR) in July 2010. The TOR outlines the purpose, study area, scope
of work and EIR schedule. A copy of the TOR is provided in Appendix A-1.
The City endorsed the Block 51-1 Block Plan process and schedule including a phased
approach to the preparation of the required EIR. This involved the preparation of a Scoped EIR, to be followed by a full EIR submission. The Scoped EIR, submitted in
August 2010, addressed certain elements of the TOR required for the City’s review and
endorsement of major structural elements of the Block Plan, largely relating to the NHS’ boundaries and stormwater management (SWM). The Scoped EIR provided
documentation on the NHS’ boundaries and SWM support at sufficient detail to allow the approval, in principle, of the Block Plan in September 2010.
In January 2011, a full submission of the Block 51-1 EIR was made to address all EIR requirements set out in the EIR TOR. It provided a substantial amount of data, analyses
and design recommendations on all TOR requirements to support the adoption of the City’s Block Plan in early 2011 through the requisite Official Plan Amendment. Comments
on the January 2011 EIR were received from the City (March 3, April 26, April 29 and May 30, 2011), the CVC (April 12, 2011), and verbally from the MNR in a
series of workshops held throughout the spring and summer of 2011. This Final EIR
(September 2011) supersedes the January 2011 EIR with revisions made to address all agency comments.
1.2 Study Area
The North West Brampton (NWB) lands are bounded in the north by Mayfield Road, in the east by McLaughlin Road and Creditview Road, in the south by Wanless Drive,
Bovaird Drive West and the main Credit River Valley and to the west by Winston Churchill Boulevard. Within the NWB lands, the MPSP area lands are located east of Mississauga

Final Environmental Implementation Report Mount Pleasant Sub-Area 51-1
September 2011
1-4
Road. Figure 1.2.1 illustrates the location of the NWB lands as well as the boundaries
of the MPSP Area.
Within the MPSP, there are two Block Plan Areas – Sub-Area 51-1 and Sub-Area 51-2. The lands for this EIR are defined to be Sub-Area 51-1, as illustrated on Figure 1.2.1. The area covers approximately 516 ha, lying east of Mississauga Road, north of Bovaird
Drive West, west of new Creditview Road (and future James Potter Road), and south of Mayfield Drive (Study Area).
Sub-Area 51-1 lands lie within three surface water subcatchments as set out on
Figure 1.2.2:
• The East Huttonville Creek subcatchment is situated in the central portion of the
Study Area. It encompasses approximately 371 ha or 72% of the
Sub-Area 51-1 lands.
• The West Huttonville Creek subcatchment lies in the northwest portion of the
Sub-Area 51-1 lands. It covers approximately 54 ha or 10% of the Sub-Area 51-1 lands.
• The West Tributary subcatchment of Fletcher’s Creek is located in the northeast
portion of the Sub-Area 51-1 lands. It covers approximately 91 ha or 18% of the Sub-Area 51-1 lands.
The EIR Subcatchment Areas, situated within the Sub-Area 51-1 lands, are defined to be the East Huttonville Creek, West Huttonville Creek and West Tributary of Fletcher’s Creek subcatchments.
The total land area comprising Block Plan Area 51-1, including lands held privately and those under public ownership, equals 516.42 ha. The Block Plan Area 51-1 participating
landowners own approximately 452 ha. This represents 96% of all privately held lands within the Block Plan Area. Ownerships are illustrated on Figure 1.2.3.
The MPSP is located immediately adjacent to the Mount Pleasant Village (MPV) Mobility Hub. The MPV is located within the Fletcher’s Meadow Secondary Plan Area referred to
as Block Plan Area 44-1. The MPV is comprised of approximately 60 ha. It is located in the northwest quadrant of Creditview Road and Bovaird Drive West, including the Mount
Pleasant GO Transit Station. In addition to a broad range of community oriented facilities, the approved MPV Plan includes a broad range of residential uses, including
single detached, freehold townhouse residential units, freehold live-work townhouse
units, and mixed-use residential and commercial apartment units. In June 2008 and September 2009, the City granted MPV Stage 1 and Stage 2 Block Plan Approval,
respectively. The MPV was granted Draft Plan Approval in February 2010, with the first phase being registered in March 2010; construction is ongoing. Engineering, planning,
environmental and transportation design with the MPV has been reviewed and
coordinated with the design of Block Plan Area 51-1.

Final Environmental Implementation Report Mount Pleasant Sub-Area 51-1
September 2011
1-5
1.3 Background Studies and Secondary Plan Implementation Principles
An EIR is intended to provide a further level of detail and study to implement findings
and recommendations of several background studies. In this instance, this EIR addresses findings and recommendations of the Landscape Scale Analysis (LSA) and the
Huttonville and Fletcher’s Creeks Subwatershed Study (HFSWS), Transportation Environmental Assessments, applicable secondary plan policies (including the MPSP
Implementation Principles), the Comprehensive Fisheries Compensation Plan (CFCP,
September 2011) and the Block Plan Community Design Guidelines (January 2011). The following sections briefly outline major studies providing guidance to the preparation of
this EIR.
1.3.1 Landscape Scale Analysis
The LSA and HFSWS were completed concurrently to jointly assess the natural
environment and make recommendations for natural heritage planning. The purpose of the LSA was to model, through a Geographic Information Systems (GIS) analysis, the
inter-relationship of ecosystem features and functions at a landscape scale, to interrelate the landscape ecology of the NWB Area to the surrounding landscape within the larger
watersheds (i.e., Credit River Valley and Etobicoke Creek watersheds) and to provide
context to the subwatershed studies and municipal land use planning.
The NWB LSA considered lands 2.5km outside of the NWB Study Area and related subwatershed boundaries as illustrated on Figure 1.2.2. The LSA has assessed natural
features and their relationship to other natural heritage features related to the Credit
River Valley and Etobicoke Creek Watershed, which lie adjacent to the NWB lands. The LSA study area includes all of the NWB lands, including the MPSP Area.
The Draft North West Brampton Landscape Scale Analysis in Support of the Mount Pleasant Secondary Plan Subwatershed Study was prepared in August 2007 and circulated to the City, the CVC and the MNR for comment. Through an iterative process,
the LSA has, in conjunction with the HFSWS and the Mount Pleasant Secondary Plan,
established a NHS for the Huttonville and Fletcher’s Creek subwatersheds. From the LSA perspective, the NHS was developed in a broad environmental system context, which
included the interpretation and understanding of the hydrologic function and infrastructure necessary to support sustainable development. It provided input to
decision-making at the subwatershed scale, to ensure connectivity and ecosystem
function across the larger landscape.
The LSA is a living document that will be revised as part of the Heritage Heights Secondary Plan and Subwatershed Study. Its input to the Mount Pleasant lands was
finalized through the issuance of the June 2011 LSA report in conjunction with the conclusion of the Huttonville and Fletcher’s Creek Subwatershed Study.

Final Environmental Implementation Report Mount Pleasant Sub-Area 51-1
September 2011
1-6
1.3.2 Huttonville and Fletcher’s Creeks Subwatershed Study (HFSWS) The HFSWS includes the study of the Fletcher’s Creek subcatchments, East Huttonville
Creek subcatchment and the West Huttonville Creek subcatchment within and beyond the MPSP area.
The purpose of the HFSWS is to document existing natural resources conditions, assess potential impacts of existing and future development and recommend management
strategies to manage and mitigate the impacts, including comprehensive SWM strategies. The HFSWS includes a review and analysis of all undeveloped lands within the Huttonville
and Fletcher’s Creeks subwatershed areas. This encompasses those lands within the City
and the Town of Caledon and builds upon the information, analysis and recommendations contained within the past Credit Valley and Fletcher’s Creek
subwatershed studies and approved EIRs. In conjunction with the LSA and land use planning process, the HFSWS identifies a linked NHS to be protected, restored and
enhanced.
Subwatershed studies typically include four phases, consisting of Phase 1-
Characterization; Phase 2 - Impact Assessments; Phase 3 - Management Strategies and Implementation; and Phase 4 - Monitoring. Phases 1, 2 and 3 of the HFSWS are
complete and documented through the following reports:
• Phase 1: Subwatershed Characterization and Integration Report (December 2007);
• “Working Paper”, Phase 2: Subwatershed Impact Assessment Testing of the Point of Departure Plans, North West Brampton, Mount Pleasant Community (June 2009);
• “Working Paper”, Phase 2: Subwatershed Impact Assessment Testing of the Second Generation (2G) Land Use Plan, Mount Pleasant Community (March 2010);
• Phase 2: Subwatershed Impact Assessment (June 2011); and, • Phase 3: Management Strategies and Implementation Plan (June 2011).
The following briefly outlines the HFSWS and related work completed to date as it affects
this EIR:
• SWS Phase 1 Characterization - The HFSWS Phase 1 Characterization Report
(December 2007) documented fieldwork and analyses of Fletcher’s Creek, East
Huttonville Creek and West Huttonville Creek subcatchments. This work included inventories and analyses of water quality, fisheries, terrestrial and aquatic
resources, fluvial geomorphology, geology, hydrogeology, hydrology and
hydraulics. It summarized the value, function and sensitivity of natural resources within the Huttonville and Fletcher’s Creeks subwatersheds. Background and
field data were assessed to establish the form, function and linkages of the environmental resources. From this work, preliminary goals and objectives were
developed relevant to the subwatersheds under study. This work provided characterization of existing conditions within the MPSP area and assisted in the
preparation of land use plans to be tested as part of Phase 2 SWS work.
This existing characterization work has been referenced and supplemented with
further site fieldwork during the preparation of this EIR. The EIR fieldwork has

Final Environmental Implementation Report Mount Pleasant Sub-Area 51-1
September 2011
1-7
been ongoing since 2007; its findings were provided as input to the SWS
characterization as they became available.
• Wetland Evaluations - In 2007/2008, the MNR completed draft wetland
evaluations within the Huttonville Creek, Fletcher’s Creek and Credit River Tributaries’ subcatchments. This resulted in the identification of several
candidate provincially significant wetlands within the MPSP area. These wetlands
were identified for further study through the HFSWS and Secondary Plan to determine an appropriate NHS for the Mount Pleasant lands. Based on the
HFSWS and Secondary Plan work, most wetlands are protected in the NHS. The functions of those that are proposed for removal will be restored in newly
created wetlands in the future NHS.
• SWS Phase 2 Impact Assessments - The HFSWS Phase 2 impact
assessments of the Point of Departure (POD) Land Use Plan, the Second
Generation (2G) Land Use Plan and the Third Generation (3G) Land Use Plan are complete. The HFSWS Phase 2 work assessed the potential effects of these land
use plans on natural resources and the NHS through hydrologic, hydrogeologic and hydraulic modeling and qualitative analyses of the entire Huttonville Creek
and Fletcher’s subwatersheds. Through the SWS Phase 2 testing of land use
plans against subwatershed working targets, changes to the land use plans were recommended and management strategies were identified. These SWS analyses
provided input to the preparation and endorsement of the MPSP land use, including the Secondary Plan Natural Heritage System (SPNHS). The March 2010
Working Paper documents the 2G Land Use Plan impact assessments; the June 2011 Phase 2 Report documents the 3G Land Use Plan impact assessments.
• SWS Phase 3 Management Strategies and Implementation – The HFSWS
Phase 3 work was completed and documented in the June 2011 report entitled, Phase 3: Management Strategies and Implementation Plan, Subwatershed Study for the Huttonville and Fletcher’s Creeks. The Phase 3 report presents recommended management measures and practices for the Mount Pleasant
community based on the 3G Land Use Plan, as evaluated during the Phase 2
impact assessments. The management measures provide direction to the Block Plan and EIR studies. In addition, the recommended monitoring strategy
establishes requirements from each discipline to evaluate how the respective management solutions are functioning relative to subwatershed goals, objectives
and targets.
The Phase 3 report was referenced during the preparation of this EIR to ensure
that the recommended HFSWS management measures are incorporated into the Block Plan and servicing designs.
1.3.3 Mount Pleasant Secondary Plan Implementation Principles
The SPNHS, illustrated on Secondary Plan Schedule SP 51(a), is presented on
Figure 1.1.1. The SPNHS is comprised of valleylands and watercourse corridors, woodlands, wetlands, and environmental buffers, as well as restoration areas and
connecting corridors. The boundaries of the SPNHS reflect findings of the LSA, HFSWS and principles outlined in the "Implementation Principles for the Subwatershed Study, November 24, 2009", attached as Appendix F to the Secondary Plan. The

Final Environmental Implementation Report Mount Pleasant Sub-Area 51-1
September 2011
1-8
Implementation Principles were agreed to by the City, the CVC, the MNR and the Mount
Pleasant Landowners’ Group (MPLG). The Implementation Principles includes a schedule detailing the components of the NHS and a series of preliminary conceptual restoration
plans, as well as a work plan and schedule for Subwatershed Study, Block Plan, and EIR approval. It sets out agreement and direction on several design requirements for the
Mount Pleasant lands including NHS boundaries, buffers, channel relocation, lowering
and widths, NHS restoration/enhancement, trails, SWM, comprehensive fisheries compensation plan, drainage density, road crossing design and implementation
considerations. A copy of Appendix F is attached in Appendix A-2. Schedule A from this document is attached illustrating the agreed upon NHS elements and conceptual
boundaries.
The Implementation Principles differentiate between the SPNHS and the final NHS. The
SPNHS is set out in the MPSP; it also forms part of the Second Generation (2G) Land Use Plan tested in the second round of the HFSWS Phase 2 impact assessments. The
Implementation Principles note the final Natural Heritage System (final NHS) will be identified following the completion of Phase 2 of the HFSWS and will be reflected in the
HFSWS and EIRs.
Secondary Plan policies note that the boundaries of the final NHS are to be confirmed
through the HFSWS and may be refined through the EIRs consistent with the principles outlined in Appendix F (see Appendix A-2). Policies further note that minor
refinements to the boundaries of the SPNHS may be considered to reflect the differences in scale and level of detail available through the preparation of the EIR and Functional
Servicing Reports (FSRs). However, minor refinements shall not adversely impact the
functions or result in any significant increase or decreases in size of the final NHS. The Secondary Plan clearly states that lands located outside of the limits of the final NHS
shall be considered to be available for development, as illustrated on Schedule SP51(a). The Secondary Plan and the Implementation Principles summarize key NHS issues that
are addressed and documented in more detail in the EIR.
1.3.4 Comprehensive Fisheries Compensation Plan (CFCP) Important elements of the SPNHS are the relocation and/or lowering of the East
Huttonville Creek and five Fletcher’s Creek tributaries. These watercourses provide direct
and/or indirect fish habitat, and therefore alterations to these features will require approval under the Federal Fisheries Act and Ontario’s Endangered Species Act.
To facilitate and expedite the review of individual projects within the Block Plan areas
that have the potential to affect fish habitat (e.g., transportation and servicing crossings of watercourses, channel lowerings, channel realignments, etc.), the Department of
Fisheries and Oceans’ (DFO) representatives requested the preparation of a CFCP in the
Fall of 2009 during their review of the SWS. A draft CFCP was submitted to the Agency stakeholders in early January 2011, and based upon Agency comments, a revised report
was submitted for review on June 14, 2011. Further comments have been received from the CVC and discussions have occurred during two Agency workshops held on
July 26 and August 10, 2011 and in e-mail comments (August 3 and September 6, 2011).
Comments have also been received from the MNR via e-mail dated September 2, 2011.

Final Environmental Implementation Report Mount Pleasant Sub-Area 51-1
September 2011
1-9
The CFCP serves as a guidance document to allow for pre-notification of projects with
the potential to affect fish habitat, as well as to provide criteria for mitigation and compensation approaches for the detailed design of such projects, including construction
activities, facilities and structures. In addition to the Fisheries Act process, the presence of the Provincially Endangered Redside Dace, in the East and West Branches and Main
Huttonville Creek and Fletcher’s Creek, elevates the regulatory scrutiny on proposed
watercourse alterations by engaging the MNR to review various project components under the Endangered Species Act, 2007. The Committee on the Status of Species at
Risk in Ontario (COSSARO) originally assessed the Redside Dace as “threatened” in 2000. The species was uplisted to endangered in 2009 and is protected under Ontario’s
Endangered Species Act, 2007 (ESA 2007).
Federally, in 1987 Redside Dace was originally assessed as special concern in Canada by
the Committee on the Status of Endangered Wildlife in Canada (COSEWIC). In April 2007, COSEWIC uplisted Redside Dace and designated it as endangered in Canada. It is
currently listed as Schedule 3, special concern (not endangered) under the federal Species at Risk Act and Schedule 1 provisions do not apply.
The provincial Recovery Strategy for the Redside Dace was approved in February 2010, a Draft Final Government Response Statement was released in September/November,
2010 and the Final Government Response Statement was released in June 2011. The Final Response Statement summarizes the policy response to the scientific advice
provided in the Recovery Strategy, outlines the framework and flexibility for annual prioritizing and implementation of actions, and defines the nature of support that the
Government of Ontario intends to take in response to the Recovery Strategy. Within
nine months after the Recovery Strategy for any species is prepared, the ESA requires that the MNR publish a statement that summarizes the Government’s intended actions
and priorities in response to the Recovery Strategy. The Government Response Statement is not intended to provide detailed action or implementation plans. It provides
no specific instruction or guidance to proponents regarding the definition of habitat for
this species or the buffers that should be incorporated into the development design beyond the information provided within the Recovery Strategy. It does provide a series
of Government-led actions (those to be undertaken directly by the Government) and Government-supported actions (those that are feasible for the Government to support its
conservation partners to undertake) that collectively are intended to aid in the protection
and recovery of the species.
Up until June 30, 2011, Redside Dace and its habitat were protected under the general habitat provisions of the ESA. As of July 1 2011, the MNR finalized Ontario Regulation
293/11, which amended Regulation 242/08 to include a species-specific habitat regulation and provide specific definitions of the boundaries and elements of the habitat
of Redside Dace that are regulated under the ESA. The species-specific habitat
regulation is the legal description of a species habitat that replaces the general habitat provisions of Ontario Regulation 242/08. Redside Dace habitat in Sub-Area 51-1, defined
on the basis of Ontario Regulation 293/11, is described in detail in Section 2.2.2.4 of this EIR.
Alteration or elimination of headwater features that indirectly support the species will require review and/or approval under the ESA. Accordingly, the CFCP:

Final Environmental Implementation Report Mount Pleasant Sub-Area 51-1
September 2011
1-10
• documents the extent of Redside Dace habitat;
• identifies which aquatic features are being protected, restored, altered or
eliminated; and,
• proposes the foundation for an overall benefit plan or mitigation plan for the
purpose of addressing future approvals under Ontario’s Endangered Species Act, 2007.
In addition to the direct alteration of the watercourses, the CFCP outlines proposed site alterations that have the potential to affect aquatic resources and fish habitat such as
wetland remediation and creation, NHS enhancement, SWM outlets, CNR culvert improvements, removal of existing road culverts, loss, replacement and enhancement of
drainage features and new road and services crossings of the creeks. It scopes issues
related to fish habitat such that Agency review of the document will ultimately lead to “agreement in principle” of various conceptual designs for projects such as crossings,
channel lowerings and realignments, and channel remediation and drainage feature replacement/enhancement. By obtaining agreement, in principle, for various proposed
alterations, the document will serve to guide future detailed designs for specific projects
and lead to a streamlined approval process for future permitting in accordance with an approved CFCP.
The Implementation Principles, referred to in Section 1.3.3 herein, recognize the request
for the preparation of a CFCP and commit to its completion by stating, “A Conceptual Fisheries Compensation Plan (CFCP) will be completed and submitted for approval concurrent with the preparation of Phase 3 of the SWS and the EIRs during the Block Plan process. The CFCP will be a free-standing document with a separate submission and approval process”. This report, entitled a Comprehensive Fisheries Compensation Plan is different than the Conceptual Fisheries Compensation Plan that has been prepared in support of development in other locations in the past (notably within the Town of Milton). The use of the descriptor “comprehensive” is intended to convey the fact that this report provides
a greater amount of design detail than would occur within a Conceptual Fisheries Compensation Plan. A Comprehensive Fisheries Compensation Plan is provided in this
case at the request of the MNR/DFO/CVC as a result of the presence of the endangered
Redside Dace within the lower portions of the East Huttonville Creek and in downstream reaches of Fletcher’s Creek.
The draft CFCP was submitted for Agency review in January 2011, and a revised report
was re-submitted in June 2011. A Final CFCP is currently being finalized based on recent comments from Agency staff. It provides guidance to the design of and approval
requirements for various components of the Mount Pleasant NHS. This revised EIR
document reflects the recommendations of the CFCP.
1.4 Block Plan EIR work has been ongoing since 2007 when fieldwork was initiated and EIR level of
technical analyses were undertaken with respect to site grading, SWM, NHS restoration planning and channel design. The June 10, 2010 Block Plan prepared by Gagnon + Law
Urban Planners formed the basis for the analyses presented in the Scoped EIR in August 2010. The Block Plan for Sub-Area 51-1 received the City’s Council approval-in-principle
on September 15, 2010. Since that time, further revisions have been made to the Block

Final Environmental Implementation Report Mount Pleasant Sub-Area 51-1
September 2011
1-11
Plan based on input received from the City and other technical analyses. The Block Plan,
dated May 20, 2011, forms the basis for the Final EIR study. This Block Plan is illustrated on Figure 1.4.1. The land uses proposed for Block Plan Area include:
• residential (single detached, semi-detached, street and lane based
townhouses, condominium townhouse and apartment units);
• mixed-use nodes (commercial and higher density residential);
• live-work units;
• commercial (district, neighbourhood, convenience and motor vehicle
commercial); • NHS, parks, and open space; and,
• institutional (places of worship, fire hall, public library and schools).
The Final EIR has proposed and examined realignment of Sandalwood Parkway, as a
follow-up to the Mount Pleasant Transportation Study and has identified impacts and mitigation measures/best practices with regard to specific natural features of the NHS in
the vicinity of the realignment. Section 10.4.2.3 discusses the realignment and mitigative measures. The realignment is illustrated on the Block Plan (Figure 1.4.1).
1.5 EIR Workshops
EIR studies have historically taken a substantial length of time for their completion, review and approval. To reduce this lengthy study process, a more consultative process
was established for the preparation of the Sub-Area 51-1 EIR. This involved numerous
working sessions or workshops with the City, the CVC and the MNR staff to review and discuss technical approaches, findings and recommendations prior to the completion of
the EIR. This facilitated Agency input on all EIR matters prior to EIR submission to improve its content and understanding of the basis for various recommendations. This
approach is expected to substantially reduce EIR review time.
A series of ten workshops were held through 2010 and 2011. The following sets out the
general topics for discussion at each of these workshops:
• the June 9, 2010 Workshop discussed EIR TOR, environmental features
surveys, NHS restoration concepts, trail design, wetland water balance methodology, channel design concepts, pond design for thermal mitigation
and general implementation considerations;
• the July 14, 2010 Workshop discussed EIR TOR, environmental features
surveys, NHS restoration concepts, trail design, channel design concepts,
and Scoped EIR content;
• the October 13, November 10 and December 8, 2010 Workshops focused on
wetland water balance methodology but also included reporting on the
status of the CFCP, tour of channel designs in Brampton, separate December 2, 2010 floodplain hydraulics meeting and City Park alterations;
• the February 9, 2011 Workshop was held to discuss the transition between
the Huttonville/Fletcher’s Subwatershed Study and the Sub-Area 51-1 EIR;
and,

Final Environmental Implementation Report Mount Pleasant Sub-Area 51-1
September 2011
1-12
• the March 9, April 13, June 15 and July 26, 2011 Workshops discussed
technical items such as CNR culvert design, wetland water balance
calculations, Sandalwood Parkway alignment, Fletcher’s Creek area balancing, riparian storage calculations, trail design, construction staging and
sequencing, and natural channel design.
Valuable input received at each of these Workshops was considered through the
preparation of this EIR. Further details on workshop discussions are provided in some EIR report sections addressing specific technical components of the EIR. Workshop
notes are appended in Appendix A-3.
In addition to the EIR Workshops, three separate meetings were held with the City, the MNR and the CVC (June 8 site walk, June 28 and August 16, 2011) to discuss
Sandalwood Parkway alignment, Bobolink habitat, natural channel design and wetland
restoration design. The DFO attended the latter session. Guidance regarding natural channel design parameters for Redside Dace was discussed and ranges of parameters
outlined for consideration in detailed design. Two potential wetland restoration approaches were identified for further study at detailed design and are presented in this
Final EIR. These meeting notes are provided in Appendix A-3.
1.6 Phased EIR Format and Schedule As noted in Section 1.1, a phased approach to the preparation of the Block 51-1 EIR was
established to meet the schedule endorsed by the City for Block Plan review and approval
in 2010 and 2011, as presented in Table 1.6.1. The phased approach to the EIR preparation included a Scoped EIR (August 2010), a draft full EIR (January 2011) and
the Final EIR (September 2011). The Final EIR addresses all technical matters set out in the EIR TOR.

Final Environmental Implementation Report Mount Pleasant Sub-Area 51-1
September 2011
1-13
Table 1.6.1 Block Plan and EIR Timetable
Milestone
Completion Date
Submission of EIR Terms of Reference March 2010
Submission of Formal Block Plan, Draft Plan, Zoning
Amendment Applications
May 2010
Public Meeting on Block Plan and Draft Plans June 7, 2010
EIR Workshop #1 June 9, 2010
Submission of Staking of Environmental Features Limits June 9, 2010
EIR Workshop #2 July 14, 2010
Approval of EIR Terms of Reference July 2010
Submission of Scoped EIR August 2010
Approval in Principle of Block Plan (City) September 15, 2010
EIR Workshop #3 October 13, 2010
EIR Workshop #4 November 10, 2010
EIR Workshop #5 December 8, 2010
Submission of Draft Full EIR January 2011
EIR Workshop #6 February 9, 2011
EIR Workshop #7 March 9, 2011
EIR Workshop #8 April 13, 2011
Block Plan Approval May 2011
Agency Site Walk June 8, 2011
EIR Workshop #9 June 15, 2011
Agency Meeting June 28, 2011
EIR Workshop #10 July 26, 2011
Agency Meeting August 16, 2011
Submission of Final EIR September 2011
Draft Plan Approval October 2011

Final Environmental Implementation Report Mount Pleasant Sub-Area 51-1
September 2011
2-1
2.0 EXISTING CONDITIONS ________________________________________________________________________
The Study Area is located between urbanized areas in Brampton to the south and east,
and the predominantly natural areas on the Oak Ridges Moraine and Niagara Escarpment to the north and west. The fragmented character of land cover within the Study Area is
expressed by a low proportion (less than 6%) of remaining natural ecosystems, mostly forests and wetlands, and their high degree of isolation. The natural ecosystems tend to
be concentrated along small stream corridors while the agricultural use tablelands contain a very small amount of native vegetation cover.
Characterization of existing conditions, including discussion of the geology, hydrogeology, fluvial geomorphology, terrestrial and aquatic ecology, hydrology and hydraulics was
completed as part of the HFSWS and documented in the Phase 1: Subwatershed Characterization and Integration Report (December 2010). This work has been
thoroughly reviewed and augmented with additional fieldwork as required to characterize
existing conditions at the EIR level of detail.
Sections 2.1 through 2.3 outline existing conditions by discipline. Note that the existing conditions of the wetlands have been characterized in detail and as such, have been
reported separately in Section 6.0.
While reported separately by discipline, this work was undertaken and integrated
between disciplines to ensure that inter-relationships that exist between surface water, groundwater, receiving wetlands and watercourses, aquifers and other NHS features
were identified. Numerous team working sessions were held to discuss and understand these inter-relationships so that potential implications of development to various
components of the NHS could be identified and input provided to recommendations
regarding final NHS boundaries, design and mitigative measures to protect the NHS over the long term.
The terminology referenced in the HFSWS to denote the terrestrial units and hydrologic
model nodes has been utilized when describing these features for consistency. The MNR
wetland numbering system has been utilized to refer to wetland units. Names have also been given to the various woodlands, with names referring to adjacent road names,
where possible. Figure 2.0.1 illustrates all woodland, wetland and stream reach terminology used throughout the EIR. Stream reaches noted are consistent with those
outlined in the CFCP (October 2011) and the final HFSWS (June 2011).
2.1 Geology and Hydrogeology
2.1.1 Scope of Work
Consistent with the EIR TOR requirements and the HFSWS Phase 3 recommendations, a hydrogeological work program was completed to:

Final Environmental Implementation Report Mount Pleasant Sub-Area 51-1
September 2011
2-2
• provide an overview of the regional hydrogeological setting;
• determine the local hydrogeological conditions through site-specific investigations, testing and monitoring;
• characterize the local soil, groundwater, and surface water flow conditions;
• map the groundwater flow directions and identify the groundwater recharge and
discharge conditions across the Study Area;
• assess local groundwater/surface water interactions and the recharge/discharge
functions of the wetland features;
• characterize the existing surface water and groundwater quality through the
collection and testing of water samples;
• identify existing water supply wells and groundwater uses in the Study Area and within 500m of the proposed development area;
• provide input to the pre- and post-development feature-based water budget analyses and identify hydrogeological opportunities and constraints to maintain
the water balance;
• evaluate opportunities for augmenting groundwater infiltration through appropriate and practical best management and Low Impact Development (LID)
practices to balance, or at least in part, make up the post-development
infiltration deficit and provide input to the type, location and size of infiltration or soil storage measures that may be feasible for use based on the geological and
hydrogeological conditions;
• identify potential impacts from the proposed development on the groundwater
conditions for environmental features, watercourses, and water supply aquifers and provide input to mitigative measures, where necessary; and,
• identify construction constraints related to the hydrogeological conditions and
provide input to mitigation measures, where necessary.
The detailed scope of work included:
• A review of the geological and hydrogeological information from the HFSWS as
well as other relevant studies, including published geology maps and local hydrogeology work completed by the Interim Waste Authority (IWA, 2003).
• A review of the Ministry of the Environment’s (MOE) water supply well records and available geotechnical borehole drilling and test pit records for the Study
Area to assess the regional hydrogeological setting and soil conditions. A listing of the MOE’s water supply well records for the Study Area is provided in the
attached Appendix B-1. Borehole logs for the groundwater observation wells in
the Study Area are provided in Appendix B-2. Geotechnical test pit logs are included in Appendix I. The locations of the water supply wells, boreholes and
test pits are illustrated on Figure 2.1.1.

Final Environmental Implementation Report Mount Pleasant Sub-Area 51-1
September 2011
2-3
• The drilling and installation of 27 groundwater monitoring wells (including
shallow and deep wells in 7 well nests) to determine the local stratigraphy and
investigate the site-specific soil and groundwater conditions across the Study Area. The groundwater monitoring well (MW) locations are shown on
Figure 2.1.2 and copies of the borehole logs and monitoring well construction details are provided in Appendix B-2. Three monitoring wells installed by the
City as part of the HFSWS (BB-BH1s/d and BB-BH2) were also included as part of the monitoring network for the Study Area. Borehole logs and well construction
details are provided in Appendix B-2.
• The installation of 23 drive-point piezometers (including 10 nests of two pipes
and 3 single pipes) in wetlands and along the East Huttonville Creek to investigate shallow groundwater/surface water interactions. The piezometers
consist of steel riser pipe and custom manufactured screens (drive-point tips)
that are manually driven (pounded) to shallow depths (generally less than 2m) utilizing a modified post-hole driver. The piezometer locations (PZ) are set out
on Figure 2.1.2. A piezometer nest installed in the City Park wetland by the City, as part of the HFSWS (PZ-BB-1s/d; Figure 2.1.2), was also included as
part of the monitoring network for the EIR Study Area.
• The single-well response testing (bail down tests) of 4 groundwater monitoring
wells (2 well nests) to estimate the in-situ hydraulic conductivity of the geological units. The field testing results are included in Appendix B-3.
• The monitoring of groundwater levels to measure the depth to water in each
monitoring well and piezometer and to assess the horizontal and vertical
groundwater flow conditions. For this study, water level monitoring was initiated in October 2007 and completed monthly for over a two-year period until
December 2009, and then the frequency of monitoring was changed to quarterly through June 2011. Monitoring stations were added over time, but all locations
have a minimum of 18 months of monthly readings. In addition to the manually
recorded monthly groundwater levels, automatic water level recorders (dataloggers) were installed in selected monitoring wells and piezometers to
record detailed water level measurements. A barometric pressure recorder was also installed in the Study Area for use in the datalogger data analysis. The
groundwater monitoring data for the monitoring wells are summarized in Table B-4-1 in Appendix B-4. The monitoring data for the piezometers are
summarized in Table B-4-2 in Appendix B-4. Hydrographs for the monitoring
wells and piezometers are also provided in Appendix B-4.
• The monitoring of surface water flow monthly over a two-year period (from January 2008 to December 2009) at five monitoring stations (SF1, SF4, SF5, SF6
and SF7) established along the East Huttonville Creek and two monitoring
stations (SF2 and SF3) established along the main branch of Huttonville Creek (Figure 2.1.2). Monitoring was continued quarterly in 2010 through June 2011.
In addition to the monthly or quarterly flow measurements, weekly measurements were taken during the spring of 2009, 2010 and 2011 as part of
an intensive field monitoring program investigating wetland hydroperiods.
Surface water flow volumes, when present, were estimated utilizing a stream area - velocity method. When flows were too small to measure with equipment,
visual descriptions of the moisture conditions were made. The surface water monitoring data is summarized in Appendix B-5.

Final Environmental Implementation Report Mount Pleasant Sub-Area 51-1
September 2011
2-4
• The monitoring of the water levels in 14 wetlands identified within the Study
Area (W1 through W14) was completed weekly during May, June and July 2009
to measure the depth of accumulated water and observe the hydroperiod of the wetland features. Staff gauges (SG) were installed in selected features at the
locations illustrated on Figure 2.1.2. The wetlands continued to be monitored on a monthly basis until the end of 2009. On each visit, the features were
inspected for the presence of any standing water and photographed. This same routine of weekly monitoring was completed during the spring of 2010 and 2011
until the wetlands went dry, again to confirm the duration of the hydroperiod.
The wetland monitoring data is summarized in Table B-6-1 in Appendix B-6. In addition, a map of each wetland and a summary of the field observations are
provided in Appendix B-6.
• The collection of groundwater samples from two nests of monitoring wells
(MW5s/d and MW10s/d) for assessment of background groundwater quality. Two samples of surface water were also collected for background water quality
testing (from SF1 and W12b). The samples were collected in bottles provided by the laboratory-kept cool and submitted for analysis to AGAT Laboratories in
Mississauga within 24 hours of collection. The water quality analyses included
general quality indicators (e.g., pH, hardness, conductivity), basic ions (including chloride and nitrate) and selected metals. The water quality data is provided in
Table B-7-1 in Appendix B-7. In addition to the laboratory testing, field monitoring of surface water temperature, pH, conductivity and total dissolved
solids (TDS) were also completed at various surface water monitoring stations when flow was present during the monitoring events. The field water quality
data is provided in Table B-7-2 in Appendix B-7.
• A private water supply well survey was completed as requested by the Region to
assess groundwater use in the area. Well survey forms were sent to the residences within and adjacent to the Study Area (i.e., within approximately
500m of the Study Area boundaries; Figure 2.1.14). About 25% of the
residents responded with information about their water supply wells and groundwater usage and this information is summarized in Table B-1-1 in
Appendix B-1.
2.1.2 Physiography The Study Area is situated within the physiographic region known as the Peel Plain
(Chapman and Putnam, 1984). Regionally, the sequence of overburden deposits and the bedrock topography are a result of glacial advances and retreats and related meltwater
flows that eroded and deposited sediments. The most recent glacial advance and retreat
event is referred to as the Wisconsinan glaciation. The Peel Plain is an extensive plain which lies south of the southern slope of the Oak Ridges Moraine. The Peel Plain
gradually slopes toward Lake Ontario and is cut by deep valleys of the Credit, Humber, Don and Rouge Rivers. Regionally, it consists mainly of a glacial till plain, overlain by
thin varied clay or silty sand in some places (Chapman and Putnam, 1984).

Final Environmental Implementation Report Mount Pleasant Sub-Area 51-1
September 2011
2-5
2.1.3 Topography The Study Area is located on gently rolling land that generally slopes towards the south (Figure 2.1.3). The detailed topography across the Study Area illustrates the
topographic relief is about 30m, with a high of about 266 masl in the north-central boundary of the Study Area near Mayfield Road and a low of about 236 masl along the
south boundary of the Study Area near Mississauga Road and Bovaird Drive
(Figure 2.1.3). The higher elevation lands north of Wanless Drive tend to be more rolling and the slopes flatten to the south. There is a wide, relatively flat area in the
south central portion of the Study Area in the vicinity of the City Park (Figure 2.1.3).
2.1.4 Surface Drainage The Study Area is located within the southern part of the Credit River watershed, within
its tributary subwatersheds – Huttonville Creek and West Fletcher’s Creek. Surface water drainage patterns are controlled by variations of topography. The majority of the Study
Area drains to the East Huttonville Creek (Figure 2.1.3). The East Huttonville Creek
tributary enters the main branch of Huttonville Creek about 350m north of Bovaird Drive. Upstream of this confluence, the two branches of the creek are referred to as the East
Huttonville Creek and the West Huttonville Creek. The West Huttonville Creek enters the Study Area in the southwest corner, where the watercourse flows east through a culvert
under Mississauga Road and then flows southwards parallel to the road, meeting the East
Huttonville Creek a short distance downstream of Mississauga Road. The main branch of Huttonville Creek exits the Study Area at Bovaird Drive (Figure 2.1.3 and
Drawing 2.5.1).
A small area in the northwest corner of the Study Area lies within the West Huttonville Creek subcatchment, draining to the west via a culvert under Mississauga Road towards
the West Huttonville Creek. A small area in the northeast corner of the Study Area
drains easterly via a culvert under Creditview Road into an existing storm sewer system that discharges to the West Fletcher’s Creek downstream of Creditview Road
(Figure 2.1.3 and Drawing 2.5.1).
The East Huttonville Creek, as described in further detail in Section 2.2, is an intermittent
watercourse generally aligned through the central portion of the Study Area. There are large sections of the watercourse that have been re-constructed and straightened to
improve agricultural drainage. These agricultural drain systems were created through the Drainage Act in the early 1980s; they are referred to as the Clark Drain (reaches
numbered as HV26 and HV29 on Figure 2.0.1) and the Rowntree Drain (reaches HV19a, HV22, and HV24; Figure 2.0.1.). For most of their length, these drains are
deeply incised ditches carrying water particularly during the spring freshet, the fall, and
following high precipitation events. The Clark Drain originates to the northwest of the Mayfield Woodland A and flows in a southward direction on the west side of wetlands W1
and W2. The Rowntree Drain originates south of W7 and north of the City Park and extends southerly to the CNR.
There is evidence of agricultural field tiles throughout the Study Area that have also been utilized to improve agricultural drainage. This is very common in areas of very low
hydraulic conductivity sediments such as the silts, clays and tills found at surface in the NWB area. Field tiles are a network of perforated pipes, typically installed less than
about 1m below the soil surface, intended to remove excess water from the soil profile. These pipes are referred to as "tiles" because they were originally made from short

Final Environmental Implementation Report Mount Pleasant Sub-Area 51-1
September 2011
2-6
lengths of clay pipes known as tiles; however perforated, corrugated plastic pipe is now
commonly used. Farmers install networks of such pipes to try to underdrain the topsoil
in order to dry up the fields more quickly and prevent standing of surface water in the fields.
Drainage tiles are generally directed to ditches at the edges of fields, constructed
agricultural drains or watercourses. In the Study Area, there are a number of locations where tile outlets to woodlots, wetland areas and watercourses can be observed.
Several of these locations have been monitored in this study and these are further
discussed in Section 6.0. There may be other tile outlets that are unable to be observed as historical drainage pipes may have collapsed or plugged with sediments and the
outlets may be covered by soil or vegetation.
2.1.5 Geological Setting and Stratigraphy The geological setting and stratigraphy of the NWB area was well described in the
HFSWS. The study described how glacial advancements and retreats eroded the bedrock, formed bedrock valleys and deposited various layers of till and sediments over
the shale bedrock found in the Study Area. The discussion in the HFSWS also
characterized the regional stratigraphy and provided mapping of the surficial geology, overburden thickness and bedrock surface topography.
Many of the individual landowners within the Sub-Area 51-1 lands completed
geotechnical studies of the surficial soils on their properties. This resulted in an
extensive array of boreholes across the Study Area (Figure 2.1.1). During the EIR studies, additional geotechnical work was also completed to investigate soil and
construction conditions along the channel alignment, in the proposed SWM pond areas and at the culvert crossings. The studies involved the excavation of 22 test pits (TP)
ranging from 2.2m to 9.8m deep by AME – Materials Engineering in November 2008 (refer to Figure 2.1.1 for TP locations and Appendix I for the geotechnical report). In
July, 2010, a topsoil characterization study by Shad & Associates Limited involved the
excavation of 491 shallow test pits across the Study Area (refer to the July 2010 report in Appendix I), and in September 2010, they drilled an additional 27 boreholes within the
Study Area (refer to the December 2010 report in Appendix I). This geotechnical testing provides an extensive database to characterize the soil conditions in the Study
Area.
Additional drilling by R. J. Burnside & Associates was initiated in October 2007 for the
installation of 26 groundwater monitoring wells (MW) to assess site-specific groundwater conditions. This work included borehole drilling that permitted observation and sampling
of the soils at depths between about 3m and 18m below ground level. The borehole logs
describing the sediments encountered are provided in Appendix B-2. The borehole logs for three monitoring wells installed by the City as part of the HFSWS (BB-BH1s/d
and BB-BH2) are also included in Appendix B-2. Seven of the boreholes in the southern part of the Study Area reached the underlying shale bedrock; however, all of
the groundwater observation wells were screened and completed in overburden sediments (refer to well completion details on borehole logs in Appendix B-2).
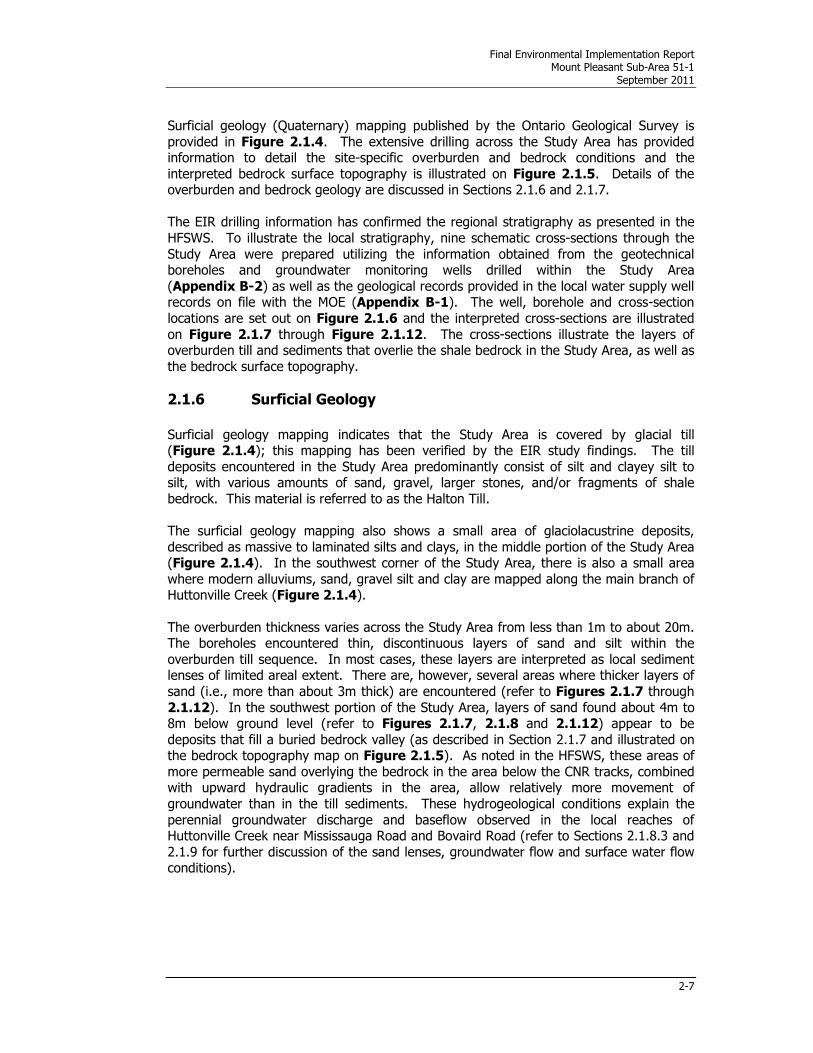
Final Environmental Implementation Report Mount Pleasant Sub-Area 51-1
September 2011
2-7
Surficial geology (Quaternary) mapping published by the Ontario Geological Survey is
provided in Figure 2.1.4. The extensive drilling across the Study Area has provided information to detail the site-specific overburden and bedrock conditions and the
interpreted bedrock surface topography is illustrated on Figure 2.1.5. Details of the overburden and bedrock geology are discussed in Sections 2.1.6 and 2.1.7.
The EIR drilling information has confirmed the regional stratigraphy as presented in the
HFSWS. To illustrate the local stratigraphy, nine schematic cross-sections through the
Study Area were prepared utilizing the information obtained from the geotechnical boreholes and groundwater monitoring wells drilled within the Study Area
(Appendix B-2) as well as the geological records provided in the local water supply well records on file with the MOE (Appendix B-1). The well, borehole and cross-section
locations are set out on Figure 2.1.6 and the interpreted cross-sections are illustrated
on Figure 2.1.7 through Figure 2.1.12. The cross-sections illustrate the layers of overburden till and sediments that overlie the shale bedrock in the Study Area, as well as
the bedrock surface topography.
2.1.6 Surficial Geology
Surficial geology mapping indicates that the Study Area is covered by glacial till (Figure 2.1.4); this mapping has been verified by the EIR study findings. The till
deposits encountered in the Study Area predominantly consist of silt and clayey silt to silt, with various amounts of sand, gravel, larger stones, and/or fragments of shale
bedrock. This material is referred to as the Halton Till.
The surficial geology mapping also shows a small area of glaciolacustrine deposits,
described as massive to laminated silts and clays, in the middle portion of the Study Area (Figure 2.1.4). In the southwest corner of the Study Area, there is also a small area
where modern alluviums, sand, gravel silt and clay are mapped along the main branch of Huttonville Creek (Figure 2.1.4).
The overburden thickness varies across the Study Area from less than 1m to about 20m. The boreholes encountered thin, discontinuous layers of sand and silt within the
overburden till sequence. In most cases, these layers are interpreted as local sediment lenses of limited areal extent. There are, however, several areas where thicker layers of
sand (i.e., more than about 3m thick) are encountered (refer to Figures 2.1.7 through
2.1.12). In the southwest portion of the Study Area, layers of sand found about 4m to 8m below ground level (refer to Figures 2.1.7, 2.1.8 and 2.1.12) appear to be
deposits that fill a buried bedrock valley (as described in Section 2.1.7 and illustrated on the bedrock topography map on Figure 2.1.5). As noted in the HFSWS, these areas of
more permeable sand overlying the bedrock in the area below the CNR tracks, combined with upward hydraulic gradients in the area, allow relatively more movement of
groundwater than in the till sediments. These hydrogeological conditions explain the
perennial groundwater discharge and baseflow observed in the local reaches of Huttonville Creek near Mississauga Road and Bovaird Road (refer to Sections 2.1.8.3 and
2.1.9 for further discussion of the sand lenses, groundwater flow and surface water flow conditions).

Final Environmental Implementation Report Mount Pleasant Sub-Area 51-1
September 2011
2-8
2.1.7 Bedrock Geology Queenston Formation shale underlies the overburden sediments throughout the Study
Area. This is a relatively soft red shale interbedded with greenish grey shale. The shale is usually weathered at the contact with the overburden. The available mapping and
geological information from the MOE’s well records indicate the bedrock surface elevation
generally ranges between about 230 masl and 255 masl in the Study Area.
As described in the HFSWS, the bedrock topography is influenced by a number of factors including the lithology, weathering, glacial-fluvial erosion and direct glacial erosion. The
regional bedrock topography mapping presented in the HFSWS was determined by interpolating bedrock surface elevations utilizing computer mapping techniques and
water well data. A large bedrock valley was interpreted to run beneath the main branch
of the Credit River, and the mapping indicated that several smaller ‘tributary’ bedrock valleys may be found beneath the Mount Pleasant lands.
The site-specific borehole data obtained in this study has allowed a more detailed
interpretation of the bedrock topography beneath the EIR Study Area as illustrated on
Figure 2.1.5. Consistent with the regional interpretation presented in the HFSWS, there is a bedrock valley oriented in a north-south direction and sloping to the south that
crosses the southern portion of the Study Area. The lowest bedrock elevation reported in the valley (less than 230 masl) is found in the southwest corner of the Study Area
(Figure 2.1.5). To the west, the bedrock surface slopes steadily upward with the highest elevations of the bedrock (about 255 masl) reported in the northwest corner of
the Study Area. The east side of the bedrock valley is interpreted to be more steeply
sloped and in the southeast portion of the Study Area, the bedrock is reported very close to ground surface at elevations above 245 masl (Figure 2.1.5).
2.1.8 Hydrogeology
2.1.8.1 Hydraulic Conductivity
Samples of the shallow surficial sediments were collected during the landowners’
geotechnical drilling programs and analyzed for grain-size. The analyses confirmed the sandy silt nature of the surficial till and the soils data suggest that the hydraulic
conductivity of the till is very low (generally less than 1 x 10⁻⁶ cm/sec). This is consistent
with the results of water level response tests completed by Golder Associates during IWA Landfill Site Search studies of various properties within NWB (December, 2003). These
studies reported hydraulic conductivities in the order of 3 x 10⁻⁶ cm/sec in the massive tills.
It is noted that conditions such as the degree of weathering and fracturing, as well as the amount of silt and sand and layering, may affect the overall effective hydraulic
conductivity of the overburden deposits. Bail-down tests were conducted for this EIR study in overburden wells MW5s/d and MW10s/d and the test results are provided in
Appendix B-3. The results varied over two orders of magnitude (10-5 to 10-7 cm/sec range) depending on the soil characteristics. MW5s was completed in a silt layer with
some sand and the test indicated a soil hydraulic conductivity of 1.5 x 10⁻⁵ cm/sec
(Figure B-3-1, Appendix B-3). In MW5d, completed in more massive till, the water level response was very slow and suggests the hydraulic conductivity is less than 6 x 10⁻⁷
cm/sec (Figure B-3-2, Appendix B-3). Thin silt and sand seams were found in MW10s and the calculated hydraulic conductivity is 5.8 x 10⁻⁶ cm/sec (Figure B-3-3,
Final Environmental Implementation Report Mount Pleasant Sub-Area 51-1
September 2011
2-9
Appendix B-3). The hydraulic conductivity was found to be very low in the dense deep
silts at MW10d, with a calculated value of 6 x 10⁻⁷ cm/sec (Figure B-3-4,
Appendix B-3).
The hydraulic conductivity of the shale bedrock tends to be controlled by weathering, fracturing and bedding planes. In the NWB area, the IWA studies (Golder, 2003)
reported that the shallow, highly fractured bedrock has an estimated hydraulic conductivity of 1 x 10⁻³ cm/sec and that the hydraulic conductivity decreases with depth
to about 1 x 10⁻⁶ cm/sec. This is interpreted to reflect the trend to less fracturing with
depth.
2.1.8.2 Groundwater Levels
Monthly measurements of groundwater levels began in the Study Area in October 2007
following the installation of monitoring wells. As more monitoring wells were installed,
they were added to the monthly monitoring program until December 2009 when the frequency of monitoring was changed to quarterly. The groundwater monitoring data for
the monitoring wells is summarized in Table B-4-1 in Appendix B-4, and all locations have a minimum of 18 months of monthly readings. Hydrographs of the water level
monitoring data for the monitoring wells are provided on Figures B-4-1 through B-4-19 in Appendix B-4.
In addition to the manually recorded monthly groundwater levels, two automatic water level recorders (dataloggers) and one barometric pressure recorder were installed in
December 2007 in monitoring wells MW5s and MW5d to record detailed water level variations in response to climatic conditions. The datalogger hydrographs are presented
on Figures B-4-20 and B-4-21 in Appendix B-4.
Groundwater levels were also monitored monthly in a series of drive-point piezometers
(10 nests) along the East Huttonville Creek to investigate the potential for shallow groundwater/surface water interactions. The piezometer locations (PZ) are illustrated on
Figure 2.1.2. This monitoring was initiated in May 2008 and continued monthly until
December 2009, when the frequency was changed to quarterly. A piezometer nest installed in the City Park wetland by the City, as part of the HFSWS (PZ-BB-1s/d;
Figure 2.1.2), was also included in the monitoring program. In March of 2010, more frequent water levels were measured in the piezometers as part of the weekly wetland
monitoring program (refer to Section 6.2.1), and in August 2010, three additional piezometers were installed in W9 and added to the wetland monitoring program. The
monitoring data for the piezometers is summarized in Table B-4-2 in Appendix B.
Hydrographs for the piezometers are provided on Figures B-4-22 through B-4-35 in Appendix B-4.
The groundwater monitoring data illustrates the following (refer to Figure 2.1.2 for the
monitoring locations and the hydrographs in Appendix B-4):
• The hydrographs illustrate that the groundwater levels in many of the monitoring
wells and piezometers took a very long time to recover to static levels, e.g., four
to six months. This illustrates the very low hydraulic conductivity of the till and silt/clay soils and indicates there is very little groundwater movement in these
materials.
• Ground elevations are provided on the hydrographs in Appendix B-4. The
groundwater levels range from about 2.7m below grade at MW2 (Figure B-4-2)

Final Environmental Implementation Report Mount Pleasant Sub-Area 51-1
September 2011
2-10
to more than 2m above ground (artesian pressures) at MW7 (Figure B-4-7).
The water levels are influenced by the topographically driven groundwater flow
systems; water levels in wells in the upland areas are generally below grade and water levels in the topographically lower areas are at or above grade.
• Seasonal variations in groundwater levels typically occur; shallow groundwater
levels tend to be highest in the spring, decline throughout the drier summer
months and then they tend to rise again in the late fall/early winter. In the Study Area, the hydrographs (Appendix B-4) illustrate such seasonal variations;
although higher than normal precipitation in the summers of 2008 and 2009
appears to have subdued typical seasonal variations and maintained relatively steady groundwater levels over the summer months.
• The maximum range of seasonal fluctuations observed in the measured
groundwater levels was generally less than 2.5m. The higher amplitude
fluctuations are generally observed in the recharge areas (e.g., MW10s/10d
(Figure B-4-10, Appendix B-4). In the wells with discharge gradients or interpreted to be in discharge areas, the amplitude of the water level fluctuations
tends to be slightly lower (e.g., MW15s/15d; Figure B-4-12, Appendix B-4). There is no significant difference in the water level fluctuation patterns in the
wells completed in more gravelly and sandy layers versus those completed in the finer-grained silt and till sediments.
• The detailed hydrographs provided by the dataloggers installed in the MW5s/d
well nest illustrate the relationship between the groundwater levels and precipitation, with rises in the water level in the shallow well (4m below grade)
of up to 0.7m recorded in response to major rain events and very wet periods (Figure B-4-20, Appendix B-4). The groundwater levels decline rapidly
between precipitation events. The pressure response in the deeper well (7.5m
below grade) is similar, but more subdued in magnitude and there is a slight lag or delay in the response compared to the shallower well (Figure B-4-21,
Appendix B-4).
• Nine nests of monitoring wells (i.e., wells located close to each other but
completed at different depths) and ten nests of piezometers provide hydraulic
gradient information as discussed below:
� Downward hydraulic gradients indicate the potential for downward
movement of water and recharge conditions and are observed at
MW3s/d (Figure B-4-3, Appendix B-4) and MW10s/d (Figure B-4-10, Appendix B-4). Both of these well nests are
located in upland areas (refer to Figure 2.1.2 for well locations).
� Upward hydraulic gradients indicate the potential for upward
movement of water and discharge conditions and these are observed at MW5s/d (Figure B-4-5, Appendix B-4) located along the
drainage ditch beside W7; MW15s/d (Figure B-4-12, Appendix B-4) located at the confluence of the Main and the East Huttonville Creeks;
MW20s/d (Figure B-4-17, Appendix B-4) located in the western
part of the Study Area, south of Wanless Road; and, at BB-PZ1s/d (Figure B-4-32, Appendix B-4) located in the City Park at W13.
The gradient is very low to negligible at MW5s/d, but more defined at

Final Environmental Implementation Report Mount Pleasant Sub-Area 51-1
September 2011
2-11
the other locations. The highest upward gradient in the Study Area is
observed at BB-PZ1s/d in the vicinity of W13.
� In two of the well nests located along Wanless Drive (MW8s/d and
MW9s/d; Figures B-4-8 and B-4-9, Appendix B-4), the water levels in the shallow and deep wells are essentially the same, i.e.,
there is no vertical hydraulic gradient. These conditions indicate that the potential groundwater movement in these areas is lateral as
opposed to vertical.
� In some cases, gradient reversals occur based on seasonal conditions
and this is particularly evident in the very shallow wells and piezometers. At BB-BH1s/d for example, there was generally a slight
upward gradient during the 2008 and 2009 spring periods, but during
drier periods the gradient flattened or reversed. The spring of 2010 was very dry and during this time, downward gradients were observed
(Figure B-4-18, Appendix B-4). Gradient reversals have been observed at all of the piezometer nests along the East Huttonville
Creek (PZ1/s through PZ10s/d; Figures B-4-23 through B-4-13,
Appendix B-4) and in many cases, the gradients between the two shallow pipes are negligible.
2.1.8.3 Groundwater Flow Conditions
Areas where water from precipitation percolates or infiltrates into the ground and moves
downward from the water table are known as recharge areas. These are generally located in areas of topographically higher relief. Areas where groundwater moves
upward are discharge areas and generally occur in areas of topographically lower relief,
such as along the watercourses. The HFSWS characterized the regional groundwater flow conditions in the NWB area and explained the different areas of recharge and
discharge that may occur in local, intermediate and more regional flow systems. Infiltrating water at any given location may follow a shallow flow path and discharge a
short distance away from the recharge area along the nearest slopes or in small
watercourses, swales, agricultural ditches, wetlands, etc. This is referred to as a local groundwater flow system (i.e., flows that closely follow the detailed topography with
relatively short flow distances, e.g., up to a few hundred metres). Some water may infiltrate and follow much deeper and longer flow paths (hundreds to thousands of
metres) to recharge underlying aquifers and discharge to more distant features and watercourses, possibly a very long way from the source of recharge. Such conditions may be referred to as intermediate and/or regional groundwater flow systems depending
on the scale of analysis.
In the Study Area, local, intermediate and more regional flow systems are evident. The
groundwater elevation data from April 2009 is provided on Figure 2.1.13, along with the interpreted groundwater elevation contours for the Study Area. The groundwater
elevation contours suggest that the groundwater elevations, in both the overburden and
shallow bedrock, generally reflect the topography and, as such, the groundwater flow patterns closely follow the surface water flow patterns. The groundwater elevations also
suggest that there is a high degree of hydraulic continuity between the overburden and bedrock and that the bedrock topography influences the groundwater flow conditions
(just as the bedrock topography influences the ground surface topography).

Final Environmental Implementation Report Mount Pleasant Sub-Area 51-1
September 2011
2-12
A local groundwater flow divide appears to be roughly coincident with the surface water
divide that occurs between the East Huttonville Creek and West Huttonville Creek
subwatersheds in the northwest corner of the Study Area (compare Figure 2.1.3 and Figure 2.1.13). There are areas where there is interpreted to be local convergence of
shallow groundwater flow and this is particularly evident towards the agricultural drains (i.e., the Clark and Rowntree Drains sections of the East Huttonville Creek that were
deepened and straightened; Figure 2.1.13). The local movement of shallow flow responds quickly to precipitation conditions and explains why the shallow hydraulic
gradients along the East Huttonville Creek are variable and often reverse from discharge
to recharge conditions (refer to Section 2.1.8.2).
There appears to be very little water moving through the local flow systems due to the
relatively tight soil conditions. This is consistent with the findings of the HFSWS which noted the horizontal component of groundwater flow, particularly within the overburden,
is weak due to the low permeability of the silt/clay sediments. Even with discharge
gradients along the watercourse, the actual volume of groundwater that discharges tends to be insufficient to sustain visible seepage or groundwater baseflow (refer to Section
2.1.9 for more information on the flow conditions in the East Huttonville Creek). There are various pockets and layers of sand found within the overburden sequence (as
provided on the cross-sections on Figures 2.1.7 through 2.1.12). These coarser-grained sediments would be expected to have higher hydraulic conductivity than the
surrounding till sediments; however, the sand layers are thin and discontinuous and, as
such, the overall hydraulic conductivity through the sub-surface is limited by the surrounding till. In places where the sandier layers are found at or near surface, and not
encased by till, the effective hydraulic conductivity will be higher. In the Study Area, this condition is found along the lower reaches of the East Huttonville Creek, south of the
CNR, where thin layers of surficial silt and sand were found at MW14 and MW16 (refer to
Figure 2.1.2 for monitoring well locations and Appendix B for borehole logs). Seasonal groundwater discharge from the more permeable sediments in this area is
interpreted to contribute to the flow in the watercourse.
Intermediate groundwater flow systems are also evident in the Study Area. Deeper
recharge conditions (downward gradients), in the area north of Wanless Drive, are found at MW10s/d. At Wanless Drive, two nests of monitoring wells (MW8s/d and MW9s/d;
Figure 2.1.13) indicate lateral flow gradients and moving south of Wanless Drive, the hydraulic gradients are upwards at MW20s/d, MW7 and MW5s/d (refer to Section
2.1.8.2). Deeper recharge and longer flow paths (e.g., up to a few kilometres) appear to drive the upward flows and high head conditions observed south of Wanless Drive and in
the vicinity of W7 (Figure 2.1.2). This deeper, intermediate groundwater flow system
explains why discharge gradients are found at MW20s/d, which is located in a locally topographic high area (i.e., in a local recharge area; Figure 2.1.13). Again, as noted
for the local flow systems, the groundwater flux (quantity or volume of groundwater flow) that occurs throughout the Study Area is limited by the relatively low gradients and
overall low hydraulic conductivity of the overburden soils.
Another example of an intermediate flow system appears in the south central part of the
Study Area near the City Park, where there is a large wetland area (W13) where organic soils have been identified. Organic soils generally form in consistently wet areas. This
wetland has formed in a low-lying topographic depression (Figure 2.1.3) and is underlain by very tight layers of silt and clay that pond the drainage in this area
(Figure 2.1.4). In addition, the water table is shallow and upward hydraulic gradients
are observed in the W13 area (refer to Section 2.1.8.2). The larger-scale intermediate groundwater flow systems converge towards this area from the topographically higher
Final Environmental Implementation Report Mount Pleasant Sub-Area 51-1
September 2011
2-13
areas situated to the west, north and east of the wetland (within and external to the
Study Area; Figure 2.1.13) and are interpreted to sustain the high groundwater
conditions in W13.
The overall regional groundwater system moves generally towards the south. Recharge occurs in the topographically higher areas of the northwest and east (within and external
to the Study Area). The deep groundwater flow paths are interpreted to generally converge through the buried bedrock valley, flowing through deep sand layers that infill
portions of the valley and through the upper fractured layer of shale. They continue to
flow south towards the more deeply-incised valleylands along the lower reaches of the East Huttonville Creek and the main branch of the Huttonville Creek in the southwest
corner of the Study Area (Figure 2.1.13). The downstream reaches, where the stream bottom intercepts the sand and/or shale, are the areas where groundwater discharge
provides perennial baseflow to the streams (refer to Section 2.1.9 for more information
on the flow conditions in the East and Main tributaries of the Huttonville Creek).
2.1.8.4 Groundwater Conditions in Terrestrial Features
As discussed in Section 6.0 of the EIR, there are a number of wetland features within the
Study Area. Many are woodland areas with small scale depressional topography that pond water during the spring runoff periods. Monitoring has confirmed that the water
table is generally high in many of the wetland areas and this affects the soil saturation,
the substrate type and composition (e.g., hydric soils) and in some cases (e.g., W13), the development of peat. However, as discussed in Sections 2.1.8.1 and 2.1.8.3, the low
permeability of the Halton Till and glaciolacustrine sediments found at surface in the Study Area limits the actual groundwater flux (volume of flow) that moves through the
subsurface and limits the potential for any significant groundwater seepage or flow
contributions into the wetland features. Based on the wetland and groundwater monitoring data, and the water table and flow system interpretations (Sections 6.2,
2.1.8.2 and 2.1.8.3), it is concluded that the wetland features rely on direct precipitation and surface water runoff inputs to sustain their functions.
Feature-based water budget modelling has been completed for each wetland to quantify the pre- and post-development surface water contributions (refer to Section 6.6). An
approximation of the potential groundwater component of the overall water budget to each of the wetlands has been calculated using basic Darcy flux calculations for both
lateral and vertical flow components. These calculations consider the site-specific soil hydraulic conductivity (K), the horizontal and vertical flow gradients (i) and the potential
contributing area of flow (A). The Darcy equation utilized for the flow (Q) calculation is
Q=KiA.
The individual wetland conditions are summarized on Tables 6.6A through 6.6N in Section 6.6. Wetlands W1, W2, W3, W5, W6 and W14 are generally above the water
table and the ponding of water in these features provides a recharge function. The
groundwater supply components were found to be negligible in these features. For those wetlands that are interpreted to have higher water table conditions and at least
seasonal intersection of the water table with the ground level or discharge conditions (i.e., W4, W7, W8, W9 and W13), the groundwater flow was calculated to be less than
about 1% of the total water supply to the features. For the ponds that are excavated into the water table (i.e., W10, W11 and W12), the calculations indicate that the
groundwater throughflow may provide up to 2% of the total water supply to the
features. It is noted that these are very general approximations of flows because of the inherent variations in hydraulic conductivity and local gradients; however, the

Final Environmental Implementation Report Mount Pleasant Sub-Area 51-1
September 2011
2-14
calculations do support the conclusions that were reached based on the field
observations and interpretation of the hydrogeological conditions, i.e., that the wetland
features are predominantly sustained by surface water runoff as noted above. These findings are also consistent with the results presented in the HFSWS, which predicted
that the groundwater flux would be a very small component of the total water budget for the terrestrial features.
It is noted that the CVC specifically inquired about the groundwater conditions in W9 as wetland vegetation was observed on the north slope of the feature in an area not
generally within the main area of observed standing surface water. Visual inspection of
the area found no evidence of groundwater seepage or wet soils on this slope. In August 2010, three piezometers were installed about 1m below grade to further
investigate the groundwater conditions. PZW9-1 was installed upgradient of the wetland, PZW9-2 was on the wetland slope, and PZW9-3 was in the main surface water drainage
area through the central portion of the feature (refer to Figure B-6-9 in
Appendix B-6). All of the piezometers were dry from August through to late September 2010 indicating the water table was more than 1m below grade. As the local water table
began to seasonally rise, the lowest elevation piezometer (PZW9-3) began to fill in late September (Figure B-4-46, Appendix B-4). During the early October 2010 monitoring
round, there was 12cm of surface water pooled in the wetland and the groundwater level at PZW9-3 was 0.71m below grade indicating a downward hydraulic gradient from the
wetland (recharge conditions). PZW9-1 and PZW9-2 remained dry through October
2010. Hydrographs for the piezometers indicate that the water levels began to rise in the fall (refer to Figures B-4-46, B-4-47 and B-4-48, Appendix B-4). The
datalogger in PZW9-2 appeared to malfunction in December 2010 and all were removed due to freezing conditions. They were reinstalled in the spring of 2011.
Although there was no evidence of groundwater discharge to the wetland slope and the water table was more than 0.5m below grade in the summer and fall, it was assumed
that, as in many of the wetland features, the water table would rise higher during the spring, especially if there was standing water in W8 and W9 that could recharge the local
water table. This has been confirmed by the 2011 monitoring data for the piezometers
that showed the water levels rose steadily in the spring. The water table rose to grade at PZW9-1 and PZW9-3, and to within about 30cm of grade on the slope at PZW9-2
(Figures B-4-46, B-4-447 and B-4-48; Appendix B-4), although there was still no visible seepage or surface water at PZW9-1 or PZW9-2. Based on the groundwater flow
patterns and assuming full saturation of the soils beneath this wetland, flux calculations indicate that potential groundwater contribution represents 1% of the total water supply
available to this wetland. It is concluded that direct precipitation and snowmelt in the
upslope areas is sufficient to maintain the high water table that supports the observed vegetation in these areas.
2.1.9 Surface Water Flow Conditions
Five surface water flow monitoring stations (SF1, SF4, SF5, SF6 and SF7; Figure 2.1.2) were established along the East Huttonville Creek and two stations (SF2 and SF3;
Figure 2.1.2) were established along the main branch of the Huttonville Creek in the southwest corner of the Study Area. Monthly observations of the watercourse conditions
were made throughout 2008 and 2009, and more frequent (approximately weekly) spot-
flow monitoring was completed in the spring of 2009, 2010, and 2011.
Where water flow was observed, measurements of flow were obtained using the Global Water Flow Probe and area velocity method. In many cases, the depth of water and/or

Final Environmental Implementation Report Mount Pleasant Sub-Area 51-1
September 2011
2-15
the channel characteristics make accurate flow measurements difficult, and the margin of
error on the flow volume calculations is relatively high. However, the observations are
still considered useful for characterizing the overall surface water flow conditions. The flow monitoring data are provided in Table B-5-1, Appendix B-5. The field work was
scheduled, whenever possible, to monitor during dry weather conditions; however with the unusually wet conditions that occurred in 2008 and 2009, observations of the creeks
were often made only one day following precipitation events (refer to Table B-5-1, Appendix B-5).
Surface water flows in the main branch of Huttonville Creek are recorded at SF2 and SF3, in the area where the watercourse enters the Study Area and flows along the east side of
Mississauga Road, just north of Bovaird Road (refer to Figure 2.1.2 for monitoring locations). Throughout the monitoring period, flowing water has always been observed
in this watercourse (i.e., it is a perennial stream); although the flows are very low at
times (refer to Table B-5-1, Appendix B). This is consistent with the interpretation that this creek receives some groundwater discharge from the intermediate and more
regional groundwater flow systems (refer to Section 2.1.8.3).
Monitoring of flows in the East Huttonville Creek confirms that it is an intermittent
system. Monitoring at SF7 at the north boundary of the Study Area at Mayfield Road, and as far down as station SF6, just north of the City Park, has found that there is little
to no surface water flow in the upper reaches of the East Huttonville Creek, with only standing water puddled at the culverts (refer to Figure 2.1.2 for monitoring locations
and Table B-5-1, Appendix B-5 for flow data). There is no evidence of groundwater discharge or baseflow and through these areas, the watercourse collects and directs
seasonal and rain event runoff southward.
South of SF6, there are straight sections of the watercourse (agricultural drains) with
several 90 degree turns which drain the central portion of the Study Area to the south through the City Park and under the rail line (Figure 2.1.2). When the SF5 monitoring
station was established in the fall of 2007, the drain was completely dry (this location is
about 250m north of the rail line that crosses the southern part of the Study Area; Figure 2.1.2). During the monitoring in 2008, there was little to no flow at SF5. Higher
than normal precipitation occurred during the summer of 2009 and minor flows were observed in the ditch at this location throughout the summer months (Table B-5-1,
Appendix B-5). There were, however, several dry weeks at the end of August and early September 2009 and during this period, there was again no flow observed at SF5.
In 2010, the spring was relatively dry and in late May and July, there was no measurable
flow at SF5. The opposite situation occurred with a wet spring of 2011 and relatively high flows have been recorded at this location during the weekly monitoring events
(Table B-5-1, Appendix B-5). Between SF5 and SF6, the East Huttonville Creek receives inputs from the W13 ditches, tile drains (e.g., from W9) and overflows from the
racetrack ponds. The surface water flow monitoring data, through these areas, confirm
the intermittent and highly variable nature of the drainage in the upper reaches of the East Huttonville Creek.
Groundwater monitoring in the area of SF5 (at PZ7s/d) shows that the water table is
relatively high beneath the channel, with rises in response to seasonal or storm event
conditions close to and even above grade with upward gradients (Figure B-4-42, Appendix B-4). This data indicates the potential for at least seasonal groundwater
discharge to the watercourse, although the surface water data suggests that the potential groundwater inputs are minimal. This is consistent with the nature of the

Final Environmental Implementation Report Mount Pleasant Sub-Area 51-1
September 2011
2-16
underlying low hydraulic conductivity soils and confirms the surface water runoff
conveyance function of the watercourse north of the rail line.
South of the rail line, measurable surface water flows have been observed in the East
Huttonville Creek more regularly during the monitoring at SF1 and SF4 (refer to Figure 2.1.2 for monitoring locations and Table B-5-1, Appendix B-5). The highest flows
are observed seasonally in the spring and minimal flows have been observed during summer and fall periods. There was no measureable flow in the watercourse north of
SF1 (located at the confluence of the East Huttonville Creek and the main tributary of the
Huttonville Creek) during particularly dry periods in July and September 2009; however seasonally at least, and under normal climate conditions, there appears to be minor
groundwater inputs to these reaches of the watercourse. As discussed in Section 2.1.8.3, this is consistent with the mapped groundwater flow conditions and groundwater
monitoring data that illustrate seasonal discharge gradients and convergence of
groundwater flow paths in this area.
2.1.10 Groundwater Quality
To characterize the groundwater quality in the shallow and deep overburden,
groundwater samples were collected on April 25, 2008 from two monitoring well nests (MW5s/d and MW10s/d). The water samples were analyzed for general water quality
indicator parameters (pH, conductivity, hardness, TDS, etc.), basic ions such as chloride and nitrate and selected metals. The groundwater chemistry results from the analytical
laboratory are summarized in Table B-7-1, Appendix B-7. For comparison purposes,
the Provincial Water Quality Objectives (PWQO) are reported on the laboratory analysis certificates in Appendix B-7. In addition, the groundwater testing results have been
compared to the Ontario Drinking Water Quality Standards (ODWQS).
Water from the Queenston Formation shale typically has high TDS and somewhat elevated chloride, sodium, and sulphate concentrations compared to water from other
types of bedrock or overburden materials.
The analytical results for the four overburden water samples indicate (refer to
Table B-7-1 in Appendix B-7):
• The groundwater is hard and mineralized, with reported hardness in the 200
mg/L to 335 mg/L range and TDS reported from about 250 mg/L to 540 mg/L.
• The reported chloride concentrations ranged from 9.5 mg/L to 38.8 mg/L. These
values are considered to be reasonably low compared to the ODWQS of 250
mg/L. The underlying Queenston shale typically contains more saline water and variable chloride concentrations in the overburden groundwater may be expected
depending on the local proximity to shale and groundwater flow patterns. For
example, the concentration of chloride at MW5d (29.6 mg/L) is higher than the concentration at MW5s (16 mg/L), and MW5d is completed near the bedrock
contact (refer to Figure 2.1.11). The chloride concentration is lowest at MW10d (9.5 mg/L) which is completed in a sand layer within the overburden
sequence (refer to Figure 2.1.10).
• The sulphate concentrations were highly variable, ranging from 15.9 mg/L in
MW5s to 200 mg/L in MW5d. As noted above, MW5d is completed in till in
relatively close proximity to the bedrock and the sulphate concentration is likely influenced by the chemistry in the underlying shale bedrock.

Final Environmental Implementation Report Mount Pleasant Sub-Area 51-1
September 2011
2-17
• Nitrate was detected in all four groundwater samples, although in three of the
samples, the reported concentration was less than 1 mg/L. At MW10s, however
an elevated concentration of nitrate was reported at 11.2 mg/L, which is above the ODWQS of 10 mg/L. This is considered to reflect an impact related to the
agricultural land use in this area (fertilizers are a common source of nitrate impacts).
• Three of the groundwater samples reported total phosphorus concentrations
above the method detection limit ranging from 0.07 mg/L to 0.12 mg/L.
Dissolved phosphorus (orthophosphate) was not detected.
• Metal concentration are generally low in the groundwater and within the PWQO,
although there are occasional levels of various metals including aluminum,
copper, iron, lead, molybdenum and uranium that were reported above the method detection limits (considered to be naturally sourced from the soils).
2.1.11 Surface Water Quality
Surface water samples were collected as part of the HFSWS and are described in greater detail within Section 2.2.2.1 of this EIR. By use of a table and depicted on a figure
within Appendix B-7, key surface water data from the HFSWS (TSS, water temperature,
and the number of wet and dry weather sampling events) are summarized.
In addition, surface water samples were collected by R. J. Burnside & Associates on April 14, 2010 from the racetrack pond outfall (location W12b on Figure 2.1.2) and
from the East Huttonville Creek at location SF1 (Figure 2.1.2). The surface water samples were analyzed for general water quality indicator parameters (pH, conductivity,
hardness, TDS, etc.), basic ions such as chloride and nitrate, and selected metals. The
surface water chemistry results from the analytical laboratory are summarized in Table B-7-1, Appendix B-7. For comparison purposes, the PWQO are reported on the
laboratory analysis certificates in Appendix B-7.
Field monitoring of salinity, pH, conductivity, and TDS was also conducted at all of the
surface water monitoring stations (SF1 through SF7; Figure 2.1.2) when flow was present and the results are summarized in Table B-7-2 in Appendix B-7. It is noted
that because there is little to no baseflow in the Study Area, the field water quality data reflect runoff water quality and the chemistry is highly variable depending on the
intensity and duration of the runoff events.
The surface water quality data indicate (refer to Table B-7-1 in Appendix B-7):
• The chloride concentrations were 51.5 mg/L at W12b and 71 mg/L at SF1. Road
salt is a common source of chloride in surface water and the concentration in the
runoff depends on the amount of runoff available for dilution.
• Nitrate was reported at 2.88 mg/L at W12b and 3.23 mg/L at SF1. These levels
of nitrate in the surface water reflect the agricultural land uses in the Study Area.
There is no PWQO for nitrate in surface water.
• Total phosphorus is a measure of all forms of phosphorus (dissolved or
particulate) that are found in a water sample. Both the total phosphorus and the phosphate parameters were below detection limits.

Final Environmental Implementation Report Mount Pleasant Sub-Area 51-1
September 2011
2-18
• The dissolved metal concentrations were generally low and below the
recommended PWQO.
2.1.12 Local Groundwater Use As explained in the HFSWS, permeable geologic materials, through which groundwater
moves in sufficient volumes to be relatively easily extracted, are referred to as ‘aquifers’.
The less permeable units are known as aquitards, and although water can move through these units, it moves slowly and it is difficult to extract water from these units. In the
NWB area, there are no high-yielding or extensive groundwater supply aquifers reflecting the lack of continuous coarse-grained sand and gravel layers and the relatively thin,
glacial till overburden (refer to Sections 2.1.5 and 2.1.6). The low hydraulic conductivity till and shale materials that characterize the NWB geology are generally considered to be
relatively poor aquifers.
The MOE Water Well Information System (WWIS) includes the location of groundwater
supply wells and a listing of geology, well construction, water level, and well capacity information. A review of the MOE water well records for the Study Area
(Appendix B-1) found 82 water well records that plotted within the site or within
approximately 500m from its boundaries. A summary of the MOE well record information is provided in Table 2.1A. The records indicate that the local wells generally tap the
overburden and the upper portions of the Queenston shale bedrock with very low to moderate well yields. Where well depth and yield information are reported, the data
indicate that about 40% of the wells are less than 15m deep, and the yields are typically low, with 83% of the wells reporting yields of less than 45 L/min (10 Igpm). Wells within
the overburden are generally larger-diameter dug or bored wells and they tend to be
completed within water-bearing sand lenses. The smaller diameter and deeper drilled wells are completed within the shale or near the bedrock/overburden contact. Even
wells that tap the sand layers indicate yields less than about 1.5 L/s, which is consistent with the discontinuous nature of the sand layers (i.e., the groundwater flows into the
sands are limited by the surrounding lower hydraulic conductivity tills).
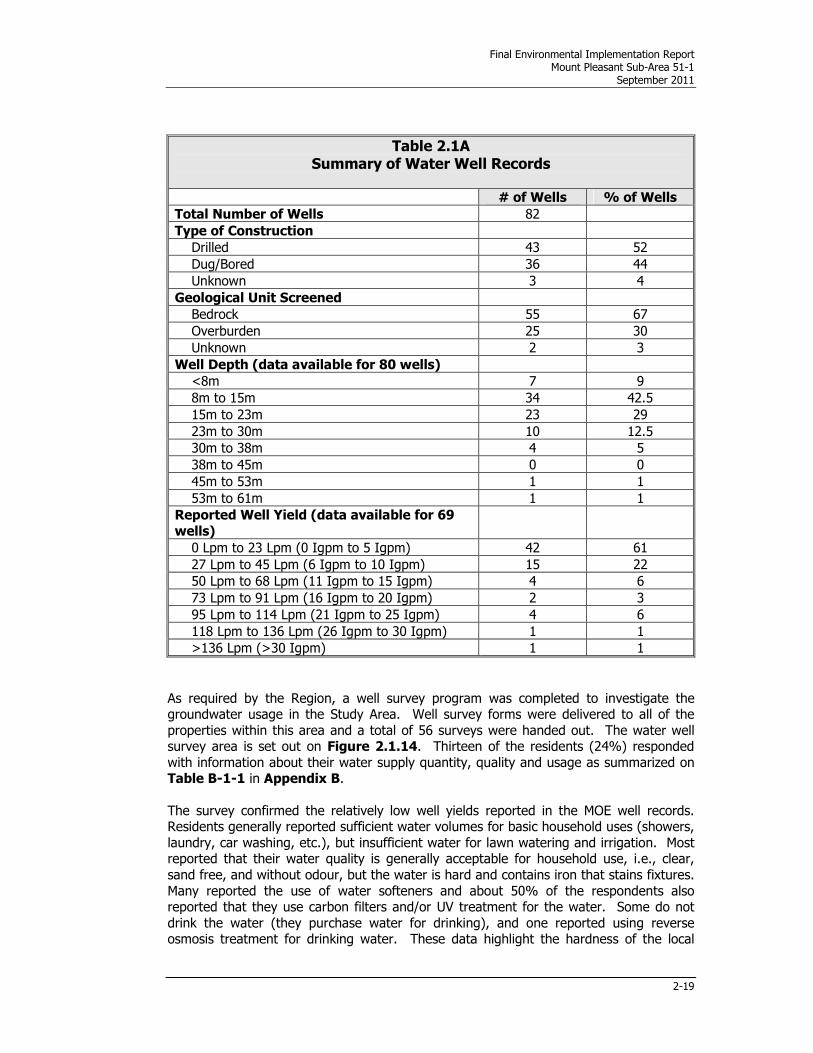
Final Environmental Implementation Report Mount Pleasant Sub-Area 51-1
September 2011
2-19
Table 2.1A Summary of Water Well Records
# of Wells % of Wells
Total Number of Wells 82
Type of Construction
Drilled 43 52
Dug/Bored 36 44
Unknown 3 4
Geological Unit Screened
Bedrock 55 67
Overburden 25 30
Unknown 2 3
Well Depth (data available for 80 wells)
<8m 7 9
8m to 15m 34 42.5
15m to 23m 23 29
23m to 30m 10 12.5
30m to 38m 4 5
38m to 45m 0 0
45m to 53m 1 1
53m to 61m 1 1
Reported Well Yield (data available for 69
wells)
0 Lpm to 23 Lpm (0 Igpm to 5 Igpm) 42 61
27 Lpm to 45 Lpm (6 Igpm to 10 Igpm) 15 22
50 Lpm to 68 Lpm (11 Igpm to 15 Igpm) 4 6
73 Lpm to 91 Lpm (16 Igpm to 20 Igpm) 2 3
95 Lpm to 114 Lpm (21 Igpm to 25 Igpm) 4 6
118 Lpm to 136 Lpm (26 Igpm to 30 Igpm) 1 1
>136 Lpm (>30 Igpm) 1 1
As required by the Region, a well survey program was completed to investigate the groundwater usage in the Study Area. Well survey forms were delivered to all of the
properties within this area and a total of 56 surveys were handed out. The water well survey area is set out on Figure 2.1.14. Thirteen of the residents (24%) responded
with information about their water supply quantity, quality and usage as summarized on Table B-1-1 in Appendix B.
The survey confirmed the relatively low well yields reported in the MOE well records. Residents generally reported sufficient water volumes for basic household uses (showers,
laundry, car washing, etc.), but insufficient water for lawn watering and irrigation. Most reported that their water quality is generally acceptable for household use, i.e., clear,
sand free, and without odour, but the water is hard and contains iron that stains fixtures.
Many reported the use of water softeners and about 50% of the respondents also reported that they use carbon filters and/or UV treatment for the water. Some do not
drink the water (they purchase water for drinking), and one reported using reverse osmosis treatment for drinking water. These data highlight the hardness of the local

Final Environmental Implementation Report Mount Pleasant Sub-Area 51-1
September 2011
2-20
groundwater and the somewhat salty nature of the groundwater that is obtained from
the shale bedrock.
There is currently no municipal water supply to the Study Area; however, areas on the
south side of Bovaird Drive and the east side of Creditview Road are currently serviced with municipal water. The proposed development will be municipally serviced, and in the
long term, it is planned that the entire NWB area will be on lake-based municipal supplies. There is no proposed groundwater use for the development (refer to
Section 4.4.2 for Water Servicing Details).
There may be continued interim use of groundwater for private well supplies in areas
adjacent to the proposed development. It is important that the development does not disrupt these local water supplies and the Region will require monitoring of the local
supply wells still in use before, during and after construction. A recommended
monitoring program for any water supply wells that remain in use, along with well decommissioning requirements for the water wells that will be taken out of service for
the development construction, are provided in Section 12.4.2.
2.1.13 Subwatershed Water Budget
The HFSWS completed detailed surface water and groundwater flow modelling and completed pre- and post-development water budget analyses for each of the
subwatershed areas in NWB. The key findings for the existing conditions water budgets are discussed below.
Infiltration rates vary based on the hydraulic conductivity of the surficial soils, topography and slope, land cover and vegetation types as well as the spatial and
temporal distribution of precipitation events and temperature. As discussed in
Section 2.1.6, the surficial geology in the Study Area consists predominantly of the Halton Till, with an area of silt and clay glaciolacustrine deposits in the south-central
portion of the Study Area (Figure 2.1.4). These sediments are low hydraulic conductivity materials (refer to Section 2.1.8.1). The topography is considered to be
rolling to hilly land with moderate slopes and the land cover is predominantly cultivated
agricultural land or open space.
As reported in the HFSWS, the surface water model (HSPF) provided the input recharge values for the groundwater model (FEFLOW). The calibration of the two models
considered site-specific stream flow data and refined model conceptualization. The two
models were calibrated utilizing an integrated approach to calibration. The HFSWS notes that this “provides a consistency of approach to common parameters and processes while
using the strengths of each model to represent the entire hydrologic system”. This detailed modelling has shown that throughout most of the NWB study area, the average
annual recharge is about 20 mm/year and varies by up to +/- 10 mm/year based on the land use and slopes for the Halton Till. The modelling results suggest that the fractured
surficial till (upper 2m to 3m) provides the main pathway for infiltration and movement of
groundwater, both laterally and to depth.
The overall infiltration was estimated in the modelling to be 2,138 m3/day for the Huttonville Creek subwatershed and 544 m3/day for the Mount Pleasant area.
Approximately 40% of the recharge supports intercatchment flow and the remainder
discharges to surface water features within the Huttonville Creek subwatershed. The HFSWS notes that the field observations of the Huttonville Creek flows suggest the

Final Environmental Implementation Report Mount Pleasant Sub-Area 51-1
September 2011
2-21
locations of the modelled groundwater discharge may be overestimated in the upper
reaches, but in general, it is concluded that the total discharge appears to be well
simulated.
Based on an average annual recharge rate range of 10 mm to 30mm, the range of pre-development recharge volumes for each of the subwatershed areas within the Study
Area boundary are summarized in Table 2.1B.
Table 2.1B Summary of Groundwater Recharge Volumes
Subwatershed Subwatershed Area
(ha) Recharge Volume
(m3/day)
West Huttonville Creek 54 15 to 44
The East Huttonville Creek 371 102 to 305
West Fletcher’s Creek 91 25 to 75
2.2 Aquatic Resources and Fish Habitat
2.2.1 Background Information
Both the Huttonville Creek and Fletcher’s Creek watersheds have been evaluated through various field investigations and planning studies primarily over the past decade and a
half, but date back to an initial survey in 1954 that was published within the 1956 Credit Valley Conservation Report. These studies have commonly observed that the main factor
limiting the productivity of aquatic habitat in the upper portions of the Huttonville and Fletcher’s Creek watersheds is flow. Virtually all of these studies (some of which are
described below), noted that many of the headwater drainage features are dry for most
of the year, and thus cannot support fish or other aquatic organisms on a continuous basis. Even on those occasions when fish migrate into these upper drainage features,
the productive capacity is limited by the temporary nature of habitats, and the fish must either move back downstream as conditions become drier or perish. Flow duration
increases in a downstream direction, eventually becoming permanent in Fletcher’s Creek
in the vicinity of Highway 7 and in the East Huttonville Creek, south of the CNR, where some degree of groundwater input occurs.
Following is a brief overview of background studies that include, either directly or
indirectly, some portions of the Study Area, with a specific focus on the character of aquatic habitat.
The Credit River Fisheries Management Plan (2002)/Fletcher’s Creek Subwatershed Study (1996)
The Credit River Fisheries Management Plan (CRFMP) contains information that is gathered on a watershed-wide scale and therefore represents a high-level perspective of
fisheries and fish habitat within the entire Credit River watershed. Subwatershed-level information and management approaches, including Fish Management Zone delineation
and/or Fish Community Classification are therefore subsequently at a higher level and are

Final Environmental Implementation Report Mount Pleasant Sub-Area 51-1
September 2011
2-22
subject to refinement as new information becomes available through more detailed
comprehensive investigations, sampling and monitoring efforts.
As described within the HFSWS Phase 3 report, the CRFMP provides guidance with respect to the fish species that management actions should be targeted towards, the
width of riparian buffers and the timing for instream works based on the fish communities that are present in and downstream of the development area. Two fish
communities – mixed cool/warmwater and small warmwater are indicated by the CRFMP to be present in the Mount Pleasant Study Area. The descriptions of these fish
communities within the CRFMP, as it applies to the East Huttonville and Fletcher’s Creek
watersheds follows.
Mixed Cool/Warmwater
• Utilized by migratory trout and salmon in the lower reaches of the watershed.
• Fletcher’s Creek reproduction is suspected but the relatively cooler waters to the
main river can provide important refuge habitat for these young migratory species.
• Normally, species associated with groundwater discharge headwater wetland
areas, such as central mudminnow and northern redbelly dace, are common. However, these species are absent below the Niagara Escarpment in the Credit
River watershed. • The Redside Dace should also be best associated with cool/warmwater habitats
but has also been reported in other stream types.
• Both cool/warmwater and small warmwater streams have intermittent
headwaters that certain species will utilize on a seasonal basis.
Small Warmwater
• The most dominant species found include creek chub and blacknose dace. These
species are also found in other stream types and best utilize intermittent reaches
along with brook stickleback. Other species tolerant of warm temperatures and
lower dissolved oxygen include bluntnose and fathead minnows. White sucker is also often common.
• A greater diversity of minnows, some habitat specialists and water quality
sensitive species may also be present, especially where access to larger mixed or warmwater streams are available.
• Most typical of clay till plains with few silt/sand/gravel components such as
Fletcher’s Creek.
The main branch of the Huttonville Creek, from Queen Street upstream to the confluence
of the East and West Branches, just north of Bovaird Drive, supports what is termed in the CRFMP as a “warmwater community dominated by Cyprinids”. The CRFMP classifies
the fish community in the East Huttonville Creek as “small warmwater”, which is dominated by blacknose dace (Rhinichthys atratalus) and creek chub (Semotilus atromaculatus). These fish communities have been confirmed through the additional fish collections completed as part of the HFSWS and the recent CVC electrofishing of the
lower reaches of the West and the East Huttonville Creeks (i.e., upstream of Highway
7/Bovaird Drive) that was undertaken in 2009 as part of a continuation of the CVC’s Effectiveness Monitoring Strategy (described below).

Final Environmental Implementation Report Mount Pleasant Sub-Area 51-1
September 2011
2-23
The CRFMP also identifies fish community management zones, which are based on fish
communities that are present, or could potentially occur, under existing conditions. The
majority of the Huttonville watershed (which would include all of the East Huttonville Creek within the Study Area) is to be managed for a “small warmwater fish community”
or has no designation. The mid to upper reaches of the Fletcher’s Creek watershed is designated as a “small warmwater” community management area, or in the case of the
smaller headwaters, is “unclassified”. This latter designation would apply to the minor headwater field swales that occur to the west and east of Creditview Road, between
Wanless Drive and Mayfield Road, within the headwaters of both the East Huttonville and
Fletcher’s Creek’s subcatchments.
As previously mentioned, new information may be applied to refine Fish Community Management Zones as appropriate from time to time. Based on recent data from the
Huttonville and Fletcher’s Creek Subwatershed Study, as well as the presence of Redside
Dace north of Bovaird Drive in both Huttonville Creek and Fletcher’s Creek, the CVC and the MNR have advised that the Fish Community Management Zone in the upper reaches
of these systems, including contributing habitats, should be considered coolwater/warmwater (CVC pers. comm.).
From an entire system perspective, the Huttonville Creek is identified as the only
potential coldwater trout habitat below the Niagara Escarpment and is regarded as providing the only coldwater trout fishery in the Peel Plain area to the south of the Norval
Dam. As such, it is also identified as providing the most southern coldwater input to the Credit River. The redbelly dace is usually considered a coolwater fish species and was
identified in the CRFMP as being absent below the Niagara Escarpment; however, as indicated above, was captured during the surveys within the HFSWS.
Overall, despite the various alterations that have resulted from agricultural intensification
in its upper reaches, the Huttonville Creek system is seen as an important coolwater contributor to the Credit River, providing habitat for species such as Redside Dace and
Redbelly Dace.
The Fletcher’s Creek Subwatershed Study (1996) The Fletcher’s Creek Subwatershed Study was completed in 1996 and describes the aquatic resources within its boundaries. This study indicated that the headwaters are
intermittent (i.e., north of Wanless Drive within the Sub-Area 51-1 and Sub-Area 51-2 Study Areas) and that permanent flow begins at approximately Bovaird Drive/Highway 7.
CVC Effectiveness Monitoring Strategy (2003-2008) The Effectiveness Monitoring Strategy (EMS) was initiated in 2003 and was intended to run for a minimum of five years to collect sufficient data to enable conclusions to be
formed on the effectiveness of land use planning controls and best management practices in providing water quantity and water quality control. In 2009, AECOM
prepared a 5-Year Review of the hydrology, water quality, water temperature, benthic
macroinvertebrates, fisheries, and geomorphology data gathered during the EMS program.
Sampling stations associated with the EMS program are depicted on Figure 2.2.2. As
may be observed, there are no stations within the Fletcher’s Creek Study Area – the
nearest station is south of Wanless Drive. In the case of the East Huttonville Creek, there are two stations located in the southern portions of the Study Area - Stations EM7
Final Environmental Implementation Report Mount Pleasant Sub-Area 51-1
September 2011
2-24
and EM8. Station EM7 is situated on the West Branch of the Huttonville Creek, on the
east side of Mississauga Road, just upstream of the confluence with the East Huttonville
Creek. Station EM8 is located some 150m downstream of EM7, on the Main Branch of the Huttonville Creek at Bovaird Drive. The results from these stations do not directly
reflect on the East Huttonville Creek, as the downstream station (EM8) represents the combined influence of both the West and East branches. Within the Fletcher’s Creek
subwatershed, the most relevant station is EM5, located on a headwater tributary, immediately south and east of Wanless Drive and Chinguacousy Road, respectively.
Station EM5 is located at the top end of a reach of natural channel that was constructed
in approximately 2002.
Based on review of the five-year dataset, the AECOM report drew the following conclusions.
The water quality sampling at Huttonville Stations EM7 and EM8 indicated generally poor to marginal conditions. The review notes indicated that although there are no urban
developments within the catchments draining to these monitoring stations, “there are extensive agricultural lands, yielding high concentrations of nitrates and phosphorus from
fertilizers”. Conditions at Station EM5 on Fletcher’s Creek also indicate similar conditions.
Flow within this reach range from ephemeral to intermittent and upstream drainage is purely agricultural:
• The instream water temperature monitoring during the years 2004 to 2007
indicated that the overall maximum temperature at Stations EM7 and EM8 was
24.80C and 25.30C, respectively (recorded in 2006). Temperatures at Station EM5 reached the mid-300Cs – but these extreme temperatures are due to
intermittent conditions.
• Benthic invertebrate collection at Huttonville’s Station EM7 suggest a generally
unimpaired condition, although there have been a fairly high percentage of
chironimid worms as compared with stoneflies, caddisflies and mayflies – a slight improvement is suggested by this data over the past five years. No sampling for
benthics has occurred at Station EM8. At the Fletcher’s Station EM5, the benthic
community is considered poor/marginal and there has been a noticeable decline in the invertebrate community over the duration of sampling.
• The fish community at Station EM7 is dominated by three warmwater species
(blacknose dace, brook stickleback, and creek chub), and the number of these
fish present at this station lead to a high biomass result. No sampling has occurred at the downstream Station EM8. In Fletcher’s Creek, Station EM5 could
only be fished in 2004 due to intermittent conditions – in 2004, a small number
of creek chub, brook stickleback, creek chub, and a white sucker were collected.
The Huttonville Creek Rehabilitation Project and North West Brampton Phase
2 Urban Expansion Area Open Space Study (2005)
Other background studies and field assessments have occurred within the Huttonville Creek watershed including the Huttonville Creek Rehabilitation Project undertaken by the
CVC in conjunction with the Credit River Anglers and landowners. This involved bank
stabilization and riparian planting, extending upstream from Queen Street to several hundred metres upstream of Bovaird Drive. Fish species present within that reach
include creek chub, brook stickleback, blacknose dace, white sucker, and fathead. The

Final Environmental Implementation Report Mount Pleasant Sub-Area 51-1
September 2011
2-25
lower reaches of the Huttonville Creek, well south of the Study Area near its confluence
with the Credit River (near Queen Street), support several species including young-of-
the-year and juvenile rainbow trout and Redside Dace. Of note is that no collection of Redside Dace has occurred north of Queen Street, which has been identified as a barrier
to fish passage.
The North West Brampton Phase 2 Urban Expansion Area Environmental Open Space Study (Dougan and Associates, 2005) examined the flow and general habitat conditions
in Huttonville Creek, north of Highway 7 and in the headwaters of Fletcher’s Creek, north
of Wanless Drive in September of 2003. The NWB Phase 2 report study area contained the headwaters of the main and west branches of Fletcher’s Creek. None of the
watercourses in the Dougan study, that lie within the Fletcher’s Creek watershed, were flowing during the fall field investigations in 2003, and the only standing water that was
observed was in excavated ponds. These observations were consistent with the
conditions reported in the Fletcher’s Creek Subwatershed Study (Paragon Engineering, 1996), which reported only intermittent swales and streams.
The North West Brampton Phase 2 Urban Expansion Area Environmental Open Space
Study Area included most of the headwaters of Huttonville Creek, although a small
amount of drainage does enter the NWB Study Area from north of Mayfield Road. With the exception of excavated ponds, all of the watercourses, north of the CNR, were dry at
the time of the field investigations. It is acknowledged that 2003 was considered to be a “dry” year; however, intermittent flow is considered to be a typical condition for these
watercourses. On the East Branch of the Huttonville Creek, permanent flow was reported to occur at a point approximately half way between the CNR and Mississauga
Road. Similar to the situation with Fletcher’s Creek, no fish sampling was possible in the
headwaters because they were dry.
2.2.2 Field Results from the Huttonville and Fletcher’s Creeks Subwatershed Study and EIR Assessment
With the foregoing backdrop of aquatic habitat characterization within the Study Area,
the HFSWS (AMEC) focused the assessment of stream morphology, fish habitat and fish communities within the headwaters of the Fletcher’s and Huttonville Creeks. Field
conditions were initially assessed during April 2005 at all crossings of Mayfield Road and
Wanless Drive, and the majority of the crossings of Heritage Road, Mississauga Road, Creditview Road, Chinguacousy Road and McLaughlin Road. Flow status was classified
as “dry”, “flowing”, or “standing pools present”. Crossings, where water was present in April 2005, were re-visited in mid-May 2005 and electrofishing occurred where water was
still present.
In April 2006, these headwater drainage features were again assessed to corroborate the
April 2005 observations and additional assessment of spring flows was completed in 2007. Results in each of the spring seasons in 2005 through 2007 demonstrated that
flows within the East Huttonville and Fletcher’s Creek headwater reaches (typically north
of Wanless Drive), were dry or were reduced to isolated pools of standing water by late April.
2.2.2.1 Assessment of Aquatic Habitat and Fish Community
The HFSWS Phase 1 Subwatershed Characterization and Integration Report (December 2010) documented existing aquatic habitat conditions and biota based upon background

Final Environmental Implementation Report Mount Pleasant Sub-Area 51-1
September 2011
2-26
information and surveys conducted between 2005 and 2007. Savanta Inc. and JTB
Environmental augmented this work by completing confirmatory field assessment of
terrestrial and aquatic resources and stream morphology over the past five years, with particular focus on the stream/swale characterization in 2009 and 2010 to determine the
quality and extent of aquatic habitat. These EIR field investigations have focused on:
• characterizing flows within the headwater drainage features;
• field verification of the results of the assessment of headwater drainage features
utilizing the Interim Guidelines - “Evaluation, Classification, and Management of Headwater Drainage Features (2009)” that was documented within the HFSWS;
and,
• assessment of in-stream habitat quality (presence of pools, habitat diversity and
in-stream habitat) and water temperature.
The existing Huttonville Creek main channel likely occurred as a natural drainage system
historically, prior to clearing of the land for the purpose of agriculture. Figure 2.2.1 depicts a map of the Township of Chinguacousy as it would have appeared in 1880
(http://digital.library.mcgill.ca/countyatlas/SearchMapframes.php). As is noted on this figure, the Grand Trunk railway (now CNR) is in the present day location, as is present-
day Mississauga Road. Both the West and the East Huttonville Creeks are evident, albeit in a natural, meandering alignment and both are considerably shorter. The effects of the
present day channelization and realignment works that have been undertaken on the
East Huttonville Creek are quite evident in viewing this map. Based upon discussions with the City and field observations of the East Huttonville Creek, from Mayfield Road to
the CNR railway, the East Huttonville Creek was altered under the Drainage Act. In the late 1970s through to the early 1980s, the East Huttonville Creek was re-constructed into
two drains – the Clark Drain that extends from Mayfield Road to Wanless Drive, and the
Rowntree Drain, which extends from the City Park to a point immediately downstream of the CNR culvert. The portion of channel between the Clark Drain and Rowntree Drain
appears to have been altered to facilitate agricultural drainage; however it does not appear to be incorporated under the Drainage Act. Although the channel presently
resembles the classic trapezoidal profile, in fact, the actual construction was less precise
– the channel was dug with a standard square bucket and hence, the channel resembles more of a straight-sided profile. Up until the early 2000’s, the channel was routinely
cleaned such that little vegetation growth occurred within the actual drain; however, regular clean-outs have since ceased and vegetation now chokes much of the stream
during the summer months. Side slopes throughout the system are either 1:1 or 2:1 and bottom widths are in the order of 0.5m to 1.0m. The purpose of an agricultural or
municipal drain design is to remove and convey water in as efficient a manner as
possible to allow for rapid draining of the landscape and to provide an outlet for surface feeder drainage as well as tile drains to facilitate cultivation for agricultural drainage.
Various sections of the East Huttonville Creek main stem exhibit characteristics that
deviate from the typical agricultural drain profile as described above (e.g., through the Mayfield Woodland A between Mayfield Road and Wanless Drive). However, the straight-
line nature of the channel and generally level bed profile in this section, as well as fill
piles along the channel, suggests that modification has occurred at some time during the construction of the Clark Drain design. An examination of aerial photography reveals
that the channel follows generally straight lines, with various 90o or other abruptly angled turns along its length between Mayfield Road and Wanless Drive, which further suggest
modification for agricultural drainage in addition to channel profiles observed at ground

Final Environmental Implementation Report Mount Pleasant Sub-Area 51-1
September 2011
2-27
level. The general channel bed profile examined in the field also suggests modification
for agricultural drainage conveyance; a flat channel bed fairly devoid of typical fish
habitat components such as pools and riffles. Further, there is an obvious deepening of the drain cross-section with downstream progression as there was an attempt to match
downstream outlet grades to the receiving natural stream.
Two catchbasins were also present on the west and south sides of Mayfield Woodland A, presumably associated with agricultural tiles, although no further data are available
regarding their outlets.
During a walk of the entire length of both the East Huttonville Creek main stem north of the CNR (Savanta Inc., September 2010) and the Fletcher’s Creek (October 2010), areas
of standing water were observed that generally coincided with existing culverts at various
road and farm lane crossings, or other areas of disturbance (i.e., farm equipment crossings without a supporting structure). Within the East Huttonville Creek, these
reaches included HV19a, HV22, HV24, HV25, HV26, HV27, and HV29. In total, seventeen areas of standing water were observed between Mayfield Road and the CNR
crossing. Of these, approximately five were conservatively identified as pools; however
they would likely be more accurately described as deep flats based on their location, general condition and presence of sediment build-up causing some backup of flow. We
note that both the number and size of pools were reduced during a site walk in the late summer of 2011, confirming the variability that will occur from year-to-year. Riffle
habitat is virtually absent within this entire length, except for one location in the woodland between Mayfield Road and Wanless Drive and at the outlet of the racetrack
ponds, where rock has been placed presumably to control scour at the outlet culvert. In
general, the longitudinal bed profile within the reaches HV26 (just north of Wanless Drive), south to the downstream end of HV19a (i.e., the CNR), follows a straight, gradual
gradient line, which is consistent with most agricultural drain profiles designed to promote the efficient and constant movement of water through agricultural areas to the
eventual receiver.
The East Huttonville Creek subwatershed is comprised of the main watercourse that
flows essentially as a channelized north-south spine that enters the main branch of the Huttonville Creek about 350m north of Bovaird Drive. Surface water flow is contributed
to the East Huttonville Creek via headwater drainage swales that are typical of surface
water drainage across the Peel Plain (i.e., swales that are poorly defined, with limited riparian vegetation, and cultivated through in many cases). These small headwater
drainage features, in both the Fletcher’s Creek and the East Huttonville Creek subwatersheds, display ephemeral to intermittent flow, depending on their location
within the subcatchment. Most of these headwater drainage features have ceased to flow by mid-April and the East Huttonville Creek typically exhibits intermittent flow at
Mayfield Road and Wanless Drive by late May or early June. In terms of the main East
Huttonville Creek, the various field assessments completed by AMEC and Savanta Inc., between 2005, 2010 and 2011 have confirmed that this watercourse is intermittent
upstream of the CNR. These same ephemeral or intermittent conditions have also been noted within all of the Fletcher’s Creek reaches within the Study Area, north of Wanless
Drive.
The HFSWS reviewed the results from benthic invertebrate indices from sites within the
Fletcher’s Creek and Huttonville Creek subwatersheds – with one exception, all stations were located some distance south of the Mount Pleasant Study Area. The HFSWS notes
that overall, habitat conditions are best within the lower reaches of the Huttonville Creek (i.e., in the Queen Street and Highway 7 area) and lower reaches of Fletcher’s Creek,

Final Environmental Implementation Report Mount Pleasant Sub-Area 51-1
September 2011
2-28
and worst in the upper reaches of Fletcher’s Creek. The downstream improvement in
habitat conditions, as indicated by the benthic invertebrate communities, may be a
reflection of increased baseflow.
Fish collections during the HFSWS indicated the presence of fish primarily in the main East Huttonville Creek within pools above or below culvert crossings at Mayfield Road,
Wanless Drive and downstream reaches in the vicinity of the City Park and the CNR (i.e., the upper portion of HV26, the divide between HV26 and HV25, and the upper portion of
HV19a below the racetrack pond discharge). When and where fish are present in these
ephemeral/intermittent headwaters, the common species are Brook Stickleback (Culaea inconstans) and/or Fathead Minnow (Pimephales promelas). These are generally tolerant, warmwater species that can survive and reproduce in standing pools. Species captured in the lower portions of the East Huttonville Creek in the summer 2006 (in the
vicinity of the CNR) were creek chub (Semotilus atromaculatus), Blacknose Dace (Rhynichthys atratulus), Northern Redbelly Dace (Phoxinus eos), and Brook Stickleback (Culaea inconstans). Northern Redbelly Dace are often considered to inhabit cool water
habitats, and they may persist here with contributions of cool water from tile drains.
Dip-net observations, by Savanta Inc. during the spring of 2009 and 2010, indicated the
presence of Brook Stickleback within the main branch of the East Huttonville Creek at the following locations:
• approximately 150m downstream of the CNR culvert, at the downstream plunge-
pool;
• the plunge-pool at the racetrack culvert (i.e., at the extreme upper portion of
HV19a);
• the plunge-pool at the culvert located approximately 100m south of the racetrack
(at the confluence of HV19b and HV19a); and,
• the East Huttonville Creek in the pool on the south side of Wanless Drive (the
beginning of reach HV25).
These observations are similar to those documented within the HFSWS Phase 1 Characterization and Integration Study. These locations, as well as the location of identified pools within the watercourses, are provided on Figure 2.2.2.
Stream Morphology, Presence of Pool Habitat and Instream Barriers To supplement the site investigations completed in the HFSWS, Savanta Inc. and JTB
Environmental have undertaken reach assessments within both the East Huttonville and
Fletcher’s Creek subcatchments. These observations are based upon comprehensive walking surveys of the watercourses from downstream to upstream. These results
confirm the findings within the HFSWS and can be summarized as follows:
• Virtually no streambed morphology – the only reaches in either the East Huttonville or Fletcher’s Creeks that exhibit any form of riffle-pool sequences are in the lower sections of the Huttonville Creek (i.e., HV2 and HV18). In virtually
all the remaining reaches in either subcatchment, the lack of flow, stream energy, and dense plant growth results in either poorly defined or no bed
morphology. Much of this, within the East Huttonville Creek, is related to the alterations following conversion to a municipal drain in the late 1970s and early

Final Environmental Implementation Report Mount Pleasant Sub-Area 51-1
September 2011
2-29
1980s. Within the Fletcher’s Creek, the lack of morphology is due to the
predominance of low-energy field swales.
• Lack of pool habitat – As discussed above, on the East Huttonville Creek, from
the upstream side of the CNR north to Mayfield Road, the pool/standing water habitat is primarily limited to major road and internal farm culvert crossings.
Pool/standing water habitat that has been identified at the locations is depicted on Figure 2.2.2.
• Stream bed substrate – The field swales are comprised of silt, typically with limited to no sorting of sediment and these comprise most of the Fletcher’s Creek
reaches, as well as many of the upper East Huttonville Creek reaches. In the main stem of the East Huttonville Creek (comprised of HV27, 26, 25, 24, and
22), the substrate is primarily comprised of silt and sand deposits, with minimal
gravel or cobble. Based upon site assessment by JTB Environmental, the present field conditions do not provide a source of coarse sediment to the watercourses
in either the upper portions of the East Huttonville Creek or Fletcher’s Creek subcatchments. These sediments are typically fine-grained material that is
generated from sheetflow across cultivated fields.
• Aquatic Barriers – Few formal barriers exist within either the East Huttonville or
Fletcher’s Creek systems. On the East Huttonville Creek, the current CNR culvert does present a hydraulic barrier to fish movement, as the invert of the insert that
was installed on the upstream side of the existing culvert approximately five years ago is higher than the old culvert. Depending on flow level, this is an
impediment to fish movement into upstream reaches. Within the upper portions
of the East Huttonville Creek, the CSP that discharges from the racetrack pond represents at least a seasonal barrier, in that upstream fish movement is only
possible under high flow periods. Fish can certainly be washed from the pond downstream into the creek during high-flow events. Although many other
culverts are found within the East Huttonville Creek system, none would prevent
fish passage during normal flow periods.
Throughout the Block 51-1 lands, the most obvious influence on fish passage is the limited volume and duration of flow.
Water Quality and Stream Temperature
As part of the HFSWS, a water quality sampling program was undertaken which included the collection of wet and dry weather “grab” samples and in-stream temperature
recording. Three stations were established within the Study Area – two were on Huttonville Creek and one on Fletcher’s Creek. One station was on the main branch of
the East Huttonville Creek at Wanless Drive (Station H2 in the HFSWS), and the second
station was on the East Huttonville Creek, just upstream of the City Park (Station H3 in the HFSWS). In Fletcher’s Creek, monitoring occurred at Station F2, which was located
on the south side of Wanless Drive between Chinguacousy Road and McLaughlin Road. Few samples were actually collected at Station F2 as it was dry on virtually every
occasion.
The water temperature data from these stations indicated that in the monitoring year of
2007, the water temperature in Fletcher’s Creek was above 260C on occasion during May, and then was dry the remainder of the summer. At station F3 (located south of the
Study Area at Highway 7), water temperatures were above 270C in each of June, July

Final Environmental Implementation Report Mount Pleasant Sub-Area 51-1
September 2011
2-30
and August of 2007 and the Huttonville stations were intermittent and temperature data
was limited to those periods when there was flow. Station H2 (Wanless Drive) recorded
data only for April, May and June 2007 and elevated temperatures of 25.40C and 33.20C occurred in May and June, respectively. For Station H3 (just north of the City Park),
maximum temperatures of 190C were recorded in April and May. In 2006, instream temperatures were considerably higher on occasion – in one case, the recorded
temperature was 390C at Station H3 (just north of the City Park), which indicates that the watercourse was becoming intermittent and the temperature logger was exposed to air.
During the summer season of 2010, Savanta Inc. deployed a number of dataloggers in the following locations on the East Huttonville Creek:
• within the plunge-pool on the downstream side of Wanless Drive;
• on the upstream side of the CNR culvert; and,
• approximately 200m south of the CNR.
No loggers were established on Fletcher’s Creek, as dry conditions existed throughout
the Study Area.
The results of the Savanta Inc. temperature loggers as well as the water quality data
collected through the HFSWS are depicted in Figure B-7-1 which has been included within
Appendix B-7 (which summarizes both the HFSWS and Savanta findings) and indicate
that water temperatures in July and August approached 260C at all stations. Based upon the amount of precipitation recorded during these months, the East Huttonville Creek
contained water within pools throughout the summer of 2010, although downstream
reaches may have experienced impassable conditions due to lack of water. These recent data, in association with the information collected during the HFSWS, indicates that
surface water temperatures within the East Huttonville Creek will routinely exceed 250C during the summer months in those pools that continue to hold water and may approach
300C depending on ambient conditions.
AMEC completed a water quality field sampling program under dry and wet weather
conditions between July and November 2006. Following are summary comments based on the sampling results:
• The HFSWS concluded that surface water quality conditions are
representative of agricultural land use conditions:
o nitrate, trace metals (copper and zinc) were above PWQO at all stations under wet weather conditions, with a general decrease in levels under
dry weather; o levels of E. coli bacteria were consistently higher than objective under
both wet and dry weather conditions; and,
o TSS levels ranged from a low of 12 mg/L at Station H3 under dry weather conditions, up to 920 mg/L at Station H2. The high
concentrations during wet weather sampling are typical of cropped conditions within the agricultural landscape.
2.2.2.2 Fish Habitat Classification
The CFCP (September 2011) provides a review of the existing and proposed extent and
quality of the aquatic habitat and fish community present within the East Huttonville

Final Environmental Implementation Report Mount Pleasant Sub-Area 51-1
September 2011
2-31
Creek subwatershed. The CFCP had built upon the findings within the HFSWS in terms
of evaluating and classifying fish habitat communities within the East Huttonville Creek.
One approach to evaluating and classifying fish habitat in headwater drainage features is
utilizing the CVC/Toronto Region and Conservation Authority’s (TRCA) Interim Guidelines for the “Evaluation, Classification, and Management of Headwater Drainage Features” (March, 2009). This methodology was utilized within the Draft Phase 1 Characterization and Integration Study (as part of the HFSWS), and was also referenced by Savanta Inc.
during the field assessments for the CFCP and Block Plan EIR preparation.
The HFSWS and CFCP has identified that Permanent, Seasonal, and Contributing fish habitat classification types are present in the Block 51-1 Study Area. These include:
• Permanent Fish Habitat (direct habitat);
• Seasonal Fish Habitat (direct habitat);
• Complex Contributing Habitat (indirect habitat); and,
• Simple Contributing Habitat (indirect habitat).
“Permanent Habitat” includes the presence of direct habitat onsite that would contribute to feeding, breeding and/or migration functions. Further, these functions
occur as a result of year-round regional groundwater discharge and/or permanent standing surface water. As indicated above, permanent habitat has been identified
downstream of the CNR on the East Huttonville Creek and the main branch of the Huttonville Creek. The racetrack ponds, W10, W11 and W12, provide permanent refuge
habitat for fish, with seasonal connectivity to the East Huttonville Creek during higher
flow periods when the racetrack culvert is inundated and connected sufficiently to permit fish movement between the ponds and the creek. There is no permanent habitat within
the Fletcher’s Creek tributaries, north of Wanless Drive.
“Seasonal Habitat” – (i.e., providing limited direct habitat onsite as a result of
seasonally high regional groundwater discharge or seasonally extended contributions from wetlands or other surface storage areas that support intermittent flow conditions, or
rarely ephemeral flow conditions). The entire main stem of the East Huttonville Creek, from the CNR northward to Mayfield Road, is classified as seasonal habitat (i.e., Reaches
HV19a, HV22, HV24, HV25, HV26, HV29). The primary reason for the designation of
seasonal habitat is not due to regional groundwater inputs, but rather to the potential for extended surface water pooling through the summer months. In Fletcher’s Creek,
seasonal habitat is primarily found in one tributary, and includes Reaches F12, F13, and F14, although a small portion of seasonal habitat has also been identified in the extreme
northeast corner of Block 51-2 (although this reach was not formally assigned a reach number within the 2G Plan). However, both these tributaries of Fletcher’s Creek are
outside the Block 51-1 lands.
“Contributing Habitat” – (i.e., providing indirect (contributing) habitat to downstream
reaches) – in these streams, the functions generally increase with flow and/or as flows move downstream with increasing length of channel, or channel density (e.g., extent of
contributing area). There are two types of contributing habitat:
• “Complex Contributing Habitat” - these features are formed generally as a result
of intermittent or ephemeral surface flows and can have marginal sorting of
substrates – these are often generally well-vegetated features, which can influence flow conveyance/attenuation/storage/infiltration, water quality and
sediment, and food (invertebrates). Generally there are two types; a) defined

Final Environmental Implementation Report Mount Pleasant Sub-Area 51-1
September 2011
2-32
features with natural bank vegetation consisting of forest, scrubland/thicket or
meadow (as defined in OSAP or ELC), or b) poorly defined features (swales)
typically distinguished by hydrophilic vegetation. There is relatively limited length of Complex Contributing Habitat in both the East Huttonville and
Fletcher’s Creek subcatchments within Block 51-1.
• “Simple Contributing Habitat” – these are formed generally as a result of
ephemeral or (less commonly) intermittent surface flows – these are generally not well-vegetated features that influence flow conveyance, attenuation, storage
and infiltration as well as sediment transport. Generally there are two types: a)
defined features characterized by crop cultivation, mowing or no vegetation; or b) poorly defined features (swales) that may contain terrestrial vegetation.
These reaches tend to dominate in the upper portions of the Study Area – particularly north of Wanless Drive. This is the case for both the East Huttonville
and Fletcher’s Creek systems.
“Not Fish Habitat” - The use of “Not Fish Habitat” is appropriate for some reaches. The elements of this category include “The pre-screened drainage feature has been field verified to confirm that no features and/or functions associated with headwater drainage features is present – generally characterized by no definition or flow, no groundwater seepage or wetland functions, and evidence of cultivation, furrowing, presence of a seasonal crop, lack of natural vegetation and fine textured soils (i.e., clay and/or silt)”. This is described in further detail below. Based on additional site observations and
discussions with the CVC through the completion of the CFCP, some swale reaches were deemed to represent “Not Fish Habitat” – including the upper reaches of HV23b (south of
W13), and a portion of HV32.
As indicated above, the upper portions of the East Huttonville Creek subwatershed (i.e.,
south of Mayfield Road to a mid-point between the CNR and Wanless Drive) and all of the upper Fletcher’s Creek tributaries within Block 51-1 (i.e., Reaches F01, F02, and F03)
include classic intermittent/ephemeral agricultural field swales – many are cropped through and have been characterized as Simple Contributing Habitat within the HFSWS.
In the case of the F01 to F03 reaches within Fletcher’s Creek, the CVC has indicated that
it would be appropriate to consider these as “Not Fish Habitat” based on the fact that they ultimately discharge into a SWM pond within the Fletcher’s Meadow community east
of Creditview Road. Other reaches are providing Complex Contributing Habitat.
Figure 2.2.2 presents the fish habitat classification as recommended in the CFCP.
2.2.2.3 Existing Fish Community Management Zones
The CRFMP contains information that is gathered on a watershed-wide scale and
therefore represents a high-level perspective of fisheries and fish habitat within the entire Credit River watershed. Subwatershed-level information and management approaches,
including Fish Management Zone delineation and/or Fish Community Classification, are
therefore addressed at a higher level and are subject to refinement as new information becomes available through more detailed comprehensive investigations, sampling and
monitoring efforts.
As described within the HFSWS Phase 3 report, the CRFMP provides guidance with
respect to the fish species that management actions should be targeted towards, the width of riparian buffers, and the timing for instream works based on the fish
communities that are present in and downstream of the development area. Two fish

Final Environmental Implementation Report Mount Pleasant Sub-Area 51-1
September 2011
2-33
communities, mixed cool/warmwater and small warmwater, are indicated by the CRFMP
to be present in the Mount Pleasant Study Area. The descriptions of these fish
communities within the CRFMP, as it applies to the East Huttonville and Fletcher’s Creek watersheds, follows.
The main branch of the Huttonville Creek, from Queen Street upstream to the confluence of the East and West Branches, just north of Bovaird Drive, was identified in the CRFMP
as a “warmwater community dominated by Cyprinids”. The CRFMP classifies the fish community in the East Huttonville Creek as “small warmwater”, which is dominated by
blacknose dace (Rhinichthys atratalus) and creek chub (Semotilus atromaculatus). These fish communities have been confirmed through the additional fish collections completed as part of the HFSWS and the recent CVC electrofishing of the lower reaches of the West
and the East Huttonville Creeks (i.e., upstream of Bovaird Drive) that was undertaken in 2009 as part of a continuation of the CVC’s Effectiveness Monitoring Strategy.
Although the dominance of creek chub, blacknose dace and brook stickleback in the East
Huttonville Creek, upstream of the CNR, would suggest that the designation of “small warmwater” is an appropriate descriptor, it is noted that northern redbelly dace were
captured immediately upstream from the CNR in 2006 (HFSWS, 2007) as well as from an offline pond in the City Park in 2003 (Dougan and Associates and others, 2005).
Recognizing that the upstream limit of northern redbelly dace in the East Huttonville
Creek is not static and that there are insufficient sampling data to define that upstream limit, the transition location is assumed to be at the confluence of Reaches HV22 and
HV23 (i.e., it is considered coolwater downstream of HV22/23 and warmwater upstream of HV22/HV23). This is the first confluence of watercourses providing seasonal habitat
upstream from the furthest upstream point where northern redbelly dace have been captured. Upstream from that point, the fish community is considered to be warmwater
as depicted in Figure 2.2.3. It is noted that the expansion of the coolwater
management zone upstream from the CNR to HV22/23 is a departure from the original delineation in the CRFMP, which was considered to be warmwater, as described
previously.
However, with the establishment of the Endangered Species Act, the management zones
policies within the East Huttonville Creek are governed by the presence of Redside Dace in the lower reaches and the designation of regulated habitat for this species, as is
described in the following section. Redside Dace are regarded as a “coolwater” species and the coldwater construction timing window is applied to proposed in-water works in
waters that contain regulated habitat. Hence, the coldwater construction timing window is applied to all reaches of the East Huttonville Creek upstream of the CNR to Mayfield
Road.
2.2.2.4 Regulated Redside Dace Habitat
Based on a review of habitat requirements outlined in the Recovery Strategy for Redside
Dace in Ontario (Redside Dace Recovery Team, 2010), Redside Dace tend to occupy
clear and cool slow moving streams that have pool and riffle sequences to support resident and spawning activity, respectively (however, it may also be found in moderately
turbid stream reaches). The species prefer clear water and are sensitive to turbidity; however, it has been found in stream reaches with moderate turbidity. They are
described as a coolwater species, preferring water temperatures generally less than 24oC
and with dissolved oxygen concentrations of at least 7 mg/l. Spawning often occurs in nests of other species and substrates include detritus or silty covered rocks, boulders,
gravel or sand. Streams inhabited are generally clear or colourless, with hard substrates

Final Environmental Implementation Report Mount Pleasant Sub-Area 51-1
September 2011
2-34
and clear to brown tinged in streams with organic substrates. Redside Dace prefer
streams with overhanging bank vegetation (grasses, shrubs), undercut banks, and
submerged branches/logs that are located adjacent to meadows, pastures and thickets. This fish jumps and captures insect prey that is flying above the water surface. These
prey are thought to utilize the stream and upland meadow and riparian vegetation communities as part of their life cycle.
Redside Dace (Clinostomas elongates), an endangered species (uplisted in 2009) as identified in the provincial Endangered Species Act, 2007, occurs in both the Fletcher’s and Huttonville Creeks. Prior to July 1, 2011, the MNR identified Huttonville Creek,
portions of West Huttonville Creek and the East Huttonville Creek, south of the CNR, to be an “Aquatic Resource Area” or currently “Occupied Habitat”, as per the approved
Redside Dace Recovery Strategy (February 2010). Additionally, the West, Centre and East Branches of Fletcher’s Creek, downstream of Sandalwood Parkway, were identified
as Aquatic Resource Areas. In September 2010, the CVC observed Redside Dace in an
undisclosed Fletcher’s Creek stream reach in a portion of constructed channel, south of Wanless Drive. In August 2011, fisheries biologists with the CVC also captured a Redside
Dace in a tributary within the West Fletcher’s subcatchment (south of Wanless Drive, east of Chinguacousy Road).
The definitions of Redside Dace habitat, for the purpose of defining Redside Dace habitat under the ESA, were updated by the MNR in Ontario Regulation 293/11 (June 2011).
This new regulation amended Ontario Regulation 242/08 under the Endangered Species Act. Ontario Regulation 293/11 implements the Endangered Species Act with respect to
Redside Dace in two main ways: 1) by providing guidance for compliance with the ESA for projects approved prior the enactment of the Regulation; and, 2) by defining Redside
Dace habitat that falls under the ESA.
Section 29.1 of Ontario Regulation 293/11 provides specific definitions of the boundaries
and elements of the habitat of Redside Dace that are regulated under the Endangered Species Act. It states,
“For the purpose of clause (a) of the definition of “habitat” in subsection 2(1) of the Act, the following areas are prescribed habitat of redside dace: 1. Within the Cities of Hamilton and Toronto, the counties of Bruce, Grey, Huron, Simcoe and Wellington, the regional municipalities of Durham, Halton, Peel and York, the Townships of St. Joseph, Jocelyn and Hilton, and the Village of Hilton Beach.
i. any part of a stream or other watercourse that is being used by a redside dace,
ii. any part of a stream or other watercourse that was used by a redside dace at any time during the previous 20 years, and that provides suitable conditions for a redside dace to carry out its life processes,
iii. the area encompassing the meander belt width of the two areas described above,
iv. the vegetated area or agricultural lands within 30 metres of the meander belt width of these areas, and
v. a stream, permanent or intermittent headwater drainage feature, groundwater discharge area or wetland that augments or maintains the baseflow, coarse sediment supply or surface water quality of the areas noted above,

Final Environmental Implementation Report Mount Pleasant Sub-Area 51-1
September 2011
2-35
provided the part of the stream or watercourse has an average bankfull width of 7.5 metres or less.
2. Within the City of Hamilton, counties of Bruce, Grey, Huron, Simcoe and Wellington, and the regional municipalities of Durham, Halton, Peel and York,
i. any part of a stream or other watercourse used by a redside dace at any time in the past that is located in the same or adjacent sub-watershed as the area identified in subparagraph 1 i or ii that provides suitable conditions for successful stream corridor rehabilitation and for natural recolonization of redside dace,
ii. the area encompassing the meander belt width of an area described in subparagraph i,
iii. the vegetated area or agricultural lands that are within 30 m of an area described in subparagraph ii, and
iv. A stream, permanent or intermittent headwater drainage feature, groundwater discharge area or wetland that augments or maintains the baseflow, coarse sediment supply or surface water quality of the areas noted above, provided the part of the stream or watercourse has an average bankfull width of 7.5 metres or less.”
Based on recent discussions with the MNR regarding the application of Section 29.1 of Ontario Regulation 293/11 under existing conditions, the East Huttonville Creek, some
headwater drainage features and some wetlands within Sub-Area 51-1, illustrated on
Figure 2.2.4, are considered to be regulated Redside Dace habitat. They are based on the following interpretation of definitions in Ontario Regulation 293/11, Section 29.1:
• Sub-section 1, items i, ii, iii and iv apply to the East Huttonville Creek
downstream of the CNR, Main Huttonville Creek and West Huttonville Creek
within Sub-Area 51-1. These definitions apply to areas with direct habitat use by
Redside Dace and include areas that were formerly described as “Occupied Habitat”. There are no records of this species being captured in the East
Huttonville Creek, but they have been captured in the West Huttonville Creek, just upstream of the confluence with the East Huttonville Creek and in the
Huttonville Creek downstream of this confluence.
• Sub-section 1, item v defines contributing habitat areas (streams, permanent or
intermittent headwater drainage features, groundwater discharge areas or
wetlands) that support those areas where Redside Dace are found by contributing baseflow, coarse sediment supply or surface water quality to them.
• Sub-section 2, items i, ii, iii refer to what was previously listed as “Recovery
Habitat”; areas where Redside Dace once existed that provide suitable conditions
for successful stream corridor rehabilitation and for natural re-colonization of
Redside Dace. These definitions do not apply to the East Huttonville Creek above the CNR or Fletcher’s Creek in Sub-Area 51-1 as these streams are not known to
have been used by Redside Dace at any time in the past, based on historical records of stream surveys.
• Sub-section 2, item iv does not apply since Sub-section 2 item i does not apply.

Final Environmental Implementation Report Mount Pleasant Sub-Area 51-1
September 2011
2-36
Section 3.5 identifies future regulated Redside Dace habitat following construction of the
new NHS.
2.2.3 CFCP Estimated Net Gain in Fish Productive Capacity
The HFSWS assessed the 2G and 3G Land Use Plans against a number of fisheries habitat related targets. The CFCP has completed a similar assessment and has reviewed
and revised fish habitat classifications presented in the HFSWS based upon a more
detailed assessment of classifications. The revised CFCP that is being finalized for submission in October 2011, has reviewed the proposed reach lengths of the various
habitat types and made refinements based upon discussions with CVC and DFO staff. Finalized existing habitat types and stream lengths will be presented within the CFCP,
however, the following is a general discussion of the anticipated changes that will result through implementation of the NHS.
The existing East Huttonville Creek subcatchment consists primarily of seasonal habitat in the main stem of the watercourse, upstream of the CNR all the way to Mayfield Road.
Flowing into the main reach are numerous agricultural field swales that have been designated as simple contributing habitat, and a smaller number that are classified as
complex contributing habitat.
The assessment of habitat change between the existing and future condition has
involved an “accounting” of stream reaches that will be lost through infilling and/or channel realignment and those reaches that will convert from one designation to another
(e.g., the conversion of existing seasonal habitat that will change to permanent habitat following the introduction of surface water from SWM ponds from Wanless Drive
downstream towards the CNR). The CFCP assessment demonstrates that there will be
an overall gain in net productive capacity achieved as follows:
• There will be an increase in permanent habitat. The existing seasonal habitat
present within the main branch of East Huttonville Creek will change to a permanent condition as a result of the increasing discharge of treated SWM
water as one proceeds southward from Wanless Drive. These additional surface
water contributions to the watercourse will replenish water to refuge pools and other habitat features such that it will afford a more secure year-round ability for
fish to survive during the driest months of the year. The designation of permanent habitat in the new channel does not imply that all reaches of the NHS
will have water on a year-round basis, but that the key habitat components such
as refuge pools and runs will have sufficient resupply of discharge to enable fish survival during these extreme conditions.
• There will likely be a slight decrease in the length of seasonal and complex
habitat, and a slight increase in the proposed length of simple contributing
habitat. The change in seasonal habitat is largely due to the conversion to permanent habitat with the introduction of frequent SWM discharge. The loss of
complex habitat is due to the infilling of most of the existing complex swales
which creates a deficit – some of this is recovered, however, through the use of side-slope swales that will drain pods of rear yards and roof-top drainage.

Final Environmental Implementation Report Mount Pleasant Sub-Area 51-1
September 2011
2-37
• The removal of the existing race track pond wetlands (i.e., W10, W11, and W12)
will result in the loss of some 14,836m2 of combined open water and associated
riparian/upland habitat. Conversely, the proposed creation of the new wetland feature that will compensate for the loss of the racetrack wetlands has the
potential to create some 21,776m2 of open water/riparian habitat (based upon the existing plans within Vignette 3 – this could change somewhat during the
detailed design discussions with the agencies that will ultimately determine the preferred type of wetland design). However, regardless of the design details,
the overall size of the wetland block is set, and the resulting wetland feature will
result in a significant gain in functional aquatic habitat.
Based on the above, implementation of the NHS will result in a net gain in fish productive capacity.
2.3 Terrestrial Resources This section provides an overview of the terrestrial ecology background information, field
surveys undertaken, a summary of findings and an assessment of significance and sensitivity as it relates to the proposed community development. The terrestrial systems
in both the Study Area and vicinity are addressed in this section. The introductory information in the following paragraphs summarizes information and results from a
number of background reports. Substantial details are provided in each of these reports
and baseline mapping.
Summary of MNR Wetland Surveys and Mapping, 2005-2007 In 2005 and 2006, the MNR conducted wetland inventories and fieldwork in the NWB
area and vicinity (within the LSA area). Information collected included:
• external wetland polygon boundaries and internal wetland community
boundaries;
• wetland vegetation community descriptions;
• vascular plant checklist divided into ten sub-areas (shown on mapping);
• upland forest community descriptions associated with the wetlands; and,
• general wildlife observations (not linked to unique vegetation polygons),
including amphibian survey observations.
The updated wetland mapping for the NWB area was utilized to confirm (and in a few
areas refine) Ecological Land Classification (ELC) mapping prepared for the HFSWS Phase 1 Characterization Report.
In December 2007, the MNR released a Draft Huttonville Creek and Area Wetlands Map
and Background data summary of Candidate Provincially Significant Wetland (PSW)
Units. Fourteen Candidate PSW areas are located in the Study Area; the MNR deferred a final determination regarding their status (i.e., they remain candidates) until completion
of HFSWS NHS planning. This approach was adopted to allow for a more broad consideration of the functions performed by the individual wetland units in the context of

Final Environmental Implementation Report Mount Pleasant Sub-Area 51-1
September 2011
2-38
the larger terrestrial and aquatic ecological system being proposed for development
within the NHS. In this EIR, the wetland units are referred to as W1, W2, W3, etc.
North West Brampton: Phase 2 Urban Expansion Area Environmental Open Space Study, Final Report, City of Brampton, 2005
An Environmental Open Space Study was completed in March 2005 by a multi-
disciplinary team led by Dougan & Associates. This study assessed whether development in the broader NWB Study Area could occur in a manner which sustains the natural
environment. It addressed how the environmental and open space related requirements
of Policy 7.9.2.8 of the Peel Official Plan could be achieved should the proposed urban expansion proceed.
Huttonville and Fletcher’s Creek Subwatershed Study, Phase 1 Characterization and Integration Report, 2007
As part of the HFSWS Phase 1 study process, Dougan & Associates mapped vegetation
community boundaries utilizing the ELC system developed by Lee et al. (1998). Field
surveys to delineate and describe ELC communities were completed in September and November 2006, and October 2007. A three season botanical inventory was conducted
in May, June, July, September and October 2006, as well as July 2007, in the Study Area.
As part of the HFSWS Phase 1 work, breeding bird surveys were completed in 2005, 2006 and 2007 to better understand the community of species present with the
subwatersheds. Amphibian surveys were conducted in 2005 and 2006 to determine
species and general numbers present in the Study Area. Aside from amphibians and breeding birds, all other wildlife species were recorded on an incidental basis, (i.e., no
specialized surveys were conducted to detect their presence).
Draft Landscape Scale Analysis, 2007
Dougan & Associates also completed a draft LSA in 2007. This study was undertaken to fully understand the larger local/regional landscape within which the Mount Pleasant
subwatershed was being investigated. This work, accomplished primarily through GIS analysis, provided an understanding of the broad landscape patterns as they related to
terrestrial and aquatic ecological systems. This work contributed to an understanding of
how an NHS, within the Mount Pleasant subwatershed, would link with and relate to adjacent external systems. The results of this work were carried forward and provided
guidance to the evolving NHS. The LSA Report will be finalized in concurrence with the HFSWS.
Figure 1.2.2 illustrates the Sub-Area 51-1 lands in relation to the LSA study boundary.
The SPNHS provides linkages northerly into Caledon and ultimately into the Etobicoke
Creek watershed and southerly through the Huttonville Creek valley to the Credit River valley.
North West Brampton Wildlife Summary Report (March 2009)
Savanta Inc. completed a variety of wildlife surveys in the Study Area, each contributing to an understanding of wildlife usage of various habitats throughout the seasons. These
were outlined in the aforementioned report and are summarized in the following paragraphs.

Final Environmental Implementation Report Mount Pleasant Sub-Area 51-1
September 2011
2-39
Winter wildlife field surveys were completed in the NWB Study Area in February and
March 2008. The purpose of those investigations was to establish relative use of wildlife
habitat during the winter season within the NWB Study Area. Work was accomplished by recording wildlife tracks and signs, species observations, and other habitat details.
Breeding amphibian field surveys were completed in April, May, and June 2008. A
second year of surveys was also conducted in April, May, and June 2009. Locations were determined through inspection of orthophotography, vegetation communities and ground
observation, including where tributaries crossed roads.
Specific amphibian road crossing surveys were completed in May and June, 2008. Road
crossing surveys were conducted in spring of 2009 to observe road crossings by earlier breeders (i.e., Wood Frog, Chorus Frog, and Spring Peeper). In addition, a second year
of May and June road crossing surveys were conducted in May and June 2009. The
purpose of the 2008 and 2009 investigations was to determine if frogs or toads were moving across roads at night during the breeding season, the level of species mortality,
and if roads were used as natural corridors.
Savanta Inc. also conducted breeding bird surveys in May, June and July of 2008 and
2009.
All of the 2008 results for the wildlife studies described above are detailed and interpreted in this report. Wildlife studies were completed in 2009 and the results of the
2008 and 2009 studies were analyzed and findings detailed in the sections of the EIR that follows.
CVC Monitoring of Terrestrial Features within Blocks 51-1 and 51-2 Lands (2009-2010) The CVC has a monitoring program for certain wetlands, woodlots and watercourses
within their jurisdiction. Four of these locations, one woodlot, one wetland, and two
watercourses, are within the Study Area for the Block 51-1 EIR. The survey of water temperature and chemistry, benthics, fish species, flow measurements and stream
morphology are conducted within the lower reaches of the East Huttonville Creek (north of Bovaird Drive) and were described within the summary of aquatic conditions within
Section 2.2 above. The terrestrial monitoring is described below.
The wetland plot is located in Park Woodland C (W13a), located west of the City Park
approximately 1 km north of Bovaird Drive West. Work which was completed within W13a was identified by the CVC as EM-2. This wetland has been classified as a Freeman
Maple Mineral Deciduous Swamp Type (SWD3-3). This vegetative community was represented throughout the site with just the edges showing some diversity with some
ash species. One soil core was taken to confirm the vegetative community type. A
variety of surveys, the methodologies of which are based on the EMAN protocols, were conducted at this site. These included ground vegetation, woody plant regeneration,
canopy cover, soil moisture and pH. Breeding bird and amphibian surveys were also conducted at this site. There is potential to initiate a tree health assessment at this
survey location in the spring of 2011.
The upland forest (woodlot) plot is located north of Wanless Road in Mayfield Woodland A (ELC unit FOD9-4), identified by the CVC as EM-1. A variety of surveys, the
methodologies of which are based on the EMAN protocols, were conducted at this site.
These included ground vegetation, woody plant regeneration, biodiversity assessment,

Final Environmental Implementation Report Mount Pleasant Sub-Area 51-1
September 2011
2-40
downed woody debris, soil decomposition, tree health assessment, soil chemistry, and
soil temperature, moisture and pH. Breeding bird surveys were also conducted at this
site.
2.3.1 Vegetation The following text summarizes the findings by Dougan & Associates from the HFSWS
Phase 1 and 2 studies.
2.3.1.1 Vegetation Communities
As part of the HFSWS Phase 1 Report, Dougan & Associates mapped vegetation
community boundaries utilizing the ELC system developed by Lee et al. (1998). Field
surveys to delineate and describe ELC communities were completed in September and November 2006 and October 2007.
In the Study Area, there are twenty-six vegetation communities as determined through a
combination of the Phase 1 HFSWS, the Draft MNR (2007) Huttonville Creek and Area Wetlands Background Document and observations by Savanta Inc. Broad groups of
vegetation communities in the Study Area include deciduous forests, deciduous and
thicket swamps, shallow and meadow marshes, and cultural old field meadow, thickets and woodlands (Figure 2.3.1; Table 2.3A). The ELC map (Figure 2.3.1) shows
Dougan’s ELC line work (black), MNR draft wetland boundaries (dark blue), and Savanta Inc.’s surveys (yellow); the staked woodland (green) and wetland boundaries (light blue)
are also mapped. None of the vegetation communities are listed as provincially rare in
the Natural Heritage Information Centre (NHIC) database (Bakowsky, 1996) nor as significant vegetation types (ELC) in the Peel-Caledon Significant Woodlands and
Significant Wildlife Habitat Study (2009).

Final Environmental Implementation Report Mount Pleasant Sub-Area 51-1
September 2011
2-41
Table 2.3A ELC Vegetation Types in the Study Area
Ecological
Land
Classification Vegetation
Type
Ecological Land
Classification Code
2007 Draft
MNR Huttonville
Creek and Area
Wetlands
Phase II SWS
Terrestrial Unit
Phase I
SWS
Vegetation Community
Code
DECIDUOUS FOREST (FOD)
Dry-Fresh Oak - Hardwood
Deciduous Forest
FOD2-4 n/a O 38
Dry-Fresh
Beech Deciduous
Forest
FOD4-1 n/a R 41.1
Dry-Fresh Sugar Maple -
Basswood
Deciduous Forest
FOD5-6 n/a H 7
Fresh-Moist
Ash Lowland Deciduous
Forest
FOD7-2 n/a I 4
Fresh-Moist Shagbark
Hickory Deciduous
Forest
FOD9-4 n/a H 8
CULTURAL MEADOW (CUM)
Dry-Moist Old Field Meadow
CUM1-1 n/a O, Q 67.1, 67.2, 357, 357.1
CULTURAL THICKET
Grey Dogwood Cultural
Thicket
CUT1-4 n/a P 8

Final Environmental Implementation Report Mount Pleasant Sub-Area 51-1
September 2011
2-42
Table 2.3A ELC Vegetation Types in the Study Area
Ecological Land
Classification Vegetation
Type
Ecological
Land Classification
Code
2007 Draft
MNR
Huttonville Creek and
Area Wetlands
Phase II
SWS Terrestrial
Unit
Phase I SWS
Vegetation Community
Code
CULTURAL WOODLAND (CUW)
Mineral
Cultural Woodland
Ecosite
CUW1 n/a R, S 41.2, 40
MEADOW MARSH (MAM)
Mineral Meadow Marsh
Ecosite
MAM2
n/a P 375
Reed Canary Grass Mineral
Meadow Marsh
MAM2-2 W7, W8, W9, W13,
W48
P 44.1
Broad-leaved Sedge Mineral
Meadow Marsh
MAM2-6 W9, W13 n/a
Jewelweed Mineral
Meadow Marsh
MAM2-9 W13 n/a n/a
Forb Mineral Meadow Marsh
MAM2-10 W13 n/a n/a
Graminoid
Mineral Meadow Marsh
MAM2-11* W9, W13 n/a n/a
Mixed Mineral
Meadow Marsh MAM2-12* W9 n/a
Creeping Bent Grass Mineral
Meadow Marsh
MAM2-13* W12 n/a
SHALLOW MARSH (MAS)
Cattail Mineral Shallow Marsh
MAS2-1 W10, W11,
W12 n/a n/a

Final Environmental Implementation Report Mount Pleasant Sub-Area 51-1
September 2011
2-43
Table 2.3A ELC Vegetation Types in the Study Area
Ecological Land
Classification Vegetation
Type
Ecological
Land Classification
Code
2007 Draft
MNR
Huttonville Creek and
Area Wetlands
Phase II
SWS Terrestrial
Unit
Phase I SWS
Vegetation Community
Code
SWAMP (SW)
Red (Green)
Ash Mineral Deciduous
Swamp
SWD2-2
W1, W2,
W3, W5, W6, W7,
W8, W13
O, P 37, 44
Silver Maple Mineral
Deciduous Swamp
SWD3-2
W13 R 42, 43
Swamp Maple
Mineral Deciduous
Swamp
SWD3-3 W4, W13 H 6
Mineral Thicket
Swamp Ecosite
SWT2 n/a P 44.3
Red-osier Mineral
Thicket
Swamp
SWT2-5
n/a R 41.5
Meadowsweet
Mineral
Thicket Swamp
SWT2-6 W9, W13 n/a n/a
OPEN AQUATIC (OAO)
Open Aquatic OAO n/a Q 259
SUBMERGED SHALLOW AQUATIC (SAS)
Submerged
Shallow Aquatic
SAS1 W10 n/a n/a
Pondweed
Submerged Shallow
Aquatic
SAS1-1 W12 n/a n/a

Final Environmental Implementation Report Mount Pleasant Sub-Area 51-1
September 2011
2-44
In the HFSWS Phase 1 Report, contiguous vegetation communities were grouped into
Natural System Integration Units; within the Study Area, Natural System Integration
Units H, (11.4 ha), I, (2.7 Ha), O (6.8 ha), P (5.4 ha), Q (1.7 ha), R (14.4 ha) and S (1.8 ha) are present. Within each area, species diversity, weediness, presence of rare
species and overall quality are summarized below. The location of each Natural System Integration Units is provided on Figure 2.0.1 (from Figure T8 Revised, HFSWS). Areas
H, I, O, P and R are to be protected and maintained in the Final NHS; Area Q and S will be removed and restoration in the final NHS will replace and enhance their functions.
The following are some key summary observations of that work.
• Most of the deciduous woodland communities in the Study Area have varying
populations of the invasive alien Garlic Mustard (Alliaria petiolata). Alien or non-native species are rated as dominant and extensive in various cultural units, although there are a few wetland units where invasives are also abundant, such
as Area P, a Deciduous Swamp, where European Buckthorn (Rhamnus cathartica) is dominant in the shrub layer.
• The Deciduous Swamp in Natural System Integration Units H and R all exhibit relatively high species diversity, even age structure and localized older growth
pockets. They are considered good representatives of their vegetation types
(Swamp Maple Mineral Deciduous Swamp Type for Natural System Integration Unit H, and Silver Maple Mineral Deciduous Swamp Type for Natural System
Integration Unit R). The Draft LSA Report (2007) notes the two Silver Maple Mineral Deciduous Swamps (Natural System Integration Unit R) as having a high
total function, as they moderate (capture) surface water flow within their catchment.
• The Green Ash Swamp Type (Units H, I, O, P and R) is common in the Study Area and tends to be more disturbed and of lower quality than the maple
swamps.
• Lowland Deciduous Ash Forest is also common, occurring as individual
communities (e.g., Unit I) or as pockets within or adjacent to larger upland forests (Area O). These lowland forests are dominated by Green Ash (Fraxinus pennsylvanica) and typically occur on clay soils on sites that were once cleared.
• The racetrack pond was formed from the establishment of irrigation ponds (W10, W12) along a headwater drainage feature. The pond (W12), located in the
centre of the racetrack, is a Submerged Aquatic Wetland, with Cattail Mineral
Shallow Marsh and Creeping Bent Grass Mineral Meadow Marsh along the shoreline. West of the racetrack pond is a small submerged aquatic wetland with
Cattail Mineral Shallow Marsh (W10) and a Cattail Mineral Shallow Marsh (W11). East of the racetrack pond is a Reed Canary Grass Mineral Meadow Marsh (W48).
The HFSWS Phase I Report lists only Cultural Old-Field Meadow and open water
aquatic wetland in Natural System Integration Unit Q.

Final Environmental Implementation Report Mount Pleasant Sub-Area 51-1
September 2011
2-45
• The woodlot immediately north of the CNR, Natural System Integration Unit S, is
a mineral cultural thicket, with a Bur Oak and Basswood hedgerow at the east
boundary. Within the thicket is a very small wetland community comprised of three different vegetation types: a Forb Mineral Meadow Marsh, a Graminoid
Mineral Meadow Marsh and a Red-Osier Dogwood Thicket Swamp (W14). The HFSWS Phase 1 Report only notes the presence of the Red-Osier Mineral Thicket
Swamp and not the meadow marsh communities.
A Vegetation Conservation Plan was completed by Kuntz Forestry Consulting Inc. to
inventory trees within the Block 51-1 lands. The study included all trees 15cm in diameter and larger situated outside the NHS and select trees situated within the NHS. A
total of 491 individual trees including the CNR Woodland were inventoried outside the NHS. Select trees inventoried within the NHS but outside of woodlands included 6
individual trees, 1 tree grouping and 1 Regenerating Meadow.
Of the 491 individual trees situated outside of the NHS, 21 specimen trees were identified
for preservation consideration. Tree health, location or site grading requirements made preservation of most specimen trees impractical. Of the specimen trees identified, 1 will
be retained with the Block Plan fabric within the revised boundary of the City Park.
Of the trees inventoried within the NHS but outside of woodlands, 2 trees, 1 tree
grouping and the majority of the Regenerating Meadow can be retained.
For further discussion, see Section 7.0.
2.3.1.2 Vascular Plant Species
Three-season botanical inventories were conducted in May, June, July, September and
October 2006, as well as in July 2007, within the HFSWS Study Area by Dougan & Associates (refer to Appendix D3 of Phase 1 HFSWS). A total of 295 species of vascular
plants were recorded from the HFSWS during the surveys. In the HFSWS Study Area,
238 species or 81% are native and 57 species or 19% are exotic. Refer to Appendix C-1 for tables summarizing SWS botanical inventory.
In 2006, prior to the completion of field studies in support of the HFSWS, MNR staff conducted field studies in the entire NWB Study Area and identified sixteen wetland
species and four upland species as regionally and locally rare (based on Varga et al. 2005 and Kaiser 2001). Thirty-seven regionally and locally rare (same ranking sources)
species were identified during Dougan’s investigations. Savanta Inc. has reviewed all of the regionally and locally rare species identified in the NWB (MNR study) and HFSWS
area (Dougan & Associates inventory), with associated vegetation communities present
in the Study Area, and believes that all of the local and regional species of interest recorded may be found within the Study Area.
Since the completion of the MNR and the HFSWS plant surveys, regional and local plant
species list have been updated. The current local list is the 2010 Field Data List of Flora Species Confirmed in the CVC Watershed document. The latest list for the Region is within the Rare Vascular Plants of Ontario, Fourth Edition (March 2009). The MNR and
HFSWS plant species lists were compared to the latest local and regional species list and thirty-four local species of interest (SCC Tier 2) were noted. None of the species
identified by the MNR or HFSWS plant surveys are on the latest regional rare plant list (Table 2.3B). The local plant species identified are widespread across Block 51-1. For
local wetland plants, wetland water balance has been completed and the volume of

Final Environmental Implementation Report Mount Pleasant Sub-Area 51-1
September 2011
2-46
water will be maintained post development. While there will be changes to temporal
distribution of water in the spring (less water from spring runoff), none of the locally
significant species are sensitive to this temporal water distribution change. Figure 2.3.2 summarizes abundance by category (low, moderate, high) levels of rare species in each
Natural System Integration Unit. Low abundance equals 1-4 species occurrances, moderate equals 5-7 species and high equals 8+ species.

Final Environmental Implementation Report Mount Pleasant Sub-Area 51-1
September 2011
2-47
Table 2.3B Local or Regional Vegetation Species of Interest Observed by
MNR in North West Brampton Area or Dougan & Associates in the HFSWS Area: Current Local and Regional Designation
Common
Name
Scientific
Name
Identified as Locally or Regionally Rare or
Uncommon by MNR 2006 or HFSWS Study
LOCAL RANK
Peel and 2010 CVC SCC
Ranking (Tier 2=Local
Interest)
Indian Hemp Apocynum cannabinum
MNR 2006; Dougan & Associates 2010
Common, common
Sky Blue
Aster
Aster oolentangiensis
MNR 2006; Dougan &
Associates 2010 Rare, SCC Tier 2
Beggar-ticks, Tall
Bidens vulgata MNR 2006; Dougan & Associates 2006, 2007
Rare, SCC Tier 2
Broad-
glumed Brome
Bromus latiglumis
MNR 2006; Dougan &
Associates 2010
Uncommon, SCC Tier 2
Daisy-leaf
Grape-fern
Botrychium matricariifolium
Dougan & Associates 2006,
2007 SCC Tier 2
Bulbous
Cress
Cardamine bulbosa
MNR 2006; Dougan &
Associates 2010 SCC Tier 2
Purple Cress Cardamine douglassii
MNR 2006; Dougan & Associates 2010
Uncommon, SCC Tier 2
Pennsylvania
Bitter-cress
Cardamine pensylvanica
MNR 2006 Uncommon, SCC
Tier 2
Foxtail Sedge
Carex alopecoidea
MNR 2006; Dougan & Associates 2006, 2007
Rare, SCC Tier 2
Brome-like
Sedge
Carex bromoides
MNR 2006; Dougan &
Associates 2006, 2007 Rare, SCC Tier 2
Brownish
Sedge
Carex brunnescens
ssp. brunnescens
Dougan & Associates 2006,
2007 SCC Tier 2
Fringed
Sedge, Carex crinita MNR 2006
Uncommon, SCC Tier 3
Slender Wood Sedge
Carex digitalis Dougan & Associates 2006,
2007 SCC Tier 2
Gray Sedge Carex grayi Dougan & Associates 2006,
2007 SCC Tier 2
Pubescent
Sedge Carex hirtifolia
Dougan & Associates 2006,
2007 SCC Tier 2
Spreading Sedge
Carex laxiculmis MNR 2006; Dougan & Associates 2006, 2007
Rare, SCC Tier 2
Loose-
flowered Sedge
Carex laxiflora Dougan & Associates 2006,
2007 SCC Tier 2
Troublesome Carex molesta Dougan & Associates 2006, Rare, SCC Tier 2

Final Environmental Implementation Report Mount Pleasant Sub-Area 51-1
September 2011
2-48
Table 2.3B Local or Regional Vegetation Species of Interest Observed by
MNR in North West Brampton Area or Dougan & Associates in the HFSWS Area: Current Local and Regional Designation
Common Name
Scientific Name
Identified as Locally or
Regionally Rare or Uncommon by MNR
2006 or HFSWS Study
LOCAL RANK Peel and 2010 CVC SCC Ranking
(Tier 2=Local
Interest)
Sedge 2007
Larger Straw
Sedge Carex normalis
MNR 2006; Dougan &
Associates 2010
Not reported, not reported
Pale Sedge Carex
pallescens Dougan & Associates 2006,
2007 SCC Tier 2
Necklace
Sedge Carex projecta
Dougan & Associates 2006,
2007 SCC Tier 2
Pointed Broom
Sedge
Carex scoparia Dougan & Associates 2006,
2007 SCC Tier 2
Blunt Broom Sedge
Carex tribuloides
Dougan & Associates 2006, 2007
SCC Tier 2
Tuckerman
Sedge
Carex tuckermanii
MNR 2006; Dougan &
Associates 2006, 2007 Rare, SCC Tier 2
Pretty Sedge Carex woodii MNR 2006; Dougan &
Associates 2006, 2007 Rare, SCC Tier 2
Beaked Sedge
Carex utriculata MNR 2006; Dougan &
Associates 2010 Rare, SCC Tier 2
Shagbark
Hickory Carya ovata
MNR 2006; Dougan &
Associates 2010
Common, SCC Tier 2
Blue Cohosh Caulophyllum thalictroides
Dougan & Associates 2006, 2007
SCC Tier 2
Spotted
Water-hemlock
Cicuta maculata MNR 2006; Dougan &
Associates 2010
Common, SCC Tier 2
Wood
Reedgrass
Cinna arundinacea
MNR 2006; Dougan &
Associates 2006, 2007 Rare, SCC Tier 2
Slender Wood
Reedgrass
Cinna latifolia Dougan & Associates 2006,
2007 SCC Tier 2
Carolina Spring
Beauty
Claytonia caroliniana
MNR 2006; Dougan & Associates 2010
Rare, SCC Tier 2
Virginia Spring
Beauty
Claytonia virginica
MNR 2006; Dougan & Associates 2010
Common, SCC Tier 2
Silky Dogwood
Cornus amomum ssp.
obliqua
Dougan & Associates 2006, 2007
Rare, SCC Tier 2
Grey Dogwood
Cornus foemina MNR 2006; Dougan &
Associates 2010 Common, SCC
Tier 2

Final Environmental Implementation Report Mount Pleasant Sub-Area 51-1
September 2011
2-49
Table 2.3B Local or Regional Vegetation Species of Interest Observed by
MNR in North West Brampton Area or Dougan & Associates in the HFSWS Area: Current Local and Regional Designation
Common Name
Scientific Name
Identified as Locally or
Regionally Rare or Uncommon by MNR
2006 or HFSWS Study
LOCAL RANK Peel and 2010 CVC SCC Ranking
(Tier 2=Local
Interest)
Holmes'Haw
thorn
Crataegus holmesiana
MNR 2006; Dougan &
Associates 2006, 2007 Rare, SCC Tier 2
Blunt Spike-rush
Eleocharis obtusa
MNR 2006; Dougan & Associates 2010
Uncommon, SCC Tier 2
River Wild-
rye Elymus riparius
Dougan & Associates 2006,
2007 SCC Tier 2
Running Strawberry
Bush
Euonymus obovata
MNR 2006; Dougan &
Associates 2010
Common, SCC Tier 2
Rough Avens
Geum laciniatum
MNR 2006; Dougan & Associates 2010
Common, SCC Tier 2
White Grass Leersia virginica MNR 2006; Dougan &
Associates 2006, 2007 Rare, SCC Tier 2
Michigan Lily Lilium
michiganense MNR 2006
Uncommon, SCC Tier 2
Water
Loosestrife
Lysimachia thyrsiflora
Dougan & Associates 2006,
2007 SCC Tier 2
Pennsylvania
Pellitory
Parietaria pensylvanica
MNR 2006; Dougan &
Associates 2010 Rare, SCC Tier 2
Ditch Stonecrop
Penthorum sedoides
MNR 2006; Dougan & Associates 2010
Common, SCC Tier 2
White
Spruce Picea glauca
Dougan & Associates 2006,
2007 SCC Tier 2
Red Pine Pinus resinosa Dougan & Associates 2006,
2007 SCC Tier 2
Sago
Pondweed
Potamogeton pectinatus
MNR 2006 Uncommon, SCC
Tier 4
Bur Oak Quercus
macrocarpa MNR 2006; Dougan &
Associates 2010 Common, SCC
Tier 2
Sandbar
Willow Salix exigua MNR 2006 Rare, SCC Tier 2
Hispid
Greenbrier Smilax hispida MNR 2006
Uncommon, SCC Tier 2
Giant Goldenrod
Solidago gigantea
MNR 2006; Dougan & Associates 2010
Common, SCC Tier 2
Large Bur-
reed
Sparganium eurycarpum
MNR 2006; Dougan &
Associates 2006, 2007 Rare, SCC Tier 2
Greater Duckweed
Spirodela polyrrhiza
MNR 2006 Uncommon, SCC
Tier 2
Le Conte’s
Violet Viola affinis
MNR 2006; Dougan &
Associates 2006, 2007 Rare, not reported

Final Environmental Implementation Report Mount Pleasant Sub-Area 51-1
September 2011
2-50
Table 2.3B Local or Regional Vegetation Species of Interest Observed by
MNR in North West Brampton Area or Dougan & Associates in the HFSWS Area: Current Local and Regional Designation
Common Name
Scientific Name
Identified as Locally or
Regionally Rare or Uncommon by MNR
2006 or HFSWS Study
LOCAL RANK Peel and 2010 CVC SCC Ranking
(Tier 2=Local
Interest)
Marsh Blue
Violet Viola cucullata
Dougan & Associates 2006,
2007 Rare, SCC Tier 2
Northern Water-meal
Wolffia borealis MNR 2006; Dougan &
Associates 2010 Rare, SCC Tier
Water-meal Wolffia
columbiana MNR 2006; Dougan &
Associates 2010 Rare, SCC Tier
*Note: No species are designated on the 2009 Ontario Rare Species List (Peel Region)
An examination of the distribution of rare species in the Phase 1 HFSWS points to the
forested wetlands, and in particular, those dominated by Silver and/or Swamp maple, as hosting the highest concentrations of rare species, with Natural System Integration Unit
R having 11 rare species and Area H having 5 rare species. The upland deciduous woodland in Natural System Integration Unit H harbours 9 rare species. Other
woodlands and other forested mineral wetlands have fewer rare species present (i.e.,
three or four). Only one non-forested upland unit, a cultural meadow, was habitat to two rare plant species. This cultural meadow is located south of the CNR, just above and
below where the West and the East Huttonville Creeks join the Main Huttonville Creek (Polygon 70). The meadow is approximately within the Redside Dace-occupied creek
reach, a 100m wide corridor. All of the vegetation communities that are habitat to local
or regional species of interest are protected within the Final NHS.
Beyond rarity, native plant species were also assessed in the HFSWS for their relative sensitivity, based upon a review of assigned coefficients of conservatism (CC) (Oldham et al., 1995). The value of CC, ranging from 0 (low) to 10 (high), is based on a species’ tolerance of disturbance and fidelity to a specific natural habitat. Species with a CC value
of 9 or 10 generally exhibit a high degree of fidelity to a narrow range of habitat
parameters. For each vegetation community, the mean native (i.e., exotics excluded) coefficient of conservation (mean CC) was calculated (Table 2.3C). As expected, the
lowest value (1.3) was found in cultural old-field meadows (CUM1-1), while the highest values (3.9-4.6) were found in deciduous forest and deciduous swamp communities
Areas H, I and R (FOD5-6, FOD7-2, FOD9-4, SWD3-2, SWD3-3). The high CC values in
these communities reflect the fairly specialized habitat required by the rare species.

Final Environmental Implementation Report Mount Pleasant Sub-Area 51-1
September 2011
2-51
Table 2.3C Co-efficients of Conservatism for Each Vegetation
Community in the Study Area
Natural System
Integration Unit
ELC Type FQI Calculations S
Rank
CULTURAL MEADOW (CUM)
Above and
below where West and the
East Huttonville
Creek join Main Huttonville
Creek
CUM1-1
Dry-Moist Old Field
Meadow
Native Species (n)
Adventive Species (n) Total Species
Sum of cc Mean Native C
mean C with adventives Native fqi
Native fqi with adventives
20
21 41
51 2.55
1.243 11.403
7.964
N/A
O
CUM1-1
Dry-Moist Old Field
Meadow
Native Species (n) Adventive Species (n)
Total Species
Sum of cc Mean Native C
mean C with adventives Native fqi
Native fqi with adventives
14 12
26
19 1.357
0.730 5.077
3.726
N/A
Q
CUM1-1
Dry-Moist Old Field
Meadow
Native Species (n) Adventive Species (n)
Total Species
Sum of cc Mean Native C
mean C with adventives Native fqi
Native fqi with adventives
29 12
41
77 2.655
1.878 14.298
12.025
N/A
410 Associated with
un-named
simple contributing
reach southwest of
HV28
CUM1-1
Dry-Moist Old Field
Meadow
Native Species (n) Adventive Species (n)
Total Species
Sum of cc Mean Native C
mean C with adventives Native fqi
Native fqi with adventives
6 12
18
8 1.333
0.444 3.265
1.885
N/A
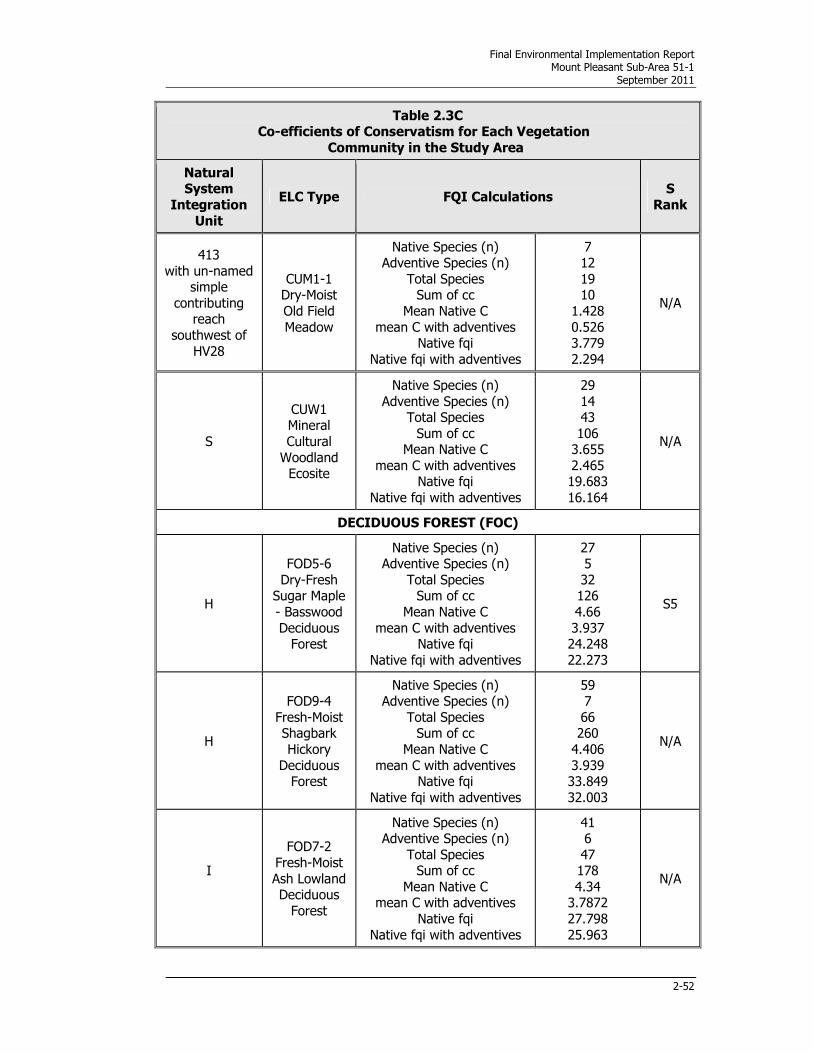
Final Environmental Implementation Report Mount Pleasant Sub-Area 51-1
September 2011
2-52
Table 2.3C Co-efficients of Conservatism for Each Vegetation
Community in the Study Area
Natural System
Integration
Unit
ELC Type FQI Calculations S
Rank
413
with un-named simple
contributing reach
southwest of
HV28
CUM1-1 Dry-Moist
Old Field
Meadow
Native Species (n) Adventive Species (n)
Total Species Sum of cc
Mean Native C
mean C with adventives Native fqi
Native fqi with adventives
7 12
19 10
1.428
0.526 3.779
2.294
N/A
S
CUW1 Mineral
Cultural
Woodland Ecosite
Native Species (n)
Adventive Species (n) Total Species
Sum of cc Mean Native C
mean C with adventives Native fqi
Native fqi with adventives
29
14 43
106 3.655
2.465 19.683
16.164
N/A
DECIDUOUS FOREST (FOC)
H
FOD5-6
Dry-Fresh Sugar Maple
- Basswood
Deciduous Forest
Native Species (n) Adventive Species (n)
Total Species Sum of cc
Mean Native C
mean C with adventives Native fqi
Native fqi with adventives
27 5
32 126
4.66
3.937 24.248
22.273
S5
H
FOD9-4
Fresh-Moist Shagbark
Hickory
Deciduous Forest
Native Species (n) Adventive Species (n)
Total Species Sum of cc
Mean Native C
mean C with adventives Native fqi
Native fqi with adventives
59 7
66 260
4.406
3.939 33.849
32.003
N/A
I
FOD7-2
Fresh-Moist
Ash Lowland Deciduous
Forest
Native Species (n) Adventive Species (n)
Total Species Sum of cc
Mean Native C mean C with adventives
Native fqi
Native fqi with adventives
41 6
47 178
4.34 3.7872
27.798
25.963
N/A

Final Environmental Implementation Report Mount Pleasant Sub-Area 51-1
September 2011
2-53
Table 2.3C Co-efficients of Conservatism for Each Vegetation
Community in the Study Area
Natural System
Integration
Unit
ELC Type FQI Calculations S
Rank
O
FOD2-4
Dry-Fresh Oak -
Hardwood Deciduous
Forest
Native Species (n)
Adventive Species (n)
Total Species Sum of cc
Mean Native C mean C with adventives
Native fqi
Native fqi with adventives
26
3
29 101
3.884 3.482
19.807
18.755
N/A
R
FOD4-1
Dry-Fresh Beech
Deciduous
Forest
Native Species (n)
Adventive Species (n)
Total Species Sum of cc
Mean Native C mean C with adventives
Native fqi
Native fqi with adventives
29
4
33 111
3.827 3.363
20.612
19.322
N/A
MEADOW MARSH (MAM)
P
MAM2-2
Reed Canary Grass Mineral
Meadow Marsh
Native Species (n)
Adventive Species (n) Total Species
Sum of cc
Mean Native C mean C with adventives
Native fqi Native fqi with adventives
15
8 23
28
1.866 1.217
7.229 5.838
N/A
P
MAM2 Mineral
Meadow
Marsh Ecosite
Native Species (n)
Adventive Species (n) Total Species
Sum of cc Mean Native C
mean C with adventives
Native fqi Native fqi with adventives
24 7
31 60
2.5
1.935 12.247
10.776
N/A

Final Environmental Implementation Report Mount Pleasant Sub-Area 51-1
September 2011
2-54
Table 2.3C Co-efficients of Conservatism for Each Vegetation
Community in the Study Area
Natural System
Integration
Unit
ELC Type FQI Calculations S
Rank
DECIDUOUS SWAMP (SWD)
H
SWD3-3 Swamp
Maple
Mineral Deciduous
Swamp
Native Species (n)
Adventive Species (n) Total Species
Sum of cc
Mean Native C mean C with adventives
Native fqi Native fqi with adventives
50
6 56
218
4.36 3.892
30.829 29.131
N/A
O
SWD2-2
Red (Green) Ash Mineral
Deciduous Swamp
Native Species (n)
Adventive Species (n) Total Species
Sum of cc
Mean Native C mean C with adventives
Native fqi Native fqi with adventives
40
6 46
153
3.825 3.326
24.191 22.558
S5
P
SWD2-2 Red (Green)
Ash Mineral
Deciduous Swamp
Native Species (n)
Adventive Species (n) Total Species
Sum of cc
Mean Native C mean C with adventives
Native fqi Native fqi with adventives
31
3 34
108
3.483 3.176
19.397 18.521
S5
R
SWD3-2
Silver Maple Mineral
Deciduous Swamp
Native Species (n)
Adventive Species (n) Total Species
Sum of cc Mean Native C
mean C with adventives
Native fqi Native fqi with adventives
29
4 33
114 3.931
3.454
21.169 19.844
N/A
R
SWD3-2
Silver Maple Mineral
Deciduous Swamp
Native Species (n)
Adventive Species (n) Total Species
Sum of cc Mean Native C
mean C with adventives
Native fqi Native fqi with adventives
49
8 57
178 3.632
3.122
25.428 23.576
N/A

Final Environmental Implementation Report Mount Pleasant Sub-Area 51-1
September 2011
2-55
Table 2.3C Co-efficients of Conservatism for Each Vegetation
Community in the Study Area
Natural System
Integration
Unit
ELC Type FQI Calculations S
Rank
THICKET SWAMP (SWT)
P
SWT2
Mineral Thicket
Swamp
Ecosite
Native Species (n)
Adventive Species (n) Total Species
Sum of cc
Mean Native C mean C with adventives
Native fqi Native fqi with adventives
28
11 39
81
2.892 2.076
15.307 12.970
N/A
R
SWT2-5
Red-osier Mineral
Thicket Swamp
Native Species (n)
Adventive Species (n) Total Species
Sum of cc
Mean Native C mean C with adventives
Native fqi Native fqi with adventives
31
3 34
109
3.516 3.205
19.576 18.693
S5
Invasive species are present in varying abundance and numbers of species (moderate or
high) within each Natural System Integration Unit, as illustrated on Figure 2.3.2. Garlic
mustard and common buckthorn are the most common species.
There may be opportunity to salvage live native plant material from vegetation communities outside of the NHS, for use within the future NHS depending on staging of
grading and construction. Potential salvage areas include:
• cultural old field meadows along the east side of Mississauga Road, south of
Mayfield Road;
• various ELC vegetation types associated with Terrestrial Unit Q (i.e., W10, W11,
W12, and W48); and, • the CNR (Terrestrial Unit S) cultural woodland and internal meadow marsh (W14).
2.3.2 Wildlife
In addition to the specific surveys conducted through the HFSWS, the MNR and/or Savanta Inc., incidental observations of other species were also recorded (i.e., fingernail
clams, fairy shrimp, butterflies, dragonflies & damselflies, crayfish and reptiles).
Final Environmental Implementation Report Mount Pleasant Sub-Area 51-1
September 2011
2-56
2.3.2.1 Winter Wildlife Surveys
Winter wildlife surveys were not previously conducted for the NWB Study Area or as part
of field surveys during the HFSWS. Winter wildlife field surveys were completed in the EIR Study Area by Savanta Inc.’s staff on February 14th and 23rd, March 2nd, 6th and 7th,
2008. The purpose of the investigation was to better understand wildlife movement patterns and the relative importance of winter wildlife habitat within the Study Area.
Observations included noting wildlife tracks and signs, species observations, and general
habitat characteristics.
The winter wildlife surveys were conducted at selected transects throughout the NWB Study Area (Figure 2.3.3). Transect locations were determined through inspection of
orthophotography, vegetation communities, and ground observation and were distributed
across the NWB Study Area to ensure that the ecological variability was adequately sampled. Transects were focused mainly on existing access routes, trails, forest edges,
hedgerows, and streams. Vegetation communities consisting of dense vegetation were also surveyed as long as habitat was accessible by snowshoes.
Additional details regarding the field methodologies employed are contained in North West Brampton Wildlife Summary Report (March 2009). Six mammal species, four unconfirmed mammal species and two bird species were
identified in the Study Area in the winter of 2008 (listed in Table 2.3D). According to the Natural Heritage Information Centre (NHIC, 2008), all species are considered
provincially and globally common (S5/G5). Refer to Figure 2.3.4 for species, locations
and number of species occurrences within the Study Area.

Final Environmental Implementation Report Mount Pleasant Sub-Area 51-1
September 2011
2-57
Table 2.3D
Winter Wildlife Species Observed
Common Name Scientific Name Designation
Mammals
Coyote Canis latrans S5/G5
Grey Squirrel Sciurus carolinensis S5/G5
Eastern Cottontail Sylvilagus floridanus S5/G5
Meadow Vole Microtus pennsylvanicus S5/G5
Raccoon Procyon lotor S5/G5
White-tailed Deer Odocoileus virginianus S5/G5
Unknown canine species N/A N/A
Unknown mouse species Peromyscus sp. S5/G5
Unknown shrew species N/A N/A
Unknown small mammal N/A N/A
Birds
Blue Jay Cyanocitta cristata S5/G5
Woodpecker species N/A N/A
The following paragraphs summarize the general distribution of winter wildlife in the Study Area (Note: Surveys were conducted only on properties where access was
granted).
East of Mississauga Road, west of Creditview Road, south of Wanless Drive, and north of
the CNR, wildlife observations were abundant. Wildlife appeared to be using the cluster of forest block, and the forested area north of the CNR as habitat during the winter
months. Small mammal species and deer trails were relatively abundant and wildlife
diversity was relatively high for this area.
The forested areas north of Wanless Drive, south of Mayfield Road, west of Creditview Road and east of Mississauga Road (Terrestrial Unit H) contained a relatively high
number of mammal tracks and trails. Gray Squirrel tracks were abundant throughout this woodlot. The woodlot is a Fresh-Moist Shagbark Hickory Forest (FOD9-4), a foraging
area with abundant mast. In a recent background study to ROPA 21B, criteria were
developed and presented for the determination of Significant Wildlife Habitat (SWH) in

Final Environmental Implementation Report Mount Pleasant Sub-Area 51-1
September 2011
2-58
Peel Region and in the Town of Caledon. ROPA 21B identifies the need for the Cities of
Mississauga and Brampton to develop and apply criteria that would be deemed suitable
for this definition within their local municipalities and to ensure the intent of the Region’s ROPA 21B is met. This local approach has not been developed in Brampton, however, the
relatively expansive and inclusive nature of the proposed NHS is expected to fully encompass and to restore important habitat for wildlife within this study area.
The FOD9-4 vegetation community also exhibited relatively more habitat usage by
Eastern Cottontails. Coyotes tracks were also present in this area. The presence of
coyote with cottontails and small mammals likely indicates a potential predator-prey relationship, as cottontails and small mammals are a preferred food source for coyotes.
This predator-prey relationship is also found at other locations throughout the Study Area.
All species observed in the Study Area are designated as common according the to NHIC database.
2.3.2.2 Breeding Anurans (Frogs and Toads) and Road Crossing Surveys
Amphibian walk-in and roadside call surveys were conducted as part of the HFSWS. In April 2005, May and June 2006, and April 2007, Dougan & Associates conducted
amphibian breeding surveys and found low levels of breeding calls. The HFSWS also conducted amphibian egg mass surveys (April and May 2006). In the Spring of 2007,
amphibian road crossing surveys were first conducted in the North West Brampton Study Area by the MNR. See Appendix C-2 for summary tables of EIR 2008-2009 breeding
amphibian results.
The MNR and the CVC reviewed the results of the 2005-2007 HFSWS inventories and
requested some supplementary investigations to thoroughly sample areas greater than 100m from call recording points. In support of the HFSWS, amphibian breeding call and
road crossing surveys were conducted by Savanta Inc. where suitable breeding habitat
was confirmed or suspected. These activities were undertaken to develop a better understanding of amphibian movement patterns across the landscape. Additional details
regarding the field methodologies employed are contained in North West Brampton Wildlife Summary Report (March 2009).
Breeding Populations of Amphibians
The following summarizes breeding amphibian field surveys completed in 2008 and 2009 by Savanta Inc. In 2008, surveys were undertaken on April 15th and 16th, May 5th, and
7th, and June 10th, and 11th, 2008. During 2009, surveys were completed on April 17th and 18th, May 21st, 22nd and 27th and June 18th, 19th, and 23rd, 2009. Locations were
determined through inspection of orthophotography, vegetation communities, and
ground observation, including where tributaries crossed roads (Figure 2.3.5). A table summarizing Savanta Inc.’s field results (date, time, climate conditions, survey duration,
results) is provided in Appendix C-2.4).
The purpose of the investigation was to better understand the diversity, abundance and
distribution of amphibians in the Study Area as input into the development of a thorough awareness of local ecosystems. This work relied upon call surveys, incidental visual
observations and general habitat characterization. The provincial and global status of species identified on the North West Brampton Study Area was referenced in the current
NHIC database.

Final Environmental Implementation Report Mount Pleasant Sub-Area 51-1
September 2011
2-59
An additional amphibian breeding call survey was conducted on adjacent lands, at the
stormwater ponds (SWP) located within the residential area, east of the NWB Study Area. The ponds were surveyed to compare the amphibian occurrences in permanent man-
made ponds, to those permanent and natural and/or naturalized wetland/pond features found within the NWB Study Area. This was undertaken to better understand and
predict the potential effects of community development on local amphibian populations. In the Study Area, the only permanent open water feature is in the racetrack pond area,
just east of Mississauga Road and northwest of the City Park.
Limited numbers of frogs and toads were heard calling within the Study Area and on
adjacent lands (see Figures 2.3.6 and 2.3.7) for location, species and number of
occurrences). Six species of frog and one species of toad were heard calling and are identified (refer to Table 2.3E). According to the NHIC 2008, all species detected are
considered provincially and globally common (S5, G5).
Of the six species observed, only one, American Toad, was present in a large enough
concentration to meet the Marsh Monitoring Program definition of a ‘chorus’ (i.e., occurs “when there is so many males of one species calling that all the calls sound like they are
overlapping and continuous”, making it difficult to reasonably count or estimate). Only
one chorus of American Toad was heard outside of the Study Area, west of Mississauga Road and south of Mayfield Road in a wet agricultural field.
In two years of study, only five Spring Peepers were heard calling in the Study Area. This species breeds in temporary ponds (fishless) near or in wooded areas, including
shallow ponds, flooded fields, swamps, and flooded ditches. Both 2008 and 2009 are recognized as “wet years”, with high levels of precipitation (snow/rain) which would
maximize potential for temporary ponds within the Study Area. Low call levels of Spring Peepers were observed over both years, which suggests that breeding habitat of
sufficient quality is relatively unavailable in the Study Area.
Northern Leopard Frogs also breed in temporary ponds (fishless) including flooded
meadows, marshes with open water and ditches. In 2008, the species was only
observed at the racetrack pond (Natural System Integration Unit Q; W12); five individuals were heard in total. In 2009, eleven individuals were heard at the racetrack
pond and three individuals were heard in the unnamed drainage feature south of the racetrack wetland/pond and immediately south of HV19b. No full choruses were heard
at either of the observation locations.
Green frogs breed, feed and overwinter in permanent open water features. They require
permanent ponds for breeding because their tadpoles overwinter. In both 2008 and 2009, the species was only observed at the racetrack pond with nine and eleven
individuals, respectively.
Only one Gray Tree Frog was heard during the two years of surveys and no Wood Frogs
were detected in the Study Area.

Final Environmental Implementation Report Mount Pleasant Sub-Area 51-1
September 2011
2-60
Table 2.3E
Breeding Amphibian Species Observed in 2008 & 2009 Surveys
Common Name Scientific Name Designation
American Toad Bufo americanus S5/G5
Gray Treefrog Hyla versicolor S5/G5
Green Frog Rana clamitans S5/G5
Northern Leopard Frog Rana pipiens S5/G5
Spring Peeper Pseudacris crucifer S5/G5
In 2010, the Region adopted the new Official Plan Natural Heritage (and agricultural)
Policies (ROPA 21B). While this policy document and associated background reports are specific to Caledon, they can offer guidance for Brampton and Mississauga in their
determination of thresholds to satisfy significant wildlife habitat in their jurisdictions. These local municipalities have not advanced specific thresholds for the determination of
this feature.
A review of the Peel/Caledon specific criteria and thresholds suggests that if these criteria
were adopted without local Brampton refinements, two areas examined would possess concentrations and diversity of amphibians that would seem to meet suggested
thresholds. For the purposes of this study, in the absence of Brampton-specific criteria, this was interpreted to mean that these two areas provide some level of importance to
amphibian populations. Both of these features are human-created: a SWM pond in
urbanized Fletcher’s Creek subwatershed (i.e., 18 green frogs, and 2 American Toads) and Natural System Integration Unit Q (i.e., 10 American toads, 9 green frogs, and 5
northern leopard frogs) (racetrack pond). The common characteristic amongst these two features is permanent open water. Limited shoreline and adjacent natural vegetation
adjacent to these habitats limit their importance beyond comments offered in this
section. This does suggest however, that a properly designed and restored amphibian habitat within the proposed NHS could create a mix of areas with higher quality habitat
for these fauna.
Amphibian Movement Surveys
Savanta Inc. conducted amphibian movement surveys, relying upon road crossing
observations completed on May 7th, 14th, 30th, and June 4th, 2008. Road crossing surveys were conducted in the spring of 2009 (March 27th, April 20th) to observe road crossings
by earlier breeders (i.e., Wood Frog, Chorus Frog, Spring Peeper). In addition, a second year of May and June road surveys were conducted on May 26th, May 27th, May 28th,
June 8th, and June 17th, 2009. ) Surveys were conducted between dusk to pre-dawn
during light rain, or shortly following rain events. Refer to Appendix C-3 for a summary table of weather conditions during amphibian road crossing surveys.

Final Environmental Implementation Report Mount Pleasant Sub-Area 51-1
September 2011
2-61
These movement investigations assisted to determine whether frogs or toads were
travelling across the landscape and where concentrations of movement might occur.
This contributed to an understanding of natural corridors and their use and where such features might be beneficial to restore in the proposed NHS.
In 2008, the American Toad (Bufo americanus), a provincially and globally common
species, was the only amphibian species observed moving across the landscape (Figure 2.3.8). In 2009, the Northern Leopard Frog (Rana pipiens) (one occurrence) and Green Frog (Rana clamitans) (five occurrences) were also observed (Figure 2.3.9).
Both of these species are also considered provincially and globally common (S5/G5). The amphibians were headed in many different directions, some towards water features and
some towards shelter. On all roads, more dead amphibians were found than live ones. The highest mortality rate was on Wanless Drive, with relatively lower mortality rates
along Mississauga Road, Creditview Road, Chinguacousy Road, and Mayfield Road.
Lower road mortality was most likely due to the fact that some roads were busier and louder than other roads, causing amphibians to avoid them, if possible. It was also
difficult to survey Mayfield Road and Mississauga Road as traffic was heavier, busier and faster, and the roads were wider/multi-lane. Generally, amphibian movement was
restricted to the ubiquitous species American Toad; its movement was diffuse across the
Study Area.
2.3.2.3 Raptor Surveys
Specialized searches were conducted for late wintering raptors (owls and hawks) and possible/potential raptor nests prior to leaf out by Savanta Inc. in April/May 2009. These
surveys revealed three species of hawks inhabiting the Study Area - Red-tailed Hawk,
Northern Harrier, and American Kestrel. All three are open country hawks feeding primarily on Meadow Voles in roadside ditches, waste and grassland habitats.
No owls were directly observed during these surveys, but large and small pellets were
located suggesting Great Horned Owl and Eastern Screech-Owl respectively, based on
pellet size and habitat. In addition, an active Great Horned Owl nest was located nearby but outside the Study Area.
In the case of all these birds of prey, both wintering and nesting, it should be assumed
that birds found breeding within the Study Area will likely rely upon habitats outside of the Study Area.
Dougan and Associates, as part of the Phase 1 HFSWS program, found a presumed Cooper’s Hawk nest in Natural System Integration Unit H in 2006. A second nest
attributed to Cooper’s Hawk, based on the observation of adults nearby, was located the same year in Block 51-2. Savanta Inc. conducted nest searches in April and May of 2009
and found no nests in Block 51-1 lands but did locate a nest from the roadside in Block
51-2 (Natural System Integration Unit C) where no landowner access has been granted. Additionally, a Cooper’s Hawk was observed in 2009 around a suitable woodlot in Natural
System Integration Unit J (Heritage Heights). Although Cooper’s Hawk was not observed in the Study Area on these surveys, it was found in NWB during the breeding season and
is likely a permanent resident in NWB Area in small numbers.

Final Environmental Implementation Report Mount Pleasant Sub-Area 51-1
September 2011
2-62
2.3.2.4 Breeding Bird Observations
Previous Breeding Bird Surveys conducted over a larger area for the HFSWS by Dougan
and Associates in 2005, 2006 and 2007 detected 77 species, 11 of which were considered migrants. Two other species, although recorded during the breeding season,
did not reveal any breeding evidence. Therefore, 64 bird species showed breeding evidence during this period.
Savanta Inc. conducted ongoing and supplementary breeding bird surveys in May through July 2008 and 2009. These surveys were conducted according to the Ontario
Breeding Bird Atlas protocol. Breeding bird surveys were conducted at point count stations, roadside surveys and area searches across the Study Area, including early
morning visits at the racetrack ponds east of Mississauga Road.
The HFSWS recorded bobolink in Terrestrial Unit P (W9), and a cultural meadow located
west of W9 and just east of Mississauga Road. In late September 2010, Bobolink was listed as Threatened on the Endangered Species Act (2007). No other breeding bird species present are listed in the Endangered Species Act, 2007. Neither are any of the
breeding species provincially significant, (i.e., designated S1, S2, or S3 by the Natural Heritage Information Centre (NHIC, 2007f)).
Beyond importance due to rarity designations, a number of bird species were noteworthy
as they are known as area-sensitive bird species. Others were noteworthy given their more southern range in North America. Eastern Wood-Pewee (COSEWIC High Priority
Candidate) and Wood Thrush (COSEWIC Mid-Priority Candidate) were both observed.
The American Kestrel (Mid-Priority) was noted in the adjacent fields. Northern Harrier, an area-sensitive grassland raptor, was observed several times in all but summer,
suggesting they migrate and winter here at a minimum. Although grassland habitat is limited, it is possible they could also nest within the Study Area. The Red-bellied
Woodpecker was detected in forest areas, providing further evidence of this expanding
species continued success. In 2008, another southern species - Orchard Oriole, currently undergoing a northward expansion, was located in mid-May. It would either be a
migrant, or possibly a local breeding species, although it was not detected on breeding bird surveys in June.
In summary, the Mount Pleasant SPNHS was created to maximize protection of the
wetland and woodlot COSEWIC priority species. Three (Wood Thrush, Barn Swallow and
Eastern Pewee) are protected through woodlands and wetlands. The Wood Thrush is maintained through conservation of woodlands (5 ha+). The Barn Swallow may build its
nest on the side of buildings and under bridges, and requires open country for foraging, which will be present in the NHS. Eastern Wood-Pewee nesting habitat - deciduous trees
without surrounding development, will be present in the NHS (Environment Canada,
2007).
Table 2.3F summarizes the bird species observed by Savanta Inc. in NWB during 2008 and 2009 raptor surveys, breeding bird surveys and incidental observations.

Final Environmental Implementation Report Mount Pleasant Sub-Area 51-1
September 2011
2-63
Table 2.3F 2008/2009 Bird Observations within North West Brampton (Savanta Inc.)
SCIENTIFIC NAME COMMON
NAME 2009 2008
G-
rank
S-
rank
Anatidae
Branta canadensis Canada
Goose x x G5 S5
Aix sponsa Wood Duck x early
spring G5 S5
Anas rubripes American Black Duck x fall G5 S4
Anas platyrhynchos Mallard x x G5 S5
Anas crecca Green-
winged Teal
x early
spring G5 S4
Aythya collaris Ring-necked
Duck x fall G5 S5B
Mergus merganser Common Merganser
x early spring
G5 S5B, S5N
Phasianidae
Meleagris gallopavo Wild Turkey x x G5 S5
Ardeidae
Ardea herodias Great Blue
Heron x fishing
x
fishing G5 S5
Cathartidae
Cathartes aura Turkey Vulture
x, on the
ground, overhead
/roosting
x,over
head, roosti
ng
G5 S5B
Accipitridae
Circus cyaneus Northern
Harrier
winter,
also HW
winter
, fall G5 S4B
Accipiter cooperii Cooper's
Hawk x G5 S4

Final Environmental Implementation Report Mount Pleasant Sub-Area 51-1
September 2011
2-64
Table 2.3F 2008/2009 Bird Observations within North West Brampton (Savanta Inc.)
SCIENTIFIC NAME COMMON
NAME 2009 2008
G-
rank
S-
rank
Accipiter sp. x
Buteo jamaicensis Red-tailed
Hawk x x G5 S5
Falconidae
Falco sparverius American
Kestrel
x winter,
early spring &
post-
breeding season
x
spring G5 S5B
Charadriidae
Charadrius vociferus Killdeer x x G5 S5B,
S5N
Scolopacidae
Actitis macularius Spotted
Sandpiper x x G5 S5
Gallinago delicata Wilson's Snipe
x (during 2008 April amphibian survey)
G5 S5B
Columbidae
Columba livia Rock Pigeon x x G5 SNA
Zenaida macroura Mourning Dove
x x G5 S5
Strigidae
Megascops asio Eastern
Screech-Owl pellets G5 S5
Bubo virginianus Great Horned
Owl x G5 S5
Picidae

Final Environmental Implementation Report Mount Pleasant Sub-Area 51-1
September 2011
2-65
Table 2.3F 2008/2009 Bird Observations within North West Brampton (Savanta Inc.)
SCIENTIFIC NAME COMMON
NAME 2009 2008
G-
rank
S-
rank
Melanerpes carolinus Red-bellied
Woodpecker x G5 S4
Picoides pubescens Downy
Woodpecker x x G5 S5
Picoides villosus Hairy
Woodpecker x G5 S5
Colaptes auratus Northern
Flicker x x G5 S4B
Dryocopus pileatus Pileated
Woodpecker holes x G5 S5
Woodpecker sp. x
Tyrannidae
Contopus virens Eastern
Wood-Pewee x x G5 S4B
Empidonax minimus Least
Flycatcher x x S4B
Sayornis phoebe Eastern
Phoebe x x G5 S5B
Myiarchus crinitus Great Crested Flycatcher
x x G5 S4B
Tyrannus tyrannus Eastern Kingbird
x x G5 S4B
Vireonidae
Vireo gilvus Warbling Vireo
x x G5 S5B
Vireo olivaceus Red-eyed Vireo
x G5 S5B
Corvidae
Cyanocitta cristata Blue Jay x x G5 S5
Corvus brachyrhynchos American
Crow x x G5 S5B
Alaudidae

Final Environmental Implementation Report Mount Pleasant Sub-Area 51-1
September 2011
2-66
Table 2.3F 2008/2009 Bird Observations within North West Brampton (Savanta Inc.)
SCIENTIFIC NAME COMMON
NAME 2009 2008
G-
rank
S-
rank
Eremophila alpestris Horned Lark x x G5 S5B
Hirundinidae
Tachycineta bicolor Tree Swallow x x G5 S4B
Hirundo rustica Barn Swallow x x G5 S4B
Paridae
Poecile atricapillus Black-capped
Chickadee x x G5 S5
Sittidae
Sitta carolinensis White-breasted
Nuthatch
x x G5 S5
Certhiidae
Certhia americana Brown
Creeper x G5 S5B
Troglodytidae
Troglodytes aedon House Wren x x G5 S5B
Turdidae
Hylocichla mustelina Wood Thrush x x G5 S4B
Turdus migratorius American
Robin x x G5 S5B
Mimidae
Dumetella carolinensis Gray Catbird x G5 S4B
Mimus polyglottos Northern
Mockingbird x x G5 S4
Toxostoma rufum Brown
Thrasher x x G5 S4B

Final Environmental Implementation Report Mount Pleasant Sub-Area 51-1
September 2011
2-67
Table 2.3F 2008/2009 Bird Observations within North West Brampton (Savanta Inc.)
SCIENTIFIC NAME COMMON
NAME 2009 2008
G-
rank
S-
rank
Sturnidae
Sturnus vulgaris European Starling
x x G5 SNA
Bombycillidae
Bombycilla cedrorum Cedar
Waxwing x x G5 S5B
Parulidae
Vermivora ruficapilla Nashville
Warbler x G5 S5B
Dendroica petechia Yellow Warbler
x x G5 S5B
Setophaga ruticilla American
Redstart x G5 S5B
Geothlypis trichas Common
Yellowthroat x x G5 S5B
Emberizidae
Spizella arborea American
Tree Sparrow x migrant G5 S4B
Spizella passerina Chipping
Sparrow x x G5 S5B
Spizella pusilla Field Sparrow x x G5 S4B
Pooecetes gramineus Vesper
Sparrow x x G5 S4B
Passerculus sandwichensis Savannah
Sparrow x x G5 S4B
Melospiza georgiana Swamp Sparrow
x x G5 S5B
Melospiza melodia Song
Sparrow x x G5 S5B
Junco hyemalis Dark-eyed
Junco x migrant G5 S5B

Final Environmental Implementation Report Mount Pleasant Sub-Area 51-1
September 2011
2-68
Table 2.3F 2008/2009 Bird Observations within North West Brampton (Savanta Inc.)
SCIENTIFIC NAME COMMON
NAME 2009 2008
G-
rank
S-
rank
Cardinalidae
Cardinalis cardinalis Northern Cardinal
x x G5 S5
Pheucticus ludovicianus Rose-
breasted
Grosbeak
x x G5 S4B
Passerina cyanea Indigo Bunting
x x G5 S4B
Icteridae
Dolichonyx oryzivorus Bobolink x x G5 S4B
Agelaius phoeniceus Red-winged Blackbird
x x G5 S5
Sturnella magna Eastern
Meadowlark x x G5 S4B
Quiscalus quiscula Common
Grackle x x G5 S5B
Molothrus ater Brown-headed
Cowbird
x x G5 S4B
Icterus spurius Orchard Oriole
x G5 S4B
Icterus galbula Baltimore Oriole
x x G5 S4B
Fringillidae
Carpodacus mexicanus House Finch x G5 SNA
Carduelis tristis American Goldfinch
x x G5 S5B
Passeridae
Passer domesticus House Sparrow
x x G5 SNA
Final Environmental Implementation Report Mount Pleasant Sub-Area 51-1
September 2011
2-69
2.3.2.5 Waterfowl Observations
The racetrack pond and its surrounding wetlands/meadows were assessed in detail for the degree of use as a waterfowl stopover and breeding area. The MNR previously
labelled the area as potential waterfowl breeding habitat. As recorded in the Huttonville Creek and Area PSW Background document, the MNR and the CVC observed waterfowl
staging in 2007 and 2009 in the racetrack pond.
On April 15th, May 14th, June 13th and July 6th, 2008, the racetrack pond and surrounding
wetland and upland habitats were visited by Savanta Inc. to assess the waterfowl breeding function and stopover habitat. On September 20th, October 24th, November 6th
and 23rd, 2008, the pond was further assessed as a fall migratory stopover site. As agricultural fields extended to the cattail edge of the ponds, observations were
conducted on foot with binoculars.
The data presented, in previous wildlife reporting and summarized here, support the
conclusion that the “racetrack pond” provides local importance as a stopover habitat for migrating waterfowl; however the pond and surroundings are not used by breeding
waterfowl. Characteristics that limit this breeding function include the following:
• ponds are relatively small and are not linked with other waterways to supplement
food and shelter for a breeding season;
• shrub and tree cover around the ponds are almost absent; and,
• lands surrounding the ponds are highly disturbed (i.e., completely surrounded by
plowed fields, including the field inside the racetrack surrounding the pond).
In terms of potential breeding observations, male Mallards were observed on the pond in April and May; each month between two and five males were observed. Males typically
gather after mating and soon begin to molt into their eclipse plumage. Their presence is
unlikely an indication of breeding in the pond area; it is more likely an indication that the ponds may provide a local food and shelter function for at least part of the molting
period. No nests were found in the vicinity, however females were observed in flight overhead and offsite in April and May.
Migrating Ring-necked Ducks were observed on the pond in the spring, indicating the
potential of the ponds to function as a stopover site for migrating ducks. A series of
observations were made during the fall to determine whether the pond was utilized during fall migration. On October 24th, 2008, over 90 Canada Geese and 20 Mallards
were observed in the ponds. On November 6th, 2008, 125 Mallards, one American Black Duck, and 12 Canada Geese were observed in the ponds, with another 500 or so Canada
Geese in the agricultural fields directly to the north of the pond. In November, 2008, the
pond was frozen over and most waterfowl congregated in the agricultural fields where foraging material was still available.
In considering ROPA 21B guidance for assessing wildlife significance, it would appear
that the racetrack pond does not meet criteria for breeding or stopover functions. The
Caledon/Peel specific criteria and thresholds include: waterfowl nesting habitat, landbird migratory stopover areas, terrestrial and aquatic habitat used for waterfowl stopover (or
staging) areas, and habitat for wetland breeding birds. Only one of the listed species, a single Black duck, was observed on the pond over the entire observation period. Non-

Final Environmental Implementation Report Mount Pleasant Sub-Area 51-1
September 2011
2-70
listed, urbanized species were dominant including Canada Geese and Mallard. Again, the
City has not developed thresholds for the determination of SWH, however, comments are
presented in this report with reference to ROPA 21B for context.
In considering the Caledon/Peel criteria and thresholds for habitat for wetland breeding birds the race track pond would not appear to meet criteria for designation as SWH.
2.3.3 Wetlands As discussed in Section 3.0, W1, W2, W3, W4, W5, W6, W7, W8, W9 and W13 will be maintained in the final NHS. The limits of these features have been surveyed in the field
with the Agencies (CVC, MNR, and the City) and 20m buffers are provided to wetlands
where required by the Implementation Principles. Each of these wetlands lies within the final NHS; some will be modified while others will be maintained in their existing
condition. Each wetland has been studied with respect to its size, location, contributing drainage area, inlet and outlet conditions, water sources, vegetation and habitat
conditions. The HFSWS, the MNR inventories and the EIR fieldwork were referenced to characterize each of the wetlands that will be maintained in the final NHS. The existing
conditions (geology, ecology, hydrology, hydrogeology) of each wetland are summarized
in a series of tables in Section 6.0.
2.4 Provincial Policy Statement – Natural Heritage Features
Seven types of natural heritage features are defined in the Provincial Policy Statement
(PPS):
• PSWs;
• significant portions of the habitat of endangered and threatened species; • fish habitat;
• significant woodlands;
• significant valleylands; • significant Areas of Natural and Scientific Interest (ANSIs); and,
• significant wildlife habitat.
The Natural Heritage Reference Manual (2010) provides technical guidance for evaluating significance of above PPS natural heritage features. Each is described in more detail as it
relates to the Study Area.
For the Study Area, the Natural System Integration Units were evaluated, through the
HFSWS Phase 2 Impact Assessments, for designation as Significant Valleylands, Significant Woodlands, Significant Wetlands, and Significant Wildlife Habitat, as
summarized in Table 2.4A. The following sections describe the criteria met by each
natural feature for designations as significant, in accordance with Table T1 of the Phase 2 HFSWS (2010). This report also considers whether woodlands designated as being
significant meet ROPA21B’s Peel/Caledon criteria for a Core Area (i.e., criteria have not been developed specific to Brampton – these Caledon/Peel criteria and thresholds
provide helpful guidance to these determinations).
Table 2.4A reflects deliberations regarding guidance offered in ROPA 21B. An
application of the language and intent of ROPA 21B in the North West Brampton area leads to the determinations presented in Table 2.4A and Figure 2.4.1. Core Areas
represent provincially and regionally significant features and areas, and are considered a

Final Environmental Implementation Report Mount Pleasant Sub-Area 51-1
September 2011
2-71
sub-set of what would be significant under the PPS. The Phase 3 HFSWS Report
provides a detailed discussion on how the NHS meets the intention of the PPS. Core
Areas maintain the integrity of the NHS. Natural Areas and Corridors (NAC) and Potential Natural Areas and Corridors (PNAC) may also be evaluated and identified to be significant
in area municipal official plans and through the local study process required during planning approvals in accordance with regional, area municipal and provincial policy.
NAC support the integrity of the NHS and PNAC have the potential to support the integrity of the NHS.
Table 2.4A Summary of Significant Features and Habitat by Natural System Integration Unit **
HFSWS
Phase 2 Natural
System
Integration Unit *
Significant
Valleyland
Significant
Woodland
Candidate
Significant Wetland (Candidate
Huttonville and
Fletcher’s Creek PSW)
Candidate Significant
Wildlife
Habitat
H N/A Yes (Core) Yes, (W1-4) Yes
I N/A Yes (NAC) Yes (W5-6) Yes
O N/A Yes (NAC) Yes (W7) Yes
P N/A Yes (NAC) Yes (W8 & 9) Yes
Q N/A N/A W10/11/12/48, to be
removed as per MPSP Yes
R N/A Yes (Core and NAC)
Yes (W13 ) No
S N/A No W14 to be removed
as per MPSP No
* See Figure 2.0.1 for Natural System Integration Unit locations ** Source: HFSWS (2010)
2.4.1 Significant Valleylands
Core valleys are defined in ROPA 21B as the natural resources associated with the river systems characterized by their landform, features and functions and include associated
ravines. The aforementioned river systems are the main branches, major tributaries,
other tributaries and identified watercourses draining directly into Lake Ontario.
Associated ravines are to be included if they meet one of the following criteria:
• important ecological functions related to the valley landform; • habitat for endangered/ threatened species;

Final Environmental Implementation Report Mount Pleasant Sub-Area 51-1
September 2011
2-72
• linkage to other natural features of the Greenlands System;
• flood and erosion hazards; or
• restoration potential.
Associated ravines within the Rural System are not considered Regional Core valley and stream corridors.
The section of the East Huttonville Creek, immediately south of the CNR, meets the criteria for designation as a Core Valleyland because it contains habitat of aquatic
endangered or threatened species (MNR defines this reach as Occupied Redside Dace habitat). It is protected in the final NHS through a 100m wide stream corridor.
2.4.2 Significant Wetlands
Wetlands can perform many functions, including the provision of groundwater recharge and discharge, attenuating flood flows, enhancing water quality, preventing erosion and
providing fish and wildlife habitat for a diversity of species. The four major types of
wetlands in Ontario are swamps, marshes, bogs and fens. In Brampton, the wetlands are swamps and marshes.
The MNR has completed wetland inventories within the NWB Study Area as well as
adjoining lands, as summarized in the Draft PSW December 2007 mapping. It is understood that the MNR Draft PSW mapping will be finalized after the completion of the
planning process; with the size and configuration of PSW units matching those conserved
within the final NHS reflecting the conservation and restoration of important wetland features and functions.
The November 24th, 2009 Implementation Principles for the Mount Pleasant
Subwatershed Study states that:
“The Ministry of Natural Resources will designate Provincially Significant Wetlands (PSWs) within the Mount Pleasant Secondary Plan area on the basis of the SPNHS (Schedule A) and will not preclude works, including site alteration, within PSWs specifically designed to enhance the wetland feature, wetland water balance, or required to implement the final NHS as refined through the EIRs.”
In accordance with the SPNHS and the final NHS described in Section 3.0:
• Candidate PSWs to be protected includes W1, W2, W3, W4, W5, W6 W7, W8, W9 and W13. The NHS Vignettes (March 2009) which formed part of the
Implementation Principles, proposed alterations to W7 and W9 to enhance
biological features and functions. At the June 9, 2010 EIR Workshop #1, the MNR requested that the current wetland vegetation community types within
portions of W7 and W9 be maintained. The proposed alterations to portions of these wetlands, within the agreed upon SPNHS limits, have been removed from
the revised Vignettes; refer to Section 3.4.1 for further discussion; and,
• Candidate PSWs to be removed to permit creek restoration (lowering and
realignment), development of a major urban node and the future James Potter Parkway, including W10, W11, W12, W48 and W14. Functions performed by
these wetlands will be restored in the final NHS.

Final Environmental Implementation Report Mount Pleasant Sub-Area 51-1
September 2011
2-73
The Final EIR has also proposed and examined realignment of Sandalwood Parkway
partially into W9, as a follow-up to the Mount Pleasant Transportation Study. The Study has identified impacts and mitigation measures/best practices with respect to partial
encroachment into W9, including the recommendation for wetland restoration in another location in the NHS adjacent to W13. Section 10.2.4.3 discusses the realignment and
mitigative measures.
Detailed descriptions of the wetland features are provided in Section 6 of this EIR report.
2.4.3 Significant Woodlands Woodlands are complex ecosystems comprising communities of trees, shrubs, ground
vegetation and immediate environmental conditions on which they depend. Woodlands can provide a range of ecosystem functions including:
• influencing hydrologic characteristics (quantity and quality);
• ameliorating microclimates;
• preventing erosion and stabilizing steep slopes;
• providing shade for cold water fisheries;
• enhancing groundwater recharge areas;
• providing habitat; and,
• supporting species diversity.
Woodlands are deemed to be important both because of the functions and ecosystem
services they perform, but also because of their general scarcity on the Peel landscape. In addition to their ecological functions, woodlands are valued for their economic, social,
and aesthetic benefits.
Woodlands, in the Region generally and in Caledon specifically, are designated by the
Region (ROPA 21B) as Core Features (i.e., significant woodlands) if they meet one or more of the criteria listed below:
• size: =/> 16 ha (rural system) or =/> 4 ha (urban system); or
• age: any woodland =/> 4 ha containing at least 0.5 ha of woodland in native trees older than 100 years and having late successional characteristics (excludes
plantations); or
• support Significant Species: any G1, G2, G3, S1, S2 or S3 plant or animal species or community as designated by the NHIC; or, any species designated by the
COSEWIC or COSSARO as Threatened, Endangered or Special Concern; or, the
following forest communities (FOC1-2, FOM2-1, FOM2-2, FOM6-1, FOD1-1, FOD 1-2, FOD 1-4, FOD2-3 or FOD 6-2. There are no significant ELC vegetation types
in the MPNHS.
ROPA 21B, and the supporting technical reporting, recognize that local municipalities
other than Caledon (i.e., Brampton and Mississauga) may determine their own thresholds for the definition of significant. The Region is interested in ensuring that significant
woodlands are adequately and consistently addressed in these local municipal landscapes. The City has yet to refine these Peel/Caledon criteria to suit local conditions.
The Caledon/Peel thresholds are utilized in this analysis as guidance for the potential determination of significance in Brampton.
Final Environmental Implementation Report Mount Pleasant Sub-Area 51-1
September 2011
2-74
In the Study Area, woodlands are present in Natural System Integration Unit H, I, O, P, R
and S. The HFSWS Phase 2 report identifies Core Areas based on the (January 27, 2009)
ROPA 21B. Natural System Integration Unit H and R met the designation as Core Area, while Natural System Integration Unit I, O and P met the designation of Natural Areas
and Corridors (NAC). Natural System Integration Unit S was deemed not to be significant.
The SPNHS “includes the protection of woodlands…as shown on Schedule A”. All Natural System Integration Units designated as Core Area and NAC, (i.e., Natural System
Integration Unit H, I, O, and P) are protected in the final NHS and include a 10m buffer
from the dripline.
2.4.4 Significant Wildlife Habitat
The criteria and thresholds for the identification of Significant Wildlife Habitat are
described in the Caledon-Peel Significant Woodland and Wildlife Habitat Report (June 2009). ROPA 21B explicitly states that the thresholds for determining the significance of
all types of significant wildlife habitat may need to be refined in the planning process and no policies were placed in this regard into the new ROPA. ROPA 21B and the supporting
technical reporting also recognize that local municipalities (i.e., Brampton and
Mississauga) may determine their own thresholds for the definition of significance. These criteria have not been developed specific to Brampton – these criteria and
thresholds provide helpful guidance to these determinations.
There are no seasonal concentrations of animals in the Study Area. However, the following are the more specialized habitats in the Study Area that would be defined
based upon Peel/Caledon suggested thresholds:
• Habitat for area-sensitive species of birds (both forest and open-country).
• Raptor nesting habitat – woodland habitats (suspected Cooper’s Hawk nest -
north end of Natural System Integration Unit H, 2006).
• Seeps and springs (minor spring was noted by LGL from the middle of Natural
System Integration Unit P). This was not found by the HHSWS or EIR team, and based on detailed hydrogeological studies by both teams is not expected to occur
(likely tile drain).
• Species identified as nationally Endangered or Threatened by COSEWIC which
are not protected in regulation under Ontario’s Endangered Species Act (Species identified as Special Concern based on Species at Risk in Ontario List that is
periodically updated by OMNR (Monarch Butterfly in Natural System Integration Unit O and R).
• Species whose populations appear to be experiencing substantial declines in
Ontario (Species from Ontario Breeding Bird Survey and Ontario Forest Bird Monitoring Program whose population trend show a significant decline (p<0.10)
– Natural System Integration Unit P and R).
• Species that are rare in the Region/ Town of Caledon, even though they may not
be provincially rare (Natural System Integration Unit H, P, and R).
• Species that are the subject of recovery programs (A Recovery Strategy is available for Redside Dace).

Final Environmental Implementation Report Mount Pleasant Sub-Area 51-1
September 2011
2-75
Table T1 of the Phase I HFSWS summarizes significant wildlife habitat by Natural System
Integration Unit (i.e., H, I, O, P, Q, R, S).
All of these wildlife habitats will be maintained in the NHS, with the exception of larger areas of habitat for open country birds and some viable habitat for area sensitive forest
bird species. Throughout the development of the NHS and associated community planning, it was recognized that some open country species (i.e., those that may depend
upon larger tracts of grasslands) would likely find post development conditions, even in the large and diverse NHS, unsuitable for their persistence. Similarly, some forest
nesting birds that are dependent upon more secure wooded habitat (e.g., less human
and pet intrusions) will find post-development conditions less suitable, even though habitat will not be removed. Ground nesting and near ground nesting bird species are
particularly vulnerable to predation and disturbance effects associated with urbanization.
2.4.5 Significant Habitat of Endangered and Threatened Species Redside Dace (Clinostomas elongates), an endangered species (uplisted in 2009) as
identified under Ontario’s Endangered Species Act, 2007, occurs in both Fletcher’s and Huttonville Creeks. The extent of existing regulated Redside Dace habitat is described in
Section 2.2.2.4 and depicted on Figure 2.2.4.
The regulated Redside Dace habitat (south of the CNR) is protected within the Mount
Pleasant NHS. Along this reach, there is no creek lowering or any major alterations to the creek channel, although two SWM pond outlets will be constructed and there will be
two sanitary servicing crossings – one under the Main Huttonville Creek, north of Bovaird
Drive and one under the East Huttonville Creek, located approximately 350m north of Bovaird Drive.
Regulated habitat also exists north of the CNR. The NHS design includes natural channel
design approaches intended to provide habitat for Redside Dace; culvert improvements at the CNR to remove existing fish passage constraints and provide the opportunity for
the extension movement of fish upstream; and protection of other regulated habitats
(i.e., wetlands and connected streams) in the NHS design.
On September 29, 2010, Bobolink was listed as a Threatened Species under the Endangered Species Act, 2007. Through past field studies on the Mount Pleasant Lands,
this species was observed around the racetrack pond wetlands and surrounding area.
During a site walk on June 8, 2011 with the MNR, the CVC, the City and the Block 51-1 consulting team, W9 was visited to assess potential for providing Bobolink habitat as well
as visiting an area south of the racetrack pond, where 2011 Bobolink observations (from the road) were made by the MNR and the CVC. The MNR and Savanta Inc. confirmed
that there is no Bobolink habitat present in W9; the area is too wet and floral species are
unsuitable. The cultural meadow area, south of the racetrack pond, was identified as potential suitable habitat. The MNR requested that targeted Bobolink surveys, during the
breeding season, be completed along with an assessment of potential habitat. In mid-June 2011, Savanta Inc. completed the requested surveys and submitted results to the
MNR. As of the time of submittal of this Final EIR Block 51-1, landowners and the MNR are in discussions to determine the next steps with respect to meeting the requirements
under Ontario’s Endangered Species Act (2007).

Final Environmental Implementation Report Mount Pleasant Sub-Area 51-1
September 2011
2-76
2.4.6 Areas of Natural and Scientific Interest (ANSI)
ANSIs are areas of land and water containing natural landscapes or features that have been identified as having life science or earth science values related to protection,
scientific study or education. ANSIs are evaluated and identified as either provincially or
regionally significant by the MNR.
There are no ANSI’s with the Mount Pleasant Sub-Area 51-1 lands, nor are they present within the broader of the NWB lands.
2.4.7 Environmentally Sensitive or Significant Areas
Environmentally Sensitive or Significant Areas (ESAs) are places where ecosystem functions or features warrant special protection. These may include, but are not limited
to, rare or unique plant or animal populations or habitats, plant or animal communities, or concentrations of ecological functions. ESAs are often identified by the Conservation
Authorities, according to established criteria.
The CVC identified ESAs through a much earlier initiative (Ecologistics Limited 1979).
None were identified in the Mount Pleasant lands; however, the Huttonville Valley ESA is located downstream in the Credit Valley Secondary Plan area, on the Main Huttonville
Creek.
2.5 Existing Regulatory Floodplain
The existing floodplain for the East Huttonville Creek was established in the HFSWS, Phase 1 Characterization Report (December 2007) and updated during the finalization of
the Phase 2 analyses. The HFSWS HEC-RAS model for channel hydraulics is based on
predicted channel flow from the Phase 2 HFSWS hydrologic modelling results (HSP-F) and the channel geometry/floodplain topography available at the time of HFSWS
production.
For the EIR work, more detailed Study Area topography was obtained (LiDAR and low-
flow channel survey by RPE). Based on this topographic data and surveys of road and other culvert crossings, Urbantech Consulting reviewed and updated the HFSWS existing
conditions HEC-RAS model. The return period channel flow, modelling parameters and boundary conditions in the Urbantech model were consistent with the existing conditions
HFSWS model. Table 2.5A presents Regional Storm water levels from both models at key crossing locations and through the City Park floodplain. These differences are
relatively minor and can be attributed to the updated topographic data, which included
culvert inverts, detailed low-flow channel dimensions and improved overbank/floodplain characterization. In general, the refined Urbantech model indicates that the existing
Regional Storm water surface elevations were on average less than 0.1m below the HFSWS existing Regional Storm water surface elevations. Drawing 2.5.2 presents both
the HFSWS and refined EIR existing conditions Regional Storm floodplains.

Final Environmental Implementation Report Mount Pleasant Sub-Area 51-1
September 2011
2-77
Table 2.5A Comparison of HFSWS and Urbantech (EIR) Existing Regional
Storm Flood Elevations
Urbantech
XS
HFSWS
XS
Channel
location
Urbantech Ex.
WSE
(m)
HFSWS Ex.
WSE
(m)
Difference (m)
5846 25696 Mayfield
Road 264.5 264.56 -0.06
4564 24420 Wanless Drive
255.65 255.72 -0.07
2975 22830 City Park 247.27 247.39 -0.12
2815 22641 City Park 247.06 247.06 0
2610 22455 City Park 247 246.96 0.04
2215 22081 City Park 247 246.94 0.06
1829 21687
Farm
Culvert U/S of
TCPL
245.5 245.58 -0.08
1622 21500 TCPL 244.48 244.68 -0.2
809 20677 U/S
CNR 243.94 243.94
(Same boundary
condition used at
downstream model boundary)

FINAL ENVIRONMENTAL IMPLEMENTATION REPORT MOUNT PLEASANT SUB-AREA 51-1
September 2011
3-1
3.0 NATURAL HERITAGE SYSTEM BOUNDARIES ________________________________________________________________________
3.1 Mount Pleasant Secondary Plan NHS
The Mount Pleasant Secondary Plan Land Use Schedule SP51(a), attached as
Figure 1.1.1, presents the future land uses within the Mount Pleasant Community
including the NHS, residential, commercial, mixed uses, parks, schools, places of worship, special policy areas and infrastructure.
The SPNHS is comprised of valleylands and watercourse corridors, woodlands, wetlands,
and environmental buffers, as well as restoration areas and connecting corridors. It covers an area of 97.6 ha or 19% of Sub-Area 51-1. The boundaries of the SPNHS
reflect findings of the NWB LSA and HFSWS, and reflect the principles outlined in the
"Implementation Principles for the Subwatershed Study, November 24, 2009", (Implementation Principles) attached as Appendix F to the Secondary Plan. These
Implementation Principles were agreed to by the City, the CVC, the MNR and the MPLG. They set out agreement and direction on several design requirements for the Mount
Pleasant lands, including NHS boundaries, buffers, channel relocation, lowering and
widths, NHS restoration/enhancement, trails, SWM, CFCP, drainage density, road crossing design and implementation considerations. A copy of Appendix F is provided in
Appendix A-2.
The Implementation Principles differentiate between the SPNHS and the final NHS. The SPNHS is shown in the MPSP; it also forms part of the Second Generation (2G) Land Use
Plan tested in the second round of the HFSWS, Phase 2 Impact Assessments. The
Implementation Principles note that the final NHS will be identified following the completion of Phase 2 of the SWS and will be reflected in the SWS and EIRs.
Secondary Plan policies note that the boundaries of the final NHS are to be confirmed
through the HFSWS and may be refined through the EIRs, consistent with the
Implementation Principles outlined in Appendix F (refer to Appendix A-2). Minor refinements to the boundaries of the SPNHS may be considered to reflect the differences
in scale and level of detail available through the preparation of the EIRs and FSRs. However, minor refinements shall not adversely impact the functions or result in any
significant increase or decreases in the size of the final NHS. The Secondary Plan clearly
states that lands located outside the limits of the final NHS shall be considered to be available for development, as illustrated on Schedule SP51(a) (Figure 1.1.1).
The “Working Paper”, Phase 2: Subwatershed Impact Assessment Testing of the Second Generation (2G) Land Use Plan, Mount Pleasant Community (March 2010) was prepared as part of the HFSWS by AMEC, in association with Blackport and Associates, C. Portt and Associates, Dougan and Associates and Parish Geomorphic. This Working Paper presents
the results of testing of the 2G Land Use Plan, including testing of the SPNHS design
against the HFSWS working targets. It concluded that the 2G Land Use Plan met all targets with some minor refinements. It stated that the SPNHS doubles existing natural
cover in the Study Area, by providing a connected natural features (terrestrial and aquatic) network that enhances existing core features (i.e., Terrestrial Unit Areas) and
contains newly created features. The result is a functional NHS that maximizes
community and species diversity, increases wetland and forest interior cover, supports

Final Environmental Implementation Report Mount Pleasant Sub-Area 51-1
September 2011
3-2
species at risk and benefits fish habitat functions. The SPNHS also provides a north-
south wildlife corridor connecting habitats in the Etobicoke Creek Subwatershed to the
Main Huttonville Creek system, south of Bovaird Drive.
Refinements to the 2G Land Use Plan were recommended through the completion of the HFSWS Phase 2 Impact Assessment of the 3G Land Use Plan. Results are documented in
the Phase 2: Subwatershed Impact Assessment (December 2010). This report concludes that the SPNHS reflects the protection of key existing natural features, the creation,
restoration and/or maintenance of key natural functions and linkages and the application
of features specific buffers. The recommended modifications to the SPNHS only relate to the Fletcher’s Creek stream corridors and, in particular, to increased Fletcher’s Creek
channel widths and one new channel in the northeast corner of the MPSP area. No changes were recommended to the SPNHS within the Sub-Area 51-1 lands, therefore,
the SPNHS boundary is the final NHS boundary presented in the HFSWS.
The HFSWS Phase 3, Management Strategies and Implementation Plan (January 2011) identifies the SPNHS to be:
“.., the key management strategy that has been identified to address applicable provincial, municipal and agency policies, regulations and legislative requirements with respect to natural heritage conservation and management.”
It further notes that the SPNHS:
“… has addressed all key matters identified in the updated NHRM, and also reflects the scope of subwatershed targets that were developed through stakeholder participation with the intention to conform with provincial and municipal plans and policies, as well as recommendations arising from previous applicable watershed plans and subwatershed studies as prepared by Credit Valley Conservation. The SPNHS also reflects the strategic framework for a future NHS, mandated in the Terms of Reference that was developed in Phase 1, the subwatershed study process for the integration of information and data, analysis of impacts, and the specification of a recommended natural heritage system and associated land use plan”.
As outlined in the HFSWS Phase 3 report and in Secondary Plan policies, the SPNHS is
subject to some refinement at the EIR scale. This refinement may reflect staking of environmental features, confirmation of riparian and online storage requirements, site
grading analyses, etc. The following report sections outline elements of the SPNHS, including the staked boundaries of woodlands and wetlands and recommended final NHS
boundaries. Some specific refinements to the SPNHS are presented.
3.2 Elements of the Final NHS
Elements of the SPNHS and NHS are illustrated on Schedule A to the Implementation
Principles from the MPSP and in the HFSWS Phase 3 report (June 2011). Some elements have been modified as per EIR discussions with the City, CVC and/or MNR. NHS
elements include:

Final Environmental Implementation Report Mount Pleasant Sub-Area 51-1
September 2011
3-3
• The conservation of existing features including eight woodlands and ten
wetlands.
• The relocation, lowering and natural channel design of the East Huttonville Creek
from upstream of the TransCanada/Enbridge Pipeline (TCPL) easement to Mayfield Road.
• The relocation and natural channel design of the East Huttonville Creek from the
CNR to the TCPL easement.
• The conservation and enhancement of the East Huttonville Creek Redside Dace
regulated in its existing location from Bovaird Drive to the CNR. This reach will not be subject to lowering or realignment but will be subject to the introduction of new
culverts, which will contribute to enhanced fish passage and a potential upstream
extension of improved habitat for this endangered species; one storm sewer outfall, one SWM pond outfall and two municipal services crossings.
• Four new road crossings of East Huttonville Creek (Spine Road in two locations -
Sandalwood Parkway and Buick Boulevard) for a total of eight crossings of the East
Huttonville Creek from Bovaird Drive to Mayfield Road inclusive, as well as the CNR.
• The creation of open water/marsh wetlands south of Sandalwood Parkway, west of
the realigned creek and within the ‘tooth’ area adjacent to wetlands near the City Park.
• The connection of woodlands and wetlands within the north-south orientation of the final NHS.
• The identification of potential locations for the incorporation of low impact
development (LID) measures in the NHS.
• Buffer requirements to assist in the conservation of woodland and wetland
features.
• A carefully designed trail system, within the final NHS, that respects natural features and functions and supports active transportation by connecting
neighbourhoods and residents to community destinations such as schools,
parklands and urban nodes.
• Restoration (i.e., re-introduction of historic and/or creation of new features in suitable settings) and enhancement (i.e., improving ecological functions of
existing features) opportunities in select locations in the NHS (e.g., woodlands,
wetlands, stream channel and waterfowl breeding ponds).
Each of these NHS elements relies upon EIR analyses and some further design details to finalize NHS boundaries. The EIR analyses, in support of these NHS elements, are
reported separately in subsequent report sections; however these were undertaken in an
iterative, integrated manner by the multi-disciplinary EIR study team. The inter-relationships that exist between surface water, groundwater, receiving wetlands and
watercourses, aquifers and other NHS features were identified and understood as input to the final NHS boundaries and appropriate mitigation measures. Numerous multi-
disciplinary team meetings contributed to a thorough understanding of key

Final Environmental Implementation Report Mount Pleasant Sub-Area 51-1
September 2011
3-4
physical/biological relationships as a foundation to recommendations regarding final NHS
boundaries, NHS design and mitigative measures to sustain the final NHS for the post
urbanization period.
3.3 Environmental Features Boundaries
In July 2009, the boundaries of woodlands and wetlands in Sub-Area 51-1 were staked in the field with representatives of the City, the CVC, the MNR, the Sub-Area 51-1 Owners’
Group consulting team and the surveying firm of Rady-Pentek & Edward Surveying Ltd. (RPE). This fieldwork was completed as input to the preparation of this EIR and was
provided in the fall of 2009 in draft form to the City as input to the then ongoing HFSWS.
At the request of the CVC and the MNR, the boundaries of all existing woodlands and
wetlands (forested wetlands were surveyed within 20m of dripline edge) in the Sub-Area 51-1 lands were staked and subsequently surveyed to document the location
and configuration of these features. The resulting surveyed plans prepared by RPE illustrate the staked woodland driplines and staked wetland boundaries, as determined in
the field with the Agencies on July 22nd, 24th and 27th, 2009 as well as the staked top-of-
bank sections along the East and West Huttonville Creek north of Bovaird Drive, as staked in the field with the Agencies on August 31, 2009. These plans were presented
and submitted to the City, the CVC and the MNR during a multi-stakeholder technical workshop (i.e., June 9, 2010 - EIR Workshop #1). These plans were again discussed at
a second workshop (i.e., July 14, 2010 - EIR Workshop #2) where the Agencies
endorsed these survey plans as accurate and acceptable.
The SPNHS and final NHS conserve the majority of the existing surveyed environmental features, with a few exceptions. The few features proposed for removal are the subject
of functional restoration and enhancement measures within the final NHS. The RPE drawings differentiate between the features to be retained and those to be removed.
The attached Drawings 3.3.1 to 3.3.5 illustrate the RPE surveyed boundaries on recent aerial photography, as submitted to the Agencies on June 9, 2010. These staked
boundaries provide the basis for the determination of the final NHS boundaries (Note: in some locations, appropriate buffers are to be added to the staked boundaries).
3.4 Final NHS Boundaries
The final NHS boundaries are an important structural element of the Block Plan. Preliminary final NHS boundaries were identified and integrated into the Block Plan
analyses completed by Gagnon + Law Urban Planners. This preliminary integration
relied on staked boundaries of woodlands/wetlands, plus buffers, hydrologic and hydraulic analyses, site grading plans, March 2009 restoration vignettes, refined road
alignments, East Huttonville Creek channel design, refinements to the City Park, NHS interface and the agreed-to Implementation Principles. This collection of inputs was
provided to the planners in the spring of 2010 and was reflected on the Block Plan
submitted to the City on May 3, 2010. Since that time, additional EIR work has been completed that has resulted in minor revisions to final NHS boundaries in several
locations. The Scoped EIR (August 2010) presented minor modifications to the NHS boundaries (see Figures 3.4.1A to 3.4.1E from the Scoped EIR attached in
Appendix A-4). These revisions relate to the provision of the required 5m buffer between woodlands/wetlands and the realigned channel or necessary modifications to

FINAL ENVIRONMENTAL IMPLEMENTATION REPORT MOUNT PLEASANT SUB-AREA 51-1
September 2011
3-5
road locations to respect 10m woodland buffers. These refinements are reflected in this
Final EIR and the Final Block Plan.
The basis for the final NHS boundaries varies depending upon location. Final NHS boundaries are discussed in the following report sections. This work confirmed that all
natural hazards and important environmental features and functions of the SPNHS are
contained with the final NHS design and boundaries presented herein.
3.4.1 NHS Vignettes
Three NHS Vignettes (illustrative sketches) were initially prepared in March 2009 to
depict proposed limits and conceptual design of the NHS, along with restoration and enhancement proposals for portions of the NHS extending from the existing City Park
northerly to Mayfield Road. These Vignettes represented concepts proposed to create a diverse and representative system of natural and restored areas that together would
provide a viable, functioning and sustainable natural system in an urbanizing area. The
Vignettes collectively illustrated the following concepts:
a. The establishment of woodland planting nodes in locations that would increase the size of existing forest patches thus adding to the amount of potential forest
interior habitat (targeted ELC woodland communities reflected a detailed understanding of soil type/moisture and indigenous woodland cover).
b. The largest concentration of environmental features, located in the vicinity of the existing municipal park fronting on Creditview Road, were proposed to be increased in size and restoration was planned to contribute to an increased amount of woodland and wetland habitat and watercourse functions.
c. The establishment of open water and shallow wetland systems to restore and enhance displaced wetland functions. This was proposed in close proximity to
the existing man-made racetrack ponds that would be displaced by the development of an urban node. The NHS Vignettes proposed substantial
meadow and thicket communities in proximity to open water (versus existing
farmed lands to the water’s edge at the racetrack ponds). The size, depth and vegetative character of those restored features would reflect an interest in
optimizing wildlife, and in particular, waterfowl and amphibian functions.
d. The establishment of a continuous north-south NHS linked between and around existing woodland/wetland areas with an innovative, naturalized channel. This channel was proposed between 45m to 100m wide in the East Huttonville Creek
subwatershed. Portions of the East Huttonville Creek (through the existing City Park and just south of Mayfield Road) were identified for relocation to areas
adjacent to existing woodlands.
e. The channel was illustrated to incorporate a range of terrestrial and aquatic habitat functions including amphibian breeding pools, reptile basking and hibernation areas, fish spawning, nursery and refuge habitat.
f. The channel was illustrated to have large areas proposed for woodland,
grassland and wetland restoration - those areas would contribute substantially to the ecological functions and linkages on the landscape that do not exist today.

Final Environmental Implementation Report Mount Pleasant Sub-Area 51-1
September 2011
3-6
g. The reduction in and/or removal of populations of non-native and aggressive weedy species, which currently colonize some remnant natural areas (e.g.,
common reed, European buckthorn, garlic mustard).
h. The establishment of restored cultural meadow and thicket communities in close proximity to SWM facilities to afford waterfowl nesting and foraging habitat and
amphibian foraging habitat.
i. The conservation of Redside Dace regulated habitat, as defined by the MNR along the East Huttonville Creek, south of the CNR. Habitat enhancements upstream were proposed to improve habitat for this species further upstream.
j. The improved CNR culvert installations and realigned channel upstream of the
CNR tracks were suggested to permit the general enhancement of conditions for fish passage upstream.
k. Habitat enhancements upstream were proposed to include more specialized habitat for specific aquatic functions (i.e., spawning, nursery and refuge habitats).
The three March 2009 NHS Vignettes formed part of the agreed-to Implementation
Principles in the MPSP. Copies of the March 2009 Vignettes are provided in Appendix A-2. The Implementation Principles note:
“Within the East Huttonville portion of the SPNHS, the extent of habitat enhancement and wetland creation is to be implemented as per the concepts/principles illustrated on the Landowners’ Group vignettes dated March 2009 (Schedule B attached) and includes other concepts such as natural channel design, habitat requirements for Redside Dace, etc. Implementation and additional design details will be established at the EIR stage (e.g., actual species for planting, size of plantings, phasing of development, etc.).”
As part of the Scoped EIR work, each of the three NHS Vignettes was reviewed with the City, the CVC and the MNR at EIR Workshops #1 and #2. During these discussions, the
following revisions to the NHS Vignettes were identified:
• inclusion of staked boundaries of existing environmental features;
• identification of buffers to existing staked features;
• identification of proposed trail locations;
• retention “as is” (i.e., without restoration and/or enhancement measures) of W7 (reed canary grass meadow marsh) and W9 within the agreed-to NHS
boundaries;
• some specific revisions to channel alignments to reflect the content of the
Implementation Principles;
• additional information added to fully illustrate the nature and location of various types of restoration;

Final Environmental Implementation Report Mount Pleasant Sub-Area 51-1
September 2011
3-7
• updated SWM pond location, configuration and outlets;
• revisions in channel location, NHS boundaries and restoration plans adjacent to the City Park to retain the westernmost lacrosse field; and,
• updated road crossing locations.
The three original NHS Vignettes have been updated to reflect these discussions.
Based on comments received from the City on the Scoped EIR submission, an additional Vignette was prepared for the East Huttonville Creek realignment between the CNR and
the TCPL.
The March 2009 Vignettes were landscape architect renderings, and this EIR has
confirmed the location, size, and shape of the ecological features proposed within the NHS. In the EIR, a fourth Vignette has been added, between the CNR and TCPL. As a
result the original three Vignettes have been renumbered, as follows:
• Vignette 1: Mayfield Road to Wanless Road (formerly Vignette #3);
• Vignette 2: Wanless Road to (no change);
• Vignette 3: Buick Road to TCPL (formerly Vignette #1); and,
• Vignette 4: TCPL to CNR (new).
In addition to the changes requested through the EIR workshops, the following features
are planned:
• The addition of Vignette 4 between the CNR and TCPL depicts suitable habitat
(i.e., riffle and pools, overhanging vegetation) within the 100m wide East Huttonville Creek. This in-stream channel morphology and riparian zone
vegetation will suit the habitat needs of Redside Dace should they migrate
upstream from the occupied reach downstream of the CNR.
• The creation of fish foraging habitat pools (formerly Redside Dace foraging habitat on March 2009 concepts) west of Park Woodland A and east of the
realigned creek. The change to the designation of these pools is simply due to
habitat preference – these proposed pools will not have active flow or riffle-type habitat and will tend to exhibit warm water temperatures. These conditions will
be ideally suited to the tolerant warm water species already found within the East Huttonville Creek (e.g., brook stickleback, creek chub and blacknose dace).
• The creation of off-line amphibian pools and online seasonally flooded fish habitat
pools are planned in numerous locations along the length of the new floodplain of
the East Huttonville Creek.
• The creation of simple contributing habitat swales along the side slopes of the East Huttonville Creek that connect to the creek.
The NHS boundaries for each Vignette are further discussed in the following report sections. Additional detail regarding the natural channel designs are presented in
Section 4.0 and restoration concepts are presented in Section 5.0.
FINAL ENVIRONMENTAL IMPLEMENTATION REPORT MOUNT PLEASANT SUB-AREA 51-1
September 2011
3-8
3.4.2 Bovaird Drive to CNR Final NHS Boundary
The final NHS boundary, between Bovaird Drive and the CNR, was delineated on the Block Plan topographic mapping, based upon a corridor width the “greater of” the
existing staked top-of-bank, stable top-of-bank, meander belt allowance, fisheries
setback, Regional Storm floodplain, appropriate buffers and the SPNHS width of 100m to address significant habitat of endangered species in this location. Drawing 3.4.2
presents the final NHS boundary. As illustrated, the final NHS boundary is largely dictated by:
• the 100m stream corridor width centred along the existing alignment of the East Huttonville Creek;
• the Regional Storm floodline along the Main Huttonville Creek or the required
50m width from creek centreline; and,
• the 50m width from creek centreline along the West Huttonville Creek.
The final NHS boundary contains the floodline, meander belt, fisheries setback and
defined top-of-bank in all locations. The resulting width varies from 75m to 148m. This boundary protects the regulated habitat of Redside Dace between Bovaird Drive and the
CNR.
As per HFSWS recommendations, this reach of the East Huttonville Creek will be
maintained in its existing conditions with the exception of culvert improvements at the CNR, one storm sewer outfall, one SWM pond outfall and two municipal services
crossings.
3.4.3 CNR to TCPL Final NHS Boundary
The final NHS boundaries from the CNR to the TCPL easement are formed by the 100m
wide realigned East Huttonville Creek channel. The final NHS alignment and grading are
presented on Drawings 3.4.3A and 11.1.3. A new Vignette prepared for this area is presented on Drawing 3.4.3 to illustrate NHS boundaries and restoration concepts.
Due to grading constraints introduced by the elevation of the TCPL, the invert of the
creek will not be lowered in this reach. In support of the channel design, the accurate
elevation and location of the pipeline was determined by exposing it in several locations. The resulting pipeline profile is illustrated on Drawing 11.2. Based on the review of
alternative channel alignment options, and as presented in the HFSWS, the MPSP and the Implementation Principles, the realigned channel must cross the pipeline at the location
and elevation where the existing creek crosses the pipeline. This does not allow for lowering of the creek invert. As a result, the channel depth of approximately 3.5m to
4.0m required to service the adjacent tablelands will be created largely through filling of
the adjacent lands.
Typical cross-sections through various locations along the 100m wide channel are provided on Drawing 4.6.7.1D. The final NHS boundary along the 100m wide channel
contains the floodline, meander belt, fisheries setback, natural channel design, online
Regional storage, trail system and newly created defined top-of-bank in all locations. Section 4.0 in this EIR Report provides further discussion and technical analyses of the
floodline, meander belt, natural channel design and online storage requirements.

Final Environmental Implementation Report Mount Pleasant Sub-Area 51-1
September 2011
3-9
The realigned East Huttonville Creek between TCPL and CNR (Vignette 4) is directly north
of the Redside Dace occupied habitat that occurs south of the CNR. With the input of upstream treated SWM discharge into the East Huttonville Creek at various upstream
locations, the current intermittent flow and seasonal habitat conditions are expected to improve such that the creek will provide permanent fish habitat within the NHS. Riffle
and pool features are built into the creek design here, along with vegetation communities planned (including overhanging vegetation) to provide suitable habitat for Redside Dace.
Further details on restoration design are described in Section 5.0.
The Implementation Principles acknowledge that the eastern SWM Pond HE5 can
partially be located within the outermost 30m of the 100m channel. Schedule A to the Implementation Principles illustrates the SWM Pond HE5 length of approximately 295m
within the SPNHS, immediately upstream of the CNR. Drawing 11.1.3 illustrates the
location of SWM Pond HE5, which extends 30m into the channel corridor for a length of 115m.
The existing CNR crossing will continue to serve as the outlet for the East Huttonville
Creek which drains the majority of the Sub-Area 51-1 lands. Currently, the existing
1,200mm crossing does not have capacity to convey the existing Regional Storm flow of 28 m3/sec. Due to the limited culvert capacity, relatively high embankment and flat
topography north of the CNR, a very wide floodplain results during the Regional Storm upstream of the CNR. To contain the Regional Storm floodplain within the realigned East
Huttonville Creek and improve fish passage, culvert improvements are required, in addition to site grading to raise elevations adjacent to the creek. Refer to Section 10.0
for further details.
3.4.4 TCPL to the Sandalwood Woodland Final NHS Boundary The final NHS boundaries, between the TCPL and the Sandalwood Woodland/W8, contain
several natural features. NHS widths vary from a minimum of 180m to a maximum in
excess of 700m. NHS boundaries and internal design elements are illustrated on Drawing 3.4.3A and Drawing 11.1.3 including:
• Staked Wetlands 8 and 13 boundaries and buffers - Staked boundaries from the
RPE surveys, plus 20m buffers, are delineated on the grading plan and the NHS
Vignette; these delineate the final NHS boundaries in many locations.
• Staked Park and Sandalwood Woodlands driplines and buffers - Staked boundaries from the RPE surveys, plus 10m woodland buffers, are delineated on
the grading plans and the NHS Vignette; these delineate the final NHS boundaries in some locations.
• Maintenance of Portions of Wetland 9 - The March 2009 NHS Vignette for this area proposed modification to portions of W9 to create a new open water
wetland restoration area. This new wetland, along with the proposed new open water wetland south of the new Sandalwood Parkway, were intended to mitigate
for the removal of wetland functions associated with the racetrack pond. At the
EIR Workshop #1, the MNR requested that the new open water wetland, north of Sandalwood Parkway within W9, be removed from the plans and the existing,
disturbed wetland feature be retained in its current condition. As set out on Vignette Drawing 3.4.4, this change has been completed within the agreed
upon NHS boundaries in this location.

Final Environmental Implementation Report Mount Pleasant Sub-Area 51-1
September 2011
3-10
• The future Sandalwood Parkway has been realigned where it crosses the NHS.
The proposed Sandalwood Parkway realignment is the result of an integrated
analysis of the extent and form of the NHS, land use design for the Mixed Use Node and Spine Road, road geometry and design, maintenance of existing
parkland infrastructure and development land use efficiencies. The revised alignment is illustrated on Drawings 3.4.3A and 3.4.4 and was discussed
initially in EIR Workshops #2 and #3 and further with the MNR in the spring of 2011. This alignment encroaches further into W9 than the approved alignment
presented in the Sandalwood Parkway Extension from Creditview Road to Mississauga Road Class Environmental Assessment – Environmental Study Report (ESR) completed by ENTRA Consultants and Philips Engineering in November
2010. To mitigate this encroachment, at detailed design, road design is to be reviewed to minimize grading impacts into W9 and maintain drainage from W9
into the newly created wetland south of Sandalwood Parkway. Vegetation
community edge management, including native species restoration plantings, will be implemented along the right-of-way (ROW). In addition, as agreed by the
MNR, the City and the MPLG, wetland replacement will occur elsewhere in the NHS. More specifically, the loss of 0.98 ha of W9 will be mitigated through the
construction of approximately 2.0 ha replacement wetland and associated buffers
in the area referred to as the “tooth” in the vicinity of the woodlands/wetlands (W13) to the west and south of the Creditview Park illustrated on Figure D.
Section 10.2.4.3 discusses the realigned Sandalwood Parkway in further detail.
• The “tooth” area between the City Park Woodlands – This proposed restoration
area was commonly referred to as the “tooth” area during the HFSWS and subsequent EIR workshops and meetings (defined as Area H on Schedule A of
the Implementation Principles). The Implementation Principles note that the City
and Landowners agreed to incorporate the “tooth” lands into the SPNHS and specifically state that planting or restoration in this area will not be completed by
the City or the MPLG, but may be made by others and/or allowed to occur naturally. Subsequently, as noted above, the City and the MPLG agreed to
implement wetland replacement for the loss of portions of W9 as a result of the
realigned Sandalwood Parkway. See City correspondence dated March 16, 2011, Appendix A-3). Approximately 2.0 ha of replacement wetland and associated
buffers will be constructed in the “tooth” in the vicinity of the woodlands/wetlands (W13) to the south and west of the Creditview Park.
The “tooth” area has been the subject of discussions regarding future hydrology
conditions required to sustain wetland restoration and approaches to the
construction of the replacement wetland. An Agency site visit on May 18, 2011 to the “tooth” facilitated discussion on replacement wetland design and
implementation. For further discussion, see Section 5.7.5. The City is concerned that alterations to drainage in this area may increase flooding of the existing,
adjacent sports fields and have noted that restoration should be undertaken in
consideration of a risk management framework (i.e., public health and safety, ecosystem change, and public perception of aesthetics). Wetland water balance
calculations, presented in Section 6.0 and further design work to be completed as part of detailed design, have/will address this concern through wetland
detailed design.

Final Environmental Implementation Report Mount Pleasant Sub-Area 51-1
September 2011
3-11
• Realignment and lowering of the East Huttonville Creek –The realignment of the
East Huttonville Creek was proposed through secondary planning and the HFSWS to establish a continuous north-south NHS linked between and around existing
woodland/wetland areas with a naturalized channel. This includes creek re-location and lowering from its existing location, at the pipeline crossing
northward. As confirmed through the HFSWS Phase 2 Impact Assessments, the East Huttonville Creek channel in this location is 70m in width. This channel
width contains the Regional Storm flow, provides incremental riparian storage,
online Regional Storm storage and accommodates the meander belt width allowance, 30m fisheries setback and environmental buffers. For further
discussion on channel design, refer to Section 4.0.
This reach of new channel will be located adjacent to City Woodlands A and B,
portions of W13, the City Park, Sandalwood Woodland, W8 and W9. In accordance with the Implementation Principles, the new channel block will be
located 5m from woodlands and wetlands. Drawings 3.4.3A and 3.4.4 illustrate buffers to establish final NHS limits as well as the 5m buffer from these
woodlands/wetlands to the realigned channel blocks. Drawing 4.6.7.1C and
Drawing 4.6.7.1D provide cross-sections through the channel in this location.
• Creation of a new wetland south of new Sandalwood Parkway to replicate functions of the existing racetrack ponds – The “racetrack ponds” encompass the
MNR’s Draft Huttonville Creek and Area Wetlands 10, 11, 12 and 48. Their locations are illustrated on Figure 2.0.1. These wetlands are all man-made
features created sometime after 1960 during the construction of the racetrack
and are briefly described as follows:
- W10 has a cattail mineral shallow marsh and one small open water wetland; the open water wetland was constructed as farm pond along
stream reach HV20.
- W11 is a cattail mineral shallow marsh along the north side of the
racetrack.
- W12 is also located along stream reach HV20 and is located in the middle of the racetrack; it is a small open water wetland with a cattail
mineral shallow marsh around its perimeter and pockets of mineral
marsh and meadow marsh communities to the west and east.
- W48 is a reed canary grass mineral meadow marsh located east of the racetrack and receives surface water inputs from the East Huttonville
Creek.
The hydrologic conditions for the existing features are described in Section 6.0.
The ponds are excavated into the local groundwater table and receive overland surface water runoff and tile drainage from surrounding farm areas. The water
quality in these ponds is affected by this hydrologic setting, with slightly elevated
chloride concentrations likely from road salting along Mississauga Road and nitrate concentrations from agricultural land uses (refer to Section 2.1.11).

Final Environmental Implementation Report Mount Pleasant Sub-Area 51-1
September 2011
3-12
With respect to the ecological setting, the MNR previously identified W12 as
providing waterfowl habitat. Two years of studies by the EIR consulting team determined that the pond provided local stop-over habitat for migrating
waterfowl, but did not support breeding waterfowl. Amphibian breeding habitat is present, with American toad, northern leopard frog and green frog observed.
As per the Implementation Principles, the racetrack ponds will be removed for
development of an urban node; their functions will be replaced within the final
NHS. The Vignettes that formed part of the Implementation Principles included the proposed new open water/marsh wetland concept, located south of
Sandalwood Parkway and east of the current racetrack ponds, to replicate the ecologic functions of these existing features.
In the January 2011 EIR submission, a preliminary design of the proposed new open water/marsh wetland, located south of Sandalwood Parkway and east of
the current racetrack ponds, was proposed to replicate ecologic functions of the racetrack ponds. Drawing 3.4.3 and Drawing 11.1.3 present this open water
wetland design. The January 2011 EIR noted that the proposed open
water/marsh wetland will provide enhanced ecological features, both in size and type of vegetation communities present, to increase ecological functionality. It
will have a shallow littoral zone and gently slope to upland vegetation communities to maximize potential for vegetation community types from an open
water (i.e., submerged and rooted macrophytes) to emergent (i.e., cattail/sedge) to graminoid/forb meadow marsh to upland meadow and thicket communities.
Shorebird, waterfowl and amphibian use is maximized through the presence of
these community types as well as the presence of irregular shoreline, islands, and deep pools (> 2m).
Through the review and comment process of the January 2011 EIR, including a
June 8, 2011 site visit to the location of the future open water/marsh wetland,
the MNR suggested investigating an alternative “semi-passive” wetland restoration method. Utilizing this alternate design approach, the natural
topography of the land would be maintained to the extent possible, along with berming and use of existing soils and seed bank to create a new wetland.
Based on the existing topography and engineering constraints posed by the
Sandalwood Road alignment and realigned East Huttonville Creek, an alternative
wetland restoration design to the January 2011 open water/marsh will be considered. At the July 16th EIR workshop, it was agreed among all participants
(CVC, City, MNR, Block 51-1 consultants, MPLG) that this alternative wetland design would be assessed post EIR through the detailed design process. This
alternative design will likely differ in vegetation types from that proposed in the
January 2011 EIR, in that it may not support a permanent shallow open water wetland but may support a seasonally flooded shallow marsh/meadow marsh.
Through this evaluation, it will be determined whether the “semi-passive” wetland restoration design can replicate the ecologic functions of the racetrack
ponds and whether this alternate approach is preferred by all agencies and the
landowners. Considerations to be addressed include ability to meet this design objective, engineering factors associated with the design of East Huttonville
Creek realignment and Sandalwood Parkway, flooding implications, operational/management requirements and aesthetics.

Final Environmental Implementation Report Mount Pleasant Sub-Area 51-1
September 2011
3-13
• Changes to NHS channel alignment, NHS boundaries and restoration areas–
Through the Block Plan review process, the City expressed their preference to maintain the westernmost lacrosse field within the City’s active park facilities. It
was illustrated in the MPSP, as part of the SPNHS, as an area for woodland restoration to provide a wooded linkage between the Sandalwood Parkway
Woodland and the Park Woodland A. Options to move and maintain the lacrosse field were investigated in conjunction with the review of Sandalwood Parkway
realignment. The City’s preference to maintain the lacrosse field involves
modifications to Sandalwood Parkway alignment and the NHS design west of the City Park, as illustrated on Drawings 3.4.3A and 3.4.4 and discussed in EIR
Workshops #2 and #3, including:
- Movement of Sandalwood Parkway northerly to accommodate an
appropriate road alignment to maintain the existing lacrosse field in the City Park. This realignment partially encroaches into the southern
portion of W9. See Section 10.2.4.3 for further discussion on road alignment, design and mitigative measures.
- Movement of the East Huttonville Creek westerly to maintain the lacrosse field; the eastern edge of the 70m channel block begins 3m west of the
lacrosse field and its run-out area. To accommodate this movement westerly, the channel location north of the proposed Sandalwood
Parkway and the culvert crossing of Sandalwood Parkway, requires movement further west, partially into the eastern portion of W9.
- Modifications to the shape of the created open water wetland (south of Sandalwood Parkway) intended to replace wetland functions from the
existing racetrack pond.
- Restoration of the 70m channel block with woodland species to provide
the wooded linkage between the Sandalwood Parkway Woodland and the City Park Woodlands.
These adjustments and the maintenance of the existing lacrosse field will modify
the easterly limit of the SPNHS adjacent to the field and will reduce the proposed NHS by 1.1 ha. Secondary Plan policies note that the boundaries of the final
NHS may be refined through the EIRs, consistent with the principles outlined in
the Implementation Principles. The policies further note that minor refinements to the boundaries of the SPNHS may be considered to reflect the differences in
scale and level of detail available through the preparation of the EIR and FSRs. However, minor refinements shall not adversely impact the functions or result in
any significant increase or decreases in size of the final NHS. To ensure that the
size of the final NHS is not significantly reduced, other park areas are proposed to be added to the final NHS, as set out on Drawings 3.4.3A and 3.4.4. These
areas total approximately 1.2 ha and are actively maintained lawns with some ornamental tree plantings that would be restored with native woodland canopy,
understorey and groundcover species.
During discussions at EIR Workshops #1 and #2 regarding these proposed NHS
changes, the CVC requested that the potential to add width to the NHS be investigated west of the newly created open water wetland, just south of
Sandalwood Parkway. This was reviewed by the EIR planning and environmental

Final Environmental Implementation Report Mount Pleasant Sub-Area 51-1
September 2011
3-14
team and has not been proposed, given planning concerns associated with
potential negative implications to the design of the proposed urban node located
at the intersection of Sandalwood Parkway and the new Spine Road. The southeast quadrant of this urban node is constrained in area by the location of
the Sandalwood Parkway/Spine Road intersection and the location of the SPNHS boundary. Recent planning discussions with the Peel Region Police Association
(one of few non-participating owners located to the north of Sandalwood Parkway) on the alignment of the Spine Road through their lands has resulted in
the proposal to move the Spine Road further east, closer to the NHS boundary.
This will further constrain the width of the high-density block in the southeast quadrant of the urban node. Adding width to the NHS in this location and
further constraining the high density block was deemed to be undesirable from an urban planning and design perspective.
With the proposed NHS revisions, a final NHS width of 190m is provided immediately south of Sandalwood Parkway. There is substantial support in the
technical literature for NHS widths >100m to enhance water quality (sediment, nutrient and pollutant removal) and provide for substantial wildlife habitat. NHS
widths >100m tend to support larger mammals (e.g., beavers, birds and wide-
ranging reptiles (i.e., turtles). Within the revised width, the Final NHS north and south of future Sandalwood Parkway contains a diversity of upland and wetland
habitat vegetation communities (i.e., open water wetland, interior forest, riparian wetland, upland meadow/thicket), which provides suitable feeding, breeding
and/or stop-over habitat for a wide range of birds species (shorebird, interior forest, edge specialists waterfowl, grassland, aerial insectivores). The NHS
habitats provided north and south of Sandalwood Parkway are also suitable for
use as amphibian overwintering, feeding and breeding areas; and NHS width is suitable to allow amphibian movement between these habitat types.
• Proposed Trail System - The proposed trail system, through this portion of the
final NHS, was discussed at the EIR workshops and has been reviewed with the
City in the context of open space plans for this Block Plan. Drawing 3.5 illustrates the Sub-Area 51-1 proposed trail system as presented in the
Community Design Guidelines (May 2011).
• City Park Swales - While not an issue that affects the final NHS boundaries, with
the re-location of the East Huttonville Creek from its existing location through the City Park, the City advised that restoration opportunities for the existing creek
through the Park were being investigated by City staff. As a result of this review,
the City has identified future improvements to park facilities. Further discussion on these improvements is outlined in Section 4.7.
• New Roads Crossing the NHS - Two new roads will cross the final NHS in this
location – the North-South Spine Road and the new Sandalwood Parkway. Road
alignment, design recommendations and implications to channel design are
discussed in Section 10.0.
3.4.5 Sandalwood Woodland to Wanless Drive Final NHS Boundary The final NHS boundaries from the Sandalwood Woodland to Wanless Drive contain
several NHS elements. NHS widths vary from a minimum of 70m to a maximum of 325m. Final NHS boundaries and internal design elements are provided on
Drawings 3.4.3A and 11.1.2. These include:

Final Environmental Implementation Report Mount Pleasant Sub-Area 51-1
September 2011
3-15
• Staked Wetland 7 boundaries and buffers - Staked boundaries from the RPE
surveys, plus 20m buffers, are delineated on the grading plans and the final NHS Vignette; they delineate the western boundary of the final NHS in some
locations.
• Staked Wanless Woodlands driplines and buffers - Staked boundaries from the RPE surveys, plus 10m buffers, are delineated on the grading plans and the final
NHS Vignette; they delineate final NHS boundaries in the southwestern portions
of the NHS in this location.
• Realignment and lowering of the East Huttonville Creek – As noted above, the realignment of the East Huttonville Creek was proposed through secondary
planning and the HFSWS to establish a continuous north-south NHS linked
between and around existing woodland/wetland areas with an innovative, naturalized channel. This includes creek re-location and lowering from the
Sandalwood Woodland northward to Wanless Drive. As confirmed through the HFSWS Phase 2 Impact Assessments, the East Huttonville Creek channel in this
location is 70m in width. This channel width contains the Regional Storm flow,
provides incremental riparian storage, online Regional Storm storage and accommodates the meander belt width allowance, 30m fisheries setback and
environmental buffer. For further discussion on channel design, refer to Section 4.0.
This reach of new channel will be located adjacent to Wanless Woodland B and
W7. In accordance with the Implementation Principles, the new channel block
will be located 5m from woodlands and wetlands. Drawing 3.4.3A and Vignette Drawing 3.4.5 illustrate all buffers to establish final NHS limits in this
location. This includes illustration of the 5m buffer from the Wanless Woodland and W7 to the realigned channel blocks.
As set out on Drawing 4.6.7.1B, channel cross-section 8-8 in this location illustrates that the new East Huttonville Creek channel will be only marginally
lowered below existing grades. A berm is located along the easterly edge of the existing creek channel (along the western edge of the new channel) to maintain
frequent flows to a defined area in the new channel bottom. The height of this berm can be adjusted/confirmed at detailed design with respect to the potential
desire to maintain infrequent flooding to the adjacent W7. The existing channel
will be left in place to drain the woodlands and wetlands (as occurs under existing conditions). This will maintain an additional 630m+/- drainage feature
length in the drainage system.
• 160m corridor width south of Wanless Drive – As identified in the
Implementation Principles, the corridor width just south of Wanless Drive is 160m. This includes the 70m channel in the east and a grassland restoration
area in the west.
• Maintenance of existing vegetation community in portions of Wetland 7 - The
March 2009 NHS Vignette for this area proposed modification to the two northernmost small portions of W7 to replace the existing homogeneous reed
canary grass mineral meadow marsh with new lowland forest/forested swamp vegetation communities. This was intended to extend wooded areas from the
large Wanless Woodland B northerly to Wanless Drive. At the EIR Workshop #1,

Final Environmental Implementation Report Mount Pleasant Sub-Area 51-1
September 2011
3-16
the MNR requested that the two wetland areas be left as is. This change has
been made, as illustrated on the revised Vignette, within the agreed upon SPNHS
boundaries in this location. Instead of replacing the current cultural meadows surrounding the existing reed canary grass mineral meadow marsh communities
with forest communities, upland meadow restoration is planned to increase floral biological diversity within the upland meadow and to increase grassland fauna
use between the upland and wetland meadows.
• Proposed Trail System - The proposed trail system through this portion of the
NHS is along the eastern edge of the final NHS within the realigned channel block. Drawing 3.5 illustrates the City’s preferred trail alignment; one trail
crossing of the NHS, across the small width of W7 (reed canary grass mineral meadow marsh) is proposed.
New Buick Boulevard will cross the NHS in this area. It is located along the south side of the large Wanless Woodland B, outside of the 10m buffer. Road
design recommendations are discussed in Section 10.0.
3.4.6 Wanless Drive to Mayfield Road Final NHS Boundary The final NHS boundaries from Wanless Drive to Mayfield Road contain several NHS
elements. Final NHS widths vary from a minimum of 70m to a maximum of 325m. Final NHS boundaries and internal design elements are set out on Drawing 3.4.3A and
Drawing 11.1.1. These include:
• Staked Wetland 1, 2, 3, 4 boundaries and buffers - Staked boundaries of portions
of these wetlands, as presented on the RPE surveys plus 20m buffers, are delineated on the grading plan and the final NHS Vignette; they delineate the
eastern boundary of the final NHS in some locations.
• Staked Mayfield Woodlands A and B driplines and buffers - Staked boundaries
from the RPE surveys, plus 10m buffers, are delineated on the grading plans and the final NHS Vignette; they delineate final NHS boundaries along the northeast,
central east and southwest portions of the NHS in this location.
• Realignment and lowering of the East Huttonville Creek – As previously noted,
the realignment of the East Huttonville Creek was proposed through secondary planning and the HFSWS to establish a continuous north-south NHS linked
between and around existing woodland/wetland areas with an innovative, naturalized channel. This includes creek re-location and lowering from Wanless
Drive northerly to Mayfield Road. As confirmed through the HFSWS Phase 2 Impact Assessments, the East Huttonville Creek channel in this location is 45m in
width. This channel width contains the Regional Storm flow, provides
incremental riparian storage and accommodates the meander belt width allowance, 15m fisheries setback and environmental buffer. For further
discussion on channel design, refer to Section 4.0.
This reach of new channel will be located adjacent to the Mayfield Woodlands.
In accordance with the Implementation Principles, the new channel block will be located 5m from woodlands and wetlands. Drawing 3.4.3A and Vignette
Drawing 3.4.6 illustrate all buffers to establish NHS limits in this location; this includes illustration of the 5m buffer from these woodlands/wetlands to the
realigned channel blocks.

Final Environmental Implementation Report Mount Pleasant Sub-Area 51-1
September 2011
3-17
The Implementation Principles identified that the channel through Mayfield
Woodland A and portions of W4 is to be filled in and restored with wetland vegetation. This requires that the channel be realigned around Mayfield
Woodland A. The Implementation Principles also noted that the realignment around Mayfield Woodland A is to match the existing channel location at either
the west edge of these woods where an existing creek exists, or south of Mayfield Woodland A. The specific location was to be determined through the
EIR. Based on the grading analysis completed as part of this EIR, the realigned
channel must extend around the western side of Mayfield Woodland A as illustrated on Drawings 3.4.3A and 11.1.1. This realigns the channel through
the existing agricultural area between the two Mayfield Woodlands. In this specific location, the distance between the two woodlands varies between 30m
and 50m. As presented on channel cross-section 4-4 on Drawing 4.6.7.1A, a
modified channel cross-section is required in this location.
• Proposed Trail System - The proposed trail system, through this portion of the NHS, is along the western edge of the realigned channel block. Drawing 3.5
illustrates the City’s preferred trail alignment as presented in the Community Design Guidelines (2010). An east-west trail location crosses Mayfield Woodland A; its location as shown was field staked in June 2010. Its alignment is outside
both W1 and W2 and their associated 20m buffers.
3.5 Future Regulated Redside Dace Habitat
Existing regulated Redside Dace habitat is defined in Ontario Regulation 293/11. Section
2.2.2.4 of this EIR provides a discussion of the application of definitions from this regulation to the Sub-Area 51-1 lands to identify where existing habitat is considered to
be regulated Redside Dace habitat.
As noted in previous sections, the proposed NHS design upstream of the CNR is intended to improve habitat for Redside Dace. Following completion of the NHS, the areas defined
as existing regulated habitat will remain, albeit in an improved condition and in some
cases in altered locations. Figure 3.5.1 illustrates the location of regulated Redside Dace habitat in the future NHS.
3.6 Green System Trail
The City has a long history in the strategic planning and implementation of pathways and
trails throughout the municipality. In 2002, their Pathways Master Plan was prepared which reinforced the objectives of the municipality to establish a connected open space
system utilizing the many parks and valleys to create convenient pedestrian and cycling routes across the City. The Master Plan routing plan was amended in 2006 in
consideration for supplementary routing and incorporating more completely, the City’s
road network. Recent work has focused on the development of a draft Pathways Hierarchy in response to environmental and maintenance concerns. Inter-municipal trail
connections, the role of the Region of Peel in ‘active transportation’, communications work and expansion of wayfinding through a new signage program, are all examples of
contributory efforts that support the Pathways Plan.

Final Environmental Implementation Report Mount Pleasant Sub-Area 51-1
September 2011
3-18
The City seeks to promote walkable communities in the development of all new block
plans. Off-road multi-purpose trails and on-road bike routes are critical to the creation of
walkable communities. A well-planned and integrated trail system reduces the dependencies residents have on their automobile. It benefits school boards by reducing
the number of students necessitating bus transportation, thereby reducing the number of buses on the road each day. A secondary but equally beneficial outcome from the
creation of a complete trails network through the natural areas of a block plan is the reduction in the frequency of random trails created by users. Clearly defined trails tend
to focus users down a defined path and reduce the tendency to create multiple trails in
other less desirable areas through natural heritage systems.
This approach to planning an integrated open space network complete with a trail system, is supported by Brampton’s Strategic Plan, the “Six Pillars”, which states that:
“Brampton strives to be an effective partner in environmental stewardship to ensure our natural resources are conserved for future generations and as such, Brampton follows best practices in an ecosystem approach to land use planning so that new development protects, and is sensitively integrated with, the natural environment whenever practical”.
The City works to provide well planned and accessible trail systems for residents.
Similar to many other municipalities, trails are recognized by the City as an integral
component in the development of communities and offers benefits for residents, such as the following:
• Provides people with the opportunity to observe, experience and appreciate the
City’s diverse plant and animal habitats, such as a connected system of wetlands, meadows and forests;
• When trails are located properly, use of the trail reaffirms a sense of connection
with the natural environment and provides opportunities for an appreciation of
natural heritage that some might not otherwise have the opportunity to enjoy,
without the use of a car to travel to other natural areas outside of the City;
• Trails provide an opportunity for affordable, inexpensive year round activity such
as walking, jogging, hiking and cycling, which are recreational pursuits that all age groups can enjoy. This provides general public health benefits for residents,
which is strongly encouraged and supported by the City and the Peel Health Department;
• Trails provide opportunities for alternative sustainable modes of transportation in
a safe and attractive manner, by providing connections between residences, parks, schools, workspaces, shopping and other services. This also provides
more efficient routes for commuting by bicycle or foot, thus providing potential economic benefits such as reducing reliance on the personal vehicle;
• Trails not only play an important role in supporting environmental education and
building a public commitment to environmental conservation, but they also connect communities to their environment, which adds value to a community as
an attractive and desirable place to live. These personal experiences gained through the use of trails add to stewardship practices, which benefit the
community and the environment in the long run; and,

Final Environmental Implementation Report Mount Pleasant Sub-Area 51-1
September 2011
3-19
• Trails provide for managed public access to the NHS and help minimize impacts that would otherwise result from unmanaged public access, particularly in a very
intensive urban environment.
The City’s trail system is an important community design element to be integrated with
the NHS in appropriate locations. The HFSWS Phase 3 report identifies trails as one component of NHS design and notes that a pedestrian trail may be located in the NHS’
corridors. It recommends that, in general, trails be placed within the NHS buffers, along one side of the corridor and not placed in the vicinity of the NHS features, such as
habitats that support interior conditions or wetland features. It further notes that trail
layout should reflect a careful analysis of key NHS areas as well as desirable activity nodes. Consideration should be given to signage, screen plantings and placement of
deterrent shrubs or rock piles to ‘direct’ trail users away from key NHS features.
The MPSP Implementation Principles note that trails will be accommodated in appropriate
areas in the SPNHS and that their location will be confirmed through the EIR analyses and recommendations.
This EIR assessment of trail locations has been co-ordinated with the completion of the
Mount Pleasant Block 51-1 Community Design Guidelines (CDG, May 2011). The CDG address a number of urban design matters, including trails and pathway network, views
and viewsheds, gateways, neighbourhood parks and SWM ponds. Landscape guidelines
are provided for each of these design elements. The CDG notes that walkable, cycle friendly, pedestrian scaled neighbourhoods are to be linked with trail and pathways
integrated into the open space system and road network. These will enable safe and accessible recreation and commuter options that allow the user to access the variety of
land uses to be found within the Block without the need to drive. It further notes that
the proposed trails and pathways will be appropriately located and designed to respect significant hazards or sensitive features and functions.
With respect to the trail and path network, the CDG identify several broad objectives to
the planning and siting of the trails and pathways. It identifies that trail and pathway networks should:
• provide pedestrian linkages that facilitate the continuity of the City and
Community-wide Pathway Network, enhance the continuity of the City’s Open Space System, and provide access to recreational opportunities within each
neighbourhood;
• provide potential linkages to the main existing network of trails found in the City
(Etobicoke Creek Trail, Chinguacousy Trail, Professor’s Lake Trail) and the local
trail system;
• connect to key destinations such as the Credit River Valley, Cassie Campbell
Community Centre, the Mount Pleasant GO Station and Downtown Brampton; and,
• mitigate potential impacts to the designated NHS as the primary criterion for proposed trail locations.

Final Environmental Implementation Report Mount Pleasant Sub-Area 51-1
September 2011
3-20
These broad objectives are supplemented by HFSWS recommendations to:
• locate trails on one side of the NHS corridor only;
• generally locate trails away from sensitive habitats, such as interior conditions
and wetlands; and,
• incorporate signage and/or vegetation plantings to deter unwanted usage off
trails.
3.6.1 Location of the Green System Trail within the NHS
The Green System Trail within the NHS is planned as part of a continuous municipal trail system that will eventually link this new community to existing areas in Brampton and
ultimately to Mississauga to the south, Caledon to the north, and Halton to the west. This is just one of many north/south trail systems that the City has developed for residents.
Significant time and effort has gone into planning the trail to ensure that this system is
integrated with the features and functions of the existing and proposed natural environment, the community’s transportation infrastructure, and surrounding land uses.
Many of the changes that will be reflected in an updated City Pathways Hierarchy and trail design guidelines were developed in conjunction with the review and approval of the
CDG document.
Several alternatives for the Green System Trail were evaluated during the preparation of
the EIR. Changes made to advance the trail system, including the location of a primary path along the East Huttonville Creek corridor and the corridor crossing locations, were
based on many factors such as changes to the design of the NHS, requirements for access and maintenance, and environmental comments received from stakeholders such
as the CVC and City staff, as the block plan evolved. Some examples of this are as
follows:
• Initial concepts showed the trail located on the east side of the large woodlot
north of Wanless Drive, known as Mayfield Woodland A. However, after further evaluation, the trail was relocated to the west side of that community to reduce
the impact on the woodlot and NHS; and,
• In the summer of 2010, alternative trail concepts were prepared that indicated
several trails in the area near Park Woodland B and the City Park. However upon
further evaluation, the number of trails in that area were reduced, lessening the overall length of trail in the NHS. These concepts also proposed several
crossings of the NHS, generally west of the City Park. After further evaluation, the number of crossings were reduced to just one, to lessen the impact on the
NHS.
The proposed trail alignment through the NHS, referred to as the Green System Trail, is
illustrated on Figure 3.1.4a of the CDG and presented on Drawing 3.5. The Green System Trail is part of the Mount Pleasant Community Trails plan, which includes a
multi-use recreation path, the Spine Road (on-street bike lane), and the Signed Bike Route. As illustrated, the Green System Trail will be located along the eastern edge of
the NHS, from its southernmost point to Wanless Drive, transitioning to the west side of
the NHS between Wanless Drive and Mayfield Road, with linkages that cross the NHS at strategic intervals.

Final Environmental Implementation Report Mount Pleasant Sub-Area 51-1
September 2011
3-21
The majority of the Green System Trail is located along the top-of-bank of the newly re-
aligned East Huttonville Creek channel and not adjacent to existing natural features.
Within the City Park (Vignette 3), the trail moves eastward from the top-of-bank of the realigned channel and southward into a planned forest community along the western
edge of the City Park’s playing fields. The trail then continues southward over the TCPL and moves west-southwest generally following the 5 year floodline within the “tooth”
area. At the southern boundary of the “tooth”, the trail moves eastward and terminates at a vista block at the southern portion of Sub-Area 51-1.
The proposed trail has been assessed, through this EIR, to assist in determining its alignment across appropriate NHS locations. Consultation with the City has also provided
input to the desired Green System Trail relative to connections to other trail components through the community.
3.6.2 Trail Design Elements
Trail design elements proposed by the CDG gave consideration to the ecological features present within the NHS and include the following components:
• preference for permeable screenings instead of past standard use of asphalt or
concrete, suitable for anticipated use and setting characteristics;
• consideration of change from standard practice of locating trails within
valleylands to locating trail within tablelands;
• consider no winter maintenance of trails (i.e., no use of salt, sand, or plowing) to
protect adjacent NHS;
• consideration of change from standard practice of pedestrian lighting along park
paths and at trail entrances to the City’s new practice of no lighting;
• placement of entry markers at trailhead locations;
• educational signage on ecological features present, which also encourage users
to remain on path;
• locate waste receptacles at accessible key points along trails; and,
• examine use of inconspicuous low page wire fencing to keep pets on trail.
The EIR supports the consideration/use of the above trail design elements to
mitigate/minimize impacts on natural features and offers the following additional recommendations that must be considered in light of public safety considerations:
• planting of low/no maintenance native vegetation along either side of the trail
and planting of thorny and dense vegetation (i.e., rose, hawthorn, grape,
shrubs) to discourage users, including their pets, from entering into the interior
of the NHS;
• use of permeable surface materials with appropriately sized and placed
corrugated steel pipes where trails are within wetlands (i.e., W7c and W13b);

Final Environmental Implementation Report Mount Pleasant Sub-Area 51-1
September 2011
3-22
• signage for trails within wetlands (i.e., W7c and W13b) denoting trail closure
dates during spring and fall rains; and,
• placement of page wire fencing along either side of the west-east trail in
Mayfield Woodland A and between the trail and Woodland B. to discourage pedestrians and their pets from using internal portions of the NHS.
3.6.3 Impact Assessment of Green System Trail on the NHS
This EIR has evaluated the potential impact of the proposed Green System Trail on the NHS key features and functions (i.e., wetlands, interior forest). Expected pedestrian
movement patterns have been considered in the CDG to ensure that there are trails linking key locations (i.e., schools, retail/services, public transit); otherwise pedestrians
may make their own series of trails within the NHS, which may have undesirable impacts on the ecological features and functions present.
Generally, the Green System Trail is located on the outer edge of the NHS, outside of sensitive ecological features and functions. The proposed trail location is independent of
locations proposed for wetland mitigation measures. Where the trail is proposed through
ecological features; it is to serve an important linkage function (such as, connecting the
City Park with Mount Pleasant Go Train Station). Where there are essential pedestrian crossings through the NHS, special trail design considerations will be required to
minimize impacts on features (i.e., wetlands and interior forest habitat), including
assessing the need for signage, surface materials, planting measures to deter pedestrians from leaving the trail, visual barriers (i.e., split rail fence), and absence of
trail lighting.
As indicated on Drawing 3.5, the majority of the trail is located in the NHS channel top-
of-bank buffer. In these circumstances, the City requires a 3m setback from rear lot lines to a trail. This generally leaves 9m from the top-of-bank to rear lot lines for
accommodation of a 3m meandering trail. The 3m trail should be setback at least 1m from the top-of-bank. It is recommended that consideration be given to the planting of
native shrubs, along with the hydroseeding, to discourage users from going off-trail. Varied sloping of 3:1 and 4:1 (H:V) will be utilized along the channel corridor. Areas for
use of 3:1 sloping should be assessed at detailed design with the intent to increase the
width of the ‘flat’ area on the opposite side of the corridor where the Green System Trail will be located. This would provide the opportunity to set the trail back from top-of-
bank further than 1m.
There are six locations where the Green System Trail is located within existing ecological
features in the NHS. Their locations, an assessment of potential impacts on features and functions, and proposed trail design considerations to mitigate impacts, are described
below:
1) South of Mayfield Road, there is a west-east trail through Mayfield Woodland A,
along the natural ridge between W1 and W2, to make an essential connection between an Elementary School on the west with a Park on the east. The trail, as
shown on Vignette 1, was ground-truthed by Savanta Inc. and surveyed by RPE. It follows a natural ridge, >30m from the edges of W1 and W2; as well it is
located along openings in the canopy to minimize tree removal.

Final Environmental Implementation Report Mount Pleasant Sub-Area 51-1
September 2011
3-23
It is recommended that permeable screenings and no lighting (e.g., wood chips)
be considered at detailed design as well as the installation of a page wire fence
along either edge of the trail, accompanied by ecological signage describing features of natural area to encourage users and their pets to remain on the trail.
2) South of Mayfield Road, the Green System Trail follows the western edge of
Mayfield Woodland B to Wanless Drive. In the January 2011 EIR, the trail followed the realigned channel between Mayfield Woodland A and B. Through
EIR workshop discussions with the City and the CVC, this trail was relocated to
the west end of Mayfield Woodland B to keep pedestrian traffic outside of a future interior forest habitat community. This trail will be located in the 10m
woodland buffer. The trail will stay out of a 3m width adjacent to rear lot lines and will be located within a 7m width adjacent to the woodland. While located
within the woodland buffer, this alternate location is preferred since it eliminates
a trail through the channel between Mayfield Woodland A and B.
3) South of Wanless Drive, an essential west-east Green System Trail pedestrian corridor across the NHS is planned, connecting a vest pocket park to the west
with a vista block and nearby parkette to the east. This west-east trail has been
located along the narrowest width of a reed-canary grass mineral meadow marsh community (W7c). The existing flow paths within W7c have been GPS’d and trail
placement is outside of these areas. Trail design should consider the need/use for corrugated steel pipes underneath the path to maintain spring flooding
conditions and pedestrian access; and/or signage noting that trail closures will be in effect during spring flooding.
4) South of Sandalwood Parkway, where the NHS and the existing City Park drainage feature is located, the Green System Trail is illustrated inside the NHS
within the planned forest and within the 20m buffer of W13. Interior forest habitat is located to the south. At detailed design, this trail placement will be
finalized, with the intention of relocating it between the new planned forest edge
and the City Park fields. Final trail location in this area is also dependent on the potential removal of the existing ditch on the eastern edge of City Woodland A
and overall wetland restoration design for City Woodland A and C and the “tooth”, also to be determined at detailed design.
5) South of the TCPL, the Green System Trail is required to connect the City Park to
the Mount Pleasant Go Train Station. Without an official trail between these
major attractions, it is expected that NHS users will create their own trail(s) through the “tooth” restoration area, which would provide a greater overall
negative impact on the feature than a planned trail through this future wetland/forest area. Through the “tooth”, the trail generally follows the 5 year
floodline along the western edge of the “tooth”. The “tooth” east of the 5 year
floodline is a future wetland restoration area. In the January 2011 EIR, the Green System Trail was illustrated along the western edge of Park Woodland C.
Based on a site visit and discussions with the CVC, the MNR and the City, it was agreed that the trail would be relocated to the west to a location generally at or
above the 5 year storm floodline. At the northwest corner of Park Woodland C,
shrub/tree plantings are planned to remove any views between the City Park and the Mount Pleasant GO Train Station to the south in efforts to prevent trail users
from creating their own trails. Temporary page wire fencing should be considered to prevent trail users from going off trail and into the wetland and
upland “tooth restoration area”. The design of the Green System Trail is linked

Final Environmental Implementation Report Mount Pleasant Sub-Area 51-1
September 2011
3-24
with the design of the wetland restoration within the “tooth”, Park Woodland A
and Park Woodland C. Trail design and wetland restoration will also need to
consider future twinning of the TCPL, which may occur as early as 2012.
6) The west-east TCPL trail crosses wetland and interior forest habitat. Discussions are required with the TCPL regarding suitable trail design (i.e., screenings vs.
impermeable surfaces, need for culverts, etc.) noting that maintenance and repair access to the underground pipeline is necessary.

Final Environmental Implementation Report Mount Pleasant Sub-Area 51-1
September 2011
4-1
4.0 NATURAL CHANNEL DESIGN
4.1 Introduction A key element of the NHS design is the realignment and lowering of the East Huttonville Creek from the CNR upstream to Mayfield Road. The SPNHS, HFSWS Phase 2 and 3 recommendations, the CFCP findings and the NHS Vignettes present the channel realignment and design conceptually. The intent of the new East Huttonville Creek is to provide significant functional improvements over the existing ephemeral and intermittent drainage network and to link existing fragmented natural features to create a strengthened, connected NHS. The entire East Huttonville Creek corridor from Mayfield Road to the CNR will be reconstructed in a naturalized watercourse corridor ranging in width from a minimum of 45m to a maximum of 100m. At present, the riparian corridor associated with the creek channel is generally relegated to a thin band of reed canary grass in cultivated and cropped areas, although some wider zones are associated with woodland edges and fallow fields. The new riparian corridor will be restored with native species consistent with local vegetation communities, including a diversity of wooded riparian areas and open meadow habitats as depicted within the vignettes presented at the various EIR Workshops. The conceptual landscape design and vegetation community types have been discussed with NAK Design and are presented within the Vignettes, (see Section 5.0). Further details (i.e., landscape design planting plan) will be formulated at the subsequent detailed design stage. The restored stream channel and establishment of a wider riparian zone and supporting corridor will connect and strengthen the Mount Pleasant NHS in comparison to what exists today. The creation of the NHS is facilitated by linking existing ecological islands of isolated habitat utilizing the realigned and restored watercourses/aquatic systems as the spine of the corridor. The channel design has involved considerable integration amongst the Mount Pleasant consulting team who has endeavored to incorporate design recommendations from the HFSWS, CFCP and discussions with key Agency staff during EIR Workshops and field visits. This section provides the technical rationale and preliminary design parameters that have guided the development of a stable and functional channel corridor, as well as presenting an overview of the various aquatic habitat components that will ultimately create a functional stream corridor that will provide a net gain in fish productive capacity. In June and August 2011, focused natural channel design meetings were held with the City, the CVC and the MNR to discuss channel design objectives and parameters. The outcome of these meetings is discussed in this EIR; however, it was agreed that specific details and channel metrics are to be addressed through detailed design. Text in this EIR reflects these recent discussions; however, EIR drawings have not been modified at this time as this will be completed through detailed design. Detailed channel design and a design brief are presently being prepared and will be available for Agency review in the fall of 2011. Hence, some of the specific details regarding the channel metrics and the design drawings are contained in this section, are utilized from the previous EIR submission, and are referred to herein as “preliminary”; they will be modified, as required, in the subsequent channel design brief.

Final Environmental Implementation Report Mount Pleasant Sub-Area 51-1
September 2011
4-2
4.2 HFSWS Phase 3 Stream Management Strategy
The HFSWS Phase 3 report documents the proposed HFSWS Stream Management Strategy including:
• discussion on management of high and medium constraint streams; • rehabilitation measures to improve fluvial geomorphology and habitat conditions; • maintenance of drainage density; • establishment of appropriate sediment regime; • maintenance of habitats dependent on coarse substrates; • corridor sizing; • channel design for low flows and high flows; • on-line Regional Storm storage; • integration of road crossings/trails within corridors, • corridor vegetation strategies; • consideration of specialized habitat needs (e.g., Redside Dace); and, • implications to terrestrial features and functions.
Each of these Phase 3 recommendations, findings of the CFCP and EIR Agency discussions have been considered and will be addressed in the detailed channel design that is presently being completed. This includes consideration of design principles and metrics that were presented and discussed during the natural channel design meeting held on August 16, 2011. As can be seen from the above listing of design elements/recommendations, there are many facets to the channel design. The basis for the channel design, including grading, configuration, capacities and fish habitat elements, are discussed in the following sections. Other channel restoration design discussions are provided in Section 5.0. Road crossings and trail design are addressed in Sections 10.0 and 3.5, respectively.
The HFSWS Phase 3 report identifies the stream management strategy on a reach-by-reach basis as outlined in Table 2.13 from the HFSWS Phase 3 report (June 2011), reproduced below. This strategy has been implemented in the MPSP and this EIR to provide input to the channel block alignments and widths illustrated on the Block Plan. All stream reaches noted to remain open are incorporated into the NHS design as open, restored channels. All ‘other tributaries’ noted are eliminated. Drainage density calculations that address these lost swales are presented in Section 8.0.

Final Environmental Implementation Report Mount Pleasant Sub-Area 51-1
September 2011
4-3
Application of Watercourse Management Strategy on a Reach-Basis*
Description Reaches Net
Rating
Proposed
Management Strategy
Existing
Length (km)
Post-
Development Length (km)
East Huttonville Creek downstream of CN Railway
HV2, HV3, HV18, HV19c
High Reaches to be retained or enhanced along existing alignment as part of the East Huttonville Creek stream corridor.
1.07
1.07
Main creek upstream of CN Railway
HV19a, HV22 (d/s), HV24 (u/s), HV25, HV26, HV29
Medium Reaches to remain as open watercourse as part of the East Huttonville Creek stream corridor with potential for rehabilitation.
5.03
5.13 0.75
Creditview Park
HV22*(u/s), HV24* (d/s)
Medium Reach to be retained along existing alignment through parkland with potential for rehabilitation.
Tributaries
HV23 Medium Reach to remain as open watercourse with potential for rehabilitation.
0.27 0.27
Other Tributaries
HV19b, HV20, HV21, HV23b, HV27, HV28, unlabelled reaches
Low Reaches may be eliminated. However, where this in the case, creation of new swales will be required to ensure drainage density targets are met.
8.02
9.25
Total 14.38 16.47
• Source: HFSWS Phase 3 Report, Table 2.13 (June 2011)
* These portions of HV22 and HV24 are not a part of the formal NHS.
4.3 General Design Principles The options for the channel design had been considered from the earliest stages of the HFSWS, when the notion of creek realignment and channel lowering were considered essential to the community design and to facilitate the servicing of these Mount Pleasant lands. The ultimate design will need to satisfy a variety of technical requirements outlined in the HFSWS Phase 3 report and CFCP and address design parameters/metrics that are specific to the creation of natural channel design intended to provide habitat conditions for Redside Dace. The rationale of the proposed design is to provide for a creek morphology which is sensitive to the principles of fluvial geomorphology, while providing for fish habitat requirements in a reconstructed channel, address flood/erosion hazard issues and functionally integrate channel realignment with the NHS and development design. Based on the review of the HFSWS Phases 2 and 3 reports, as well as the CFCP and Agency discussions, design principles for a reconstructed channel have been established for its design, including the following:

Final Environmental Implementation Report Mount Pleasant Sub-Area 51-1
September 2011
4-4
• Create a stream channel which will be stable and functional at low-flows (as the system becomes intermittent during periods of low precipitation) as well as during higher flood flow conditions.
• Where appropriate, transition from a headwater drainage feature/swale system
in upstream areas to a more formal fluvial channel system in the downstream reaches.
• Provide channel inverts, as required, to service the adjacent tablelands.
• Design channel depths to provide for channel/floodplain connections over the
length of the channel – this link between the low-flow channel and the floodplain will assist to feed floodplain pool and side-channel features that are being designed.
• Incorporate meander belt width, erosion and fisheries setbacks and
environmental buffers into the stream corridor design.
• Incorporate a diversity of aquatic habitat components within the low-flow channel, riparian zone and adjacent floodplain to re-establish a functional connection between these areas of fish habitat. The channel design should include both instream aquatic habitat structure as well as the creation of seasonally-connected side channels and pools within the floodplain. The designs should address the potential for Redside Dace to expand their range from downstream of the CNR to the newly created upstream channel north to the TCPL and possibly beyond.
In this regard, the channel will incorporate various channel metrics that are suitable for Redside Dace habitat. These include the use of bioengineering, riparian plantings and meeting other Redside Dace criteria (such as desired sinuosity, width/depth ratios, riffle gradients, substrate materials) which will be detailed in the final design
• Transition/co-ordinate/integrate channel grading with adjacent woodlands and
wetlands.
• Incorporate and take advantage of anticipated flow increases from treated SWM discharges – as flow volumes increase in a downstream progression, the channel morphology can become more diverse with the inclusion of riffles/pools and runs.
• Accommodate Regional Storm flows, online storage and riparian storage.
• Incorporate trails, where appropriate, in accordance with the Community Design
Guidelines.
• Integrate road crossings.
• Restore the corridors within the NHS to grasslands or wooded communities in accordance with restoration concepts presented in the East Huttonville Creek Vignettes and natural cover targets from the HFSWS. These restoration initiatives will provide a diversity of upland terrestrial habitat, as well as seasonally inundated bottomland within the floodplain riparian zones.

Final Environmental Implementation Report Mount Pleasant Sub-Area 51-1
September 2011
4-5
4.4 Agency Discussions and Site Tour
4.4.1 Site Tour The approach to channel design was discussed during several of the EIR Workshops. As recommended in the July 2010 EIR Workshop, a site visit occurred on September 9th, 2010, with select staff from the CVC, the City, Dougan and Associates, Savanta Inc. and JTB Environmental. The purpose of the site visit was to examine the success of past channel restoration initiatives and to utilize this information to maximize success of the Mount Pleasant NHS. The sites visited included Springbrook Creek and Tributary 8B, within the lands south of Bovaird Drive and sites on Fletcher’s Creek, north of Bovaird Drive. In total, five sites were visited. The key points arising from this site visit were the following:
• Alternative design approaches presented in the channels in each of the five sites were discussed. It was agreed that there is a desire to maintain a wet footprint as wide across the floodplain of the upper reaches as possible, through the use of surface berms and subsurface berms (subsurface berms were used on Springbrook Creek because of the proximity of the shale bedrock elevation; they are not required in the East Huttonville Creek design as shale is not intercepted), which will hold back water from storm/melt events for a longer period of time than would occur if they were not in place. However, it is acknowledged that the volumes of water available in the upper reaches (primarily from Mayfield Road downstream to Wanless Drive), will be limited.
• There is a desire to have a diversity of habitat features on the floodplains of the
corridor, including connected and disconnected pools and undercut banks.
• Pools on the floodplain should be sufficiently large to remain functional over time as vegetation encroaches into the pool area under dry conditions; this may require boulders on the upgradient end to provide for some scour under high flow events.
• As a result of the aggressiveness of some vegetation (reed canary grass and
cattails), a tighter planting plan should be utilized to limit the opportunity for these less desirable species from getting a foothold.
• Diversity in plantings should be high, with a good mixture of woody species in
the overall plan and closer to the low flow channel. These woody species may need to be set upon ‘benches’ on the floodplain to ensure their long-term success.
• Plantings could incorporate the nodal concept rather than a general application
of the same mixture through the corridor.
• Connections from the upland areas to the low flow should be maintained, if possible in some manner, to ensure that existing energy patterns are replicated in the final product.
• Side-slopes for the corridor should be as variable as possible, with some flatter
and some steeper areas to provide for diversity. In addition, extending some

Final Environmental Implementation Report Mount Pleasant Sub-Area 51-1
September 2011
4-6
slopes to the low flow will allow for backwater areas (much like the berm situation).
• Riffle structures lower down the channel (where they can be maintained by flow)
should be designed so they are not covered in with silt and vegetation, which will require steepening of the riffles at the crest.
Based upon the foregoing, the intention of the design is to provide for a series of diverse wet floodplain complexes from Mayfield Road south through the woodlot, extending to the proposed crossing at Buick Boulevard to function similar to a headwater feature. At that point, the design will transition from a floodplain complex to a channel complex, which will be fully developed downstream of the Sandalwood Parkway crossing. The lower reaches will be reflective of a riverine environment, which will permit a broader range of channel morphology including riffle/pool/run sequences. These changes to a more riffle/pool sequence and a coarser substrate will provide diversity of form and function and necessary habitat features for Redside Dace (for instance, spawning riffles as opposed to runs with no spawning substrate). Discussions with staff from the CVC, the MNR and the DFO at the July 2010 EIR Workshop centered around the long-term stability of the low-flow channel, in addition to the overall functioning with respect to sediment and nutrient delivery to downstream reaches. The design reflects these desires and as such, it is realized that there may be some minor channel shifting of the low flow channel within the corridor while the creek adjusts to its flow regime and the success of plantings on the floodplain. 4.4.2 Natural Channel Design Workshop – August 16, 2011 On this date, a multi-Agency meeting was held to discuss technical issues associated with the natural channel design works for the East Huttonville Creek and Fletcher’s Creek systems. The workshop was led by Mr. Mark Heaton of the Aurora District, MNR and attendees included staff from the MNR Species at Risk Branch, the CVC and the DFO, members of the Mount Pleasant Landowner Group and their consulting team, as well as other fluvial geomorphology experts with experience in channel design in Redside Dace habitat. Meeting notes are provided in Appendix A-3. The MNR and the CVC presented examples of past reconstruction works in watercourses in Markham (Exhibition Creek) and Brampton (Timberbank channel) and discussed the types of habitat elements that are desirable in a reconstructed channel not only for Redside Dace, but other fish species. The opportunity to re-establish a sinuous stream channel in an agricultural stream that has been straightened in the past was identified as an important design objective. A variety of Redside Dace metrics of streams containing Redside Dace were presented by the MNR for consideration based on data compiled by Parish Geomorphic. Detailed design of the channel will strive to meet design criteria for Redside Dace habitat as understood from a variety of sources, including the 2008 Parish Geomorphic/MNR Geomorphology Report, the 2011 MNR Redside Dace Ontario Recovery Strategies Series Report and the 2007 COSEWIC Assessment and Update Status on the Redside Dace Report. If/where criteria cannot be met, an explanation will be provided outlining in detail the rationale for parameter selection. Within Sub-Area 51-1, sinuosity will be maximized within the limits of the NHS and within the bounds of a dynamically stable system.

Final Environmental Implementation Report Mount Pleasant Sub-Area 51-1
September 2011
4-7
The following design metrics were identified as important to channel design:
• Channel sinuosity; • Channel width/depth ratios; • Average pool bottom to riffle top gradient; • Woody debris should be present in pools; • Bioengineering approaches should be used in vegetating the streambanks and
riparian zones; • Shrub/meadow vegetation communities should comprise the riparian buffers;
and, • Appropriate substrates sizing.
4.5 Channel Alignment, Lowering and Width Section 3.0 presents the boundaries of the NHS, including Vignettes illustrating realigned channel locations. The proposed channel alignment is consistent with the alignment presented in the MPSP and its appended Implementation Principles and the HFSWS. The East Huttonville Creek requires lowering in some locations to provide the adequate storm sewer servicing depths to avoid the need for excessive fill and/or excessive lengths of foundation drain collector. The HFSWS Phase 2 analyses assessed the impact of the proposed watercourse lowering and realignment and determined that the water table elevation, recharge and groundwater discharge targets may be met with the application of the recommended LID practices (as further discussed in Section 9.10).
Drawing 4.5 presents the existing creek invert profile and the lowered channel profile. Portions of the East Huttonville Creek will be realigned and portions will be realigned and lowered, as follows:
• watercourse lowering and realignment begins at the pipeline easement and extends northerly to a location approximately 350m upstream of Wanless Drive; and,
• watercourse realignment will only occur at two locations; namely between the CNR and the gas pipeline corridor and between Mayfield Drive and the southern limit of Mayfield Woodland A.
The existing pipeline grade has established the downstream extent of watercourse lowering. As a result of the review of lowering options, it was determined that, based on environmental, cost and grading implications, the lowering of the East Huttonville Creek would begin at the pipeline and extend upstream to north of Wanless Drive (Drawing 4.5). As outlined in the HFSWS, channel widths are designed to accommodate meander belt allowances, Regional Storm flows, riparian storage, online Regional Storm storage, low flow channels, fisheries setbacks and environmental buffers from top-of-bank. Table 2.5 from the HFSWS Phase 3 report (June 2011), reproduced below, presents HFSWS recommended channel widths. It should be noted that, although not specifically indicated, the preliminary channel block widths, as described within the HFSWS, also incorporate required fisheries setbacks within the corridor widths and recommended stream meander belt. The issue of fisheries setbacks is explicitly addressed in

Final Environmental Implementation Report Mount Pleasant Sub-Area 51-1
September 2011
4-8
Table 4.5.A (below), which presents the channel widths determined through the more detailed assessment within the EIR.
Minimum HFSWS Watercourse Channel Block Width Requirements*
Creek Location
Stream
Meander Belt
Flood
Control Setback Total1
East Huttonville
South of CNR (ref. Reach HV 18) 30 60 10 70
North of CNR to TCPL (ref. Reaches HV 19) 31-50 55 +/- 10 70 +/-
TCPL to Wanless (ref. Reaches HV20-25) 15-20 40 +/- 10 50 +/-
North of Wanless to Woods (ref. Reaches HV 26) 15-20 35 +/- 10 45 +/-
North of Wanless, Woods to Mayfield
(ref. Reaches HV 27-29) 15-20 35 +/- 10 45 +/-
The implementation of this buffer/setback can be variable/flexible as it relates to its application to the corridor, e.g. if its 10 m, it might be split 5 m on either side, or used as 6 metres on one side to facilitate the City trail and 4 m on other side.
1. Actual watercourse corridors can be greater based on SPNHS principles. 2. This buffer/setback may be variable/flexible as applied from top-of-bank (e.g. 5 m per side).
The channel widths presented in this EIR are equal to or larger than the total channel block width requirements set out in the HFSWS Table 2.5. Refer to Table 4.5A for the comparison of recommended channel block widths to those presented in the HFSWS. The EIR channel block widths reflect:
• Meander belt allowances have been refined from HFSWS values. The HFSWS Phase 2 Report (January 2011) notes that the HFSWS meander belt allowances are conservative and may be refined through the EIR. This refinement has been completed by JTB Environmental Systems for the East Huttonville Creek. Calculations are provided in Appendix E. Refined meander belt allowances that reflect the minimum bottom width of the new channels are:
- From CNR to Wanless Drive = 27m - From Mayfield Woodland A to Mayfield Drive = 10m
• Fisheries Setback = 15m on either side of low flow channel.
• Width to accommodate Regional Storm flows, riparian storage and
online Regional Storm storage varies along the channel. Hydraulic calculations to support the resulting channel widths are presented in Section 4.8.
• Environmental buffer from top of bank = 5m.

Final Environmental Implementation Report Mount Pleasant Sub-Area 51-1
September 2011
4-9
Table 4.5A Recommended Channel Block Widths, East Huttonville Creek
Stream Reach HFSWS Channel Block
Width (m)
EIR Channel Block Width
(m)
South of CNR (Reach HV18, HV19c)
70 100
CNR to TCPL (HV19a)
70+/- 100
TCPL to Wanless Drive (HV22, HV24, HV25)
50+/- 70
Wanless Drive to Mayfield Woodland A
45+/- 45
Woodland A to Mayfield Drive
45+/- 45
The channel block south of the CNR is influenced by three others factors:
• The requirements for a 100m channel width (50m on either side of the low flow channel that reflects 30m from the meander belt) to protect the regulated (formerly “occupied”) habitat of the Redside Dace.
• No environmental buffer requirement to top-of-bank since generally no
defined top-of- bank exists along these reaches.
• Consistent with the Implementation Principles, no buffer is required to the Regional Storm floodline that governs the channel block width in many locations. A minimum 0.3m freeboard to the Regional Storm floodline elevations is required for adjacent new development.
In accordance with the Stream Management Strategy, this reach of watercourse will not be lowered or realigned. Only minor modifications will be made along HV18 and HV19c to accommodate new CNR culverts, two SWM pond outfalls and two municipal servicing crossings of the NHS.
4.5.1 Potential Impacts of Channel Lowering The channel profiles on Drawing 4.5 show the existing channel elevation compared to the channel elevation on the proposed realignment. There is less than about 1m change to the elevation everywhere except in the vicinity of Wanless Road, where the channel will be lowered by about 3m. Based on the available drilling and interpretation of surficial geology across the Study Area, the soils encountered along the channel are expected to be relatively low hydraulic conductivity till (refer to Section 2.1.6 for surficial geology conditions). There is no indication that any of the deep artesian-pressured and coarse-grained sediment layers will encountered with such limited lowering. There are several small sections of the channel that may encounter thin sandy silt layers including near MW10s/d at the north edge of W4, at the Wanless Road crossing, and in the vicinity of MW18 along W8 and W9 (refer to Figure 2.1.2 for these well and wetland locations). These sediments are fine-grained and there is no evidence to suggest that they are extensive or continuous such that any extensive dewatering would occur.

Final Environmental Implementation Report Mount Pleasant Sub-Area 51-1
September 2011
4-10
The potential impacts related to the channel lowering on the local water table conditions and NHS features were the subject of modeling and extensive discussions in the HFSWS. The proposed alignment was modeled as part of the 2G Plan assessment. Due to the nature of the steady-state groundwater flow model and input assumptions, the HFSWS concluded that the modeled results may not reflect the actual dewatering that might actually occur along the lowered channel sections. As a result, empirical long-term trench dewatering calculations were presented to assess potential impacts. These calculations provided a potential radius of influence in the order of 28m (i.e., the distance from the channel that may experience potential water table lowering). As discussed Section 4.5, the proposed channel block varies in width from 45m to 100m range and as such, the potential radius of influence for water table lowering from the channel excavation would be expected to be within the channel block and not adversely affect terrestrial features adjacent to the channel. There is an area between the Mayfield Woodlands A and B where the channel block width is restricted by the woodlands to about 23m at its narrowest point (Drawing 4.5), so there may be the potential to lower the water table along the south edge of W4. It is noted, however, that for all of the wetland features along the NHS, it is proposed that the post-development stormwater be managed to ensure that adequate surface water flows to the features are continued (refer to discussion in Section 6.0). This will maintain their recharge functions and, in turn, is expected to maintain the high water table conditions beneath the features as a contingency against any channel lowering effects. Due to the complexity of glacial geological conditions and the uncertainty inherent in subsurface soil investigations, the potential for encountering shallow layers or lenses of sand or silt along the channel excavation is recognized. If a permeable sand layer extended under an adjacent wetland and the layer was permitted to drain into the channel, there is a potential to lower the water table beneath the wetland. Prior to channel construction, it is recommended that additional soil investigations (e.g., test pits or drilling) be completed along the proposed alignment, focusing on the areas adjacent to the wetlands. Should shallow sand layers be encountered, the potential groundwater yield will be assessed to determine the need for active dewatering for channel construction as well as the potential for impacts from passive dewatering into the channel on the local water table conditions over the longer-term. Mitigation strategies for the control of groundwater during construction and, if warranted, mitigation to prevent lowering of the water table over the long term (e.g., cutoff walls or barriers to prevent groundwater flow into the channel) will be required. Contingency plans for construction will also be required should a zone of higher hydraulic conductivity be encountered unexpectedly during the excavations.
It is a requirement during any construction dewatering program that monitoring of the local groundwater levels and wetlands adjacent to the channel be conducted. Should the channel construction monitoring indicate a radius of influence that could adversely affect the groundwater levels in the adjacent wetlands, mitigation measures must be designed to compensate for this effect. Further discussion on the recommended assessment, contingency and monitoring requirements for channel construction are provided in Section 12.4.2.

Final Environmental Implementation Report Mount Pleasant Sub-Area 51-1
September 2011
4-11
4.6 Natural Channel Design
Since preparation of the draft EIR, there has been considerable discussion regarding the design of the new channel vis-à-vis the habitat requirements to support Redside Dace as well as maximizing the overall habitat benefits for aquatic and terrestrial animals within the NHS. With regard to Redside Dace, a number of important design metrics have been discussed in team/Agency meetings and within a dedicated channel design meeting that was held on August 16, 2011, as presented in Subsection 4.4.2 above. The EIR Team is in the process of refining the channel design with a view to maximizing channel sinuosity while working within the confines of the agreed NHS. As per discussions that occurred during the August 16th Agency meeting and other recent EIR meetings, it was acknowledged that this Final EIR would not be in a position to provide an update to the Natural Channel Design section, but that a set of detailed design drawings and a design brief would be completed and available in the fall of 2011. However, the team also met with the CVC during a May 5, 2011 meeting to review detailed technical comments and where appropriate, these comments have been addressed within the following sections. Hence, the reader will note that several of the drawings included in this EIR (such as Drawings 4.6A to 4.6F referenced below) have not been updated since the previous version of the EIR, and where appropriate, information is presented herein as ‘preliminary’. This section of the EIR addresses natural channel design requirements that have been incorporated into the preliminary channel designs presented on Drawings 4.6A to 4.6F. These drawings illustrate both plan view and cross-section and the anticipated location and design of these features. Discussion includes commentary and calculations on channel floodplain relationships, low flow channel configuration, creek profile, transitions from runs/riffles to pools, channel substrate, and aquatic habitat components, including floodplain and side-slope channels, offline or connected shallow ponds. Hydraulic calculations, supporting channel sizing is provided in Section 4.7. Some of the following information below may change following completion of the detailed design efforts presently underway. The natural channel design solution for East Huttonville Creek will conform to the draft CVC document Guidance Document: Application of Fluvial Geomorphology in Common Submissions (Geomorphic Solutions, 2009); the checklist will be provided in the detailed fluvial design brief.
4.6.1 Channel/Floodplain Relationships Discharge of water and sediment in rivers varies greatly in space and time. Discharge is normally confined below the banks of channels, but occasionally the channels are not able to contain the volume of discharge and water and sediment spill over onto the adjacent land surfaces. Adjacent to perennial rivers, these surfaces are usually alluvial floodplains, which are created by the fluvial system to accommodate the larger, less frequent flows. In headwater areas, these floodplains tend to be more active, with access to runoff flow occurring even in frequent storm events.
Alluvial floodplains result from the storage of sediment within and adjacent to the river channel. Two principal processes are involved. The first is the accumulation of sediment, often coarser sediment, within the shifting river channel. Sediment is commonly deposited, for example, on the slip-off slopes on the inside of meander bends

Final Environmental Implementation Report Mount Pleasant Sub-Area 51-1
September 2011
4-12
to produce point-bars. As the river migrates in the direction of the outside of the bend, the point-bar grows and the floodplain deposit is augmented. Much of the sediment is only temporarily stored in the point-bar and it may be moved further downstream from time to time. This type of within-channel accumulation, which can occur at any point within the channel, is mainly associated with below-bankfull discharges. Secondly, suspended sediment, carried by overbank discharges across the valley floor, may settle and provide a further increment of floodplain sediment, either generally over the flooded surface, or occasionally, locally along the channel margins. Where floodplain sediments comprise both coarse and fine material, most of the coarse fraction is the result of deposition by lateral accretion within the channel. Some of the fine material may result from overbank accretion where the floodplain sediment is comprised largely of fine material and is likely that most will be deposited within a channel. Deposition of suspended load on the floodplain is important for a number of reasons. Firstly, and most importantly, this systematic removal of fine material from suspension aids in the prevention of accumulation of fines in the channel itself. Sedimentation in this manner has direct implications for aquatic habitat quality as well as presenting concerns from a sediment transport perspective: Fines can cement gravels and prevent them from being entrained. This restricted sediment transport results in an increase in energy in the flow, which can then cause increased bank erosion. Secondly, there are advantages for overbank vegetation from accumulating sediment, including provision of a sediment layer for germination as well as the delivery of minerals and nutrients, which the vegetation may require. The channel design is intended to ensure that connectivity between the active flow in the low flow channel and the floodplain is maintained in a sufficient manner to provide for the processes described above. Further, the channel-floodplain interaction, which is built into the design, will assist to maintain the floodplain aquatic features that are part of the overall corridor design plan. It is intended that the floodplain gradient from side slopes to the channel be constructed at a grade of 1.0% to facilitate drainage to the low flow channel at times when flow volumes are low. This allows for opportunity for target fish species to migrate to refuge areas when necessary; it also allows for drainage of the floodplain so wet-tolerant plant species do not become overly saturated.
4.6.2 Design Components The East Huttonville Creek design has two main elements; an upstream complex which mimics a wetland/swale system and a downstream complex with similar properties transitioning to a more formal, more permanent flow condition, beginning at the Wanless culvert crossing and downstream. The entire design is approximately 4,500m in length and extends through six defined reaches. Reach breaks are determined according to changes in slope of the floodplain to accommodate grade inverts, as well as according to increases in flow under design events, as determined in the HEC-RAS analysis. Table 4.6A indicates the preliminary location of the reaches and their corresponding slopes, as well as preliminary run dimensions for the low flow channel under the 25mm and 2 year return period flows.

Final Environmental Implementation Report Mount Pleasant Sub-Area 51-1
September 2011
4-13
Table 4.6A Preliminary Reach Locations, Channel Slopes and
Dimensions for 25mm and 2-year Flows
Event
Reach
Slope
(m/m)
Discharge
(m3sec-1)
Top Width
(m)
Depth
(m)
Max. Velocity
(m sec-1)
Boundary Shear
(N m-2)
Froude
25mm Event
1 Mayfield to Spine Rd
0.00707
0.150
2.78
0.10
0.55
6.85
0.56
2 Spine Rd to Wanless
0.00707
0.190
2.24
0.14
0.65
9.59
0.58
3 Wanless to Sandalwood
0.00387
0.360
4.00
0.17
0.56
6.44
0.44
4 Sandalwood to City Park
0.00296
0.850
6.45
0.23
0.80
6.66
0.41
5 City Park to TCPL
0.00246
0.910
6.04
0.26
0.60
6.26
0.38
6 TCPL to CNR Crossing
0.00524
0.990
4.58
0.26
0.87
13.34
0.56
2-year Event
1 Mayfield to Spine Rd
0.00707
0.460
2.98
0.20
0.83
13.70
0.56
2 Spine Rd to Wanless
0.00707
0.510
2.47
0.25
0.92
17.13
0.62
3 Wanless to Sandalwood
0.00387
0.950
4.26
0.30
0.80
11.37
0.48
4 Sandalwood to City Park
0.00296
1.760
6.70
0.35
0.79
10.14
0.44
5 City Park to TCPL
0.00246
1.920
6.34
0.41
0.79
9.87
0.41
6 TCPL to CNR Crossing
0.00524
2.060
4.87
0.41
1.13
21.03
0.59
Each reach consists of three separate channel features: runs, rectangular pools and meander pools. Preliminary dimensions for construction of these channel features are found in Drawings 4.6.2A to 4.6.2D. The difference in pool type is to provide for vertical differentiation over long, straight reaches. Rectangular pools differ from meander pools in that they are not associated with a particular bend in the creek; they are associated with straight reaches to break up runs.

Final Environmental Implementation Report Mount Pleasant Sub-Area 51-1
September 2011
4-14
Depths of the channel features were designed to provide for channel/floodplain interactions over the length of the channel. This will help feed seasonally connected floodplain pool features discussed in Section 5.7.2.2. Table 4.6B illustrates the anticipated depths of runs and pools for each of the reaches as per the preliminary design sections.
Table 4.6B Preliminary Channel Depths - Runs/Riffles and Pools by
Reach: Depths in Metres
Reach
1 2 3 4 5 6
Run/Riffle
Depth (m)
0.10 0.14 0.17 0.23 0.26 0.26
Pool Depth (m)
0.40 0.70 0.80 1.10 1.20 1.20
The low-flow channel in the reaches upstream of the Mayfield Woodlot is not meant to be a formal fluvial channel. The design goal is to replicate headwater swale functions. The slopes and the target discharge are insufficient to maintain both a fluvial channel and a flooding channel in order to provide for wetland replenishment. Therefore, the channel is designed more as a swale with pools and should be vegetated rather than lined with stone material. This replicates the low-gradient headwater-type channels found in the area. The low-flow channel throughout the length is interspersed with pools, which will sustain water for fish and other animals when the remainder of the floodplain is dry. It is expected over time that the pools will drain through either seepage or evaporation during dry periods; therefore their utility for habitat will likely be limited to wet periods. Further, the channel is intended to promote undercutting of banks as part of the creation of habitat features. The channel will be cut into disturbed materials and held together at the surface by low-rooting vegetation mat; this encourages undercutting/overhanging, primarily in areas upstream of the SWM ponds where there is no stone being used. In order for the constructed channel to enhance the quality features of the existing channel, a number of elements will need to be established. In particular, placement of boulders along the riffles (sized appropriately to the specific riffle dimensions) will create diversity of flow in the runs and provide diversity of habitat. There may also be opportunities to place coarse woody debris (CWD) along certain sections of the newly-constructed channel to provide for diversity of habitat while not inhibiting flows. These two opportunities should be considered at the construction phase of this project and should be undertaken by a qualified fluvial geomorphologist and aquatic biologist.

Final Environmental Implementation Report Mount Pleasant Sub-Area 51-1
September 2011
4-15
4.6.3 Preliminary Channel Profile: Positioning of Channel Features
Table 4.6C contains the preliminary chainage locations for the profiles (Drawings 4.6A to 4.6F). It should be noted there is a +/- factor to the locations of the runs, riffles and pools, which would constitute a field fit situation and would be under the direction of the onsite fluvial geomorphologist.

Final Environmental Implementation Report Mount Pleasant Sub-Area 51-1
September 2011
4-16
Table 4.6C Details for Preliminary Positioning of Channel Elements as pre-
Detailed Design
Reach
Chainage From:
(0+…)
Chainage To:
(0+ …)
Channel Element
(reference
form)
Refer to Channel
Detail
Reach 1 Reach 2
000 050.6 090.6 130 140 175
225.9 290 330 346 365
404.8 450 465 500
518.5 557
574.4 610
648.8 663.4 678.3 730.6 785
813.2 830
858.3 888 910
948.3 1000 1020
1043.5 1060 1100 1150 1170 1190 1208 1240 1270
050.6 090.6 130 140 175
225.9 290 330 346 365
404.8 450 465 500
518.5 557
574.4 610
648.8 663.4 678.3 730.6 785
813.2 830
858.3 888 910
948.3 1000 1020
1043.5 1060 1100 1150 1170 1190 1208 1240 1270 1310
M POOL ]RUN
M POOL RUN
M POOL RUN
M POOL RUN
R POOL RUN
R POOL RUN
R POOL RUN
R POOL RUN
R POOL RUN
M POOL RUN
R POOL RUN
M POOL RUN
R POOL RUN
M POOL RUN
M POOL RUN
R POOL RUN
R POOL RUN
M POOL RUN
R POOL RUN
R POOL RUN
CULVERT
B
A
B A
B A
B A
C
A C
A C
A
C A
C A
B
D E
D F
D E
D
F D
F D
E
D E
D F
D E
D
E D
G

Final Environmental Implementation Report Mount Pleasant Sub-Area 51-1
September 2011
4-17
Table 4.6C Details for Preliminary Positioning of Channel Elements as pre-
Detailed Design
Reach
Chainage From: (0+…)
Chainage To: (0+ …)
Channel
Element (reference
form)
Refer to
Channel Detail
Reach 3
1310 1346.9 1385.2 1410
1435.8 1470 1522 1570 1610
1633.9 1653.7 1670 1720
1804.7 1856.6 1926.1 1953.2 1980
1996.4 2014.7 2040
2085.3 2104
2134.4 2167.4 2200 2226 2252 2270 2310
2333.7 2380
2405.4 2430
2471.9 2540 2567 2592 2646 2674
2695.8 2710 2740
2781.4
1346.9 1385.2 1410
1435.8 1470 1522 1570 1610
1633.9 1653.7 1670 1720
1804.7 1856.6 1926.1 1953.2 1980
1996.4 2014.7 2040
2085.3 2104
2134.4 2167.4 2200 2226 2252 2270 2310
2333.7 2380
2405.4 2430
2471.9 2540 2567 2592 2646 2674
2695.8 2710 2740
2781.4 2821.7
RIFFLE RUN
M POOL RUN
R POOL RUN
M POOL CULVERT RIFFLE RUN
R POOL RUN
R POOL RUN
M POOL RUN
M POOL RUN
R POOL RUN
R POOL RUN
M POOL RUN
R POOL RUN
M POOL RUN
M POOL RUN
CULVERT RIFFLE RUN
M POOL RUN
R POOL RUN
M POOL RUN
R POOL RUN
M POOL RUN
R POOL
D
F
D E
D F
H
I J
I J
I K
I
K I
J I
J
I K
I J
I K
I
K I
G I
K
I J
I K
I
J I
K I
J I
K
I

Final Environmental Implementation Report Mount Pleasant Sub-Area 51-1
September 2011
4-18
Table 4.6C Details for Preliminary Positioning of Channel Elements as pre-
Detailed Design
Reach
Chainage From: (0+…)
Chainage To: (0+ …)
Channel
Element (reference
form)
Refer to
Channel Detail
Reach 4 Reach 5 Reach 6
2821.7 2850 2870 2895 2920
2954.8 3000 3020 3060
3102.1 3137.2 3165.7 3197.7 3230 3250
3282.6 3301.8 3326
3346.8 3380
3412.8 3442.9 3467.1 3477
3501.3 3520 3552
3587.4 3625.5 3691.4 3718.5 3770 3820
3867.7 3885.2 3931.6 3974.3 4003.2 4020 4050
4072.5 4098.8 4132.4 4160
2850 2870 2895 2920
2954.8 3000 3020 3060
3102.1 3137.2 3165.7 3197.7 3230 3250
3282.6 3301.8 3326
3346.8 3380
3412.8 3442.9 3467.1 3477
3501.3 3520 3552
3587.4 3625.5 3691.4 3718.5 3770 3820
3867.7 3885.2 3931.6 3974.3 4003.2 4020 4050
4072.5 4098.8 4132.4 4160 4187
RUN M POOL
RUN R POOL
RUN R POOL
RUN M POOL
RUN R POOL
CULVERT RIFFLE RUN
R POOL RUN
M POOL RUN
R POOL RUN
R POOL RUN
M POOL RUN
R POOL RUN
R POOL RUN
M POOL RUN
M POOL RUN
M POOL CULVERT RIFFLE R POOL
RUN R POOL
RUN R POOL
RUN M POOL
RUN R POOL
RUN
J
I
J I
K I
J
L N
M N
O N
M
N M
N O
N
M P
Q P
R P
R
P R
S Q
P
Q P
Q P
R
P T
U T
U V
U
T

Final Environmental Implementation Report Mount Pleasant Sub-Area 51-1
September 2011
4-19
Table 4.6C Details for Preliminary Positioning of Channel Elements as pre-
Detailed Design
Reach
Chainage From: (0+…)
Chainage To: (0+ …)
Channel
Element (reference
form)
Refer to
Channel Detail
4187 4217
4239.5 4268.9 4308.3 4350
4390.5 4415.6 4454.2
4217 4239.5 4268.9 4308.3 4350
4390.5 4415.6 4454.2 4494.9
R POOL RUN
M POOL RUN
R POOL RUN
R POOL RUN
M POOL
U
T
U V
U T
U
V U
Re: Features: R=Run/Riffle, R Pool = Rectangular Pool, M pool = Meander Pool Note: chainages and channel details are shown on Drawings 4.6A to 4.6F.
4.6.4 Transitions from Runs/Riffles to Pools in Construction The attached preliminary drawings (Drawings 4.6A to 4.6F) indicate a series of runs/riffles and pools which essentially meet at the prescribed location. During construction, there will need to be a transition between the runs/riffles (which are approximately 2.0m top width at bankfull) and the pools (which are approximately 2.5m top width at bankfull). This transition is not meant to be abrupt, but rather spread over a distance at each location of about 3m to 5m, where possible. This represents a field-fit situation and will require the presence of a qualified fluvial geomorphologist onsite at the time of construction. The location of these runs/riffle sections will be updated, as required, following completion of the detailed channel design presently taking place.
4.6.5 Channel Substrate Materials Upstream of Wanless Drive, the design substrate for the low flow channel is comprised of compacted native materials (required compaction of 95-98%) with an addition of some loose alluvium mixture. The alluvium is intended to be mobile under low flow conditions to mimic the availability of bank and bed materials for transport through the system. Care and consideration is required when applying this layer of alluvium as it should not be available for mass transport under the first flow event, as that could cover downstream riffles and create sedimentation issues. Application of the alluvium materials should be under the supervision of a fluvial geomorphologist. Riffles downstream of Wanless Drive require stone to maintain the riffle form as well as the grade of the crest. Recognizing that the channel downstream of Wanless is to be designed for Redside Dace, a substrate mix which is in accordance with MNR directives on suitable substrate is proposed. According to the 2008 Parish Report on geomorphic parameters for Redside Dace, the optimum substrate sizing has been found to be 70mm diameter. While it is not acceptable to have one single diameter comprise the entire substrate composition, the following substrate mix is to be utilized:

Final Environmental Implementation Report Mount Pleasant Sub-Area 51-1
September 2011
4-20
• 16% of the mix = 70mm diameter • 20% = 60mm • 7% = 40mm • 50% = 30mm • 7% = 20mm
This combination of materials is to be pre-mixed prior to application and is to be applied to a thickness of 200mm (minimum). Analysis of the maximum boundary shear stress found downstream of Wanless Drive indicates a value of 21.03Nm-2. The critical stone size for entrainment at that value is 29mm diameter; therefore the substrate mix noted above will remain stable under the design flows. As a cross-check, the maximum velocity in the channel downstream of Wanless Drive was found to be 1.13msec-1; the critical stone size for this value is 45mm diameter. Based on these values, the substrate mix will remain dynamically stable over the design flows. As with the other channel segments, a mix of alluvium into the riffle stone will assist in minor transport events, while also acting to lock the riffle stones together for additional stability. As per the other channel sections, this application should be under the supervision of the fluvial geomorphologist. In addition to channel supplies of sediment for transport, a series of sand/gravel/alluvium pockets have been added to the floodplain in a number of locations. These pockets are to act as sediment supply zones for times when the system needs to gain some sediment for proper functioning. In addition to these zones, undercutting along banks will allow for additional sediment supply in a controlled manner.
4.6.6 Channel Form in Culverts There are multiple culvert crossings along the length of the realigned East Huttonville Creek. In order to facilitate movement of flow through the culverts, a low flow channel is situated approximately in the centre of each culvert. The culverts themselves are comprised of a different substrate than the runs and they do not crest in the same manner as the riffles do; they are designed to pass the required flow without creating risk to the associated infrastructure. Further information on culvert design is provided in Section 10.0. In terms of general form for the low-flow and floodplain in the culverts, the low flow channel should be designed as specified on Drawing 10.4.1 and the floodplains should grade at +1.00 % from the bank of the low flow to the edge of the culvert wall (in section). This allows for drainage of the culvert on the receding end of a storm event back toward the low flow channel, and assists in maintaining the position of the low flow channel as well as limiting development of multiple channels in the culverts. The positioning of the low flow channel in the culverts will also provide an overbank area that will assist in the movement of small mammals through the culverts. This design is based on the principles of fluvial process for systems of this size and contributing area. The design is intended to be sustainable over the long term and is intended not to interfere with natural channel elements downstream of the Study Area. Detailed design will provide confirmation or refinement of these design approaches and additional data, as required, for construction approvals.

Final Environmental Implementation Report Mount Pleasant Sub-Area 51-1
September 2011
4-21
4.6.7 Aquatic Habitat Components (Side-slope and Floodplain Features)
Associated with the natural channel design of the low flow channel is the development of floodplain and side-slope habitat features that will contribute to, and will be affected by, the low-flow channel at times of low flow as well as during flood periods. Diverse floodplain habitat features can assist with the function of the main channel thread in that they provide necessary organics and sediment to the low-flow channel which would normally be reduced under land development conditions. The lack of overland flow under existing conditions limits sediment and nutrient delivery to the channel; the floodplain features provide that delivery to the low flow channel and by association to downstream reaches. Within the reconfigured and naturalized stream channel, various elements associated with natural streams will be incorporated, where feasible and appropriate, based on stream corridor slope and expected availability of water. Slope, which affects channel gradient, and volume of water are the two drivers of channel feature formation and maintenance. As noted in previous sections, channel bed morphology, such as pools, riffles, flats, and runs, will be incorporated into the new channel to create habitat diversity and improved fish passage to move both upstream and downstream during more periods of the year. At present, pool habitat in the entire section from Mayfield Road to the CNR is limited and found generally associated with existing culvert crossings were the locations where fish were most frequently observed. Riffle habitat is virtually non-existent, so opportunities for riffle-spawning are presently limited. Increasing the number and quality of pool and riffle features available to fish will provide more habitat for spawning and incubation, more areas for rearing and holding, better habitat for food production (benthic invertebrates in riffle zones, breaking down contributions from an enhanced and diverse riparian zone), and increased availability of refuge areas for periods of low-flow and extremes in temperature. Therefore, the productivity of the system should be increased by providing greater habitat diversity, particularly habitat types required for reproduction and growth of fish. These features are currently limited in the system and need to be more common and available to the existing and downstream fish communities.
As noted in Subsection 4.4.2, a number of these design parameters were discussed during the natural channel design meeting on August 16, 2011, and efforts are being made to incorporate these within the current detailed design.
4.6.8 Accessory Habitat Components
Under existing conditions, the aquatic features in the East Huttonville Creek are essentially homogeneous. The East Huttonville Creek, in particular, is a constructed drain that is entrenched in an artificial channel that has been disconnected from its floodplain and overbank flows are likely infrequent and short-lived. As discussed above, by creating a naturalized channel and re-connecting it to its floodplain, opportunities are created to incorporate the following additional features within the floodplain area that can contribute to habitat productivity.

Final Environmental Implementation Report Mount Pleasant Sub-Area 51-1
September 2011
4-22
Side Channels and Off-line or Connected Shallow Ponds
Creating side-channels, off-line pools or ponds and seasonally connected pool areas within the floodplain area can offer habitat functions similar to meander scar depressions, cutoff oxbows and riparian wetlands. Based upon the design of the NHS, the expected location of side-channels and the off-line and/or connected ponds are depicted on Drawings 4.6A to 4.6F (Natural Channel Design) and on Drawing 4.6G (NHS Restoration Concept Elevations) and Figure 4.6.1. Drawing 4.6G depicts cross- sections across the NHS at two locations illustrated on Vignettes 3 and 4 (Drawings 3.4.3 and 3.4.4, respectively). While the location and design of these side channels and pools may vary slightly during detailed design based on channel sinuosity, the general information presented on Drawings 4.6A to 4.6F will still apply. For purposes of graphic depiction, all these pools and side channels appear identical on these drawings; however, there will be variability in the actual construction (i.e., depths will vary, location and types of woody debris will vary and substrate will vary). Under high flows, fish can move from the main channel into these areas where they may remain for a period of time, or they may exit while flows are high. Fish that remain in these features can feed and grow, and upon the next high flow overbank event, can re-enter the main stem to continue various life stage processes. These features are expected to provide seasonal habitat at a minimum, with the potential for some to provide permanent habitat depending on the degree of inundation. As part of any natural aquatic system, predation of fish may occur within these pools from birds or mammals, and during some extreme dry weather events, some die-off may occur to those fish trapped within these pools. Some species may also utilize the quiet pool areas for spawning and rearing functions, with recruitment back to the system occurring during the next flood event.
Floodplain and Side-slope Channels
Previous discussion of the proposed alterations to existing stream reaches acknowledged both a conversion and loss of simple contributing habitat. The opportunities for the creation of swale drainage that would approximate the functions of complex contributing habitat have been the subject of discussion with Agency stakeholders. Through internal design charrettes, the EIR team has examined the potential to create a series of semi-formal side-slope and floodplain channels that will deliver concentrated overland flow from the tablelands to the channel corridor. The purpose of these channels is to provide for some delivery of energy to the East Huttonville Creek system, which the overall system can utilize to create minor ‘pulses’ of sediment and water to maintain the overall creek morphology, while delivering sediment in a controlled manner to downstream reaches (to mimic the flow conveyance function of the simple and complex headwater swales presently on the landscape). It should be noted, however, that the existing network of simple contributing habitat swales, through cultivated fields, will likely present excessive volumes of fine-grained sediment – the goal will be to provide limited amounts of more coarse-grained sediment. In areas where there are formal riffle structures (riffles will be increasingly incorporated south of Buick Boulevard as flow volume increases), these channels can be utilized to ensure that riffles are ‘cleaned’ periodically of silt that may accumulate in the system.
In some locations, the width of the riparian zone and floodplain will allow for the creation of longer corridor swales that will receive rear lot drainage from tableland swales to deliver periodic flow to the main stem or one of the off-line depressional features. The function of these tableland and floodplain swales would be to convey runoff/storm flows

Final Environmental Implementation Report Mount Pleasant Sub-Area 51-1
September 2011
4-23
through vegetated swales and channels, which would be an improvement from the existing reaches of simple contributing habitat that conveys stormwater via cultivated fields. As described previously, it is worthy to note that the TRCA/CVC’s Evaluation, Classification and Management of Headwater Drainage Feature Guidelines identify that the removal of simple contributing habitat functions can be replicated through the use of lot-level conveyance measures that are connected to the NHS “as feasible”. The combined implementation of swales, around schools, parks or other public lands and bioswales, adjacent to the NHS draining to corridor side-slope swales and floodplain channels, will address the management recommendations of the Headwater Drainage Feature Guidelines. There are constraints in terms of where these side-slope and floodplain channels can be located. They are unable to be designed within the narrower portions of the NHS corridor as there are concerns about the potential for rill or gully erosion occurring on the side-slopes and creating functioning floodplain channels. Hence, the best location for these features is within the 785m of 100m wide channel, north of the North-South Spine Road (west of Park Woodland A) and the CNR. In addition, there will be an opportunity for placement of another side-slope channel further north on the east side of the NHS (i.e., north of Wanless Drive). As depicted, in preliminary fashion on Drawings 4.6.7.1A to 4.6.7.1D, the following presents some basic design details that will be utilized for these side-slope channels:
• width and depth of the channels should not exceed 1.0m (width) and 0.25m (depth);
• maximum velocity of flow in the channels should not exceed 0.50m per second;
the substrate of the channels should be compacted native soil materials and can be vegetated with seed plantings after an initial stabilization with cocofibre mat;
• the channels should not approach the floodplain bottom and/or formal channel of
the East Huttonville Creek at an angle greater than 60 degrees toward perpendicular in order to prevent potential scour due to steep slopes; and,
• at detailed design, consideration should be given to directing swales to a gravel
lens, offline shallow ponds or vegetated nodes in the floodplain.
The source of water for the side-slope channels can be directed overland flow from the tablelands and/or from rooftops and side yard/rear yard swales. The number of potential side-slope channels is governed by grading practicalities and the ability to generate adequate flows from the various sources. A variation on the concept of the side-slope and floodplain channels is the potential for the creation of extended SWM discharge channels. Where feasible, the addition of length to the SWM channels will further replicate functions of simple and complex contributing habitat. 4.6.8.1 Aquatic Habitat Components
Drawings 4.6A and 4.6F depicts the anticipated preliminary locations of the above-referenced aquatic habitat components such as the side channels, on-line and off-line pools, and side-slope swales. The preliminary design of the channel and grading details has enabled a reasonably accurate estimation of the number and location of these

Final Environmental Implementation Report Mount Pleasant Sub-Area 51-1
September 2011
4-24
features within the NHS. For example, the connected side channels and pools within the floodplain, as well as the off-line pools and upland terrestrial nodes, are illustrated with a high degree of accuracy; however we note that final channel design currently being completed may result in some alteration to the location of these features within the floodplain – for purposes of this revised EIR, however, their locations illustrated on Drawings 4.6A and 4.6F have not been amended from the January 2011 EIR. The location of the side-slope swales are depicted on the west side of the NHS, just north of the Spine Road (west of Park Woodland A) and the TCPL, as well as another side-slope, east of Mayfield Woodland B, on the east side of the NHS. Grading details for the channels permits a better understanding of where these channels can occur, as well as how surface water contributions will occur to these features. As further example, the side-slope channels, within the channel between the CNR and the TCPL, will only be sited on the west side of the channel as there is a trail alignment anticipated within the corridor on the east side. The presence of a drainage channel on this side could create unsafe walking conditions during freezing weather.
The estimated lengths of the side channels (including a calculation of the length through the connected side pools), the lengths of the side-slope channels, and the estimated habitat area within the connected and unconnected floodplain pools are being refined through the detailed channel design presently taking place. As the new channel exhibits a different sinuosity and as the channel side slope gradients are being finalized, the location of these floodplain features and the overall number of them may alter slightly from what was presented in the previous EIR. However, these side-slope channels are anticipated to provide either complex or seasonal fish habitat. Beyond this, the creation of floodplain and amphibian pools, as well as the large area of open water marsh/wetland and the small fish foraging pools at the west side of the City Park, will provide an overall net gain in productive fish capacity, as described within the CFCP (October 2011).
4.7 Creditview Park Channel
The City Park is a fully serviced city-wide facility of active sports field supported by a fieldhouse (e.g., washrooms, concession, and operations depot), parking and pathways. The City will continue to improve the open space infrastructure and amenities of this City Park to meet current and anticipated service demands. Future improvements to the City Park include: replacement of two soccer fields with artificial turf (proposed 2011); playground/splash pad associated with the fieldhouse; community/educational gardens; picnic areas; and, parking lot upgrades including asphalt surface and expansions, etc. The City recognizes that the City Park is currently traversed by the East Huttonville Creek, which will be realigned through the creation of the NHS that will generally border the west boundary of the Park. Regardless, the City Park will continue to be affected post-development by the East Huttonville Creek Regional Storm floodline. The agreement between the City and the Mount Pleasant Landowner’s Group requires, among other things, is that the Landowner’s Group compensate the City for the estimated future cost of re-engineering the channel. The City may, at its discretion, undertake the channel improvements in conjunction with the NHS construction or at another time of its choosing.
The existing conditions of the East Huttonville Creek have been well described within Section 2 of this EIR, as well as within the CFCP (October 2011). As discussed, this portion of the creek is part of the Rowntree Drain, created in the early 1980s. Through the City Park, the watercourse has been channelized from north-to-south for

Final Environmental Implementation Report Mount Pleasant Sub-Area 51-1
September 2011
4-25
approximately 370m (a portion of Reach HV24), before turning 900 to the west for approximately 470m, again through a channelize.1ed reach (a portion of Reach HV22). Dense vegetation cover (cattails and reed canary grass) encroaches through the majority of these reaches. Through the City Park, there are five culvert crossings. Given the use of this area as an active park, virtually all of the adjacent lands around the drain consist of manicured turf and the riparian zone on either side of the channel is essentially limited to the top width of the entrenched channel (i.e., averaging about 4m to 5m total width). This area is depicted on Figure 4.2.6. Given the significant level of use of these lands by the public, including a large, young demographic in the soccer programs, the City is considering opportunities to modify the existing steep side-slopes of the channel to a more gradual slope along its full length through the Park. The reduction in slope angle will provide opportunities to create a riparian zone through a naturalized side-slope including native plantings and application of a meadow seed mix. The reduction in slope angle will also address safety for park users, pedestrians and cyclists. Figure 4.2.6 illustrates the proposed width of the new channel as well as providing a channel cross-section that highlights the existing V-shaped channel and the proposed shaping of the side-slopes. It is recognized that City staff will need to have discussions with the Conservation Agencies regarding any channel modifications and the proposed naturalization opportunities.
The realignment of the East Huttonville Creek and the development of Sub-Area 51-1, including SWM, will alter the drainage catchments to the East Huttonville Creek/NHS corridor, thereby removing a substantial upstream drainage area to the remnant channel through the City Park. It is the City’s intention to maintain positive site drainage for the Park’s playing fields, building and structures, and parking areas to the restored East Huttonville Creek’s corridor via the Park remnant channel/-swale. As well, the City will consider the alteration and/or removal of the existing off-line pond (southeast bend of the existing East Huttonville Creek, east of the fieldhouse) to improve public safety and accessibility at this gateway to the City Park.
The HFSWS, EIR and CFCP have acknowledged the future status of the City Park’s drainage system, although potential removal of the off-line pond has not been formally addressed. While there are no immediate plans to remove this pond, the City may wish to consider its removal at some future date.
Considerable discussion has occurred between the Mount Pleasant design team, the City and the CVC regarding the future habitat of the remnant channel of the East Huttonville Creek through the Park. It is anticipated that the City Park drainage system will provide a combination of simple contributing and seasonal habitat functions based on the degree of flow conveyance to the remnant channel and the manicured and/or natural vegetation communities, respectively. To this end, there are numerous swales oriented between and around the playing fields that will convey overland drainage to the remnant channel (i.e. Reaches HV24 and HV22), following the creation of the NHS – these grassed swales will provide simple contributing habitat. Urbantech has examined the opportunity to provide surface water contributions to the remnant channel, downstream of Sandalwood Parkway. Their calculations indicate that clean surface water contributions will be available from 1.8 ha of residential roofs that will be constructed on the north side of the new Sandalwood Parkway alignment, at the top end of the remnant Reach HV24. Figure 4.2.6 illustrates the portion of residential roofs that will be available. It is anticipated that surface water will be available from the following sources:

Final Environmental Implementation Report Mount Pleasant Sub-Area 51-1
September 2011
4-26
• Discussion with the City indicates that it will seek opportunities to manage and improve the quantity and quality of flows that drain to the remnant channel (e.g., conversion of playing fields to artificial turf, application of LIDs, as feasible, etc.). Hence, sheet flow and perhaps tile drainage from the playing fields will flow into the remnant channel; and,
• An RDC (roof drain collector) system can be implemented on lots north of
Sandalwood Parkway to direct clean flow into the upper reaches of the remnant channel through the Park.
4.8 Channel Hydraulics
4.8.1 HFSWS Riparian Storage Calculations The HFSWS Phase 3 Working Paper (June 2011) identified preliminary riparian storage targets for the East Huttonville Creek and the Fletcher’s Creek tributaries for the 100 year and Regional Storm events. Within Sub-Area 51-1, only the East Huttonville Creek has a floodplain and hence, riparian storage targets for the East Huttonville Creek presented in Table 2.6 of the HFSWS Phase 3 Report (June 2011) and reproduced below, must be maintained in the channel design.
Watercourse Riparian Storage Requirements(m3)
Creek Location
Existing
100 Yr Regional
East Huttonville
North of CNR
195,170 339,170
North of Wanless Drive
19,520 24,530
4.8.2 Updated Existing Huttonville Creek Floodplain and Riparian Storage Calculations
The purpose of the hydraulic analysis of the East Huttonville Creek is to:
• confirm floodplain mapping for the existing watercourse;
• determine existing riparian storage volume targets for range of return period events and the Regional Storm;
• ensure riparian storage in the realigned and lowered channel matches or exceeds
existing riparian storage;
• guide culvert sizing for new road crossings of the realigned and lowered channel;
• test channel design under proposed conditions, assuming failure of all crossings, to confirm that its design accommodates Regional Storm flows;

Final Environmental Implementation Report Mount Pleasant Sub-Area 51-1
September 2011
4-27
• confirm the design of on-line Regional Storm storage; and,
• establish channel velocities for input into the fluvial geomorphological analysis. To achieve the above goals, the U.S. Army Corps of Engineers' River Analysis System (HEC-RAS) was utilized. HEC-RAS is designed to perform one-dimensional steady and unsteady flow river hydraulics calculations, sediment transport-mobile bed modelling, and water temperature analysis. The HEC-RAS software supersedes the HEC-2 river hydraulics package. The modelling system calculates water surface profiles for steady gradually varied flow. The system can handle a full network of channels, a dendritic system, or a single river reach. The steady flow component is capable of modelling subcritical, supercritical, and mixed flow regime water surface profiles. The basic computational procedure is based on the solution of the one-dimensional energy equation. Energy losses are evaluated by friction (Manning's equation) and contraction/expansion (coefficient multiplied by the change in velocity head). The momentum equation is utilized in situations where the water surface profile is rapidly varied. These situations include mixed flow regime calculations (i.e., hydraulic jumps), hydraulics of bridges, and evaluating profiles at river confluences (stream junctions). The effects of various obstructions, such as bridges, culverts, dams, weirs, and other structures in the floodplain, are considered in the computations. The steady flow system is designed for application in floodplain management, estimation of floodplain storage, and for assessing the change in water surface profiles due to channel modifications. The model requires the following input:
• channel geometry (low flow centerline profile and cross-sections; culvert crossing details);
• Manning’s roughness for main channel and overbank areas; • cumulative flow; and, • downstream boundary conditions.
The existing East Huttonville Creek from the CNR to Mayfield Road has been modelled by extracting cross-section information from the available LiDAR topographic mapping for the Study Area. Channel flow data was extracted from the HFSWS Phase 2 Report (June 2011). To assess riparian storage requirements, the existing watercourses were simulated for the entire range of return period events (2-year to 100-year) and Regional Storm with no infrastructure/man-made obstructions present in the channel. In order for the model to calculate water levels and storage within the channel, a downstream boundary condition for the watercourse is required. As per the HFSWS, the peak flow downstream of the CNR tracks must be maintained at 28.4m3/s and the existing channel in this location will not be modified. Therefore, based on existing downstream water level at the channel section immediately downstream of the CNR tracks, a water level boundary condition was determined. The existing channel geometry was extracted from the available LiDAR topographic survey. A low-flow survey, conducted by RPE in 2008, was integrated into the topography as well. The RPE survey also included detailed measurements of all existing
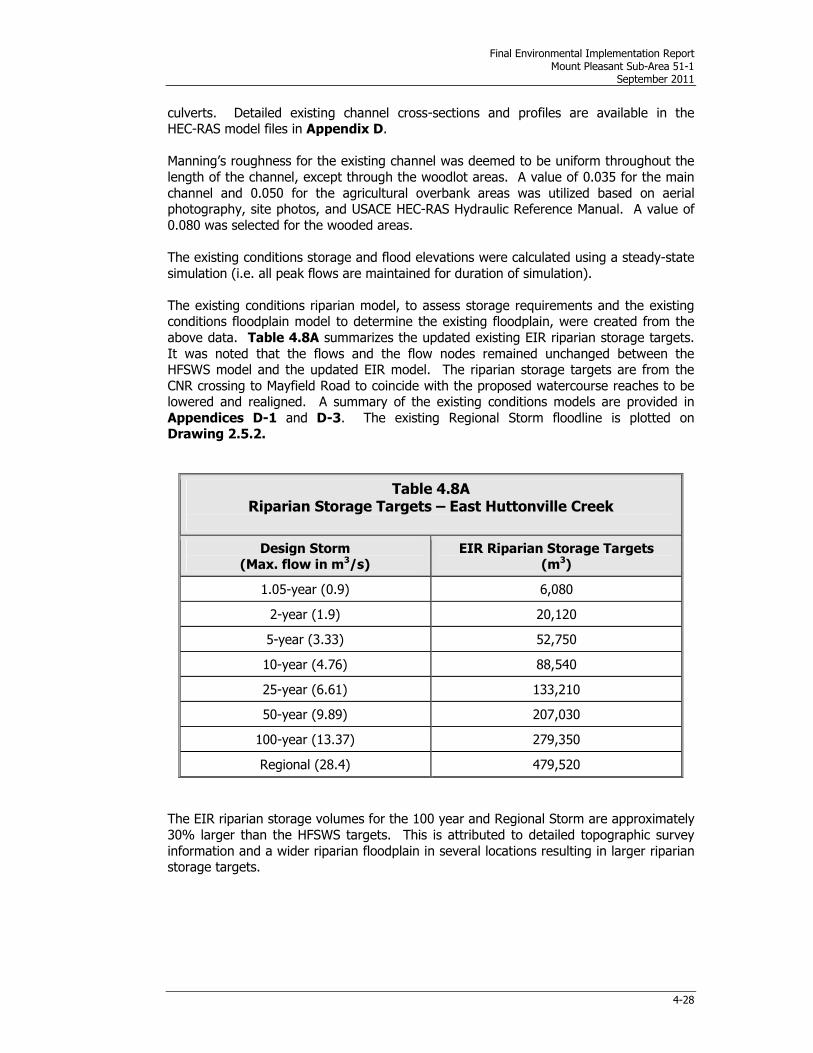
Final Environmental Implementation Report Mount Pleasant Sub-Area 51-1
September 2011
4-28
culverts. Detailed existing channel cross-sections and profiles are available in the HEC-RAS model files in Appendix D. Manning’s roughness for the existing channel was deemed to be uniform throughout the length of the channel, except through the woodlot areas. A value of 0.035 for the main channel and 0.050 for the agricultural overbank areas was utilized based on aerial photography, site photos, and USACE HEC-RAS Hydraulic Reference Manual. A value of 0.080 was selected for the wooded areas. The existing conditions storage and flood elevations were calculated using a steady-state simulation (i.e. all peak flows are maintained for duration of simulation). The existing conditions riparian model, to assess storage requirements and the existing conditions floodplain model to determine the existing floodplain, were created from the above data. Table 4.8A summarizes the updated existing EIR riparian storage targets. It was noted that the flows and the flow nodes remained unchanged between the HFSWS model and the updated EIR model. The riparian storage targets are from the CNR crossing to Mayfield Road to coincide with the proposed watercourse reaches to be lowered and realigned. A summary of the existing conditions models are provided in Appendices D-1 and D-3. The existing Regional Storm floodline is plotted on Drawing 2.5.2.
Table 4.8A Riparian Storage Targets – East Huttonville Creek
Design Storm (Max. flow in m3/s)
EIR Riparian Storage Targets (m3)
1.05-year (0.9) 6,080
2-year (1.9) 20,120
5-year (3.33) 52,750
10-year (4.76) 88,540
25-year (6.61) 133,210
50-year (9.89) 207,030
100-year (13.37) 279,350
Regional (28.4) 479,520
The EIR riparian storage volumes for the 100 year and Regional Storm are approximately 30% larger than the HFSWS targets. This is attributed to detailed topographic survey information and a wider riparian floodplain in several locations resulting in larger riparian storage targets.

Final Environmental Implementation Report Mount Pleasant Sub-Area 51-1
September 2011
4-29
4.8.3 Proposed Conditions Floodplain Model
The post development hydraulic model was prepared to confirm riparian storage targets will be met, to identify post development flood levels, to assess on-line Regional Storm storage and to determine culvert crossing requirements. Both the existing and post development conditions were simulated with a steady-state model (i.e. peak flows sustained throughout duration of simulation). The channel geometry in the post-development hydraulic model is based on the final NHS alignment and grading provided on Drawings 4.6A to 4.6F. Channel flow for the 2 yr to 100 yr storm events was assumed to be equal to the existing flows established in the HFSWS. This is a valid assumption since the proposed SWM facilities will control the 2 yr to 100 yr post-development runoff to existing peak flow rates. A Visual OTTHYMO model was utilized to calculate the proposed Regional Storm peak flows under AMCIII conditions. To match the incremental existing riparian storage requirements, several measures were implemented.
• The existing creek, through the City Park/sports fields, will be maintained to drain the City Park. This area is prone to flooding, providing substantial floodplain storage under existing conditions. These flooding conditions will remain; they will not be increased. This area contributes to a large majority of the pre-development and post-development riparian storage.
• The proposed final NHS will have a wide section (~200m) with flat overbank
areas through the proposed open water/marsh wetland upstream of the North-South Spine Road/TCPL corridor. This area will be flooded to achieve riparian storage.
• To create energy losses/backwater to fill the City Park and NHS storage areas, as
well as increase the water level throughout the channel, a “hydraulic speed bump” is proposed. This concept involves a reverse slope in the overbank area from upstream to downstream while maintaining a positive slope for the low flow channel to allow for fish passage/low flow conveyance. The hydraulic speed bump does not impact the low-flow channel and will not cause any standing water/ponding or impact base flow temperature. The hydraulic speed bump is designed to cause backwater during extreme (e.g. Regional) flooding events to achieve the required riparian storage. It does not affect the “day to day” performance of the low flow channel conveyance or habitat. Refer to Drawing 4.6E for details.
The post development riparian conditions model demonstrates that existing riparian storage volumes are maintained on an incremental basis with the proposed channel design. Tables 4.8B and Appendices D-2 and D-4 summarize riparian storage volumes. The post development riparian storage model is also provided in these appendices.

Final Environmental Implementation Report Mount Pleasant Sub-Area 51-1
September 2011
4-30
Table 4.8B Riparian Storage – East Huttonville Creek
Design Storm
(m3/s)
EIR Riparian Storage Targets
(m3)
EIR Provided Storage
(m3)
1.05-year (0.9) 6,080 6,141
2-year (1.9) 20,120 20,522
5-year (3.33) 52,750 54,333
10-year (4.76) 88,540 92,082
25-year (6.61) 133,210 139,871
50-year (9.89) 207,030 219,452
100-year (13.37) 279,350 298,905
Reg. (28.4) 479,520 520,000
4.8.4 Online Regional Storm Storage
The HFSWS identified that Regional Storm flow controls are required within the Huttonville and some Fletcher’s Creek subcatchments. Consistent with the HFSWS recommendations, on-line Regional Storm storage will be provided within the proposed open channel blocks, upstream of the CNR. Development downstream of the CNR must provide Regional Storm controls within the end-of-pipe SWM facility. The HFSWS determined unit storage rates to control Regional Storm post development flows to pre-development levels. Within Block 51-1, only flow Node HE at Bovaird Drive was identified for Regional Storm post to pre-flow control. Referring to HFSWS results, the Regional Storm requirements are:
East Huttonville Creek Flow Node HE at Bovaird Drive: Regional Flood Control: 841 m3/imp ha Fletcher’s Creek Flow Node F1 at Creditview Road:
Regional Flood Control: 910 m3/imp ha (in addition to the required 100-year storage volume; refer to EIR Section 9.5 for details).
The Implementation Principles note that, “Regional Storm on-line storage is approved in principle subject to the SWS Phase 2 impact assessment”. This concept was tested through the HFSWS Phase 2 modelling. This assessment, presented in the HFSWS, notes that “To mitigate the increase in peak flows, Regional Storm Flood Control Storage would also have to be provided at strategic on-line locations within Huttonville Creek and Fletcher’s Creek”. It recommended the above noted Regional Storm unit storage volumes required for the Study Area.

Final Environmental Implementation Report Mount Pleasant Sub-Area 51-1
September 2011
4-31
Consistent with HFSWS recommendations, with the exception of the SWM facility south of the CNR and SWM F-1, Regional Storm flow control will be provided within the East Huttonville Creek new channel corridor as opposed to within the proposed end-of-pipe SWM facilities. The existing Regional Storm peak flow at the CNR crossing has been identified in the HFSWS (approximately 28.4m3/s). In order to match this existing flow target at this location, while discharging uncontrolled, post-development Regional Storm flows into the channel, flow control must be provided within the channel itself. The final NHS design has established a relative wide channel top width ranging from 45m to 100m that accommodates the meander belt, riparian storage, buffers, required servicing invert, natural channel design principles and Regional Storm flood protection. Based on these channel design characteristics, the typical channel cross-section is hydraulically efficient and there is excess freeboard that can accommodate additional storage and maintain flood protection. A review of the HFSWS Phase 1 Report (2007) concluded that the existing conditions hydraulic model and flow data accounted for flow routing effects inherent in the channel and significant floodplain storage in the City Park. For example, a flow reduction immediately downstream of the City Park indicated that significant floodplain storage was considered. This trend is visible for all return period events in Table 4.3.4.6 and Table 4.3.4.9 in the Phase 1: Subwatershed Characterization and Integration Report (2007). The inclusion of channel storage effects was confirmed by HFSWS analyses. The HFSWS approach involved a combination of monitored data and modelled HEC-RAS rating curves to establish the storage-discharge relationship for various channel sections to assess the peak flow routing. That is, the flow routing is based on the relationship between the channel storage and discharge from each channel section. The following section describes the methodology and analysis applied in this EIR to establish a corridor design for the East Huttonville Creek that adheres to the downstream target flows in the HFSWS Report. The proposed methodology was developed to meet the theoretical exercise originally proposed in correspondence reviewed with the CVC and the City (Urbantech, Feb 28, 2009). The general configuration of the corridor and the proposed crossings dimensions were originally established using a static version of the HEC-RAS model developed with target outflows from the proposed development and surrounding drainage area. The purpose of this exercise is to determine whether:
• there are additional adjustments to the corridor required to ensure that there
is sufficient flood storage and;
• there is additional storage required with the post development conditions in order to meet these target flows.
This analysis was completed utilizing the dynamic version of the HEC-RAS model. The methodology uses full hydrographs from all nodes and routes these flow conditions through the corridor to determine the true effect of the channel configuration and backwater at any structures. The dynamic version of HEC-RAS establishes a rating curve for each cross-section in the pre-processor prior to initiating the modelling of the flows. The energy balance is completed for each section for each time step in the hydrographs that are introduced.

Final Environmental Implementation Report Mount Pleasant Sub-Area 51-1
September 2011
4-32
This provides a more complete routing of the flows through the corridor and bridge structures. Post-development Regional Storm flows input to the dynamic model were generated utilizing a Visual OTTHYMO. This model identifies the input points for various developments with the proposed outlets from SWM facilities that will be constructed. These nodes were linked by ‘Route Channel’ commands to establish a preliminary indication as to how the corridor would route flows. The following analysis for the Regional Storm event reviews how the corridor and various crossings function during a Regional Storm event that is routed through the HEC-RAS model. This analysis has been developed by first reviewing the Visual OTTHYMO model utilized to determine the flow conditions for each neighbourhood and SWM facility. This model was adjusted to run the Regional Storm event by setting the internal CN value for the pervious portion in the urban catchments to AMCIII conditions. The premise is that modelling the last 12 hours of the Hurricane Hazel event would occur with saturated soil conditions in the pervious portion of each urban catchment. Since there is 48 hours of rain prior to this 12 hour event, there is a possibility that the SWM facilities are partially or completely full. The conservative method is to set the facility with an overflow equivalent to the peak flow from the catchment during the Regional Storm event. These hydrographs were generated from the urban catchments and not routed through the SWM facilities. The Regional Storm event hydrology model is provided in Appendix D-6. The hydrographs were introduced directly into the HEC-RAS model at the key nodes and the dynamic version of the model was run. Two model scenarios were assessed to determine the impacts of road crossings on flood routing – one with road crossings and one without road crossings. Table 4.8C summarizes the flow conditions at each node, both upstream and downstream of each of the main crossings for both future conditions with and without the crossings. Drawing 4.8.4 presents the model flow schematic. The road crossings proposed do not exert a significant backwater effect due to the size of the structure and the height of the crossing above the invert of the channel. The floodplain resulting from the “steady-state” simulation for the proposed channel is indicated on Drawing 4.8.4.

Final Environmental Implementation Report Mount Pleasant Sub-Area 51-1
September 2011
4-33
Table 4.8C Regional Storm Flows and Flood Levels With and Without Crossings in Place
Control
Location
Regional
Peak in flow
(m3/sec) and
(location)
HEC-
RAS X-Section
Dynamic w/Culvert Dynamic w/o Culvert
Routed Flow
m3/sec
Water Elevation (m)
Routed Flow
m3/sec
Water Elevation (m)
1 9.66
(4583.407) 3106.196 9.46 252.97 9.47 252.91
Wanless Dr 3053.69 9.45 252.73 9.47 252.7
3027.69 9.45 252.4 9.46 252.46
2 8.27
(1977.846) 1951.412 16.46 247.94 15.49 247.89
3 5.26
(1688.005) 1651.891 21.44 246.97 19.36 246.55
Sandalwood Pkwy
1566.45 21.42 246.79 18.95 246.24
1529.44 19.59 246.35 18.44 246.18
Spine Rd 935.183 18.06 244.35 13.42 244.28
909.182 18.06 244.24 13.41 244.18
4 7.20
(558.4685) 551.538 22.7 242.96 17.67 242.56
5 6.06
(320.0993) 291.6864 25.64 242.77 21.94 241.52
CNR 99.5652 25.55 242.73 21.88 240.48
90.2173 25.55 240.55 21.88 240.48
The dynamic version of the HEC-RAS model indicates that there is little routed effect behind the culvert crossings upstream of the CNR crossing. There is, however, a marked routed effect at the CNR crossing. The proposed culverts are quite efficient in passing the Regional Storm flows. The lower peaks with the “without-culvert” dynamic HEC-RAS model option could be explained with the more efficient movement of the flows at a slightly different timing than some of the input flow hydrographs from the SWM outlet points. This resulted in a lesser opportunity for the convergence of peaks and therefore the flow differences are slightly lower. The important observation to be made with the no culvert option is that there is some efficiency achieved in the flow routing through the corridor but the peak flow is not exceeded at the CNR crossing that has been used to establish conditions further downstream. The target flow condition established in the HFSWS is 28.4m3/sec. Without the CNR crossing in place, the peak flow at this location is 25.5m3/sec and is less than the target flow. The hydraulic modelling downstream of the CNR crossing has been completed utilizing the static version of HEC-RAS with unattenuated peak flows; therefore the condition established for the corridor upstream of the CNR crossing is satisfactory.

Final Environmental Implementation Report Mount Pleasant Sub-Area 51-1
September 2011
4-34
This analysis confirms that the online storage in the channels will meet HFSWS flow targets at the CNR. The review of Regional Storm water levels with the culverts in place confirms that the Regional Storm storage will be contained within the NHS limits. The details of the Dynamic HEC-RAS analysis were provided at the May 11, 2011 EIR workshop with the CVC and the City. A technical submission was provided to the CVC on May 27, 2011 providing the analysis including the Dam Break scenarios. Subsequent to the May 11 2011 workshop, MNR provided their position that the proposed stream corridor crossings would not act as dams and a permit under the Lakes and Rivers Improvement Act (LRIA) will not be required for the proposed road crossings of the NHS where there is some attenuation of Regional Storm peak flows. However, the detailed design of the stream corridor crossings will address both structural and geotechnical stability of these crossings, but will not be designed as dams. As required in the HFSWS, all structures supporting Regional Storm on-line storage (i.e., all crossings from Wanless Drive to the CNR inclusive) will be designed to be functionally stable.
4.9 Flooding of Woodlands and Wetlands
As previously discussed, the East Huttonville Creek will be realigned through Sub-Area 51-1. In some locations, the creek will be realigned to locations adjacent to wetland and woodlands; in other locations, it is being realigned to locations away from wetlands/woodlands. Potential impacts of channel realignment and design of flooding conditions within wetlands and woodlands were assessed to identify existing and future flooding conditions in these features. Where channels currently are or will be adjacent to woodlands/wetlands, existing and proposed flood levels for the 5 year, 100 year and Regional Storm were calculated and compared. Drawings 4.9.1, 4.9.2 and 4.9.3 present existing and proposed floodlines in these locations. Review of water level changes and channel design concludes that:
• W1, W2 and W3 – The East Huttonville Creek does not currently drain through or adjacent to these wetlands. These wetlands are located in the Fletcher’s Creek subcatchment. Design of the East Huttonville Creek realignment to the west side of Mayfield Woodland A will contain all flows in the future channel and not outlet to or flood W1, W2 or W3. While these wetlands do not receive any surface water from the East Huttonville Creek, the channel realignment in this location will direct some drainage from agricultural fields west of these wetlands (that currently drain into these wetlands) southerly in the new channel. Hence, channel realignment will alter drainage patterns in the contributing surface water catchment area of these wetlands. Section 6.6 addresses changes to surface water inputs to wetlands including mitigation measures in these areas, where needed.
• W4 – The East Huttonville Creek currently drains through a portion of Mayfield Woodland A and a portion of W4. This area has been altered in the past as part of agricultural practices to create a defined channel through this woodland. This deeply incised channel has been dug and drains the wetland. Review of the floodlines in this location (refer to Drawing 4.9.1) illustrates that this dug channel has the capacity to convey the 5 yr storm event. During the 100 yr and Regional Storm events, the channel capacity is exceeded and some areas within the wetland and woodland will flood.

Final Environmental Implementation Report Mount Pleasant Sub-Area 51-1
September 2011
4-35
At the request of the MNR and the CVC, the realigned East Huttonville Creek will drain around Mayfield Woodland A. As a result, flooding conditions in localized portions of this wetland will be altered. Under future conditions, there will be no flooding of this area from the East Huttonville Creek. This was the objective of moving the creek around the woodland, as requested by the MNR and the CVC. Drawing 4.9.1 illustrates anticipated changes to floodlines through the woodland.
• W5 and W6 – The East Huttonville Creek does not currently drain through these wetlands; it is located to the east of W5 and W6, east of Mayfield Woodland B. Design of the East Huttonville Creek realignment to the east side of Mayfield Woodland B will contain all flows in the future channel and not outlet to or flood W5 and W6. The creek alignment in this location does not affect any drainage within the surface water catchment areas of W5 or W6.
• W7 – The East Huttonville Creek currently flows through the easternmost portions of W7 and provides an outlet for drainage from W7. The creek in this location is a well-defined channel dug in the past to facilitate agricultural drainage from the adjacent farmed fields. Realignment and lowering of the creek in this location will shift the creek low flow channel easterly away from the edge of W7, although, the existing creek channel will be maintained to continue to provide an outlet for W7. Changes to the creek and flooding conditions along the edge of this wetland were identified conceptually during discussions with the City, MNR, CVC and DFO through the HFSWS workshops, held in the fall of 2009 prior to Agency acceptance of the NHS design. Hence, changes to flooding conditions were acknowledged to be part of the NHS design.
Drawing 4.9.2 illustrates existing and future floodlines adjacent to W7. As illustrated, the existing channel has capacity to contain 5 yr flows with essentially no flooding of W7 outside of the channel. During the 100 yr and Regional Storm events, some flooding of the eastern portion of W7 is expected. Drawing 4.9.2 also provides future 5 yr, 100 yr and Regional Storm floodlines. As expected, frequent flows from upstream areas will no longer drain to the existing channel as they will be contained in the realigned channel to the east of W7. Channel lowering in this location is not substantial (in the order of 0.5m) and hence, flooding levels from the creek will not be substantially lowered. During less frequent flood events, flooding from the channel into the eastern portions of W7 will persist, although smaller areas will be flooded. These alterations to the flow conditions in W7 are consistent with discussions of implications to this wetland with Agencies in the past.
• W8 – The East Huttonville Creek does not currently drain through and is not located adjacent to this wetland. As set out on Drawing 4.9.2, design of the East Huttonville Creek realignment to the east side of Sandalwood Woodland will contain all flows in the future channel and not outlet to or flood W8.
The channel realignment in this location will direct some drainage from agricultural fields northeast of W8 (that currently drain into W8) southerly in the channel located east of W8. Channel realignment will alter drainage patterns in the contributing surface water catchment area of these wetlands. Section 6.6 addresses changes to surface water inputs to wetlands including an assessment of mitigation requirements.

Final Environmental Implementation Report Mount Pleasant Sub-Area 51-1
September 2011
4-36
• W9 – The East Huttonville Creek does not currently drain through and is not
located adjacent to this wetland. Design of the East Huttonville Creek realigns it to the east side of Sandalwood Woodland and largely east of W9 (with exception of small eastern portion of wetland). Channel design contains all flows in the future channel and will not outlet to or flood W9.
• W13 – The East Huttonville Creek, through the City Park, abuts the northern edge of W13b. Ditches constructed for agricultural purposes in the past exist along some boundaries of W13b and W13a. Under existing conditions, portions of the City Park and these wetlands are flood vulnerable during frequent and infrequent flood events. Drawing 4.9.3 illustrates the 5 yr, 100 yr and Regional Storm floodlines. The realignment of the East Huttonville Creek, from its current location through the City Park to its proposed location along the western park boundary, will alter drainage conditions through the park and adjacent to these wetlands. As illustrated on Drawing 4.9.3, channel realignment will reduce frequent flooding conditions along some of the ditches surrounding these wetlands. Only minor changes in the extent of flooded area results during infrequent flooding events. The City is interested in reducing frequent flooding conditions through the park, while the CVC and the MNR are interested in introducing more drainage to W13. With respect to any measures to restore hydrology of these wetlands, the City is also concerned that increased flows may negatively impact the proposed surrounding neighbourhoods and current and future park programs and functions, through creation of increased standing water and its associated effects. Refer to Section 6.0 for further discussion on changes to potential changes to wetland hydrology adjacent to the City’s Park.
Final Environmental Implementation Report Mount Pleasant Sub-Area 51-1
September 2011
5-1
5.0 NATURAL HERITAGE RESTORATION
5.1 Proposed Natural Heritage System – Input from Background Studies
5.1.1 Subwatershed Study As part of the Subwatershed Planning Process, the HFSWS Phase 2 and 3 Reports
assessed the 3G Plan NHS to determine if the HFSWS Phase 2 target for each of the indicators were met within the Mount Pleasant NHS. As described in the HFSWS, some
of the terrestrial indicators and measurable parameters include:
• Riparian Cover 1 – width of riparian buffer;
• Riparian Cover 2 – percent of stream length buffered;
• Forest Cover – increase in “natural cover”;
• Wetland Cover – increase in wetland cover; and,
• Interior Forest/Core Habitat – increase in interior forest.
The NHS terrestrial parameters, identified in HFSWS Phase 2, were subsequently assessed against their target values. The terrestrial parameters and targets were
grouped into two categories:
1) Protect/Restore: riparian cover, natural cover, wetland cover, interior forest and
new natural areas; species at risk (Redside Dace and Bobolink), and vegetation communities; and
2) Corridors/Linkages: new natural corridor and linkages, Landscape Scale Analysis
(LSA) principles (protect, improve, inform), LSA connections and Mayfield West linkages.
The HFSWS Phase 3 concluded that the Mount Pleasant NHS met all of the terrestrial targets, including an increase from 7.9% to 16.9% natural cover on the landscape. The
3G Plan was assessed as addressing the functional protection and integration of forests
and wetlands. Furthermore, the “Linked Green Block” approach was assessed as protecting and reinforcing core features and providing substantial corridors, coupled with
functionally supportive land uses.
5.1.2 EIR Workshops Through the EIR process, workshops have been held with the CVC, the MNR and the City
which has resulted in refinements regarding wetlands in the NHS. North of Sandalwood Parkway, Waterfowl Wetland #1 will not be created; instead W9 will remain on the
landscape as per the desires of the CVC and the MNR. Overall, the final NHS will, as did the SPNHS, provide a significant increase in wetland cover.

Final Environmental Implementation Report Mount Pleasant Sub-Area 51-1
September 2011
5-2
5.2 Regional Landscape Context
The Mount Pleasant Study Area in NWB is situated at the interface of Canada’s two southernmost forest regions: the Deciduous Forest Region and the Great Lakes-St.
Lawrence Forest Region (Rowe, 1959).
The Niagara Section of the Deciduous Forest Region covers the southernmost parts of
the Ontario peninsula from Windsor to beyond Toronto, as a narrow band on the north shore of Lake Ontario. Broadleaf trees dominate forest stands in this region. The main
association is that of beech and sugar maple, but numerous other species are associates,
including white ash, red maple, black cherry, shagbark hickory, basswood, and red, white and bur oak. In wet areas, the dominant species include silver maple, swamp maple, red
maple, and white elm. The region’s further characteristic is the presence of several species, which have their northern limits of geographical distribution in Ontario,
commonly referred to as Carolinian, for example tulip tree, paw-paw, Kentucky coffee-tree, and black gum, however, these trees do not reach into the Brampton area.
Forests of the Huron-Ontario Section of the Great Lakes/St. Lawrence Forest Region, in contrast, contain a much greater proportion of coniferous species and are generally
mixed in nature, although sugar maple and beech are common over the whole area. The softwoods include white pine, red pine and eastern hemlock, whereas those of still more
northern affinity are white spruce, black spruce, balsam fir and tamarack.
5.2.1 Landscape Scale Analysis of Current and Potential Wetlands in CVC and TRCA Jurisdictions
Using the GIS, landscape level opportunities for wetland restoration in the CVC and the
TRCA jurisdictions were identified by Gartner-Lee (2005) in a report entitled Identification of Site for Wetland Creation in the TRCA and CVC. Following this study, CVC has developed, in collaboration with Dougan & Associates, a document called Wetland Restoration Strategy (2009), for the area of the Credit River watershed. This report provides guidance and sets priorities on wetland rehabilitation and restoration, based on
analyses, classification, rankings and mapping of existing wetlands and potential areas. Through the GIS, the results were summarized as subwatershed maps illustrating
existing features, restoration priority areas and wetland targets.
All subwatersheds within the City were identified as "High Subwatershed Priority for
Improved Wetland Services". The Strategy Vision was summarized as striving to create “flourishing, diverse, low maintenance wetlands throughout the Credit Valley watershed providing valuable ecological services that contribute significantly to the health – economic, social and ecological – of the watershed”. That report identified the priority functional needs for both the Huttonville Creek and Fletcher's Creek as water quality improvement, flood attenuation, NHS improvement and social functions. The Strategy
Vision’s listed principles and goals are similar to those proposed for NHS design and
restoration in Block 51-1. These common elements include, for example: priority to protect existing wetlands, emulation of natural wetlands and landscape processes,
restoration to hydrological function, and improving the ecological health of wetlands.

Final Environmental Implementation Report Mount Pleasant Sub-Area 51-1
September 2011
5-3
5.2.2 Local Landscape Context NWB is an urbanizing rural area. The Mount Pleasant lands are a mosaic of agricultural
fields, human settlements and remaining, largely isolated woodlands, mostly located within valleylands, less frequently on tablelands. The woodlands are generally composed
of various treed swamp communities, with dominant species being swamp/silver maple
and green ash and associates such as shagbark hickory and elm. Forested upland sites are covered by sugar maple, beech, hickory, black cherry, white ash and hemlock. Shrub
wetlands are composed of small associations of dogwoods (red-osier, grey and silky), willows, and occasionally meadowsweet. Open meadow marshes are primarily
dominated by reed-canary grass, sedges, tall white aster, jewelweed, spotted Joe-pye-
weed, and several other forbs and graminoids.
5.2.3 Existing and Future Wildlife Features and Functions
The existing woodlots that form the basic framework for the proposed north-south corridor, while generally small and somewhat degraded, still contain many valuable
natural characteristics. These forest blocks vary in age and species composition, but
collectively contain a fairly broad selection of deciduous forest types normally found in this area.
Connecting these forest blocks will add to the area of available habitat and will create
opportunities for increased species and community diversity (e.g., establishment of a
conifer component). Over time, the larger forest area will not only increase the numbers of existing birds and wildlife using this area, but should also result in enhanced species
movement patterns through the more connected natural systems. The connection of these habitats will allow for a north/south movement corridor for common small and
medium size mammals that benefit from connected forested corridors.
During the early stages of the establishment of the NHS and especially in areas currently
tilled, succession and plantings will provide substantial areas of meadow and thicket which will favour bird species that are less common (e.g., Cuckoos, Brown Thrasher,
Eastern Towhee, Field Sparrow, and Orchard Oriole). All natural systems are evolving in nature and are not static. Over time, as succession advances, those open habitats in
areas targeted for forest cover will become more suitable for forest species as they shift
away from meadow and thicket.
5.3 Reference Landscape for Restoration The proposed NHS restoration will be modelled on the landscapes presently characteristic
of similar areas within Site District 6E-7. It will establish vegetation and habitat types that will match the natural patterns of forests, wetlands and open habitats, such as
various meadows and thickets. The success of the restoration effort will thus be measurable by the degree of similarity of habitat features and functions within the NHS
and comparable areas in Site District 6E-7.
The restored ecosystems will, in the general sense, contain the full suite of structural and
functional groups typically present in referenced ecosystems, such as primary producers, herbivores, carnivores, decomposers, pollinators, etc. The flows of matter and energy
(e.g., nutrient cycling, trophic interactions) will be facilitated by the restored landscape
cores and linkages. Species and functional redundancy will be ensured by multiple species in each group. This will create a self-sustaining system that is also resilient to
the normal range of variation of environmental stresses and disturbances.

Final Environmental Implementation Report Mount Pleasant Sub-Area 51-1
September 2011
5-4
5.4 Natural Heritage System Objectives
In this EIR, the NHS design objectives include:
1) Protection: to protect important natural heritage areas and functions.
2) Enhancement: to increase the level of functions, features and linkages over the
existing fragmented and patchy landscape.
3) Linkage: to establish a linked system of features and functions in the NHS and,
where feasible, to facilitate linkages with key features and functions external to the NWB area.
4) Resilience: to promote resilience to effects expected, associated with the level
of urbanization proposed (i.e., expected changes in surface and storm flows).
5) Sustainability: to create a dynamic stable system that will evolve, including
natural regeneration.
6) Integration with urban uses: to provide opportunities for passive and complementary recreation and provide a trail system that links community
destinations, supports active transportation and development of a healthy
community. Elements of infrastructure, such as trails, servicing, roads and SWM facilities will be integrated in/with the NHS.
7) Restoration: to replace features and functions where natural and/or created
features (wetlands and non-wetlands) are proposed for removal, as part of and
to optimize balanced community design objectives. Efforts will be directed towards the generation of a net gain in environmental features and functions.
8) Diversity: to increase native community and species biodiversity on the
developed landscape.
9) Efficiency: to ensure investments in the NHS optimize outcomes, given the
many other important and competing needs.
10) Balanced: to balance NHS design with other factors such as planning, trail design, transportation and transit, recreation, neighbourhood connections and
interactions, and urban design and housing objectives.
5.5 Restoration Principles This NHS restoration plan was guided by numerous primary and secondary literature
sources, including, but not limited to:
• The Society of Ecological Restoration (SER) International Primer for Ecological
Restoration (SER 2004);
• The Society for Ecological Restoration International Guidelines for Developing
and Managing Ecological Restoration Projects (SER 2005);
• What is Good Ecological Restoration?, in Conservation Biology (Higgs, 1997);

Final Environmental Implementation Report Mount Pleasant Sub-Area 51-1
September 2011
5-5
• Restoring Nature’s Place (Daigle and Havinga, 1996);
• Nature by Design (Higgs, 2003); and,
• Defining the Limits of Restoration: The Need for Realistic Goals, in Restoration Ecology (Ehrenfeld, 2000).
The choice of plant species for restoration has been guided by the CVC’s current plant checklists. Generally, and specifically for the SWM pond locations, the selection is based
on the following criteria:
• native and occurring within the CVC’s jurisdiction;
• common to frequent within the CVC’s jurisdiction;
• inclusive of plants species with less specialized habitat requirements (i.e.,
coefficients of conservatism <8);
• consistent with plant selections as per the CVC’s thermal mitigation applications;
and,
• consistent with the CVC’s Stormwater Management Facility Planting Guidelines
(2003).
Depending on the staging of the creation of the NHS, large quantities of native plant material may be required in a short time span; therefore multiple native plant commercial
suppliers may be needed. The Society of Ecological Restoration Ontario has developed a
Growers and Buyers Guideline and the principles in this guideline will be followed when selecting native plant growers.
It is expected that an important element in the long-term maintenance of the NHS will be
the involvement of local residents. Stewardship initiatives would include, for example,
trail and boardwalk maintenance, signage, control of pet access, trash removal, etc.
5.6 Envisioned Natural Heritage System
5.6.1 Planned Features The NHS will create several new ecosystem types and areas, including:
• upland and lowland forest;
• thicket and forested swamp;
• upland meadow and meadow marsh;
• open water wetland; and,
• riparian channel communities.
Some of the existing wetlands (W10, W11, W12, W14 and W48) will be removed;
however their functions will be replicated within the constructed open water/marsh wetland area south of new Sandalwood Parkway, as well as the created wetlands in the
new East Huttonville Creek corridor.

Final Environmental Implementation Report Mount Pleasant Sub-Area 51-1
September 2011
5-6
The final NHS will provide a net gain in ecological features and functions over the
existing conditions. Some benefits include:
• realignment and creation of natural creek morphology and
vegetation communities;
• natural corridor connecting with the Main Huttonville Creek and
the potential to connect to a tributary of the Etobicoke Creek,
north of NWB, in Mayfield, in the future;
• surface water storage and conveyance;
• increase in overall natural cover;
• increase in interior forest habitat;
• increase in wetland cover;
• increase in diversity of native flora, fauna and vegetation
communities;
• amphibian breeding habitat;
• improved fish habitat (foraging, spawning, rearing, refuge, etc.)
for the tolerant warmwater fish community, as well as providing improved fish passage from the existing Redside Dace habitat
downstream of the CNR, upstream to the regulation habitat extending to Wanless Drive. The channel will incorporate
various design metrics that are suitable for Redside Dace
habitat. These include the use of bioengineering, riparian plantings and meeting other Redside Dace criteria (such as
width/depth ratios, riffle gradients, substrate materials) which will be detailed in the final design; and,
• migratory breeding, rearing and feeding habitat for waterfowl.
5.7 Proposed Restoration Design The following are conceptual presentations of vegetation types and wildlife habitat to be
restored within the NHS. The final NHS design will be completed during the detailed
design stage. In some locations, further review of design options will be completed as part of detailed design. Any resulting changes to design approaches may require
changes to the restoration discussions outlined in this section of the EIR.
From north to south, the Vignettes are:
• Vignette 1, Drawing 3.4.6: from Mayfield Road to Wanless Drive;
• Vignette 2, Drawing 3.4.5: from Wanless Drive to south of Buick Boulevard;
• Vignette 3, Drawing 3.4.4: from south of Buick Drive to the City Park Woodlands;
• Vignette 4, Drawing 3.4.3: between the City Park Woodlands and
TCPL to the CNR.
Final Environmental Implementation Report Mount Pleasant Sub-Area 51-1
September 2011
5-7
The proposed vegetation cover types and areas, within each Vignette, are organized
according to the major categories/feature codes listed in each of the Vignette’s legend.
Throughout the entire realigned channel (as described previously within Section 4.0), numerous habitat improvement areas are planned in the floodplain, including seasonally
connected floodplain pools (for fish habitat), amphibian pools, hummocky topography
and low knolls. Within the channel itself, low rise berms will occur at selected points perpendicular to the flow, and these will serve as minor “hydraulic speed bumps” that
will back up water in the immediate area upstream of each berm. Downstream of the new Sandalwood Parkway, and particularly south of TCPL, the ability to create riffle and
pools sequences will increase as the volumes of water within the realigned East Huttonville Creek gradually rise with the bringing on-line of SWM pond discharge. Refer
to Section 4.0 for details on channel and floodplain design elements. A description of the
vegetation communities within the channel, amphibian pools and seasonally flooded pools is described in the sections below.
Renderings of the west-east cross-sections in two locations within the NHS have been
drawn to illustrate how the features will look on the landscape in terms of length, slope
and vegetation communities present (refer to Drawing 5.7.2). The first cross-section (A-A’) is located in Vignette 3 and the second (B-B’) in Vignette 4; these are described in
Sections 5.7.3 and 5.7.4 herein.
For each new feature (i.e. Area 1a, Area 4a) described below, a detailed phasing plan at will be prepared at detailed design stage, that includes consideration of site-specific
conditions related to grading, soil growing conditions, crop cover, seeding, initial
maintenance, invasive species management, etc. In 2011, agricultural crops were documented for all land parcels within Block 51-1. The need for soil testing, as part of
the detailed phasing plan for each new feature will be determined based on current and recent past specific crop uses in the NHS.
5.7.1 Vignette 1 - Mayfield Road to Wanless Drive
As illustrated on Drawing 3.4.6, the restoration for this portion of the NHS will build on the existing, relatively large Mayfield Woodland A on the south side of Mayfield Road. An
agricultural field currently separates Mayfield Woodland A from the smaller Mayfield
Woodland B at its south end. The restoration will install forested communities in this agricultural field.
The East Huttonville Creek, currently the Clark Drain, will be realigned adjacent to the
west side of this new larger woodland and will travel through the former agricultural field area, before heading south towards Wanless Drive. The old creek alignment, through
the south end of Mayfield Woodland A, will be restored to natural topographic conditions
to improve hydrology to W4. The vegetation in the East Huttonville Creek will be comprised of forested side slopes and floodplain.
5.7.1.1 Feature 1a: New Woodlot/Forest Restoration
Presently, Mayfield Woodlands A and B have an abundance of large trees and, while they are narrow in places, they still contain a number of interesting features, including the
presence of several birds typically considered “forest interior” species, (e.g., Hairy and Pileated Woodpecker, Eastern Wood-Pewee, and Wood Thrush). The larger trees also
contain natural cavities that can provide nesting sites for Wood Duck and Eastern
Screech-Owl.

Final Environmental Implementation Report Mount Pleasant Sub-Area 51-1
September 2011
5-8
Connecting the two woodlands, through Area 1a and Woodland Channel 1c (described below), will increase the width of the new connected forest block, and will provide the
potential for an increase in the abundance and diversity of species. The proposed patch size increase may attract additional area sensitive bird species that are able to persist in
an urbanizing environment. The addition of a coniferous component may attract other
forest warblers such as Black-throated Green or Pine Warbler.
During the early stages of restoration, the shrubby areas will become a suitable nesting or feeding site for edge and second growth species such as Black and/or Yellow-billed
Cuckoo, Gray Catbird, Eastern Kingbird, Field Sparrow, and Eastern Towhee.
Target community types: The existing Mayfield Woodland B is characterized as an
ELC type FOD7-2 (Fresh-Moist Ash Lowland Deciduous Forest) and contains two green-ash swamp communities (W5 and W6).
Forest recreation adjacent to Mayfield Woodland B, where topography and moisture are
similar to those inside the woodlot, will have a cover of Silver, Red and Swamp Maple,
together with basswood and elm.
On the sloped portion and away from the woodland’s edge, where moisture levels will likely decrease, there will be opportunities to establish a forest generally dominated by
sugar maple, with its various associates (ELC Ecosite FOD6, Fresh-Moist Sugar Maple Deciduous Forest). Maple co-dominants would include white elm, basswood, shagbark
hickory, beech, yellow birch, red maple and bur oak, as well as groups of conifers:
hemlock and white pine.
Phases: The target communities will eventually establish themselves after a period of at least 40 years. The nursing crop will be dominated of early-successional covers of
poplar-ironwood-white birch, with a shrub understorey of grey dogwood, nannyberry and
elderberry. Within this prevailing matrix, later-successional species, such as sugar maple and beech will be simultaneously planted in order to jump-start vegetation development.
Life forms: Trees 80%, shrubs 10%, herbs 10%.
Intended functions: The forested connection of Mayfield Woodland A and Mayfield Woodland B will add to the overall forest cover in the local area. With the forest
connection proposed between Mayfield Woodland A and Mayfield Woodland B, there will be a reduction in edge habitat and an increase in local vegetation diversity. Some
additional habitat will be provided for more wildlife and plant species.
5.7.1.2 Area 1c: Woodland Channel between Mayfield Woodlands A and B
Target community types: The woodland channel will be situated adjacent to the west side of Mayfield Woodland A and will bend around it at the south end to follow the eastern side of Woodland B to the Spine Road. Mayfield Woodland A currently consists
of the predominant cover of ELC Type FOD9-4 (Fresh-Moist Shagbark Hickory Deciduous
Forest), FOD5-6 (Dry-Fresh Sugar Maple-Basswood Deciduous Forest) and SWD3-3 (Swamp Maple Mineral Deciduous Swamp), the latter in four separate patches.
The treed communities within the channel will complement and enlarge the suite of
forest and swamp cover types currently present. The channel will contain a central flat

Final Environmental Implementation Report Mount Pleasant Sub-Area 51-1
September 2011
5-9
portion, but with a very limited bed and bank morphology, with the two sides sloping up
to existing grade.
The narrow central portion is expected to remain moist for long enough periods to support a lowland forest in which silver maple, red maple, swamp maple, white elm,
basswood and shagbark hickory would grow. A small number of fish and amphibian
habitat pools will be created within the channel.
On the drier slopes, the proposed cover types include various sugar maple-dominated stands, with admixtures of red oak and other hardwoods (black cherry, beech, bitternut
hickory) together representing ELC Ecosite FOD5 (Dry-Fresh Sugar Maple Deciduous Forest).
Phases: These mature forest communities, will fully develop only after a period of 40-50 years. The early-successional plantings of red-osier (ELC type SWT2-5) and willow
(SWT2-2) thicket swamps within the channel, and grey dogwood thicket on the slopes will contain, from the onset, most of the tree species characteristic of the mature forests,
such as silver, red and swamp maple, together with basswood and elm in order to
accelerate vegetation succession.
Life forms: Shrubs 70%, trees 30%.
Intended functions: The restoration will provide a continuously vegetated channel alongside existing main forest patches, thus increasing the treed area at that location. It
will connect Mayfield Woodlands A and B and reduce the amount of edge habitat. It will
provide habitat for a diversity of wildlife and plant species. In wetter years, amphibian pools will attract frogs and mammals such as Muskrat and Mink, as well as birds like
Eastern Screech-Owl and Northern Waterthrush.
5.7.1.3 Area 4c: Grassland Channel
The East Huttonville Creek, between Mayfield Road and Buick Drive, is designed with a
shallow low-flow channel and wide floodplain. Water will be present in this low-flow channel and floodplain following spring freshet and summer and fall rain events. The
amount of water in the channel and its residence time is dependent on whether it is a
wet or dry year. Therefore, frequent drying periods can be expected, and instead of meadow marshes normally typical in floodplains that receive water year-round,
herbaceous-forb meadows and moist thickets of dogwoods, willow and nannyberry will cover the bottom of the channel.
Target Community Types: Forb Mineral Meadow Marsh (MAM2-10), Willow Mineral
Thicket Swamp (SWT2-2); Red-osier Dogwood Mineral Thicket Swamp (SWT2-5), Gray
Dogwood Mineral Thicket Swamp (SWT2-9) and Nannyberry Mineral Thicket Swamp (SWT2-10).
Phases: No phases or nurse crop vegetation will be required.
Life forms: Graminoids 20%, forbs 40% and shrubs 40%.
Intended Functions: The channel and its floodplain, because of its width and length, will provide habitat for numerous plant and wildlife species (fishes, amphibians, riparian
and open habitat birds, small mammals, insects and other invertebrates).

Final Environmental Implementation Report Mount Pleasant Sub-Area 51-1
September 2011
5-10
The floodplain, with areas of open herbaceous wetlands, scattered scrubs and pools, will
provide habitat, which will be attractive to Common Yellowthroat and Red-winged Blackbird, but could also attract less common species like Sedge Wren. The scrubby
borders will likely be used by species such as Eastern Kingbird, Yellow Warbler and perhaps Swamp Sparrow. It is likely that mammals will utilize this grassy channel as part
of a movement corridor, especially for water-oriented species like Muskrat and Mink.
Over time, these riparian grassland zones in the upper reaches north of Wanless Drive may benefit Redside Dace and other fish species in downstream reaches by encouraging
use by insects and providing nutrients/food to these areas.
5.7.2 Vignette 2 - Wanless Drive to South of Buick Boulevard As illustrated on Drawing 3.4.5, this portion of the NHS restoration will extend and
connect the existing wetlands and woodlands on the south side of Wanless Drive. The major restoration feature will be the Grassland Channel.
5.7.2.1 Area 4c: Grassland Channel
The East Huttonville Creek, between Wanless Drive and Buick Drive, has a shallow low-flow channel and will experience dry periods; vegetation communities in the grassland
channel will be as described in Vignette 1. South of Buick Drive, a typical channel form is planned and higher volumes of water flowing through the channel will translate into an
active, meandering system.
Target community types: Various wetland cover types would be established within the channel and floodplain, with upland types on the slopes. The seasonally connected floodplain pools, acting as fish habitat connected to the main creek via permanent
individual channels, will have mostly open, submerged aquatics types, such as SAS1-1 (Pondweed Submerged) and SAS1-4 (Water Milfoil). Within the remainder of the
floodplain, depending on moisture conditions and substrate, the possible cover types will
include Meadow Marshes, such as MAM2-2 (Reed-canary Grass), MAM2-3 (Red-top), MAM2-5/6 (Narrow- and Broad-leaved Sedge), MAM2-9 (Jewelweed) and MAM2-10
(Forb). In contrast, the shallower amphibian pools will be separated from the creek to prevent predation by fish. These pools will have open water vegetation similar to that in
the fish pools.
Near the base of the channel slopes, thicket swamps will be established, for example
SWT2-2 (Willow), SWT2-5 (Red-osier), SWT2-6 (Meadowsweet) and SWT2-8 (Silky Dogwood). On the channel slopes, grey dogwood thickets will be established. These,
with time, will naturally transition towards tree cover.
Phases: No phases or nurse crop vegetation will be required. Life forms: Open water areas: graminoids 50%, forbs 50%. Shrub areas: shrubs 80%,
herbs 20%.
Intended functions: The channel and its floodplain, because of its width and length, will provide habitat for numerous plant and wildlife species (fishes, amphibians, riparian and open habitat birds, small mammals, insects and other invertebrates).
The floodplain, with areas of open herbaceous wetlands, scattered scrubs and pools, will
provide habitat attractive to Common Yellowthroat and Red-winged Blackbird, but could
also attract less common species like Sedge Wren. The scrubby borders will likely be

Final Environmental Implementation Report Mount Pleasant Sub-Area 51-1
September 2011
5-11
used by species such as Eastern Kingbird, Yellow Warbler and perhaps Swamp Sparrow.
It is likely that mammals will utilize this grassy channel as part of a movement corridor, especially for water-oriented species like Muskrat and Mink. The grassland riparian zone
in this reach will be particularly suitable for Redside Dace, should they ultimately colonize the upper portions of East Huttonville Creek. These reaches will be designed to
ultimately provide overhanging banks and grassland vegetation that are favoured by the
Redside Dace and the prey insects that they feed upon. These grassland channels will also be suitable to the range of tolerant warm water fish that are known to presently
inhabit East Huttonville Creek.
5.7.2.2 Area 4a: Grassland Creation
There is opportunity for enhancing the current cultural old-field meadows and agricultural
fields located between the reed-canary grass wetlands (W7a, W7c), on the south side of Wanless Drive.
Target community types: The proposed vegetation cover will be grassland and other upland open habitats. In the long term, if not maintained, through either mowing,
cultivation or burning (i.e., possible through community stewardship groups), shrub or treed communities will succeed in open areas.
There is no suitable ELC vegetation type that could be applied to the proposed area;
however the current cover of old field meadow with asters and goldenrods could be enriched with other native graminoids and forbs. The species to be utilized for these in-
plantings include tall, Canada and grey goldenrod, New England and other asters,
fleabanes, with possible graminoid species being the switch grass, blue-joint grass, little and big bluestem, and native sedges and rushes. Of the shrub species, bird “friendly”
hawthorns, “islands” of pines, white spruce and cedars should be maintained or planted, while aggressive exotics, such as buckthorn, strictly controlled or eliminated.
Phases: No phases or nurse crop vegetation will be required.
Life forms: Forb 50%, graminoid 40%, shrubs 10%.
Intended functions: The main ecological function will be provision of habitat for
common wildlife, in particular open habitat birds.
5.7.3 Vignette 3 - South of Buick Drive to the City Park Woodlands
This is the longest, widest, most diverse and ecologically important restoration area of Mount Pleasant. Some of the restoration units here are continuations of such areas
depicted on Vignette 2, while others are new types. As illustrated on Drawing 3.4.4,
the fundamental existing elements of the NHS here are the three remaining City Park woodlots, with their diverse swamps (W13) and upland forests. An important new
element will be the proposed open water/marsh wetland or alternative “semi-passive” wetland restoration proposed to be located east of the existing racetrack wetlands (W10,
W11, W12, and W48). These racetrack wetlands will be removed and replaced by the
wetlands within the East Huttonville Creek floodplain and the open water/marsh wetland, or the “semi-passive” wetland restoration as discussed in Section 5.7.3.5.
Cross-section A-A’ (Drawing 5.7.1) displays the contours and vegetation communities
present within the open water/marsh wetland; the shallow wooded slope between this
wetland and the East Huttonville Creek, which conveys water to the wetland in periods of

Final Environmental Implementation Report Mount Pleasant Sub-Area 51-1
September 2011
5-12
flooding; the wooded channel, a seasonally connected floodplain pool (fish habitat pool);
steeper wooded side slope, trail location and City Park property.
5.7.3.1 Area 4c: Grassland Channel
This feature will extend from the open water/marsh wetland to the CNR tracks at the
south end. The design, features and functions within this section of the channel are identical to the descriptions presented above within Vignette 2.
5.7.3.2 Area 1a: New Woodlot/Forest Restoration
This new forested connecting link will envelop the northern tip of existing Park
Woodland A and will extend to where it meets the forested East Huttonville Creek
Channel.
Target community types: This proposed area is low-lying and level, making it suitable as habitat for silver, red and swamp maple together with basswood and elm, and small
groups of hemlock and white pine.
Phases: Planted amongst the matrix of shrubs, such as red-osier dogwood, silky
dogwood, grey dogwood, willow and nannyberry, the forest tree species will be simultaneously planted, in order to speed up vegetation succession.
Life forms: Shrubs 60%, trees 40%.
Intended functions: The creation of Area 1a Woodland will add to the overall forest cover in the area and will contribute to a more complete wooded connected system. The
intention is to create a forested corridor between the Park Woodlands (A, B, and C) and Sandalwood Woodland.
5.7.3.3 Area 1c: Woodland Channel
The woodland channel will begin along the east side of Sandalwood Woodland and end adjacent to the open water/marsh wetland, where it will connect with the new forested
area on the east side of the East Huttonville Creek. The west slope of the East
Huttonville Creek, adjacent to the open water/marsh wetland, is very gradual (~3%) allowing water to flow from the channel and into the open water/marsh wetland during
spring freshet and summer and fall storm events. Target community types: The central portion will be covered by lowland deciduous forest comprised of silver, red and swamp maple, together with basswood, white elm,
and shagbark hickory. On the channel slopes, the possible cover types would include
various sugar maple-dominated stands, with admixtures of red oak and other hardwoods (black cherry, beech, bitternut hickory) similar to the ELC Ecosite FOD5 (Dry-Fresh Sugar
Maple Deciduous Forest).
Phases: The mature forest communities will fully develop after a period of 40-50 years.
Initially, within the shrub plantings of red-osier, willow and grey dogwood, most of the constituent tree species will be planted, to accelerate vegetation succession.
Life forms: Shrubs 70%, trees 30%.

Final Environmental Implementation Report Mount Pleasant Sub-Area 51-1
September 2011
5-13
Intended functions: The treed communities, within the channel, will complement and
enlarge the suite of forest and swamp cover types currently present. The restoration will provide a continuously vegetated channel alongside existing main forest patches, thus
increasing the treed area at that locality. It will reduce the amount of edge habitat and provide new habitat for wildlife and plant species. Establishing a forested connection
within the East Huttonville Creek corridor between the Sandalwood Woodland and the
City Park Woodlands will also facilitate the movement of wildlife between these two woodlands. Mammals are expected enjoy the greatest benefits of this forest connection,
but it will also aid the movement of herptiles and birds, especially forest species that might otherwise be hesitant to cross a non-forested area. While some mammals will
move freely between blocks, many others are less willing to leave their forest habitat, and then often only under the cover of darkness. Outdoor lighting associated with the
City Park to the east, residential development to the west and Sandalwood Parkway to
the north should be directed away from East Huttonville Creek. Wildlife movement will be directed from East Huttonville Creek through the use of directional fencing and along
the road and culvert design elements under Sandalwood Parkway. See Section 10.4.3 for a description of design elements to encourage/direct animal movement through the
culvert. The increase in actual forested area achieved through this habitat creation, as
well as the function of connecting the existing wooded areas together will also help build up the area available for species that currently occur here, thus increasing their numbers,
but may in time also permit growth in biodiversity as the joined blocks begin to function as one habitat unit. While it is difficult to predict exactly which species will be affected
the most by this habitat addition, it remains logical that species that are less tolerant of human activity and urbanized landscapes will see the greatest overall benefit.
5.7.3.4 Area 3: Open Water/Marsh Wetland
In the January 2011 EIR submission, a preliminary design of the proposed new open water/marsh wetland, located south of Sandalwood Parkway and east of the current
racetrack ponds, was proposed to replicate ecologic functions of the racetrack ponds.
Vignette 3, illustrated on Drawing 3.4.4, presents this open water wetland design. This report section addresses the restoration of this type of open water wetland design.
Through the review process of the January 2011 EIR, including a June 8, 2011 site visit to the location of the future open water/marsh wetland, the MNR suggested investigating
an alternative “semi-passive” wetland restoration method. Utilizing this alternate design
approach, the natural topography of the land would be maintained to the extent possible, along with berming and use of existing soils and seed bank to create a new wetland.
Based on the existing topography and engineering constraints posed by the Sandalwood
Road alignment and the realigned East Huttonville Creek, an alternative wetland restoration design to the January 2011 open water/marsh will be developed for
review/discussion at the detailed design stage. If the alternate design approach is
deemed preferred at detailed design, the restoration approach discussed below will be modified, as required, at detailed design.
Target community types: This restoration area will be newly established to compensate for the removal of the racetrack wetlands (W10, W11, W12 and W48). As
such, it presents significant opportunities for creative restoration. The detailed design stage will determine staging of creation of the new wetland and will include a rescue plan
for existing flora and fauna from the racetrack wetlands.
The racetrack wetlands are comprised of a small submerged aquatic community with cattail drainage channel (W10), a cattail mineral shallow marsh (W11), an open water

Final Environmental Implementation Report Mount Pleasant Sub-Area 51-1
September 2011
5-14
pond with a pondweed submerged shallow aquatic community, surrounded by cattail
mineral shallow marsh and an eastern appendage of creeping bent grass mineral meadow marsh (W12); and, a reed-canary grass mineral meadow marsh (W48). W12 is
connected to the existing East Huttonville Creek through a perched CSP (culvert). These wetlands were found to provide some locally important staging habitat for waterfowl and
breeding habitat for American toad, green frog, and northern leopard frog. Details on
existing wetland conditions on the racetrack ponds, and all other existing wetlands are provided in Section 6.0.
The overriding objective will be to create a dynamic and diverse complex of various
wetland types, which will promote or attract numerous wetland plants and wildlife. The wetland will be variable in terms of its shape, water depth and substrate types.
Peninsulas, bays and islands will increase the complexity of habitats for wildlife.
The open water/marsh wetland will receive water from the East Huttonville Creek
through the gradual slope on its eastern portion. The open water pond will be dug below groundwater level; the amount of groundwater input will depend on the surrounding soils
but is expected to be relatively minor (similar to the existing features). If the pond
excavation encounters only low hydraulic conductivity clays, silts and till, the groundwater inputs will be very minor. Groundwater inputs could be more moderate if
highly fractured tills or sand lenses are encountered. The open water/marsh is designed to have an outflow channel to the newly realigned East Huttonville Creek, which will
function in periods of high water levels. As described above, the racetrack ponds are connected to the East Huttonville Creek (formally considered to be the Rowntree Drain)
through a perched culvert which overflows to the East Huttonville Creek.
Vegetation zonation will mimic natural patterns. Within each zone, several specific
vegetation associations will be established:
• Submerged Aquatics: dominated by or composed of pondweed, water milfoil and
duckweed;
• Floating-Leaved Aquatics: Dominated by water lilies;
• Shallow Marsh: dominated by or composed of bur-reed, bulrush, cattail, rice-
cutgrass, spikerush, sedge, forb;
• Meadow Marsh: dominated by or composed of tall white aster, jewelweed,
sedges, red-top, fowl-meadow grass; and,
• Thicket Swamp: dominated by or composed of willow, red-osier, silky dogwood,
nannyberry, black alder, buttonbush.
Phases: Vegetation communities described above can be planted in one phase.
Life forms: Forbs 45%, graminoids 45%, shrubs 10%, but will vary depending on the
particular type.
Intended functions: Create a dynamic, diverse and self-sustaining complex of various
wetland ecosystems that will promote or attract numerous wetland plants and wildlife. The intention is to provide habitat for waterfowl, shoreline birds, fish and potentially
amphibian breeding habitat. It is expected that this newly created feature will replace

Final Environmental Implementation Report Mount Pleasant Sub-Area 51-1
September 2011
5-15
the functions of the racetrack pond and provide enhanced features and functions in the
NHS.
The pond was designed to provide feeding, nesting breeding and stopover habitat for waterfowl. The racetrack pond currently provides only stopover habitat. Nesting islands
will be attractive to waterfowl, while shallow littorals and exposed mudflats should
benefit shorebirds ranging from local breeding species like Killdeer and Spotted Sandpiper to the more common migrants like Lesser Yellowlegs and Least Sandpiper.
The grassy margins of the pond and surrounding field and grassland channel will also offer additional nesting habitat for waterfowl. Once cattails become established along
some of the shoreline, it is also possible that marsh birds, like Virginia Rail and possibly Sora, may take up residence. Depending on the amount of adjacent grassland, it may be
possible to retain certain grassland birds, especially those that are less area dependent
and/or are more tolerant of the presence of humans. Water-affiliated mammals, like Muskrat and Mink, and amphibians, will quickly accept and benefit from the pond. The
pond surface, along with the SWM ponds, may also prove attractive to bats foraging over the water. This wetland will be large enough to support Midland Painted and Common
Snapping Turtle provided they could find their way from existing sites. If natural
immigration fails to take place, a small introduction could be attempted. Between this pond and the large flooded Silver Maple swamps to the south, enough road-free habitat
will exist that turtles should be able to persist.
The larger area of Grassland Channel, planned for south of this wetland, will also be of benefit to nesting waterfowl, open country marsh birds like Common Yellowthroat and
Swamp Sparrow, and possibly Sedge Wren, which has been recorded in this area
previously. The channel, whether wooded or grass, will also provide a safe corridor function for all mammals in the area.
A narrow north-south row of trees will also be established along the eastern flank of this
section bordering the soccer fields. This forest band will be mixed but will have a strong
coniferous component, in part to provide some shading for the pond and wetland from the substantial evening lighting of the soccer fields.
5.7.3.5 Area 4a: Grassland Creation (north of TCPL and west of
Spine Road)
This area is abutted by the East Huttonville Creek to the north and west, Spine Road to
the east, and TPCL and residential development to the south. Target community types: The proposed vegetation cover will be a cultural old-field meadow. The species to be utilized for plantings are the native forbs and graminoids
growing in similar situations, such as tall and Canada goldenrod, New England and other
asters, fleabanes, and native sedges and rushes. Of the shrub species, bird “friendly” hawthorns and groups of native conifers should be planted or allowed to grow. There
may be the opportunity to transplant cultural old-field meadow species (graminoid and forb) that are outside of the NHS into this area.
Phases: No phases or nurse crop vegetation will be required.
Life forms: Forb 50%, graminoid 40%, shrubs 10%.
Intended functions: The main ecological function will be provision of habitat for common wildlife, in particular, open habitat birds. The provision of a grassland riparian

Final Environmental Implementation Report Mount Pleasant Sub-Area 51-1
September 2011
5-16
zone will be beneficial to the habitat requirements of Redside Dace, by supporting the
insect life that are a food source for this fish.
5.7.3.6 Area 5a: Fish Foraging Habitat
Warmwater tolerant fish-foraging pools are planned east of the East Huttonville Creek
and west of the Park Woodlands, where the City Park drainage feature is located. A relatively large berm is planned in the East Huttonville Creek, just south of the fish-
forage habitat pools, with very gradual slope on the east side of the channel to permit water to backup into the fish-foraging pool habitat. The pools are designed to provide
suitable habitat for warmwater tolerant fish species, in particular, young-of-the-year. Benthic production is also expected in these pools. The pools are at least 1m deep, with
uneven edges and peninsulas. Shallow littorals with drop-offs on opposite sides and
woody debris and rocks at shoreline for cover are also present. For details on their design and function, refer to Section 4.0.
Target Community types: Shallow marsh and meadow marshes surrounding the
pools, with scattered shrubs (i.e. red-osier dogwood).
Phases: No phases or nurse crop vegetation will be required. Life forms: Forb 50%, graminoid 40%, shrubs 10%.
Intended functions: Provision of habitat for tolerant warmwater fish species and
suitable conditions for benthic production.
5.7.4 Vignette 4 - City Park Woodlands and TCPL to the CNR As provided on Drawing 3.4.3, the main NHS element in this location consists of the
Grassland Channel between the TPCL and the CNR tracks. The MNR designated
occupied Redside Dace habitat is located south of the CNR. The NHS restoration includes improvements to the CNR culverts to permit continuous fish movement in the
East Huttonville Creek, south of the CNR. The grassland channel, from top-of-bank to top-of-bank between TCPL and the CNR, is 100m wide and will provide permanent fish
habitat due to discharge from upstream SWM ponds. The anticipated flow increases will
enable the creation of pool and riffle sequences within this portion of the NHS channel, which will potentially provide available Redside Dace foraging and spawning habitat. The
species preys on insects that hover over the stream. Tall grasses and overhanging shrub vegetation maximizes the presence of these insects.
Cross-section B-B’ displays the grassland channel vegetation communities, typical side
slope variation, typical floodplain hummocky topography and a knoll within the floodplain
present within the grassland channel; eastward to SWM pond HE-5.
Target Community types: Meadow marsh vegetation with presence of tall overhanging grasses and some overhanging shrubs (i.e., grey dogwood).
Phases: No phases or nurse crop vegetation will be required.
Life forms: Forb 40%, graminoid 50%, shrubs 10%.
Intended functions: Provision of diverse channel morphology (including riffle and pool
habitat) as well as overhanging grass riparian zone will provide suitable habitat for

Final Environmental Implementation Report Mount Pleasant Sub-Area 51-1
September 2011
5-17
Redside Dace as well as for the tolerant warmwater fish community known to inhabit this
reach.
In addition, on the side slopes of this channel, are swale features (5g) that convey water from rear yard swales to the East Huttonville Creek. These side slope swales provide
simple contributing fish habitat to the East Huttonville Creek.
Target Community types: Meadow marsh vegetation.
Phases: No phases or nurse crop vegetation will be required. Life forms: Forb 50%, graminoid 40%, shrubs 10%.
Intended functions: To convey water from rear yard swales along the side slope into the East Huttonville Creek and create simple contributing fish habitat.
5.7.5 Wetland 13a, 13b and “Tooth” Restoration
Wetland replacement is required for the loss of portions of W9 as a result of the realigned Sandalwood Parkway. In this regard, approximately 2.0 ha replacement
wetland and associated buffers will be constructed in the “tooth” adjacent to W13a and W13b. This area was walked on May 18, 2011 with the City, the CVC and the MNR to
view the existing drainage/vegetation conditions and discuss specific restoration
approaches for W13a and W13b and the creation of the new “tooth” wetland. The following restoration approaches were discussed for implementation:
• The design objective is to maintain surface water in the “tooth” and W13a from
being lost to existing ditches in order to restore wetland hydrology. There is a
ditch, between the east side of the “tooth” and the west side of W13a, which receives surface water from the “tooth”, from tablelands to the south and from
portions of W13a. There is also a ditch along the east side of W13a, which
continues along the north side and inputs into a ditch along the east side of W13b through the City Park. Generally, the ditches are situated such that they carry
surface water around W13a to the East Huttonville Creek, resulting in limited inputs to W13a, W13b and the “tooth” area. The objective of the design will be to
remove or modify ditches to the extent possible to increase standing water within
the “tooth” and W13a/W13b. The existing ditching, between the east side of the “tooth” and the west side of W13a, should be filled in, existing field tiles within the
“tooth” broken and the concrete tile outlet structure removed. Invasive species noted in the south end of this ditch should also be removed. With respect to the
ditch at the north end of W13a, filling or the use of check dams should be considered in effort to keep surface water in the wetland longer. Berming along
the south side of the TCPL easement may be required to maintain drainage off the
easement as well as out of the City Park. This work should be co-ordinated with planning to twin the TCPL pipeline in the near future in this location.
• Surface flow from the fields south of W13a enters W13a from several locations.
To the extent feasible, flows should continue to be directed to these locations
following development.
• The ditch system from W13a continues north of the TCPL, along the east side of
W13b and connects to the East Huttonville Creek. W13b loses some surface water
to the ditch on its east boundary. East of the ditch on the City Park lands, there is

Final Environmental Implementation Report Mount Pleasant Sub-Area 51-1
September 2011
5-18
a triangular-shaped area that will become part of the NHS. Consideration should
be given to removing the ditch east of W13b and placing a berm at the east/north end of this triangular-shaped area to potentially extend the width of the wetland
and direct flows into W13b. The elevations on the east side of the ditch will govern how much berming will be required to prevent the City Park playing fields
from further flooding. A flow path through this area would be required so that the
adjacent fields do not flood. The Green Trail is planned to go through this triangular area. If wetland habitat is feasible, consideration for trail movement to
the edge of the planned NHS vegetation, adjacent to the City Park, should be given.
• Restoration of the “tooth” should be allowed to naturally evolve; however, this
should be started by restoring the “tooth” with a native wetland meadow mix in
the low elevation areas. Silver (or swamp) maple seedlings, swamp beggar-ticks,
swamp buttercup and prickly cucumber were observed to be naturally regenerating in the farmed “tooth” area.
• The proposed City’s Green Trail is located in the “tooth” area outside of the
wetland restoration area (generally outside of the 5 year floodline). Special
consideration is required for a TCPL trail crossing of this area. Fencing of the
entire restoration area, along with plantings to obscure sight lines, is necessary to prevent trail users from making short-cuts from the City Park through the new
wetland to the Mount Pleasant Go Station. Fencing should be placed south of TCPL trail, and east of the Green Trail and extend to the south end of the “tooth”,
connecting to southeast corner of W13a.
• Signage should be employed to educate area residents on the semi-passive
restoration efforts, successional wetland growth from mineral meadow marsh to
treed swamp, ecological features and functions and sensitivity to disturbance.
This wetland creation/restoration concept for W13a, W13b and the “tooth” will be advanced at detailed design, including post-development water balance calculations for
the wetland restoration design.
5.8 Role of Natural Succession in the NHS Post-Restoration The Mount Pleasant NHS post-restoration proposal is significant in its scope and
complexity. Its guiding vision is to create a diverse and sustainable connected system of natural areas and habitats. In other words, once established, the NHS will be left to
function on its own, with limited human intervention. Given the NHS is located in an
urbanized environment, some management and maintenance is required to guide natural succession (i.e., invasive species management, replacement of unsuccessful plantings).
A separate Operations/Management Guideline for the Mount Pleasant NHS will be prepared for use by the City.
The reliance on native species and vegetation should ensure vibrant and dynamic
systems. Plantings and habitat creation will form a framework upon which natural
succession will rely but, over time, ecosystems will change and become attuned to their biotic and abiotic components. It is understandable however that some habitats will be
changing faster than others and that some introduced species may even drop out, to be replaced by others through natural mechanisms.

Final Environmental Implementation Report Mount Pleasant Sub-Area 51-1
September 2011
5-19
Human intervention should be limited to those activities that could benefit the
ecosystems, among them the control and removal of exotic species. Specific invasive species management strategies (i.e., for garlic mustard, common buckthorn) should be
developed in the detailed design stage for eradication (where feasible) or control of documented invasives within existing natural features, as well as monitoring and
management of proposed NHS natural features for species invasion. Without active
mowing or cultivation of meadows, these floodplain and upland communities will naturally succeed into thicket and treed communities over time. Stewardship of the
lands should be geared towards nature appreciation, protection and with only limited and managed opportunities for access into the newly created NHS.
The development of trail systems in the NHS will foster stewardship by connecting
communities to their environment. By planning and constructing the trail system in a
sensitive way, including providing controlled access to residents and public, the trail system will support environmental education and build public commitment to
environmental conservation through personal experience. It is these personal experiences that will encourage residents to adopt appropriate stewardship practices,
which benefit the community and the environment in the long run. Signage is planned
along the trail system at locations of existing natural features and restoration areas as an education and stewardship tool. As well, a new homeowner’s guide will be created to
inform new residents of existing and planned natural heritage features, their sensitivity to disturbance and to foster stewardship for them to respect and protect the NHS.
5.9 Net Benefit Analysis of Implementing the NHS
The HFSWS Phase I Report identified a set of terrestrial factors (area sensitivity, condition and quality, biodiversity & landscape planning, connectivity, and uniqueness &
rarity) to evaluate terrestrial conditions at the HFSWS and LSA scales. Based on these
factors, the HFSWS identified a number of opportunities to maintain and/or improve terrestrial conditions in the future urban setting, such as protecting existing core natural
features, creating linkages, improving natural cover, etc. In the HFSWS Phase 2 analyses, these terrestrial opportunities were evaluated against the 2G land use plan
(SPNHS), as summarized in HFSWS Table T4 of Appendix F. The status of the terrestrial opportunities evaluated in Table T4 has not changed since the EIR level of detail was
available and provided to the HFSWS. Hence no updates to Table T4 are warranted. As
summarized in Table T4, the SPNHS and the Sub-Area 51-1 NHS as presented in this Final EIR will:
• protect key forest core areas;
• provide a net gain in forest interior area;
• restore wetland hydrology in the “tooth” and surrounding City Park wetlands; • create a new wetland south of Sandalwood Parkway that offers enhanced
ecological features and functions over the existing racetrack pond wetlands that are to be removed;
• connect formerly isolated natural features with new features, that increases overall biodiversity and provides a functionally linked natural corridor to
Caledon to the north and the Credit River to the south; and,
• meet/exceed natural cover target under the 2G plan.
The terrestrial opportunities outlined in Table T4 were used in the development of the
NHS. The previous sections have provided discussion regarding the NHS restoration principles and a focused review of the four Vignettes and the restoration features that
will be established within each of these four areas. The NHS was agreed upon by the

Final Environmental Implementation Report Mount Pleasant Sub-Area 51-1
September 2011
5-20
MPLG and Stakeholder Agencies as a means of creating a diverse and representative
system of natural areas that will be functional and sustainable within the urbanizing landscape of Mount Pleasant. To achieve this goal, some loss and alteration of the
existing natural heritage features will occur, but these changes are more than off-set by the retention of the key elements within the existing landscape and creation of new
habitats for their inclusion within a more diverse, larger, and better linked riparian and
terrestrial corridor. Following is a summary of the anticipated changes and a discussion of net benefit that is expected to occur through implementation of the NHS. The
following items are addressed in more specific detail within other portions of this EIR.
5.9.1 Alterations to Vegetation Communities and Wildlife Habitat The majority of the Study Area has been under active agricultural use for many decades
and these uses continue today. The key wooded and wetland elements within Sub-Area 51-1 will be maintained and buffered as per the agreed NHS. However, some
loss of existing natural heritage features will occur with the removal of W10, W11, W12, W14, and W48. Some of these wetland units provide breeding habitat for amphibians
(i.e., American toad, green frog, and northern leopard frog), although monitoring did not
identify large numbers. The racetrack pond provides staging habitat for waterfowl and habitat for a small warmwater fish community that may be able to move upstream from
the East Huttonville Creek into the pond under limited high-water seasonal conditions.
There will also be removal of tableland hedgerows and ornamental plantings as described
within the Tableland Vegetation Assessment (Kuntz Forestry, 2010). Although these features provide some limited local habitat for mammals and birds, these functions will
be replaced and improved upon by various components of the NHS. The conversion of these lands to residential will also result in the loss of cultural meadows that support
some grassland bird species; however as described within the various Vignettes, there is a grassland component to the NHS which will aid in offsetting the loss of this habitat.
Sub-sections 5.6 and 5.7 above have described how key measurables, such as wetland area, interior forest habitat, and woodland area, are all expected to increase under the
proposed NHS. In addition, the creation of the open water/marsh wetland, as well as the variety of terrestrial vegetation communities within the new channel design, will add
layers of diversity that presently do not exist. These efforts will result in a net gain in
both the areal extent of vegetation as well as the diversity of terrestrial resources, and over time, as the NHS matures, benefits to wildlife habitat will occur.
The buffers within the NHS are adequate in protecting terrestrial habitat features and
functions, with the inclusion of the Green System Trail within the buffer. There is an adequate buffer to prevent root compaction, allow for planting of shrubs and vines for
protection against windthrow along woodland edges, to prevent pedestrians going off
trail into the feature and to discourage invasive species encroachment into the feature. Wetland water balance features (i.e., swales, inlets) are in NHS buffers where there is no
Green System Trail. The majority of the Green System trail is located along the top of bank of the realigned East Huttonville Creek. Opportunities for increasing the distance
between the top of bank and the start of trail, through increasing side slopes will be
explored in detailed design. The Green System Trail was moved from between Mayfield Woodland A and B to the west buffer of Mayfield Woodland B to maximize opportunity
for creation of suitable interior habitat conditions. While the west buffer has grading restrictions that limit trail location relative to the woodland dripline, the movement of the
trail outside of interior habitat has significant ecological benefits.

Final Environmental Implementation Report Mount Pleasant Sub-Area 51-1
September 2011
5-21
5.9.2 Changes to Aquatic Habitat The CFCP (October, 2011) provides a comprehensive discussion of the existing aquatic
habitat quality and fish community, both upstream of the CNR within the intermittent reaches of the East Huttonville Creek, as well as downstream of the CNR within, what
was formally referred to as an “occupied reach” of the Redside Dace. As described in
Section 2.2.2.4, the definitions of Redside Dace habitat for the purpose of defining Redside Dace habitat under the ESA were updated by the MNR in Ontario
Regulation 293/11 (June 2011). Regulated Redside Dace habitat extends from south of the CNR upstream to Mayfield Road. The quality and extent of the intermittent flow
conditions within the East Huttonville Creek subcatchment are also discussed in Section
2.0 of this EIR, and identify the substantial influence that historical agricultural use and channelization have had on the East Huttonville Creek subcatchment. The NHS will result
in the existing East Huttonville Creek being realigned and/or realigned and lowered between the upstream point at Mayfield Road, downstream to the CNR and there will
also be a number of road crossings across the NHS.
The CFCP concludes that the re-creation of the East Huttonville Creek and the increase in
flow within the new creek, from the discharge of treated stormwater, will result in a net gain in productive capacity within the creek and will see the conversion of existing
ephemeral and intermittent reaches into seasonal and permanent habitat. The removal of the racetrack pond will ultimately be replaced by the new wetland feature (to be
determined through detailed design and Agency stakeholder discussions). The loss of
the racetrack pond will result in the displacement of the local warmwater fish community found in these linked ponds (i.e., the racetrack pond, as well as the two smaller historic
irrigation ponds that are linked along Reach HV20). A “fish and wildlife rescue” plan will be prepared that will specify how fish and wildlife existing in the ponds will be captured
and re-located. In the case of the fish population, they will be distributed downstream in an appropriate area within Reach HV19. The racetrack pond is known to contain certain
undesireable species (such as largemouth bass) that will be culled and removed from the
East Huttonville system (as they would have been stocked by previous owners and this species is not native to the Huttonville Creek watershed).
Hence, these alterations are anticipated to result in demonstrated improvement to the
extent and quality of fish habitat within the NHS. The culvert improvements to the CNR
crossing and the natural channel design elements have been incorporated with the knowledge that the reach downstream of the CNR is identified as an occupied reach for
Redside Dace. The improved passage for fish, once the culverts are in place, and the ability to create riffle and pool habitat where none presently exists, may assist in the
future expansion of the range of this endangered species.
The buffers within the NHS are adequate in protecting aquatic habitat features and
functions. The primary aquatic habitat features and functions will occur within the new creek and the floodplain on either side of the creek. The width of the NHS and the
typical location of residential rear yards with a setback from the top-of-bank will provide suitable buffering from the adjacent development. Side-slope swales which typically will
occur in the wider portions of the NHS (i.e., south of the TCPL) and wetland mitigation
measures (swales) will not be located in areas of proposed trails so there will be no anticipated conflicts with this use.
Final Environmental Implementation Report Mount Pleasant Sub-Area 51-1
September 2011
5-22
5.9.3 Alterations to Wildlife Movement, Linkages and Corridors The Study Area has been under active agriculture for many decades, and wildlife use of
these lands is generally by common and opportunistic species that are fairly adaptable to land use change. In a landscape context, the primary habitat and terrestrial linkages
presently occurring are influenced by the fragmented nature of the habitat blocks and
the limited riparian habitat associated with the East Huttonville Creek. The NHS will result in a primarily north/south spine that will afford opportunities for wildlife to carry
out lifecycle functions within a mosaic of connected upland and lowland vegetation types and habitats. The movement of wildlife through the Mount Pleasant lands will continue
following development, and linkages to the south and north of the Study Area will be
maintained. The corridor will be quite wide in some areas particularly where SWM blocks occur adjacent to the NHS and this will provide a secure wildlife link within the urban
fabric. In terms of east/west movement of animals, the use of the subdivisions by small mammals will definitely occur, and these animals are expected to move back and forth
between the new habitat provided within the residential communities as they mature, and the NHS.
5.9.4 Increased Human Activity Adjacent To, and Within, the NHS
The introduction of human activity adjacent to, and within portions of the NHS, will be a reality of the development of the Mount Pleasant lands; however, there are mitigative
measures that can be utilized to limit the potential impacts from these interactions.
Section 3.5 of the EIR addresses the issues around the design and siting of trail locations. Considerable discussion has occurred around the desire to minimize intrusion
through particularly sensitive portions of the NHS, while balancing the need to provide a pedestrian-friendly trail network for local residents.
The EIR recognizes that a “convenient” trail network will assist in encouraging residents and their pets to remain within the formal trail limits rather than creating informal
pathways to destination points. The Block Plan trail system has been designed in consideration of the following:
• sensitively citing of the trail to conserve natural features, while affirming the
community’s connection with the natural environment by providing opportunities
for nature appreciation in an urban setting;
• providing affordable year round recreational opportunities for walking, jogging,
hiking, and cycling for all age groups to enjoy, notwithstanding their level of
personal fitness ability;
• supporting active transportation by providing community connections between
residences, parks, schools, workspaces, shopping and other services; and,
• supporting environmental education and public awareness to environmental
conservation.
Providing managed access to the NHS helps to provide for public access, while
minimizing impacts that would otherwise result from unmanaged public access.
The CDG and the EIR also provides a number of design recommendations for the
construction of the trails to minimize their potential impacts to the NHS. These include the consideration of the use of permeable screenings, lighting requirements along the
Final Environmental Implementation Report Mount Pleasant Sub-Area 51-1
September 2011
5-23
trail, and the use of page wire fencing and/or vegetation to clearly delineate the trail
limits for residents.
Ultimately, the trail network will be a significant amenity to the residents of Mount Pleasant, with the important goal of users having the opportunity to interact with the
NHS in a sensitive manner. The ability of the City to govern the activities of trail users
and adjacent homeowners is best achieved through effective education campaigns. Signage along the trail that explains the various attributes and functions of the NHS, and
the potential impacts from off-trail use, can have a strong impact on new residents. Homeowner manuals are now becoming a common element of new home purchase
information, particularly so when the development includes natural heritage features within its boundaries.
A variety of other mitigative techniques can be utilized to either limit the encroachment within buffer zones (such as adjacent to woodlot edges), or in areas adjacent to the
trails. These may include the planting of thorny and dense vegetation to discourage access outside of NHS trail heads. Refer to Section 3.6 for further discussion on trail
design.
5.9.5 Changes to Groundwater and Surface Water Quantity and Quality
The groundwater regime has been well studied within the HFSWS as well as the EIR.
Both studies have concluded that, while there is there is not a pronounced groundwater/surface water interaction anywhere in the Study Area, there may be local
areas that experience seasonal groundwater contributions either from tile drainage or minor interaction with an elevated groundwater table during wet seasons. These areas
include the existing race track ponds which contribute baseflow to Reach HV19 and
occasionally from the W13. The main area of ground water influence, however, gradually occurs approximately 200m downstream of the CNR, where the watercourse
begins to exhibit perennial flow. Notwithstanding the above, the various studies and monitoring demonstrates that the various wetland communities within the NHS are
primarily supported by seasonal surface water contributions. Mitigation strategies have been proposed to manage the water budget conditions in the wetlands (refer to Section
6.6) and the use of LID measures, as required, in the HFSWS has been proposed to
address potential development impacts to groundwater and surface water. As such, the development of the Mount Pleasant lands is not anticipated to have an impact on either
the quantity or quality of the groundwater resource in this area as it relates to the health and maintenance of the NHS.
The issue of SWM is addressed within Section 9.0 of this EIR. The use of Level 1 treatment for SWM facilities, in addition to the incorporation of LID measures, will result
in an improvement in quality beyond current standards, although mitigation measures will be needed to minimize potential thermal impacts within the NHS. Section 9.9
provides a review of potential mitigation techniques and recommendations for measures on the various SWM facilities. The release of treated stormwater into the NHS is
expected to result in measurable improvement to aquatic habitat and the fish community
by creating new reaches of seasonal and permanent habitat. The volumes of stormwater will meet required standards and downstream erosion thresholds will be met to ensure a
stable channel. The incorporation of more frequent and extended baseflow conditions, within the NHS, will permit the creation of a more dynamic stream morphology that will
include pools, riffles, and runs in some reaches. All these changes will establish a more
functional floodplain, a low-flow channel and will create a measurable improvement in

Final Environmental Implementation Report Mount Pleasant Sub-Area 51-1
September 2011
5-24
aquatic and terrestrial habitat diversity within the riparian and adjacent terrestrial
corridor. In terms of potential cumulative impacts on downstream reaches of Huttonville Creek (downstream of the Block 51-1 lands), and further downstream within the Credit
River, discussions through the HFSWS with the CVC have resulted in a broader initiative to retrofit existing SWM facilities to limit potential water quality impacts on the Credit
River.
All of the above, and a number of other aspects of the NHS, will contribute to creating a
more functional, diverse, and mosaic terrestrial and aquatic habitat that will provide a net ecological benefit which will increase as the NHS matures over time.

Final Environmental Implementation Report Mount Pleasant Sub-Area 51-1
September 2011
6-1
6.0 WETLANDS
There are a number of wetlands within the Study Area that have been inventoried by the
MNR. As discussed in Section 2.4.2 of this EIR, there are 10 Candidate PSWs protected in the NHS including W1, W2, W3, W4, W5, W6, W7, W8, W9 and W13. Candidate PSWs
to be removed to permit creek restoration (lowering and realignment), development of a
major urban node and the future James Potter Parkway include W10, W11, W12, W48 and W14. Functions performed by these wetlands will be replicated in the restored NHS. The creation of a new open water/marsh wetland in the vicinity of the creek relocation adjacent to the City Park, as well as seasonally connected pools and off-line pools in the
new creek floodplain, are incorporated into the NHS design to replace the functions of the existing racetrack wetlands. NHS boundaries illustrating the protection and buffering
of the wetlands are presented in Section 3.0. Design of the new open water/marsh
wetland is addressed in Section 5.0.
Development within and/or adjacent to wetlands are subject to the natural heritage policies within the PPS (2005) and the guidelines within the 2nd edition of the Natural
Heritage Reference Manual (NHRM, 2010). The latest NHRM was released after the
Implementation Principle agreement and therefore, it does not directly apply.
The wetlands in Sub-Area 51-1 have been evaluated by the MNR (2007) and candidate significant wetlands were identified in the Draft Huttonville Creek and Area Wetlands.
The features and functions of the natural features within Sub-Area 51-1 are known (refer to Section 2.0), as determined by multi-disciplinary studies completed for the LSA, the
HFSWS, the MNR wetland evaluation and the Block EIR. In November 2009, the Block
51-1 conceptual NHS was approved by the City, the CVC and the MNR, which included the protection of key wetland features, removal of W9, W10, W11, W12, W14 and W48
and creation of new wetlands with enhanced features and functions. The HFSWS reviewed the NHS in the context of the updated NHRM. The NHRM includes guidelines
for developing a NHS in an urban environment, which recommends a balance between
efficient land use approaches and natural feature protection. The HFSWS concluded that the NHS has addressed all key matters identified in the updated NHRM, and also reflects
the scope of subwatershed targets that were developed through stakeholder participation with the intention to conform with provincial and municipal plans and policies, as well as
recommendations arising from previous applicable watershed plans and subwatershed
studies as prepared by CVC.
As part of the EIR, an impact assessment of the proposed Block Plan on the existing wetlands to remain in the NHS (W1, W2, W3, W4, W5, W6, W7, W8, W9, and W13) and
their adjacent lands (within 120m) was completed.
Section 6.0 summarizes the existing conditions for each wetland including details on size,
type, condition, monitoring, surface water, groundwater, soils, ELC, flora and fauna, fish use, etc. All of the wetlands were determined to be seasonally flooded surface water
features, and changes to contributing drainage areas may alter the size of flooded areas, timing of flooding (hydroperiod) or depth of flooding within each feature. Depending on
the degree of change in hydrology in each wetland, this may affect other functions within
the wetland (i.e., suitability of vernal pools for amphibian breeding, moisture conditions for individual flora or vegetation communities). It is the intent to mitigate post
development changes in hydrology through the use of drainage from rooftops or pervious areas to ensure that hydrological conditions are suitable to maintain desirable
water inputs.

Final Environmental Implementation Report Mount Pleasant Sub-Area 51-1
September 2011
6-2
As recommended by the HFSWS, a multi-disciplinary and integrated approach for the
assessment and protection of the wetland features has been adopted for the EIR. This
section of the EIR focuses on the characterization of the existing wetland features and the water budget considerations for long term health of the wetlands within the NHS. It
includes discussion and data on:
• existing conditions of each wetland through the integration and consolidation of
input from surface water, groundwater and ecology disciplines;
• management objectives for each wetland;
• which wetlands require water budget calculations;
• the methodology for the assessment of wetland water budgets;
• water budget calculations for both pre- and post-development conditions; and,
• potential impacts to wetlands and mitigative measures to be incorporated into
development design to address water budget requirements for each wetland.
Section 6 is organized to provide detailed integrated discussion of existing conditions,
water budgets (pre-development and post-development) and mitigative measures on a wetland-by-wetland basis (refer to Section 6.6). There are, however, a number of topics
that apply to many or all wetlands that are discussed in Sections 6.2 to 6.5 to avoid
repetition in Section 6.6. This includes the approach to wetland boundary determination, monitoring and the approach to water budget modelling. Similarly, there are several
overview descriptions that apply to many or all wetlands that are also included prior to the presentation of information and analyses on a wetland-by-wetland basis. This
includes general discussions of the wetland water conditions, sources of water to wetlands, types of wetlands present in the Study Area and the terrestrial conditions of
the features.
6.1 Wetland Boundaries The boundaries of all existing wetlands (forested wetlands were surveyed within 20m of dripline edge) in the Sub-Area 51-1 lands were staked and subsequently surveyed to
document the location and configuration of these features. The resulting surveyed plans prepared by RPE illustrate the staked woodland driplines and staked wetland boundaries,
as determined in the field with the City, the CVC and the MNR on July 22nd, 24th and 27th,
2009. These plans were presented and discussed at the EIR Workshops #1 and #2. These Agencies have endorsed these survey plans as accurate and acceptable. The use
of wetland boundaries to determine the NHS boundaries through the addition of 20m buffers, where applicable, is addressed in Section 3.0.

Final Environmental Implementation Report Mount Pleasant Sub-Area 51-1
September 2011
6-3
6.2 Wetland Water Conditions
6.2.1 Wetland Types
With the exception of W5, all wetlands within Sub-Area 51-1 are considered to be
‘palustrine’. W5 is considered to be ‘isolated’. Palustrine and isolated wetlands are defined by the Southern Ontario Wetland Evaluation Manual (Dec. 2002) as:
“Palustrine wetlands generally occur in lands positioned physiographically upslope from lacustrine and riverine wetlands. Palustrine wetlands are defined either by absent or intermittent inflow and either intermittent or permanent outflow. They are often found in headwater areas and may drain in opposite directions into different streams or river basins." "Isolated wetlands are defined as wetlands that have no surface outflow. The source of nutrients is precipitation, diffuse overland flow and occasionally groundwater."
The majority of the wetlands have either forested (W1-W6, W7b, W7d, W8, W13) or
non-forested (W7a, W7c, W9, W10, W11, W12, W14, W48) vernal pools. The only areas of permanent open water are small ponds that have been constructed at W10 and W12
(further discussion of these ponds is provided in Section 6.2.6).
6.2.2 Wetland History A review of historical aerial photography available for the Study Area (1946, 1960, and
2004-2010) shows that some of the features have been on the landscape in similar form
as present since the 1940s (i.e., Mayfield Woodland A & B). However, most features have changed in size, shape and type of vegetation communities present (e.g., Wanless
Woodland A and B, Sandalwood Woodland and the Park Woodlands). The historical photos also depict changes in size, shape and texture (vegetation type) for Wetlands
W7a, W7b, W7c, W7d, W8, W9, W10, W11, W12, W13a, W13b and W13c, W14, and W48.
There has been considerable historical alteration of the local surface water drainage in the Study Area for agricultural purposes. This has included the construction of ditches
and tile drainage systems, and it appears that this has contributed to the formation and modification of a number of the wetland features (refer to Section 2.1.4 for further
discussion of tile drains). For example, a drainage ditch constructed on the west side of
W4 directs flows to a catchbasin at the south end of the woodlot (refer to Figure B-6-4 in Appendix B-6 for the catchbasin location). The pipe outlet for this catchbasin was
not observed, but is assumed to be directed southward to the East Huttonville Creek. There is a ditch on the west side of W8 that directs flow from W8 and tile drainage from
the northern agricultural fields southwards into W9. An outlet from a tile drainage system has actually been observed directing flows to this ditch (refer to Figure B-6-8 in
Appendix B-6 for the tile location). Recently, another catchbasin was also found on the
south edge of W9. Again, as noted above for the constructed drainage system at W4, the outlet for this catchbasin was not observed; it is postulated that the drain may outlet
to the south to W48 or, more likely, directly into the East Huttonville Creek. There are also relatively deep ditches that have been constructed along the west side of W13a and
the east side of W13b, and shallower ditching along the north side of W13b to drain the
agricultural area to the south of the features northwards into the East Huttonville Creek. Again, several field tile outlets have been observed discharging to the ditch along W13a

Final Environmental Implementation Report Mount Pleasant Sub-Area 51-1
September 2011
6-4
(refer to wetland Figure B-6-13 in Appendix B-6 for tile locations).
The racetrack ponds (W10, W11, W12, W48) are absent from the 1946 and 1960 aerial
photography. These ponds appear to have been excavated for farm use and/or irrigation (refer to Section 6.2.6 for further details).
6.2.3 Monitoring
As part of the EIR, wetland monitoring was undertaken to observe existing hydroperiods
(i.e., the period of time during which the wetlands are covered by water). Each wetland feature in the Study Area was monitored in spring conditions (when they fill up with
water during the freshet) and the monitoring continued until the wetlands were completely dry. The monitoring to observe the hydroperiods for these features was
completed weekly in May, June and July, 2009, March, April and May 2010, and was
resumed in the spring of 2011, with wetland observations from March until the wetlands were dry at the end of June.
The methodology for the monitoring of these wetlands involved identifying key locations
with flagging tape and visually inspecting and photographing the conditions at these same locations each week. There are small isolated areas of shallow standing water that
can be observed during snowmelt and spring conditions and following heavy rain events,
but generally there is insufficient surface water to warrant the installation of a staff gauge and monitoring equipment (often only a few centimetres of water is ponded for
very short periods of time). Deeper ponded water depths up to about 0.5m have been reported in spring melt conditions, but typically the wet areas in all of the wetlands are
small, isolated pools less than about 20cm deep (Table B-6-1, Appendix B-6).
In areas where some deeper ‘pockets’ of standing water were observed in channelized
portions of the wetlands, staff gauges were installed (refer to SG locations in W4, W7, W8, W9, W13 and W14; Figure 2.1.2). At SG1 in W9, the bottom of the staff gauge is
actually below the natural grade of the wetland as a result of the staff gauge being
located in a deep tire rut. When water levels are recorded that are below grade, they do not reflect what is considered to be the natural hydroperiod of standing water in the
feature. The data are, however, still useful to understand surface water flows through the feature and are interpreted to illustrate the high water table conditions beneath the
wetland. Staff gauges were also installed in two of the constructed ponds (near W10 and in W12) in May, 2009 (SG10 and SG12; Figure 2.1.2). A summary of the staff
gauge monitoring data is provided in Table B-6-1 in Appendix B-6.
As noted above in Section 6.2.2, there have been agricultural drainage works around a
number of the features. Where visible, the field tile outlets, the catchbasins and ditches were included in the weekly inspections of the wetland features. In 2011, a staff gauge
(SG2-W9) was added beside the catchbasin in W9. Figures, field note summaries, and
hydrographs of the monitoring results for each individual wetland are provided in Appendix B-6. Wetland photographs are provided in Appendix C.

Final Environmental Implementation Report Mount Pleasant Sub-Area 51-1
September 2011
6-5
6.2.4 Hydroperiods
The hydroperiod observations for each of the wetlands within the Study Area are
provided on individual wetland summary tables in Section 6.6 (Tables 6.6A through 6.6N). With the exception of the open water ponds (W10 and W12), the
wetlands/woodlots dry up each spring by May or June. This is consistent with the wetland observations presented in the HFSWS Phase 1 Characterization and Integration
Report (December, 2010).
6.2.5 Sources of Water
The wetlands in the Study Area are surface water features, meaning that they rely on direct precipitation as well as surface water runoff contributions from the surrounding
drainage areas to sustain their function (i.e., overland runoff and, in some cases as
discussed above, piped inputs of runoff from agricultural field tiles, drainage swales and ditches). They have formed in depressional topography that ponds water during the high
runoff periods. As discussed in Section 2.1.5, the surficial geology mapping illustrates that all of the wetlands are underlain by glacial till or silt and clay sediments (refer to
Tables 6.6A through 6.6N for comments on the individual wetland soil conditions). The
low hydraulic conductivity soils underlying the features support the ponding of surface water in the wetland depressions and the slow drainage of water from the features.
There is generally only standing water in the features in the spring (refer to
Section 6.2.4) when surface water contributions are highest. As discussed in Sections 2.1.8.2 and 2.1.8.4, the water table is seasonally high in many of the wetland
areas and discharge gradients also occur in several wetlands. The high spring water
table below the wetlands is important to the soil conditions in the root zone; however, the low permeability of the till and clay sediments limits the actual groundwater flux
(volume of flow) that moves through the subsurface soils. This limits the potential for significant seepage or direct groundwater contributions to maintain any standing water in
the wetland features. Throughout the summer months as the vegetation grows, the
evapotranspiration requirements use up the available standing water supply and the wetlands dry out. As the seasonal water table declines in the summer months, any direct
precipitation that ponds in the wetlands can infiltrate into the soils. This recharge helps to maintain the water table and soil saturation conditions beneath the features to
continue to support wetland vegetation.
The groundwater contributions have been calculated to range from zero to less than 2%
of the total water supplies to the features (refer to Sections 2.1.8.2, 2.1.8.3 and 2.1.8.4 for details on groundwater levels, flow conditions and groundwater contributions to
terrestrial features in the Study Area). It is concluded that although the high water table conditions are important for the wetland soil conditions and vegetation, the groundwater
movement is insufficient to sustain the wetland features, and as such, they rely on direct
precipitation and surface water inputs for their existence. The precipitation and surface water inputs are also important for maintaining the water table and soil conditions in the
features. It is noted that these findings are consistent with the results and conclusions of the HFSWS with respect to the characterization of the groundwater resources in the
vicinity of the wetland features.
Alterations to the location and configuration of the East Huttonville Creek, through
agricultural drain construction completed in the 1970’s/80’s, have created defined channel capacities immediately adjacent to or through some wetlands. In some
instances, flooding from the creek enters various wetland areas during certain runoff

Final Environmental Implementation Report Mount Pleasant Sub-Area 51-1
September 2011
6-6
events. Surface flooding of woodlands and wetlands is discussed in Section 4.9 and key findings are noted below:
• East Huttonville Creek does not currently drain through or adjacent to W1, W2,
W3, W5, W6, W8, W9 or W14; and hence, provides no input of water to these wetlands.
• W4 – East Huttonville Creek currently drains through a portion of Mayfield
Woodland A and a portion of W4. This area has been altered in the past as part
of agricultural practices to create a defined channel through this woodland. As
noted in Section 4.9, areas of W4 will only flood on an infrequent basis (100 year and Regional Storm events), so flooding from the creek is not considered an
important source of water for this wetland.
• W7 – East Huttonville Creek currently flows through the easternmost portions of
W7 and provides an outlet for drainage from W7. The creek in this location is a well-defined channel dug in the past to facilitate agricultural drainage from the
adjacent farmed fields. As noted in Section 4.9, some flooding of the eastern
portion of W7 is expected during the 100 year and Regional Storm events. Due to the infrequent nature of these events, flooding from the creek is not
considered an important source of water for this wetland.
• W13 – East Huttonville Creek, through the City Park, abuts the northern edge of
W13b. Under existing conditions, portions of the City Park and these wetlands
are flood vulnerable during frequent and infrequent flood events. Channel realignment will reduce frequent flooding conditions along the creek. The City is
interested in reducing frequent flooding conditions through the park, while the CVC and the MNR are interested in introducing more drainage to W13.
6.2.6 Wetland Inlet and Outlets
Wetland inlet and outlet conditions are discussed in each wetland table in Section 6.6
under characterization of existing conditions.
Under existing conditions, several wetlands have no defined inlet conditions (W1, W3, W4, W5, W6, W14). Some ill-defined swales drain adjacent largely farmed fields into
wetlands in one or more locations (W2, W7, W8, W10, part of W13a, W48). Well defined
inlets exist into W9, W11 and W12. W8 flows through W9; W10 and W11 flow through W12. Ditching around W13 carries surface runoff around portions of W13a. In locations
where existing wetland are maintained in the NHS, inlet locations are generally to be maintained.
Outlet conditions are either directly through the NHS to the East Huttonville Creek or through future developed areas in the Fletcher’s Creek subcatchments. With respect to
future drainage and development conditions, the following wetland outlet conditions must be accommodated:
• W1, W2 and W3 drain easterly to Fletcher’s Creek, currently through farmed
fields. Under future conditions, developed areas, east of these wetlands, must provide outlets to W1, W2 and W3 through the major/minor system design.
• W4 currently drains into the ditched portion of the East Huttonville Creek
through Mayfield Woodland A. Modifications are proposed to W4 to restore this
area by redirecting upstream flows around W4 and the woodland. Alterations to

Final Environmental Implementation Report Mount Pleasant Sub-Area 51-1
September 2011
6-7
outlet conditions will be addressed through detailed design. W4 will outlet to the realigned East Huttonville Creek.
• W5 and W6 have no defined outlets.
• W7 drains to the existing East Huttonville Creek. This existing ditch will remain
and be incorporated into the NHS design; hence, W7 outlet conditions will
remain unchanged.
• W8 drains to an existing ditch along the west side of this wetland and drains
southerly into W9. The existing ditch is located in the NHS and will not be
altered; hence, W8 outlet conditions will remain unchanged.
• W9, a new outlet or outlets, must be designed to accommodate its drainage
across the new Sandalwood Parkway.
• W10, W11, W12 and W48 will be removed and their functions replaced in the
new open water wetland located south of Sandalwood Parkway. The new wetland will outlet to the realigned East Huttonville Creek. Specific outlet
conditions of the new wetland will be addressed through detailed design.
6.2.7 Existing Open Water Wetlands The two existing open water wetlands (W10 and W12) are located in the racetrack area
(Figure 2.1.2).
W10
As illustrated on Figure 2.1.2, there are two small ponds in the W10 area that are
referred to as 10a and 10c in the monitoring data (Appendix B-6). Only one of the
ponds (the north pond - 10c) is included within the staked W10 boundary; the south pond was not included within the boundary (it does not meet MNR criteria as wetland),
but was monitored with a staff gauge (SG10) in this study. Both ponds were excavated along a drainage course and are relatively deeply excavated into the water table (the
ponds are more than 3.5m deep in the centre). There was a dam structure on the drainage swale that was constructed to retain the surface water in pond 10c, although it
has deteriorated and is now partially collapsed. Overflow from 10c flows south and
enters 10a via a small swale, and flow was monitored at in this swale at the location identified as 10b on Figure 2.1.2.
The observed water flows at 10b were generally low (Table B-6-2, Appendix B), but
the presence of flow was noted during periods of limited or no rainfall. The ponds are
excavated into the local water table and have a minor groundwater throughflow component that contributes to the observed flows. It was noted, however, that the
observed volume of surface water flow from the ponds was occasionally incongruous with the very low hydraulic conductivity soils and groundwater flow conditions in the
area, i.e., the observed surface flows from the ponds during dry weather were higher
than the estimated groundwater inflow volumes through the ponds. It was noted that pond 10c often emanates foul odours, which suggests stagnant ponded water conditions
and supports the interpretation that there is no significant volume of groundwater throughflow. To investigate this apparent inconsistency in the observed flow conditions,
a detailed field inspection of the area surrounding the ponds was completed. Field tiles were found that would direct interflow runoff into pond 10c from the adjacent
agricultural fields. This likely increases the effective contributing drainage area to the

Final Environmental Implementation Report Mount Pleasant Sub-Area 51-1
September 2011
6-8
ponds and provides a delayed source of runoff water which helps to explain the observed surface water runoff conditions at 10b.
W12
W12 is a pond located in the centre of a former racetrack (Figure 2.1.2). It is approximately 2.5m deep in the open water portion (west side) of the wetland and
excavated into the water table. The drainage course from W10 and W11 (i.e., reach
HV20), is piped under the north part of the track to direct surface water flow into W12. Impeded drainage and backup of water north of the track appears to have formed W11
(Figure 2.1.2). The southern part of the racetrack forms a berm for the pond and flow from W12 exits the pond via a 50cm diameter CSP culvert under the racetrack. The flow
is directed south to the Rowntree Drain ditch that is a reconstructed portion of the East
Huttonville Creek (Figure 2.1.2).
Following its use as a racetrack, a small golf course was developed on this property. During the field inspections, sections of scrap field tile and irrigation pipe were observed
around the pond. Submerged pipes were also observed in W11 and W12. It appears that an irrigation system may have been installed to use water from the pond, either for
track watering or subsequent golf course irrigation. At the time of the site inspections,
however, the piping appeared to be disconnected and no irrigation was observed. The W12 pond water level is controlled by the outlet culvert elevation. Water levels remained
generally stable during the 2009 monitoring period but rose by 10cm to 20cm during spring runoff and heavy precipitation conditions in 2010 and 2011 (Table B-6-1,
Appendix B-6). Flows monitored at the racetrack pond outlet (12c on Figure 2.1.2)
were generally minimal (estimated to be <1 L/s) except during heavy spring runoff/storm conditions when flows of up to 38 L/s were recorded (Table B-6-2, Appendix B).
6.3 Terrestrial Conditions
The Candidate PSWs, within Subarea 51-1, are comprised of treed swamp (W1-W6, W7b, W7d, W8 and W13), thicket swamp (W9, W13), meadow marsh (W7a, W7c, W8, W9,
W12, W13, W14 and W48), shallow marsh (W10-W12), and open aquatic communities (W10 and W12). Hydrological conditions differ between the range of community types
with open aquatic communities requiring permanent water and other community types
with varying temporal periods for flooded conditions and water levels associated with a given season. Treed swamp communities require spring flooding followed by dry
summer conditions; thicket swamp and meadow marsh communities require spring flooding and moist summer conditions; and shallow marsh spring flooding and standing
water in summer.
Within each community type, vegetative species have different tolerances to length and
depth of ponding. In Subarea 51-1, there are two treed swamp vegetation types, a Green Ash Mineral Deciduous Swamp and a Swamp Maple Mineral Deciduous Swamp.
While both require spring flooding followed by dry summer, Swamp Maple need more extensive spring flooding. The recommended mitigation strategies (Section 6.6)
considered existing community type water needs.
6.3.1 Monitoring Extensive ecological surveys have been conducted in Sub Area 51-1 beginning in early
2000 for the LSA, HFSWS, MNR Candidate PSW report, and landowner field studies in
support of the EIR. Surveys included:

Final Environmental Implementation Report Mount Pleasant Sub-Area 51-1
September 2011
6-9
• Breeding amphibians;
• Amphibian movement across roadways;
• Winter raptors (owl, hawk);
• Winter wildlife (mammals);
• Breeding birds;
• Waterfowl use;
• Three season botany;
• Ecological Land Classification;
• Presence and location of wetland inlet and/or outlets; and,
• Estimate of ponded area within wetland (storage estimate).
Field walks were also conducted as part of the EIR process to walk vignette concepts to
make refinements to the NHS restoration concepts.
The terrestrial observations for each of the wetlands within the Study Area are provided
on each of the wetland summary tables (Tables 6.6A through 6.6N).
6.4 Wetland Water Budgets 6.4.1 HFSWS Recommendations
As recommended in the HFSWS, the EIR studies have focussed on updating, consolidating and confirming data and analysis regarding the communities, biota and
functions of all wetland features. This data is summarized in Table 6.6A through Table
6.6N in Section 6.6.
The HFSWS also requires that water budgets to the existing natural features be assessed at the EIR stage to “establish an appropriate hydroperiod with respect to wetland conservation, restoration and enhancement efforts. It has been proposed that roof drain collection systems for shallow features and both roof drain and foundation drain systems for deeper features be implemented to manage the overall ecological water budget for these features”. Details of the water budget modelling and proposed mitigation strategies are provided in Section 6.6.
6.4.2 EIR Workshop Discussions
The need for and scope of work for wetland water budgets was a topic of discussion at several EIR Workshops. EIR Workshop meeting notes summarizing these discussions are
provided in Appendix A-3. Input obtained from these Workshops was valuable in
scoping the type of analyses and addressing reporting structure for the analyses. Key direction from these discussions included:
• Wetland characterization requires input from numerous areas of expertise
including ecology, hydrology, hydrogeology and geology. The consolidation of input from each of these disciplines into discussions on each wetland should be
provided in one location in the report to the extent practical.
• Wetland hydrology is a key element of wetland form and function. Analyses
should, to the extent feasible, identify hydrologic conditions under both existing and future conditions and relate them to vegetation types and wetland functions.
This information is important to the identification of appropriate mitigative
measures to address wetland hydroperiods.

Final Environmental Implementation Report Mount Pleasant Sub-Area 51-1
September 2011
6-10
• Hydrologic modelling of drainage areas to wetlands should be undertaken to simulate surface water inputs using a continuous simulation model for both
existing and future conditions. The use of the EPA SWMM model was discussed
and subsequently approved for use by the CVC.
• Several components of the methodology for hydrologic modelling were discussed. Most of the wetlands have a number of very small, shallow
depressions and ill-defined outlets. They are flow-through wetlands with little
opportunity for large build-up of water. Due to these conditions, the determination of storage volumes in the wetlands is difficult. It was agreed that
storage would be estimated for modelling purposes. Similarly, due to the lack of defined outlet conditions, discharge characteristics of wetland outlets would also
be estimated only.
• Seasonal water conditions in wetlands are important. In some cases, the dry
summer period is very important to wetland health and should be replicated, where feasible.
• Wetland management objectives should be identified on a wetland-by-wetland
basis. Objectives to restore some wetlands consistent with the Implementation
Principles and Agency discussions should be recognized and addressed through wetland water budget analysis.
6.4.3 Wetlands Requiring Water Budget Calculations
The need for water budget analyses for each of the wetlands was discussed with the City, the CVC and the MNR at EIR Workshops #1 and #2. To determine which wetlands
require water budget analyses, the following considerations were reviewed:
• the existing contributing surface drainage area and drainage patterns to each
wetland were identified from topographic mapping and site reconnaissance. Drawing 6.3.1 illustrates existing surface catchments to each wetland; and,
• the degree of development or alterations to surface drainage patterns proposed in each subcatchment was identified. This information was obtained from the
review of Block Plan land use in each wetland subcatchment.
For those wetlands that have no development or drainage alteration proposed within their surface water subcatchments or those wetlands that will not be retained in the
future NHS, no water budget work is necessary. Where development or alterations to
drainage patterns are proposed in the surface water subcatchments, assessment of water budgets is required. Table 6.4A summarizes the outcomes of these discussions,
noting which wetlands within Sub-Area 51-1 require water budget or other considerations.
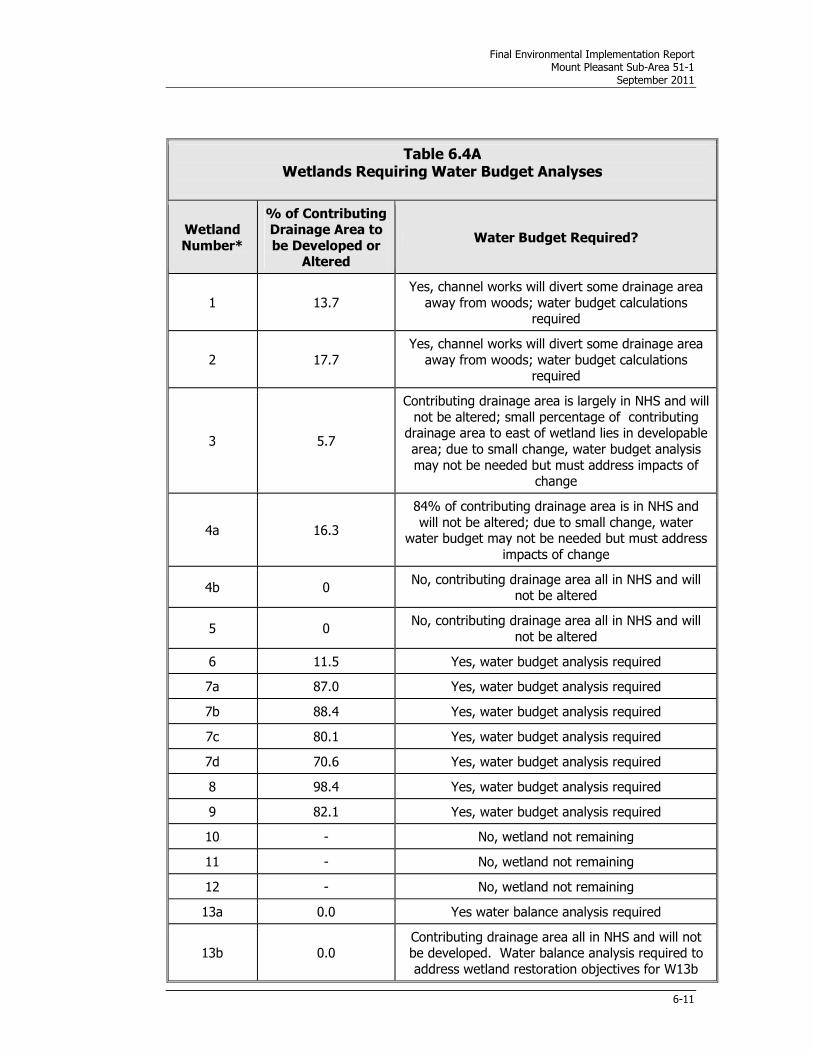
Final Environmental Implementation Report Mount Pleasant Sub-Area 51-1
September 2011
6-11
Table 6.4A Wetlands Requiring Water Budget Analyses
Wetland
Number*
% of Contributing Drainage Area to
be Developed or Altered
Water Budget Required?
1 13.7
Yes, channel works will divert some drainage area
away from woods; water budget calculations required
2 17.7
Yes, channel works will divert some drainage area
away from woods; water budget calculations required
3 5.7
Contributing drainage area is largely in NHS and will
not be altered; small percentage of contributing drainage area to east of wetland lies in developable
area; due to small change, water budget analysis
may not be needed but must address impacts of change
4a 16.3
84% of contributing drainage area is in NHS and
will not be altered; due to small change, water water budget may not be needed but must address
impacts of change
4b 0 No, contributing drainage area all in NHS and will
not be altered
5 0 No, contributing drainage area all in NHS and will
not be altered
6 11.5 Yes, water budget analysis required
7a 87.0 Yes, water budget analysis required
7b 88.4 Yes, water budget analysis required
7c 80.1 Yes, water budget analysis required
7d 70.6 Yes, water budget analysis required
8 98.4 Yes, water budget analysis required
9 82.1 Yes, water budget analysis required
10 - No, wetland not remaining
11 - No, wetland not remaining
12 - No, wetland not remaining
13a 0.0 Yes water balance analysis required
13b 0.0 Contributing drainage area all in NHS and will not be developed. Water balance analysis required to
address wetland restoration objectives for W13b

Final Environmental Implementation Report Mount Pleasant Sub-Area 51-1
September 2011
6-12
Table 6.4A Wetlands Requiring Water Budget Analyses
Wetland
Number*
% of Contributing Drainage Area to
be Developed or Altered
Water Budget Required?
13c 0 No, contributing drainage area all in NHS and will
not be altered
14 - No, wetland not remaining
48 - No, wetland not remaining
Proposed
Open Water/
Marsh
Wetland
- Yes, water balance analysis required
Refer to Drawing 6.3.1 for wetland locations and contributing drainage areas
6.5 Water Budget Methodology
6.5.1 Model Description and Background Water budget simulations were carried out for the wetlands identified in Sub-Area 51-1
using the EPA Stormwater Management Model (SWMM5 model engine). Model selection
was discussed during the EIR Workshops and a submission was made to the CVC on September 9, 2010 outlining the merits of this model for water budget modelling. The
selection of this model was subsequently accepted by the CVC.
The EPA Storm Water Management Model (SWMM) is a deterministic, dynamic rainfall-
runoff simulation model utilized for either single event or long-term (continuous)
simulation of runoff quantity and quality. The runoff component of SWMM operates on a
subcatchment area that receives precipitation and generates runoff based on land use,
climate data, and soil properties. SWMM accounts for various hydrologic processes that
produce runoff from rural and urban areas. SWMM can account for time- and spatially-
varying rainfall, evaporation, snow accumulation and melting, rainfall interception in
depression storage, and infiltration losses including soil wetting/drying.
The routing module of SWMM transports this runoff through a system of pipes, channels,
storage/treatment devices, pumps, and regulators. SWMM tracks the quantity of runoff generated within each subcatchment and the flow rate and flow depth in each model
element during a simulation period comprised of multiple time steps.
SWMM was first developed in 1971 and has undergone several major upgrades since
then. It continues to be widely utilized throughout the world for planning, analysis and design related to storm water runoff, combined sewers, sanitary sewers, and other
drainage systems, including non-urban areas as well. The SWMM engine is also used in
software such as PC-SWMM, OTTSWMM, DDSWMM, InfoSWMM, and XP-SWMM. The current edition, Version 5.0.21, runs under Windows to provide an integrated

Final Environmental Implementation Report Mount Pleasant Sub-Area 51-1
September 2011
6-13
environment for editing study area input data, running hydrologic, hydraulic and water quality simulations, and viewing the results in a variety of formats. These formats
include thematic mapping, time series graphs, tables and profile plots. In addition, EPA-
SWMM can produce statistical frequency analyses including summary statistics, rank-ordered events and return period analysis, histogram plots, and exceedance frequency
plots.
The Conservation Ontario “Integrated Watershed Management – Water Budget
Overview” document (October, 2009) lists the SWMM engine as a suitable model for subwatershed-scale water balance analysis. The latest version of SWMM was produced
by the Water Supply and Water Resources Division of the U.S. Environmental Protection Agency's National Risk Management Research Laboratory and is capable of modelling
various LID measures such as rain barrels, bio-swales, pervious pavement, etc.
6.5.2 Use of EPA-SWMM for Water Balance Analysis EPA-SWMM is ideal for water budget analyses as it can continuously simulate the major
components of the water cycle (precipitation, snowmelt, infiltration, storage, evaporation,
and runoff) with actual precipitation and temperature inputs. Note that while the model does not simulate transpiration directly, the evaporation parameters can be augmented
seasonally to account for this. A conceptual view of surface runoff routine used by SWMM is illustrated in following schematic:
depth
dep. storage
Each subcatchment surface is treated as a non-linear reservoir. Inflow comes from
precipitation and snowmelt as well as run-on from any designated upstream
subcatchments or point-source input. Outflows consist of infiltration, evaporation (corrected to include transpiration), and surface runoff. The capacity of this "reservoir" is
the maximum depression storage, which is the maximum surface storage provided by ponding, surface wetting, and interception. Surface runoff occurs only when the depth
of water in the "reservoir" exceeds the maximum depression storage. Depth of water

Final Environmental Implementation Report Mount Pleasant Sub-Area 51-1
September 2011
6-14
over the subcatchment is continuously updated with time by solving numerically a water balance equation over the subcatchment.
6.5.3 Model Approach
A detailed model was set up to determine the hydrology and response of the wetlands and their subcatchments in Sub-Area 51-1. Each wetland system was simulated as
depicted conceptually in the following schematic:
Lumped
Wetland
Storage
WetlandContributing
Drainage Area
Overflow weir
Climate
data
Climate
data
Free
outfall
The above schematic is representative of both existing and proposed conditions, with the
exception that under proposed conditions, part of the contributing drainage area includes
impervious roof top area as a mitigative measure to account for removed/diverted existing drainage area. Rainfall, runoff and initial abstractions (depression storage,
evapotranspiration, and infiltration losses) were considered over the contributing drainage area and the entire wetland area. The resulting runoff from the contributing
drainage area was directed to the wetland, and the total runoff from the contributing
drainage area and wetland area was directed to the storage component of the wetland area. Initial abstractions (infiltration loss and evapotranspiration) were also considered
for the wetland storage volume itself.
Bioswales are proposed between the contributing drainage area(s) and wetlands. Based on discussions with the CVC at EIR Workshops #8 and #10, these swales have not been
modelled, rather, a discussion of their functions is provided in Section 6.6.

Final Environmental Implementation Report Mount Pleasant Sub-Area 51-1
September 2011
6-15
Input data for the EPA-SWMM model representing the wetland drainage areas included:
• hourly precipitation data recorded at the Toronto Pearson Airport rain-gauge
(Station 6158733 - approximately 40 years available).
• minimum and maximum daily temperature data recorded at Toronto Pearson Airport, used for evaporation and snow-melt calculations (Station 6158733 -
approximately 40 years available).
• monthly average wind-speed from Toronto Pearson Airport, used for snow-melt
calculations (Environment Canada Climate Normals).
In addition to the time series data mentioned above, the following physical subcatchment
parameters were included in the model:
• drainage area; • land use;
• average catchment slope and overland flow length; • infiltration and evapotranspiration parameters; and,
• Manning’s roughness and initial abstractions (depression storage, etc.) based on
observed vegetation and site conditions.
There are often numerous small depressions within the wetlands and quantification of the available storage volume is difficult since numerous depressions are small and
shallow, are at different elevations, are isolated or interconnected and have no defined
outlets.
To attempt to best establish the existing seasonal variation in wetland water levels, a rough approximation of the wetland storage volume was attempted by estimating the
perimeter and average depth of the observed ponded area during recent field surveys (November 24, December 6 and 7, 2010). The storage volume for each wetland was
based on the maximum extent of visible ponding multiplied by the average observed
depth through the ponded area. In some cases, individual ponded areas noted in the field surveys were lumped together in the analyses.
Due to the inherent difficulties in estimating the storage capacity, a sensitivity analysis
was completed for each wetland to determine the range of potential water level
responses as it relates to storage volume. In addition to the simulation carried out for the initial (estimated) storage volume estimate described above, two additional
simulations were completed varying the storage estimate by:
i) 10x less storage; and,
ii) the use of the maximum observed ponded depths (from the 2009 and 2010
wetland monitoring data; Table B-6-1, Appendix B-6) to determine a maximum amount of storage. It is noted that the monitoring locations were
selected in the deepest pockets/channels, so may considerably overestimate the actual level of ponded water across the wetland features. This maximum
storage scenario is unlikely to occur as the estimated ponded areas for the
modelling include the range of depression sizes present; and the use of the maximum depth over the entire ponded area is unrealistic. Nevertheless, the
third scenario was used to determine sensitivity to storage estimates.

Final Environmental Implementation Report Mount Pleasant Sub-Area 51-1
September 2011
6-16
It should be noted that the “10x less storage” scenario was completed as the lower limit of the sensitivity analysis of the model to varying storage volume estimates. The “10x
less” scenario represented the lower limit of the estimated volume. This scenario
simulated “10x less” volume, not “10x less” depth.
All simulations were conducted for the time period of January 1, 1970 to October 19, 2010. Wetland water level results are presented graphically over the span of one year,
but each data point represents the water level for each individual day averaged over the
simulation time period. That is, the water level depicted for January 1st represents the average water level for every January 1st in the simulation period.
Since no measureable outlet rating curve was available for the wetlands, an overflow
weir-type outlet was selected to model the discharge from the wetland. The weir invert
was set at the top elevation of the storage and was the only outlet for the wetland storage (aside from infiltration and evapotranspiration). Flow is discharged from the
wetland only if the wetland storage volume is full and the contributing drainage area produces excess runoff. The weir parameters were selected such that there would be no
restrictions in the storage outflow (i.e., outflow = inflow when storage is full). The wetland outfall was assumed to be free (i.e., no tailwater effects).
For each wetland requiring a water budget calculation, multiple models were run including:
• Existing conditions scenarios with variable storage volume estimates (estimated
storage, 10x less storage and maximum storage depth).
• Post development without mitigation to determine the change in water levels
throughout the year due to development of the contributing area, which ultimately determined if mitigation was required.
• Post development with mitigation to determine the amount and type of
mitigation area (i.e., roof tops or other areas) where runoff would be directed to
the wetland so that post-development water levels meet wetland management objectives. Where roof areas were used for mitigation, the area was assessed
from 0 ha in 0.25 ha increments (each increment representing approximately 20
average roof tops) until the post-development and existing wetland water level curves obtained a good match or otherwise to satisfy wetland management
specific objectives.
Rooftop drainage into wetlands is proposed to outlet to bioswales located in the NHS
buffers adjacent to the wetlands. These have not been modelled. They are intended to slow down roof runoff, allow for evapotranspiration and infiltration to the extent feasible
prior to discharge into wetlands.
A complete list of all model parameters, including climatology, snow melt/snow pack, subcatchment, and storage parameters is included in Appendix G-3.
6.5.4 Comparison of Simulated Water Levels to Observed Water Levels
A review of simulated wetland water levels from the wetland modelling to monitored
water level data was completed and similarities and differences were identified. The observed and simulated water depths were normalized (i.e., by dividing all values in data

Final Environmental Implementation Report Mount Pleasant Sub-Area 51-1
September 2011
6-17
set by the maximum value in the data set, resulting in a maximum value of “1” to facilitate comparison between different data sets). Figures G-4-1 to G-4-7 in Appendix
G-4 illustrate the comparison of normalized simulation results to normalized observed
data.
In general, there was good agreement between the observed monitoring results and the simulated modelling results when comparing normalized values in the wetalnds. The
modelled and observed hydroperiods had similar wet and dry periods. The peak timing,
as well as the recession time, matched as well.
Some differences were noted in comparing the observed data with the simulated results. In particular, observed events in W7, W8 and W9 had high depths in the summer, when
the simulated results indicated low or no depth (i.e., dry). This can be attributed to:
• The observed data represent a particular year (2009 - 2010), while the simulated
data represent an average of 40 years of climate data. Therefore, storm events
and resulting water levels which occur infrequently may be lost in the simulation data averaging, while the observed measurements could have captured an
infrequent event.
• The difference between observed water levels and simulated water levels in the
summer months could be a result of the placement of the staff gauges.
Overall, modelled wetland hydroperiods compared well to the observations from the EIR
and HFSWS work.
6.6 Existing Conditions, Water Budget and Mitigative Measures This section is organized by wetland and includes discussion on existing conditions
characterization, management objectives, existing water budget, and proposed water budget with and without mitigative measures. Summary tables of information have been
provided for each wetland. The tables include details on size, type, condition,
monitoring, surface water, groundwater, soils, ELC, flora and fauna, etc. and conclude with recommended management objectives for each wetland that have guided the
assessment and recommendations of appropriate mitigative measures for implementation in each wetland’s subcatchment.
For some wetlands, the recommended mitigation measures design are intended to match the existing water supply volumes such that the pre-development wetland water balance,
and in particular hydroperiod, is mimicked as closely as possible for the post-development conditions. For other wetlands, (i.e., W4 and W13), the MNR has
expressed interest in increasing water supply through the elimination of ditching through/around the wetlands. Designing measures so that the wetlands continue to
receive adequate surface water runoff will ensure that the water levels in the features
will be maintained and, as well, will ensure that soil saturation and water table conditions beneath the features are maintained (i.e., that the wetlands will continue to support a
recharge function). This is achieved through directing roof water as a substitute for existing undeveloped contributing drainage areas. Through modelling, differing amounts
of rooftop areas were simulated to achieve a best match of peak water level and
hydroperiod. In general, adding more sources of runoff input into the wetlands increases the peak water level during the spring, but has a very minor effect on hydroperiod
duration. The modelled scenario with no rooftops and scenario with considerably more runoff inputs (i.e., roof-tops) have similar hydroperiods, but different peak water levels

Final Environmental Implementation Report Mount Pleasant Sub-Area 51-1
September 2011
6-18
during the spring. Therefore, increasing the peak does not impact the duration significantly. Refer to Figures 6.6.1.1 to 6.6.15.1 (post-development graphs).
As described in Section 6.5.3, the CVC staff recommended the use of swales between the post-development contributing drainage area and wetland feature to act as a “buffer”
between the relatively fast runoff response from the proposed roof top drainage system (as opposed to a slower response from the pre-development drainage area). These
swales will not significantly impact the volume of runoff approaching the wetland but
rather the peak flow timing.
It was suggested that mechanical control be provided at the outlet of the RDC system or swale to allow for “fine tuning” of the runoff input into the wetland features. However,
this has not been pursued further due to maintenance concerns raised by the City staff.
Opportunities to adjust the amount of rooftop drainage to wetlands without the need for annual/seasonal mechanical measures will be reviewed at detailed design.
The design of the swales is intended to act as a buffer between the impervious roof
surfaces and the wetland in order to introduce a lag in the hydrograph and be more representative of the natural conditions. While the proposed mitigation measures have
been demonstrated to match the volume and water level in the wetland at different
times of the year, the delivery of flow to the wetland can be matched closer to existing conditions by introducing the swale, rather than direct discharge. With respect to design
of the mitigation measures, the swales are intended to slow discharge into the wetland. The length and width of the swales will be maximized within the NHS buffers and will
follow the typical swale design criteria as defined in the TRCA/CVC LID Design Guidelines
(2010). These LID Design guidelines also indicate that, in addition to providing conveyance for rooftop, FDC, or rear-yard runoff, the swales can provide an opportunity
for sedimentation and infiltration into the root zone and underlying native soil (where suitable conditions exist). The swales will act as a flow-through system, i.e., there will be
no attenuation of runoff aside from those related to hydraulic losses.
6.6.1 Wetland 1 (Mayfield Woodland A)
6.6.1.1 Existing Conditions and Management Objectives
Existing wetland conditions are summarized in Table 6.6A. This table should be read in
conjunction with the review of Figure 6.6.1.1 that assists in understanding the
characterization outlined in Table 6.6A.
Table 6.6A
W1 - Summary of Existing Wetland Conditions
ATTRIBUTE COMMENTS (refer to Figure 6.6.1.1)
Wetland Size based on Draft
MNR Wetland Mapping (2007)
• 0.53 ha
Contributing Drainage Area
(including wetland area)
• 2.47 ha
% of Contributing Drainage Area to be Developed or
Altered
• 0% will be developed; however, 13.7% of catchment area will be modified by relocated channel that will direct drainage away from
wetland.
Wetland Type (isolated, riverine, palustrine)
• Palustrine without inflow.

Final Environmental Implementation Report Mount Pleasant Sub-Area 51-1
September 2011
6-19
Table 6.6A
W1 - Summary of Existing Wetland Conditions
ATTRIBUTE COMMENTS (refer to Figure 6.6.1.1)
Landscape Context • 1 of 3 headwater treed swamps within West Fletcher’s Creek
Watershed and 1 of 4 treed swamps within Mayfield Woodland A. Mayfield Woodland A has been on the landscape, in similar form
since at least 1946 (aerial photography).
Disturbance/Invasive Species • A treed swamp in largely natural condition. • Moderate presence of buckthorn.
• CVC Category I invasives: garlic mustard, common buckthorn; Category III invasives: bitter nightshade.
Monitoring • Visual inspections of the wetland hydroperiod were made during
the spring of 2009, 2010 and 2011 by Burnside. • MNR conducted wetland inventories (draft OWES) in 2005 and
2006. • Ecological Land Classification and three season botanical surveys
were completed by Dougan & Associates between 2006 and 2007.
• Winter wildlife surveys were completed in 2008-2009 by Savanta Inc.
• Winter raptor surveys were conducted between 2008-2009 by Savanta Inc.
• Breeding amphibian surveys were completed from 2005-2006
(Dougan & Associates) and 2008-2009 (Savanta Inc.). • Amphibian movement surveys were completed from 2008-2009 by
Savanta Inc. • Breeding bird surveys were completed from 2005-2007 (Dougan &
Associates) and 2008-2009 (Savanta Inc.).
Underlying Geology • Sandy silt till deposits.
Wetland Soil Conditions
(organics, mottles, gley)
• No gley recorded; 21cm to mottles (MNR).
Groundwater Conditions • The water table is interpreted to be approximately 3m below ground level and there is no evidence of groundwater discharge to
the wetland feature.
Surface Water Conditions • No perennial open water. • Intermittent shallow standing water in spring and following major
storm events. • Water accumulates in small vernal pools – maximum observed
water depth was 20cm in the deepest vernal pool in March 2011
(Table B-6-1; Appendix B).
Surface Water Inputs and Inlet
Conditions
• Direct precipitation and surface water runoff provide water supply
to this feature. • No inlet.
Outlet Conditions • Diffuse drainage into agricultural fields on the east side of Mayfield
Woodland A.

Final Environmental Implementation Report Mount Pleasant Sub-Area 51-1
September 2011
6-20
Table 6.6A
W1 - Summary of Existing Wetland Conditions
ATTRIBUTE COMMENTS (refer to Figure 6.6.1.1)
Hydroperiod • Shallow standing water is observed during and following the
snowmelt period. • Dougan & Associates reported vernal pools in early May 2006.
• Burnside observed wetland to be dry by late May 2009 and by the first week of May 2010. Under wet conditions in 2011, the wetland
had some areas of standing water until the first week of June.
Typical standing water period is estimated to be about 3 months (generally March/April/May).
ELC Vegetation Types • Green Ash Mineral Deciduous Swamp
Dominant Vegetation Species Per Strata
• Trees: green ash, shagbark hickory, swamp maple • Shrubs: green ash, swamp maple, shagbark hickory, blue beech
• Ground cover: running strawberry bush, sensitive fern
Flora • Rare in Ecodistrict 6E7: brome-like sedge, blunt broom sedge, wood reed grass, running strawberry-bush, shagbark hickory
• Uncommon in Ecodistrict 6E7: bur oak, fringed sedge, Carolina spring beauty, bristly greenbrier
Fish and Wildlife Use • No rare species.
Special Features/Other (i.e., hibernacula, vernal pools)
• Shallow vernal pools. • Freshwater clams, Fairy Shrimp, Scuds (MNR, 2007).
• No amphibian calls (Savanta Inc., 2008, 2009; Dougan, 2005)
Sensitivity to Water Budget Change
• Green ash swamp requires spring flooding followed by dry conditions from June onwards.
Management
Recommendations
• Wetland and buffers to be protected within NHS.
• Maintain as much of the pre-development areal size (ha) of pervious surface drainage into wetland as possible, recognizing
adjacent channel re-alignment. • Inlet should be overland flow.
• Develop Invasive Species Management Strategy
6.6.1.2 Hydrologic Characterization of Wetland 1
W1 is 0.53 ha in size and its contributing drainage area outside of the wetland is 1.94 ha,
as indicated on Drawing 6.3.1. W1 is classified as a palustrine; with no defined inflow
and intermittent outflow. It has no well-defined storage basin, or measurable outlet rating curve. As described in Section 6.5.3, a field survey was completed by Savanta Inc.
in December 2010 to estimate both the perimeter of the storage area and average water depth.
To model this wetland and its catchment, three simulations were conducted to assess the wetland’s sensitivity to storage volume estimates (as described in Section 6.5.3). The
preliminary approximation based on field investigations yielded a storage capacity of 540m3. The second simulation assumed that the wetland had one tenth of the capacity
(54m3), while the third simulation utilized the maximum depth observed in the field
(2009-2010) in the deepest location of the ponded area for a total volume estimate of 900m3.

Final Environmental Implementation Report Mount Pleasant Sub-Area 51-1
September 2011
6-21
The variation of simulated wetland water levels is indicated in Figure 6.6.1.2. The results show the range of wetland water levels resulting from the sensitivity analyses of
volume estimates. The resulting modelled range of fluctuation in wetland water levels is
relatively narrow. That is, there is typically a difference of less than 1cm to 2cm between the low and high volume estimates.
As expected, relative to other sensitivity analyses, the field volume estimate (540 m3)
resulted in slightly lower water levels throughout the year due to increased storage
capacity, while the low volume (10x less) estimate resulted in consistently higher water levels due to reduced storage capacity (Figure 6.6.1.2).
Based on the sensitivity analysis and the range of volumes considered, it is concluded
that the wetland water levels are not particularly sensitive to the amount of storage in
the wetland. This conclusion is likely because of the relatively small storage values and the fact that this wetland is a flow-through feature with limited ponding so water levels
cannot increase to depths over the maximum observed. Based on this analysis, the field estimate simulation is considered to be most representative of the wetland conditions
and was utilized as the target water levels.
As provided on Figure 6.6.1.2, on average, wetland water levels are high throughout
the winter and spring due to snow accumulation and lack of evapotranspiration. Following mid-April, water levels quickly decrease due to evapotranspiration. Although
precipitation occurs throughout the spring, summer, and fall, there is insufficient runoff volume from the contributing drainage area to fill the storage volume significantly due to
high evapotranspiration. These trends agree with field observations of the hydroperiod
as described in Table 6.6A, in which the wetland was dry between late May/early June until snow accumulation in late fall/early winter.
6.6.1.3 Mitigation Requirements
Under proposed conditions, the wetland area will remain unchanged (0.53 ha) and the
contributing drainage area (1.94 ha) will be modified due to the proposed channel
alignment. Approximately 0.34 ha will be directed away from the wetland. The remaining 1.60 ha contributing drainage area will continue to contribute runoff to the
wetland (refer to Drawing 11.3.2). It should be noted that part of the NHS buffer through the wetland can be directed back into the wetland (approximately 0.1 ha) via a
swale parallel to the channel. As indicated on Figure 6.6.1.3, with these changes to
drainage area and no development in this subcatchment, there is little expected change to the annual water level fluctuations. The existing hydroperiod post-development closes
matches current conditions which supports maintenance of the Green Ash Mineral Deciduous Swamp. Therefore no further mitigation beyond the direction of channel
buffer drainage to W1 is recommended.

Final Environmental Implementation Report Mount Pleasant Sub-Area 51-1
September 2011
6-22
6.6.2 Wetland 2 (Mayfield Woodland A)
6.6.2.1 Existing Conditions and Management Objectives
Existing wetland conditions are summarized in Table 6.6B. This table should be read in conjunction with the review of Figure 6.6.2.1 that assists in understanding the
characterization outlined in Table 6.6B.
Table 6.6B
W2 - Summary of Existing Wetland Conditions
ATTRIBUTE COMMENTS (refer to Figure 6.6.2.1)
Wetland Size based on Draft
MNR Wetland Mapping (2007)
• 1.08 ha
Contributing Drainage Area (including wetland area)
• 2.83 ha
% of Contributing Drainage
Area to be Developed or Altered
• 5.2% (0.15 ha) will be developed, however, note that an additional
12.5% (0.35 ha) of catchment area will be modified by relocated channel that will direct drainage away from wetland.
• In total, 17.7% (0.50 ha) of drainage area will be modified through development and channel design.
Wetland Type (isolated,
riverine, palustrine)
• Palustrine with inflow.
Landscape Context
• 1 of 3 headwater treed swamps within West Fletcher’s Creek Watershed and 1 of 4 treed swamps within Mayfield Woodland A.
Mayfield Woodland A has been on the landscape, in similar form since at least 1946 (aerial photography).
Disturbance/Invasive Species • A treed swamp in largely natural condition.
• Moderate presence of buckthorn. • CVC Category I invasives: garlic mustard, common buckthorn;
Category III invasives: bitter nightshade.
Monitoring • Visual inspections of the wetland hydroperiod were made during the spring of 2009, 2010 and 2011 by Burnside.
• MNR conducted wetland inventories (draft OWES) in 2005 and 2006.
• Ecological Land Classification and three season botanical surveys were completed by Dougan & Associates between 2006 and 2007.
• Winter wildlife surveys were completed in 2008-2009 by Savanta
Inc. • Winter raptor surveys were conducted between 2008-2009 by
Savanta Inc. • Breeding amphibian surveys were completed from 2005-2006
(Dougan & Associates) and 2008-2009 (Savanta Inc.).
• Amphibian movement surveys were completed from 2008-2009 by Savanta Inc.
• Breeding bird surveys were completed from 2005-2007 (Dougan & Associates) and 2008-2009 (Savanta Inc.).
Underlying Geology • Sandy silt till deposits.
Wetland Soil Conditions (organics, mottles, gley)
• Soil information not available; expect similar soil conditions to W1.

Final Environmental Implementation Report Mount Pleasant Sub-Area 51-1
September 2011
6-23
Table 6.6B
W2 - Summary of Existing Wetland Conditions
ATTRIBUTE COMMENTS (refer to Figure 6.6.2.1)
Groundwater Conditions • The water table is interpreted to be approximately 3m below
ground level and there is no evidence of groundwater discharge to the wetland feature.
Surface Water Conditions • No perennial open water.
• Intermittent shallow standing water in spring and following major storm events.
• Water occurs in small vernal pools - maximum observed water depth was 22cm in the deepest vernal pool in April 2010.
Surface Water Inputs and Inlet
Conditions
• Direct precipitation and surface water runoff provide water supply
to this feature. • One inlet (ill-defined agricultural swale) from west side of Mayfield
Woodland A.
Outlet Conditions • Diffuse drainage into agricultural fields on the east side of Mayfield Woodland A.
Hydroperiod • Shallow standing water is observed during and following the
snowmelt period. • Dougan & Associates reported vernal pools in early May 2006.
• Burnside observed this wetland to be dry by late May 2009 and by the first week of May 2010. Under wet conditions in 2011, the
wetland had some areas of standing water until the first week of June (Table B-6-1; Appendix B).
• Typical standing water period is estimated to be about 3 months
(generally March/April/May).
ELC Vegetation Types • Green Ash Mineral Deciduous Swamp
Dominant Vegetation Species
Per Strata
• Trees: green ash, shagbark hickory, swamp maple, basswood
• Shrubs: green ash, swamp maple, shagbark hickory • Ground cover: running strawberry-bush
Flora • Rare in Ecodistrict 6E7: brome-like sedge, blunt broom sedge,
wood reed grass, running strawberry-bush, shagbark hickory • Uncommon in Ecodistrict 6E7: bur oak, fringed sedge, Carolina
spring beauty, bristly greenbrier
Fish and Wildlife Use • No rare species.
Special Features/Other
(i.e., hibernacula, vernal pools)
• Shallow vernal pools.
• Freshwater clams (MNR, 2007). • No amphibian calls (Savanta Inc., 2008, 2009; Dougan, 2005).
• Several American Toads (MNR, 2007).
Sensitivity to Water Budget Change
• Green ash swamp requires spring flooding followed by dry conditions from June onwards.
Management
Recommendations
• Wetland and buffers to be protected within NHS.
• Maintain as much of the pre-development areal size (ha) of pervious surface drainage into wetland as possible, recognizing
adjacent channel re-alignment.
• Inlet should be overland flow. • Develop Invasive Species Management Strategy

Final Environmental Implementation Report Mount Pleasant Sub-Area 51-1
September 2011
6-24
6.6.2.2 Hydrologic Characterization of Wetland 2
W2 is 1.08 ha in size and its contributing drainage area is 1.76 ha, as indicated on
Drawing 6.3.1. W2 is classified as a palustrine; with intermittent inflow and outflow. It has no well-defined storage basin or measurable outlet rating curve. As described in
Section 6.5.3, a field survey was completed by Savanta Inc. to estimate both the perimeter of the storage area and average water depth.
To model this wetland and its catchment, three simulations were conducted to assess the wetland’s sensitivity to storage volume estimates. The preliminary approximation based
on field investigations yielded a storage capacity of 900m3. The second simulation assumed that the wetland had one tenth of the capacity (90m3), while the third
simulation utilized the maximum depth observed in the field (2009-2010) in the deepest
location of the ponded area for a total volume estimate of 1350m3.
The variation of simulated wetland water levels is indicated in Figure 6.6.2.2. The results show the range of wetland water levels resulting from the sensitivity analyses of
volume estimates. The resulting modelled range of fluctuation in wetland water levels is relatively narrow. That is, there is typically a difference of less than 1cm between the
low and high volume estimates.
As expected, relative to other sensitivity analyses, the field volume estimate (900m3)
resulted in slightly lower water levels throughout the year due to increased storage capacity, while the low volume (10x less) estimate resulted in consistently higher water
levels due to reduced storage capacity (Figure 6.6.2.2). Based on the sensitivity
analysis and the range of volumes considered, it is concluded that the wetland water levels are not particularly sensitive to the amount of storage in the wetland. This
conclusion is likely because of the relatively small storage values and the fact that this wetland is a flow-through feature so water levels cannot increase to depths over the
maximum observed. Based on this analysis, the field estimate simulation is considered to be most representative of the wetland conditions and was utilized as the mitigation
target.
As illustrated on Figure 6.6.2.2, on average, wetland water levels are high throughout
the winter and spring due to snow accumulation and lack of evapotranspiration. Following mid-April, water levels quickly decrease due to evapotranspiration. Although
precipitation occurs throughout the spring, summer, and fall, there is insufficient runoff
volume from the contributing drainage area to fill the storage volume significantly due to high evapotranspiration. These trends agree with field observations of the hydroperiod
as described in Table 6.6B, in which the wetland was dry between late May/early June until snow accumulation in late fall/early winter.
6.6.2.3 Mitigation Requirements
Under proposed conditions, the wetland area will remain unchanged (1.08 ha) and the contributing drainage area will be modified. From the existing 1.76 ha contributing
drainage area outside of the wetland, 0.4 ha will be developed and directed into the storm sewer system or diverted due to the grading associated with the proposed channel
alignment. The remaining 1.36 ha, made up of 1.26 ha of pervious NHS area and 0.1 ha
of channel buffer, will continue to contribute runoff to the wetland (refer to

Final Environmental Implementation Report Mount Pleasant Sub-Area 51-1
September 2011
6-25
Drawing 11.3.2). The resulting changes to water levels in W2, as a result of directing some runoff from the contributing drainage area away from the wetland, are indicated
on Figure 6.6.2.3. This figure illustrates the target water levels discussed in the
previous section as well as the simulation results for the modified wetland drainage area (i.e., 1.08 ha + 1.36 ha).
The loss of a portion of the existing contributing area reduces the existing wetland water
levels by 2cm during the winter and spring. While this is a relatively small depth change,
it suggests that the runoff from the contributing drainage area outside of the NHS is important to this wetland.
Potential water level changes associated with the model runs were discussed with
ecological team members to identify potential impacts of water levels
increases/decreases to the type of vegetation community in W2. Without mitigation, modelling confirms there would be a reduction in water levels between mid-March and
the end of June. W2 is a Green Ash Mineral Deciduous Swamp. To maintain this community post-development spring flooding is required, followed by dry summer
months (i.e., dry by early June). Continued flooding in summer months would bring about a change in vegetation types, from a treed swamp community to a graminoid
marsh (i.e., Cattail Shallow Mineral Marsh). Significantly reduced water levels in spring
from existing conditions would see an alteration in this community from a treed swamp to lowland forest or possibly upland forest community. Based on this review, it was
concluded that mitigation options must be identified to more closely match existing water levels to achieve wetland water budget objectives.
Several simulations were carried out to determine the required mitigation. In this case, as indicated in Figure 6.6.2.3, the addition of 0.1 ha of roof tops will provide runoff to
this wetland from adjacent developing areas to more closely match the long term average water level patterns in this wetland. As illustrated, with this mitigation, the post-
development wetland water levels are within ±1cm of the estimated existing wetland water levels. The modelling results demonstrate that the proposed mitigation area would
be sufficient to generally match the existing average daily water levels during the spring,
while not increasing the hydroperiod through the summer months.
Based on the preliminary block grading, it is feasible to direct drainage from 0.1 ha of roof tops into the wetland via a rear-lot/NHS buffer swale on the east side of the
wetland. Drawing 11.3.2 schematically shows this location.
6.6.3 Wetland 3 (Mayfield Woodland A) 6.6.3.1 Existing Conditions and Management Objectives
Existing wetland conditions are summarized in Table 6.6C. This table should be read in conjunction with the review of Figure 6.6.3.1 that assists in understanding the
characterization outlined in Table 6.6C.

Final Environmental Implementation Report Mount Pleasant Sub-Area 51-1
September 2011
6-26
Table 6.6C
W3 - Summary of Existing Wetland Conditions
ATTRIBUTE COMMENTS (refer to Figure 6.6.3.1)
Wetland Size based on Draft
MNR Wetland Mapping (2007)
• 0.58 ha
Contributing Drainage Area (including wetland area)
• 1.63 ha
% of Contributing Drainage Area to be Developed or
Altered
• 5.7% (0.09 ha)
Wetland Type (isolated, riverine, palustrine)
• Palustrine without inflow.
Landscape Context
• 1 of 3 headwater treed swamps within West Fletcher’s Creek
Watershed and 1 of 4 treed swamps within Mayfield Woodland A. Mayfield Woodland A has been on the landscape, in similar form
since at least 1946 (aerial photography).
Disturbance/Invasive Species • Moderate-aged treed swamp in natural condition. • CVC Category I invasives: garlic mustard; Category III invasives:
bitter nightshade.
Monitoring
• Visual inspections of the wetland hydroperiod were made during the spring of 2009, 2010 and 2011 by Burnside.
• MNR conducted wetland inventories (draft OWES) in 2005 and 2006.
• Ecological Land Classification and three season botanical surveys
were completed by Dougan & Associates between 2006 and 2007. • Winter wildlife surveys were completed in 2008-2009 by Savanta
Inc. • Winter raptor surveys were conducted between 2008-2009 by
Savanta Inc. • Breeding amphibian surveys were completed from 2005-2006
(Dougan & Associates) and 2008-2009 (Savanta Inc.).
• Amphibian surveys were completed from 2008-2009 by Savanta Inc.
• Breeding bird surveys were completed from 2005-2007 (Dougan & Associates) and 2008-2009 (Savanta Inc.).
Underlying Geology • Silty clay deposits.
Wetland Soil Conditions (organics, mottles, gley)
• Soil information not available.
Groundwater Conditions • The water table is estimated to be more than 2m below ground
level and there is no evidence of groundwater discharge to the wetland feature.
Surface Water Conditions • No perennial open water.
• Intermittent shallow standing water in spring and following major storm events.
• Water occurs in small vernal pools - maximum observed water
depth was 25cm in April 2011 (Table B-6-1; Appendix B).
Surface Water Inputs and Inlet
Conditions
• Direct precipitation and surface water runoff provide water supply
to this feature. • No inlet.

Final Environmental Implementation Report Mount Pleasant Sub-Area 51-1
September 2011
6-27
Table 6.6C
W3 - Summary of Existing Wetland Conditions
ATTRIBUTE COMMENTS (refer to Figure 6.6.3.1)
Outlet Conditions • Diffuse drainage into agricultural fields on the east side of Mayfield
Woodland A.
Hydroperiod • Shallow standing water is observed during and following the
snowmelt period.
• Dougan & Associates reported wetland dry in early May 2006. • Burnside observed this wetland to be dry by the end of May 2009
and by mid May 2010. Under wet conditions in 2011, the wetland had some areas of standing water until the first week of June
(Table B-6-1; Appendix B).
• Typical standing water period is estimated to be about 3 months (generally March/April/May).
ELC Vegetation Types • Green Ash Mineral Deciduous Swamp
Dominant Vegetation Species per strata
• Trees: green ash, swamp maple, shagbark hickory • Shrubs: green ash, blue beech, shagbark hickory
• Ground cover: running strawberry-bush, yellow dog’s tooth violet
Flora • Rare in Ecodistrict 6E7: shagbark hickory, Virginia spring beauty, running strawberry-bush
• Uncommon in Ecodistrict 6E7: bur oak, bristly greenbrier, fringed sedge
Fish and Wildlife Use • No rare species.
Special Features/Other (i.e., hibernacula, vernal pools)
• Shallow vernal pools. • Freshwater clams (MNR, 2007).
• No amphibian calls (Savanta Inc., 2008, 2009; Dougan, 2005)
Sensitivity to Water Budget Change
• Green ash swamp requires spring flooding followed by dry conditions from June onwards.
Management
Recommendations
• Wetland and buffers to be protected within NHS.
• Maintain as much of the pre-development areal size (ha) of pervious surface drainage into wetland as possible, recognizing
adjacent channel re-alignment. • Inlet should be overland flow.
• Develop Invasive Species Management Strategy
6.6.3.2 Hydrologic Characterization of Wetland 3
W3 is 0.58 ha in size and its contributing drainage area outside of the wetland is 1.05 ha, as indicated on Drawing 6.3.1. W3 is classified as a palustrine; with intermittent inflow
and outflow. It has no well-defined storage basin or measurable outlet rating curve. As
described in Section 6.5.3, a field survey was completed by Savanta Inc. to estimate both the perimeter of the storage area and average water depth.
To model this wetland and its catchment, three simulations were conducted to assess the
wetland’s sensitivity to storage volume estimates. The preliminary approximation based
on field investigations yielded a storage capacity of 50m3. The second simulation assumed that the wetland had one tenth of the capacity (5m3), while the third simulation
utilized the maximum depth observed in the field (2009-2010) in the deepest location of the ponded area for a total volume estimate of 100 m3.

Final Environmental Implementation Report Mount Pleasant Sub-Area 51-1
September 2011
6-28
The variation of simulated wetland water levels is indicated in Figure 6.6.3.2. The results illustrate the range of wetland water levels resulting from the sensitivity analyses
of volume estimates. The resulting modeled range of fluctuation in wetland water levels
is relatively narrow. That is, there is a typically a difference of less than 1cm between the low and high volume estimates.
As expected, relative to other sensitivity modeling analyses, the field volume estimate
(50m3) resulted in slightly lower water levels throughout the year due to increased
storage capacity, while the low volume (10x less) estimate resulted in consistently higher water levels due to reduced storage capacity (Figure 6.6.3.2). Based on the sensitivity
analysis and the range of volumes considered, it is concluded that the wetland water levels are not particularly sensitive to the amount of storage in the wetland. This
conclusion is likely because of the relatively small storage values, small contributing
drainage area and the fact that this wetland is a flow-through feature so water levels are unable to increase to depths over the maximum observed. Based on this analysis, the
field estimate simulation is considered to be most representative of the wetland conditions and was used as the mitigation target.
As depicted on Figure 6.6.3.2, on average, wetland water levels are high throughout
the winter and spring due to snow accumulation and lack of evapotranspiration.
Following mid-April, water levels quickly decrease due to evapotranspiration. Although precipitation occurs throughout the spring, summer, and fall, there is insufficient runoff
volume from the contributing drainage area to fill the storage volume significantly due to high evapotranspiration. These trends agree with field observations of the hydroperiod
as described in Table 6.6C, in which the wetland was dry between late May/early June
until snow accumulation in late fall/early winter.
6.6.3.3 Mitigation Requirements
Under proposed conditions, the wetland area will remain unchanged (0.58 ha) and a small area (0.09 ha) will be developed on the east side of the wetland and direct
drainage away from W3. Approximately 0.96 ha will continue to contribute runoff to the
wetland, a Green Ash Mineral Deciduous Swamp (refer to Drawing 11.3.2). As indicated on Figure 6.6.3.3, there will be little change to the annual water level
fluctuations due to the very small change in contributing drainage area and, therefore, mitigation is not required.
6.6.4 Wetland 4
6.6.4.1 Existing Conditions and Management Objectives
Existing wetland conditions are summarized in Table 6.6D. This table should be read in
conjunction with the review of Figure 6.6.4.1 that assists in understanding the characterization outlined in Table 6.6D.

Final Environmental Implementation Report Mount Pleasant Sub-Area 51-1
September 2011
6-29
Table 6.6D
W4 - Summary of Existing Wetland Conditions
ATTRIBUTE COMMENTS (refer to Figure 6.6.4.1)
Wetland Size based on Draft MNR Wetland Mapping (2007)
The W4 wetland is separated into two areas for discussion and these are referred to as W4a and W4b.
• Total Area W4 = 2.14 ha • Area W4a = 1.43 ha
• Area W4b = 0.71 ha
Contributing Drainage Area (including wetland area)
• Total Drainage Area to W4 = 4.02 ha • Drainage Area W4a = 2.26 ha
• Drainage Area W4b = 1.76 ha
% of Contributing Drainage Area to be Developed or
Altered
• W4a = 5.2% (0.12 ha) - note that an additional 11.1% (0.25 ha) of catchment area will be modified by relocated channel that will
direct drainage away from wetland. • In total for W4a, 16.3% (0.37 ha) of drainage area will be modified
through development and channel design.
• W4b = 0% (0 ha)
Wetland Type (isolated,
riverine, palustrine)
• W4a and W4b are palustrine without inflow.
Landscape Context
• 1 of 3 headwater treed swamps within East Huttonville Creek Watershed and 1 of 4 treed swamps within Mayfield Woodland A.
Mayfield Woodland A has been on the landscape, in similar form since at least 1946 (aerial photography).
Disturbance/Invasive Species • Agricultural drain (Clark Drain) constructed through W4, creating
W4a and W4b areas. A second drainage ditch (HV27) was constructed along the west side of W4a.
• There is a catchbasin that was installed at the south end of wetland
at the confluence of the two drains – outlet unknown. • There is also a catchbasin located on the west side of W4a outside
of wooded area – outlet unknown. • CVC Category I invasives: garlic mustard, common buckthorn;
Category III invasives: bitter nightshade.
Monitoring • Visual inspections of the wetland hydroperiod were made during the spring of 2009, 2010 and 2011 by Burnside.
• Monitoring well nest (MW10s/d) just north of wetland; two nests of two piezometers in drainage channel though center of wetland
(PZ3s/d just north of wetland and PZ4s/d at south end of wetland
near catchbasin (refer to Figure B-6-4; Appendix B-6). Another piezometer (PZ1-W4) and a staff gauge (SG4) were added in the
spring of 2011 within W4a to monitor conditions further away from the drainage channel (Figure B-6-4; Appendix B-6).
• Wells monitored monthly from November 2007 through December 2009 and seasonally in 2010 and part of 2011(refer to
Appendix B-4 for data and hydrographs).
• Piezometers monitored monthly from May 2008 through May 2010 and seasonally during the remainder of 2010 and 2011 (refer to
Appendix B-4 for data and hydrographs).

Final Environmental Implementation Report Mount Pleasant Sub-Area 51-1
September 2011
6-30
Table 6.6D
W4 - Summary of Existing Wetland Conditions
ATTRIBUTE COMMENTS (refer to Figure 6.6.4.1)
• MNR conducted wetland inventories (draft OWES) in 2005 and
2006. • Ecological Land Classification and three season botanical surveys
were completed by Dougan & Associates between 2006 and 2007. • Winter wildlife surveys were completed in 2008-2009 by Savanta
Inc.
• Winter raptor surveys were conducted between 2008-2009 by Savanta Inc.
• Breeding amphibian surveys were completed from 2005-2006 (Dougan & Associates) and 2008-2009 (Savanta Inc.).
• Amphibian surveys were completed from 2008-2009 by Savanta
Inc. • Breeding bird surveys were completed from 2005-2007 (Dougan &
Associates) and 2008-2009 (Savanta Inc.).
Underlying Geology • Clayey silt and sandy silt till deposits.
Wetland Soil Conditions
(organics, mottles, gley)
• 6cm of organics, 18cm to 26cm to mottles; and 50cm to gley
(Dougan & Associates, polygon 6, likely SWD2-2; W4a). • 50cm to 75cm to mottles (Dougan & Associates, polygon 7, likely
FOD5-6; east of W4b).
Groundwater Conditions • MW10s shows water table varies seasonally by 1.2m (Figure B-4-10; Appendix B-4) with a high level about 0.5 m below ground.
• The hydraulic gradient at MW10s/d is always down, i.e., recharge area.
• Piezometers PZ3s/d and PZ4s/d show the groundwater level in the
ditches ranges from grade in April and May to about 0.3 m below ground level during drier months (Figures B-4-38 and B-4-39;
Appendix B-4), with seasonal reversals of gradient showing the potential for discharge to the ditches draining the wetland area.
• The spring 2011 water table in the wetland at PZ1-W4 was more
than 1 m below grade (Figure B-4-50; Appendix B-4), although the groundwater level may not yet have reached static conditions
due to the very low hydraulic conductivity of the till in this area. • The data suggest the water table within the overall wetland area
will generally be within 1 m of ground level, with seasonal variations to ground level. The seasonal surface water ponding in
W4a will contribute to the high water table conditions.
• The potential groundwater contribution from the high water table conditions is estimated to be less than 1% of the total water supply
to the wetland feature.
Surface Water Conditions • No perennial open water. • Intermittent shallow standing water in spring and following major
storm events in W4a. • Water in W4a occurs in small vernal pools - maximum observed
water depth was 23cm in May 2011.
• W4a is drained to catchbasin by ditches on either side and minor seepage into the catchbasin at the confluence of the two ditches
(refer to Figure B-6-4; Appendix B-6) was observed on most site visits.

Final Environmental Implementation Report Mount Pleasant Sub-Area 51-1
September 2011
6-31
Table 6.6D
W4 - Summary of Existing Wetland Conditions
ATTRIBUTE COMMENTS (refer to Figure 6.6.4.1)
Surface Water Inputs and Inlet
Conditions
• Direct precipitation and surface water runoff are estimated to
provide 99% of the water supply to this feature. • No inlet to either wetland area.
• Clark Drain separates W4a and W4b. Drainage channel is deeply incised and provides no frequent flows into the wetland areas
(infrequent flooding of wetlands from drain may occur).
Outlet Conditions • Diffuse drainage from W4a to Clark Drain and HV27 (ditches on either side of wetland area).
• Diffuse drainage from W4b into Clark Drain.
• There is a catchbasin at the confluence of the Clark Drain and HV27 that captures water from both of these ditches; there is also
observed seepage from the east side of the catchbasin.
Hydroperiod • Shallow standing water is observed in W4a during and following the
snowmelt period.
• Dougan & Associates reported several small vernal pools in W4a in early May 2006.
• W4a was dry by the end of May 2009 and by the first week of May 2010.
• Typical standing water period in W4a is estimated to be less than 3
months. There is no evidence of any ponding in W4b. • Burnside observed this wetland to be dry by late May 2009 and by
the first week of May 2010. Under wet conditions in 2011, the wetland had some areas of standing water until the second week of
June (Table B-6-1; Appendix B). • Typical standing water period is estimated to be about 3 months
(generally March/April/May).
ELC Vegetation Types • Swamp Maple Mineral Deciduous Swamp
Dominant Vegetation Species
Per Strata
• Trees: swamp maple, green ash, basswood, white elm
• Shrubs: poison ivy • Ground cover: sensitive fern, poison ivy, fowl meadow grass, wood
reed grass, fringed sedge and hop sedge
Flora • Rare in Ecodistrict 6E7: shagbark hickory, purple cress, foxtail sedge, brome-like sedge, wood reed grass, Virginia spring beauty,
rough avens, running strawberry-bush, Michigan lily, climbing poison ivy, shagbark hickory
• Uncommon in Ecodistrict 6E7: fringed sedge, Tuckerman’s sedge,
bur oak
Fish & Wildlife Use • No rare species.
Special Features/Other
(i.e., hibernacula, vernal pools)
• Shallow vernal pools.
• Freshwater clams, Fairy Shrimp, Scuds (MNR, 2007). • No amphibian calls (Savanta Inc., 2008, 2009; Dougan, 2005).
Sensitivity to Water Budget
Change
• Swamp maple swamp requires extensive spring flooding (and
deeper water depths than green ash) followed by dry conditions from June onwards.
Management
Recommendations
• Wetland and buffers to be protected within NHS.
• Restore W4 wetland area through removal of Clark Drain that currently divides the wetland into the W4a and W4b areas and

Final Environmental Implementation Report Mount Pleasant Sub-Area 51-1
September 2011
6-32
Table 6.6D
W4 - Summary of Existing Wetland Conditions
ATTRIBUTE COMMENTS (refer to Figure 6.6.4.1)
removal of catchbasin that drains south end of wetland.
• Maintain as much of the pre-development areal size (ha) of pervious surface drainage into wetland as possible, recognizing
adjacent channel re-alignment. • Inlet should be overland flow.
• Develop Invasive Species Management Strategy
6.6.4.2 Hydrologic Characterization of Wetland 4
W4 is 2.14 ha in size and its contributing drainage area outside of the wetland is 1.87 ha,
as indicated on Drawing 6.3.1. The individual wetlands (i.e., “a” and “b”) are 1.43 ha and 0.71 ha with drainage areas outside of the wetland of 0.82 ha and 1.05 ha,
respectively. Note that W4b (east side of the existing East Huttonville Creek) does not contribute drainage to W4a (west side), nor does it have any storage. W4 is classified as
a palustrine; with no inflow and intermittent outflow. It has no well-defined storage
basin, outlet location or measurable outlet rating curve. As described in Section 6.5.3, a field survey was completed by Savanta Inc. to estimate both the perimeter of the storage
area and average water depth.
To model Wetland 4a and its catchment, three simulations were conducted to assess the wetland’s sensitivity to storage volume estimates. The preliminary approximation based
on field investigations yielded a storage capacity of 625m3. The second simulation
assumed that the wetland had one tenth of the capacity (62.5m3), while the third simulation utilized the maximum depth observed in the field (2009-2010) in the deepest
location of the ponded area for a total volume estimate of 750m3.
The variation of simulated wetland water levels is indicated in Figure 6.6.4.2. The
results indicate the range of wetland water levels resulting from the sensitivity analyses of volume estimates. The resulting modelled range of fluctuation in wetland water levels
is typically a difference of less than 1cm between the field and high volume estimates, and a difference of less than 3cm between the high and low estimates.
As expected, relative to other sensitivity modelling analyses, the field volume estimate
(625m3) resulted in slightly lower water levels throughout the year due to increased
storage capacity, while the low volume (10x less) estimate resulted in consistently higher water levels due to reduced storage capacity (Figure 6.6.4.2). Based on this analysis,
the field estimate simulation is considered to be most representative of the wetland conditions and was used as the mitigation target.
As shown on Figure 6.6.4.2, on average, wetland water levels are high throughout the winter and spring due to snow accumulation, and lack of evapotranspiration. Following
mid-April, water levels quickly decrease due to evapotranspiration. Although precipitation occurs throughout the spring, summer, and fall, there is insufficient runoff
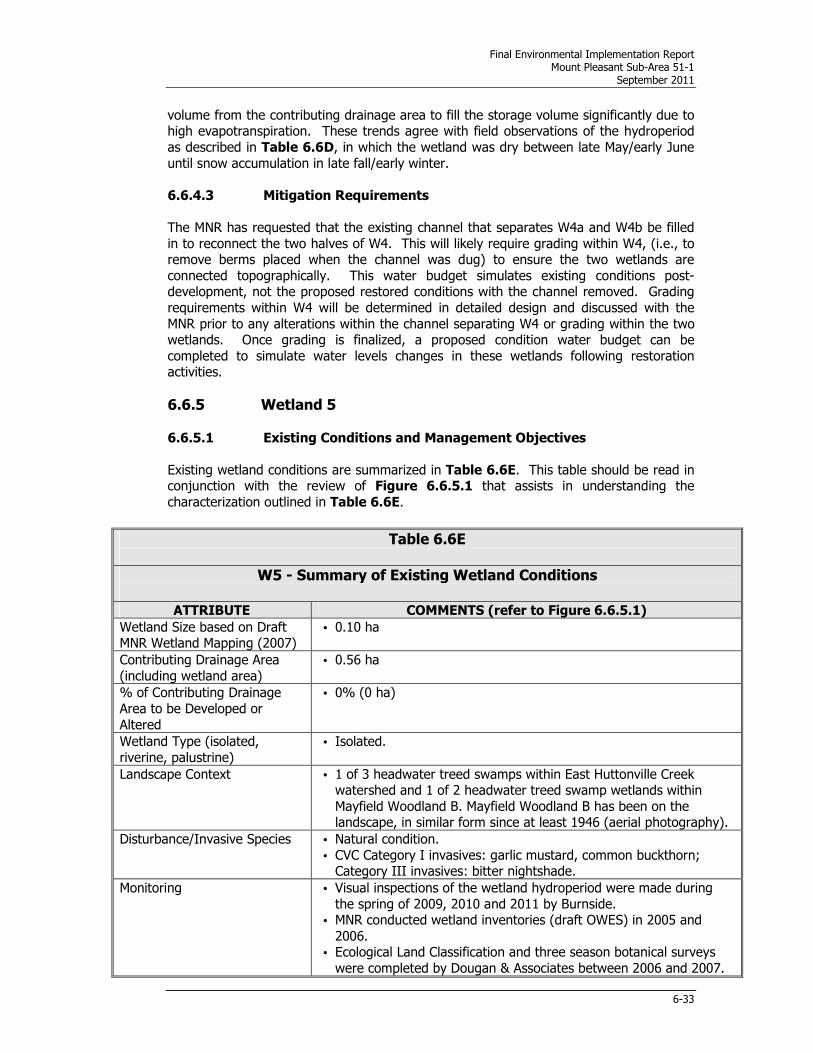
Final Environmental Implementation Report Mount Pleasant Sub-Area 51-1
September 2011
6-33
volume from the contributing drainage area to fill the storage volume significantly due to high evapotranspiration. These trends agree with field observations of the hydroperiod
as described in Table 6.6D, in which the wetland was dry between late May/early June
until snow accumulation in late fall/early winter.
6.6.4.3 Mitigation Requirements
The MNR has requested that the existing channel that separates W4a and W4b be filled
in to reconnect the two halves of W4. This will likely require grading within W4, (i.e., to remove berms placed when the channel was dug) to ensure the two wetlands are
connected topographically. This water budget simulates existing conditions post-development, not the proposed restored conditions with the channel removed. Grading
requirements within W4 will be determined in detailed design and discussed with the
MNR prior to any alterations within the channel separating W4 or grading within the two wetlands. Once grading is finalized, a proposed condition water budget can be
completed to simulate water levels changes in these wetlands following restoration activities.
6.6.5 Wetland 5
6.6.5.1 Existing Conditions and Management Objectives
Existing wetland conditions are summarized in Table 6.6E. This table should be read in conjunction with the review of Figure 6.6.5.1 that assists in understanding the
characterization outlined in Table 6.6E.
Table 6.6E
W5 - Summary of Existing Wetland Conditions
ATTRIBUTE COMMENTS (refer to Figure 6.6.5.1)
Wetland Size based on Draft MNR Wetland Mapping (2007)
• 0.10 ha
Contributing Drainage Area
(including wetland area)
• 0.56 ha
% of Contributing Drainage
Area to be Developed or
Altered
• 0% (0 ha)
Wetland Type (isolated,
riverine, palustrine)
• Isolated.
Landscape Context
• 1 of 3 headwater treed swamps within East Huttonville Creek watershed and 1 of 2 headwater treed swamp wetlands within
Mayfield Woodland B. Mayfield Woodland B has been on the landscape, in similar form since at least 1946 (aerial photography).
Disturbance/Invasive Species • Natural condition.
• CVC Category I invasives: garlic mustard, common buckthorn; Category III invasives: bitter nightshade.
Monitoring
• Visual inspections of the wetland hydroperiod were made during
the spring of 2009, 2010 and 2011 by Burnside. • MNR conducted wetland inventories (draft OWES) in 2005 and
2006. • Ecological Land Classification and three season botanical surveys
were completed by Dougan & Associates between 2006 and 2007.

Final Environmental Implementation Report Mount Pleasant Sub-Area 51-1
September 2011
6-34
Table 6.6E
W5 - Summary of Existing Wetland Conditions
ATTRIBUTE COMMENTS (refer to Figure 6.6.5.1)
• Winter wildlife surveys were completed in 2008-2009 by
Savanta Inc. • Winter raptor surveys were conducted between 2008-2009 by
Savanta Inc. • Breeding amphibian surveys were completed from 2005-2006
(Dougan & Associates) and 2008-2009 (Savanta Inc.).
• Amphibian movement surveys were completed from 2008-2009 by Savanta Inc.
• Breeding bird surveys were completed from 2005-2007 (Dougan & Associates) and 2008-2009 (Savanta Inc.).
Underlying Geology • Clayey silt deposits.
Wetland Soil Conditions (of organics, to mottles, to gley)
• Soil information not available.
Groundwater Conditions • The water table is estimated to be more than 1.5m below ground
level and there is no evidence of groundwater discharge to the wetland feature.
Surface Water Conditions • No perennial open water.
• Intermittent shallow standing water in spring. • Water occurs in very small vernal pools - maximum observed water
depth was 20cm in March 2010.
Surface Water Inputs and Inlet Conditions
• Direct precipitation and surface water runoff provide water supply to this feature.
• No inlet.
Outlet Conditions • No outlet.
Hydroperiod • Shallow standing water is observed during and following the
snowmelt period. • Burnside observed this wetland to be dry by the end of May 2009
and by the end of April 2010. Under wet conditions in 2011, the
wetland had some areas of standing water until the first week of June (Table B-6-1; Appendix B).
• Typical standing water period is estimated to be about 3 months (generally March/April/May).
ELC Vegetation Types • Green Ash Mineral Deciduous Swamp
Dominant Vegetation Species Per Strata
• Trees: green ash, shagbark hickory • Shrubs: green ash
• Narrow-leaved emergents: fowl meadow grass
• Ground Cover: herb Robert
Flora • Rare in Ecodistrict 6E7: shagbark hickory, running strawberry-bush
• Uncommon in Ecodistrict 6E7: fringed sedge, bur oak
Fish and Wildlife Use • No rare species.
Special Features/Other
(i.e., hibernacula, vernal pools)
• Shallow vernal pool.
• Freshwater clams (MNR, 2007).
• No amphibian calls (Savanta Inc., 2008, 2009; Dougan, 2005).
Sensitivity to Water Budget
Change
• Green ash swamp requires spring flooding followed by dry
conditions from June onwards.
Management Recommendations
• Wetland, buffer and contributing drainage area to be protected within NHS.
• Develop Invasive Species Management Strategy

Final Environmental Implementation Report Mount Pleasant Sub-Area 51-1
September 2011
6-35
Under proposed conditions, the wetland (a Green Ash Mineral Deciduous Swamp) will
remain unchanged (0.1 ha) and the contributing drainage area will not be modified. The
entire existing 0.46 ha contributing drainage area outside of the wetland will continue to contribute runoff to the wetland. As a result, no water budget analyses are required.
6.6.6 Wetland 6
6.6.6.1 Existing Conditions and Management Objectives
Existing wetland conditions are summarized in Table 6.6F. This table should be read in conjunction with the review of Figure 6.6.6.1 that assists in understanding the
characterization outlined in Table 6.6F.
Table 6.6F
W6 - Summary of Existing Wetland Conditions
ATTRIBUTE COMMENTS (refer to Figure 6.6.6.1)
Wetland Size based on Draft
MNR Wetland mapping (2007)
• 0.17 ha
Contributing Drainage Area (including wetland area)
• 0.86 ha
% of Contributing Drainage
Area to be Developed or Altered
• 11.5% (0.10 ha)
Wetland Type (isolated,
riverine, palustrine)
• Palustrine without inflow.
Landscape Context
• 1 of 3 headwater treed swamps within East Huttonville Creek
watershed and1 of 2 headwater treed swamps within Mayfield Woodland B. Mayfield Woodland B has been on the landscape, in
similar form since at least 1946 (aerial photography).
Disturbance/ Invasive Species • Natural condition. • CVC Category I invasives: garlic mustard, common buckthorn;
Category III invasives: bitter nightshade.
Monitoring
• Visual inspections of the wetland hydroperiod were made during the spring of 2009, 2010 and 2011 by Burnside.
• MNR conducted wetland inventories (draft OWES) in 2005 and 2006.
• Ecological Land Classification and three season botanical surveys
were completed by Dougan & Associates between 2006 and 2007. • Winter wildlife surveys were completed in 2008-2009 by Savanta
Inc. • Winter raptor surveys were conducted between 2008-2009 by
Savanta Inc.
• Breeding amphibian surveys were completed from 2005-2006 (Dougan & Associates) and 2008-2009 (Savanta Inc.).
• Amphibian movement surveys were completed from 2008-2009 by Savanta Inc.
• Breeding bird surveys were completed from 2005-2007 (Dougan & Associates) and 2008-2009 (Savanta Inc.).
Underlying Geology • Clayey silt deposits.

Final Environmental Implementation Report Mount Pleasant Sub-Area 51-1
September 2011
6-36
Table 6.6F
W6 - Summary of Existing Wetland Conditions
ATTRIBUTE COMMENTS (refer to Figure 6.6.6.1)
Wetland Soil Conditions
(organics, mottles, gley)
• Soil information not available.
Groundwater Conditions • The water table is estimated to be more than 1.5m below ground
level and there is no evidence of groundwater discharge to the
wetland feature.
Surface Water Conditions • No perennial open water.
• Intermittent shallow standing water in spring. • Water occurs in small vernal pools - maximum observed water
depth was 12cm in the deepest vernal pool in March 2010.
Surface Water Inputs and Inlet Conditions
• Direct precipitation and surface water runoff provide water supply to this feature.
• No inlet.
Outlet Conditions • Diffuse drainage into agricultural fields on the east side of Mayfield Woodland B
Hydroperiod • Shallow standing water is observed during and following the
snowmelt period. • Burnside observed this wetland to be dry by the end of May 2009
and by the end of April 2010. Under wet conditions in 2011, the wetland had some areas of standing water until the last week of
May (Table B-6-1; Appendix B).
• Typical standing water period is estimated to be about 3 months (generally March/April/May).
ELC Vegetation Types • Green Ash Mineral Deciduous Swamp
Dominant Vegetation Species Per Strata
• Trees: green ash, basswood • Shrubs: green ash
• Narrow-leaved emergents: fowl meadow grass • Ground Cover: herb Robert
Flora • Rare in Ecodistrict 6E7: shagbark hickory, running strawberry-
bush, brome-like sedge, Virginia spring beauty • Uncommon in Ecodistrict 6E7: fringed sedge, bur oak
Fish and Wildlife Use • No rare species.
Special Features/Other (i.e., hibernacula, vernal pools)
• Shallow vernal pool. • Freshwater clams (MNR, 2007).
• No amphibian calls (Savanta Inc., 2008, 2009; Dougan, 2005).
Sensitivity to Water Budget Change
• Green ash swamp requires spring flooding followed by dry conditions from June onwards.
Management
Recommendations
• Wetland and buffers to be protected within NHS.
• Maintain as much of the pre-development areal size (ha) of pervious surface drainage into wetland as possible.
• Inlet should be overland flow. • Develop Invasive Species Management Strategy
6.6.6.2 Hydrologic Characterization of Wetland 6
W6 is 0.17 ha in size and its contributing drainage area outside of the wetland is 0.69 ha,
as indicated on Drawing 6.3.1. W6 is classified as a palustrine; with no inflow and intermittent outflow. It has no well-defined storage basin, outlet location or measurable

Final Environmental Implementation Report Mount Pleasant Sub-Area 51-1
September 2011
6-37
outlet rating curve. As described in Section 6.5.3, a field survey was completed by Savanta Inc. to estimate both the perimeter of the storage area and average water
depth.
To model this wetland and its catchment, three simulations were conducted to assess the
wetland’s sensitivity to storage volume estimates. The preliminary approximation based on field investigations yielded a storage capacity of 40m3. The second simulation
assumed that the wetland had one tenth of the capacity (4m3), while the third simulation
utilized the maximum depth observed in the field (2009-2010) in the deepest location of the ponded area for a total volume estimate of 80m3.
The variation of simulated wetland water levels is indicated in Figure 6.6.6.2. The
results show the range of wetland water levels resulting from the sensitivity analyses of
volume estimates. The resulting modelled range of fluctuation in wetland water levels is relatively narrow. That is, there is a typically a difference of less than 1cm between the
low and high volume estimates.
As expected, relative to other sensitivity modelling analyses, the field volume estimate (40m3) resulted in slightly lower water levels throughout the year due to increased
storage capacity, while the low volume (10x less) estimate resulted in consistently
slightly higher water levels due to reduced storage capacity.
Based on the sensitivity analysis and the range of volumes considered, it is concluded that the wetland water levels are not particularly sensitive to the amount of storage in
the wetland. This conclusion is likely because of the relatively small storage values, and
the fact that this wetland is a flow-through feature so water levels cannot increase to depths over the maximum observed. Based on this analysis, the field estimate
simulation is considered to be most representative of the wetland conditions and was used as the mitigation target.
As illustrated on Figure 6.6.6.2, on average, wetland water levels are high throughout
the winter and spring due to snow accumulation, and lack of evapotranspiration.
Following mid-April, water levels quickly decrease due to evapotranspiration. Although precipitation occurs throughout the spring, summer, and fall, there is insufficient runoff
volume from the contributing drainage area to fill the storage volume significantly due to high evapotranspiration. These trends agree with field observations of the hydroperiod,
as described in Table 6.6F, in which the wetland was dry between late May/early June
until snow accumulation in late fall/early winter.
6.6.6.3 Mitigation Requirements
Under proposed conditions, the wetland area will remain unchanged (0.17 ha) and the
contributing drainage area will be marginally modified. From the existing 0.69 ha contributing drainage area outside of the wetland, only 0.1 ha will be developed and
directed into the storm sewer system. The remaining 0.59 ha, made up of pervious NHS area, will continue to contribute runoff to the wetland (refer to Drawing 11.3.2). The
resulting changes to water levels in W6 as a result of directing a small portion of the contributing drainage area away from the wetland are indicated on Figure 6.6.6.3. This
figure illustrates the target water level fluctuations discussed in the previous section as
well as the simulation results for the modified wetland drainage area (i.e., 0.1 ha + 0.59 ha).
The minimal change in the existing contributing area results in a marginal difference in
water levels during the winter and spring. Based on the simulation results described

Final Environmental Implementation Report Mount Pleasant Sub-Area 51-1
September 2011
6-38
above, mitigation is not required to maintain water levels in the wetland in an acceptable range to meet wetland management objectives.
6.6.7 Wetland 7
6.6.7.1 Existing Conditions and Management Objectives
Existing wetland conditions are summarized in Table 6.6G. This table should be read in
conjunction with the review of Figures 6.6.7.1, 6.6.7.4, 6.6.7.5 and 6.6.7.9 that assist in understanding the characterization outlined in Table 6.6G.
Table 6.6G
W7 - Summary of Existing Wetland Conditions
ATTRIBUTE COMMENTS
Wetland Size based on Draft MNR Wetland Mapping
(2007)
The W7 wetland is separated into four areas for discussion and these are referred to as W7a, W7b, W7c and W7d.
• Total Area W7 = 3.55 ha • Area W7a = 0.64 ha
• Area W7b = 0.43 ha • Area W7c = 0.41 ha
• Area W7d = 2.07 ha
Contributing Drainage Area (including wetland area)
• Total Drainage Area to W7 = 36.08 ha • Drainage Area W7a = 11.88 ha
• Drainage Area W7b = 5.41 ha
• Drainage Area W7c = 5.22 ha • Drainage Area W7d = 13.57 ha
% of Contributing Drainage
Area to be Developed or Altered
• W7a = 87.0%(10.33 ha)
• W7b = 88.4% (4.78 ha) • W7c = 80.1% (4.18 ha)
• W7d = 70.6% (9.58 ha)
Wetland Type (isolated,
riverine, palustrine)
• W7a, W7b, W7c, and W7d = palustrine with inflow.
Landscape Context
• W7 = receive inputs from west agricultural swales and outlets into East Huttonville Creek at east end.
• W7a = meadow marsh located south of Wanless Road, and
immediately north of Wanless Woodland A. Is absent from 1946 aerial photography and starting to form in 1960 mapping.
• W7b = Wanless Woodland A (small treed swamp), with meadow marsh to the north and the south. Present on the landscape in similar
shape since 1946. • W7c = meadow marsh located south of Wanless Woodland A and
north of Wanless Woodland B. Present on landscape since 1946.
• W7d = Treed swamp within Wanless Woodland B. There are two wetland pockets that are not hydrologically connected to one another.
The main wetland pocket contains the staff gauge and is centrally located. The secondary wetland pocket is in the southwest corner of
the wetland, and has its own ill-defined inlet and outlet. 1946 air
photos reveal an open patchy woodland system with large patches of wet and dry meadow.

Final Environmental Implementation Report Mount Pleasant Sub-Area 51-1
September 2011
6-39
Table 6.6G
W7 - Summary of Existing Wetland Conditions
ATTRIBUTE COMMENTS
Disturbance/Invasive Species • East Huttonville Creek has been reconstructed as a well-defined
agricultural ditch along entire length of the east side of W7. • W7b is highly disturbed, likely as a result of lack of water due to
interrupted drainage. CVC Category I invasives: garlic mustard, common buckthorn, Manitoba maple, Norway Maple; Category III
invasives: bitter nightshade.
• W7d is moderately disturbed. CVC Category I invasives: garlic mustard, common buckthorn; Category III invasives: bitter
nightshade. • W7a and W7c: CVC Category II invasives: Kentucky bluegrass, tufted
vetch, orchard grass, bird’s-foot trefoil.
Monitoring • Visual inspections of the wetland hydroperiod were made during the spring of 2009, 2010 and 2011 by Burnside.
• A staff gauge (SG7) was installed near the centre of the W7d woodlot in a shallow depression.
• Groundwater monitoring wells surround the woodlot (MW5s/d, MW6
and MW7). • Piezometer nests are located in East Huttonville Creek along the east
side of feature (PZ5s/d, PZ6s/d). • Wells monitored monthly from October 2007 through December 2009
and seasonally in 2010 and part of 2011 (refer to Appendix B-4 for
data and hydrographs). • Piezometers and staff gauge monitored monthly from May 2008
through May 2010 and seasonally during the remainder of 2010 and part of 2011 (refer to Appendix B-4 for piezometer data and
hydrographs and Appendix B-6 for staff gauge data). • MNR conducted wetland inventories (draft OWES) in 2005 and 2006.
• Ecological Land Classification and three season botanical surveys were
completed by Dougan & Associates between 2006 and 2007. • Winter wildlife surveys were completed in 2008 by Savanta Inc.
• Winter raptor surveys were conducted between 2008-2009 by Savanta Inc.
• Breeding amphibian surveys were completed from 2005-2006 (Dougan
& Associates) and 2008-2009 (Savanta Inc.). • Amphibian movement surveys were completed from 2008-2009 by
Savanta Inc. • Breeding bird surveys were completed from 2005-2007 (Dougan &
Associates) and 2008-2009 (Savanta Inc.).
Underlying Geology • Clayey silt and silty sand till deposits.
Wetland Soil Conditions (of
organics, to mottles, to gley)
• W7b - no gley recorded; 20cm to mottles (MNR).
Groundwater Conditions
• MW5s/d data show minor upward hydraulic gradients on the east side of the wetland where it drains into EHC (refer to Figure B-6-7;
Appendix B-6 for well location and hydrographs on Figures B-4-5a
and 5b; Appendix B-4). The water level data show the groundwater level in the ditch ranges from grade in April to about 0.45m below
ground level during drier months with seasonal reversals of gradient. MW6 data show the groundwater level ranges from 0.6m to 2m below

Final Environmental Implementation Report Mount Pleasant Sub-Area 51-1
September 2011
6-40
Table 6.6G
W7 - Summary of Existing Wetland Conditions
ATTRIBUTE COMMENTS
grade with a seasonal variation of 1.4m (hydrograph provided in
Appendix B-4). • MW7 is on the west side of the wetland (Figure B-6-7, Appendix B-6)
and shows artesian pressures from depth (Figure B-4-7; Appendix B-4). The upward gradients are interpreted to help sustain
the high water table in the wetland area although the flow volume is
limited by the tight soils. • The potential groundwater contribution, considering both the lateral
flow and vertical discharge conditions, is estimated to be less than 2% of the total water supply to the wetland feature.
Surface Water Conditions • No perennial open water.
• Eastern end of W7 floods occasionally from East Huttonville Creek. • Intermittent shallow standing water is observed in W7d in spring and
following major storm events. • A small defined channel exists in W7a from inlet to outlet. Similarly,
there is a small defined channel in W7c from inlet to outlet.
• Water occurs in small vernal pools in W7d - maximum observed water depth was 20cm at SG7 in May 2009.
Surface Water Inputs and
Inlet Conditions
• Direct precipitation and surface water runoff are estimated to provide
98% of the water supply to wetland. • All inlet locations are well defined as depicted on Figure 6.2.7.1.
• W7a - there are two inlets from the west agricultural fields. Within W7a they join (just above W7b) and channel heads east toward outlet.
• W7b - a small side channel from W7a inlet terminates at northwest end of W7b.
• W7c - from west agricultural fields.
• W7d - from west and south agricultural fields.
Outlet Conditions • W7a - outlets to East Huttonville Creek.
• W7b - incised W7a channel at northeast corner which outlets water
into East Huttonville Creek. W7b may indirectly drain into this channel.
• W7c – small defined channel through W7c outlets into East Huttonville Creek.
• W7d - diffuse drainage into East Huttonville Creek.
Hydroperiod • No standing water has been observed in W7b. • Shallow standing water was observed in the W7a, W7c and W7d areas
during and following the snowmelt period. • Dougan & Associates reported small vernal pools in W7d in early May
2006.
• Burnside observed W7d to be dry by mid June 2009 and by the end of May 2010. Under wet conditions in 2011, the wetland had some areas
of standing water until mid-June (Table B-6-1; Appendix B). • Typical standing water period is estimated to be about 3 months
(generally March/April/May).
ELC Vegetation Types • W7a and W7c - Reed-canary Grass Mineral Meadow Marsh • W7b and W7d - Green Ash Mineral Deciduous Swamp

Final Environmental Implementation Report Mount Pleasant Sub-Area 51-1
September 2011
6-41
Table 6.6G
W7 - Summary of Existing Wetland Conditions
ATTRIBUTE COMMENTS
Dominant Vegetation
Species Per Strata
• W7a and W7c - Narrow-leaved emergents: reed-canary grass.
• W7b - Trees: green ash, white elm; Shrubs: common buckthorn; Ground cover: garlic mustard
• W7d - Trees: green ash, swamp maple; Shrubs: green ash; Narrow-leaved emergents: fowl meadow grass
Flora • Rare in Ecodistrict 6E7: bulbous cress, brome-like sedge, shagbark
hickory, running strawberry-bush, Michigan lily • Uncommon in Ecodistrict 6E7: Carolina spring beauty, bur oak, Le
Conte’s violet
Fish and Wildlife Use • No rare species.
Special Features/Other
(i.e., hibernacula, vernal
pools)
• Shallow vernal pools.
• Pond snails, freshwater clams, Scuds (MNR, 2007).
• Gray Treefrog and several American Toads (MNR, 2005, 2007). • No amphibian calls (Savanta Inc., 2008, 2009; Dougan, 2005)
Sensitivity to Water Budget
Change
• W7a, W7c – Reed-canary grass meadow marsh has a wide ecological
amplitude to moisture conditions, from saturated to moist. • W7b, W7d - Green ash swamp requires spring flooding followed by dry
conditions from June onwards.
Management
Recommendations
• Wetland and buffers to be protected within NHS.
• W7a and W7c – manage water supply to replicate inlet and outlet
locations; maintain average annual runoff volumes. • W7b - manage water supply to direct additional water to flood out
invasive species and re-create treed swamp community conditions. • W7d – manage water supply to replicate inlet and outlet locations;
provide wet spring conditions and dry summer period.
• Inlets should be overland flow. • Maintain existing East Huttonville Creek as outlet from these wetlands.
• W7 - Develop Invasive Species Management Strategy
6.6.7.2 Hydrologic Characterization of Wetland 7a
W7a is 0.64 ha in size and its contributing drainage area outside of the wetland is 11.24 ha, as indicated on Drawing 6.3.1. W7a is classified as a palustrine; with
intermittent inflow and outflow. It has no well-defined storage basin or measurable outlet rating curve. As described in Section 6.5.3, a field survey was completed by
Savanta Inc. to estimate both the perimeter of the storage area and average water depth.
To model this wetland and its catchment, three simulations were conducted to assess the wetland’s sensitivity to storage volume estimates. The preliminary approximation based
on field investigations yielded a storage capacity of 645m3. The second simulation assumed that the wetland had one tenth of the capacity (64.5m3), while the third
simulation utilized the maximum depth observed in the field (2009-2010) in the deepest
location of the ponded area for a total volume estimate of 860m3.
The variation of simulated wetland water levels is indicated in Figure 6.6.7.2. The results indicate the range of wetland water levels resulting from the sensitivity analyses
of volume estimates. The resulting modelled range of fluctuation in wetland water levels

Final Environmental Implementation Report Mount Pleasant Sub-Area 51-1
September 2011
6-42
is relatively narrow. That is, there is a typically a difference of less than 1cm between the low and high volume estimates.
As expected, relative to other sensitivity modelling analyses, the field volume estimate (645m3) resulted in slightly lower water levels throughout the year due to increased
storage capacity, while the low volume (10x less) estimate resulted in consistently slightly higher water levels due to reduced storage capacity.
Based on the sensitivity analysis and the range of volumes considered, it is concluded that the wetland water levels are not particularly sensitive to the amount of storage in
the wetland. This conclusion is likely because of the relatively small storage values and the fact that this wetland is a flow-through feature so water levels cannot increase to
depths over the maximum observed. Based on this analysis, the field estimate
simulation is considered to be representative of the wetland conditions and was used as the mitigation target.
As illustrated on Figure 6.6.7.2, on average, wetland water levels are high throughout
the winter and spring due to snow accumulation and lack of evapotranspiration. Following mid-April, water levels quickly decrease due to evapotranspiration. Although
precipitation occurs throughout the spring, summer and fall, there is insufficient runoff
volume from the contributing drainage area to fill the storage volume significantly due to high evapotranspiration. These trends agree with field observations of the hydroperiod
as described in Table 6.6G, in which the wetland was dry between late May/early June until snow accumulation in late fall/early winter.
6.6.7.3 Wetland 7a Mitigation Requirements
Under proposed conditions, the wetland area will remain unchanged (0.64 ha) and the contributing drainage area will be modified. From the existing 11.24 ha contributing
drainage area outside of the wetland, 10.33 ha will be developed and directed into the storm sewer system. The remaining 0.91 ha, made up of pervious NHS area, will
continue to contribute runoff to the wetland (refer to Drawing 11.3.2). The resulting
changes to water levels in W7a as a result of directing runoff from most of the contributing drainage area away from the wetland are indicated on Figure 6.6.7.3. This
figure illustrates the target water level fluctuations discussed in the previous section as well as the simulation results for the modified wetland drainage area (i.e., 0.64 ha
+ 0.36 ha).
The loss of a portion of the existing contributing area reduces the existing wetland water
levels by nearly 5cm during the winter and spring. This suggests that the runoff from the contributing drainage area outside of the wetland is important to maintain wetland
water levels.
Potential water level changes associated with the model runs were discussed with
ecological team members to identify potential impacts of water levels increases/decreases to the type of vegetation community in W7a. Without mitigation,
modelling illustrates there would be a reduction in water levels between November to July. W7a is a Reed Canary Grass Mineral Meadow Marsh. While it has a wide ecological
amplitude to moisture conditions, from saturated to moist, a reduction in water levels
during this time period may bring about a change in vegetation types, from a mineral meadow marsh community to an upland meadow. Based on this review, it was
concluded that mitigation options should be identified to more closely match existing spring water levels to achieve wetland water budget objectives.

Final Environmental Implementation Report Mount Pleasant Sub-Area 51-1
September 2011
6-43
Several simulations were carried out to determine the required mitigation. In this case, as indicated in Figure 6.6.7.3, the addition of 0.3 ha of roof tops will provide runoff to
this wetland from adjacent developing areas to more closely match the long term
average water level patterns in this wetland. As indicated, with this mitigation, the post-development wetland water levels are within ±1cm of the estimated existing wetland
water levels. The modelling results demonstrate that the proposed mitigation area would be sufficient to generally match the existing average daily water levels during the spring,
while not increasing the hydroperiod through the summer months.
Based on the preliminary block grading, it is feasible to direct 0.3 ha of roof tops into the
wetland via a rear-lot/NHS buffer swale connected to the existing inlet to the wetland. Drawing 11.3.2 schematically illustrates the location of the rooftop drainage required
to the wetland.
6.6.7.4 Hydrologic Characterization of Existing Wetland 7b
W7b is 0.43 ha in size and its contributing drainage area outside of the wetland is
4.98 ha, as indicated on Drawing 6.3.1. W7b is classified as a palustrine; with intermittent inflow and outflow. Standing water has not been observed in W7b and
therefore no storage assessment was conducted. This wetland is in transition into a
lowland forest; as evidenced by lack of standing water and presence of invasives garlic mustard and common buckthorn. Additional details are provided in Table 6.6G.
6.6.7.5 Wetland 7b Mitigation Requirements
As discussed in the preceding section, there is currently no storage in W7b so a storage assessment could not be completed. This wetland serves as an overland flow route
outlet into the channel for the contributing drainage area, with little to no attenuation in the wetland.
To re-create storage conditions in W7b, grading within W7a, W7b and W7c would be
required. Further discussions with the MNR and the CVC are recommended to discuss
the feasibility and benefit of improving W7b storage conditions versus potential impacts on adjacent wetlands (W7a and W7c).
6.6.7.6 Hydrologic Characterization of Existing Wetland 7c
W7c is 0.41 ha in size and its contributing drainage area outside of the wetland is 4.81 ha, as indicated on Drawing 6.3.1. W7c is classified as a palustrine; with
intermittent inflow and outflow. It has no well-defined storage basin or measurable outlet rating curve. As described in Section 6.5.3, a field survey was completed by
Savanta Inc. to estimate both the perimeter of the storage area and average water
depth.
To model this wetland and its catchment, three simulations were conducted to assess the wetland’s sensitivity to storage volume estimates. The preliminary approximation based
on field investigations yielded a storage capacity of 600m3. The second simulation assumed that the wetland had one tenth of the capacity (60m3), while the third
simulation utilized the maximum depth observed in the field (2009-2010) in the deepest
location of the ponded area for a total volume estimate of 800m3.
The variation of simulated wetland water levels is indicated in Figure 6.6.7.7. The results show the range of wetland water levels resulting from the sensitivity analyses of
volume estimates. The resulting modelled range of fluctuation in wetland water levels is

Final Environmental Implementation Report Mount Pleasant Sub-Area 51-1
September 2011
6-44
relatively narrow. That is, there is a typically a difference of less than 1cm between the low and high volume estimates.
As expected, relative to other sensitivity modelling analyses, the field volume estimate (600 m3) resulted in slightly lower water levels throughout the year due to increased
storage capacity, while the low volume (10x less) estimate resulted in consistently slightly higher water levels due to reduced storage capacity.
Based on the sensitivity analysis and the range of volumes considered, it is concluded that the wetland water levels are not particularly sensitive to the amount of storage in
the wetland. This conclusion is likely because of the relatively small storage values and the fact that this wetland is a flow-through feature so water levels cannot increase to
depths over the maximum observed. Based on this analysis, the field estimate
simulation is considered to be representative of the wetland conditions and was used as the target.
As set out on Figure 6.6.7.7, on average, wetland water levels are high throughout the
winter and spring due to snow accumulation, and lack of evapotranspiration. Following mid-April, water levels quickly decrease due to evapotranspiration. Although
precipitation occurs throughout the spring, summer and fall, there is insufficient runoff
volume from the contributing drainage area to fill the storage volume significantly due to high evapotranspiration. These trends agree with field observations of the hydroperiod
as described in Table 6.6G, in which the wetland was dry between late May/early June until snow accumulation in late fall/early winter.
6.6.7.7 Wetland 7c Mitigation Requirements
Under proposed conditions, the wetland area will remain unchanged (0.41 ha) and the contributing drainage area will be modified. From the existing 4.81 ha contributing
drainage area outside of the wetland, 4.18 ha will be developed and directed into the storm sewer system. The remaining 0.63 ha, made up of pervious NHS area, will
continue to contribute runoff to the wetland (refer to Drawing 11.3.2). The resulting
changes to water levels in W7c, as a result of directing runoff from most of the contributing drainage area away from the wetland are indicated on Figure 6.6.7.8. This
figure illustrates the target water level fluctuations discussed in the previous section as well as the simulation results for the modified wetland drainage area (i.e., 0.41 ha
+ 0.63 ha).
The loss of a portion of the existing contributing area reduces the existing wetland water
levels by 3cm during the winter and spring. This suggests that the runoff from the contributing drainage area outside of the wetland itself is important to this wetland.
Potential water level changes associated with the model runs were discussed with ecological team members to identify potential impacts of water levels
increases/decreases to the type of vegetation community in W7c. Without mitigation, modelling shows there would be a reduction in water levels between November to July.
W7c is a Reed Canary Grass Mineral Meadow Marsh and while it has a wide ecological amplitude to moisture conditions, from saturated to moist, a reduction in water levels
during this time period may bring about a change in vegetation types, from a mineral
meadow marsh community to an upland meadow. Based on this review, it was concluded that mitigation options must be identified to more closely match existing
spring water levels to achieve wetland water budget objectives.

Final Environmental Implementation Report Mount Pleasant Sub-Area 51-1
September 2011
6-45
Several simulations were carried out to determine the required mitigation. In this case,
as indicated in Figure 6.6.7.8, the addition of 0.25 ha of roof tops will provide runoff to
this wetland from adjacent developing areas to more closely match the long term average water level patterns in this wetland. As illustrated, with this mitigation, the post-
development wetland water levels are within ±1cm of the estimated existing wetland water levels. The modelling results demonstrate that the proposed mitigation area would
be sufficient to generally match the existing average daily water levels during the spring,
while not increasing the hydroperiod through the summer months.
Based on the preliminary block grading, it is feasible to direct 0.25 ha of roof tops into the wetland via a rear-lot/NHS buffer swale connected to the existing inlet to the
wetland. Drawing 11.3.2 schematically illustrates the location of recommended rooftop
drainage into this wetland.
6.6.7.8 Hydrologic Characterization of Existing Wetland 7d
W7d is 2.07 ha in size and its contributing drainage area outside of the wetland is 11.51 ha, as indicated on Drawing 6.3.1. W7d is classified as a palustrine; with
intermittent inflow and outflow. It has no well-defined storage basin or measurable
outlet rating curve. As described in Section 6.5.3, a field survey was completed by Savanta Inc. to estimate both the perimeter of the storage area and average water
depth.
To model this wetland and its catchment, three simulations were conducted to assess the
wetland’s sensitivity to storage volume estimates. The preliminary approximation based on field investigations yielded a storage capacity of 900m3. The second simulation
assumed that the wetland had one tenth of the capacity (90m3), while the third simulation utilized the maximum depth observed in the field (2009-2010) in the deepest
location of the ponded area.
The variation of simulated wetland water levels is indicated in Figure 6.6.7.10. The
results illustrate the range of wetland water levels resulting from the sensitivity analyses of volume estimates. The resulting modelled range of fluctuation in wetland water levels
is relatively narrow. That is, there is a difference of less than 1cm between the low and high volume estimates.
As expected, relative to other sensitivity modelling analyses, the field volume estimate (900m3) resulted in slightly lower water levels throughout the year due to increased
storage capacity, while the low volume (10x less) estimate resulted in consistently higher water levels due to reduced storage capacity.
Based on the sensitivity analysis and the range of volumes considered, it is concluded that the wetland water levels are not particularly sensitive to the amount of storage in
the wetland. This conclusion is likely because of the relatively small storage values and the fact that this wetland is a flow-through feature so water levels cannot increase to
depths over the maximum observed. Based on this analysis, the field estimate simulation is considered to be most representative of the wetland conditions and was
used as the mitigation target.
As provided on Figure 6.6.7.10, on average, wetland water levels are high throughout
the winter and spring due to snow accumulation, and lack of evapotranspiration. Following mid-April, water levels quickly decrease due to evapotranspiration. Although

Final Environmental Implementation Report Mount Pleasant Sub-Area 51-1
September 2011
6-46
precipitation occurs throughout the spring, summer, and fall, there is insufficient runoff volume from the contributing drainage area to fill the storage volume significantly due to
high evapotranspiration. These trends agree with field observations of the hydroperiod
as described in Table 6.6G, in which the wetland was dry between late May/early June until snow accumulation in late fall/early winter.
6.6.7.9 Wetland 7d Mitigation Requirements
Under proposed conditions, the wetland area will remain unchanged (2.07 ha) and the contributing drainage area will be modified. From the existing 11.5 ha contributing
drainage area outside of the wetland, 9.57 ha will be developed and directed into the storm sewer system and downstream SWM facility. The remaining 1.93 ha, made up of
pervious NHS area, will continue to contribute runoff to the wetland (refer to
Drawing 11.3.2). The resulting changes to water levels in W7d, as a result of directing runoff from most of the contributing drainage area away from the wetland, are indicated
on Figure 6.6.7.11. This figure illustrates the target water level fluctuations discussed in the previous section as well as the simulation results for the modified wetland drainage
area (i.e., 2.06 ha + 1.93 ha).
The loss of the majority of the existing contributing area reduces the existing wetland
water levels by 2cm during the winter and spring. This suggests that the runoff from the contributing drainage area outside of the wetland is important to this wetland.
An additional model run was completed to identify potential water level changes if runoff
from this whole catchment, outside of the NHS, was directed to the wetland under post
development conditions. These results depicted increases in average water levels of up to 10cm in the spring and fall periods and water in the wetland throughout the summer
months.
Potential water level changes associated with the model runs were discussed with ecological team members to identify potential impacts of water levels
increases/decreases to the type of vegetation community in W7d. Without mitigation,
modelling shows there would be a reduction in water levels between November to July. W7d is a Green Ash Mineral Deciduous Swamp. To maintain this community post-
development, spring flooding is required, followed by dry summer months (i.e., dry by early June). Continued flooding in summer months would bring about a change in
vegetation types, from a treed swamp community to a graminoid marsh (i.e., Cattail
Shallow Mineral Marsh). Significantly reduced water levels in spring from existing conditions would see an alteration in this community from a treed swamp to lowland
forest or possibly upland forest community. Based on this review, it was concluded that mitigation options must be identified to more closely match existing water levels to
achieve wetland water budget objectives.
Several simulations were carried out to determine the required mitigation. In this case,
as indicated in Figure 6.6.7.8, the addition of 0.35 ha of roof tops will provide runoff to this wetland from adjacent developing areas to more closely match the long term
average water level patterns in this wetland. As indicated, with this mitigation, the post-development wetland water levels are within ±1cm of the estimated existing wetland
water levels. The modelling results demonstrate that the proposed mitigation area would
be sufficient to generally match the existing average daily water levels during the spring, while not increasing the hydroperiod through the summer months.

Final Environmental Implementation Report Mount Pleasant Sub-Area 51-1
September 2011
6-47
Based on the preliminary block grading, it is feasible to direct 0.35 ha of roof tops into the wetland via a rear-lot/NHS buffer swale connected to the existing inlet to the
wetland. Drawing 11.3.2 schematically illustrates the location of recommended rooftop
drainage into this wetland. A bioswale would be constructed at the outlet of the roof drainage system in the NHS buffer prior to discharge into the wetland.
6.6.8 Wetland 8
6.6.8.1 Existing Conditions and Management Objectives
Existing wetland conditions are summarized in Table 6.6H. This table should be read in
conjunction with the review of Figure 6.6.8.1 that assists in understanding the characterization outlined in Table 6.6H.
Table 6.6H
W8 - Summary of Existing Wetland Conditions
ATTRIBUTE COMMENTS (refer to Figure 6.6.8.1)
Wetland Size based on Draft MNR Wetland Mapping (2007)
• 0.5 ha
Contributing Drainage Area
(including wetland area)
• 7.09 ha
% of Contributing Drainage
Area to be Developed or
Altered
• 76.9% (5.45 ha) - note that 21.6% (1.53 ha) of catchment area will be
modified by relocated channel that will direct drainage away from
wetland. • In total for W8, 98.4% (6.98 ha) of drainage area will be modified
through development and channel design.
Wetland Type (isolated, riverine, palustrine)
• Palustrine with inflow.
Landscape Context
• Treed Swamp and Meadow Marsh within Sandalwood Woodland. Two distinct treed swamp areas divided by very minor topographic rise.
1946 air photos reveal this area as a mosaic of tree groupings in a
matrix of wet and dry meadow.
Disturbance/Invasive Species
• Historically there was a homestead partially within Sandalwood
Woodland. There are fill piles in the north and western portions of the
woodland that prevent drainage into the northwest corner and limit drainage out of the west side of the woodland.
• Agricultural field northwest of woodland is tiled and a ditch has been constructed along the west side of the Sandalwood Woodland to direct
the tile drainage around the wetland to the south. • Constructed channels in northeast corner of woodland to direct surface
flows into W8.
• CVC Category I invasives: garlic mustard, common buckthorn, Manitoba maple, dame’s rocket.
Monitoring
• Visual inspections of the wetland hydroperiod were made during the
spring of 2009, 2010 and 2011 by Burnside. • There are various ‘pockets’ or depressions in the wetland. A drive-point
piezometer (DP2) and staff gauge (BB-SG) were installed in the central area of W8 during the HFSWS. Another staff gauge (SG8) was installed
for the EIR in the drainage inlet swale at the east edge of the woods (Burnside). A third staff gauge was installed in 2011 (SG8a) to monitor
the conditions at the west side of the wetland area where drainage

Final Environmental Implementation Report Mount Pleasant Sub-Area 51-1
September 2011
6-48
Table 6.6H
W8 - Summary of Existing Wetland Conditions
ATTRIBUTE COMMENTS (refer to Figure 6.6.8.1)
enters the ditch. A second piezometer was also added in 2011
(PZW8-1) (Figure B-6-8; Appendix B-6). • There is a field drainage tile outlet at the northwest corner of the
woodland that is also monitored; the drainage from this tile enters a ditch and flows south past W8.
• SG8 and field tile monitored monthly from May 2008 through May 2010
and seasonally during the remainder of 2010 and part of 2011 (refer to Appendix B-4 for data and hydrographs). SG8a and PZW8-1
monitoring began in May 2011 and was completed weekly through the hydroperiod.
• DP2 monitored 4 times through June 2006 to January 2007 period
(HFSWS data). • MNR conducted wetland inventories (draft OWES) in 2005 and 2006.
• Ecological Land Classification and three season botanical surveys were completed by Dougan & Associates between 2006 and 2007.
• Winter wildlife surveys were completed in 2008-2009 by Savanta Inc. • Winter raptor surveys were conducted between 2008-2009 by Savanta
Inc.
• Breeding amphibian surveys were completed from 2005-2006 (Dougan & Associates) and 2008-2009 (Savanta Inc.).
• Amphibian surveys were completed from 2008-2009 by Savanta Inc. • Breeding bird surveys were completed from 2005-2007 (Dougan &
Associates) and 2008-2009 (Savanta Inc.).
Underlying Geology • Silty sand till deposits.
Wetland Soil Conditions
(organics, mottles, gley)
• Gley at 17cm; mottles at 17cm (MNR).
• SWD2-2 - 58cm to mottles (Dougan & Associates).
• MAM2-2 - 5cm of organics, no mottles or gley (Dougan & Associates).
Groundwater Conditions • The HFSWS data suggested that the groundwater level ranged
seasonally from grade to more than 1m below ground level during drier
periods with downward gradients (recharge conditions). • In the recent spring monitoring, standing water is present in the
wetland and the water level in the very shallow pipe at DP2 rose to the same level above grade showing the saturated soil conditions and how
the surface water ponding contributes to the high water table conditions (DP2 is only 65cm deep).
• A deeper piezometer PZW8-1 was installed to 1.43m below grade in the
wetland in 2011. Due to very low hydraulic conductivity soils, however, the groundwater levels did not reach stable conditions during the spring
monitoring period (Figure B-4-49; Appendix B). • The potential groundwater contribution from the high water table
conditions is estimated to be less than 1% of the total water supply to
the wetland feature.
Surface Water Conditions
• No perennial open water.
• Intermittent shallow standing water in spring and following major storm
events. Water generally stands in the drainage channel on the east side of the wetland and in the more central area of the woodlot. Water
also stands in the western portion of the wetland and along the drainage channel to the west. The maximum observed water depths
were 39cm in the east (SG8), 46cm in the central area (BB-SG) and

Final Environmental Implementation Report Mount Pleasant Sub-Area 51-1
September 2011
6-49
Table 6.6H
W8 - Summary of Existing Wetland Conditions
ATTRIBUTE COMMENTS (refer to Figure 6.6.8.1)
55cm in the west ponded area at SG8a in May 2011 (Table B-6-1;
Appendix B-6).
Surface Water Inputs and Inlet
Conditions
• Direct precipitation and surface water runoff are estimated to provide
99% of the water supply to this feature.
• Two inlets - northeast corner of Sandalwood Woodland (inlet on north side is suspected to be a field tile outlet).
Outlet Conditions • Outlet to the west, just south of a fill pile in location of Reed-canary Grass Mineral Meadow Marsh.
Hydroperiod • Shallow standing water is observed during and following the snowmelt
period. • Dougan & Associates reported vernal pool in early May 2006.
• Burnside observed W8 to be dry by mid June 2009 and by the end of
May 2010. Under wet conditions in 2011, the wetland had some areas of standing water until mid-June (Table B-6-1; Appendix B).
• Typical standing water period is estimated to be about 3 months (generally March/April/May).
ELC Vegetation Types • Green Ash Mineral Deciduous Swamp
• Reed-canary Grass Mineral Meadow Marsh
Dominant Vegetation Species
per strata
• Trees: green ash; Shrubs: green ash, common buckthorn
• Narrow-leaved emergents: reed-canary grass
Flora • Rare in Ecodistrict 6E7: rough avens, Michigan lily • Uncommon in Ecodistrict 6E7: Tuckerman’s sedge, Carolina spring
beauty, silky dogwood, bur oak
Fish and Wildlife Use • No rare species.
Special Features/Other
(i.e., hibernacula, vernal pools)
• Shallow vernal pools.
• Pond snails, freshwater clams, Fairy Shrimp (MNR, 2007).
• Two Green Frogs (Dougan, 2006). • Green Frog (number not specified, MNR, 2006).
• Full chorus of Spring Peepers (MNR, 2007). • Full chorus of American Toads (MNR, 2007).
• One Spring Peeper (Savanta Inc., 2009)
Sensitivity to Water Budget Change
• Green ash swamp requires spring flooding followed by dry conditions from June onwards.
Management
Recommendations
• Wetland and buffers to be protected within NHS.
• Manage water supply to maintain inflows at northeast portion of wetland and to provide wet spring conditions and dry summer period.
• Consider removal of fill and debris piles in northwest area of Sandalwood Woodland.
• Develop Invasive Species Management Strategy
6.6.8.2 Hydrologic Characterization of Wetland 8
W8 is 0.5 ha in size and its contributing drainage area outside of the wetland is 6.59 ha, as indicated on Drawing 6.3.1. W8 is classified as a palustrine; with intermittent inflow
and outflow. It has no well-defined storage basin or measurable outlet rating curve. As
described in Section 6.5.3, a field survey was completed by Savanta Inc. to estimate both the perimeter of the storage area and average water depth.

Final Environmental Implementation Report Mount Pleasant Sub-Area 51-1
September 2011
6-50
To model this wetland and its catchment, three simulations were conducted to assess the wetland’s sensitivity to storage volume estimates. The preliminary approximation based
on field investigations yielded a storage capacity of 115m3. The second simulation
assumed that the wetland had one tenth of the capacity (12m3), while the third simulation utilized the maximum depth observed in the field (2009-2010) in the deepest
location of the ponded area for a total volume estimate of 230m3.
The variation of simulated wetland water levels is indicated in Figure 6.6.8.2. The
results indicate the range of wetland water levels resulting from the sensitivity analyses of volume estimates. The resulting modelled range of fluctuation in wetland water levels
is relatively narrow. That is, there is a typically a difference of less than 1cm between the low and high volume estimates.
As expected, the field volume estimate (115m3) resulted in slightly lower water levels throughout the year due to increased storage capacity, while the low volume (10x less)
estimate resulted in consistently slightly higher water levels due to reduced storage capacity (Figure 6.6.8.2).
Based on the sensitivity analysis and the range of volumes considered, it is concluded
that the wetland water levels are not particularly sensitive to the amount of storage in
the wetland. This conclusion is likely because of the relatively small storage values and the fact that this wetland is a flow-through feature so water levels cannot increase to
depths over the maximum observed. Based on this analysis, the field estimate simulation is considered to be most representative of the wetland conditions and was
used as the target.
As shown on Figure 6.6.8.2, on average, wetland water levels are high throughout the
winter and spring due to snow accumulation, and lack of evapotranspiration. Following mid-April, water levels quickly decrease due to evapotranspiration. Although precipitation
occurs throughout the spring, summer, and fall, there is insufficient runoff volume from the contributing drainage area to fill the storage volume significantly due to high
evapotranspiration. These trends agree with field observations of the hydroperiod as
described in Table 6.6H, in which the wetland was dry between late May/early June until snow accumulation in late fall/early winter.
6.6.8.3 Mitigation Requirements
Under proposed conditions, the wetland area will remain unchanged (0.5 ha) and the contributing drainage area outside of the wetland will be modified. From the existing
6.59 ha contributing drainage area outside of the wetland, 5.45 ha will be developed and directed into the storm sewer system or diverted due to the grading associated with the
proposed channel alignment. The remaining 1.14 ha, made up of pervious NHS area, will
continue to contribute runoff to the wetland (refer to Drawing 11.3.2). The resulting changes to water levels in W8 as a result of directing runoff from most of the
contributing drainage area away from the wetland are indicated on Figure 6.6.8.3. This figure illustrates the target water level fluctuations discussed in the previous section as
well as the simulation results for the modified wetland drainage area (i.e., 0.5 ha + 1.14 ha).
The change in the existing contributing area results in a marginal difference in water levels between November and March; there is little change in spring water levels
(mid-March to mid-June). W8 is a Green Ash Mineral Deciduous Swamp; to maintain this community post-development spring flooding is required, followed by dry summer
months (i.e., dry by early June). These conditions are met post-development without

Final Environmental Implementation Report Mount Pleasant Sub-Area 51-1
September 2011
6-51
mitigation, likely because of the small storage volumes required to fill them up after storm events.
Based on the simulation results described above, mitigation is not required to maintain water levels in the wetland in an acceptable range to meet wetland management
objectives.
6.6.9 Wetland 9
6.6.9.1 Existing Conditions and Management Objectives
Existing wetland conditions are summarized in Table 6.6I. This table should be read in
conjunction with the review of Figure 6.6.9.1 that assists in understanding the
characterization outlined in Table 6.6I.
Table 6.6I
W9 - Summary of Existing Wetland Conditions
ATTRIBUTE COMMENTS (refer to Figure 6.6.9.1)
Wetland Size based on Draft MNR Wetland Mapping (2007)
• 2.49 ha
Contributing Drainage Area
(including wetland area)
• 21.28 ha
% of Contributing Drainage Area to be Developed or
Altered
• 82.1% (17.49 ha)
Wetland Type (isolated, riverine, palustrine)
• Palustrine with inflow.
Landscape Context
• Recent wetland community on the landscape, post 1940, present as a result of field tile drainage and removal of treed vegetation. 1956
aerial photography shows area as patchy mosaic of trees, wet
meadow and dry meadow. From 1960s aerial photography, the triangular shape of the wetland is visible.
Disturbance/Invasive Species • Area covered by linear depressions that are remnants of agricultural
furrows and farm vehicle tire tracks. • CVC Category I invasives: garlic mustard, common buckthorn;
Category II invasives: tufted vetch, bird’s-foot trefoil; Category III invasives: bitter nightshade, Canada thistle.
Monitoring
• Visual inspections of the wetland hydroperiod were made during
the spring of 2009, 2010 and 2011 by Burnside. • Three piezometers were installed in W9 in mid August 2010.
PZW9-1 is northeast of the wetland boundary, PZW9-2 is on the side slope of the wetland and PZW9-3 is in the central area of the
feature (Figure B-6-9; Appendix B-6).
• There is a field drainage tile outlet at the northwest corner of the Sandalwood Woodland that is also visually monitored; the drainage
from this tile enters a ditch and flows south directly into W9. In 2001, a staff gauge (SG1-W9) was installed at the inlet into the
feature. • In 2011, a catchbasin was found at the south edge of the wetland
that drains the wetland. A second staff gauge (SG2-W9) was
installed beside it to monitor the surface water levels in the spring

Final Environmental Implementation Report Mount Pleasant Sub-Area 51-1
September 2011
6-52
Table 6.6I
W9 - Summary of Existing Wetland Conditions
ATTRIBUTE COMMENTS (refer to Figure 6.6.9.1)
of 2011.
• The field tile was monitored monthly from May 2008 through May 2010 and seasonally during the remainder of 2010 and part of
2011. • The piezometers were monitored regularly since August 2010, and
each is equipped with a datalogger to provide detailed water level
response data. The water levels were also recorded manually on a weekly basis during the spring 2011 period (refer to Figures B-4-46,
B-4-47 and B-4-48 in Appendix B-4 for hydrographs). • MNR conducted wetland inventories (draft OWES) in 2005 and
2006.
• Ecological Land Classification and three season botanical surveys were completed by Dougan & Associates between 2006 and 2007.
• Winter wildlife surveys were completed in 2008-2009 by Savanta Inc.
• Winter raptor surveys were conducted between 2008-2009 by Savanta Inc.
• Breeding amphibian surveys were completed from 2005-2006
(Dougan & Associates) and 2008-2009 (Savanta Inc.). • Amphibian movement surveys were completed from 2008-2009 by
Savanta Inc. • Breeding bird surveys were completed from 2005-2007 (Dougan &
Associates) and 2008-2009 (Savanta Inc.).
Underlying Geology • Clayey silt till deposits.
Wetland Soil Conditions
(organics, mottles, gley) •
• Reed-canary Grass Mineral Meadow Marsh – Soil information not
available.
• Lake-bank Sedge Mineral Meadow Marsh – gley at 17cm, mottles at 17cm (MNR).
• Narrow-leaved Meadowsweet Mineral Thicket Swamp – gley at 25cm, mottles at 25cm (MNR); 5cm of organics; mottles at 16cm
(Dougan & Associates).
Groundwater Conditions
• As discussed in Section 2.1.8.4, all of the piezometers in the W9 area were dry from August through to late September 2010
indicating the water table was more than 1m below grade. During the early October 2010 monitoring round, there was 12cm of
surface water pooled in the wetland and the groundwater level at
PZW9-3 was 0.71m below grade indicating a downward hydraulic gradient from the wetland (recharge conditions). PZW9-1 and
PZW9-2 remained dry through October 2010. • The water table varies seasonally. Hydrographs show the
groundwater levels began to rise in the fall and continued to rise
steadily in the spring. The groundwater level rose to grade at PZW9-1 and PZW9-3, and to within about 30cm of grade on the
slope at PZW9-2 (Figures B-4-46, B-4-47 and B-4-48, Appendix B-4).
• The hydrographs show no direct response of the shallow
groundwater levels to rainfall events, illustrating the very tight nature of the clay soils underlying the wetland. It was also noted
that there was no visible seepage at PZW9-1 or PZW9-2 despite the
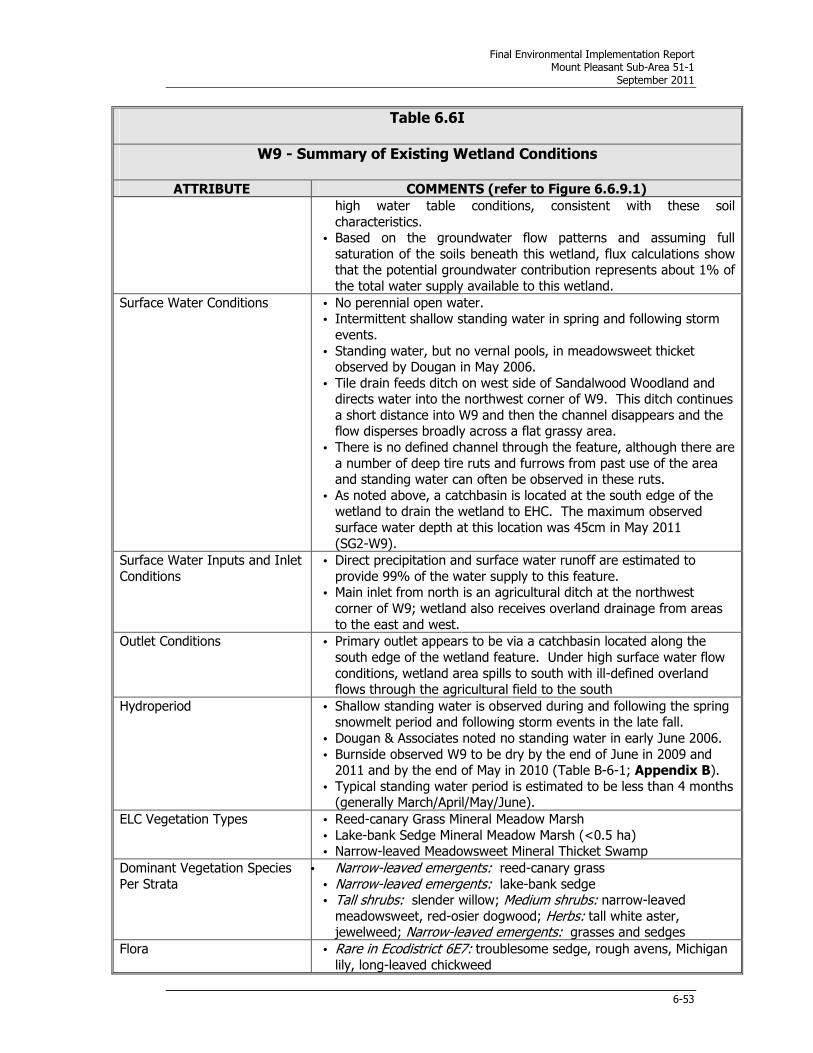
Final Environmental Implementation Report Mount Pleasant Sub-Area 51-1
September 2011
6-53
Table 6.6I
W9 - Summary of Existing Wetland Conditions
ATTRIBUTE COMMENTS (refer to Figure 6.6.9.1)
high water table conditions, consistent with these soil
characteristics. • Based on the groundwater flow patterns and assuming full
saturation of the soils beneath this wetland, flux calculations show that the potential groundwater contribution represents about 1% of
the total water supply available to this wetland.
Surface Water Conditions • No perennial open water. • Intermittent shallow standing water in spring and following storm
events.
• Standing water, but no vernal pools, in meadowsweet thicket observed by Dougan in May 2006.
• Tile drain feeds ditch on west side of Sandalwood Woodland and directs water into the northwest corner of W9. This ditch continues
a short distance into W9 and then the channel disappears and the flow disperses broadly across a flat grassy area.
• There is no defined channel through the feature, although there are
a number of deep tire ruts and furrows from past use of the area and standing water can often be observed in these ruts.
• As noted above, a catchbasin is located at the south edge of the wetland to drain the wetland to EHC. The maximum observed
surface water depth at this location was 45cm in May 2011
(SG2-W9).
Surface Water Inputs and Inlet
Conditions
• Direct precipitation and surface water runoff are estimated to
provide 99% of the water supply to this feature. • Main inlet from north is an agricultural ditch at the northwest
corner of W9; wetland also receives overland drainage from areas
to the east and west.
Outlet Conditions • Primary outlet appears to be via a catchbasin located along the
south edge of the wetland feature. Under high surface water flow
conditions, wetland area spills to south with ill-defined overland flows through the agricultural field to the south
Hydroperiod • Shallow standing water is observed during and following the spring snowmelt period and following storm events in the late fall.
• Dougan & Associates noted no standing water in early June 2006.
• Burnside observed W9 to be dry by the end of June in 2009 and 2011 and by the end of May in 2010 (Table B-6-1; Appendix B).
• Typical standing water period is estimated to be less than 4 months (generally March/April/May/June).
ELC Vegetation Types • Reed-canary Grass Mineral Meadow Marsh
• Lake-bank Sedge Mineral Meadow Marsh (<0.5 ha) • Narrow-leaved Meadowsweet Mineral Thicket Swamp
Dominant Vegetation Species
Per Strata
• Narrow-leaved emergents: reed-canary grass
• Narrow-leaved emergents: lake-bank sedge • Tall shrubs: slender willow; Medium shrubs: narrow-leaved
meadowsweet, red-osier dogwood; Herbs: tall white aster, jewelweed; Narrow-leaved emergents: grasses and sedges
Flora • Rare in Ecodistrict 6E7: troublesome sedge, rough avens, Michigan
lily, long-leaved chickweed

Final Environmental Implementation Report Mount Pleasant Sub-Area 51-1
September 2011
6-54
Table 6.6I
W9 - Summary of Existing Wetland Conditions
ATTRIBUTE COMMENTS (refer to Figure 6.6.9.1)
• Uncommon in Ecodistrict 6E7: silky dogwood
Fish and Wildlife Use • No threatened or endangered species
Special Features/Other (i.e., hibernacula, vernal pools)
• Ten American Toads (Dougan, 2006). • Over six American Toads (MNR, 2005).
• Three American Toad (Savanta Inc., 2009). • Chimney Crayfish, Pond Snails (MNR, 2007).
Sensitivity to Water Budget
Change
• Lake-bank sedge community (<0.5 ha) that requires extensive
flooding in the spring, moist conditions in summer. • Reed-canary grass meadow marsh has a wide ecological amplitude
to moisture conditions, from saturated to moist. • Meadow-sweet thicket swamp requires moderate flooding in the
spring and moist conditions in the summer.
Management Recommendations
• Wetland to be maintained within approved NHS boundary. Note that Implementation Principles that set out NHS boundaries
(November 2009) included the replacement of W9 with a new open
water/marsh wetland. MNR subsequently requested that the existing wetland be maintained.
• Manage water supply to maintain inflows at northwest corner of wetland and provide wet spring conditions and saturated to minimal
standing water in summer. Note: plant species present are adaptive to some water level changes if additional water is introduced during
summer months.
• Recognize the location of new Sandalwood Parkway along southern portion of wetland and identify appropriate design requirements for
wetland outlet; assess options at detailed design to minimize grading transition into W9 from Sandalwood Parkway.
• Develop Invasive Species Management Strategy
6.6.9.2 Hydrologic Characterization of Wetland 9
W9 is 2.49 ha in size and its contributing drainage area outside of the wetland is 18.79 ha, as indicated on Drawing 6.3.1. W9 is classified as a palustrine; with
intermittent inflow and outflow. It has no well-defined storage basin or measurable
outlet rating curve. As described in Section 6.5.3, a field survey was completed by Savanta Inc. to estimate both the perimeter of the storage area and average water
depth.
To model this wetland and its catchment, three simulations were conducted to assess the wetland’s sensitivity to storage volume estimates. The preliminary approximation based
on field investigations yielded a storage capacity of 2,400m3. The second simulation
assumed that the wetland had one tenth of the capacity (240m3), while the third simulation utilized the maximum depth observed in the field (2009-2010) in the deepest
location of the ponded area for a total volume estimate of 2,800m3.
The variation of simulated wetland water levels is indicated in Figure 6.6.9.2. The
results illustrate the range of wetland average water levels resulting from the sensitivity

Final Environmental Implementation Report Mount Pleasant Sub-Area 51-1
September 2011
6-55
analyses of volume estimates. The resulting modelled range of fluctuation in wetland water levels is relatively narrow. That is, there is a typically a difference of less than 1cm
between the low and high volume estimates.
As expected, the field volume estimate (2,400m3) resulted in slightly lower water levels
throughout the year due to increased storage capacity, while the low volume (10x less) estimate resulted in consistently slightly higher water levels due to reduced storage
capacity (area). Based on the sensitivity analysis and the range of volumes considered,
it is concluded that the wetland water levels are not particularly sensitive to the amount of storage in the wetland. This conclusion is likely because of the relatively small storage
values and the fact that this wetland is a flow-through feature so water levels cannot increase to depths over the maximum observed. Based on this analysis, the field
estimate simulation is considered to be most representative of the wetland conditions
and was used as the target.
As illustrated on Figure 6.6.9.2, on average, wetland water levels are high throughout the winter and spring due to snow accumulation, and lack of evapotranspiration.
Following mid-April, water levels quickly decrease due to evapotranspiration. Although precipitation occurs throughout the spring, summer, and fall, there is insufficient runoff
volume from the contributing drainage area to fill the storage volume significantly due to
high evapotranspiration. These trends agree with field observations of the hydroperiod as described in Table 6.6I, in which the wetland was dry to moist between late
May/early June until snow accumulation in late fall/early winter.
6.6.9.3 Mitigation Requirements
Under proposed conditions, the wetland area will be reduced in size by approximately
1.0 ha a as a result of the Sandalwood Parkway alignment and the contributing drainage area will be modified. From the existing 18.79 ha contributing drainage area outside of
the wetland, 17.49 ha will be developed and directed into the storm sewer system. The remaining 1.30 ha, made up of pervious NHS area, will continue to contribute runoff to
the wetland (refer to Drawing 11.3.2). The resulting changes to water levels as a
result of directing runoff from most of the contributing drainage area away from the wetland are indicated on Figure 6.6.9.3. This figure illustrates the target water level
fluctuations discussed in the previous section as well as the simulation results for the modified wetland drainage area (i.e., 1.49 ha + 1.30 ha).
The loss of a portion of the existing contributing area reduces the existing wetland water levels by up to 8cm during the winter and spring. This suggests that the runoff from the
contributing drainage area outside of the wetland is important to this wetland.
Potential water level changes associated with the model runs were discussed with
ecological team members to identify potential impacts of water levels increases/decreases to the type of vegetation community in W9. The dominant
vegetation community in W9 is a Reed Canary Grass Mineral Meadow Marsh. A ditch north of W8 feeds into the north end of W9, which spreads into this community.
Encompassing the Reed Canary Grass Mineral Meadow Marsh is a Meadowsweet Mineral Thicket Swamp, with some patches within the Reed Canary Grass Mineral Meadow
Marsh. Interspersed with in the Mineral Meadow Marsh is also a Broad-Leaved Sedge
Mineral Meadow Marsh (lake-bank sedge). Reed Canary Grass Mineral Meadow Marsh has a wide ecological amplitude to moisture conditions, from saturated to moist.
Meadow-sweet thicket swamp requires moderate flooding in the spring and moist conditions in the summer. Lake-bank sedge community (<0.5 ha) requires extensive

Final Environmental Implementation Report Mount Pleasant Sub-Area 51-1
September 2011
6-56
flooding in the spring and moist conditions in summer. Without mitigation, modelling indicates there would be a reduction in water levels throughout the year, with greatest
reductions between January to July. This reduction in water levels will likely not provide
extensive flooding conditions needed to support broad-leaved sedge mineral meadow marsh community. Based on this review, it was concluded that mitigation options must
be identified to more closely match existing spring water levels to achieve wetland water budget objectives.
Several simulations were carried out to determine the required mitigation. In this case, as indicated in Figure 6.6.9.3, the addition of 0.65 ha of roof tops will provide runoff to
this wetland from adjacent developing areas to more closely match the long term average water level patterns in this wetland. As illustrated, with this mitigation, the post-
development wetland water levels are within ±1cm of the estimated existing wetland
water levels. The modelling results demonstrate that the proposed mitigation area would be sufficient to generally match the existing average daily water levels during the spring,
while not increasing the hydroperiod through the summer months.
Based on the preliminary block grading, it is feasible to direct 0.65 ha of roof tops into the wetland via a rear-lot/NHS buffer swale connected to the existing inlet to the
wetland. Drawing 11.3.2 schematically illustrates the location of recommended rooftop
drainage into this wetland. At detailed design, water balance to W9 should be reviewed to confirm if the design of the open water wetland has any implications to water levels in
W9.
In addition to water balance mitigation, see Section 10.4.2.3 for mitigation measures to
minimize road grading into the southern portions of W9.
6.6.10 Wetland 10
6.6.10.1 Existing Conditions and Management Objectives
Existing wetland conditions are summarized in Table 6.6J. This table should be read in
conjunction with the review of Figure 6.6.10.1 that assists in understanding the characterization outlined in Table 6.6J.
Table 6.6J
W10 Summary of Existing Wetland Conditions
ATTRIBUTE COMMENTS (refer to Figures 6.6.10.1)
Wetland Size based on Draft MNR Wetland Mapping (2007)
• 0.21 ha
Contributing Drainage Area
(including wetland area)
• 15.95 ha
% of Contributing Drainage Area to be Developed or
Altered
• 100%
Wetland Type (isolated,
riverine, palustrine)
• Palustrine with inflow.
Landscape Context
• Absent on landscape until after 1960 (aerial photography). There are two distinct parts of this wetland. The north part of the

Final Environmental Implementation Report Mount Pleasant Sub-Area 51-1
September 2011
6-57
Table 6.6J
W10 Summary of Existing Wetland Conditions
ATTRIBUTE COMMENTS (refer to Figures 6.6.10.1)
wetland is a Submerged Shallow Aquatic wetland that was first created as a pond (likely for farm irrigation). The south part is a
Cattail Mineral Shallow Marsh that formed along the drainage ditch from the pond. A second irrigation pond to the south was created
along the ditch, but this pond does not form part of W10.
Disturbance/Invasive Species • This is a completely man-made drainage system. The creation of the ponds was through excavation and damming; the dams are
collapsed. A field tile outlet is observed draining the west corn field
into the south pond; other tile inputs to both ponds are likely, although the pipes were not observed. There are remnants of
irrigation piping throughout the area. • The Submerged Shallow Aquatic wetland is very foul smelling and
appears to be stagnant throughout most of the frost-free season.
Monitoring
• There are two dug ponds joined by a drainage channel. Visual inspections of the ponds and wetland hydroperiod were made by
Burnside during the spring of 2009, 2010 and 2011. The three monitoring locations are identified as 10a, 10b and 10c.
• A staff gauge (SG10) was installed in the south pond and flow
monitoring was completed at location 10b (Appendix B-6). • SG10 and flow at 10b was monitored weekly during the spring in
2009, 2010 and 2011 and seasonally during the remainder of 2009, 2010 and part of 2011 (Appendix B-6).
• MNR conducted wetland inventories (draft OWES) in 2005 and
2006 • Ecological Land Classification and three season botanical surveys
were completed by Dougan & Associates between 2006 and 2007. • Winter wildlife surveys were completed in 2008-2009 by Savanta
Inc. • Winter raptor surveys were conducted between 2008-2009 by
Savanta Inc.
• Breeding amphibian surveys were completed from 2005-2006 (Dougan & Associates) and 2008-2009 (Savanta Inc.).
• Amphibian movement surveys were completed from 2008-2009 by Savanta Inc.
• Breeding bird surveys were completed from 2005-2007 (Dougan &
Associates) and 2008-2009 (Savanta Inc.). • Waterfowl breeding function and stopover assessment in spring,
summer and fall 2008.
Underlying Geology • Clayey silt till and silt deposits.
Wetland Soil Conditions (of
organics, to mottles, to gley)
• Soil information not available.
Groundwater Conditions • The ponds are excavated into the local water table and as such, have a groundwater throughflow component.
• The potential groundwater contribution through the ponds is estimated to be less than 2% of the total water supply to these
features.
Surface Water Conditions • Minor surface water flow was observed in the drainage channel

Final Environmental Implementation Report Mount Pleasant Sub-Area 51-1
September 2011
6-58
Table 6.6J
W10 Summary of Existing Wetland Conditions
ATTRIBUTE COMMENTS (refer to Figures 6.6.10.1)
(10b) portion of the wetland throughout the monitoring periods, with the highest flows (up to 2 L/s) observed in spring melt
conditions or following summer rain events (Table B-6-2; Appendix B-6).
Surface Water Inputs and Inlet Conditions
• Overland drainage swale from north drains into north pond via a culvert.
• A field tile outlet was observed draining the west corn field into the
south pond; other tile inputs to both ponds are likely, although the pipes were not observed.
• Direct precipitation and surface water runoff are estimated to provide 98% of the water supply to these features.
Outlet Conditions • Culvert from drainage channel into W11.
Hydroperiod • The Submerged Shallow Aquatic wetland is a perennial open water feature.
• Intermittent flow or shallow standing water in the Cattail Mineral
Shallow Marsh has been observed throughout the monitoring periods.
ELC Vegetation Types • Dug pond is Submerged Shallow Aquatic wetland
• Drainage channel is Cattail Mineral Shallow Marsh
Dominant Vegetation Species
Per Strata
• Robust Emergents: narrow-leaved cattail
• Submergents: pondweeds
Flora • No rare or uncommon species.
Fish and Wildlife Use • No rare species.
Special Features/Other
(i.e., hibernacula, vernal pools)
• Green Frog (Dougan, 2006).
• More than three Green Frogs (MNR, 2006). • Several American Toads (MNR, 2007).
• One Leopard Frog (MNR, 2007). • No amphibian calls (Savanta Inc., 2008, 2009).
Management
Recommendations
• Wetland is to be removed as per SWS recommendations.
• Recreate similar vegetation communities in newly created wetlands
within NHS.
This wetland is not being retained in the proposed development. Its size and function will be replaced through new wetland creation in the NHS (refer to NHS Restoration
Section 5). As a result, no water budget analyses are required.
6.6.10.2 Mitigation Requirements
W10 is one of three ponds in the vicinity of a former racetrack, and collectively with W11
and W12, the wetlands are referred to as the ‘racetrack wetlands’. These wetlands are not being retained in the proposed development and mitigation strategies to replicate the
current surface water and groundwater contributions to the East Huttonville Creek from
the racetrack wetlands are required. Mitigation for this area is discussed in Section 6.6.12.2.

Final Environmental Implementation Report Mount Pleasant Sub-Area 51-1
September 2011
6-59
6.6.11 Wetland 11
6.6.11.1 Existing Conditions and Management Objectives
Existing wetland conditions are summarized in Table 6.6K. This table should be read in conjunction with the review of Figure 6.6.11.1 that assists in understanding the
characterization outlined in Table 6.6K.
Table 6.6K
W11 Summary of Existing Wetland Conditions
ATTRIBUTE COMMENTS (refer to Figure 6.6.11.1)
Wetland Size based on Draft
MNR Wetland Mapping (2007)
• 0.04 ha
Contributing Drainage Area
(including wetland area)
• 0.61 ha (direct to wetland), but west end of feature also receives
drainage through-flow from W10 and it’s contributing drainage area
of 15.95 ha
% of Contributing Drainage
Area to be Developed or Altered
• 100%
Wetland Type (isolated,
riverine, palustrine)
• Palustrine with inflow.
Landscape Context
• Absent on landscape until after 1960 (aerial photography). The racetrack was likely first created and subsequently the drainage
from W10 to W12 was altered. W11 appears to have formed in a in a drainage ditch along the north side of the racetrack where the
drainage backs up at the culvert.
Disturbance/Invasive Species • There are culverts into and out of W11. Wetland is formed in man-made drainage ditch.
Monitoring
• Visual inspections of the wetland hydroperiod were made during
the fall of 2009 and spring of 2010 and 2011 by Burnside. • MNR conducted wetland inventories (draft OWES) in 2005 and
2006. • Ecological Land Classification and three season botanical surveys
were completed by Dougan & Associates between 2006 and 2007.
• Winter wildlife surveys were completed in 2008-2009 by Savanta • Winter raptor surveys were conducted between 2008-2009 by
Savanta Inc. • Breeding amphibian surveys were completed from 2005-2006
(Dougan & Associates) and 2008-2009 (Savanta Inc.). • Amphibian movement surveys were completed from 2008-2009 by
Savanta Inc. Breeding bird surveys were completed from 2005-
2007 (Dougan & Associates) and 2008-2009 (Savanta Inc.). • Waterfowl breeding function and stopover assessment in spring,
summer and fall 2008.
Underlying Geology • Clayey silt till and silt deposits.
Wetland Soil Conditions (of
organics, to mottles, to gley)
• Soil information not available.
Groundwater Conditions • There are buried drainage culverts into and out of W11 that appear to be at or near the water table. There is a deep pool at the mouth

Final Environmental Implementation Report Mount Pleasant Sub-Area 51-1
September 2011
6-60
Table 6.6K
W11 Summary of Existing Wetland Conditions
ATTRIBUTE COMMENTS (refer to Figure 6.6.11.1)
of a concrete culvert where standing water is always observed. • The potential groundwater contribution to the feature is estimated
to be less than 2% of the total water supply.
Surface Water Conditions • There are buried drainage culverts into and out of W11 directing drainage from W10 through W11 and under the race track to W12.
• W11 is not a perennial open water wetland, although as noted above, there is generally water ponded at the concrete culvert.
• The water levels at the culvert vary from try to a maximum
observed water depth of 47cm during snowmelt conditions in April 2011(Table B-6-1; Appendix B-6).
Surface Water Inputs and Inlet Conditions
• Culverts direct flows from the W10 area into W11. • Direct precipitation and surface water runoff are estimated to
provide 98% of the water supply to this feature.
Outlet Conditions • Buried culvert connecting W11 to W12 under the race track berm.
Hydroperiod • Flows through the culverts (and through the wetland) and some shallow standing water in the wetland area is observed during and
following the snowmelt period (March/April). There has generally been some standing water observed at the exit culvert throughout
the monitoring period (Table B-6-2, Appendix B-6).
ELC Vegetation Types • Cattail Mineral Shallow Marsh
Dominant Vegetation Species
Per Strata
• Robust emergents: narrow-leaved cattail • Groundcover: tall white aster, jewelweed
Flora • No rare or uncommon species.
Fish and Wildlife Use • No rare species.
Special Features/Other
(i.e., hibernacula, vernal pools)
• Not present.
Sensitive Attributes • Not applicable.
Management
Recommendations
• Wetland is to be removed as per SWS recommendations.
• Recreate similar vegetation communities in newly created wetlands
within NHS.
This wetland is not being retained in the proposed development. Its size and function will be replaced through new wetland creation in the NHS (refer to NHS Restoration,
Section 5). As a result, no water budget analyses are required.
6.6.11.2 Mitigation Requirements
W11 is in the vicinity of a former racetrack, and collectively with W10 and W12, the
wetlands are referred to as the ‘racetrack wetlands’. These wetlands are not being
retained in the proposed development and mitigation strategies to replicate the current surface water and groundwater contributions to the East Huttonville Creek from the
racetrack wetlands are required. Mitigation for this area is discussed in Section 6.6.12.2.

Final Environmental Implementation Report Mount Pleasant Sub-Area 51-1
September 2011
6-61
6.6.12 Wetland 12
6.6.12.1 Existing Conditions and Management Objectives
Existing wetland conditions are summarized in Table 6.6L. This table should be read in conjunction with the review of Figure 6.6.12.1 that assists in understanding the
characterization outlined in Table 6.6L.
Table 6.6L
W12 Summary of Existing Wetland Conditions
ATTRIBUTE COMMENTS (refer to Figure 6.6.12.1)
Wetland Size based on Draft
MNR Wetland Mapping (2007)
• 1.55 ha
Contributing Drainage Area (including wetland area)
• 6.47 ha (direct to wetland), but feature also receives drainage from W10 and W11 areas (contributing drainage area of 16.56 ha)
• Total contributing area to W12 is 23.04 ha.
% of Contributing Drainage Area to be Developed or
Altered
• 100%
Wetland Type (isolated, riverine, palustrine)
• Palustrine with inflow.
Landscape Context • Absent on landscape until after 1960 (aerial photography). W12
was likely created as an irrigation pond and the south side of the pond is bermed by the racetrack. The drainage was altered,
leading to the formation of the marsh area along the inlet swale and the meadow marsh northeast of the pond.
Disturbance/Invasive Species • This is a man-made pond that drains through a hanging culvert
through the berm formed by the racetrack to the south. A 9-hole golf course was constructed in and around the feature and there
are remnants of irrigation piping throughout the area. 2005 aerial photography shows there was a golf hole and a constructed
drainage channel in the present location of the meadow marsh
area. • A non-native species (crispy pondweed; also known as curly-leaved
pondweed) is present in the pond (Category 1 invasive species on the CVC priority invasive plant list).
Monitoring
• Visual inspections of the pond and wetland hydroperiod were made
during the spring of 2009, 2010 and 2011 by Burnside. • A staff gauge (SG12) was installed in the pond. Flow monitoring
was completed at three monitoring locations identified as 12a, 12b and 12c. 12a is at the culvert that drains the pond south under the
racetrack. 12b and 12c are in the drainage ditch (Rowntree Drain)
upstream and downstream of the W12 pond outlet (Figure B-6-12; Appendix B-6).
• SG12 and flow at the W12 stations monitored weekly during the spring in 2009, 2010 and 2011 and seasonally during the remainder
of 2009, 2010 and part of 2011(Appendix B-6).
• MNR conducted wetland inventories (draft OWES) in 2005 and 2006.

Final Environmental Implementation Report Mount Pleasant Sub-Area 51-1
September 2011
6-62
Table 6.6L
W12 Summary of Existing Wetland Conditions
ATTRIBUTE COMMENTS (refer to Figure 6.6.12.1)
• Ecological Land Classification and three season botanical surveys were completed by Dougan & Associates between 2006 and2007
• Winter wildlife surveys were completed in 2008-2009 by Savanta Inc.
• Winter raptor surveys were conducted between 2008-2009 by
Savanta Inc. • Breeding amphibian surveys were completed from 2005-2006
(Dougan & Associates) and 2008-2009 (Savanta Inc.). • Amphibian movement surveys were completed from 2008-2009 by
Savanta Inc.
• Breeding bird surveys were completed from 2005-2007 (Dougan & Associates) and 2008-2009 (Savanta Inc.).
• Waterfowl breeding function and stopover assessment in spring, summer and fall 2008.
Underlying Geology • Clayey silt till and silt deposits.
Wetland Soil Conditions (of organics, to mottles, to gley)
• Creeping Bent Grass Mineral Meadow Marsh - gley at 0cm (MNR).
Groundwater Conditions • The pond is excavated into the local water table and as such, has a
groundwater throughflow component. • The potential groundwater contribution to the pond is estimated to
be less than 2% of the total water supply to the feature.
Surface Water Conditions • The pond level has varied by up to 21cm at SG12. The highest water levels and flows are observed in the spring and following
major rain events (Tables B-6-1 and B-6-2; Appendix B-6). • The water depth at SG12 has been observed at 0.7m in spring
conditions (May 2011) and the pond is about 2.5m deep in the
centre.
Surface Water Inputs and Inlet
Conditions
• Receives water from the W10 and W11 areas via a culvert under
the racetrack.
• Direct precipitation and surface water runoff are estimated to provide 98% of the water supply to this feature.
Outlet Conditions • Pond outlets via a culvert under the racetrack into the Rowntree Drain (ditched portion of East Huttonville Creek; HV20).
Hydroperiod • The pond is a perennial open water feature.
ELC Vegetation Types • Open water pond feature is Pondweed Submerged Shallow Aquatic.
• Inlet swales are Cattail Mineral Shallow Marsh.
• East of inlet swale is Creeping Bent Grass Mineral Meadow Marsh.
Dominant Vegetation Species
Per Strata
• Narrow-leaved Emergents: creeping bent grass.
• Robust emergents: narrow-leaved cattail. • Submerged: Sago pondweed and crispy pondweed (also known as
curly-leaved pondweed).
Fish & Wildlife Use • No rare species. • Staging area for waterfowl (mostly Canada Geese).
• Breeding amphibian habitat for American Toad, Green Frog and
Northern Leopard Frog. • Permanent fish habitat and use, connected seasonally to
downstream stream reaches

Final Environmental Implementation Report Mount Pleasant Sub-Area 51-1
September 2011
6-63
Table 6.6L
W12 Summary of Existing Wetland Conditions
ATTRIBUTE COMMENTS (refer to Figure 6.6.12.1)
Special Features/Other (i.e., hibernacula, vernal pools)
• Many Leopard Frogs, Green Frogs and American Toads (MNR, 2007).
• Pond Snails (MNR, 2007).
Sensitive Attributes • Not applicable.
Management
Recommendations
• Wetland is to be removed as per SWS recommendations.
• Recreate ecological features (vegetation communities) and
functions (waterfowl staging and breeding amphibian habitat) in
newly created wetland within NHS.
This wetland is not being retained in the proposed development. Its size and function will be replaced through new wetland creation in the NHS (refer to NHS Restoration,
Section 5). As a result, no water budget analyses are required.
6.6.12.2 Mitigation Requirements
W12 is in the vicinity of a former racetrack, and collectively with W10 and W11, the
wetlands are referred to as the ‘racetrack wetlands’. These wetlands are not being
retained in the proposed development and mitigation strategies to replicate the current groundwater and surface water contributions to the East Huttonville Creek from the
racetrack wetlands are required.
Over the longer term, new wetland features along the NHS will be constructed to replicate the racetrack wetlands. In the short term, however, mitigative actions will be
required for local groundwater and surface water management during the pond removal
stage, i.e., during the period of time when the ponds are dewatered and filled in. Depending on the NHS construction schedule, there may also be an interim period
between the removal of the racetrack wetlands and the construction of the replacement wetland features. Options and considerations for mitigation are discussed below. These
options will be further assessed at detailed design.
Wetland Removal The wetland ponds have been excavated into the local water table and have a
groundwater throughflow component. Prior to the ponds being excavated, the natural
groundwater flow pattern in the area would have been towards the southeast (i.e., towards the East Huttonville Creek). When ponds are excavated into the water table and
are permitted to drain, they essentially function as a groundwater interceptor system, i.e., they ‘short-circuit’ the natural groundwater flow path and provide a more direct
piped outlet of the local groundwater into the creek. Due to the small size of the ponds and the ‘tight’ nature of the underlying soils restricting the dewatering effect, the
presence of the ponds does not appear to have significantly changed the overall
groundwater flow pattern to the southeast (refer to Figure 2.1.13). Following filling of the ponds, the natural groundwater levels and patterns would be expected to re-
establish. Therefore, the same volume of groundwater would be directed to the creek, although the discharge would occur in a non-point source manner.

Final Environmental Implementation Report Mount Pleasant Sub-Area 51-1
September 2011
6-64
If continuation of a point source of groundwater discharge to the East Huttonville Creek is desired, either during the interim period between the removal of the racetrack
wetlands and the construction of the replacement wetland features or permanently, a
local groundwater interception system could be installed. For example, granular trenches, constructed below the water table and connected to the creek, could be used
to collect groundwater seepage from the former racetrack pond area. For the overall Sub-Area 51-1 area, it is a goal to maintain high water table conditions along the NHS
and recommendations have been proposed, in both the HFSWS and this EIR, to design
service trenches such that groundwater collection and redirection does not occur (refer to Section 12.4.2). However, an exception to this could be considered in the former
racetrack area if direct discharge of groundwater to the East Huttonville Creek is preferred. Under present conditions, the drainage from the racetrack culvert serves to
contribute flows to the lower reaches of the East Huttonville Creek (i.e., HV19) and under
certain dry weather situations, the East Huttonville Creek upstream of the culvert may be dry. Hence, while the primary benefit of this input is to support flow in the lower reaches
of the East Huttonville Creek, it is anticipated this function could be replaced either by a point-source contribution through a groundwater collection trench, or via passive
seepage along the created watercourse. The preferred approach will be determined at detailed design.
The wetlands will need to be dewatered before they can be filled in. As noted in Section 12.3, dewatering activities may require a Permit To Take Water (PTTW) from the
MOE. A detailed water management plan will be required in support of the PTTW application. It is recommended that the water management plan for the racetrack
wetlands include the following:
• Swales will be constructed around the proposed construction area such that all
surface water currently draining towards the ponds will be diverted and
redirected into the East Huttonville Creek.
• All water pumped from the ponds throughout the dewatering process should
continue to be discharged into the East Huttonville Creek.
• The water discharge location should be as close to the existing discharge location
as possible given the construction area layout and grades.
• Appropriate construction monitoring and sediment and erosion controls plans will
be required as part of the water management plan.
Separate from the water management plan, a wildlife rescue plan for amphibians,
reptiles, fish and mammals will be completed in accordance with MNR’s permitting
requirements (Permit for the Collection of Fish for Scientific Purposes and a Permit for the Collection of Wildlife) prior to any construction/dewatering in the racetrack wetlands.
New Wetland Construction With respect to the long term, construction of a new wetland feature is proposed within
the NHS, south of Sandalwood Parkway. As noted above, the existing ponds essentially
function as a local groundwater interceptor system – excavation below the water table permits groundwater to flow into the ponds and the connecting drainage channels direct
these flows into the East Huttonville Creek. To mimic the existing groundwater conditions for any new open water feature to be constructed, it will be necessary to
ensure that the pond features are excavated below the water table and provide an outlet
to the East Huttonville Creek (the racetrack ponds are in the range of about 2m to 3.5m below the local water table). The MNR has requested that a semi-passive restoration
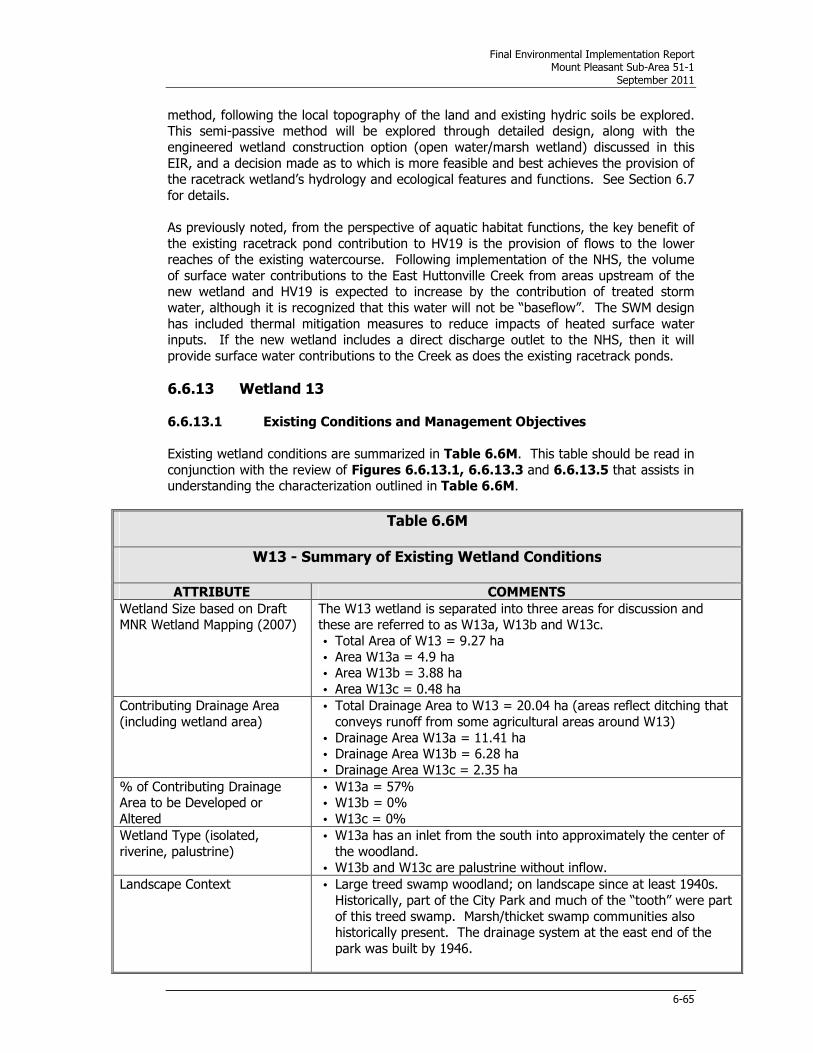
Final Environmental Implementation Report Mount Pleasant Sub-Area 51-1
September 2011
6-65
method, following the local topography of the land and existing hydric soils be explored. This semi-passive method will be explored through detailed design, along with the
engineered wetland construction option (open water/marsh wetland) discussed in this
EIR, and a decision made as to which is more feasible and best achieves the provision of the racetrack wetland’s hydrology and ecological features and functions. See Section 6.7
for details.
As previously noted, from the perspective of aquatic habitat functions, the key benefit of
the existing racetrack pond contribution to HV19 is the provision of flows to the lower reaches of the existing watercourse. Following implementation of the NHS, the volume
of surface water contributions to the East Huttonville Creek from areas upstream of the new wetland and HV19 is expected to increase by the contribution of treated storm
water, although it is recognized that this water will not be “baseflow”. The SWM design
has included thermal mitigation measures to reduce impacts of heated surface water inputs. If the new wetland includes a direct discharge outlet to the NHS, then it will
provide surface water contributions to the Creek as does the existing racetrack ponds.
6.6.13 Wetland 13 6.6.13.1 Existing Conditions and Management Objectives
Existing wetland conditions are summarized in Table 6.6M. This table should be read in
conjunction with the review of Figures 6.6.13.1, 6.6.13.3 and 6.6.13.5 that assists in understanding the characterization outlined in Table 6.6M.
Table 6.6M
W13 - Summary of Existing Wetland Conditions
ATTRIBUTE COMMENTS
Wetland Size based on Draft MNR Wetland Mapping (2007)
The W13 wetland is separated into three areas for discussion and these are referred to as W13a, W13b and W13c.
• Total Area of W13 = 9.27 ha
• Area W13a = 4.9 ha • Area W13b = 3.88 ha
• Area W13c = 0.48 ha
Contributing Drainage Area
(including wetland area)
• Total Drainage Area to W13 = 20.04 ha (areas reflect ditching that
conveys runoff from some agricultural areas around W13)
• Drainage Area W13a = 11.41 ha • Drainage Area W13b = 6.28 ha
• Drainage Area W13c = 2.35 ha
% of Contributing Drainage Area to be Developed or
Altered
• W13a = 57% • W13b = 0%
• W13c = 0%
Wetland Type (isolated,
riverine, palustrine)
• W13a has an inlet from the south into approximately the center of
the woodland.
• W13b and W13c are palustrine without inflow.
Landscape Context
• Large treed swamp woodland; on landscape since at least 1940s.
Historically, part of the City Park and much of the “tooth” were part
of this treed swamp. Marsh/thicket swamp communities also historically present. The drainage system at the east end of the
park was built by 1946.

Final Environmental Implementation Report Mount Pleasant Sub-Area 51-1
September 2011
6-66
Table 6.6M
W13 - Summary of Existing Wetland Conditions
ATTRIBUTE COMMENTS
Disturbance/Invasive Species • W13a - Eastern half disturbed, western half mature undisturbed
swamp. Ditching on southwest and southeast sides of W13a prevents water from entering wetland. There are two tile drains at
southwest corner that feed into a ditch that carries water northwest to the Rowntree Drain. The ditch starting on the southeast corner
and continues around the east and north sides of the wetland
carries water away from the wetland and into the Rowntree Drain. Surface water from the “tooth” area drains into either the ditch
along the southwest side of W13a or the ditch along the south side of W13b.
• W13a - CVC Category I invasives: garlic mustard, common
buckthorn; Category III invasives: bitter nightshade, Canada thistle. • W13b - Relatively undisturbed. Ditching on south side of W13b
prevents water from entering wetland. Ditch on part of east side of W13b drains this wetland. There is a partial berm on east side that
prevents some of W13b from draining into the east ditch. • W13b - CVC Category I invasives: garlic mustard, common
buckthorn, Manitoba maple.
• W13c – The wetland is a narrow linear feature at the toe of slope along the east edge of Park Woodland B. There are two large
metal storage tanks (2.4m high by ~6m long) and abundant piles of residential garbage present along its length. Vegetation present
suggests it is in transition from wetland to lowland forest. .
Monitoring
• Visual inspections of the wetland hydroperiod were made during the spring of 2009, 2010 and 2011 by Burnside.
• A staff gauge (SG13) was installed in 2009 in the drainage ditch along the north side of W13a. In 2011, a second staff gauge
(SG13b) was installed in the central portion of W13b. Note that
this gauge was installed at the same location as had been regularly inspected for depth of water monitoring since 2009 (refer to Figure
B-6-13 and Table B-6-1; Appendix B-6). • A monitoring well nest and a piezometer nest were installed in the
central area of the wetland for the HFSWS (BB-BH1s/d and BB PZ-
1s/d) and monitored throughout the EIR study period. Two new piezometers nests were installed in 2011 – PZ1s/d-W13a and
PZ1s/d-W13b (Figure B-6-13; Appendix B). • Wells were monitored monthly from December 2007 through
December 2009 and seasonally in 2010 and part of 2011(refer to Appendix B-4 for data and hydrographs). Piezometers and staff
gauges were monitored monthly from May 2008 through May 2010
and seasonally during the remainder of 2010 and part of 2011 (refer to Appendix B-4 for piezometer data and hydrographs and
Appendix B-6 for staff gauge data). • There are a number of field tiles that outlet to the drainage ditch
on the southwest side of W13a and two locations are included in
the visual monitoring program (tile outlet location is shown on Figure B-6-13; Appendix B-6).
• MNR conducted wetland inventories (draft OWES) in 2005 and 2006.
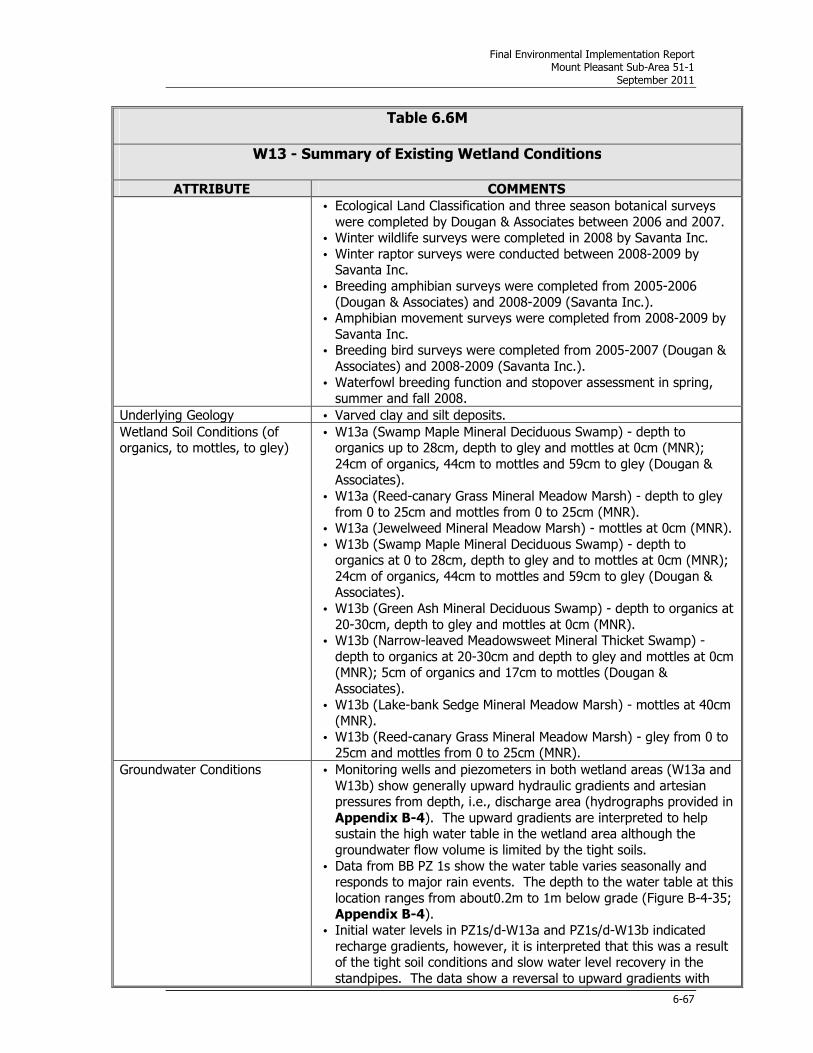
Final Environmental Implementation Report Mount Pleasant Sub-Area 51-1
September 2011
6-67
Table 6.6M
W13 - Summary of Existing Wetland Conditions
ATTRIBUTE COMMENTS
• Ecological Land Classification and three season botanical surveys
were completed by Dougan & Associates between 2006 and 2007. • Winter wildlife surveys were completed in 2008 by Savanta Inc.
• Winter raptor surveys were conducted between 2008-2009 by Savanta Inc.
• Breeding amphibian surveys were completed from 2005-2006
(Dougan & Associates) and 2008-2009 (Savanta Inc.). • Amphibian movement surveys were completed from 2008-2009 by
Savanta Inc. • Breeding bird surveys were completed from 2005-2007 (Dougan &
Associates) and 2008-2009 (Savanta Inc.).
• Waterfowl breeding function and stopover assessment in spring, summer and fall 2008.
Underlying Geology • Varved clay and silt deposits.
Wetland Soil Conditions (of organics, to mottles, to gley)
• W13a (Swamp Maple Mineral Deciduous Swamp) - depth to organics up to 28cm, depth to gley and mottles at 0cm (MNR);
24cm of organics, 44cm to mottles and 59cm to gley (Dougan & Associates).
• W13a (Reed-canary Grass Mineral Meadow Marsh) - depth to gley
from 0 to 25cm and mottles from 0 to 25cm (MNR). • W13a (Jewelweed Mineral Meadow Marsh) - mottles at 0cm (MNR).
• W13b (Swamp Maple Mineral Deciduous Swamp) - depth to organics at 0 to 28cm, depth to gley and to mottles at 0cm (MNR);
24cm of organics, 44cm to mottles and 59cm to gley (Dougan & Associates).
• W13b (Green Ash Mineral Deciduous Swamp) - depth to organics at
20-30cm, depth to gley and mottles at 0cm (MNR). • W13b (Narrow-leaved Meadowsweet Mineral Thicket Swamp) -
depth to organics at 20-30cm and depth to gley and mottles at 0cm (MNR); 5cm of organics and 17cm to mottles (Dougan &
Associates).
• W13b (Lake-bank Sedge Mineral Meadow Marsh) - mottles at 40cm (MNR).
• W13b (Reed-canary Grass Mineral Meadow Marsh) - gley from 0 to 25cm and mottles from 0 to 25cm (MNR).
Groundwater Conditions
• Monitoring wells and piezometers in both wetland areas (W13a and
W13b) show generally upward hydraulic gradients and artesian pressures from depth, i.e., discharge area (hydrographs provided in
Appendix B-4). The upward gradients are interpreted to help sustain the high water table in the wetland area although the
groundwater flow volume is limited by the tight soils.
• Data from BB PZ 1s show the water table varies seasonally and responds to major rain events. The depth to the water table at this
location ranges from about0.2m to 1m below grade (Figure B-4-35; Appendix B-4).
• Initial water levels in PZ1s/d-W13a and PZ1s/d-W13b indicated
recharge gradients, however, it is interpreted that this was a result of the tight soil conditions and slow water level recovery in the
standpipes. The data show a reversal to upward gradients with

Final Environmental Implementation Report Mount Pleasant Sub-Area 51-1
September 2011
6-68
Table 6.6M
W13 - Summary of Existing Wetland Conditions
ATTRIBUTE COMMENTS
above-grade water levels for a couple of weeks in early May 2011
and a decline of the water levels throughout June (Figures B-4-51 and B-4-52, Appendix B-4).
• Based on the groundwater flow patterns and assuming full saturation of the soils beneath the wetland area, flux calculations
considering both the lateral flow and vertical discharge conditions
show that the potential groundwater contribution represents about 1% of the total water supply available to this wetland area.
Surface Water Conditions • No perennial open water.
• Intermittent shallow standing water is observed in spring and following major storm events, particularly in W13b, but none in
W13c. • Water in the woodlots occurs in small vernal pools. The maximum
observed spring water depth in W13b was 39cm in May 2011. A water depth of 46cm was measured in May 2011 in the ditch at
SG13 (Table B-6-1; Appendix B-6).
• No vernal pools were observed in W13b by Dougan in May 2006. • Flows are observed in the drainage ditches adjacent to the
wetlands in the spring and following major rain events.
Surface Water Inputs and Inlet Conditions
• Direct precipitation and surface water runoff are estimated to provide 99% of the water supply to this feature.
• W13a - no inlet to swamp (ditching surrounds wetland) • W13b - no inlet; ill-defined overland drainage only from “tooth”
area; periodic flooding from Rowntree Drain. • W13c - no inlet; wetland located on/near height of land in Park
Woodland B.
Outlet Conditions • W13a - drained by ditching surrounding wetland • W13b - there is a poorly defined swale that drains the western
portion of W13b towards the east ditch. There appears to be
drainage to the north (HV22), in the area of meadowsweet thicket swamp.
• W13c - diffuse drainage into Reed-canary Grass Mineral Meadow Marsh on TCPL.
Hydroperiod • Shallow standing water was observed in the W13a and W13b
during and following the snowmelt periods. • Burnside observed W13a and W13b to be generally dry by the end
of May in 2009 and 2010, except for the deepest portions of the drainage ditches that line the southwest and north boundaries of
W13a and the northeast boundary of W13b. Under wet conditions
in 2011, the wetlands had some areas of standing water through the end of June (Table B-6-1, Appendix B-6).
• The typical standing water period is estimated to about 3 months (generally March/April/May).
• While surface water conditions were not observed in W13c,
vegetation conditions suggest that this wetland is generally dry.
ELC Vegetation Types
• W13a - Swamp Maple Mineral Deciduous Swamp, small peripheral
areas of Reed-canary Grass Mineral Meadow Marsh and Jewelweed Mineral Meadow Marsh.
• W13b - Swamp Maple Mineral Deciduous Swamp; smaller areas of

Final Environmental Implementation Report Mount Pleasant Sub-Area 51-1
September 2011
6-69
Table 6.6M
W13 - Summary of Existing Wetland Conditions
ATTRIBUTE COMMENTS
Green Ash Mineral Deciduous Swamp; Narrow-leaved
Meadowsweet Mineral Thicket Swamp; Reed-canary Grass Mineral Meadow Marsh; Forb Mineral Meadow Marsh; Graminoid Mineral
Meadow Marsh (Lake-bank Sedge). • W13c - Green Ash Mineral Deciduous Swamp and Reed-canary
Grass Mineral Meadow Marsh at bottom of slope.
Dominant Vegetation Species Per Strata
• W13a - Trees: swamp maple, green ash; Shrubs: swamp maple, green ash, buckthorn, white elm; Ground cover: garlic mustard,
white avens, yellow avens.
• W13b - Trees: swamp maple, green ash; Shrubs: swamp maple, buckthorn; Ground cover: Virginia water-leaf, jewelweed, garlic
mustard. • W13c – Trees: green ash; Shrubs: common buckthorn; Ground
cover: garlic mustard.
Flora • Rare in Ecodistrict 6E7: foxtail sedge, wood reed grass, shagbark hickory, silky dogwood, running strawberry-bush, rough avens.
• Uncommon in Ecodistrict 6E7: tall beggar-ticks, Pennsylvania bitter cress, Tuckerman’s sedge, silky dogwood, bur oak, giant goldenrod,
Le Conte’s violet.
Fish and Wildlife Use • No rare species.
Special Features/Other
(i.e., hibernacula, vernal pools)
• Shallow vernal pools in W13b.
• Freshwater clams (MNR, 2007).
• W13a – American Toad (Dougan 2006). • W13a – No amphibian calls (Savanta Inc., 2008 and 2009).
• W13b – No amphibian calls (Savanta Inc., 2008) and one American Toad (Savanta Inc., 2009).
• W13c - No amphibian calls (Savanta Inc., 2008 and 2009).
• Leopard Frog (number and specific location not noted, MNR, 2006).
Sensitivity to Water Budget
Change
• W13a, b and c – Shallow vernal pools
• W13a and W13b - Swamp maple swamp requires extensive spring flooding (and deeper water levels than green ash) followed by dry
conditions from June onwards.
• W13c – This patch has been much degraded and is no longer subject to floodings.
Management
Recommendations
• Protect wetlands and their buffers in NHS
• Restore “tooth” area with new wetland • W13a and W13b - Enhance hydrological conditions to maintain
existing vegetation community types, increase flooded area of wetlands outside of City Park and support newly created wetland.
Within the City Park, objective is to reduce flooding if feasible. • W13c – Acknowledge this community is in transition from swamp to
lowland forest.
• W13 - Develop Invasive Species Management Strategy

Final Environmental Implementation Report Mount Pleasant Sub-Area 51-1
September 2011
6-70
6.6.13.2 Hydrologic Characterization of Existing Wetland
W13 has three distinct parts (W13a, W13b, and W13c).
W13a is 4.9 ha in size and its contributing drainage area is 11.41 ha (which includes agricultural areas to the immediate south of the wetland and the wetland itself). The
other surrounding areas south and east of W13a drain towards this wetland but surface
flows are captured in the existing ditches that exist along the east/north and west sides of the wetland. Drainage from these areas is effectively directed around the wetland.
W13b is 3.88 ha in size and its contributing drainage area is 6.28 ha including the wetland itself. W13c is 0.48 ha in size and its contributing drainage area is 2.35 ha
including the wetland itself. All wetland features within W13 are classified as a
palustrine; with intermittent inflow and outflow. The W13 features have no well-defined storage basins, or measurable outlet rating curve. As described in Section 6.5.3, a field
survey was completed by Savanta Inc. to estimate both the perimeter of the storage area and average water depth.
To model W13, three simulations were conducted to assess the wetland’s sensitivity to
storage volume estimates. The preliminary approximation based on field investigations
yielded a storage capacity of 530m3 (W13a), 250m3 (W13b), and 2,700m3 (W13c). The second simulation assumed that the wetlands had one tenth of the capacity (i.e., 53m3,
25m3, and 270m3), while the third simulation utilized the maximum depth observed in the field (2009-2010) in the deepest location of the ponded areas of W13a, W13b, and
W13c for total volume estimates of 1060m3, 300m3, and 5,400m3, respectively.
The variations of wetland water level for W13a, W13b, and W13c over a typical year are
indicated in Figures 6.6.13.2, 6.6.13.4 and 6.6.13.6. The results show the range of wetland water levels resulting from the sensitivity analyses of volume estimates. The
resulting modeled range of fluctuation in wetland water levels is relatively narrow. That is, there is a typically a difference of less than 1cm between the low and high volume
estimates. Drainage areas contributing flow to these wetlands are essentially the
wetland areas themselves due to the ditching surrounding the wetlands.
As set out on Figures 6.6.13.2, 6.6.13.4, and 6.6.13.6, on average, wetland water levels are high throughout the winter and spring due to snow accumulation, and lack of
evapotranspiration. Following mid-April, water levels quickly decrease due to
evapotranspiration. Although precipitation occurs throughout the spring, summer, and fall, there is insufficient runoff volume from the contributing drainage area to fill the
storage volume significantly due to high evapotranspiration and presence of ditches. These trends agree with field observations of the hydroperiod as described in
Table 6.6M, in which the wetland was dry between late May/early June until snow
accumulation in late fall/early winter.
6.6.13.3 Mitigation Requirements
Under proposed conditions, should the existing ditches remain in place, they will continue to direct upstream drainage away from the wetlands. Based on discussion with the CVC
and the MNR, it is not desirable to maintain existing drainage conditions and water levels
in W13a and W13b. Hence, existing water levels currently experienced in these wetlands and modeled are not the desired targets.
The maintenance of existing conditions in W13a and W13b is not desired, as under these
conditions the wetlands are not receiving enough water, as evidenced by presence of

Final Environmental Implementation Report Mount Pleasant Sub-Area 51-1
September 2011
6-71
upland species (i.e., raspberry) into the wetland. The dominant vegetation in these two wetlands is Swamp Maple Mineral Deciduous Swamp, which requires extensive spring
flooding, followed by dry summers. The general concept to restoration of W13a, W13b
and the “tooth” area was discussed with the City, the CVC and the MNR on May 18, 2011. The approach to restoration is described in Section 5.7.5. The restoration
of a more natural hydroperiod for these wetlands requires further grading analyses and consideration of adjacent uses - the City Park and the TCPL. Implementing the wetland
restoration concept for W13a, W13b and the “tooth” area will require further discussions
with the CVC, the MNR, the City and the TCPL to detail a solution to meet all parties’ needs and desired outcomes. Post development water balance analyses will be
completed at the NHS detailed design stage when further wetland restoration design and consultation is completed.
W13b and W13c have small contributing drainage areas that will not be developed under proposed development conditions and hence mitigation regarding surface water source
supply is not required in either wetland. Management of drainage ditches adjacent to W13b is proposed to modify drainage paths that currently direct water away from this
wetland.
6.6.14 Wetland 14
6.6.14.1 Existing Conditions and Management Objectives
Existing wetland conditions are summarized in Table 6.6N. This table should be read in
conjunction with the review of Figures 6.6.14.1 that assists in understanding the
characterization outlined in Table 6.6N.
Table 6.6N
W14 Summary of Existing Wetland Conditions
ATTRIBUTE COMMENTS (refer to Figure 6.6.14.1)
Wetland Size based on Draft MNR Wetland Mapping (2007)
• 0.21 ha
Contributing Drainage Area
(including wetland area)
• 4.66 ha
% of Drainage Area to be
Developed or Altered
• 100%
Wetland Type (isolated, riverine, palustrine)
• Palustrine without inflow.
Landscape Context • Small wetland located within CNR Woodlot. Upland portion of CNR woodlot is predominantly a cultural woodland (buckthorn and
hawthorn thicket) with row of mature Bur Oak trees on east edge. CNR woodlot, in similar shape to present day was on the landscape
in 1946.
Disturbance/ Invasive Species • Disturbed from historic farming practices, including high likelihood that woodland was used for cattle grazing.
Monitoring
• Visual inspections of the wetland hydroperiod were made during
the spring of 2009, 2010 and 2011 by Burnside at locations identified as 14a and 14b on Figure B-6-14 in Appendix B-6. A
staff gauge (SG14) was installed near the centre of the wetland at

Final Environmental Implementation Report Mount Pleasant Sub-Area 51-1
September 2011
6-72
Table 6.6N
W14 Summary of Existing Wetland Conditions
ATTRIBUTE COMMENTS (refer to Figure 6.6.14.1)
the 14b location. • MNR conducted wetland inventories (draft OWES) in 2005 and
2006. • Ecological Land Classification and three season botanical surveys
were completed by Dougan & Associates between 2006 and 2007.
• Winter wildlife surveys were completed in 2008 by Savanta Inc. • Winter raptor surveys were conducted between 2008-2009 by
Savanta Inc. • Breeding bird surveys were completed from 2005-2007 (Dougan &
Associates) and 2008-2009 (Savanta Inc.).
Underlying Geology • Clayey silt to silty clay deposits.
Wetland Soil Conditions (of
organics, to mottles, to gley)
• Soil information not available.
Groundwater Conditions • The water table is estimated to be approximately 1.5 m below ground level and there is no evidence of groundwater discharge to
the wetland feature.
Surface Water Conditions • No perennial open water. • Intermittent shallow standing water in spring.
• Water occurs in small vernal pools - deepest observed vernal pool
was 20cm in May 2011 (Table B-6-1; Appendix B).
Surface Water Input and Inlet
Conditions
• Direct precipitation and surface water runoff provide water source
to this feature. • No inlet.
Outlet Conditions • At west end of W14, there is diffuse drainage into the agricultural
fields and eventually in East Huttonville Creek.
Hydroperiod • Shallow standing water is observed during and following the snowmelt period.
• Wetland was dry by late May 2009 and by end of April 2010. • Typical standing water period is interpreted to be less than 3
months. Burnside observed W14 to be dry by mid June in 2009 and 2011, and by the end of April in 2010 (Table B-6-1,
Appendix B-6).
• The typical standing water period is estimated to about 3 months (generally March/April/May).
ELC Vegetation Types • Graminoid Mineral Meadow Marsh
Dominant Vegetation Species Per Strata
• Narrow-leaved emergents: awl sedge, creeping bent grass and crested sedge
Flora • Rare in Ecodistrict 6E7: shagbark hickory, rough avens • Uncommon in Ecodistrict 6E7: bur oak
Fish and Wildlife Use • No rare species.
Special Features/Other
(i.e., hibernacula, vernal pools)
• Not observed.
• No amphibian calls (Savanta Inc., 2008, 2009; Dougan, 2005)
Sensitive Attributes • Not observed.
Management
Recommendations
• Remove and restore ecological functions within NHS.
• Transplant suitable native vegetation (that is amenable to transplantation) to areas within NHS.
• Consider seed bank collection and topsoil salvaging.

Final Environmental Implementation Report Mount Pleasant Sub-Area 51-1
September 2011
6-73
This wetland is not being retained in the proposed development and no water budget is
required.
6.7 Creation of Open Water/Marsh Wetland
In the January 2011 Sub-Area 51-1 EIR submission, a preliminary design of the proposed
new open water/marsh wetland, located south of Sandalwood Parkway and east of the current racetrack ponds, was proposed to replicate ecologic functions of the racetrack
ponds. This proposed open water/marsh wetland is intended to provide enhanced ecological features, both in size and type of vegetation communities present, to increase
ecological functionality. Its design includes a shallow littoral zone and upland vegetation communities to maximize potential for vegetation community types from an open water
(i.e., submerged and rooted macrophytes) to emergent (i.e., cattail/sedge) to
graminoid/forb meadow marsh to upland meadow and thicket communities. Shorebird, waterfowl and amphibian use is maximized through the presence of these community
types as well as the presence of irregular shoreline, islands and deep pools (> 2m). The January 2011 EIR noted that the preferred hydroperiod of the open water/marsh wetland
involves maintaining the maximum depth (approximately 2.1m in the deep pools) during
the spring until June, and then drying partially to provide mudflats for shoreline bird use (average depth of 1.0m across the area). Calculations were completed to determine
water supply requirements to maintain the desired hydroperiod and wetland depths on this new wetland. Three possible alternate water sources were identified, including
drainage from W9, adjacent roof areas and the East Huttonville Creek. The need for further refinement of the model and water sources considering channel/flooding effects
was identified to determine specific mitigation requirements.
Through the review and comment process of the January 2011 EIR, including a
June 8, 2011 site visit to the location of the future open water/marsh wetland, the MNR suggested investigating an alternative “semi-passive” wetland restoration method.
Utilizing this alternate design approach, the natural topography of the land would be
maintained to the extent possible, along with berming and the use of existing soils and seed bank to create a new wetland.
Based on the existing topography and engineering constraints posed by the Sandalwood
Road alignment and realigned East Huttonville Creek, an alternative wetland restoration
design to the January 2011 open water/marsh will be developed post EIR through the detailed design process. This alternative design will likely differ in vegetation types from
that proposed in the January 2011 EIR, in that it may not support a permanent shallow open water wetland but may support a seasonally flooded shallow marsh/meadow
marsh. Through this evaluation, it will be determined whether the “semi-passive” wetland restoration design can replicate the ecologic functions of the racetrack ponds.
Considerations to be addressed include ability to meet this design objective, water
balance requirements, engineering factors associated with the design of the East Huttonville Creek realignment and Sandalwood Parkway, flooding implications and
aesthetics. Once the preferred design is determined, water balance calculations for the new wetland feature should be finalized.

Final Environmental Implementation Report Mount Pleasant Sub-Area 51-1
September 2011
7-1
7.0 VEGETATION CONSERVATION PLAN
Kuntz Forestry Consulting Inc. was retained by the Mount Pleasant North-South Spine Group to
complete a Vegetation Conservation Plan for the Study Area. A tree inventory was conducted and reviewed in the context of the proposed development plan. The work plan for this study is
outlined in the approved EIR TOR dated July 2010. The scope of work included the following:
• Prepare mapping (topographic/proposed site plan overlaid on aerial ortho-imagery) for
use in field.
• Conduct field work to collect tree inventory data including species, diameter at breast
height (DBH), condition and crown reserve (diameter) for tree resources. Tag and locate
trees on ortho-imagery. Obtain photos of all trees considered to be specimen trees.
• Evaluate specimen trees given their size, species, condition, location and tolerance to
disturbance.
• Evaluate tree saving opportunities based on proposed site and grading plans.
• Document the findings in a Vegetation Conservation Plan report.
The resultant report entitled, Vegetation Conservation Plan, Block 51-1, Mount Pleasant Lands, Brampton, Ontario, is provided in Appendix F. This report presents the tree inventory comprised of three different types of tree resources located within the Study Area:
• trees 15cm in DBH and larger outside of the Natural Heritage System (NHS);
• woodland trees situated outside of the NHS; and,
• trees situated within the NHS outside woodlands where channel realignment and road
alignments are proposed.
Field assessments were conducted in September and October 2010. Trees situated outside of
the NHS were tagged with metal tree tags, sequentially numbered 2 to 492 corresponding to the
inventory. Trees situated within the NHS outside of woodlands were identified with letters A-G corresponding with the inventory. These trees were identified for further review by the City
during the staking of woodland features in 2010. Trees included in the inventory were located by use of ortho-rectified aerial photography and are presented in the figures in the Vegetation
Conservation Plan report (see Appendix F).
The findings of the study included all trees 15cm in diameter and larger situated outside the NHS
and select trees situated within the NHS. A total of 491 individual trees and 1 woodland (CNR
Woodland) were inventoried outside the NHS. Select trees inventoried within the NHS but outside of woodlands included 6 individual trees, 1 tree grouping and 1 Regenerating Meadow.
Of the 491 individual trees situated outside of the NHS, 21 specimen trees were identified for
preservation consideration. Tree health, location or site grading requirements made preservation
of most specimen trees impractical. Of the specimen trees identified, 1 can be retained with the Block Plan fabric within the revised boundary of the City Park.

Final Environmental Implementation Report Mount Pleasant Sub-Area 51-1
September 2011
7-2
Of the trees inventoried within the NHS but outside of woodlands, 2 trees, 1 tree grouping and the majority of the Regenerating Meadow can be retained.
The preservation of the CNR woodland is not required as per the MPSP and the Implementation Principles.
Approximately 195 trees situated outside of the NHS are protected by the City’s Tree
Preservation By-law 38-2006. Removal of a portion of the Regenerating Meadow situated south
of the Sandalwood Woodland is protected by the City’s Woodlot Conservation By-law No. 402-2005. Permission from the City is required prior to the removal of these tree resources.
The following recommendations are suggested to minimize impacts to trees identified for
preservation:
• Tree protection barriers and fencing should be erected prior to earthworks to ensure
trees identified for preservation are not impacted by the proposed developments.
• Branches that extend past prescribed tree protection zones that require pruning must be
pruned by a qualified Arborist or other tree professional as approved by the City. All
pruning of tree roots and branches must be in accordance with good arboricultural standards.
• Site visits, (pre, during and post construction) are recommended by either a certified
consulting arborist (I.S.A.) or registered professional forester (R.P.F.) to ensure proper utilization of tree protection barriers. Trees should also be inspected for damage
incurred during construction to ensure appropriate pruning or other mitigation measures are implemented.

Final Environmental Implementation Report Mount Pleasant Sub-Area 51-1
September 2011
8-1
8.0 DRAINAGE DENSITY
8.1 HFSWS Analyses and Recommendations One of the HFSWS targets requires the maintenance of drainage density by maintaining, “open channel length within similar natural systems of similar Regional subwatershed samples”. The HFSWS Phase 2 and 3 Reports (June 2011) addressed the drainage density in the East
Huttonville Creek separately from Fletcher’s Creek. The HFSWS Phase 2 Report (June 9, 2011)
presents the hierarchy of channel lengths calculated as part of the drainage density analyses. Table 3.17 from the HFSWS Phase 2 Report lists the various channel types utilized in these
calculations as shown in Table 8.1A.
Table 8.1A Channel Types for Drainage Density Calculations
from the HFSWS Phase 2 Report
Rating Channel Type
High Watercourses within the NHS (High)
Medium Watercourses within the NHS (Medium)
Low-1
Existing feature maintained within the proposed development
New swales in public lands able to connect directly to the NHS (already constructed)
Existing swales maintained within the NHS
New swales in public lands able to connect directly to the NHS
New swales downstream of stormwater management facilities within the NHS
Low-2 New swales in public lands connected to the stormwater management system
Flow paths through stormwater management facilities
* Source: HFSWS Phase 2 Report (June 9, 2011), Table 3.17
Based on the HFSWS assessment of the 3G Land Use Plan, channel lengths based on channel types noted above were calculated and presented in Table 3.18 in the HFSWS Phase 2 Report
(June 9, 2011). Table 8.1B reflects this data. These calculations do not include a number of other valid channel types for calculations due to uncertainty in their locations at the HFSWS
stage. These other types include swale lengths in the NHS buffers, swales on private lands, LID measures, or overbank fish habitat outlets/backwaters connected to the stream network. This
latter length is referred to in this EIR as side channels and connected pools in overbank areas.

Final Environmental Implementation Report Mount Pleasant Sub-Area 51-1
September 2011
8-2
Table 8.1B Identified Channel Types within the 3G Land Use Plan*
Rating Hierarchy Fletcher’s Creek Huttonville
Creek
TOTAL
Existing
(km)
3G
Plan (km)
Existing
(km)
3G
Plan (km)
Existing
(km)
3G
Plan (km)
High Watercourses within the
NHS (High) 0.00 0.00 0.84 1.07 0.84 1.07
Medium Watercourses within the
NHS (Medium) 0.92 4.86 5.52 5.40 6.44 10.26
Low - 1 Existing feature maintained within the
proposed development
19.26
n/a
8.02
0.75
27.27
0.75
Swales in public grounds joining the NHS (already
constructed)
n/a 1.77 1.77
Existing swales
maintained within the NHS
0.93 1.74 2.67
New swales in public
grounds joining the NHS 0.95 1.40 2.35
New swales downstream
of stormwater management facilities
within the NHS
0.83 1.22 2.05
Low - 2 New swales in public lands connected to the
stormwater
management system
3.18 2.13 5.31
Flow paths through stormwater
management facilities
1.49 0.99 2.48
Total 20.18 12.23 14.38 16.47 34.56 28.70
* Source: HFSWS Phase 2 Report (June 9, 2011), Table 3.18
As illustrated, the HFSWS calculations of the 3G Land Use Plan indicate that the East Huttonville
Creek channels will exceed existing lengths while channel lengths in Fletcher’s Creek
subwatershed will be decreased.
The HFSWS also completed drainage density calculations which were presented in Table 3.19 and are reproduced in Table 8.1C herein. The HFSWS conclusions noted that when all channels are
considered, the overall 3G Plan drainage density by far exceeds the minimum drainage density
target of 1.41 within both watersheds. It also concludes that the average drainage density is nearly equivalent to or exceeds the average drainage density calculated within the Study Area

Final Environmental Implementation Report Mount Pleasant Sub-Area 51-1
September 2011
8-3
using streams lengths measured from Ontario base mapping. In the case of the East Huttonville Creek, these averages are far exceeded.
In the instance where only defined watercourses within NHS are taken into account (equivalent to high and medium rated streams), the HFSWS analyses concluded that there is a slight deficit
within Fletcher’s Creek (1.33km). Considering all streams and swales, some sub-catchments also exhibited a drainage deficit. The HFSWS work concluded that the incorporation of further swales
into the land use plan is required in order to maintain appropriate drainage density and channel
length. Additional swales can be incorporated into the 3G Land Use Plan, including:
• swales within the NHS perimeter buffers;
• swales within private property ownership (residential/employment);
• LID best management practices; and,
• overbank fish habitat outlets/backwaters connected to the stream network.
Table 8.1C 3G Plan Drainage Density Assessment
POD Testing 3G Testing
OBM Streams
High & Medium
Streams
POD All 3G
Channels
Watercourses within NHS
only
Fletcher’s Creek
Total catchment area considered (km2) 4.37 4.37 4.37 4.39 4.39
Total stream length (km) 16.27 7.88 5.86 12.23 4.86
Average drainage density within the Study Area
3.72 1.80 1.34 2.79 1.11
Drainage density deficit (km) 0.09* 2.27* -6.04* 1.33*
Huttonville Creek
Total catchment area considered (km2) 4.24 4.24 4.24 4.47 4.47
Total stream length (km) 10.27 6.41 5.76 16.47 6.46
Average drainage density within the Study
Area 2.42 1.51 1.36 3.68 1.45
Drainage density deficit (km) 0.17* 0.82* -10.17* -0.16*
*Source: HFSWS Phase 2 Report (June 9, 2011), Table 3.19
HFSWS conclusions note that:
1. “The findings show that, when all channels are considered, the overall 3G Plan drainage
density by far exceeds the minimum drainage density target of 1.41 within both
watersheds.”;
2. “When only defined watercourses with NHS are taken into account (equivalent to high
and medium rated streams), there is a slight deficit within Fletcher’s Creek (1.33km) …
This demonstrates the importance of incorporating further swales into the land use plan
in order to maintain appropriate drainage density and channel length.”
3. In the East Huttonville Creek, “ …location of swales can be used to maintain existing
channel length within public lands alone…”; and,
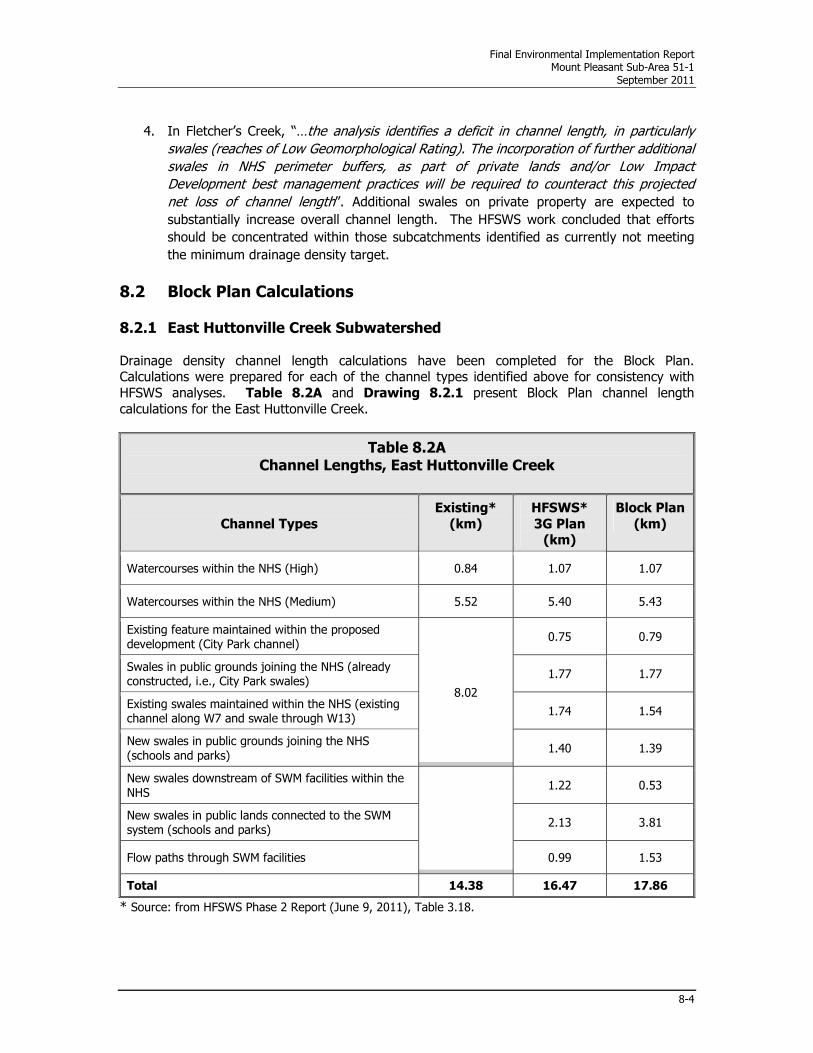
Final Environmental Implementation Report Mount Pleasant Sub-Area 51-1
September 2011
8-4
4. In Fletcher’s Creek, “…the analysis identifies a deficit in channel length, in particularly
swales (reaches of Low Geomorphological Rating). The incorporation of further additional
swales in NHS perimeter buffers, as part of private lands and/or Low Impact
Development best management practices will be required to counteract this projected
net loss of channel length”. Additional swales on private property are expected to
substantially increase overall channel length. The HFSWS work concluded that efforts
should be concentrated within those subcatchments identified as currently not meeting
the minimum drainage density target.
8.2 Block Plan Calculations 8.2.1 East Huttonville Creek Subwatershed
Drainage density channel length calculations have been completed for the Block Plan. Calculations were prepared for each of the channel types identified above for consistency with
HFSWS analyses. Table 8.2A and Drawing 8.2.1 present Block Plan channel length
calculations for the East Huttonville Creek.
Table 8.2A Channel Lengths, East Huttonville Creek
Channel Types
Existing*
(km)
HFSWS*
3G Plan (km)
Block Plan
(km)
Watercourses within the NHS (High) 0.84 1.07 1.07
Watercourses within the NHS (Medium) 5.52 5.40 5.43
Existing feature maintained within the proposed
development (City Park channel)
8.02
0.75 0.79
Swales in public grounds joining the NHS (already constructed, i.e., City Park swales)
1.77 1.77
Existing swales maintained within the NHS (existing channel along W7 and swale through W13)
1.74 1.54
New swales in public grounds joining the NHS
(schools and parks) 1.40 1.39
New swales downstream of SWM facilities within the
NHS
1.22 0.53
New swales in public lands connected to the SWM system (schools and parks)
2.13 3.81
Flow paths through SWM facilities 0.99 1.53
Total 14.38 16.47 17.86
* Source: from HFSWS Phase 2 Report (June 9, 2011), Table 3.18.

Final Environmental Implementation Report Mount Pleasant Sub-Area 51-1
September 2011
8-5
As illustrated in Table 8.2A, the Block Plan channel lengths exceed those identified in the HFSWS Phases 2 Report for the East Huttonville subwatershed. These calculations do not include
a number of additional swales as follows:
• Channel side slope swales throughout the NHS. These side slope swale lengths total
approximately 975m; they are largely located in the 100m channel sections;
• Lengths through fish habitat features designed into the realigned East Huttonville
Creek channel. This adds an additional 1,490m to channel lengths;
• Lengths through bioswales proposed within wetland buffers; and,
• Lengths through swales on private property. Since every lot has sideyard and
rearyard swales, this will be a substantial length.
With these additional lengths, channel/swale length numbers presented in Table 8.2A will be greatly exceeded.
The HFSWS concluded that the drainage density targets within the East Huttonville Creek are
exceeded with the channel lengths noted in the HFSWS Phase 2 Report. The Block Plan channel
lengths exceed the channel lengths included in the HFSWS drainage density calculations; hence, drainage density conclusions from the HFSWS are met and exceeded.
8.2.2 Fletcher’s Creek Subwatershed
The northeast portions of the Block Plan lie within the Fletcher’s Creek subwatershed (in HFSWS subcatchments 521 and 522). As noted in Section 8.1, the HFSWS recommends that additional
swale lengths be provided through the incorporation of further additional swales in the NHS perimeter buffers, as part of private lands and/or LID best management practices.
The Block Plan has been reviewed and swale lengths calculated for the Fletcher’s Creek subcatchments in Sub-Area 51-1. Swale lengths are noted in Table 8.2B.
Table 8.2B – Fletcher’s Creek Swale Lengths, Subcatchments 521 and 522
Swale Type
Swale Length (m)
New swales on public grounds joining NHS (schools and parks)
270
New swales on public lands connected to SWM system (schools and parks)
1,200
Flow paths through SWM ponds
350
TOTAL
1,820

Final Environmental Implementation Report Mount Pleasant Sub-Area 51-1
September 2011
8-6
The HFSWS Phase 2 drainage density calculations show 1,440m of swale length in these Fletcher’s Creek subcatchments. Therefore, the Block Plan design includes additional swale
length to that included in the HFSWS calculations. These lengths do not include swales in NHS
buffers that can be provided along the east side of Mayfield Woodland A in some locations. Detailed design grading plans should assess and provide, where feasible, additional swales in this
buffer. This needs to be co-ordinated with drainage design that accommodates existing flows out of W1, W2 and W3, through the development to downstream outlets.

Final Environmental Implementation Report Mount Pleasant Sub-Area 51-1
September 2011
9-1
9.0 STORMWATER MANAGEMENT PLAN
9.1 HFSWS Recommendations The EIR TOR notes that the purpose of the drainage and SWM component is to characterize
existing drainage conditions and identify SWM facility requirements and LID measures/designs
consistent with the HFSWS recommendations for surface water quality and quantity control.
The HFSWS Phase 2 (June 2011) and Phase 3 Report (June 2011) includes recommendations for further study and design of storm drainage systems as part of the EIR in support of Block Plans
and Draft Plans of Subdivision. It provides the recommended SWM criteria and concept,
identifying preliminary SWM facility locations. The channel realignment, the NHS and SWM pond locations are presented on HFSWS Figure 2G-LU. The recommendations include:
• SWM design criteria, including unit storage volumes and unit release rates for erosion
and flood control design of SWM facilities;
• requirement for Enhanced Level water quality design of SWM facilities; and,
• LID storage/infiltration targets.
The hydrologic modeling of pre-development conditions to establish unit flow rate targets for
quantity (flood) control purposes (2 year through Regional Storm flows) was completed as part of
the HFSWS. Further modeling of pre-development conditions is not required as part of the EIR. SWM ponds are to be sized to meet unit flow and unit storage targets as recommended in the
HFSWS.
The following sections summarize technical design requirements for SWM from the HFSWS that
have been utilized to guide the EIR SWM designs.
9.2 Design and Location of SWM Facilities
The HFSWS Phase 2 Report (June 2011) presents a recommended SWM Plan, including design
criteria, number, type and locations of end-of-pipe SWM facilities, outlet locations and LID design criteria. This EIR has further assessed the HFSWS SWM Plan at a more detailed level of review.
The proposed SWM facility locations are similar to those presented in the HFSWS Phase 2 Report
(June 2011). The SWM pond locations are provided on Drawing 3.4.3A and Drawings 9.2.1
to 9.2.6. The SWM facilities have been situated in the proposed locations for the following reasons:
• to make use of existing/natural low points in terrain to minimize earthworks/cut and
fill operations and maintain existing drainage patterns as much as possible;
• to maintain a permanent pool and drain into the receiving channel;
• to maintain flow input locations along the receiving channel;
• to minimize storm sewer infrastructure size and avoid potential servicing crossing
conflicts; the contributing areas to the SWM facilities are generally limited to 60 to 80 ha;

Final Environmental Implementation Report Mount Pleasant Sub-Area 51-1
September 2011
9-2
• to locate SWM facilities adjacent to the NHS;
• to optimize land use by maximizing tableland and serviceable area;
• to provide orientation most suitable for thermal mitigation/shading; and,
• to utilize existing infrastructure (in the case of the Pond F-1 existing storm outlet).
The EIR SWM Plan largely mirrors the HFSWS SWM Plan with some revisions – the main revision
being refinements to drainage areas to each SWM facility, the consolidation of four proposed SWM facilities into two combined facilities and the location of one facility near the CNR. The first
SWM facility consolidation is on the East Huttonville Creek where the proposed SWM facility,
north of the TCPL and west of the NHS, is consolidated with the SWM facility adjacent to the CNR and west of the NHS. The location of this consolidated pond has been moved westerly adjacent
to Mississauga Road. The second SWM facility consolidation is at Wanless Drive and Creditview Road within the Fletcher’s Creek subwatershed, where two SWM facilities will be consolidated
into one facility south of Wanless Drive.
As discussed in Section 9.6 of the EIR, an alternate set of SWM pond design criteria will be
implemented in Sub-Area 51-1 as approved by the City. Individual SWM facilities designs are provided on Drawings 9.2.1 to 9.2.6. These drawings present preliminary pond grading plans
illustrating grades, water levels, access road, sediment forebays, and inlet and outlet locations.
Pond design information is provided in the following sections.
9.3 Detailed Impervious and Pervious Area Calculations
The HFSWS provides recommendations for SWM end-of-pipe facility sizing based on a required
storage per impervious hectare and a release rate per hectare. Hence, to establish the preliminary pond designs, the imperviousness of the contributing drainage area to each SWM
pond was required. The imperviousness is utilized to calculate the permanent pool and target storage volumes for each SWM facility.
The catchment imperviousness is based on a combination of lot imperviousness and road right-
of-way (ROW) imperviousness. The proposed unit types and distribution were determined from
the preliminary Block Plan presented on Figure 1.4.1. For each unit type, the ratio of impervious surface (roofs, driveway, etc.) to total lot area was calculated as follows:

Final Environmental Implementation Report Mount Pleasant Sub-Area 51-1
September 2011
9-3
Table 9.3A Percent Imperviousness by Land Use
Unit Type Description
Percent
Impervious
Low Density (Detached homes) 51%
Medium Density (Semi-detached or
townhouse) 53%
High Density (Attached townhouses) 64%
High Density (Institutional/Commercial) 88%
A similar approach was utilized to assess the imperviousness of the proposed ROWs. Each ROW
cross-section was divided into impervious (pavement, sidewalk, and driveway) areas and pervious (boulevard) areas to provide the following ROW imperviousness percentages.
Table 9.3B Road Right-of-Way Imperviousness
Road ROW Description Percent Impervious
8m ROW (Rear laneway) 100%
10m ROW (Slip-off lane) 91%
16.5m ROW (Local road) 67%
18.5m ROW (Buffer road) 53%
21.5m ROW (Minor Collector road) 78%
24m ROW (Spine road / mid-block.) 94%
29.5m ROW (Arterial) 97%
36m ROW (Arterial) 89%
The total impervious area of each unit type and total length (multiplied by width) of each ROW
was calculated and divided by the total catchment area. The average imperviousness, based on the distribution of the above unit and ROW types, is approximately 65%. Detailed calculations
are included in Appendix G-2.
9.4 Erosion Control and Extended Detention The HFSWS proposed that in-stream erosion impact mitigation be addressed through the
incorporation of extended detention storage within SWM facilities. The HFSWS determined unit
storage and release rates for use in sizing the erosion control portion of the SWM facilities to meet erosion mitigation targets, assuming no LID measures were in place. Referring to Table 2.7
from the HFSWS Phase 3 Report (June 2011), the criteria are:

Final Environmental Implementation Report Mount Pleasant Sub-Area 51-1
September 2011
9-4
East Huttonville Creek Flow Node HE (at Bovaird Drive):
• Extended Detention/Erosion Storage: 200 m3/imp ha
• Extended Detention/Erosion Release Rate: 0.00052 m3/s/ha
Fletcher’s Creek Flow Node F1 (at Creditview Road):
• Extended Detention/Erosion Storage: 250 m3/imp ha
• Extended Detention/Erosion Release Rate: 0.00052m3/s/ha (Case 1) and
0.00025 m3/s/ha (Case 2)
Through the review of the HFSWS Working Paper (March 2010), based on input from the CVC,
the erosion thresholds for the East Huttonville Creek were revised and agreed upon as presented in the HFSWS Phase 3 Report (June 2011) as listed above. For Fletcher’s Creek, at the HFSWS
level, there was no agreement on the erosion threshold value to be used. As a result, the HFSWS assessed two alternative erosion thresholds (noted above as Case 1 and Case 2 numbers)
and identified that refinement of the critical flow for erosion control component of the SWM pond
design will be completed as part of EIR analyses. The CVC recommends a unitary rate of 0.00025 m3/s/ha; however, AMEC has indicated that this rate is based on a relatively
conservative bank shear stress rate and can lead to aggradation/reduction in sediment transport within the channel. Furthermore, the reduced extended detention release rate will lead to longer
drawdown time and potentially increased SWM facility temperatures. The HFSWS analyses
identified that the erosion threshold value will not affect required storage volumes, but will influence the discharge rate from the SWM ponds. Future changes to the erosion thresholds
require that the outlet structure design and drawdown time for each facility be reviewed.
The SWM pond designs presented in this EIR are therefore based on the AMEC design criteria (volume and discharge) presented in the HFSWS Phase 3 Report, as noted above. However,
additional erosion threshold analyses have been completed as part of this EIR as discussed below
and alterations to the Fletcher’s Creek erosion threshold is recommended. This will require revisions to the Fletcher’s Creek HFSWS erosion model to confirm pond discharge rates. This
work will be done in conjunction with the Block 51-2 design to comprehensively update this modeling. Should alterations be made as a result of additional revisions to the modeling to
reflect the refined erosion threshold value for the Fletcher’s Creek subcatchment, pond designs
will be updated through the FSR or detailed design process.
9.4.1 Erosion Thresholds
A key element of the SWM strategy for developing lands is the determination of erosion
thresholds, which dictate release rates from stormwater ponds to receiving creek systems. Erosion thresholds are based on the susceptibility of bed and bank material at the most sensitive
reach downstream of the proposed stormwater outfall to be eroded and transported downstream. Practically, assessment of the stability of the channel materials at a representative grain size is
compared to channel dimensions to determine a critical threshold discharge for entrainment; that
discharge is then converted to a unit discharge per areal unit (most often expressed as cubic metres per second per hectare). When interpreted on an individual stormwater pond basis, the
contributing area for the pond is multiplied by the unit discharge, thereby determining the release rate.
The HFSWS assessed erosion thresholds through the Phase 1 and Phase 2 process. The erosion
thresholds provided in the HFSWS Phase 2 Report were reviewed by the CVC. They accepted the
erosion threshold of 0.00052 m3/sec/ha for the East Huttonville Creek as the appropriate value to be utilized for the SWM pond sizing analyses. However, as discussed above, the CVC have
questioned the appropriateness of the SWS erosion threshold for Fletcher’s Creek sites, based on

Final Environmental Implementation Report Mount Pleasant Sub-Area 51-1
September 2011
9-5
corresponding erosion threshold values for the Huttonville Creek. Following discussions in the
summer 2010 regarding the Fletcher’s Creek calculations, the Fletcher’s Creek Site SW4 was selected as the sensitive downstream reach for erosion threshold analyses. No agreement was
reached regarding the appropriate erosion threshold value for Fletcher’s Creek at that time. The SWS Phase 2 assessment of the 3G Land Use Plan modeling runs, for the determination of
erosion control storage, pond release rates and detention times, included both the HFSWS team
recommended erosion threshold value (Case 1: 0.00052 m3/sec/ha) and the suggested CVC value (Case 2: 0.00025 m3/sec/ha). It was agreed that additional field analyses would be completed
for Site SW4 through the EIR to finalize the appropriate erosion threshold for Fletcher’s Creek.
9.4.1.1 Additional Work to Confirm Fletcher’s Creek Erosion Thresholds
JTB Environmental Systems Inc. met with the CVC and their representatives at Site SW4 to
review the location of the cross-sections for additional study and to discuss the methodology to be used in the collection and analysis of data. This site is located approximately 45m
downstream of the Fletcher’s Creek culvert at Bovaird Drive (located approximately 260m east of the intersection of Bovaird Drive and McLaughlin Road). UTM coordinates for the site are 596755
E, 4838569 N.
Consistent with the agreed to scope of work, four site visits were conducted over the fall of 2011
to sample for sediment transport and velocity at the SW4 site. One visit was completed under low flow conditions (lack of precipitation for a minimum of 5 days prior to the visit) and the other
three were completed under somewhat higher flow conditions in post-storm events. All visits were within 24 hours of a precipitation event.
9.4.1.2 Additional Data from CVC
The CVC completed a site assessment at Site SW4 to collect sediment samples for use in the analysis. Three sediment samples were collected and sent for grain size analysis: one sample
was labelled SW4 Bank (a mid-bank sample); one was labelled SW4 Lower (a lower bar sample
on the bed); and the third was labelled SW4 Upper (an upper bar sample on the bed). According to the CVC notes, the representative bed sample is expected to be somewhere between the SW4
Lower and SW4 Upper grain size results.
Table 9.4A shows the D50 (median grain size) value for the three samples, which were
extracted from the grain size chart provided by the CVC.
Table 9.4A Sediment Sample Grain Size Dimensions Used in the Analysis
Sample
Identifier
Median Grain Size (D50)
(mm)
SW4 Bank 0.08
SW4 Upper 1.20
SW4 Lower 10.0

Final Environmental Implementation Report Mount Pleasant Sub-Area 51-1
September 2011
9-6
9.4.1.3 Results
Results of the fieldwork and analysis are set out below.
Table 9.4B Summary of Site Discharge Measurements, Site SW4
Site
Visit
Discharge
(m3 sec-1)
Average
Velocity
(m sec-1)
Flow
Depth
(m)
Boundary Shear
Stress
(N m-2 sec-1)
1 0.484 0.61 0.19 19.71
2 0.629 0.67 0.23 21.64
3 0.774 0.72 0.26 23.58
4 0.141 0.37 0.09 11.95
HFSWS
Case 1
0.799 0.73 0.26 23.58
HFSWS
Case 2
0.385 0.56 0.17 18.09
Table 9.4B presents the range in discharge, velocity and depth during the site visits. Visit 4 was
conducted during low flow conditions (minimum 5 days post-rainfall event). Boundary shear
stresses are calculated for each visit utilizing the average energy gradient of 0.0033m/m (0.33%), which was measured in the field. Results for Cases 1 and 2 are reported in light of the
cross-sections used in this analysis for comparative purposes.
Sediment transport samples were collected during each site visit. These samples consisted of two components; the first being a water sample for TSS (total suspended solids) using a depth-
integrated sampler; the second being a near-bed sediment transport sample using a small-bore
(0.075m square) Helley-Smith sampler.
TSS samples were collected mid-channel during the site visit. The method used was the equal-transit method, whereby the sampler was sent through the water column at an equal rate to fill
the sampler bottle. During the low flow visit, use of the equal-transit method was not possible
given the low depth of the flow (0.09m), so a grab sample was utilized which encapsulated the top 0.07m of the water column.
Samples were weighed, decanted and the water evaporated off. The remaining sediment was
weighed and converted to a sample result in mg/litre.
Bed transport samples were collected at the centre of the channel. The Helley-Smith sampler
was deployed for a period of 30 minutes, during which time sediment in transport was able to be trapped in the sampler bag. At the end of the 30 minutes the sampler was removed and the
sample stored. Upon drying, the sample weight was converted to a standard unit of measure (kg/m/hr) by multiplying the sample weight by a factor of 0.0266. Results are provided in
Table 9.4C.

Final Environmental Implementation Report Mount Pleasant Sub-Area 51-1
September 2011
9-7
Table 9.4C Summary of Sediment Transport Sampling, Site SW4
Site Visit
Discharge (m3 sec-1)
Average
Velocity (m sec-1)
TSS (mg l-1)
Near Bed
Transport (kg m-1 hr-1)
1 0.484 0.61 1.4 0.152
2 0.629 0.67 16.1 0.109
3 0.774 0.72 2.9 0.101
4 0.141 0.37 4.7 0.036
Results in Table 9.4C illustrate variability in catch for both TSS and bedload over the range of discharges and velocities which is not necessarily consistent with what might be expected (higher
discharge and velocity = larger sample result = more sediment transport). The inconsistency can be interpreted as being a result of prior sediment flushing of the section and upstream (or the
lack thereof). That being said, results are indicating sediment transport rates that can be
considered low considering the potential for erosion and transport as set out in Table 9.4D.
Table 9.4D Summary of Erosion Potential, Section SW4
Flow
Depth
(m)
Discharge
(m3 sec-1)
Average
Velocity
(m sec-1
)
Critical
Velocity
(Vcrit)
Vavg/Vcrit Boundary
Shear
Stress
(τo)
Critical
(τcrit)
τo /τcrit
0.19 0.484 0.61 0.062 10.14 19.71 0.06 338.16
0.23 0.629 0.67 0.062 9.23 21.64 0.06 371.42
0.26 0.774 0.72 0.062 8.47 23.58 0.06 404.68
0.09 0.141 0.37 0.062 16.71 11.95 0.06 205.12
0.26 0.799 0.73 0.062 8.47 23.58 0.06 404.69
0.17 0.385 0.56 0.062 11.04 18.09 0.06 310.45
0.19 0.484 0.61 0.214 35.32 19.71 0.87 22.54
0.23 0.629 0.67 0.214 32.08 21.64 0.87 24.76
0.26 0.774 0.72 0.214 29.44 23.58 0.87 26.97
0.09 0.141 0.37 0.214 58.09 11.95 0.87 13.67
0.26 0.799 0.73 0.214 29.44 23.58 0.87 26.97
0.17 0.385 0.56 0.214 38.38 8.09 0.87 20.7
0.19 0.484 0.61 0.57 93.44 19.71 7.28 2.71
0.23 0.629 0.67 0.57 85.07 21.64 7.28 2.97
0.26 0.774 0.72 0.57 78.08 23.58 7.28 3.24
0.09 0.141 0.37 0.57 154.05 11.95 7.28 1.64
0.26 0.799 0.73 0.57 78.09 23.58 7.28 3.24
0.17 0.385 0.56 0.57 101.79 18.09 7.28 2.48
D50 SW4 Lower Bar Sample 10.0mm
SWS Results (Case 1 in Bold; Case 2 in italics )
D50 SW4 Bank Sample 0.08mm
SWS Results (Case 1 in Bold; Case 2 in italics )
D50 SW4 Upper Bar Sample 1.20mm
SWS Results (Case 1 in Bold; Case 2 in italics )

Final Environmental Implementation Report Mount Pleasant Sub-Area 51-1
September 2011
9-8
Table 9.4D illustrates the potential for erosion of the representative sediment samples collected
by the CVC as a function of the channel survey results. Values in Columns 5 and 8 in Table 9.4D are indicative of erosion and sedimentation potential for the grain size samples provided by the
CVC. Where critical velocity for entrainment is exceeded by average channel velocity, erosion of the material will occur: in column 5 above, a result of 100 equals the erosion threshold, values
below that number increase sedimentation potential and numbers above that value increase
erosion potential. A similar case is made using Column 8, the difference being a number in that column approaching 1.0 equates to the threshold for erosion; higher numbers indicate a lack of
stream energy for erosion and subsequently a degree of sedimentation which increases as that value in column 8 increases.
The table clearly indicates that as discharge, velocity and depth increase, the potential for
erosion and transport of the sediment samples increases as well for each of the grain size
samples. While the results for the Case 2 unit discharge (the CVC-provided number) shows a lower potential for erosion than the Case 1 scenario number, sedimentation potential utilizing the
Case 2 scenario remains high for all samples.
This theoretical treatment of the data is compared to the results in Table 9.4C to determine
whether the section is behaving as theoretical constructs would predict (Table 9.4D).
Results show that correlation between predicted and actual sediment transport is poor under the sampled conditions. As there was no sediment transport sampling completed in associated with
the HFSWS results for Case 1 and Case 2, the HFSWS results are unable to be used to refine the erosion threshold value for stormwater discharge.
9.4.1.4 Summary
Results from the four additional sampling events are not conclusive enough to fully refine the erosion threshold critical discharge. That said, the results from the additional samples are all
within the two Case scenarios presented in the HFSWS Phase 3 Report, as set out in Table 9.4E.
Table 9.4E Summary of Unit Discharge Rates, All Sample Events, Section
SW4
Site Visit
Discharge (m3 sec-1)
Unit Discharge (m3 sec-1 ha-1)
1 0.484 0.000315
2 0.629 0.000409
3 0.774 0.000501
4 0.141 0.000090
SWS Case 1 0.799 0.00052
SWS Case 2 0.385 0.00025

Final Environmental Implementation Report Mount Pleasant Sub-Area 51-1
September 2011
9-9
Unit discharge rates from the additional analysis range from a low of 0.000315 m3/sec/ha to a
high of 0.00050 cubic metres/second/ha. From the results in Table 9.4D, it can be concluded, in the absence of additional data, that the use of a unit discharge value of 0.000409 m3/sec/ha
represents the spread in the data appropriately enough to proceed with erosion control storage requirements at that rate.
Given concerns for erosion and sedimentation at the site and the absence of a wide range of data, the use of the unit discharge value of 0.000409 m3/sec/ha is recommended for SWM pond
design and should be reflected in the monitoring plan after implementation, with the intent that monitoring results be reviewed in light of the need for possible adjustments to stormwater pond
release rates in the future.
9.5 Quantity Control The HFSWS provides an assessment of the potential impacts of stormwater runoff within the
Huttonville and Fletcher’s Creeks subwatersheds associated with the proposed land use change. The HFSWS determined unit storage and release rates to control post development flows to pre-
development levels, assuming no LID measures were in place. Referring to Tables 2.3 and 2.4
from the HFSWS Phase 3 Report (June 2011), the quantity control criteria are:
East Huttonville Creek Flow Node HE at Bovaird Drive:
Flood Control: 25 Year 550 m3/imp ha
Flood Control: 100 Year 975 m3/imp ha Flood Control: Regional 841 m3/imp ha
Release Rate: 25 Year 0.0068 m3/s/ha Release Rate: 100 Year 0.025 m3/s/ha
Fletcher’s Creek Flow Node F1 at Creditview Road:
Flood Control: 25 Year 800 m3/imp ha Flood Control: 100 Year 1,055 m3/imp ha
Flood Control: Regional 1,965 m3/imp ha Release Rate: 25 Year 0.0072 m3/s/ha
Release Rate: 100 Year 0.025 m3/s/ha
These quantity control storage volumes include the extended detention/erosion storage volumes.
9.6 Pond Design Criteria
Through a co-operative informal consultation process with the City’s Works and Transportation Department, the City’s current SWM pond design criteria were reviewed. As a result of these
discussions, a number of revisions were suggested to the design criteria, the majority of which have been accepted by the City. Table 9.6A summarizes the City’s standards and the currently
accepted standards for Sub-Area 51-1. These revised design criteria have been utilized to design
each of the seven SWM ponds within Sub-Area 51-1. All facilities will be designed to meet the City’s standards and CVC design guidelines.

Final Environmental Implementation Report Mount Pleasant Sub-Area 51-1
September 2011
9-10
Table 9.6A SWM Pond Design Criteria*
SWM Pond Design
Criteria
SWM Design Standards
Rescue Shelf
Brampton’s Fire and Emergency Services Division will
require a 2.4m wide rescue shelf (with a cross slope of 2% into the pond) located at a minimum height of
0.3m above the high water level and around the periphery of the pond.
Vegetation
Management Zone (Mow Strip)
This zone, with a width of 2.4m (with a cross slope of
2% into the pond), will be required around the entire periphery of the pond. This could also function as
the rescue shelf.
Maintenance Access Road
A maintenance access road with a width of 4.0m
(with a cross slope of 2% into the pond) shall be provided on at least two sides of the pond (i.e. one
long side and one short side). The maintenance access road shall be configured such that two points
of entry are provided from a street. Secondary access points could also be made through open space
blocks that have street frontages. Access should be
provided to all inlets, outlets with 12:1 (horizontal: vertical) access to the bottom of the pond forebay
and main cell. The access road shall be situated in a manner that allows trucks to drive around the pond
without having to turn around. Where possible, the
maintenance access road may also be utilized as a rescue shelf.
Staging/Loading Area
A separate staging/loading area will be required for
both the pond forebay and the main cell. Minimum dimensions for the staging/loading areas should be
4.5 m x 5.5 m. These areas should be situated between the permanent pool and the maintenance
access road and should be placed adjacent to the
12:1 slope to the bottom of the pond.
Side Slopes
Side slopes of 3:1 (H:V) will only be allowed above
the rescue shelf.
Side slopes of 4:1 (H:V) will be provided in the following situations:
• Below the rescue shelf to the maintenance
access road; • Below the rescue shelf to 5-year predicted
water level; and
• Adjacent to ROWs.
All other criteria for side slopes shall remain the same.

Final Environmental Implementation Report Mount Pleasant Sub-Area 51-1
September 2011
9-11
Table 9.6A SWM Pond Design Criteria*
SWM Pond Design
Criteria
SWM Design Standards
Armor Stone Retaining
Walls
Retaining walls are not allowed in SWM blocks. Note that armour stone has been approved for use above the high water level in Pond F-1 by City staff.
By-Pass Storm Sewer By-pass pipes may be eliminated.
Trails
A continuous trail shall be constructed around the
pond and shall adhere to the following criteria:
• Minor trails shall be:
- 2.4m wide with a 0.5m buffer on either
side of the trail; - constructed of 5/8” clear stone; and
- located at a minimum height of 0.3 m above the 5-year predicted water level.
• Major trails (which form part of the City’s trail
system) shall be:
- 3.0m wide - constructed of asphalt;
- located at a minimum height of 0.3m above the regulatory storm event; and
- located one metre away from the pond
embankment. • The trail shall be located a minimum of three
metres away from the property line, where
the trails abut residential properties; and, • The maintenance access road and/or the
rescue shelf can facilitate the trail.
Every effort shall be made to locate paved trails away from the maintenance access road.
Other All other SWM pond standards shall remain the same.
By-pass pipe is no longer requirement.
*City of Brampton SWM Standards Subcommittee: Original Proposal June 10, 2010
Revision 1 December 13, 2010 Revision 2 December 16, 2010 Revision 3 January 4, 2011

Final Environmental Implementation Report Mount Pleasant Sub-Area 51-1
September 2011
9-12
9.7 Pond Stage-Storage-Discharge Characteristics Pond storage and discharge targets were established in the HFSWS Phase 3 Report (June 2011).
The HFSWS and Phase 3 SWS work included continuous hydrological modeling for existing and proposed conditions to establish the unit storage and flow rates per hectare. These targets are
required to maintain existing peak flows (2 year to 100 year), existing Regulatory storm peak
flows, and existing exceedences of erosion flows. In addition to developing design criteria for conventional SWM facilities, the HFSWS also simulated off-line, LID and SWM practices in the
form of lot-level storage.
Section 9.5 provides the unit volume and flow targets per hectare. The proposed SWM facilities
in the Study Area were designed based on the conventional volume and flow targets described in Section 9.5. The drainage areas to each facility and resulting pond block size are identified in
Table 9.7A.
Consistent with the HFSWS’ recommendations, Regional Storm flow control is not required for the proposed SWM facilities, with the exception of Ponds HE-6 and F-1, since online storage is
provided in the realigned East Huttonville Creek. Proposed SWM Pond HE-6 is located south of
the CNR where no channel modifications are recommended; hence, this off-line SWM pond must control Regional Storm flows to existing peak flows.
The permanent pool for each facility was sized according to Table 3.2 in the MOE’s Stormwater
Planning and Design Manual (2003). Based on the average imperviousness for each catchment
(65%), the required permanent pool volume is 170m3/ha (note that this volume/ha rate does not include the MOE extended detention volume of 40m3/ha, since the HFSWS extended detention
volume/ha rate is greater).
Table 9.7A SWM Facility Drainage and Pond Block Areas
Pond ID+
Contributing
Drainage Area (ha)*
Imperviousness
(%)
Pond Block Area
(ha)
HE-1 69.8 65% 3.23
HE-2 59.6 65% 3.51
HE-3 57.7 65% 2.84
HE-4 51.8 65% 2.42
HE-5 43.5 65% 1.79
F-1** 87.1 65% 3.73
* See Drawing 4.8.4 for drainage areas to each facility ** Regional storage criteria is 1,965 m3/imp ha. Pond Area currently shown in EIR is only for 100
year control; pond block area will be increased to provide required Regional Storm storage. + Ponds HE-1 to HE-5 do not require Regional Storm storage as this will be provided in the
realigned East Huttonville Creek.

Final Environmental Implementation Report Mount Pleasant Sub-Area 51-1
September 2011
9-13
Preliminary stage-storage-discharge curves, based on the grading and target volume and flow,
were developed for each facility (refer to Table 9.7B). Note that Facility HE-6 will be designed at the FSR phase when the land use plan, south of the CNR, becomes available. This facility will
provide Regional Storm flow control.

Final Environmental Implementation Report Mount Pleasant Sub-Area 51-1
September 2011
9-14
Table 9.7B SWM Facility Stage-Storage-Discharge Relationships
Pond F-1 87.1ha @ 65%IMP Pond HE-1 69.8ha @ 65%IMP
Required
Volume
Provided
Volume Stage Discharge
Required
Volume
Provided
Volume Stage Discharge
[m3] [m3] [m3] [m3/s] [m3] [m3] [m3] [m3/s]
PERM
POOL 14,807 22,558 246.6 -
PERM
POOL 11,866 23,113 252.6 -
EXT DET 14,154 21,848 247.6 0.046 EXT DET 9,074 20,697 253.6 0.036
25YR 45,292 42,558 248.1 0.63 25YR 24,954 29,932 254.1 0.47
100YR 62,277 63,897 248.6 2.18 100YR 44,236 45,087 254.6 1.75
Pond HE-2 59.6 @ 65%IMP Pond HE-3 57.7ha @ 65%IMP
Required
Volume
Provided
Volume Stage Discharge
Required
Volume
Provided
Volume Stage Discharge
[m3] [m3] [m3] [m3/s] [m3] [m3] [m3] [m3/s]
PERM
POOL 10,132 20,909 247.6 -
PERM
POOL 9,809 18,306 246 -
EXT DET 7,748 20,228 248.6 0.031 EXT DET 7,501 16,758 247 0.021
25YR 21,307 30,325 249.1 0.41 25YR 20,628 26,141 247.5 0.39
100YR 37,772 43,431 249.6 1.49 100YR 36,567 37,222 248 1.44
Pond HE-4 51.8 @ 65%IMP Pond HE-5 43.5ha @ 65%IMP
Required Volume
Provided Volume
Stage Discharge Required
Volume Provided Volume
Stage Discharge
[m3] [m3] [m3] [m3/s] [m3] [m3] [m3] [m3/s]
PERM POOL 8,806 13,104 241 -
PERM POOL 7,395 11,598 241 -
EXT DET 6,734 13,792 242 0.029 EXT DET 5,655 10,551 242 0.023
25YR 18,519 21,736 242.5 0.35 25YR 15,551 18,376 242.5 0.30
100YR 32,828 33,367 243 1.30 100YR 27,568 28,470 243 1.09

Final Environmental Implementation Report Mount Pleasant Sub-Area 51-1
September 2011
9-15
The stage data indicated in the preceding table (Table 9.7B) is subject to change based on the outlet structure design for each facility. However, the target storage and discharge will be
maintained, unless the proposed drainage areas are revised.
Note that due to grading requirements, the “provided” permanent pool volume is significantly
larger than the “required” permanent pool volume. The CVC staff suggested that consideration be given to designing these facilities as a hybrid wetland/wet pond by including a “shelf” to
reduce the excess permanent pool volume. The designs remain wet ponds since larger permanent pools reduce the frequency of maintenance (i.e. dredging) and reduce effluent TSS
concentrations. Wetland plantings within the facilities may impose additional maintenance requirements on the City and shallow wetland areas are prone to thermal impacts. Furthermore,
the HFSWS did not recommend the use of hybrid wet ponds/wetlands for the Study Area.
9.8 Inlet and Outlet Design As indicated in Table 9.7A, the majority of the pond drainage areas are large and therefore
several facilities have multiple inlets due to grading constraints, overall pond location, and an
effort to reduce storm sewer sizes. Typically, the larger drainage areas will require a box culvert inlet, while the small drainage areas may be serviced with a circular pipe between 750mm to
1800mm in diameter, where feasible.
The size of the inlet pipes will be minimized where possible; however, box culverts are preferred
as they can provide greater conveyance capacity with less pipe depth in locations where cover is limited. The inlets will generally convey minor system flows, while an overland spillway into the
facility will convey flows above the 10 yr return period into the facility. Several facilities, Pond F-1 in particular, are downstream of 100 yr capture areas and will therefore receive 100 yr flow via
inlet pipes. The pipe size will ultimately be determined via detailed storm sewer design
calculations (i.e., conveyance capacity based on Manning’s equation and Rational Method peak storm flows).
The inlet structure will be designed according to the City’s standards (OPSD 804.040) and will
discharge into a forebay. All forebays will be designed according to the settling and dispersion length equations provided in Section 4.6.2 of the MOE SWM Planning and Design Manual (2003).
Each facility will have multiple outlets including extended detention, flood flows, emergency spillway and a maintenance drawdown pipe or sump (where applicable).
The extended detention pipe will consist of a reverse-slope pipe extending from the bottom of
the permanent pool to an orifice plate on the control structure. The submerged end-of-pipe will
be fitted with a perforated pipe section of sufficient open area and will be protected with riprap. The orifice plate will be sized to meet the required extended detention flows and required
drawdown time under approximately 1m of head (i.e., extended detention level). The orifice plate will be bolted onto the outlet structure with the invert set at the permanent pool level. To
prevent potential blockage by debris, etc., a minimum orifice size of 75mm to 100mm is desirable. Preliminary orifice dimensions for each facility are indicated in Table 9.8A.

Final Environmental Implementation Report Mount Pleasant Sub-Area 51-1
September 2011
9-16
Table 9.8A Preliminary Extended Detention Orifice Dimensions Extended
Detention
Facility EXT DET Flow
EXT DET WL Preliminary Orifice
Diameter
[m3/s] [m] [mm]
Pond F-1 0.04650 247.6 131
Pond HE-1 0.03555 253.6 134
Pond HE-2 0.03195 248.6 124
Pond HE-3 0.02065 247.0 122
Pond HE-4 0.02900 242.0 115
Pond HE-5 0.02345 242.0 106
A series of orifices or a compound weir knock-out will be designed for the outlet control structure to achieve the 25 year and 100 year target flows, as established in the HFSWS and noted in
Table 9.7B.
Since the majority of the SWM facilities are situated adjacent to the proposed channel, an
emergency spillway, located above the 100 year water level, will be provided to manage overflows in the event that all outlet structures are blocked. The spillway will be suitably
protected with riprap, where required, and will be integrated into the NHS design. Pond F-1 is
not located adjacent to a watercourse; therefore the top of the outlet control structure will be fitted with an emergency overflow grate, suitably sized to pass the greater of the Regional Storm
or 100 year flow in the event of blockage of the primary outlets. A 1500mm storm sewer stub on Tawnberry Circle, south-east of Pond F-1 was provided as part of the Thornbush Developments
Subdivision and will serve as the outlet for the entire range of flows (extended detention to
Regional). According to the design sheet prepared by RAND Engineering Corporation (refer to Appendix G-1), the design of the stub has accounted for an external area (i.e., part of the Sub-
Area 51-1 lands within the Fletcher’s Creek subwatershed) with a 100-year peak flow of 3.122m3/s. According to Table 9.7B, the peak 100-year flow from Pond F-1 will be 2.18m3/s,
therefore sufficient capacity is available in the receiving storm sewer system.
The location of Pond HE-4, presented in the HFSWS, has been moved westerly to address noise
mitigation from the CNR and land use issues in this location that is constrained by the CNR, Mississauga Road overpass and the channel location. Since it is not located adjacent to a
watercourse, the emergency spillway and outlet pipe for this facility will be provided via an easement parallel to the CNR tracks. The proposed outfall pipe for SWM Pond HE-4 does not
encroach on the CNR property. This pipe is sized for the 100 yr controlled flow. The pipe is
within an easement which also serves as the emergency spillway (overland) in the event that that outlet pipe is blocked. The capacity of the easement is sufficient to prevent impact to
neighbouring properties.
The conveyance of Regional Storm peak flows, through the SWM ponds, will be accommodated in the overflow spillway and these details will be provided at the detailed design stage for each
SWM facility.
Final Environmental Implementation Report Mount Pleasant Sub-Area 51-1
September 2011
9-17
If the grading and pond design permit, a maintenance sump or drawdown pipe will be provided
to drain the facility for maintenance works. This structure will also connect to the outlet structure.
The outlet pipe from the control structure into the channel will be directed to an outlet headwall
as per the City’s standard Drawing STD.332. A cooling trench will be provided, as discussed in
Section 9.9. All outlets into the watercourse will be angled at 45 degrees to reduce erosion impacts. The SWM facility outlet headwalls are typically situated below the 25 yr water level in
the receiving watercourse. The detailed outlet structure design will account for the tailwater influence of the channel.
Where grading permits, the foundation drain or roof drain collector system outlets will be
integrated with the SWM facility outlet as per the CVC recommendations.
9.9 Thermal Mitigation The East Huttonville Creek, upstream of the CNR, drains into regulated Redside Dace habitat
south of the CNR tracks. The HFSWS has identified that Redside Dace are associated with cool
water systems. The HFSWS and CFCP identify the requirement for incorporation of thermal mitigation measures in SWM pond design since discharge from SWM facilities have the potential
to increase stream temperatures. As a result, a number of mitigation measures are proposed, including mitigation measures that research suggests will have an impact on reduction of water
temperature (where feasible). Of specific interest is the CVC study “Thermal Impacts of Urbanization including Preventative and Mitigation Techniques” (draft, December 2010), which indicated that an east-west pond orientation can reduce the hours of potential solar radiation,
although a north-south orientation is preferable for narrow SWM facilities. Similarly, orienting the long side of the facility perpendicular to the prevailing wind direction (west) can assist in
reducing thermal impacts. It is recommended that post development performance monitoring be
carried out to assess the impact of the various thermal mitigation measures.
The Draft CVC Thermal Impacts report identified five “zones” where thermal mitigation measures can be implemented. These include:
• Zone 1 – Up-gradient (i.e., pond catchment area);
• Zone 2 – SWM facility inlet;
• Zone 3 – SWM facility;
• Zone 4 – SWM facility outlet; and,
• Zone 5 – Riparian corridor.
The HFSWS Phase 3 Report recommended a list of potential thermal mitigation measures that
have been reviewed and considered for use in Sub-Area 51-1 SWM ponds. Table 9.9A indicates the thermal mitigation measures reviewed and those recommended for implementation in each
SWM Pond. If a measure is not applicable, rationale for this recommendation is provided. The selected mitigation measures are also identified on SWM Pond Drawings 9.2.1 to 9.2.6.
There has been considerable discussion regarding the need for and optional thermal mitigative measures. MNR has requested that cooling trenches and/or deeper permanent pools be provided
for every facility. The requirement for deeper permanent pools (average depth of 3m) is currently being discussed with the City since this currently is not consistent with their design
standards. With respect to cooling trenches, the CVC and MNR require that they be located outside the meander belt. Drawings 9.2.1 to 9.2.6 presents simplified details for cooling
trenches options. Preliminary alternatives for design of the pond outlet and outfall structures to
provide thermal mitigation shown in Figures 9.91 to 9.9.4 include:

Final Environmental Implementation Report Mount Pleasant Sub-Area 51-1
September 2011
9-18
• Alternative 1 includes the use of deep outlet pool, reverse-slope extended detention pipe, sub-surface outlet pipe, and a cooling trench situated along the toe of the channel slope, outside of the meander belt. This outfall configuration also includes a naturalized swale
to convey flows greater than the extended detention release rate (i.e. 2-year and up). Refer to Figure 9.9.1 for a typical plan view and Figure 9.9.2 for typical sections and
details.
• Alternative 2 is similar to Alternative 1 in that it includes a deep outlet pool, reverse-slope pipe, and sub-surface outlet pipe. In place of a cooling trench along the toe of slope,
this alternative proposes a cooling gallery situated immediately at the pond outfall in a plunge-pool configuration. This mitigation measure would also be situated outside of the
meander belt. Refer to Figure 9.9.3 for a typical plan view and Figure 9.9.3 for typical sections and details.
The preferred thermal mitigation strategy will be further refined during the detailed natural channel / NHS design and detailed SWM facility design stage. Planting/landscaping details for
the various pond zones are discussed in Section 9.10 and will be addressed in detail at the detailed design stage.

Final Environmental Implementation Report Mount Pleasant Sub-Area 51-1
September 2011
9-19
Table 9.9A Thermal Mitigation Measures
SWM Facility Zone HE-1 HE-2 HE-3 HE-4 HE-5 HE-6 F-1
Energy transfer between warm storm runoff and cool sub-surface storm sewers Zone 1 � � � � � � �
LID measures Zone 1 � � � � � � �
Roof colour Zone 1 TBD TBD TBD TBD TBD TBD TBD
Downspout disconnection Zone 1 � � � � � � �
Up-gradient plantings Zone 1
Buried inlet pipe Zone 2 � � � � � � �
Inlet cooling trench Zone 2 X3 X3 X3 X3 X3 X3 X3
Inlet plantings Zone 2
Shading of open water areas by maximizing
canopy Zone 3 � � � � � � �
Artificial shade systems Zone 3 X3 X3 X3 X3 X3 X3 X3
Floating island Zone 3 X1 X1 X1 X1 X1 X1 X1
Reduce open water area Zone 3 � � � � � � �
Increased L:W ratio Zone 3 X3 X3 � � X3 X3 �
Pond orientation to reduce solar inputs Zone 3 � � X2 X2 X2 X2 �
Pond orientation to increase exposure to
prevailing wind Zone 3 X2 � X2 � X2 � �
Landscaped jetties for shading Zone 3 X3 X3 X3 X3 X3 X3 X3
Sub-surface SWM ponds Zone 3 X4 X4 X4 X4 X4 X4 X4
Outlet sub-surface cooling trench and shading Zone 4 � � � � � � X3
Concrete outlet pipe Zone 4 � � � � � � �
Introduce cool water at SWM pond outlets such as foundation drain collectors (FDC),
where feasible and/or a Thermal Siphon Zone 4 � � � � � � �
Reversed slope submerged pond outlet and extra permanent pool depth at outlet Zone 4 � � � � � � �
Distributed outlets along the NHS to take advantage of the NHS shading Zone 4 � � � � � � �
Night time release Zone 4 X5 X5 X5 X5 X5 X5 X5
Watercourse shading Zone 5 � � � � � � �

Final Environmental Implementation Report Mount Pleasant Sub-Area 51-1
September 2011
9-20
Notes to Table 9.9A:
1. The CVC is proposing a floating island in Pond 10 in Fletcher’s Meadow and the monitoring/maintenance results of that pilot project will help determine its effectiveness.
Therefore, the use of floating islands is pending upon the study findings, the City’s recommendations and general design feasibility.
2. The orientation of this pond is required in an east to west configuration. 3. Not recommended due to grading, capacity, or maintenance constraints.
4. Sub-surface storage is typically not suitable for large drainage areas since costs become prohibitive. There may be application of sub-surface storage in commercial areas.
5. Night-time release requires complex control systems that would have to be maintained by the City. These measures are therefore not recommended at this time.
6. TBD – for further consideration; to be determined at functional servicing/detailed design phase.
The following sections describe the rationale behind the thermal mitigation measures proposed
for several of the facilities:
Pond F-1 (refer to Drawing 9.2.1) – Due to the grading constraints surrounding this facility (Creditview Road, future Wanless Road, and the cemetery) as well as the location of the outlet
pipe on Tawnberry Circle, Pond F-1 must have a north-south orientation. This orientation results in a high length to width ratio. Since the facility drains into a municipal storm sewer,
opportunities for cooling trenches are limited. However, due to the relatively narrow width of the
facility, there may be more opportunities for shading along the banks.
Pond HE-1 (refer to Drawing 9.2.2) – This facility has a east-west oriented forebay as well as a north-south oriented forebay, with the wet cell having no particular orientation (i.e., square
shape). Since this facility is adjacent to the NHS corridor and proposed Wanless Road, there are
opportunities for shading/plantings along the entire perimeter of the facility. Furthermore, a cooling trench can be provided at the pond outfall.
Pond HE-2 (refer to Drawing 9.2.3) – Pond HE-2 is oriented north-south along the NHS
corridor. This facility has an east-west oriented forebay as well as a north-south oriented forebay. This facility is bounded by the Sandalwood Woodland, Buick Boulevard and the NHS;
therefore there are opportunities for shading. A cooling trench is proposed at the outlet.
Pond HE-3 (refer to Drawing 9.2.4) – The opportunity to orient this pond in a north-south
orientation, parallel to the NHS has been reviewed. This pond must be in an east-west orientation to provide a gravity storm outlet for the existing low point at Creditview Road and
Sandalwood Parkway. The pond inlet must be as far east as possible to allow for the low area to
gravity drain. A north-south orientation would push the pond inlet further west and it would not be possible to gravity drain the roads.
Pond HE-4 (refer to Drawing 9.2.5) – The rationale for a north-south orientation for this pond
is to provide a physical separation between the proposed Mississauga Road overpass and residential development. The north-south configuration can take advantage of the shade
opportunity from the Mississauga Road overpass on the CNR. The proposed facility outfall is
through a long easement prior to discharge into the channel and includes a cooling trench at the outlet into the channel. At this location, two ponds presented in the HFSWS (located in sub-
catchments 746 and 731) have been consolidated into one allowing the potential open water area to be reduced.
Pond HE-5 (refer to Drawing 9.2.6) – From a land use planning perspective, the southern limit of this pond is fixed by the school block and the location of the Spine Road is virtually set
through the ongoing Environmental Assessment. This creates a land use structure that the pond orientation must work within. The pond location was selected based on the most efficient
Final Environmental Implementation Report Mount Pleasant Sub-Area 51-1
September 2011
9-21
location for gravity drainage. This resulted in an orientation immediately adjacent to the school
block. The east-west configuration provides the opportunity for only one sediment forebay versus a north-south orientation that would require an additional inlet/sediment forebay at the
south end of the pond (as it would be impossible to drain the portion of the Phase 3 Mount Pleasant Village to the northern inlet).
Future Pond HE-6 (South of the CNR) - This SWM pond will service the future district retail area south of the CNR. These lands will have higher densities and higher impervious areas. The
ultimate orientation and location of the SWM pond will be determined through the land use planning exercise for these lands.
9.10 Pond Restoration
The primary functions of the SWM ponds are water quality control, erosion and flood control, with a secondary function as a wetland habitat for plants and wildlife. Creation of wetland
vegetation will provide supportive habitat for wetland wildlife and plants. The SWM ponds will create a place where waterfowl can gather and rest and tolerant species, such as Canada Goose
and Mallard, can potentially nest and rear young. The pond features will also be attractive to
Wood Ducks, which could nest in forest tree cavities, just to the north. The ponds will also become attractive to more common amphibian species, which in turn, would provide an
additional feeding site for Great Blue and Green Heron, as well as mammals, such as Mink and Northern Raccoon.
The choice of plant species for use in SWM facilities is consistent with the CVC’s Stormwater Management Facility Planting Guidelines (2003) and CVC’s Study Report: Thermal Impacts of
Urbanization including Preventative and Mitigation Techniques (Jan. 2011). Target vegetation types for pond restoration include:
• Submerged planting zone: various species of native pondweeds (Potamogeton natans,
pectinatus, zosteriformis), loose-flowered water milfoil (Myriophyllum alternifolium), water lilies (bullhead pond-lily Nuphar variegata, fragrant white water lily Nymphaea
odorata).
• Aquatic fringe zone: cattail (narrow-leaved Typha angustifolia and wide-leaved cattail T.
latifolia), giant bur-reed (Sparganium eurycarpum), bulrushes (dark-green bulrush Scirpus atrovirens, river bulrush S. fluviatilis, soft-stem bulrush S. validus).
• Shoreline (floodfringe) zone: stick-tight (Bidens cernua), native sedges (e.g. Bebb's
sedge carex babbiana), rice cut grass (Leersia oryzoides), dogwoods (red-osier Cornus stolonifera, silky dogwood C. amomum), speckled alder (Alnus rugosa), ninebark
(Physocarpus opulifolius), various native shrub willows, e.g. slender willow Salix petiolaris, shining willow S. lucida, Bebb's willow S. bebbiana), balsam poplar (Populus
balsamifera), cottonwood (Populus deltoides), silver maple (Acer saccharinum).
The purpose of inlet and outlet plantings will be two-fold: (1) to provide shading of incoming and
outgoing water; and, (2) to help prevent substrate erosion. Numerous trees and shrubs can be utilized for these areas including, for example, cottonwood, trembling aspen, balsam poplar, red
maple, silver maple, speckled alder, red-osier and grey dogwood, nannyberry, and numerous native species of willow.
Planting recommendations for Zone 1, upland areas, will be prepared at detailed design.

Final Environmental Implementation Report Mount Pleasant Sub-Area 51-1
September 2011
9-22
Timing of SWM pond restoration is dependent upon timing of assumption. Terrestrial species
that are dependent on the permanent pool elevation will not be installed until it is confirmed that the SWM facility functionally maintains the permanent pool elevations. Further, no planting of
any proposed aquatic species in the sediment forebay and/or areas of the permanent pool will be undertaken until after initial cleaning and subsequent assumption.
9.11 Low Impact Development Criteria
The HFSWS LID modeling scenario simulates storage units which have an infiltration, sub-drain and overflow components. Based on hydrologic model results obtained in the Phase 3 HFSWS,
the design criteria for LID measures have been assessed and are sufficient to maintain the
groundwater recharge and overall water balance at existing levels. The HFSWS established a capture rate depth (mm) target rather than individual LID measures to be implemented to allow
for flexibility in the Block 51-1 design. The LID elements in the model were simulated as lumped infiltration facilities. It was assumed that roofs and lawns are directed to the infiltration LID,
while driveways and ROWs were not.
While the contributing drainage areas to the LIDs are proposed to be entirely located within the
residential lots and do not include the ROWs, the capture rates are expressed in mm per hectare of land use (residential area). These depths are applied to the entire catchment area
(development area) to account for the ROWs while the LID storage will be provided on the pervious lot area.
The following consideration was made:
• Discharge rates calculated, based upon infiltration rates of native soils, are set in the
range of 0.38 mm/hr to 4.5 mm/hr with a 72 hour drawdown time as per CVC criteria and porosity of 0.3 for infiltration matrix.
The HFSWS LID modeling results are identified in Table 2.2 in the HFSWS Phase 3 (June 2011) report and are summarized in Table 9.11A below; they indicate the LID capture rates (depth in
mm) applied for various land uses.

Final Environmental Implementation Report Mount Pleasant Sub-Area 51-1
September 2011
9-23
Table 9.11A
LID Capture Rates by Land Use
Land Use Capture Rate
(mm) Commercial Big Box 1.73
Strip Commercial 1.73
Small Institutional 0.64
Industrial Big Box 1.73
Prestige Industrial 1.73
Low Density Residential 1.04
Medium Density Residential 0.96
Note: Includes both Pervious and Impervious Areas.
The following sections describe the lot-level LID measures (i.e., additional topsoil depths) which directly relates to the unitary storage and discharge rates established by the HFSWS, as well as
the potential NHS LID measures which were not modeled as part of the HFSWS.
9.11.1 Additional Topsoil Depth To facilitate the application of LID measures, the results of the HFSWS were examined on a unit
hectare basis. The HFSWS modelling included a continuous water balance simulation to estimate the size and impacts of LID storage. Results indicated that partial reduction in stormwater
quality and erosion control required storage volumes can be achieved and end-of-pipe SWM
facility required runoff control storage volumes can be reduced. At this time, the City has not accepted reduced storage volumes for SWM pond sizing, resulting from the use of LID measures;
therefore all ponds are sized utilizing the conventional unit volume and flow rates. It is proposed that increased topsoil depth, applied in specific locations, can provide the LID storage.
Figure 9.11.1 illustrates the topsoil LID concept. While no direct SWM facility size reduction
benefits can be realized, LID will nonetheless improve water quality (thermal mitigation), encourage recharge and reduce runoff volumes. This LID measure is considered non-structural
as it does not require maintenance.
The HFSWS provided specific sizing criteria based on continuous simulation of LID storage on a
typical unit area (1.0 ha or 10,000m2). These LID storage criteria for a unit area can be applied to similar residential areas within Sub-Area 51-1 without the need for additional modelling during
detailed design. The following Table 9.11B summarizes the criteria (volume) established by HFSWS for LID storage sizing.
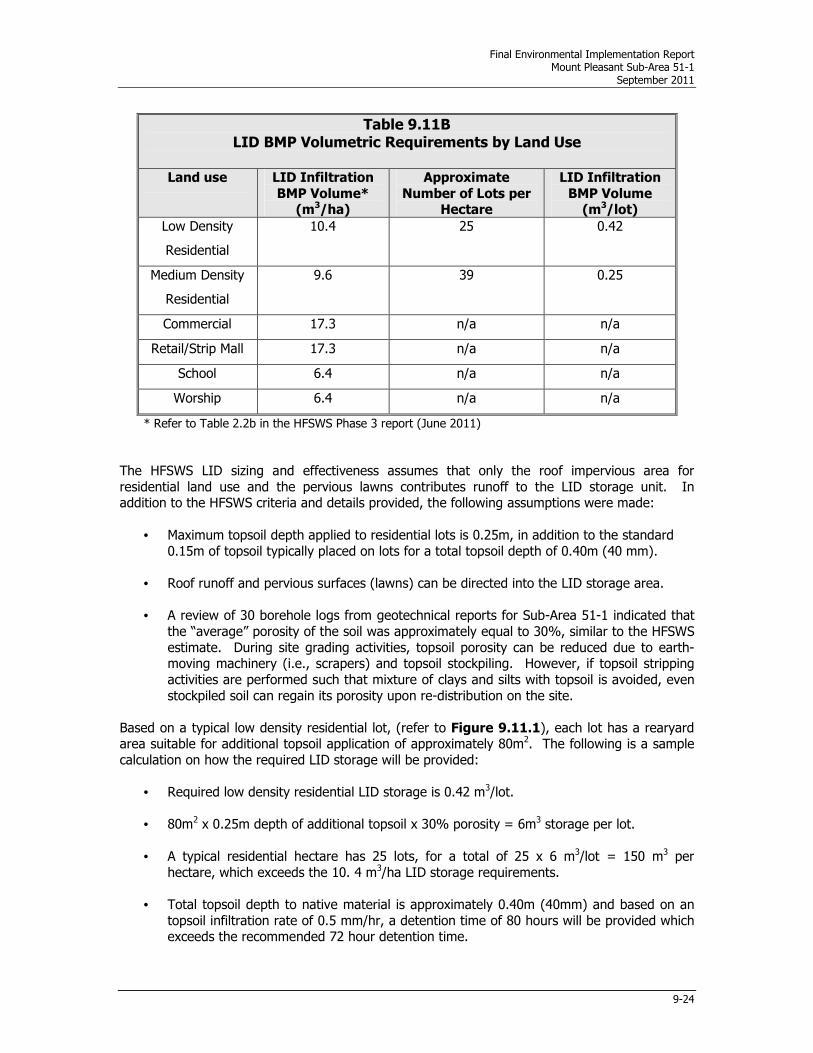
Final Environmental Implementation Report Mount Pleasant Sub-Area 51-1
September 2011
9-24
Table 9.11B LID BMP Volumetric Requirements by Land Use
Land use LID Infiltration
BMP Volume* (m3/ha)
Approximate
Number of Lots per Hectare
LID Infiltration
BMP Volume (m3/lot)
Low Density
Residential
10.4 25 0.42
Medium Density
Residential
9.6 39 0.25
Commercial 17.3 n/a n/a
Retail/Strip Mall 17.3 n/a n/a
School 6.4 n/a n/a
Worship 6.4 n/a n/a
* Refer to Table 2.2b in the HFSWS Phase 3 report (June 2011)
The HFSWS LID sizing and effectiveness assumes that only the roof impervious area for
residential land use and the pervious lawns contributes runoff to the LID storage unit. In addition to the HFSWS criteria and details provided, the following assumptions were made:
• Maximum topsoil depth applied to residential lots is 0.25m, in addition to the standard
0.15m of topsoil typically placed on lots for a total topsoil depth of 0.40m (40 mm).
• Roof runoff and pervious surfaces (lawns) can be directed into the LID storage area.
• A review of 30 borehole logs from geotechnical reports for Sub-Area 51-1 indicated that
the “average” porosity of the soil was approximately equal to 30%, similar to the HFSWS
estimate. During site grading activities, topsoil porosity can be reduced due to earth-moving machinery (i.e., scrapers) and topsoil stockpiling. However, if topsoil stripping
activities are performed such that mixture of clays and silts with topsoil is avoided, even
stockpiled soil can regain its porosity upon re-distribution on the site.
Based on a typical low density residential lot, (refer to Figure 9.11.1), each lot has a rearyard area suitable for additional topsoil application of approximately 80m2. The following is a sample
calculation on how the required LID storage will be provided:
• Required low density residential LID storage is 0.42 m3/lot.
• 80m2 x 0.25m depth of additional topsoil x 30% porosity = 6m3 storage per lot.
• A typical residential hectare has 25 lots, for a total of 25 x 6 m3/lot = 150 m3 per
hectare, which exceeds the 10. 4 m3/ha LID storage requirements.
• Total topsoil depth to native material is approximately 0.40m (40mm) and based on an
topsoil infiltration rate of 0.5 mm/hr, a detention time of 80 hours will be provided which exceeds the recommended 72 hour detention time.
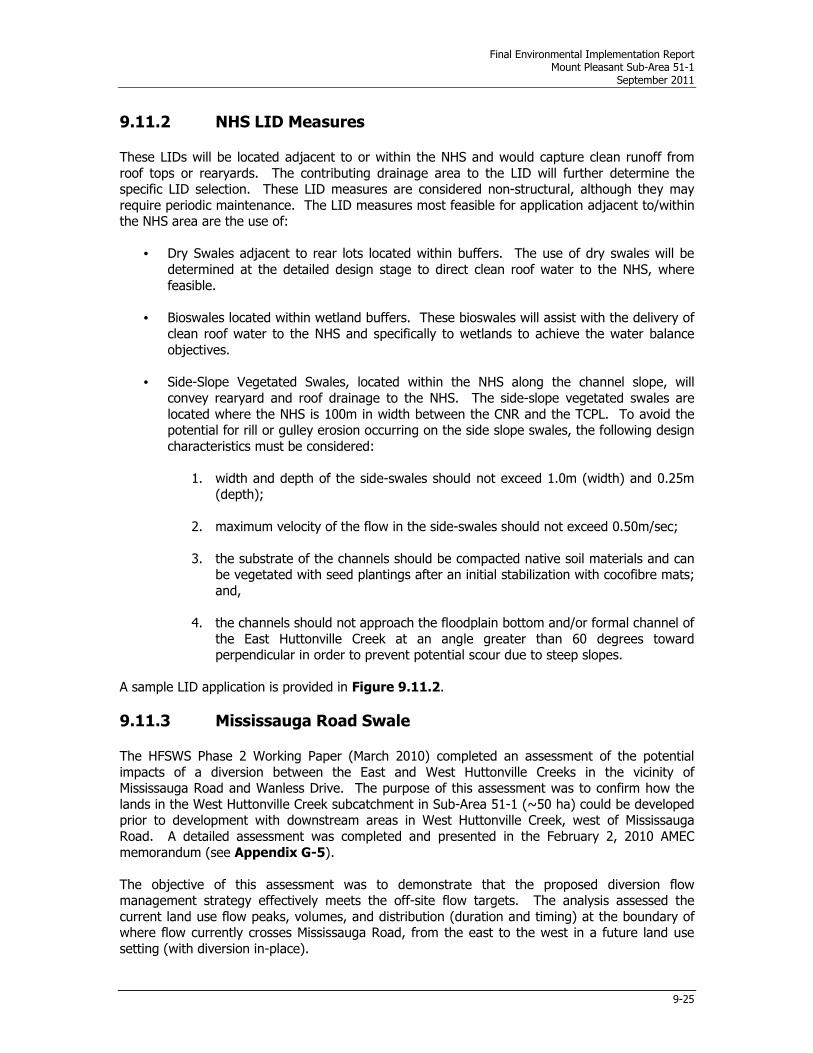
Final Environmental Implementation Report Mount Pleasant Sub-Area 51-1
September 2011
9-25
9.11.2 NHS LID Measures
These LIDs will be located adjacent to or within the NHS and would capture clean runoff from
roof tops or rearyards. The contributing drainage area to the LID will further determine the specific LID selection. These LID measures are considered non-structural, although they may
require periodic maintenance. The LID measures most feasible for application adjacent to/within the NHS area are the use of:
• Dry Swales adjacent to rear lots located within buffers. The use of dry swales will be
determined at the detailed design stage to direct clean roof water to the NHS, where
feasible.
• Bioswales located within wetland buffers. These bioswales will assist with the delivery of
clean roof water to the NHS and specifically to wetlands to achieve the water balance
objectives.
• Side-Slope Vegetated Swales, located within the NHS along the channel slope, will
convey rearyard and roof drainage to the NHS. The side-slope vegetated swales are
located where the NHS is 100m in width between the CNR and the TCPL. To avoid the potential for rill or gulley erosion occurring on the side slope swales, the following design
characteristics must be considered:
1. width and depth of the side-swales should not exceed 1.0m (width) and 0.25m (depth);
2. maximum velocity of the flow in the side-swales should not exceed 0.50m/sec;
3. the substrate of the channels should be compacted native soil materials and can be vegetated with seed plantings after an initial stabilization with cocofibre mats;
and,
4. the channels should not approach the floodplain bottom and/or formal channel of
the East Huttonville Creek at an angle greater than 60 degrees toward perpendicular in order to prevent potential scour due to steep slopes.
A sample LID application is provided in Figure 9.11.2.
9.11.3 Mississauga Road Swale
The HFSWS Phase 2 Working Paper (March 2010) completed an assessment of the potential
impacts of a diversion between the East and West Huttonville Creeks in the vicinity of Mississauga Road and Wanless Drive. The purpose of this assessment was to confirm how the
lands in the West Huttonville Creek subcatchment in Sub-Area 51-1 (~50 ha) could be developed prior to development with downstream areas in West Huttonville Creek, west of Mississauga
Road. A detailed assessment was completed and presented in the February 2, 2010 AMEC
memorandum (see Appendix G-5).
The objective of this assessment was to demonstrate that the proposed diversion flow management strategy effectively meets the off-site flow targets. The analysis assessed the
current land use flow peaks, volumes, and distribution (duration and timing) at the boundary of where flow currently crosses Mississauga Road, from the east to the west in a future land use
setting (with diversion in-place).

Final Environmental Implementation Report Mount Pleasant Sub-Area 51-1
September 2011
9-26
The AMEC memorandum concluded that:
“The analyses and assessments of the proposed Huttonville Creek Inter-catchment Diversion between the East and West Huttonville Creek headwaters has been demonstrated to change only nominally in terms of runoff volume, peak flows, and flow distribution. The net impacts to the natural systems resulting from this change have been concluded to be minor with no negative impacts anticipated”. This conclusion was accepted by the City and the CVC.
The impact assessment considered the following storm drainage features which would contribute
drainage to the West Huttonville Creek and the remaining area would direct drainage to the East
Huttonville Creek:
• rooftop runoff collector drain (RDC) for designated roofs (residential) to collect 7mm of
runoff;
• onsite SWM for commercial areas;
• parks and schools; and,
• linear SWM system, at diversion area outlets along the east side of Mississauga Road, to
attenuate flow delivery downstream and also provide requisite stormwater quantity
control.
Drawing 2.5.1 illustrates the location of the pre-development drainage boundary between the East and West Huttonville Creek subwatersheds and Drawing 11.3.2 provides the approximate
location of the equivalent roof top, commercial and school areas that will convey drainage
westerly to the two existing culverts under Mississauga Road, described as outlets A and B.
The positive outcome of the February 2, 2010 impact assessment determined that the West Huttonville Creek lands, within Sub Area 51-1, could develop in conjunction with the East
Huttonville and Fletcher’s Creek lands.
In order to maintain the target flows and volumes to the West Huttonville Creek system, target
storage volumes and flows were determined as set out in Table 9.11C from the HFSWS assessment. These target storage volumes and release rates will be provided through a linear
swale along the east limit of the Mississauga Road ROW.

Final Environmental Implementation Report Mount Pleasant Sub-Area 51-1
September 2011
9-27
Table 9.11C Required Storage Volumes & Release Rates at Outlets A & B
Storage Discharge Relationship For Dry Facilities within
the Huttonville Creek Diversion Area
Storage (m3) Discharge (m3/s)
Outlet A
0 0
660 0.12
850 0.20
900 0.40
9101. 10.0
Outlet B
0 0
1600 0.15
1750 0.20
2000 0.40
20101. 10.0
Note: 1 Ordinate on rating curve represents emergency overflow component of facility, above 100 year storage capacity (as per correspondence on August 4th from Aaron Farrell,
AMEC to David Leighton, Urbantech)
Swale and Drainage System Design
In order to maintain the target flows and volumes to the West Huttonville Creek system, target storage volumes and flows were determined in the HFSWS assessment. The required storage
and conveyance will be provided with a linear swale along the eastern limit of the Mississauga Road ROW. This LID measure can be considered non-structural, although it may require periodic
maintenance.
The swale will be fed by a roof drain collector (RDC) system. The RDC is a third pipe located
within private property on the east side of the Mississauga Road ROW. It will collect and convey clean roof drainage into the proposed swale to maintain flows to the natural features west of
Mississauga Road (within the West Huttonville Creek subcatchment).
A dedicated, City-owned block will be provided for the proposed swale and will be within the
private development on the east side of the ultimate Mississauga ROW. The block will incorporate a landscaped noise berm area which will be maintained by the City.
The swale block width will vary depending on the land use of the adjacent development and will
be designated as a “City Storm Drainage” block. As indicated in Drawings 9.9.3.1 and 9.9.3.2,
the swale preliminary block widths along Mississauga Road are as follows:
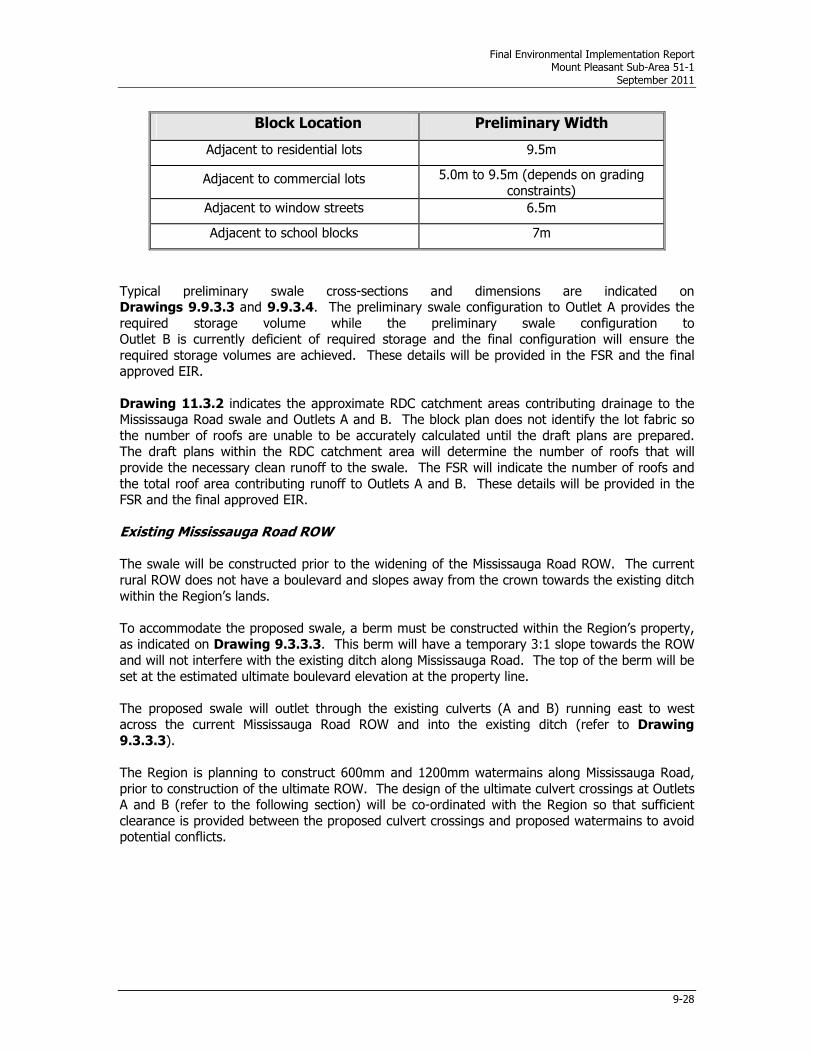
Final Environmental Implementation Report Mount Pleasant Sub-Area 51-1
September 2011
9-28
Block Location Preliminary Width
Adjacent to residential lots 9.5m
Adjacent to commercial lots 5.0m to 9.5m (depends on grading
constraints)
Adjacent to window streets 6.5m
Adjacent to school blocks 7m
Typical preliminary swale cross-sections and dimensions are indicated on Drawings 9.9.3.3 and 9.9.3.4. The preliminary swale configuration to Outlet A provides the
required storage volume while the preliminary swale configuration to Outlet B is currently deficient of required storage and the final configuration will ensure the
required storage volumes are achieved. These details will be provided in the FSR and the final approved EIR.
Drawing 11.3.2 indicates the approximate RDC catchment areas contributing drainage to the Mississauga Road swale and Outlets A and B. The block plan does not identify the lot fabric so
the number of roofs are unable to be accurately calculated until the draft plans are prepared. The draft plans within the RDC catchment area will determine the number of roofs that will
provide the necessary clean runoff to the swale. The FSR will indicate the number of roofs and
the total roof area contributing runoff to Outlets A and B. These details will be provided in the FSR and the final approved EIR.
Existing Mississauga Road ROW The swale will be constructed prior to the widening of the Mississauga Road ROW. The current
rural ROW does not have a boulevard and slopes away from the crown towards the existing ditch
within the Region’s lands.
To accommodate the proposed swale, a berm must be constructed within the Region’s property, as indicated on Drawing 9.3.3.3. This berm will have a temporary 3:1 slope towards the ROW
and will not interfere with the existing ditch along Mississauga Road. The top of the berm will be
set at the estimated ultimate boulevard elevation at the property line.
The proposed swale will outlet through the existing culverts (A and B) running east to west across the current Mississauga Road ROW and into the existing ditch (refer to Drawing
9.3.3.3).
The Region is planning to construct 600mm and 1200mm watermains along Mississauga Road,
prior to construction of the ultimate ROW. The design of the ultimate culvert crossings at Outlets A and B (refer to the following section) will be co-ordinated with the Region so that sufficient
clearance is provided between the proposed culvert crossings and proposed watermains to avoid potential conflicts.

Final Environmental Implementation Report Mount Pleasant Sub-Area 51-1
September 2011
9-29
Ultimate Mississauga Road ROW Under ultimate conditions, the proposed swale will be maintained as in existing conditions. The
Mississauga Road ROW will be widened to 50.5m and the existing ditches and rural cross-section will be replaced with an urbanized ROW section with a boulevard, which will tie in to the top of
the aforementioned berm (refer to Drawing 9.3.3.4).
The culverts, (outlets A and B) crossing Mississauga Road, will be replaced with smaller, twin
pipes to achieve suitable cover. The ultimate pipe crossings will be extended so that the connection between the proposed swale can be built across the wider, ultimate ROW to the
outfall west of Mississauga Road (see Drawing 9.3.3.4). A manhole will be provided within the ultimate ROW boulevard.
The swale, RDC system and minor drainage system, within the proposed development, will be inter-connected. The RDC pipe will overflow into an internal storm sewer. In the event that the
capacity of the swale is exceeded, the swale/RDC pipes will back-up into the minor storm drainage system and discharge to the SWM Pond HE-1, north of Wanless Drive. This will prevent
the swale from overtopping and spilling onto the Mississauga Road ROW.
The proposed swale design has been reviewed and accepted by the City and Region through the
block plan approval process.

Final Environmental Implementation Report Mount Pleasant Sub-Area 51-1
September 2011
10-1
10.0 ROAD/CNR CROSSINGS OF THE NATURAL HERITAGE SYSTEM
As outlined in Section 3.0 and presented on the MPSP and Implementation Principles, there are
three existing road crossings of the NHS (Mayfield Road, Wanless Drive, Bovaird Drive), four new
road crossings of the NHS (two Spine Roads, Sandalwood Parkway and Buick Boulevard) and one existing CNR crossing of the NHS. The existing roads are City and Regional roads and proposed
improvements to these roads are or will be addressed through Environmental Assessments to be completed by the City or the Region. This Section addresses future road crossing locations and
provides design guidance for these new road crossings of the NHS as well as improvements to
the CNR crossing.
10.1 HFSWS Recommendations for Road Crossings The HFSWS Phase 3 Report (June 2011) identified that road crossings were conceptual and
subject to preliminary design as part of the EIR preparation. It notes that road crossing design for corridors encompasses a range of considerations such as human and wildlife safety, aquatic
biology, stream morphology, hydrology, hydraulics and terrestrial matters. It further
recommends that:
• Culverts will be utilized based on floodplain characteristics, with standards to be determined in the EIR and the CFCP and through detailed design.
• Finalized road widths and profiles will affect the opportunities for enhanced wildlife
passage in each crossing location. Provision of wing walls and other elements to
direct wildlife passage will be included in preliminary design requirements at the EIR stage. Crossings will require terrestrial benches to permit passage under a range of
flow conditions, typically from low flow to bank-full, protective cover and road signage.
10.2 Implementation Principles The Mount Pleasant Implementation Principles address road design by stating:
“Schedule A conceptually illustrates the location of new road crossings of the SPNHS. Road crossings and designs will be confirmed through the Sandalwood Parkway Environmental Assessment and other Integrated Planning/Environmental Assessment(s), where necessary, to be completed as part of the Block Plan process. Spans for road crossings will be designed to address fluvial considerations including watercourse form and functions (not spanning meander belt) and accommodate conveyance and storage of Regional Storm flows, where appropriate, to provide flood free road crossings, and wildlife passage as appropriate. EIR work with respect to road designs shall address wildlife passage for large mammal movement where appropriate. Design considerations will include road signage, road speed, warning lights, fencing, clear passage and/or other measures to accommodate movement across roads”.

Final Environmental Implementation Report Mount Pleasant Sub-Area 51-1
September 2011
10-2
10.3 Block Plan Transportation Study The Mount Pleasant Block 51-1 Collector Road Environmental Assessment Study and Transportation Study (BA Group, August 2011) was prepared in support of the
Sub-Area 51-1 Block Plan. The purpose of this Transportation Study is to assess and recommend
the collector road network and associated transportation infrastructure required to support the development of the Block 51-1 lands. It recommends the alignment, cross-section and
preliminary design plan for the East-West Spine Road, North-South Spine Road, Buick Boulevard, El Camino Way, and Collector Roads A to H. It is also intended to fulfill the Phase 3 and 4
requirements of a Collector Road Environmental Assessment (EA) process. As such, it is a
continuation and refinement of the work conducted in the Mount Pleasant Secondary Plan Transportation Master Plan, Phases 1 and 2 Environmental Assessment Study (TMP), completed
in June of 2009.
The BA Group has also reviewed the findings of the completed Phase 3 and 4 Environmental Assessment conducted on behalf of the City by ENTRA Consultants for Sandalwood Parkway four
lane extension from Creditview Road to Mississauga Road. An adjustment to the alignment of
this road has been recommended through this review to avoid interfering with the existing recreational infrastructure (playing fields) in the Creditview Park and address other planning
considerations/efficiencies.
10.4 Future Road Crossing Design 10.4.1 Design Principles
Based on recommendations from the HFSWS and Implementation Principles agreement, the design of road crossings of the NHS are guided by the following principles:
• Road crossings will have flood-free access during the Regional Storm.
• Road crossings will be designed to form part of the Regional Storm on-line storage
system, where required.
• Spans for road crossings will be designed to address fluvial considerations, including
watercourse form and function. A stable low flow channel is to be provided which allows
for fish/wildlife passage and drainage as well as stability under critical flow conditions; the specific design components of these crossings will be provided in the detailed design
fluvial geomorphology brief. Reference will be made to Guidance Document: Application of Fluvial Geomorphology in Common Submissions (Geomorphic Solutions, 2009) and the checklist will be provided in the detailed fluvial design brief, as applicable.
• Open-footing designs will be utilized with the placement of natural substrate through the
culverts.
• Road crossing designs will encourage wildlife passage considerations under roads for
small mammals. Large mammal movement across roads will be addressed through design considerations such as road signage, road speed, warning lights, fencing, clear
passage and/or other measures.
• Road designs are to address Green System Trail crossings as identified in the Mount Pleasant Block Plan 51-1 Community Design Guidelines (May,2011).

Final Environmental Implementation Report Mount Pleasant Sub-Area 51-1
September 2011
10-3
• Installation of municipal services under road crossings.
Drawing 10.4.1 illustrates typical road crossing details. Recent discussions between the CVC
and the MNR have confirmed that road crossings and CNR improvements are not considered dams and permits under the Lakes and Rivers Improvement Act are not required.
10.4.2 Road Alignments and Culvert Sizing
Road alignments and culvert sizing for each of the future road crossings of the NHS are addressed below. General recommendations for all road crossing designs for wildlife movement
are addressed in Section 10.4.3.
10.4.2.1 East-West Spine Road The East-West Spine Road crosses the NHS approximately 250m north of Wanless Drive. The
location of this road was determined through MPSP and Block Plan analyses and is largely influenced by the design of the Urban Node to the immediate west of the NHS in this location.
The alignment of this road crossing of the NHS has been set so that the road ROW lies south of
the dripline and buffer requirements of Mayfield Woodland B and W6 and its buffer.
The sizing of this crossing (length and opening size) is summarized on Table 10.4A, along with Regional Storm flood levels compared to the road elevation at the crossing. As illustrated,
hydraulic modelling of the NHS confirms that this crossing size (1.25m high by 6.1m wide) provides flood-free access during the Regional Storm. The culvert will be an open-footing design
with the placement of natural substrate through the culvert. The Green System Trail crosses
over the East-West Spine Road, east of the culvert. The Community Design Guidelines provide typical details of trail crossings of roads.
Table 10.4A New Road Crossing Sizes and Elevations
Road
Culvert Size (m) Elevation (masl)
Length
Height
Width
Upstream Invert
Upstream Obvert
Road at Crossing
Regional
Storm (upstream
side)
East-West
Spine Road
26.0 1.25 6.1 253.79 253.49 258.40 254.76
Wanless Drive
38.0 1.25 6.1 251.33 251.33 255.60 253.01
Buick
Boulevard
25.3 1.50 7.3 248.62 248.51 252.47 249.72
Sandalwood
Parkway
38.0 1.50 7.3 244.99 244.86 249.56 249.14
North-South Spine
Road
25.90 1.20 7.3 243.04 242.97 248.29 244.45

Final Environmental Implementation Report Mount Pleasant Sub-Area 51-1
September 2011
10-4
10.4.2.2 Buick Boulevard
Buick Boulevard crosses the NHS approximately 630m south of Wanless Drive. The location of this road was determined through MPSP and Block Plan analyses. Adjacent to the NHS, the
alignment of this road crossing of the NHS has been set so that the road ROW lies south of the dripline and buffer requirements of Wanless Woodland B and W7 and its buffer.
The sizing of this crossing (length and opening size) is summarized on Table 10.4A, along with Regional Storm flood levels compared to the road elevation at the crossing. As illustrated,
hydraulic modelling of the NHS confirms that this crossing size (1.5m high by 7.3m wide) provides flood-free access during the Regional Storm. This forms part of the online Regional
Storm design. The culvert will be an open-footing design with the placement of natural substrate through the culvert. The Green System Trail crosses over the Buick Boulevard, east of the
culvert. The Community Design Guidelines provide typical details of trails crossings of roads.
10.4.2.3 Sandalwood Parkway Extension The need, justification and potential alignments of the Sandalwood Parkway Extension were
assessed in the City’s Mount Pleasant Secondary Plan Area Transportation Master Plan (TMP) in
accordance with Class Environmental Assessment requirements. It identified the extension of Sandalwood Parkway as a Schedule C project that required further study in compliance with
Phases 3 and 4 of the Class Environmental Assessment process. This work was completed through the Sandalwood Parkway Extension from Creditview Road to Mississauga Road Class Environmental Assessment – Environmental Study Report (ESR) completed by ENTRA Consultants
and Philips Engineering in November 2010. The Study assessed alternative road alignments and recommended a location and preliminary preferred design of the Sandalwood Parkway extension
through the Mount Pleasant lands. The recommended location was noted to cross the NHS generally south of existing Wetland 9 (W9). A small portion of the staked boundary of this
wetland lies within the proposed ESR Sandalwood Parkway ROW and associated transitional grading area. The ESR concluded that the minor loss of a portion of W9 could be readily
compensated for within the NHS design as currently proposed. It further noted that necessary
adjustments to the design, inclusive of details of cross-section and alignment of Sandalwood Parkway that are generally in accordance with the preferred alternative alignment, will be
considered during the detailed design phase. This would be in association with the Block Plan process and addressed through required component studies, including but not limited to the EIR
and Transportation Study.
The boundaries of the Block 51-1 NHS reflect findings of the North West Brampton LSA, the
HFSWS and principles outlined in the "Implementation Principles for the Subwatershed Study, November 24, 2009", attached as Appendix F to the approved MPSP. The Implementation
Principles were agreed to by the City, the CVC, the MNR and the MPLG. The MPLG’s Vignettes, that formed part of the Implementation Principles (1(c)), illustrated that a portion of W9 was
proposed to be altered through the proposed NHS design, with the construction of new open
water/marsh wetlands north and south of Sandalwood Parkway; refer to Figure 10.4.1. The Implementation Principle (1(c)) states that the extent of habitat enhancement and wetland
creation is to be implemented as per the concepts/principles illustrated on the Landowners’ Group Vignettes (2009) and that implementation and additional design details will be established
at the EIR stage. Through Sub-Area 51-1 EIR Workshops in 2010, the MNR requested that the
proposed open water/marsh wetland, north of Sandalwood Parkway, be removed and that the existing W9 remain as is. Figure 10.4.1 also illustrates the resulting revised Vignette for the W9
area.

Final Environmental Implementation Report Mount Pleasant Sub-Area 51-1
September 2011
10-5
Proposed Realignment of Sandalwood Parkway
Following completion of the ESR, the ‘preferred’ alignment of Sandalwood Parkway was reviewed as part of the development of the Block Plan for Sub-Area 51-1. A review of the road alignment
with respect to the integration of various land uses in this vicinity, including the extent and form of the NHS, maintenance of the Creditview Park facilities, the development of an ‘urban node’ in
conjunction with the alignment of the community Spine Road, and the consideration of land use
efficiencies, resulted in the proposal for several adjustments to the Sandalwood Parkway alignment as illustrated in Figure 10.4.2. These adjustments can be generally described as
adjusting the road alignment northward from the ESR alignment by 18m to 45m, depending on location. This relocates the road further north into portions of W9. The nature and rationale for
these changes are summarized below.
• Reduce Impacts on the City’s Sports Park- The preferred alignment for Sandalwood
Parkway, as documented in the ESR, cuts through the northwest corner of the City’s Sports Park, located in the southwest quadrant of the future Creditview
Road/Sandalwood Parkway intersection. The preferred alignment was such that an existing illuminated lacrosse field, in which the City had made significant investment, will
be eliminated.
After discussions were held with City staff as to how this impact might be mitigated, an
alternative alignment was developed that flattened the back-to-back curves in the preferred ESR alignment so as to shift the required road ROW northwards, clear of the
affected playing field.
• Balance Property Impacts - From the mid-block property boundary to Mississauga Road,
the preferred ESR alignment for Sandalwood Parkway located the ROW completely to the south of a significant east-west property boundary that separates two participating
landowners and bisects one of the Mixed Use Nodes in the Block Plan. By virtue of the road not being centered on this property line, a problem was created with respect to a
fair division of the constraints imposed by this road on the efficiency of two adjacent
draft plans. Compounding the problem was the desire to create a particularly efficient, more urban built form within the areas identified as Mixed Use Nodes in Block 51-1, one
of which is located at the intersection of the North-South Spine Road and Sandalwood Parkway.
By shifting the road alignment north such that it was centred on this east-west property boundary, and further straightening the road in co-ordination with the effort to remove it
from the City’s Sports Park, as discussed above, these inefficiencies are resolved.
• Road Geometry Benefits - From a road design perspective, the preferred alignment for Sandalwood Parkway, as documented in the ESR, has two back to back curves that,
while meeting the City and the Technical Advisory Committee’s (TAC) standards, does
not create an ideal alignment for a busy arterial road. The adjustments to these curves, noted in the preceding two sections, have the benefit of flattening them, creating a
generally straighter alignment for this section of road.
In addition, the flattening of the easternmost of the two curves creates a more desirable
intersection configuration at the point where Collector Road ‘G’ intersects from the north. By reducing the curvature and improving sightlines, this also creates the flexibility to add
a fourth leg to this intersection, which would allow the City’s desired new access from Sandalwood Parkway into the north side of the City’s Sports Park.

Final Environmental Implementation Report Mount Pleasant Sub-Area 51-1
September 2011
10-6
• Required Road Grades – The ESR alignment does not appear to have considered overall
site grading requirements to service the Sub-Area 51-1 lands. The EIR for the Sub-Area
51-1 lands (January 2011) included a detailed site grading assessment to establish channel, road and lot grades. This analysis identified proposed road grades for
Sandalwood Parkway in the context of servicing of the adjacent lands. Resulting road grades differ from those provided in the ESR. The ESR road grades, established without
the benefit of a detailed site assessment, indicate lower road grades than what is
required. Based on the ESR alignment and EIR road grades, 4% of W9 would be removed through road construction.
The resulting road realignment and cross-sections are illustrated on Drawings 11.1.3 and
4.6.7.1C. The Green System Trail crosses over the Sandalwood Parkway east of the culvert. The Community Design Guidelines provide typical details of trail crossings of roads.
Environmental Review of Realignment
As part of the assessment of the realigned Sandalwood Parkway, environmental implications of the road realignment on Wetland 9 (W9) were evaluated. W9 is a wetland unit within the draft
Provincially Significant Huttonville Creek and Area Wetland Complex and is classified as a
palustrine wetland, with intermittent inflow and outflow. It has no well-defined storage basin or measurable outlet rating curve. W9 is a complex of several herbaceous and shrub communities.
The intricate mosaic is formed by variously shaped, connected or separate, patches of reed-canary grass meadow marsh, meadowsweet thicket swamp, sedge meadow marsh, as well as
areas of forb and mixed meadow marsh, and willow and dogwood thickets. The latest aerial
photography was reviewed, field verified and updated vegetation units, as per Ecological Land Classifications (ELC), were identified. Figure 10.4.3 illustrates the wetland and upland
vegetation units in and around W9.
The existing conditions and hydrologic characterization of this wetland is described in detail in Section 6.6.9 of this EIR. Winter wildlife surveys, winter raptor surveys, breeding amphibian
surveys, amphibian movement surveys and breeding bird surveys were completed by either
Dougan & Associates or Savanta Inc. between 2005 and 2009. Based on this extensive inventory work and MNR evaluation, American Toads, Chimney Crayfish, Pond Snails, Bobolink, Yellowlegs,
Red-winged Blackbirds, Song Sparrow, Cowbird, American Goldfinch, Eastern Kingbird, Yellow Warbler, Willow Flycatcher and Tree Swallow were observed in, or in the vicinity of, W9. Virginia
Rail was heard in a June 8, 2011 site visit by the MNR and Savanta Inc. During the same site
visit to W9, the MNR confirmed that W9 does not provide suitable habitat for Bobolink.
Surface water and groundwater conditions in and around W9 have been studied (refer to Section 2.1.8.4). The wetland relies on direct precipitation and surface water runoff for water
supply. There is a seasonally high water table; however the groundwater contribution to the wetland is minor. Surface runoff from agricultural fields to the north and tile drain discharge
flows to a ditch that directs surface flows into the northwest corner of W9. The ditch continues a
short distance into W9 and then the channel disappears and the flow disperses broadly across the grassy area. Flows out of W9 drain via a catchbasin located at the southeast limit of W9 that
is suspected to carry water directly to the East Huttonville Creek to the south. During high water conditions, overland drainage occurs southerly across the existing agricultural fields in ill-defined
swales. Shallow standing water is observed in the linear depressions that are present in W9
(remnants of agricultural furrows and farm vehicle tire tracks from past agricultural uses in this area), during and following the snowmelt period (March/April) and following storm events in the
late fall. W9 is typically dry by May/June; its hydroperiod is estimated to be four months in the spring.
Final Environmental Implementation Report Mount Pleasant Sub-Area 51-1
September 2011
10-7
Wetland 9 Delineation
In 2005 and 2006, the MNR conducted wetland inventories and fieldwork in the North West
Brampton area and vicinity. Through air photo interpretation, both the external wetland polygon boundary and internal vegetation community boundaries were determined by the MNR. In the
field, the wetland vegetation communities were determined to vegetation unit (ELC), where
access was available, and flora and fauna (i.e., amphibians and incidental wildlife) were recorded. In December 2007, the MNR released a Draft Huttonville Creek and Area Wetlands Map and
background data summary of Candidate Provincially Significant Wetland (PSW) Units. Fourteen Candidate PSW areas are located in Block 51-1, including W9. The MNR deferred a final
determination regarding their status (i.e., they remain candidates) until completion of the NHS planning through the MPSP work. This approach was adopted to allow for a more broad
consideration of the functions performed by the individual wetland units in the context of the
larger terrestrial and aquatic ecological system and adjacent urban development proposed in Mount Pleasant.
In 2009, the external W9 boundary was staked and confirmed by the MNR. Between the
summer of 2006 and the summer of 2007, a southern portion of W9 was converted to
agricultural uses (former lake-sedge meadow marsh). The 2009 wetland staking included an estimated southern boundary that contained the new agricultural field; it is noted as
“disturbed/agriculture” on Figure 10.4.3.
Species at Risk - Bobolink
As noted above, Bobolink has been observed in the vicinity of W9. As of September 2010,
Bobolink was listed as Threatened in Ontario under the Endangered Species Act (ESA, 2007). Prior to its listing of Threatened in Ontario, protection for the species was limited to that offered
under the Significant Wildlife Habitat (SWH) designation, as per the Natural Heritage Reference Manual. The Endangered Species Act protects both the species and its habitat. The MNR is in
the process of preparing a Recovery Strategy for Bobolink with the proposed timeline for
completion of the Draft Recovery Strategy being October 2011 and the Final Recovery Strategy being the summer of 2012. There currently is no specific habitat regulation for Bobolink and it is
protected under the general habitat regulation of the ESA.
Bobolink (Dolichonyx oryzivorus) is a member of the blackbird family that lives year-round in
grassland habitats ranging from abandoned pasture and grassy edges of wetlands to active hay fields. The species breeds across North America in a rough band, primarily between 40o and 50o
latitude, wherever suitable habitat occurs. Presently, much of the historical core range is in intensive crop agriculture and is unsuitable for this species. Their current range and strongholds
are in many areas strongly tied to past and present agricultural practices (e.g., presence of large hayfields).
Breeding Bird Surveys were conducted as part of the HFSWS by Dougan & Associates in 2005, 2006 and 2007, and for the North West Brampton lands in support of the HFSWS (including
Mount Pleasant) by Savanta Inc. in 2008 and 2009. These surveys were conducted in accordance with Ontario Breeding Bird Atlas protocol. Through the five-year study period,
Bobolink were recorded in 2005, 2006, 2008 and 2009 as “breeding possible” in a couple of
vegetation communities near W9 on the Block 51-1 lands. While historic records noted the limited observations of Bobolink in the vicinity of W9, these lands were re-examined by the CVC,
the MNR and Savanta Inc. on June 8, 2011 and based on site inspection, no Bobolink or their habitat were observed within W9. It was further agreed by the CVC, the MNR and Savanta Inc.
that lands along and in the vicinity of the proposed Sandalwood Parkway alignment and within

Final Environmental Implementation Report Mount Pleasant Sub-Area 51-1
September 2011
10-8
W9 itself do not comprise suitable habitat for this species.
Species at Risk – Redside Dace
Redside Dace (Clinostomas elongates), an endangered species as per the provincial Endangered Species Act, 2007, occurs in the East and Main Huttonville Creeks. Ontario Regulation 293/11, made under the Endangered Species Act, 2007 dated July 1, 2011, amends Ontario Regulation
242/08 to provide Redside Dace habitat definition (Section 29.1) and transition provisions for
development and infrastructure affecting Redside Dace habitat (Section 23.1). As discussed in Section 2.2.2.4, Redside Dace habitat is defined by Regulation 293/11, Section 29.1. Figure
2.2.4 illustrates existing regulated Redside Dace habitat in Sub-Area 51-1. As shown, based on Section 29.1 1.v., W9 and stream reaches through W9 are regulated Redside Dace habitat.
Impacts of Sandalwood Parkway Realignment on W9
Based on an engineering assessment of the road design and community grading requirements, the road alignment, grading and a cross-section through the W9 area were established. They are
illustrated on Drawings 11.1.3 and 4.6.7.1C. Transition grading (3:1 (H:V) sloping) from the northern boundary of the road ROW into W9 is currently shown.
W9 is a total of 2.49 ha in size based on the limits of W9, as staked and surveyed in the field with Agency representatives in 2009. As described earlier, the southern portions of this wetland
were historically cultivated and again farmed sometime between 2005 and 2007. Considering the removal of some wetland vegetation, approximately 2.17 ha of the wetland staked limit contains
wetland vegetation. Based on the latest aerial photography and staked W9 limits, the realigned
Sandalwood Parkway and associated grading encroaches approximately 0.98 ha or approximately 39% into W9. Of this area, 0.32 ha is disturbed by recent agricultural uses and 0.66 ha is
wetland vegetation. The road realignment will remove 26% of existing wetland vegetation and 13% of historic wetland area.
Neither the pre-development nor post-development drainage that supports W9 will be impacted
by road construction. However, an appropriate ROW drainage design is required to maintain the
existing wetland outlets for surface flows, with best management practices for construction to prevent water table lowering. To maintain drainage from W9 to downstream areas, culvert(s)
under Sandalwood Parkway will be required that will direct flows to the new wetland to be created south of Sandalwood Parkway.
Proposed Realignment and Mitigative Measures
The proposed Sandalwood Parkway realignment, presented herein, is the result of an integrated analysis of the extent and form of the NHS, land use design for the Mixed Use Node and Spine
Road, road geometry and design, maintenance of existing parkland infrastructure and development land use efficiencies. This alignment encroaches further into W9 than the approved
ESR alignment. Considering all land use planning, design, and engineering implications of road
realignment, the Sandalwood Parkway realignment is preferred, as illustrated on the Block Plan.
At detailed design, road design will be reviewed to minimize grading impacts into W9 and maintain drainage from W9 into the newly created wetland south of Sandalwood Parkway.
Opportunities to minimize grading impacts into W9 will be investigated at detailed design in
consultation with the City, the CVC and the MNR. These include lowering the road grade and utilizing alternative SWM treatment for road drainage, steepening the slope north of the road,
using retaining walls and/or starting transition grading within the ROW. Vegetation community edge management, including native species restoration plantings, will be implemented along the

Final Environmental Implementation Report Mount Pleasant Sub-Area 51-1
September 2011
10-9
ROW. In addition, as agreed to by the MNR, the City and the MPLG (refer to the City’s
correspondence to the MNR dated March 16, 2011, Appendix A-3), wetland replacement will
occur elsewhere in the NHS. More specifically, the loss of 0.98 ha of W9 will be mitigated through the construction of approximately 2.0 ha replacement wetland and associated buffers in
the area referred to as the ‘tooth’ in the vicinity of the woodlands/wetlands (W13) to the west and south of the Creditview Park. Direction to wetland restoration in this location is provided in
Section 5.7.5 based on a site visit to the “tooth” in May 18, 2011 attended by the City, the CVC
and the MNR. Further discussions are required with the MNR through detailed design on the affected draft plan to identify specific replacement wetland details including design, timing of
construction and other implementation considerations. The preparation of detailed landscape plans for implementation is the responsibility of the MPLG.
10.4.2.4 North-South Spine Road
The North-South Spine Road crosses the NHS approximately 770m north of the CNR, west of Park Woodland B. The location of this road was determined through the MPSP and Block Plan
analyses and is largely influenced by grading and community design. The alignment of this road crossing of the NHS has been set so that the road ROW south of the NHS lies outside of the
dripline and buffer requirements of Park Woodland B. In this location, grading is required in the
buffers to accommodate the grade difference between this road and the adjacent woodland.
The sizing of this crossing (length and opening size) is summarized on Table 10.4A along with Regional Storm flood levels compared to the road elevation at the crossing. As illustrated,
hydraulic modeling of the NHS confirms that this crossing size (1.2m high by 7.3m wide) provides
flood-free access during the Regional Storm. This crossing forms part of the online Regional Storm design. The culvert will be an open-footing design with the placement of natural substrate
through the culvert. The Green System Trail crosses over the North-South Spine Road east of the culvert. The Community Design Guidelines provide typical details of trails crossings of roads.
10.4.3 Road Design for Wildlife Movement
Birds, mammals, reptiles and amphibians are all susceptible to being killed by automobiles where natural features (i.e. wetlands, forest) are present on either side of the road. Due to the
fragmented and intensely farmed nature of the Sub-Area 51-1 lands, there is currently little diversity of wildlife present; being limited primarily to common species that are tolerant of human
activity. Wildlife studies also suggest there does not appear to be a concentrated system of
movement over most of the Study Area, which is likely a result of the general lack of existing corridors of habitat. The NHS will create a north-south terrestrial and aquatic wildlife corridor
through the realignment of the East Huttonville Creek and the creation of grassland and forested patches to connect the existing “islands” of woodlots and wetlands in between agricultural fields.
The overall effect will be to create a north-south corridor that will become a frequently used pathway for wildlife, especially as the corridor matures. To mitigate potential wildlife/vehicle
collisions at road crossings (i.e., Mayfield Road, Wanless Drive, Buick Boulevard, Sandalwood Parkway and the Spine Roads) numerous mitigation measures have been considered, including
minimizing the length of the proposed cement span culverts across the creek channel to maximize wildlife use, directional wildlife fencing, roadside vegetative plantings, and wildlife road
crossing with/without speed reduction signs.
In the NHS, it is anticipated that the majority of small mammal movement in the vicinity of roads
will likely occur through the cement span culverts at each creek/road crossing, although some movement by larger animals may occur across roads. The issue of deer movement across the
road by jumping over fences is addressed later in this section. Numerous studies have

Final Environmental Implementation Report Mount Pleasant Sub-Area 51-1
September 2011
10-10
documented wildlife movement through culverts, from small to large mammals, amphibians,
reptiles and birds. The effectiveness of a culvert for use by wildlife is dependent on its
dimensions (length, width, and height), degree of openness, amount of ambient light, moisture, substrate, vegetative cover and noise levels (Eriksson et al. 2000, Jackson 1999, Rodriguez et al
1996, Yanes et al. 1995, Brehm 1989, Dexel 1989, Langton 1989). Crossings of the NHS are designed with an open bottom culvert and with natural stream channel configuration and
substrate; which should encourage wildlife movement (as opposed to a concrete box culvert
bottom).
The proposed culverts in the NHS are between 1.2m to 1.5m in height and 6.1m to 7.3m in width. These culvert heights will support the passage of all species, with the exception of white-
tailed deer that require a minimum culvert height of approximately 6m. The width of the culverts is greater than 1.0m and studies have shown that this width will support a broad range of wildlife
(Eriksson et al. 2000, Jackson 1999, Brehm 1989). The length of the culverts depends on the
length of the ROW, which varies between 25m to 38m in length. Culvert lengths under the ROW have been minimized to allow for maximum potential natural light levels. To date, there has
been no conclusive research on maximum tunnel length for wildlife movement. Research findings to date have documented that some wildlife avoid tunnels over a certain length, or have
a preferred a degree of openness of tunnel (ratio of the cross-sectional area of the tunnel relative
to the ROW length). Generally, research supports culvert design with maximum openness (a see-through structure with ambient light to guide passageway) to support the largest range of
species. Where it is not possible to increase openness (light levels) in the culvert design, grates for light penetration and/or dedicated lighting near culvert entrances should be considered.
For most of the year during low water-flow periods, there will be a firm bottom (substrate). Along the west and east side of each culvert, an additional concrete “lip”, at least 40cm wide, is
planned at about the height of the anticipated high water mark during spring run-off. At either end of the culvert, the lip will be contiguous with valley grading providing there are no hydraulic
consequences. Animal corridor movement studies have indicated that both mammals and amphibians will pass along a concrete culvert, through use of a concrete ledge that has a ramp
on either side, into the natural vegetation (Foresman, 2004; Cain et al. 2003, Veenbaas and
Brandjes; 1999). The use of a concrete ledge will enable wildlife to cross through the culverts during periods of high water levels during early spring and storm events. This ledge would be
exposed (unvegetated), and as such, would not provide cover for prey crossing through the culvert, perhaps making them more susceptible to predation.
Detailed design of the crossings will determine how a concrete lip/ledge or other means of passage through the open-span culvert will be provided. A conceptual ledge has been illustrated
on Drawing 10.4.1.
Fencing is required at the entrance of the culverts to direct animal movement, in particular, amphibian movement, into the culverts and away from travelling across the road. Currently,
1.82m high chain link fencing is proposed. Amphibians and small mammals are able to pass
through or under chain fencing and it is recommended that fencing that prevents movement of small mammals and amphibians onto roadways (i.e., concrete, armour stone, curb stone, wood
or sheet metal piling) be considered. To prevent amphibian movement across the road and to direct movement through the culvert, a minimum 40cm high permanent drift fence is required
with bent upper edge (Dodd et al, 2004), from the entrance of the culvert running outwards
along the bottom of the slope (floodplain edge) and ideally extending in a fan shape between 30m to 50m from the edge of the culvert (Aresco, 2003). To prevent wildlife movement onto
roadways, parallel fencing along road ROW outside of the channel should be considered. Combining fencing with dense shrub plantings will further discourage road crossings across the
NHS tableland. To ensure the maximum range of species is deterred by the fence, the spaces

Final Environmental Implementation Report Mount Pleasant Sub-Area 51-1
September 2011
10-11
between the links should be small and the fence itself should be buried partially underground.
To minimize long term maintenance of the fence, strong durable materials (i.e., PVC) should be
considered.
As mentioned previously in this section, deer are expected to cross roadways as the culvert dimensions proposed will not enable passage. At present, there are no major concentrations or
well-defined movements of deer in Sub-Area 51-1, but it seems likely that the newly established
corridor may become attractive. It is also unclear how deer will behave in the new habitat; either using it as a north-south travel corridor or localized between the road crossings.
Regardless, it can be expected that deer will occasionally cross the roadways. Since they are unable to use the culverts and they can jump over fences (i.e., even 3.6m fences), deer warning
signs should be considered along all west-east road crossings adjacent to the NHS.
Road ecology studies in Europe and North America have demonstrated that amphibian (frog,
toad, salamander) and reptile (turtle, snake) movement across roadways are associated with changes in water levels in natural features, breeding and dispersal time periods. Successful
recruitment and dispersal are key in maintaining anuran populations (Semlitsch 2000). GIS analysis of road crossing locations have found that they are correlated with adjacent forest or
wetland cover. The NHS has been designed with placement of breeding, foraging and
overwintering habitat in locations where road crossing by amphibians is minimized. Measures to encourage amphibian and reptile movement, through the culvert instead of across the road, have
been determined, as discussed above (i.e., drift fencing). Road crossings by amphibians and reptiles should be minimized with these measures; however, some over road crossings can still
be expected to occur. Signage could also be utilized to alert motorists to spring amphibian
migration locations and summer reptile movements.
It is not anticipated that birds will be significantly at risk from traffic; however some precautions are advisable along Sandalwood Parkway where waterfowl in the new open water/marsh wetland
could come into conflict. It is expected that waterbirds will frequent the new pond, especially Canada Geese and Mallards - both of which could be killed by cars in busy urban areas. A
combination of fencing and planting of a mix of coniferous and deciduous shrubs (grow to 3m to
5m when mature) is recommended between the road and the beginning of the open water/marsh wetland. This will virtually eliminate the risk of adults bringing young onto the road
(which is when most mortality occurs). Between Sandalwood Parkway and the beginning of the slope down into the open water/marsh wetland, a 12m shrub planting area has been designed
(refer to Vignette 3). This shrub hedgerow (2 to 3 rows wide) will act as a natural barrier and
force any birds flying north out of the pond to gain enough altitude to clear vehicles by the time they cross Sandalwood Pkwy.
As described in Section 10.5, installation of new culverts under the CNR are planned to improve
fish passage. These culverts will also provide small and medium wildlife passage under most conditions, with the exception of the Regional Flood whereby all proposed culverts will be
submerged. At detailed design minor grading at the entrance/exit of each culvert will be
explored to aid wildlife movement through the culverts while not affecting water movement within the floodplain.

Final Environmental Implementation Report Mount Pleasant Sub-Area 51-1
September 2011
10-12
10.5 CNR Improvements
10.5.1 Existing and Historic Conditions
The original CNR crossing at this location was a brick pipe arch culvert but it is apparent that
several modifications to this culvert have occurred over the years. The culvert has been extended and re-enforced through the addition of a 1500mm corrugated steel pipe (CSP)
inserted through the original pipe arch culvert. In more recent years, the 1500mm CSP required additional repair due to partial collapse. A 1200mm CSP was inserted into the 1500mm CSP on
the downstream side of the crossing and the gaps were grouted. Photos A and B illustrate the upstream and downstream side of the existing culvert.
The maximum flow that the existing culvert can convey, before overtopping of the CN embankment occurs, is approximately 6.5m3/s. It should be noted that the installation of the
additional CSP lengths has resulted in a drop inside the upstream end of the culvert, such that fish passage may be impacted into upstream reaches. On the downstream side, the invert of the
culvert is within the low flow channel; there is some ponding at the upstream side, indicating that
the upstream invert of the culvert is too high to convey low flows.
Photo A - Existing CNR Crossing (U/S side – 1500mm)

Final Environmental Implementation Report Mount Pleasant Sub-Area 51-1
September 2011
10-13
Photo B –Existing CNR Crossing (D/S side – 1200mm)
10.5.2 Proposed Culvert Improvements
The existing crossing location will continue to serve as the outlet for the East Huttonville Creek which drains the majority of the Sub-Area 51-1 lands. As previously stated, development of the
lands upstream of the CNR crossing require the realignment and lowering of portions of the East Huttonville Creek. The channel inverts and slopes immediately upstream and downstream of the
CNR crossing will not be modified, but the channel banks on the upstream side will be raised to
provide a defined channel/valley section. Due to the presence of occupied Redside Dace habitat on the south side of the CNR crossing, modifications downstream of the CNR will be limited. This
will include installation of a new culvert and minor modifications to the low flow channel to accommodate new culvert works.
The HFSWS estimated the existing peak Regional Storm flow approaching the CNR tracks to be approximately 28.4m3/s. According to the HFSWS, the,
“East Huttonville Creek has been maintained in situ downstream of the CNR tracks. The existing 1.8 m diameter CSP culvert at CNR would require a minimum upgrade to an approximate 9 m span by 1.8 m rise (or equivalent area) based on stream morphologic requirements. The crossing sizing is to be reviewed and confirmed during the EIR Stage of reporting based on flooding, hydraulics and stream morphology and construction considerations.”

Final Environmental Implementation Report Mount Pleasant Sub-Area 51-1
September 2011
10-14
Currently, the existing 1200mm crossing does not have capacity to convey the flow; hence
additional capacity must be provided to improve hydraulic conveyance and reduce the extent of
the floodplain upstream of the CNR. An additional design objective is to remove the seasonal fish barrier to provide the opportunity for fish movement into improved habitats upstream of the
CNR.
Numerous discussions were held with the CNR regarding design and construction issues for the
CNR culvert improvements. The January 2011 EIR outlined proposed CNR culvert improvements
that involved the one-time installation of four new culverts under the CNR tracks to provide
desired improvements in fish passage and hydraulic conveyance. This proposal includes a new
countersunk 2100mm CSP culvert with natural substrate at an invert elevation to provide fish passage during low-flow conditions. Three additional 1500mm culverts and the existing 1200mm
culvert, located at a higher elevation, are proposed to convey higher flows. The four additional culverts, approximately 26m long, will be installed by “pipe ramming”. The proposed culverts
must accommodate future track expansion by the CNR (i.e., the culverts must be long enough to allow for additional tracks within the CNR property, therefore the culverts must extend to the
limit of the CNR property). Figure 10.5.1 conceptually illustrates the proposed culvert
improvements.
Through discussions with the City, CVC, the MNR and the CNR since January 2011, an additional
design approach has been developed for consideration/evaluation. It involves a three-stage construction of two new CSP culverts and a 33m long open span (e.g., CON-SPAN) structure.
The open span structure can only be installed via an open-cut of the tracks, therefore this work
can only be completed following construction of the diversion tracks (for the future Creditview Road underpass) on the north side of the CNR embankment to avoid rail traffic disruption. Since
the open span culvert timing is dependent on the City’s timing for the Creditview Road underpass (not scheduled for construction until mid-2013), interim channel crossing measures are required
to allow development to proceed. In the interim, Regional Storm conveyance capacity can be
provided via installation of two new 35m long 2100mm CSP culverts (minimum size). This length is required to accommodate the construction of the diversion tracks. Should fish passage be
required under interim conditions, it can be provided by counter-sinking one of the new 2100mm CSP culverts. This may necessitate an additional culvert to ensure sufficient conveyance capacity
is provided, as well as additional disturbance to re-route the low-flow channel into the countersunk culvert. The CNR must be consulted since the two 2100mm CSP culverts would
have reduced clearance between the obvert and top of tracks. The existing 1200mm crossing is
proposed to remain in place, but is unable to provide conveyance under interim conditions in order to facilitate the completion of the open span installation. Upon completion of the open
span structure, a functional low flow channel will be established which allows for conveyance and fish passage over the long term. In the long term, the existing 1200mm culvert will be available
exclusively for conveyance. Figure 10.5.2 conceptually illustrates this proposed approach to
CNR culvert improvements.
These options have been discussed with the MNR, CVC and City. Based on environmental,
design, implementation and cost perspectives, the first option is recommended for implementation. Based on input from the City, culvert sizing is currently being confirmed for this
option, then detailed design will be finalized and submitted to agencies for their review and approvals.

Final Environmental Implementation Report Mount Pleasant Sub-Area 51-1
September 2011
11-1
11.0 GRADING & MUNICIPAL SERVICING
11.1 General Site Grading
The future grades required to service the Study Area are generally influenced by the proposed realigned channel, the bounding roads (Mississauga Road, Creditview Road,
and Mayfield Road) and the CNR corridor. Furthermore, the channel invert elevation and pipeline crossing influences the elevation of all SWM facility permanent pool elevations,
which, in turn, affects storm sewer depth and serviceable drainage areas.
The site grading design has taken into consideration the following requirements and
constraints:
• Conform to the City’s grading criteria.
• Minimize cut and fill operations and work towards a balanced site.
• Match existing boundary grading conditions.
• Maintain appropriate clearance above and below the TCPL.
• Match existing grades at woodland and wetland features and buffers, where
possible. Some transition grading has been proposed within buffers in order to
avoid the use of retaining walls and to provide necessary grading to accommodate drainage/pipe outfalls into the NHS.
• Maintain subwatershed drainage boundaries, where possible.
• Provide suitable cover on proposed servicing.
• Provide overland flow conveyance for major storm conditions.
The majority of the existing Sub-Area 51-1 lands generally slope from the northwest to
the southeast, towards the channel. The proposed grading is based on an overall SWM strategy that includes maximizing the lands that can drain by gravity to each SWM facility
while avoiding excessive sewer sizes and pipe conflicts.
Proposed road grades will utilize the City’s minimum of 0.50% and will not exceed 5%.
Sawtooth grading may be introduced to minimize cut to fill operations. Sawtooth road grading conforms to the City’s minimum 0.50% road grade; however, the net grade over
an extended length of road is reduced by introducing sections of road reversed graded at
0.50%. The net slope will not be less than 0.20% in this scenario and will accommodate major system flow conveyance. Proposed road grades and overland flow routes are
illustrated on Drawings 11.1.1 to 11.1.4. The grading design has been designed to match the existing perimeter to minimize disturbance to the existing boundaries.
The alignment of the ultimate Mississauga Road ROW and overpass over the CNR tracks has been considered in the proposed block grading.

Final Environmental Implementation Report Mount Pleasant Sub-Area 51-1
September 2011
11-2
11.2 TransCanada and Enbridge Gas Pipeline Constraints
The TCPL corridor bisects Sub-Area 51-1 in an east/west alignment as illustrated on
Drawing 11.2. The two natural gas pipelines, within this corridor, are 600mm and 900mm in diameter. In July 2010, they were exposed by a vacuum truck and the top of
each pipe was surveyed to ensure the exact elevation and location was known to avoid
future conflict with all municipal services (i.e., watercourse, roads, storm, sanitary, water, utilities).
As set out in Drawing 11.2, these two pipelines are generally less than 2m below the
existing ground surface so the crossing location of all the municipal services needs to be
diligently reviewed to avoid the excessive cost to lower the gas pipelines.
As discussed in Sections 3.0 and 4.0, the lowering of the East Huttonville Creek would begin at the pipeline and extend upstream to north of Wanless Drive due to the pipeline
grading constraints.
11.3 Storm Drainage
11.3.1 Major and Minor System Drainage
The major and minor drainage systems are designed to convey storm runoff to SWM
facilities prior to discharge to the East Huttonville Creek or the Fletcher’s Creek system
downstream of Creditview Road. Drawings 11.3.1A to 11.3.1C illustrate the storm trunk (minor) system which is designed to accommodate flow from the 1:10 year storm
in accordance with the City’s standards; areas of 1:100 year storm runoff capture are also identified. Drawing 11.3.1D provides the overland flow (major) routes which are
generally contained within the municipal ROWs, except in some specific areas where the need for overland flow blocks have been identified. Storm trunk design details are
included in Appendix F.
11.3.2 Foundation Drain and Roof Drain Collector Systems
The Foundation Drain Collector (FDC) system is required throughout the Study Area to provide a gravity outlet for basements where the receiving storm sewer system is too
shallow for a basement connection. A FDC system is required in the eastern portions of
the Study Area to drain basements in areas generally adjacent to Creditview Road. This FDC system will connect to the existing FDC system on Crown Victoria Drive. Refer to
Drawing 11.3.2 for preliminary FDC locations. The FDC system draining basements is deeper than the storm sewer system or the RDC. Where possible, the FDC within the
East Huttonville Creek subcatchment, will outlet to the creek to deliver cool water to the
NHS. The extent of the areas serviced by a FDC and outlet locations will be finalized during detailed design.
The Roof Drain Collector (RDC) system is a third pipe that collects clean roof runoff and,
in most cases, will be located within the municipal ROW. It will collect and convey clean
roof drainage to selected areas to maintain flows to wetlands in the East Huttonville Creek subwatershed. Within the West Huttonville Creek subwatershed, a RDC is one of
the proposed methods of maintaining the downstream targets in the West Huttonville Creek. A swale along Mississauga Road is proposed to receive the RDC flows and is
detailed on Drawings 9.9.3.1 to 9.9.3.4.

Final Environmental Implementation Report Mount Pleasant Sub-Area 51-1
September 2011
11-3
11.4 Water and Wastewater Servicing
The North West Brampton Landowners Group (NWBLG) has worked closely with the
Region over the last 10 years to co-ordinate the timely delivery of water and wastewater servicing. Mount Pleasant Sub-Area 51-1 is the first area to develop in NWB.
The Infrastructure Servicing Study Secondary Plan Area 51 (Mount Pleasant), prepared by R.J Burnside & Associates Limited, provided guidance on the preferred wastewater
servicing routes and preliminary watermain sizing and routing. Through the preparation of the Sub-Area 51-1 Block Plan, the water and wastewater servicing alignments and
sizing have been refined and are described below.
11.4.1 Wastewater Servicing Sub-Area 51-1 will be serviced through the extension of existing wastewater trunk
sewers and sub-trunk sewers. The Mississauga Road trunk sewer is a 1200mm diameter
extension of the Creditview Road trunk sewer that will be constructed along Mississauga Road from Queen Street to Sandalwood Parkway. This trunk sewer will service
approximately 80% of Block 51-1, namely the lands within the Huttonville Creek drainage area as set out on Drawings 11.4.1A and 11.4.1B.
There are several sub-trunks of the Fletcher’s trunk sewer located along Wanless Drive
and on Creditview Road. The two sub-trunk connections in the vicinity of Wanless Drive
and Creditview Road have been sized to convey flows from the Sub-Area 51-1 lands within the Fletcher’s trunk sewer catchment area, as illustrated on Drawing 11.4.1A
and Drawing 11.4.1B.
The completion of the Mississauga Road trunk sewer up to Sandalwood Parkway is
scheduled by the Region to be completed by Q3/Q4-2012. If for unforeseen reasons this sewer is delayed, the opportunity to service the lands in the vicinity of Wanless Drive and
Creditview Road is available through the extension of the existing Fletcher’s Creek sanitary sewers that exist within the Wanless Drive ROW. The remaining Sub-area 51-1
lands can be serviced in the interim by temporary storage tanks until the completion of
the Mississauga Road trunk sewer.
The Fletcher’s Creek catchment area, within Sub-Area 51-1, is tributary to the Lakeview Wastewater Treatment Plant and the “mini” expansion to the plant is on schedule to be
completed prior to Q2-2012.
The Huttonville Creek catchment area, within Sub-Area 51-1, is tributary to the Clarkson
Wastewater Treatment Plant. It currently has adequate treatment capacity for the Sub-Area 51-1 lands.
Refer to Appendix I for the sanitary design sheets for the sub-trunk sewers.
As part of the road crossing construction, sanitary sewers will be pre-installed below the channel with sufficient clearance and erosion protection. Refer to Drawing 10.4.1 for
typical detail.
Two sanitary sewer crossings of the NHS are required south of CNR – one under the Main Huttonville Creek approximately 250m north of Bovaird Drive and one
approximately 350m north of Bovaird Drive and 130m east of Mississauga Road under

Final Environmental Implementation Report Mount Pleasant Sub-Area 51-1
September 2011
11-4
the East Huttonville Creek. These sewer crossings will be tunneled under the
NHS/Huttonville Creek corridors at sufficient depth below the channel invert. The proposed crossing locations are indicated on Drawing 11.4.1A. These crossings are
located within regulated Redside Dace habitat, defined to be meander belt plus 30m on either side of the creek. The proposed tunneling will ensure that no in-stream
construction activity will occur within the watercourse and hence, no direct or indirect
impacts are anticipated to the creek or to the regulated habitat within this reach. The tunneling shafts and manholes for the sanitary crossing will be located outside of the
regulated area.
The location of the required sanitary sewer crossing of the Main Huttonville Creek, 250m north of Bovaird Drive, is dictated by the design of the sanitary sewer on Mississauga
Road. This sewer, being designed by the Region, is to be constructed at a depth of
20m +/- at and north of Bovaird Drive. As such, this sewer must be tunneled. Manhole locations are largely dictated by the ability to obtain enough land to construct shafts to
accommodate tunneling. There are no manholes proposed for the future trunk at Bovaird Drive as a result of the Region being unable to obtain land at the intersection to
build a shaft. Proposed shaft 5A, and hence a manhole to accommodate the sewer for
the Sub-Area 51-1 lands, is located 200m north of the Bovaird Drive intersection. The Region is unable to accommodate Sub-Area 51-1 servicing via James Potter-Bovaird-
Mississauga Road since the ROWs on Bovaird Drive and Mississauga Road do not have space to accommodate additional services. As a result of the land acquisition constraints
related to the location of the proposed manholes along the future Mississauga Road sanitary trunk and lack of space within the ROW, a connection to the Mississauga sewer
is required north of Bovaird Drive. This requires a proposed sanitary sewer crossing
under Redside Dace regulated habitat. This crossing is in a location where the width of the NHS is limited. Refer to the external sanitary drainage plan (Drawing 11.4.1B) for
details.
The second sanitary sewer crossing of the NHS is under the East Huttonville Creek,
approximately 350m north of Bovaird Drive and 130m east of Mississauga Road. This crossing will provide a sanitary sewer outfall to the lands west of the East Huttonville
Creek, north of the confluence with the West Huttonville Creek. This area is unable to be serviced by directly connecting to the sewer on Mississauga Road to the west, since there
are no manholes proposed on the Region’s sanitary trunk at this location and the ROW
does not have sufficient space to accommodate a local sanitary sewer.
11.4.2 Water Servicing
Sub-Area 51-1 is located within Pressure Zone 6 and is serviced by the existing West Brampton Reservoir/Pump Station W4 and the future Alloa Reservoir/Pump Station A5.
AECOM was retained to update the Region’s water model for Sub-Area 51-1 to include
the proposed land use, grading, and population as well as to confirm the required watermain system for the full build-out of the community. This analysis is based on the
2031 population. The build-out and phasing of Sub-Area 51-1 will be thoroughly addressed in the FSRs. A detailed water analysis will accompany the FSRs.
The extension of the existing water distribution system internally, within the proposed road network in Sub-Area 51-1 and the completion of the boundary road watermains, will
provide the required water distribution system as identified on Drawing 11.4.2.

Final Environmental Implementation Report Mount Pleasant Sub-Area 51-1
September 2011
11-5
The analysis determined maximum and minimum pressures and fire flow pressures
within Sub-Area 51-1. Table 11.4A summarizes the maximum and minimum pressures under a steady state analysis and Table 11.4B summarizes the fire flow analysis.
Table 11.4A Maximum and Minimum Pressure within Sub-Area 51-1
System Performance
Average Day Maximum Day Peak Hour
Min psi Max psi Min psi Max psi Min psi Max psi
Block 51-1
57.9 98.9 56.3 96.5 40 79.9
Table 11.4B Summary of Fire Flow Analysis within Sub-Area 51-1
Scenario Minimum Residual Pressure with a Fire Flow requirement
of 151 l/s (psi)
Maximum Available Flow (l/s)
to Maintain 20 psi in Block 51-1
Full Build-out
54.2 psi 4105 l/s
The water distribution analysis has determined there is adequate water supply and
pressure for the full development of Sub-Area 51-1.
Water treatment is provided by the Lorne Park Water Treatment Plant which is currently undergoing a staged expansion. The initial expansion stage, that will service all of Mount
Pleasant, will be completed in 2010 and the final stage, which will service Heritage Heights, will be completed in 2012. There are no water treatment constraints for the full
development of Sub-Area 51-1.
As part of the road crossing construction, watermains will be pre-installed below the
channel with sufficient clearance and erosion protection. Refer to Drawing 10.4.1 for typical detail.
11.5 Construction Below Water Table
The construction of buried services below the water table has the potential to capture
and re-direct groundwater flow through more permeable fill materials placed in the base of excavated trenches. Services below the water table will be constructed to prevent
re-direction of flow and overall lowering of the water table. This will involve the use of anti-seepage collars or clay plugs surrounding the pipes to provide barriers to flow to
prevent groundwater flow along granular bedding and erosion of the backfill materials. Backfill around manholes and catchbasins will also be of low permeability material.

Final Environmental Implementation Report Mount Pleasant Sub-Area 51-1
September 2011
12-1
12.0 IMPLEMENTATION
12.1 Implementation Considerations
The successful delivery of various components of the NHS requires an implementation plan that considers the following items:
• maintaining the environmental integrity of the existing NHS;
• sequencing of site works to maximize the ability to deliver the NHS in a timely
manner and integrating NHS delivery with development phasing plans;
• staged permitting to allow the seamless delivery of the NHS;
• fisheries construction restriction timelines;
• cold-climate construction season as it relates to the “growing season”;
• erosion and sediment prevention and control;
• co-operation amongst the developers, consultants and Approval Agencies; and,
• creativity and flexibility in solving implementation challenges.
This section provides information on various implementation aspects of the design, approval, construction and conveyance of the NHS. Recommended implementation directions to guide the
NHS and aquatic habitat design and construction, along with permitting requirements, are discussed in the Mount Pleasant CFCP (October 2011). They are also noted below and where
appropriate, further discussion is provided focusing on Sub-Area 51-1.
Design and Approvals 1. Within the East Huttonville subcatchment, a very large percentage of owners are currently
participating in block planning and EIR work with the intent to develop their lands in the next
few years. Within the East Huttonville Creek subcatchment, the NHS, from the CNR to Mayfield Road, will be designed as a whole or in large sections and will be submitted
sequentially for approval. Within the Fletcher’s Creek subcatchment in Sub-Area 51-1, most landowners are participating; however there is no NHS in this subcatchment; SWM and other
servicing design must be co-ordinated in these subcatchments.
2. Concurrent with the preparation of detailed designs, Staging and Sequencing Plans should be
provided prior to construction approvals to demonstrate when/where/how works will be implemented. For the permitting processes, direction from the HFSWS, CFCP, EIR and FSR
should be considered in the establishment of these final plans. These plans should identify:
• extent and timing of projects;
• sequencing of construction recognizing timing windows for in-stream works;
• requirements for Erosion and Sediment Control Plans; and,
• relationship(s) to earthworks and servicing program(s) and building permit approvals.

Final Environmental Implementation Report Mount Pleasant Sub-Area 51-1
September 2011
12-2
Detailed plans will be prepared concurrent with detailed design; however, Section 12.2 provides preliminary direction for the NHS Staging and Sequencing plan.
3. Detailed design will include a construction monitoring program consistent with requirements
set out in the HFSWS and the monitoring plan that will be prepared under separate cover
following post EIR discussions with the Agencies. This will occur during the fall of 2011.
4. During the preparatory work in anticipation of construction, as well as during the actual earthworks to create the NHS, consideration should be given to various items including the
following:
a) construction in the vicinity of the former racetrack will require consideration of the local
groundwater conditions; b) wildlife relocation permits will be required to remove and relocate wildlife from the
racetrack pond; and, c) plant salvage should occur from wetland and terrestrial woodland blocks that are planned
for removal, where feasible. These plant materials may require storage prior to
placement.
5. Fish Rescue Plans and MNR Scientific Collector Permits will be required from existing channels prior to or concurrent with the re-direction of existing flows into diversion channels.
Fish will become trapped within isolated sections of channel to be reconstructed, and must therefore be removed and transferred to a section of active stream to remain consistent with
Fisheries Act requirements (i.e., regarding destruction of fish by means other than fishing).
In addition, fish rescue will also occur when the racetrack ponds are filled in, and the fish will be relocated to appropriate reaches of Reach HV19 downstream of the existing racetrack
pond. The Scientific Collectors’ Permit process also requires the preparation of a report detailing the species and number of fish captured during the rescue effort.
6. Numerous approvals are required for the construction of components of the NHS. Depending upon the specific works, permits/approvals may be required from the City, CVC, MNR, MOE,
CNR, TPCL and Enbridge Gas. Table 12.1A summarizes permit requirements by project type.
7. The EIR, CFCP and FSR will serve as key guiding documents for the detailed design of the NHS and elements of subdivision design.
Construction and Conveyance 1. Construction of the NHS, including channelization and road crossings, will be phased. The
CFCP notes that phasing is to be determined through the EIR and detailed design and should
consider participating ownership, development phasing set out in Block Plan Growth Management Studies, relationship to earthworks program(s), and required timing of delivery
of roads.
The Sub- Area 51-1 Growth Management Staging and Sequencing Strategy Report (August
2011) prepared by Gagnon + Law has considered a range of implementation issues and identified that this community will be built in two complementary and supportive areas.
Section 12.2 discusses these areas and general implications to NHS delivery for further consideration during detailed design.
Final Environmental Implementation Report Mount Pleasant Sub-Area 51-1
September 2011
12-3
2. The isolation of in-stream work areas for stream re-alignment and reconstruction projects is
preferred in order to facilitate construction “in-the-dry” and thereby mitigate against the risk of downstream sediment transport while construction of the new channel takes place. In
areas where the new channel cannot be constructed off-line (i.e., it will be reconstructed generally in its current path), a bypass or diversion channel will be built to allow for flow
bypass during construction in order to isolate the work area. A diversion channel is a
temporary channel that will act as the existing watercourse to convey water and allow for fish passage during the construction of the ultimate channel. There are several locations
where the ultimate channel and existing channel are at the same location and this overlap will determine the need for diversion channels. The diversion channels will convey flows until
the low-flow channel of the ultimate channel is stabilized. At that point in time, flows will be redirected from the diversion channels into the ultimate channel and the diversion channels
will be removed. The location and number of diversion channels required should consider
objectives to:
• minimize disruption of existing drainage patterns;
• minimize the area of disturbance (cut/fill stripping of topsoil);
• locate diversion channels an adequate distance away from the ultimate channel to
allow for its construction and close enough for the reconnection of flows;
• consider the location of existing floodlines; and,
• minimize the number of temporary construction crossings.
3. Within Sub-Area 51-1, the need for three diversion channels is anticipated. Locations and
sequencing of construction of these diversion channels are illustrated on Drawing 12.1. Approvals for two diversion channels (A and B) have been obtained and construction of Stage
1 excavations (in the “dry”) for the first two reaches of diversion channels are complete. The
first channel, called Diversion Channel “A” (located upstream of the TCPL), has been completed and seeded, with the exception of the final connection of the downstream “tail”
and upstream “tip” lengths to the existing watercourse. Discussions with Agencies have recently occurred that will permit the final construction of the tail connection in October
2011. Approvals for the tip construction are currently under discussion with the DFO, the
MNR, the CVC and the City. This is expected to occur in the fall of 2011. Construction of the tip and tail connections will facilitate directing flows from the East Huttonville Creek into the
diversion channels to allow for the new channel construction in dry conditions.
4. Where feasible, the construction of municipal services and road crossings of the NHS will be completed in the dry, prior to redirecting flows from the diversion channels to the ultimate
channel. This would avoid the need to enter the natural channel system to install these
services after its construction and restoration have been completed.
5. Detailed soil investigations along the channel alignment in the areas adjacent to the wetlands will be required to assess the potential for encountering layers of high hydraulic
conductivity sediments. An assessment of the dewatering requirements for construction will
be made based on the detailed construction plans. Management and mitigation plans will be developed to address groundwater control as well as the potential for long-term water table
lowering. As noted in Section 12.3, a temporary Permit to Take Water (PTTW) may be required from the MOE depending on the anticipated quantity of dewatering required during
construction.

Final Environmental Implementation Report Mount Pleasant Sub-Area 51-1
September 2011
12-4
6. Rigorous erosion and sediment control measures must be designed, implemented and maintained throughout the construction period. At detailed design, an Erosion and Sediment
Control Plan will be prepared and designed in conformance with the City and CVC guidelines. Erosion and sediment control will be implemented for all construction activities including
topsoil stripping, earthworks, foundation excavation and stockpiling of materials and will
remain in place and functional until bare surfaces are stabilized.
The following erosion and sediment control measures should be considered for use during construction:
• Natural features and fill regulation limits will be staked.
• Sediment control fence and snow fence will be placed prior to earthworks.
• Logistics/construction plan will be implemented to limit the size of disturbed areas
minimizing the non-essential clearing and grading areas.
• Temporary sediment ponds.
• Rock check-dams and cut-off swales will be provided, where required, in order to
control, slow down and direct runoff to sediment basins.
• Sediment traps will be provided.
• Gravel mud mats will be provided at construction vehicle access points to minimize
off-site tracking of sediments.
• All temporary erosion and sediment control measures will be routinely
inspected/monitored and repaired during construction. Temporary controls will not
be removed until the areas they serve are restored and stable.
• The “multiple barrier approach” will be applied to all construction stages to ensure
erosion is prevented rather than reduced. Recommended measures are to be
installed prior to the initiation of the earthworks and grading.
Reference should be made to the Guidelines for Erosion and Sediment Control for Urban Construction Sites prepared by the Greater Toronto Conservation Authorities (2006) when
preparing Erosion and Sediment Control Plans.
7. Adequate riparian storage must be maintained, to the extent feasible, during construction
periods.
8. Timing restrictions are typically imposed on in-stream work to avoid periods when fish are spawning and eggs and embryos may be present as these stages are particularly sensitive to
sediment. In Ontario, most fish spawn in the spring, but some species spawn during the
mid-to-late fall period. Based upon the presence of Redside Dace occupied habitat in the downstream reaches of both the East Huttonville and Fletcher’s Creek (downstream of the
CNR and Sandalwood Parkway, respectively), and contributing habitat upstream from these reaches, the Fish Community Management Zones in both these watercourses are considered
to be cool/warmwater. As such, construction timing guidelines for the Block 51-1 and 51-2
lands, where works are permitted in-stream, are July 1st to September 15th.
Final Environmental Implementation Report Mount Pleasant Sub-Area 51-1
September 2011
12-5
9. These timing windows are guidelines and some flexibility exists in these dates, however,
approval from the MNR is required for deviations from these timelines.
10. Practical measures for the maintenance of water levels in wetlands and watercourses during construction as well as monitoring requirements must be identified and implemented, where
feasible.
11. Grading activities that involve the removal of existing wetlands (i.e., W10, W11, W12, W14
and W48) must design/direct surface water and groundwater contributions from wetland contributing drainage areas to downstream areas. Suitable plant species for salvage and
locations within the NHS for transplant will be determined.
12. The construction and conveyance of the projects to public ownership will be implemented
through agreements between the landowners and the City. These agreements will address extent of works, construction phasing, securities requirements, conveyance mechanisms, etc.
12.2 Growth Management Staging and Sequencing
The Growth Management Staging and Sequencing Strategy Report (August 2011) was prepared to address the following matters in accordance with Section 12.2.3 of the City’s Official Plan
entitled Growth Management of the MPSP:
• Co-ordination of the planned Arterial and Collector Road network improvements with
the level and distribution of development such that components of the transportation
system required for any portion of the Sub-Area are committed or operational prior to, or coincident with development.
• Provision of school sites within the various Sub-Areas of development, including the
first Area, to reasonably accommodate the planned levels of growth.
• Provision of park sites within various Sub-Areas of development, including the first
Area, to reasonably accommodate the recreation needs of local residents.
• The efficient utilization of public investments in sanitary sewer and water supply
infrastructure.
• Accommodation to allow the early and efficient delivery of transit service.
• Appropriate staging of implementing the recommendations of the EIR, including
channel and corridor remediation, restoration and enhancement, and construction of
SWM facilities.
• Staging and sequencing issues associated with the delivery of essential community
facilities and infrastructure.
As identified in the Growth Management Staging and Sequencing Report, it is anticipated that the
development of Block Plan Area 51-1 will be initiated in two complementary and mutually
supportive areas illustrated on Figure 12.2.1 commencing in 2011. Each of the areas is envisaged to deliver all of the hard and soft services required to create the opportunity for
complete neighbourhoods. A number of guiding principles have been identified with respect to the scope and sequence of delivery of these neighbourhoods.

Final Environmental Implementation Report Mount Pleasant Sub-Area 51-1
September 2011
12-6
Discussion on the NHS delivery in this report states that staging and sequencing plans will be
addressed in the EIR, although detailed plans should be prepared at detailed design. It notes that the NHS is intended to be delivered in two general phases. The Initial Phase is to provide
for water management including the aquatic system and storm conveyance, which includes channel and corridor grading and stabilization, storm outlets or SWM facilities, road crossings and
flood protection for the Regional Storm event. The Second Phase is to provide for significant
natural heritage and recreation functional services such as wetland planting and habitat restoration, intensive landscaping and trails and pedestrian crossings. It is intended that Phase 2
works closely follow Phase 1 works, although construction seasons and timing restrictions will influence specific delivery timeframes.
The Block 51-1 Owners’ Group held numerous working sessions throughout early 2011 to identify
a preliminary construction staging and sequencing plan for the construction of the NHS, roads,
SWM, municipal services, community uses, residential areas, etc. The preparation of this plan is a complex matter that involves the co-ordination/integration of issues associated with the
delivery of various land uses and supporting infrastructure to create complete neighbourhoods in a phased manner. It requires a thorough understanding of a range of design requirements,
permits and approvals needs, implementation timelines, seasonal or other limitations to
construction activities, etc. A preliminary plan has been prepared that is considered a work-in-progress, subject to change. Drawing 12.2 presents this plan illustrating anticipated stages of
construction generally proceeding from south to north. The stages shown extend from 2011 to beyond 2014 with NHS construction beginning in 2011. Staging illustrates anticipated limits of
NHS construction on an annual basis and addresses earthworks, servicing and restoration timelines. This plan will be reviewed and updated, as necessary, at detailed design.
12.3 Permitting Requirements to Agencies or Other Parties
This section provides guidance for various regulatory permitting requirements necessary for the
implementation of the development in Sub-Area 51-1 and in particular, the NHS, site grading and servicing. Table 12.1A summarizes NHS permitting requirements by project type, although it
should be noted that various component projects listed in this table may be combined for approval at detailed design.
Department of Fisheries and Oceans CVC is engaged in a Level II review agreement with the DFO, which establishes a streamlined approach to addressing issues pertaining to Section 35(2) of the Federal Fisheries Act. Under this
Agreement, CVC staff in consultation with DFO staff, are responsible for co-ordinating the review
of proposed works that could potentially result in the harmful alteration, disruption or destruction (HADD) of fish habitat. CVC staff are empowered to review a project to make this determination,
as well as examine proposed mitigation to determine if it is sufficient to avoid a HADD. In the event that a HADD cannot be avoided and the project requires compensation, authorization from
the DFO is required under Section 35(2) of the Fisheries Act.
Through the preparation of the CFCP, several workshops were held with the City, CVC, MNR and
DFO representatives to discuss proposed works and their approval/permit/authorization
requirements. The DFO advised that the natural channel design (direct alterations to permanent, seasonal and complex contributing habitats) is considered to be a HADD that will require formal
authorization. The DFO will provide one authorization for the whole natural channel design project from the CNR to Mayfield Drive with amendments, as required, on a phased basis as
detailed design packages are provided. To process/provide the authorization, the DFO requires
the substantial completion of the CFCP, a completed Fisheries Act application, the Canadian

Final Environmental Implementation Report Mount Pleasant Sub-Area 51-1
September 2011
12-7
Environmental Assessment Act (CEAA) report, and detailed channel design (in phases is
acceptable). The proponents will utilize the CVC as the primary contact for receipt and review of the natural channel design works. These will be discussed with the DFO and the MNR via the normal
monthly Agency discussions.
Credit Valley Conservation Permits pursuant to the Conservation Authorities Act, Regulation 160/06, Development,
Interference with Wetlands and Alterations to Shorelines and Watercourses, are required for, “straightening, changing, diverting or interfering in any way with the existing channel of a river, creek, stream or watercourse, or changing or interfering in any way with a wetland caused by site grading, and/or the temporary or permanent placing, dumping or removal of any material, originating on the site or elsewhere”. Through the implementation of Regulation 160/06, the
CVC identified regulated areas, as defined in Regulation 160/06, where these types of activities would require CVC approval. Watercourses and wetlands, within the Mount Pleasant lands, lie
within the CVC regulated areas; hence most elements of the NHS, as described in Section 4 of
the CFCP, will require approvals under Regulation 160/06. Refer to Table 12.1A. Ministry of Natural Resources Redside Dace (Clinostomas elongates), an endangered species (uplisted in 2009) as identified in the provincial Endangered Species Act, 2007, occurs in both the Fletcher’s and Huttonville Creeks.
At a provincial level, Species at Risk and their habitats are afforded protection under the
Endangered Species Act and Ontario Regulation 242/08. Under Section 9(1) of the ESA:
(1) No person shall,
(a) kill, harm, harass, capture or take a living member of a species that is listed on the Species at Risk in Ontario List as an extirpated, endangered or threatened species;
(b) possess, transport, collect, buy, sell, lease, trade or offer to buy, sell, lease or trade,
(i) a living or dead member of a species that is listed on the Species at Risk in Ontario List as an extirpated, endangered or threatened species,
(ii) any part of a living or dead member of a species referred to in subclause (i), (iii) anything derived from a living or dead member of a species referred to in
subclause (i); or (c) sell, lease, trade or offer to sell, lease or trade anything that the person
represents to be a thing described in subclause (b) (i), (ii) or (iii). 2007, c. 6, s. 9 (1)”
Under Section 10(1) of the ESA:
“No person shall damage or destroy the habitat of,
a) a species that is listed on the Species at Risk in Ontario List as an endangered or threatened species; or
b) a species that is listed on the Species at Risk in Ontario List as an extirpated species, if the species is prescribed by the regulations for the purpose of this clause.”

Final Environmental Implementation Report Mount Pleasant Sub-Area 51-1
September 2011
12-8
Despite the provisions against damage or destruction of Endangered species habitat, Section
17(1) of the Act specifies that:
“The Minister may issue a permit to a person that, with respect to a species specified in the permit that is listed on the Species at Risk in Ontario List as an extirpated, endangered or threatened species, authorizes the person to engage in an activity specified in the permit that would otherwise be prohibited by section 9 or 10…if:
c) the Minister is of the opinion that the main purpose of the activity authorized by the permit is not to assist in the protection or recovery of the species specified in the permit, but, i. the Minister is of the opinion that an overall benefit to the species will be
achieved within a reasonable time through requirements imposed by conditions of the permit,
ii. the Minister is of the opinion that reasonable alternatives have been considered, including alternatives that would not adversely affect the species, and the best alternative has been adopted, and
iii. the Minister is of the opinion that reasonable steps to minimize adverse effects on individual members of the species are required by conditions of the permit.”
Ontario Regulation 293/11 (June 2011) amends Ontario Regulation 242/08 under the ESA.
Ontario Regulation 293/11 amendments address Redside Dace in two main ways: 1) by providing transition exemptions for Redside Dace for certain requirements of the Act, and 2) by defining
Redside Dace habitat that falls under the ESA.
With respect to habitat definitions, based on recent discussions with the MNR regarding the
application of Section 29.1 of Ontario Regulation 293/11, under existing conditions (and as discussed in Section 2.2.2.4 of this EIR), the East Huttonville Creek, some headwater drainage
features and some wetlands within Sub-Area 51-1 (illustrated on Figure 2.2.4) are considered to
be regulated Redside Dace habitat. There are no areas in the Fletcher’s Creek subcatchments in Sub-Area 51-1 considered to be regulated Redside Dace habitat.
A review of the ESA, Ontario Regulation 242/08 and Ontario Regulation 293/11 was completed
and documented by Turksta Mazza in their letter to the MNR dated
July 27, 2011. They provided an opinion if Section 23.1 of Ontario Regulation 242/08, as amended by Ontario Regulation 293/11, applies to Sub-Area 51-1. This section provides
“exemptions” from certain requirements of the Act for development and infrastructure in regulated Redside Dace habitat. This review concluded that development of the Sub-Area 51-1
lands is not subject to sub-sections 9(1) and 10(1) of the ESA with respect to Redside Dace, and therefore no permits are required from the Minister pursuant to Section 17 of the ESA. They
noted that this exemption is subject to the conditions in Section 23.1(4) of the Regulation,
including the preparation, submission and approval of a mitigation report.
In correspondence dated September 20, 2011 (provided in Appendix A-3), the MNR acknowledged that the Mount Pleasant Sub-Area 51-1 project meets the requirements of Section
23.1(1) 1 of Ontario Regulation 242/08 pursuant to the ESA. They further noted that a
mitigation plan should be prepared, submitted and reviewed by the MNR to determine if it can be approved by the MNR Aurora District Manager. Discussions with MNR Aurora are underway and
will continue post EIR and through detailed design to address requirements of mitigation plan(s). EIR recommendations will form the basis for mitigation plan(s).

Final Environmental Implementation Report Mount Pleasant Sub-Area 51-1
September 2011
12-9
The MNR has confirmed that approvals under the Lakes and Rivers Improvement Act are not
required for crossing design, where crossings form part of the formal on-line Regional Storm storage requirements.
Ministry of the Environment Ontario Water Resources Act Certificate of Approval for SWM – All infrastructure (storm sewers, sanitary sewers, and watermains) requires a Certificate of Approval from the MOE. SWM facilities
discharging into the watercourse also require MOE review and certification; this typically involves submission of detailed facility design reports demonstrating conformance to approved SWM
targets.
Ontario Water Resources Act Permit-to-Take-Water – Depending on the quantity of dewatering
required during construction, a temporary Permit to Take Water (PTTW) may be required from the MOE (for quantities that exceed 50,000 L/day). The application for a PTTW will require
supporting hydrogeological information, an assessment of potential impacts related to the dewatering, proposed monitoring and mitigation plans as well as details of the proposed location
of discharged flows.
CNR A detailed design submission including geotechnical analysis, construction methodology and
safety plan, and crossing design must be approved by the CNR for the improvements to the crossing of the East Huttonville Creek in Sub-Area 51-1. At present, as described within Section
10.5, there are two options being considered for the design of the necessary culvert upgrades.
TransCanada Pipeline/Enbridge Two parallel gas pipelines run west to east across Sub-Area 51-1, north of the CNR tracks. Due
to limited cover over these pipelines, the proposed East Huttonville Creek alignment and lowering
are constrained. Both TCPL and Enbridge must approve construction methodology within a 30m buffer of the infrastructure, including vehicle load allowance, construction techniques, and
proposed grading and erosion protection. Upon approval, a Crossing Agreement will be issued by each organization.
City of Brampton A Topsoil Stripping Permit and Construction Access Permit must be obtained from the City.
Removal of the CNR woodland will require permission from the City under the Brampton Tree Preservation By-Law 38-2006.
The various departments of the City must also approve the trail system, park design, landscaping, general site grading and servicing, including underground (storm, sanitary, and
water) and above-ground design. The City must also approve SWM facility design and maintenance plans.

Final Environmental Implementation Report Mount Pleasant Sub-Area 51-1
September 2011
12-10
Table 12.1A Summary of Permit/Approval Requirements for NHS Component Works
COMPONENTS OF NHS WORKS
PERMIT/APPROVAL REQUIREMENTS City of
Brampton
CVC DFO MNR MOE CNR TCPL Enbridge
Channel works including
relocation, lowering, grading, stabilization
and restoration and SWM pond outfalls
north of CNR to Mayfield
Topsoil
stripping permit and
approval of detailed design
drawings
Ontario
Regulation 160/06 permit
required
DFO will
proceed with one
authorization that will be
amended as required as
detailed design
progresses through the
Block Plan
Mitigation Plan
to be prepared in accordance
with requirements
of Section 23.1(4) of the
ESA; a fish
rescue permit is required
Water
Resources Act Certificate of
Approval required only
for online Regional Storm
SWM storage
N/A Approval
required for works through
their lands
Approval required for
works through their lands
Temporary diversion
channels for channel/NHS
construction north of CNR
Topsoil
stripping permit
required
Ontario
Regulation 160/06 permit
required
DFO
authorization required to
hook up the diversion
channels to enable
redirecting of flow from the
creek into the
diversion channel
Letter of
Advice required under
the Endangered
Species Act; fish rescue
permit required
N/A N/A Approval
required for any temporary
diversion works through their
lands
Approval required for
any temporary diversion works
through their lands
Removal of W10, W11, W12, W14 and W48
Topsoil stripping
permit required
Ontario Regulation
160/06 permit required
DFO authorization
required for W10, W11 and
W12 only
Letter of Advice
required under the
Endangered Species Act;
fish rescue permit
required
N/A N/A N/A N/A

Final Environmental Implementation Report Mount Pleasant Sub-Area 51-1
September 2011
12-11
PERMIT/APPROVAL REQUIREMENTS
COMPONENTS OF
NHS WORKS
City of
Brampton
CVC DFO MNR MOE CNR TCPL Enbridge
Watercourse crossings
of new roads
Topsoil
stripping permit and
approval of detailed design
drawings
Ontario
Regulation 160/06 permit
required
DFO
authorization required only if
works create a HADD
Mitigation Plan
to be prepared in accordance
with requirements
of Section 23.1(4) of the
ESA
Water
Resources Act permit
required for crossings that
form part of online SWM
N/A N/A N/A
CNR culvert improvements and
connection of upstream channel to existing
channel at CNR
Topsoil stripping
permit and approval of
detailed design drawings
Ontario Regulation
160/06 permit required
DFO authorization
required
Section 17(c) permit may be
required under the
Endangered Species Act
depending upon final
design of culvert(s);
otherwise a Mitigation Plan
is required
N/A CNR permit required
N/A N/A
James Potter storm outfall and SWM pond
outfall south of the CNR
Topsoil stripping
permit and approval of
detailed design drawings
Ontario Regulation
160/06 permit required
DFO authorization
required
Mitigation Plan to be prepared
in accordance with
requirements of Section
23.1(4) of the ESA
Water Resources Act
Certificate of Approval
required
N/A N/A N/A

Final Environmental Implementation Report Mount Pleasant Sub-Area 51-1
September 2011
12-12
PERMIT/APPROVAL REQUIREMENTS
COMPONENTS OF
NHS WORKS
City of
Brampton
CVC DFO MNR MOE CNR TCPL Enbridge
Wetland re-creation in
NHS south of Sandalwood Pkwy
Topsoil
stripping permit and
approval of detailed design
drawings
Ontario
Regulation 160/06 permit
required
N/A Mitigation Plan
to be prepared in accordance
with requirements
of Section 23.1 (4) of the ESA
N/A N/A N/A N/A
Wetland restoration
(e.g., W4)
Topsoil
stripping permit and
approval of detailed design
drawings
Ontario
Regulation 160/06 permit
required
DFO
authorization required for
W4 channel removal
Mitigation Plan
to be prepared in accordance
with requirements
of Section 23.1(4) of the
ESA; fish and wildlife rescue
permit required
N/A N/A N/A N/A
Removal/modification
of part of W9
Topsoil
stripping permit and
approval of detailed design
drawings
Ontario
Regulation 160/06 permit
required
N/A Mitigation Plan
to be prepared in accordance
with requirements
of Section 23.1(4) of the
ESA; fish and wildlife rescue
permit may be required
N/A N/A N/A N/A

Final Environmental Implementation Report Mount Pleasant Sub-Area 51-1
September 2011
12-13
PERMIT/APPROVAL REQUIREMENTS
COMPONENTS OF
NHS WORKS
City of
Brampton
CVC DFO MNR MOE CNR TCPL Enbridge
Removal of CNR
woodland
Topsoil
stripping permit and
approval of detailed design
drawings
Ontario
Regulation 160/06 permit
required
N/A N/A N/A N/A N/A N/A
City Park channel modifications
Topsoil stripping
permit and approval of
detailed design drawings
Ontario Regulation
160/06 permit required
DFO authorization
required
Mitigation Plan to be prepared
in accordance with
requirements of Section
23.1(4) of the ESA; fish and
wildlife rescue permit
required
N/A N/A N/A N/A
Foundation Drain Collector and Roof Drain
Collector outlets and bioswales
Topsoil stripping
permit and approval of
detailed design drawings
Ontario Regulation
160/06 permit required
N/A Mitigation Plan to be prepared
in accordance with
requirements of Section
23.1(4) of the ESA
Water Resources Act
Certificate of Approval
required
N/A N/A N/A
Trail System Topsoil stripping
permit and
approval of detailed design
drawings
Ontario Regulation
160/06 permit
required
DFO authorization
required only if
works create a HADD
N/A N/A N/A Trail system through TCPL
lands requires
permit
Trail system through TCPL lands requires
permit

Final Environmental Implementation Report Mount Pleasant Sub-Area 51-1
September 2011
12-14
PERMIT/APPROVAL REQUIREMENTS
COMPONENTS OF
NHS WORKS
City of
Brampton
CVC DFO MNR MOE CNR TCPL Enbridge
Dewatering for
construction, if required
N/A N/A N/A N/A PTTW required if
dewatering volumes exceed
50,000 L/day; approval for
discharge to receiving
watercourse required
N/A N/A N/A

Final Environmental Implementation Report Mount Pleasant Sub-Area 51-1
September 2011
12-15
12.4 Construction Considerations 12.4.1 Dewatering Requirements Dewatering may be required for construction along the proposed channel alignment and where
sewer trench grades and excavations encounter groundwater. There are no significant shallow aquifers in the development area (refer to Section 2.1.12) and the surficial till has relatively low
hydraulic conductivity with limited groundwater movement (refer to Sections 2.1.8.1 and
2.1.8.3). There may be local sand lenses encountered, but they are not expected to be laterally extensive, and groundwater flows in such lenses are expected to be limited by the surrounding
till materials. As such, significant high-volume dewatering is not anticipated to be required for residential construction excavations.
Site-specific dewatering requirements will be assessed at detailed design. It is noted that should
the construction contractor need to pump at rates exceeding 50,000 L/d, a temporary PTTW for
construction dewatering will be required from the MOE (refer to Section 12.3 above). The PTTW will be obtained in accordance with the provincial regulations prior to dewatering activities.
It is a requirement during any construction dewatering program that monitoring of the local
groundwater levels and surface water features (wetlands and watercourses) adjacent to the
dewatering area be conducted. Should the monitoring indicate a radius of influence that could adversely affect the groundwater levels in adjacent natural features or interfere with
groundwater supplies to local water wells, mitigation measures must be designed to compensate for the effects.
12.4.2 Water Table Lowering
Urban development has the potential to lower the groundwater table as a result of reduced infiltration. In addition, the construction of buried services below the water table has the
potential to capture and redirect groundwater flow through more permeable fill materials placed
in the base of excavated trenches, and may result in an overall lowering of the water table. There are a number of ways to mitigate this water table lowering. As discussed in Section 9.10,
LID measures to promote infiltration will be implemented in Sub-Area 51.1. In addition, services below the water table will be constructed to prevent redirection of flow. This will involve the use
of anti-seepage collars or clay plugs surrounding the pipes to provide barriers to flow to prevent drainage of groundwater flow along granular bedding and erosion of the backfill materials.
Local lowering of the water table may also occur along the proposed channel alignment, as the new channel will be lowered in selected areas compared to the existing channel elevation. As
discussed in Section 4.5.1, the potential radius of influence for water table lowering from the channel excavation is generally expected to be within the channel block, i.e., the lowering is not
anticipated to adversely affect the groundwater conditions in terrestrial features adjacent to the
channel. Given the nature of the surficial soils, however, the potential for encountering shallow layers of sand is recognized along with the potential that permanent dewatering of such layers
could potentially lower the water table under adjacent wetland features. During and post-construction, it is important to maintain the high water table conditions in the wetland areas. As
such, prior to channel construction, detailed soil investigations are recommended along the proposed alignment, focusing on the areas adjacent to the wetlands. This may involve the
excavation of test pits or drilling of boreholes to assess the soil conditions.

Final Environmental Implementation Report Mount Pleasant Sub-Area 51-1
September 2011
12-16
Where shallow coarse-grained sediment layers are encountered during the soil investigations, the potential groundwater yield from these zones will be assessed through field testing. This may
involve borehole hydraulic conductivity testing and/or short-term pumping tests to determine the need for active dewatering for channel construction as well as to assess the potential for longer-
term impacts on the local water table conditions relative to any permanent dewatering that would
occur if a permeable layer continued to drain into the channel (i.e., calculation of the potential radius of influence for water table lowering). In such circumstances, mitigation strategies for the
control of groundwater during construction and, if warranted, mitigation to prevent lowering of the water table over the long term will be required. During construction, collection and discharge
of groundwater seepage back to the wetland feature may be considered. Mitigation measures for long-term impacts may involve the installation of cutoff walls or barriers to prevent
groundwater from continuing to drain from the sand layer into the channel. Contingency plans
for construction will also be required should a zone of higher hydraulic conductivity be encountered unexpectedly during the excavations.
12.4.3 Private Well Water Supplies
The proposed development will be municipally serviced and the existing groundwater supply
wells, within the Study Area, will be decommissioned as the development proceeds. In the interim it is important to ensure that construction does not adversely affect local groundwater
supplies while the private water supply wells are still in use.
The Region of Peel requires monitoring of private wells throughout the construction period. Prior
to the commencement of earthworks and servicing construction activities, it will be necessary to contact the local residents who rely on groundwater supply wells, document the location and
condition of their wells and then monitor their well conditions (water quantity and quality) throughout the earthworks period.
The recommended monitoring program is as follows:
• For any active and accessible water supply well located within approximately 200m of the
active construction area, the water level will be measured during non-pumping conditions. A water sample will be collected at each well for analysis of background
water quality. The water analysis will include general water quality indicator parameters including chloride, nitrate, turbidity and e-coli.
• Regular water level measurements will be completed throughout the construction
activities (if the wells remain in use). The frequency of monitoring will be determined based on the proposed construction schedule.
• At the end of the earthworks, a water level measurement and a water sample will again
be collected from each of the monitored water supply wells to confirm the post-
development water quality.
• The results of the well monitoring program will be documented and a copy made
available to the Region of Peel.

Final Environmental Implementation Report Mount Pleasant Sub-Area 51-1
September 2011
12-17
12.4.4 Well Decommissioning
Prior to construction, it will be necessary to ensure that all inactive water supply wells within the development footprint have been located and properly decommissioned by a licensed water well
contractor in accordance with Ontario Regulation 903. In addition, all groundwater monitoring
and observation wells installed for this study must be decommissioned in accordance with provincial regulations prior to or during the site development, unless they are maintained
throughout the construction period for monitoring purposes.
12.5 Monitoring Program The Sub-Area 51-1 EIR recognizes the importance of implementing a short and long-term
monitoring program to gauge the success of the various components of the NHS and SWM Plan. The CFCP has provided some guidance on the monitoring of those elements that are focused on
aquatic habitat and the health of fish communities. The HFSWS Phase 3 Report (June 2011)
provides further recommendations/considerations regarding an overall program to monitor all facets of the NHS, including aquatic, terrestrial, surface water and groundwater components.
Monitoring will consist of several key aspects:
• pre-construction monitoring to establish baseline conditions (e.g., for private water supply
wells, proposed dewatering areas, etc.)monitoring during the construction phases, to
ensure the integrity of the erosion and sediment controls;
• monitoring of the implementation of the NHS and SWM to ensure that the NHS and SWM
measures have been created according to the design principles within this EIR as well as
the specific guidance within the forthcoming detailed design; and,
• monitoring the overall health of the NHS as the Mount Pleasant lands develop over time.
Each of these monitoring components are critical and, following on the Workshop approach that
has been utilized throughout the completion of this EIR, the monitoring program for Sub-Area
51-1 will be formulated through focused discussion amongst the Mount Pleasant landowners and the Agency stakeholders (separate from the EIR).

Final Environmental Implementation Report Mount Pleasant Sub-Area 51-1
September 2011
13-1
13.0 EIR SUMMARY
The EIR addresses a range of environmental and engineering matters associated with the development of the Sub-Area 51-1 lands in Mount Pleasant and provides NHS and SWM
recommendations for implementation through subsequent design and approval stages of the development process. The purpose of this section of the EIR is twofold - to summarize the many
recommendations made in previous sections of this report and to address conformity of the EIR with HFSWS matters, including HFSWS targets and recommendations.
13.1 Summary of EIR Recommendations
Tables 13.1.1 to 13.1.5 summarize the main EIR recommendations by draft plan of subdivision
and identify EIR report sections and/or drawings where additional discussion can be found on
each recommendation. The limits of each draft plan of subdivision referred to in these tables are illustrated on Figure 1.2.3.
These tables list specific NHS, SWM, or other EIR recommendations. In addition to this list, the
EIR has identified the need for further assessments of design approaches/concepts at the detailed design stage for several NHS related matters, including the following:
1. Identification of design measures to minimize transition grading of the Sandalwood Parkway into W9. Refer to discussion in Section 10.4.2.3.
2. Refinement of natural channel design of the realigned and lowered East Huttonville Creek. Refer to Section 4.0.
3. Consideration of the water table conditions along the lowered sections of watercourse,
the need for dewatering during construction, and the design of mitigation strategies for groundwater control. Refer to Section 12.4.
4. Design of the new wetland south of Sandalwood Parkway intended to replicate the ecological functions of the racetrack ponds. Refer to Sections 3.4.4 or 5.7.3.4.
5. Design of the new wetland in the “tooth” and restore wetland functions to W13, where feasible. Refer to Section 5.7.5.
6. Identification of W4 modifications and water balance. Refer to Section 6.6.4.
7. Determination of preferred design of CNR culvert improvements to increase hydraulic capacity, provide fish passage, on-line storage, etc. Refer to Section 10.5.
Broader recommendations applicable to all draft plans of subdivision include:
1. Preparation of a stand-alone monitoring plan in consultation with the City, the CVC and
the MNR. Refer to Section 12.5. 2. Preparation of a homeowner’s manual (purchaser’s brochure) to educate residents of the
elements and function of the NHS and SWM systems. Refer to Section 5.8. 3. Preparation of a NHS operations and maintenance report for City use. Refer to
Section 5.8. 4. Requirements for rigorous erosion and sediment controls during construction. Refer to
Section 12.1.
5. Identification of implementation principles for the NHS construction. A preliminary NHS construction staging and sequencing plan is provided in Section 12.2.
6. Identification of permit/approval requirements for the NHS and SWM measures. Refer to Section 12.3.

Final Environmental Implementation Report Mount Pleasant Sub-Area 51-1
September 2011
13-2
13.2 EIR Conformity with Subwatershed Study Recommendations Natural heritage management strategies and SWM recommendations from the HFSWS provided
guidance to the preparation of this EIR. As requested by the City and the CVC, the following
summaries are provided to identify how the EIR has addressed HFSWS recommendations, including measures to meet the HFSWS targets.
Table 13.2.1 reproduces portions of the final table in the HFSWS Phase 3 Report (June 2011)
entitled, Huttonville and Fletcher’s Creek Summary of Subwatershed Recommendations. Each HFSWS recommendation is listed in this table along with a brief commentary on how the EIR has
addressed each recommendation.
Table 13.2.2 reproduces HFSWS Phase 2 Report Table 4.1 entitled, Phase 2 Impact Assessment
Target Summary and 2G Plan Directives, and adds discussion on how the EIR recommendations meet each of the listed HFSWS targets.

Final Environmental Implementation Report Mount Pleasant Sub-Area 51-1
September 2011
13-3
Table 13.1.1 – Summary of NHS and SWM Recommendations - Mattamy (Credit River) Ltd. – 21T-10-013B (Properties 18, 23, 24, 25 and 29 on Figure 1.2.3)
NHS AND SWM TOPIC RECOMMENDATIONS Subwatershed Location • East Huttonville Creek and Fletcher’s Creek subwatersheds; Fletcher’s Creek subwatershed is in northeast portion of draft plan only; rest of East
Huttonville Creek subwatershed; see Figure 1.2.3
Natural Heritage System Recommendations
a) Protection of Existing Woodland(s)
and Buffers
• Protection of a portion of Wanless Woodlands A and B, and Park Woodlands A, B and C with 10m buffers
• Woodland boundaries survey complete – see Drawings 3.3.2, 3.3.3, and 3.3.4
• NHS limits to be reflected on draft plan of subdivision
b) Protection of Existing Wetland(s) and Buffers
• Protection of W7a, W7b, 13a and W13c with 20m buffers
• Wetland boundary survey complete – see Drawings 3.3.2, 3.3.3, and 3.3.4
• NHS limits to be reflected on draft plan of subdivision
c) Realigned East Huttonville Creek • Realignment of East Huttonville Creek within 70m and 100m corridors; channel block to be shown on draft plan of subdivision
• Conceptual channel design is shown on Drawings 4.6B to 4.6F; further review of design parameters to be undertaken at detailed design
d) Wetland Re-Creation/Restoration • Restoration of NHS ‘tooth’ as per recommendations of Section 5
e) Removal of Woodland or Wetland • Removal of CNR Woodland and W14 permitted as they do not form part of the NHS
f) Alteration to Wetland Inlet, Outlet or other wetland drainage conditions
• Drainage outlet from W7a and W7b to be accommodated in NHS design
• Alterations to W13a and W13b recommended as outlined in Section 6.6.13
g) Road, Trail or other Crossing of NHS • CNR culvert improvements needed for development in area of existing floodplain
• Portions of road crossing of NHS for North-South Spine Road, Buick Drive and Sandalwood Parkway exist on plan; detailed design to address sizing
requirements set out in Section 10.4.2
h) NHS Restoration Plans • NHS restoration plans to be provided as part of channel design; see Section 5
SWM Recommendations
i) SWM Pond(s) to service property • Draft Plan serviced by SWM Ponds HE-3, HE-4 and HE-5; design requirements set out in Section 9 and Drawings 9.2.4, 9.2.5 and 9.2.6. A conceptual
design for the draft plan south of CNR will be included in the draft plan approval phase for lands south of CNR. • Pond blocks to be shown on draft plan of subdivision
j) Roof Drainage to Wetland(s) • Roof drainage to be directed to bioswale in W13a buffer and discharged to W13a
k) Foundation Drain Collector • FDC outlet to creek
l) Online Regional Storm Storage • Online storage upstream of CNR (and within City park) accommodated in natural channel design
m) LID Measures • Increased topsoil depths to be implemented across site; bioswale in W13a buffer
n) Other • None
Other Recommendations
o) Drainage density lengths • Drainage density lengths to be maintained as per recommendations outlined in Section 8.0
p) Erosion and Sediment Controls • Erosion and Sediment Control plan to be prepared at detailed design
q) Monitoring • Monitoring plan to be prepared and implemented for NHS and SWM design components
r) Other • None

Final Environmental Implementation Report Mount Pleasant Sub-Area 51-1
September 2011
13-4
Table 13.1.2 – Summary of NHS and SWM Recommendations –Primont Homes (Mount Pleasant I) Inc. and Primont Homes (Mount Pleasant II) Inc . – 21T-10-014B
(Properties 32 and 35 on Figure 1.2.3)
NHS AND SWM TOPIC RECOMMENDATIONS Subwatershed Location • Draft Plan located in East Huttonville Creek subwatershed; see Figure 1.2.3
Natural Heritage System Recommendations
a) Protection of Existing Woodland(s) and Buffers
• Protection of portion of Park Woodland A with 10m buffers
• Woodland boundaries survey complete – see Drawing 3.3.4
• NHS limits to be reflected on draft plan of subdivision
b) Protection of Existing Wetland(s) and Buffers
• Protection of W9 within NHS boundary; protection of W13b with 20m buffers
• Wetland boundary survey complete – see Drawing 3.3.4
• NHS limits to be reflected on draft plan of subdivision
c) Realigned East Huttonville Creek • Realignment of East Huttonville Creek within 70m and 100m corridor; channel block to be shown on draft plan of subdivision
• Conceptual channel design is shown on Drawings 4.6D to 4.6E; further review of design parameters to be undertaken at detailed design
d) Wetland Re-Creation or Restoration • None
e) Removal of Woodland or Wetland • None
f) Alteration to Wetland Inlet, Outlet or other wetland drainage conditions
• None
g) Road, Trail or other Crossing of NHS • Road crossing of North-South Spine Road exists on plan; detailed design to address sizing requirements set out in Section 10.4.2
h) NHS Restoration Plans • NHS restoration plans to be provided as part of channel design; see Section 5
SWM Recommendations
i) SWM Pond(s) to service property • Draft Plan serviced by SWM Ponds HE-4 located north of CNR; design requirements set out in Section 9 and Drawing 9.2.5
• Pond blocks to be shown on draft plan of subdivision
j) Roof Drainage to Wetland(s) • Roof drainage to be directed to W9 via bioswale in W8 buffer
k) Foundation Drain Collector to Creek • FDC outlet to creek
l) Online Storage on property • Online Regional Storm storage upstream of CNR accommodated in natural channel design
m) LID Measures • Increased topsoil depths to be implemented across site
n) Other • None
Other Recommendations
o) Drainage density lengths • Drainage density lengths to be maintained as per recommendations in Section 8.0
p) Erosion and Sediment Controls • Erosion and Sediment Control plan to be prepared at detailed design
q) Monitoring • Monitoring plan to be prepared and implemented for NHS and SWM design components
r) Other • None

Final Environmental Implementation Report Mount Pleasant Sub-Area 51-1
September 2011
13-5
Table 13.1.3 – Summary of NHS and SWM Recommendations – Wanless Developments Inc., Northwest Brampton Developments Inc., Northwest Brampton Investments Inc. and 2044831 Ontario Inc. – 21T-10-012B
(Properties 10, 33, 34, 37, 38, 39, 40 and 41 on Figure 1.2.3)
NHS AND SWM TOPIC RECOMMENDATIONS Subwatershed Location • Draft plans located in West Huttonville Creek and East Huttonville Creek subwatersheds; See Figure 1.2.3
Natural Heritage System Recommendations
a) Protection of Existing Woodland(s)
and Buffers
• Protection of Mayfield Woodlands A and B, Wanless Woodlands A and B and Park Woodland B with 10m buffers
• Woodland boundaries survey complete – see Drawings 3.3.2 to 3.3.4
• NHS limits to be reflected on draft plan of subdivision
b) Protection of Existing Wetland(s)
and Buffers
• Protection of W4, W5, W6, W7 and portion of W13b with 20m buffers
• Wetland boundary survey complete – see Drawings 3.3.2 to 3.3.4
• NHS limits to be reflected on draft plan of subdivision
c) Realigned East Huttonville Creek • Realignment of East Huttonville Creek within 70m corridor; channel block to be shown on draft plan of subdivision
• Conceptual channel design is shown on Drawings 4.6B to 4.6E; further review of design parameters to be undertaken at detailed design
d) Wetland Re-Creation or Restoration • Re-Creation of new wetland south of Sandalwood on west side of realigned creek; See Section 6.7 for two alternative wetland concepts; further
discussion to be held with MNR/CVC/City at detailed design to confirm concept for implementation • Restoration of W4 to be implemented as per recommendations in Section 6.6.4
e) Removal of Woodland or Wetland • Removal of W48, W10, W11 and W12 permitted as they do not form part of the NHS
f) Alteration to Wetland Inlet, Outlet
or other drainage conditions
• Drainage out of W4, W5, W6, W7 and W9 to be accommodated through NHS design
g) Road, Trail or other Crossing of NHS • Road crossings NHS at Sandalwood Parkway; detailed design to address sizing requirements set out in Section 10
• Landowners Group commitment to replace wetland loss at W9 due to road construction through wetland restoration of NHS ‘tooth’ as outlined in
Section 6.6.9
h) NHS Restoration Plans • NHS restoration plans to be provided as part of channel design; see Section 5.7
SWM Recommendations
i) SWM Pond(s) to service property • Draft Plan serviced by SWM Ponds HE-1, HE-2 and HE-4; design requirements set out in Section 9 and Drawings 9.2.2, 9.2.3, and 9.2.5
• Pond blocks to be shown on draft plan of subdivision
j) Roof Drainage to Wetland(s) • RDC to be directed to bioswale in W7 buffer and discharged to W7(a-d); RDC to Mississauga Swale; RDC to W8; REC to new open water wetland
k) Foundation Drain Collector to Creek • No FDC outlet to creek
l) Online Storage on property • Online Regional Storm storage upstream accommodated in natural channel design
m) LID Measures • Increased topsoil depths to be implemented across site; some roof drainage directed to bioswale located along east side of Mississauga Road
• Other • Storm drainage on western portions of draft plan north and south of Wanless Drive are part of West Huttonville Creek/East Huttonville Creek
diversion; see Section 9.10.3 for specific recommendations
Other Recommendations
n) Drainage density lengths • Drainage density lengths to be maintained as per recommendations in Section 8.0
o) Erosion and Sediment Controls • Erosion and Sediment Control plan to be prepared at detailed design
p) Monitoring • Monitoring plan to be prepared and implemented for NHS and SWM design components
q) Other • None

Final Environmental Implementation Report Mount Pleasant Sub-Area 51-1
September 2011
13-6
Table 13.1.4 – Summary of NHS and SWM Recommendations – Paradise Homes North West Inc. – 21T-10-011B (Properties 1, 7, 11 and 12 on Figure 1.2.3)
NHS AND SWM TOPIC RECOMMENDATIONS Subwatershed Location • Draft plan located in West Huttonville Creek, East Huttonville Creek and Fletcher’s Creek subwatersheds; see Figure 1.2.3
Natural Heritage System Recommendations
a) Protection of Existing Woodland(s) and Buffers
• Protection of Mayfield Woodlands A with 10m buffers
• Woodland boundaries survey complete – see Drawings 3.3.1 and 3.3.2
• NHS limits to be reflected on draft plan of subdivision
b) Protection of Existing Wetland(s) and Buffers
• Protection of W1, W2, W3 and W4 with 20m buffers
• Wetland boundary survey complete – see Drawings 3.3.1 and 3.3.2
• NHS limits to be reflected on draft plan of subdivision
c) Realigned East Huttonville Creek • Realignment of East Huttonville Creek within 45m corridor; channel block to be shown on draft plan of subdivision
• Conceptual channel design is shown on Drawings 4.6A and 4.6B; further review of design parameters to be undertaken at detailed design
d) Wetland Re-Creation or Restoration • Restoration of W4 as per recommendations outlined in Section 6.6.4
e) Removal of Woodland or Wetland • None
f) Alteration to Wetland Inlet, Outlet or other drainage conditions
• Drainage from W1 and W2 to be accommodated through subdivision design east of woodland/wetlands
g) Road, Trail or other Crossing of NHS • Road crossing (North-South Spine Road) through NHS north of Wanless Drive; see Section 10.4.2 for design requirements
• Trails located in NHS buffers and across Mayfield Woodland A south of Mayfield Road; specific crossing location to be reviewed with City at detailed
design
h) NHS Restoration Plans • NHS restoration plans to be provided as part of channel design; see Section 5
SWM Recommendations
i) SWM Pond(s) to service property • Draft Plan serviced by SWM Ponds HE-1 and F-1 located on adjacent properties; design requirements set out in Section 9 and Drawings 9.2.1, 9.2.1A,
and 9.2.2
• Pond blocks to be shown on draft plan of subdivision
j) Roof Drainage to Wetland(s) • No requirements to direct roof drainage to wetlands; RDC to Mississauga Swale; rear lot drainage to W1 and W2
k) Foundation Drain Collector to Creek • No FDC outlet to creek
l) Online Regional Storm Storage • Online Regional Storm storage located upstream of Wanless Drive
m) LID Measures • Increased topsoil depths to be implemented across site; some roof drainage directed to bioswale located along east side of Mississauga Road
n) Other • Storm drainage on western portions of draft plan are part of West Huttonville Creek/East Huttonville Creek diversion; see Section 9.10.3 for specific
recommendations • East Huttonville Creek external drainage to be accommodated through East Huttonville Creek design; Fletcher’s Creek drainage (Pond F-1 outlet) to be
accommodated in existing storm sewer system
Other Recommendations
o) Drainage density lengths • Drainage density lengths to be as per recommendations in Section 8
p) Erosion and Sediment Controls • Erosion and Sediment Control plan to be prepared at detailed design
q) Monitoring • Monitoring plan to be prepared and implemented for NHS and SWM design components
r) Other • None

Final Environmental Implementation Report Mount Pleasant Sub-Area 51-1
September 2011
13-7
Table 13.1.5 – Summary of NHS and SWM Recommendations – Amber Fields Ltd. – 21T-10-015B (Property 8 on Figure 1.2.3)
NHS AND SWM TOPIC RECOMMENDATIONS Subwatershed Location • Draft Plan is located in both East Huttonville Creek and Fletcher’s Creek subwatersheds; plan is largely in Fletcher’s Creek
subwatershed; only westernmost portion in East Huttonville Creek subwatershed; see Figure 1.2.3
Natural Heritage System Recommendations
a) Protection of Existing Woodland(s) and Buffers • Protection of Mayfield Woodland A with 10m buffers
• Woodland boundaries survey complete – see Drawing 3.3.1
• NHS limits to be reflected on draft plan of subdivision
b) Protection of Existing Wetland(s) and Buffers • Protection of W3 and with 20m buffers
• Wetland boundary survey complete – see Drawing 3.3.1
• NHS limits to be reflected on draft plan of subdivision
c) Realigned East Huttonville Creek • Realignment of East Huttonville Creek within 70m corridor; channel block to be shown on draft plan of subdivision
• Conceptual channel design is shown on Drawings 4.6A and 4.6B; further review of design parameters to be undertaken at detailed
design
d) Wetland Re-Creation or Restoration • Restoration of W4 located partially on this plan; see restoration requirements outlined in Section 6.6.4
e) Removal of Woodland or Wetland • None
f) Alteration to Wetland Inlet, Outlet or other drainage
conditions
• Drainage from W3 to be accommodated through subdivision design
g) Road, Trail or other Crossing of NHS • No NHS road crossings on this plan
• No trail system on this plan
h) NHS Restoration Plans • NHS restoration plans to be provided as part of channel design; see Section 5.7
SWM Recommendations
i) SWM Pond(s) to service property • Draft Plan serviced by SWM Pond F-1 located on adjacent property south of Wanless west of Creditview Road; design requirements
set out in Section 9 and Drawings 9.2.1 and 9.2.1A • Pond blocks to be shown on draft plan of subdivision
j) Roof Drainage to Wetland(s) • Runoff from plan drains southeasterly away from wetlands; no roof drainage required to wetlands onsite
k) Foundation Drain Collector to Creek • FDC outlet to creek
l) Online Storage on property • Online storage accommodated in natural channel design
m) LID Measures • Increased topsoil depths to be implemented across site
Other Recommendations
n) Drainage density lengths • Drainage density lengths to be maintained by providing swales in parks / school blocks in addition to maintaining existing drainage
lengths through wetlands and providing side channels in the NHS where grading permits.
o) Erosion and Sediment Controls • Erosion and Sediment Control plan to be prepared at detailed design
p) Monitoring • Monitoring plan to be prepared and implemented for NHS and SWM design components
q) Other • None

Final Environmental Implementation Report Mount Pleasant Sub-Area 51-1
September 2011
Page 13- 8
Table 13.2.1 – EIR Conformity With HFSWS Recommendations
No. Phase 3 HFSWS Report Recommendations Block Plan, EIR and/or Program Follow-up
Action Requirement as per HFSWS Summary of How EIR Work Meets
SWS Recommendations
HYDROLOGY AND HYDRAULICS
HH1 Implement Low Impact Development Best Management Practices (LID
BMPs) on private lands as per net target capture rates (after accounting
for loss).
EIR to outline application of LID BMP capture volumes at the lot level (net of loss).
Where applicable, the specific LID BMP is to be guided by the current CVC/TRCA 2010
Guidelines.
Application of LID capture measures at the lot level are described in
Section 9.10.
HH2 Implement flood control (storage and discharge) within stormwater
management facilities.
EIR to define stormwater management facility details based on refined drainage areas
and levels of impervious coverage and determine total flood control volumes and discharge rates using SWS unitary rates.
Preliminary design of SWM ponds are provided in the EIR including
preliminary grading plans and stage/discharge/storage characteristics based on refined major/minor system design. SWS unitary rates were
applied. See Section 9.0.
HH3 Implement Regional Storm flood storage (off-line or on-line in
constructed corridors) to Pre-development Peak flow targets at Mount
Pleasant Community boundary
EIR Hydraulic model to confirm Regional Storm flood storage; control structures by
location and size; where control is a proposed roadway embankment detailed design
requirements to be cited to ensure roadway meets warrants for functional stability.
Hydraulic model has been updated to include Regional Storm online
storage. See Section 4.8.4. Requirements for detailed design to
address functional stability are noted.
HH4 Implement erosion control within stormwater management facilities as per the storage and discharge rates.
EIR to define stormwater management facility details based on refined drainage areas and levels of impervious coverage and determine total erosion control volumes and
discharge rates using unitary rates provided in the subwatershed study.
Preliminary design of SWM ponds are provided in the EIR including preliminary grading plans and stage/discharge/storage characteristics
based on refined major/minor system design. SWS unitary rates were
applied. See Section 9.0.
HH6 Convey Regional Storm peak flows within channel corridors. EIR to refine channel corridor dimensioning based on conveying the Regional Storm
peak flows.
Channel corridor dimensions have not changed from HFSWS. They
convey Regional Storm flows. Section 4.0 outlines channel dimensions. Channel grading plans are provided and will be refined through detailed
design.
HH7 Provide surface water quality treatment via a combination of LID BMPs
and stormwater management facilities.
EIR to define stormwater management facility details based on refined drainage areas
and levels of impervious coverage and determine permanent pool sizing for water
quality protection. Extended detention volumes and discharge rates to be determined using SWS unitary rates. Functional level of detail required for the LID BMPs to be
determined during the EIR stage.
Preliminary design of SWM ponds are provided in the EIR including
preliminary grading plans, permanent pool requirements and
stage/discharge/storage characteristics based on refined major/minor system design. Extended detention volumes and discharge rates from
HFSWS were used to design facilities. See Section 9.0.
HH8 Undertake municipal stormwater management retrofit and enhancement
study.
City to develop Terms of Reference for Stormwater Management Retrofit and
Enhancement Study, with an objective to work towards CVC’s zero contaminant loadings target as calculated for the Mount Pleasant Community.
Not addressed in the EIR - this HFSWS recommendation to be addressed
by others.
HH9 Encourage Schools, Places of Worship, and other Institutional (Civic) land uses to apply contemporary land use and stormwater management
BMPs.
City, CVC, and others to encourage application of contemporary practices at the Site Plan Stage.
Not addressed in the EIR - this HFSWS recommendation to be addressed by others
HH10 Encourage the use of pollution control prevention practices through
private property practices and in City operations.
City, CVC, Mount Pleasant Landowners and others to develop appropriate
communications-information package to encourage residential and business owners in
the use of pollution control practices.
Homeowners’ Manual to be prepared to provide an information package
to residential and business owners on the function of the NHS and
educate them on value/use of pollution control measures. See Section 5.8.
HH11 Implement municipal stormwater management operation and maintenance program for new stormwater management infrastructure.
City to audit its practices and develop sustainable pollution prevention practices. City will require comprehensive stormwater management operation and maintenance
program for all infrastructure at the detail design stage.
Not addressed in the EIR - this HFSWS recommendation to be addressed by others
HH12 Apply thermal impact mitigation measures in stormwater management facilities to reduce thermal loading and minimize temperature increases
via urban runoff.
EIR and detailed design to assess thermal impact mitigation measures. A number of thermal mitigation techniques were evaluated in the EIR for each individual SWM facility and contributing drainage area; refer to
Section 9.9 for details.

Final Environmental Implementation Report Mount Pleasant Sub-Area 51-1
September 2011
Page 13- 9
Table 13.2.1 – EIR Conformity With HFSWS Recommendations
No. Phase 3 HFSWS Report Recommendations Block Plan, EIR and/or Program Follow-up
Action Requirement as per HFSWS Summary of How EIR Work Meets
SWS Recommendations
HH13 Implement integrated stormwater management and sediment and erosion controls as per development staging of development.
EIR and detailed design to define staging of stormwater management and erosion controls.
Section 12 addresses implementation considerations at the EIR level. Further details will be provided at detailed design.
HH14 Develop monitoring plans and environmental management plans that address:
• Stormwater management hydraulic functionality
• Hydrologic model calibration and updating framework
• Low Impact Development BMPs effectiveness
• Water Temperature impacts
• Water Quality
• Sediment quality and quantity
EIR and detailed design to develop monitoring plans and environmental management plans, with consideration by City, CVC, MOE and MNR, with regard to long term
monitoring and NHS ownership.
A separate Monitoring Plan will be developed subsequent to the completion of the EIR in consultation with the City, CVC and MNR. The
EIR (Section 12) outlines this requirement.
HH15 Undertake research and development for future subwatershed studies. City and CVC in discussion with all stakeholders to determine on a priority sequence potential research projects.
Not addressed in the EIR - this HFSWS recommendation to be addressed by others.
STREAM MORPHOLOGY
SM1 Manage Huttonville and Fletcher’s Creeks stream reaches as per
watercourse management strategies.
EIR to demonstrate accordance with stream management approach on a reach basis. EIR work is consistent with the HFSWS watercourse management
strategies for high, medium and low constraint streams. Refer to
Section 4.0.
SM2 Rehabilitate “high” and “medium” rated reaches to improve
geomorphological and aquatic habitat conditions. (Examples of potential management practices are provided)
EIR to identify where rehabilitation measures are appropriate. NHS restoration plans, including aquatic habitat elements on the
floodplain linked to the new East Huttonville Creek and natural channel design principles for the creation/restoration of the new creek are
provided in the EIR (see Sections 4 and 5 respectively).
SM3 Create new swales to maintain drainage density targets in public lands
(NHS, schools, parks). Additional lengths of swale will need to be
sought in Fletcher’s Creek.
EIR to refine the location of new swale lengths, including opportunities for new
swales as per the watercourse management strategy such as:
• New swales within NHS buffer perimeters,
• Swales within private property ownership (residential/employment), • Low Impact Development Best Management Practices, and
• Overbank fish habitat outlets /backwaters connected to the stream
network.
Drainage density calculations are included in the EIR (Section 8)
including the identification of location/length of new swales in the NHS,
schools and parks, LID measures and overbank swales in floodplains.
SM4 Naturalize swales, where possible to facilitate natural sediment
generation.
To be considered in subsequent stages of the channel design process. Swales in channel corridors in overbank areas have been designed to be
dynamically stable which allows for the acquisition of sediment at times and also allows for the sediment transport regime to mimic a natural
regime—sediment can be picked up an deposited in the swales and then
the ultimate channel as flows rise and fall with storm events.
SM5 Apply flushing flow thresholds to maintain pool-riffle morphology of new
channels or rehabilitation of existing channels.
To be considered in subsequent stages of the channel design process. Flows used in the detailed design for the low flow channel are in excess
of the critical flows for fine sands, silts and clays (uncohesive). During the rising limb of a storm hydrograph, the critical velocity over the riffles
will be exceeded and the fine sediments will flush out. Because this is not a permanently flowing system, fines will again deposit on riffles on
the falling limb of the hydrograph, to again be entrained at the next
storm. This is a consequence of inconsistent flow in a channel that is meant to be dynamically stable with its sediment regime.

Final Environmental Implementation Report Mount Pleasant Sub-Area 51-1
September 2011
Page 13- 10
Table 13.2.1 – EIR Conformity With HFSWS Recommendations
No. Phase 3 HFSWS Report Recommendations Block Plan, EIR and/or Program Follow-up
Action Requirement as per HFSWS Summary of How EIR Work Meets
SWS Recommendations
SM6 Design new channels to maintain a defined thalweg to maintain conveyance of flow and sediment, and aquatic habitat connectivity,
during low flow conditions.
To be considered in subsequent stages of the channel design process The channel sections have a low flow thread which will allow for sediment and flow conveyance through riffles/runs providing
connectivity during times of low flow in the channel. However it should be noted that as flows recede, there will be instances where pool depths
decrease below the elevation of the next riffle crest, and the pool will
then become disconnected until the next storm event. This is a natural consequence of streams with intermittent and/or ephemeral flow
conditions.
TERRESTRIAL NHS
T2 Address feature-specific restoration and enhancement opportunities
identified in SPNHS and Implementation Principles.
EIR and detailed development plans to address identified opportunities. Section 5.0 – Natural Heritage Restoration provides feature specific
restoration design for each planned ecosystem throughout the NHS. The restoration design provides target vegetation community types,
identifies whether phasing is required, notes cover values by life form (tree, shrub, herb, etc), and describes the intended function of the
restored/new ecosystem.
T3 Assess features beyond SPNHS in accordance with City’s Vegetation Assessment Guidelines and Woodlot Development Guidelines/Woodland
Management Plan.
EIR and detailed development plans to address identified opportunities. A Vegetation Conservation Plan following City guidelines was completed by Kuntz Forestry Inc. and their report is discussed in Section 2.3.1.1 of
the EIR; a copy or their report is provided in Appendix F.
T4 Identify previously undocumented biota and habitats, and any
significant changes in status, including refinement of the management practices for defined areas of the SPNHS, as appropriate.
EIR must reflect the most current information and practices for management of
features and biota.
A substantial amount of fieldwork was completed for the EIR to provide
current information on biota and habitats. Refer to Section 2.0. This data was used in the formulation of SPNHS restoration and
management strategies.
T5 The detailed design of natural and corridor areas should include prescriptions for management based on target biota and cover for each
area.
EIR and detailed design to provide targets for cover and biota, and management prescriptions.
NHS restoration is generally consistent with the HFSWS recommendations for targets for cover and biota, with some changes as
requested by the MNR through the EIR consultation process. Refer to Section 5.0.
T6 Identify presence and status of invasive species and contemporary
solutions in management plans for individual natural features.
EIR to identify invasive species status and specific need for management strategies;
detailed design to address detailed management requirements.
Occurrence of invasive species by Natural System Integration Unit is
discussed in Sections 2.3.1.1 and 2.3.1.2 and illustrated on Figure 2.3.2. A NHS operations/maintenance/management report, to be prepared
post EIR, will include discussion on invasive species management for all draft plans of subdivision.

Final Environmental Implementation Report Mount Pleasant Sub-Area 51-1
September 2011
Page 13- 11
Table 13.2.1 – EIR Conformity With HFSWS Recommendations
No. Phase 3 HFSWS Report Recommendations Block Plan, EIR and/or Program Follow-up
Action Requirement as per HFSWS Summary of How EIR Work Meets
SWS Recommendations
T7 Qualify occurrence and status of potential and confirmed species at risk and rare species.
EIR to undertake focused field studies, as necessary, and detailed design should consider these species, and their specific needs in accordance with direction from
MNR and available Recovery Strategies(i.e. provision for habitat structures and safe road crossing); City to be provided with management strategies.
In the spring of 2011, the entire Block 51-1 lands were surveyed for Bobolink habitat and it was confirmed that the only habitat present is in
the meadow areas adjacent to Diversion Channel A. The MPLG is currently in the ESA permit process with the MNR for these lands.
Regulated Redside Dace habit has been delineated based on Ontario
Regulation 293/11. Refer to Sections 2.2.2.4 and 3.5. Channel design addresses needs of Redside Dace. Refer to Section 4.0.
Occurrence of rare species by Natural System Integration Unit is discussed in Sections 2.3.1.1 and 2.3.1.2 and illustrated on Figure 2.3.2.
A NHS operations and maintenance report, which will include discussion on management strategies for regionally and locally rare species, will be
prepared post EIR for all draft plans of subdivision.
T8 Provide feature-specific strategy to address short-, mid- and long-term objectives and targets for each natural feature, including those that are
created or restored.
The recommended status of the feature at time of assumption by the City and the recommended future management actions, recommended timing will be provided as
part of the EIR.
A description of the existing hydrological and ecological condition of natural features present is described throughout Section 2.0.
An NHS operations/maintenance/management report, which will include discussion on management strategies for each natural feature, will be
prepared post EIR for all draft plans of subdivision.
T9 Apply recommended riparian corridors as per SPNHS, subject to refinement based on EIR analysis.
EIR to reflect the most current information and finalized corridor dimensions and internal characteristics.
Channel corridor dimensions have been confirmed through EIR assessments of floodplains, meander belts, fisheries setbacks, on-line
storage needs, etc. Refer to Section 4.0.
T10 Locate main pedestrian trails generally along the periphery of the natural
heritage system. Side trails and stream crossings located and designed to avoid inherent impacts to sensitive habitats, including habitat
fragmentation.
EIR must reflect the most current information and recommendations for trail
development, placement and integration (buffers, habitat protection).
Trail alignment through the NHS is addressed in Section 3.6. Based on
spring/summer 2011 discussions with the City and CVC, trail placement in the NHS has been moved from the side slope of the new creek to the
adjacent table land. Distance between top-of-bank and start of trail to
be determined through detail design; opportunities to increase distance will be explored through increasing percent of side slope, where
feasible. Mitigative measures for trail design are provided where the trail crosses the NHS.
T11 Phase construction works to allow for bio-material salvaging at the
implementation stages, where feasible.
EIR and detailed design to identify donor/recipient locations, phasing requirements
and prescribed methods for salvage and placement at recipient sites.
Section 12.0 identifies the potential for plant salvage. For removal of
existing features (W10, W11, W12, W14 and W48 and CNR woodland), suitable plant species and material for salvage and locations for
placement within the NHS will be determined through discussions with the City and CVC.
T12 Corridors should include habitat enhancement components: floodplain
and tableland wetlands, measures to support target biota and species at risk; plantings in conformity with City standards, cover types that are
uncommon in the LSA study area; large scale establishment of woody material using cost-effective approaches; monitoring and management;
use of species native to Peel Plain and Credit River watershed.
EIR to provide strategy for establishment of natural cover in specific features and
areas; detailed design to specify implementation methods and materials.
Section 5.0 provides feature specific restoration design for each planned
ecosystem throughout the NHS; the restoration design provides target vegetation community types, identifies whether phasing is required,
notes cover values by life form (tree, shrub, herb, etc), and describes the intended function of the restored/new ecosystem.
T13 Size and design road crossing to provide safe passage for small to
medium sized wildlife species, e.g. terrestrial benches, provision of
plantings, wing walls or other measures to direct wildlife, and buffering between pedestrian uses and wildlife movement zones.
EIR to provide general dimensioning and integration measures, for integration into
detailed design.
Section 10.0 identifies crossing sizes and describes fencing placement,
plantings, signage and culvert design measures to ensure safe passage
for small to medium wildlife.

Final Environmental Implementation Report Mount Pleasant Sub-Area 51-1
September 2011
Page 13- 12
Table 13.2.1 – EIR Conformity With HFSWS Recommendations
No. Phase 3 HFSWS Report Recommendations Block Plan, EIR and/or Program Follow-up
Action Requirement as per HFSWS Summary of How EIR Work Meets
SWS Recommendations
T14 Undertake restoration and enhancement opportunities as the Implementation Principles and SPNHS, Schedule B, terrestrial and wetland
targets, Landscape Scale Analysis, terrestrial opportunities, etc
EIR to provide site-specific direction on restoration and enhancement strategies and specifications to be included in detailed design.
Section 5.0 provides feature specific restoration design for each planned ecosystem throughout the NHS; the restoration design provides target
vegetation community types, identifies whether phasing is required, notes cover values by life form (tree, shrub, herb, etc), and describes
the intended function of the restored/new ecosystem.
T15 Implement restrictive measures (e.g. dense plantings thorny or wattle-forming vegetation and fast-growing thicket-dominated wetland cover,
to prevent pedestrian access into adjoining sensitive natural features.
EIR to provide strategies and specifications to be included in detailed design. Section 3.5 provides direction (vegetative plantings, signage) to keep trail users on-trail, details to be developed at detailed design.
Homeowners’ Manual to be prepared to provide an information package to residential and business owners on the function of the NHS and
educate them on appropriate NHS/trail use.
T16 Stormwater management measures and/or passive recreation (e.g. SWM
ponds, infiltration trenches, bioswales, trails etc.) may be placed within
the buffers shown on Schedule A.
EIR to provide strategies and specifications to be included in detailed design, to
protect the ecological functions of the natural features.
Bioswales are recommended in some buffer locations adjacent to
wetland areas. Refer to Section 6.0. Trails are largely located in channel
buffers; refer to Section 3.6.
T17 Include “Green Development” objectives in the development of Mount
Pleasant Community Design Guidelines.
Finalized CDG’s to address NHS integration and functions in accordance with direction
from Subwatershed Study.
The Sub-Area 51-1 CDG document was finalized in August 2011; they it
was referenced in the preparation of the Sub-Area 51-1 EIR.
T18 Establish local water budgets for existing natural features and created
wetlands to manage natural feature hydrology.
EIR to include feature-based monitoring data, analysis, strategies and specifications,
to be included in detailed design.
Section 6.0 provides wetland monitoring data (Appendix B-6), and
analysis. Water balance analyses were completed for existing wetlands
where development is proposed or alteration to drainage patterns in the surface water subcatchments. Mitigative measures are recommended
where warranted. For the new wetland south of Sandalwood Parkway, there are two design options being explored and a water balance will be
completed for the preferred design approach during detailed design.
T19 Plan buffer grading to diversify water retention (e.g. area, depth and
hydroperiod longevity) to benefit amphibians and other ecosystems
components that are reliant on vernal systems.
EIR to include feature-based monitoring data, analysis, strategies and specifications,
to be included in detailed design.
Bioswales are recommended in some buffer locations adjacent to
wetland areas. Refer to Section 6.0.
T20 Adaptive management of natural features should be planned within a
risk management framework that assesses potential outcome scenarios, and responses.
EIR to include risk scenarios and recommended responses. A separate Monitoring Plan will be developed subsequent to the
completion of the EIR in consultation with the City, CVC and MNR. The EIR (Section 12) outlines this requirement.
T21 Monitor trails to maintain integrity and function within NHS, including
drainage management and deterrent measures.
Trail monitoring to be included in post-development monitoring up to assumption. City
to monitor trails monthly during active use seasons.
A separate Monitoring Plan will be developed subsequent to the
completion of the EIR in consultation with the City, CVC and MNR. The EIR (Section 12) outlines this requirement.
T22 Phasing of SPNHS implementation to ensure that resources remain functional throughout the development process.
EIR to include strategic plan for NHS implementation within Block Plan, with overall development phasing to place high priority on NHS implementation early in
development process.
Implementation considerations/principles and preliminary Construction Staging and Sequencing Plan is included in Section 12. The NHS
channel creation and stabilization is a high priority.
FISHERIES AND AQUATIC HABITAT
F1 Identify conservation, design and mitigation measures for the protection
and/or recovery of Redside Dace and its habitat.
To be addressed in CFCP and EIR. MNR’s participation in the CFCP and EIR processes
provides the opportunities for consultation, and it is expected that these documents
will form the basis for future review and permit documentation under the Endangered Species Act. ESA permit applications will be a separate submission and review
process.
Both the CFCP and the Sub-Area 51-1 EIR speak to the measures that
are anticipated resulting in an improvement to the regulated Redside
Dace habitat upstream of the CNR. The upgrading of the CNR culvert is an important element of this improvement, including riffle and pool
channel morphology in the new NHS, variable riparian habitat that is suited to Redside Dace as well as other warm/cool water fish species.
ESA approval process is discussed in accordance with requirements of
Ontario Regulation 293/11.

Final Environmental Implementation Report Mount Pleasant Sub-Area 51-1
September 2011
Page 13- 13
Table 13.2.1 – EIR Conformity With HFSWS Recommendations
No. Phase 3 HFSWS Report Recommendations Block Plan, EIR and/or Program Follow-up
Action Requirement as per HFSWS Summary of How EIR Work Meets
SWS Recommendations
F2 Implement aquatic biota and habitat targets. To be addressed in CFCP and EIR.
The aquatic biota targets are being met (as described within Table 13.2.2).
F5 Wetland remediation and restoration should ensure an overall net gain of fish productive capacity.
To be addressed in CFCP and EIR The final approach to the wetland remediation and restoration within W9 is still to be determined; however, the design of the new East
Huttonville channel, the connected side pools and channels in the
floodplain, as well as the design of a more diverse riffle/pool sequence in the new channel (where none presently exists), including the
anticipated additional baseflow from the SWM facilities, will all work to ensure a net gain of fish productive capacity.
F6 Detailed designs should favour the fish community that is most likely to occupy a reach, taking into account downstream impacts.
To be addressed in CFCP and EIR The design of the channel, upstream from the CNR to Wanless Drive, will have habitat features that will be suitable for the preferences of
Redside Dace, while also being suitable for the tolerant warmwater
species that our presently found in refuge pools, etc. within the East Huttonville Creek (e.g., brook stickleback, blacknose dace, and creek
chub).
F7 Prepare a CFCP that describes: the project and existing conditions;
proposed direct alterations to watercourses and headwater drainage
features; proposed site alterations with potential to affect aquatic resources, species-at-risk and fish habitat such as wetland recreation,
NHS enhancement, stormwater management practices and road and services crossings. The CFCP will scope issues related to fish habitat of
various conceptual designs for projects such as watercourse crossings, and channel lowerings and realignments, and channel remediation and
drainage feature enhancement.
To be addressed in CFCP and EIR The Final CFCP is being prepared based upon a second set of detailed
technical comments received from the CVC/DFO and the MNR as well as
two meetings to review the comments. The CFCP speaks to all the items noted in F7, including sections dedicated to the Redside Dace and
the new Ontario Regulation 293/11, which provides guidance on the delineation of regulated Redside Dace habitat.
F8 Provide Monitoring Plan for Fish and Fish Habitat that addresses principles of using standard protocols; sampling to allow a statistical analysis of the
data collected; and use of reference data.
The specifics of the monitoring program will be further developed during the preparation of the CFCP and the EIR. The final monitoring program will be prepared
at detailed design.
The issue of monitoring of aquatic habitat and the fish community within the NHS will be addressed within a larger workshop forum that will
develop a comprehensive monitoring program that deals with aquatic, terrestrial, fluvial morphology and groundwater components of the NHS.
This will occur following submission of this EIR and will include staff of
all agency stakeholders.
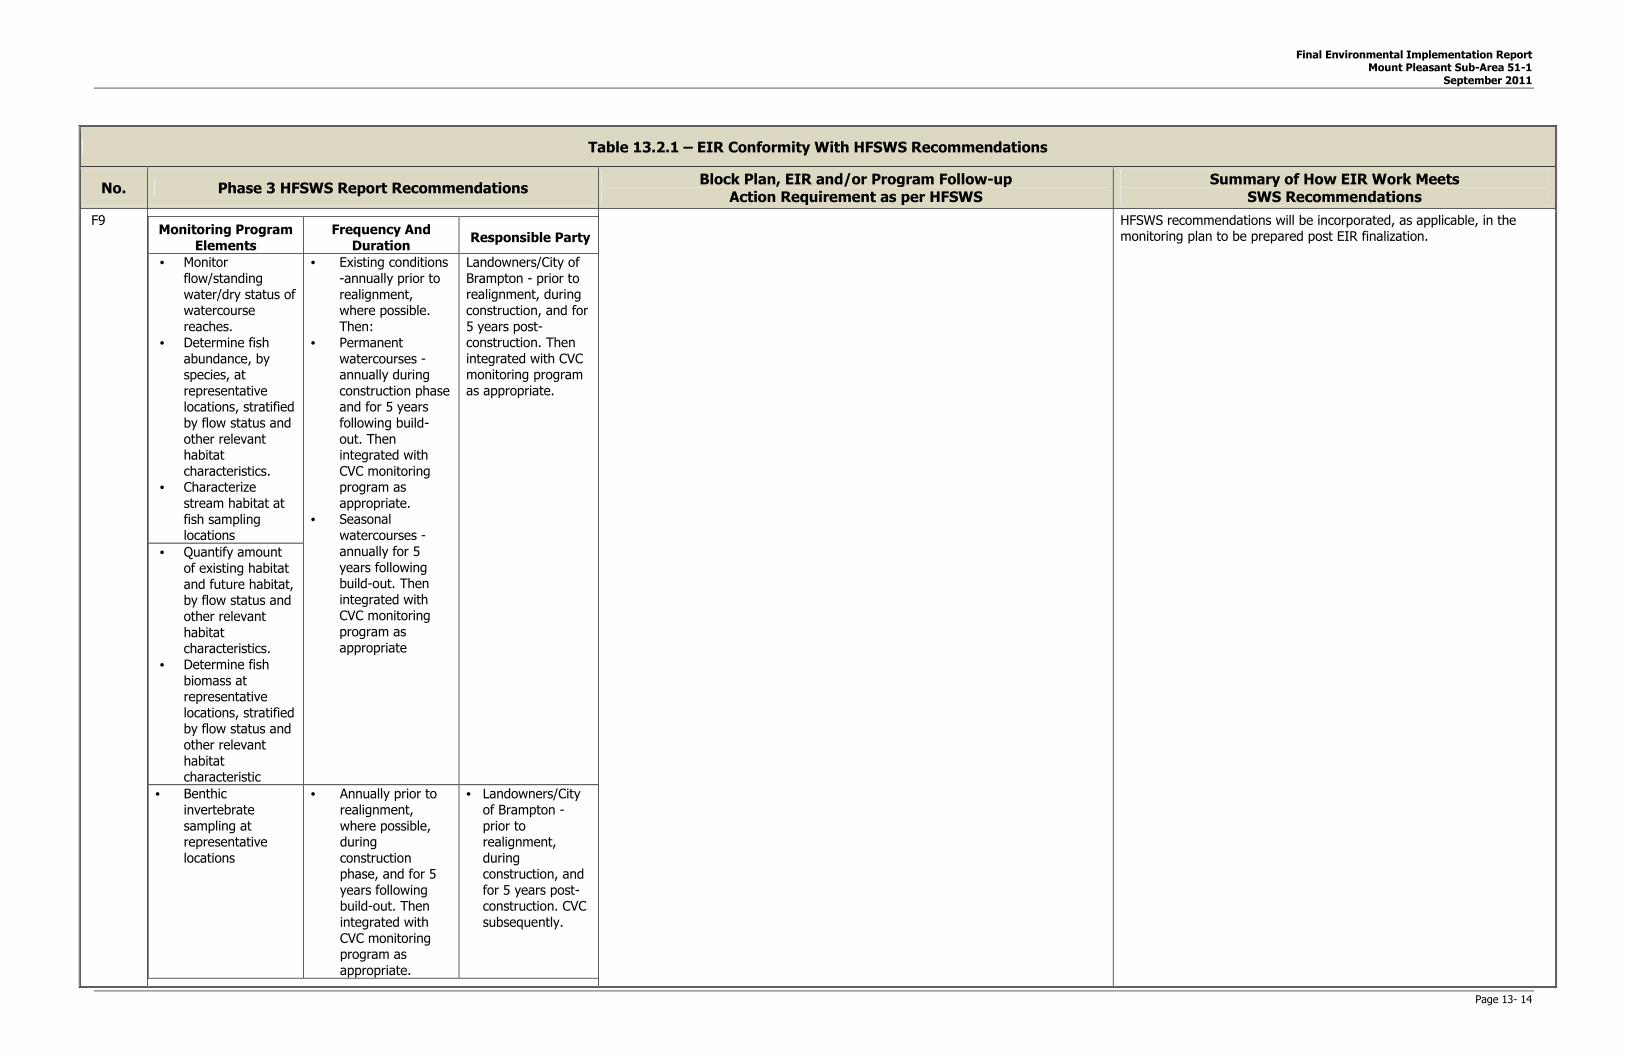
Final Environmental Implementation Report Mount Pleasant Sub-Area 51-1
September 2011
Page 13- 14
Table 13.2.1 – EIR Conformity With HFSWS Recommendations
No. Phase 3 HFSWS Report Recommendations Block Plan, EIR and/or Program Follow-up
Action Requirement as per HFSWS Summary of How EIR Work Meets
SWS Recommendations
F9
Monitoring Program
Elements
Frequency And
Duration Responsible Party
• Monitor
flow/standing
water/dry status of watercourse
reaches.
• Determine fish
abundance, by species, at
representative locations, stratified
by flow status and
other relevant habitat
characteristics. • Characterize
stream habitat at
fish sampling locations
• Existing conditions
-annually prior to
realignment, where possible.
Then:
• Permanent
watercourses - annually during
construction phase and for 5 years
following build-
out. Then integrated with
CVC monitoring program as
appropriate. • Seasonal
watercourses -
annually for 5
years following build-out. Then
integrated with CVC monitoring
program as
appropriate
Landowners/City of
Brampton - prior to realignment, during
construction, and for
5 years post-construction. Then
integrated with CVC monitoring program
as appropriate.
• Quantify amount
of existing habitat
and future habitat, by flow status and
other relevant
habitat characteristics.
• Determine fish
biomass at representative
locations, stratified by flow status and
other relevant
habitat characteristic
• Benthic
invertebrate
sampling at representative
locations
• Annually prior to
realignment,
where possible, during
construction phase, and for 5
years following build-out. Then
integrated with
CVC monitoring program as
appropriate.
• Landowners/City of Brampton -
prior to realignment,
during construction, and
for 5 years post-construction. CVC
subsequently.
HFSWS recommendations will be incorporated, as applicable, in the monitoring plan to be prepared post EIR finalization.

Final Environmental Implementation Report Mount Pleasant Sub-Area 51-1
September 2011
Page 13- 15
Table 13.2.1 – EIR Conformity With HFSWS Recommendations
No. Phase 3 HFSWS Report Recommendations Block Plan, EIR and/or Program Follow-up
Action Requirement as per HFSWS Summary of How EIR Work Meets
SWS Recommendations
• Determine which
reaches are currently occupied
by Redside Dace.
Determine Redside Dace abundance
at representative locations in the
occupied reaches.
• Annually prior to
upstream realignment,
during
construction phase, and for 5
years following build-out. Then
integrated with OMNR monitoring
program as
appropriate.
• OMNR
F11 Multi-stakeholders participation in the design and review of the
monitoring programs, to ensure its effectiveness, and recognizing that the
results may have significant implications to multiple stakeholders in the future.
City, CVC, MNR and Landowners to participate in design of monitoring program. A separate Monitoring Plan will be developed subsequent to the
completion of the EIR in consultation with the City, CVC and MNR. The
EIR (Section 12) outlines this requirement.
GROUNDWATER
G1 Implement LID management practices to manage groundwater levels
and functional linkages to wetland/terrestrial features and reach specific
discharge.
Guidance to be provided through the EIR. The LID measures to be implemented within Sub-Area 51-1 have been
described in Section 9.10. LID design requirements from the HFSWS are
addressed.
G2 Undertake site specific hydrogeologic investigations, as necessary, to
refine the local, shallow hydrostratigraphy and related groundwater flow to confirm that the installation of infrastructure (including servicing,
SWM measures, channel realignment works, foundations etc.) will not
intercept critical groundwater flow which may discharge to local receptors.
Guidance to be provided through the EIR to carry out studies at site specific design. Guidance for hydrogeological investigations for construction has been
provided in Section 12.4.
G3 Minimize compaction of the Halton Till, where practical, to maintain subtle hummocky topography to contain local runoff and promote
infiltration.
Guidance to be provided through the EIR to be applied at site specific design. Section 9.10 provides guidance on soil handling (i.e., topsoil stockpiling and redistribution) to address soil compaction. Subtle hummocky
topography will be maintained in woodlands and wetlands.
G4 Basic groundwater quality management should be considered which would
include:
• Spills management plan
• Location consideration for underground storage tanks and
mandatory groundwater quality monitoring associated with
underground storage tanks,
• The appropriate abandonment of unused water wells and
maintenance of existing water wells (Regulation 903, Ontario Water
Resources Act)
• Effectively manage road de-icing and locations of snow dumps,
• Keep an ongoing contaminant threats inventory,
• Minimize application of lawn chemicals
City and Landowners to provide plan in coordination with the Region and MOE. Generally not addressed in the EIR - this HFSWS recommendation to be
addressed by others. Section 12.4.4 speaks to decommissioning of
existing water wells.

Final Environmental Implementation Report Mount Pleasant Sub-Area 51-1
September 2011
Page 13- 16
Table 13.2.1 – EIR Conformity With HFSWS Recommendations
No. Phase 3 HFSWS Report Recommendations Block Plan, EIR and/or Program Follow-up
Action Requirement as per HFSWS Summary of How EIR Work Meets
SWS Recommendations
G5 The major groundwater discharge zone on Huttonville Creek within the study area downstream of the CNR line exists as a result of upward
gradients combined with a permeable streambed connection. This connection appears to be a combination of local sand and gravel
deposits and the connection to the bedrock. The physical attribute of
the creek must be maintained.
Guidance to be provided through the EIR There is no proposed channel realignment or lowering in the area downstream of the CNR and the physical attributes of the creek will be
maintained. Also, it is noted that LID measures to address infiltration and best management practices, to address water table lowering
throughout the upgradient areas, have been recommended in the EIR to
ensure that the overall groundwater flow system patterns are maintained (refer to Section 9.10 for recommended LIDs and Section
12.4 for construction considerations).
G6 The more detailed site specific EIR characterization will direct the number
and specific locations of monitoring sites but the following should be
considered:
• A spatially representative number of water table monitors should
be retained to assess any potential change to the water table and
larger scale groundwater flow direction.
• A number of multilevel piezometers should be included to assess
vertical gradient trends.
• An increased spatial level of groundwater monitoring should be
carried out where groundwater discharge provides a significant
function in particular in the vicinity of the perennial discharge
south of the CNR tracks.
• Spot baseflow measurements should continue.
• Spatial discretization to represent functional linkages and
potential hydrostratigraphic variation.
• Seasonal measurements are recommended with selected sites
considered for the installation of data loggers to monitor shorter
term trends.
• Annual water quality monitoring of selected well and spot
baseflow sites.
• Pre-development monitoring of spot baseflow and groundwater
levels for a minimum of two years.
• Need for coincident background natural water level trends in a
similar local physiographic setting in the absence of development
(see Fisheries Monitoring discussion).
• Need for local climate data.
• Post-development monitoring for a minimum of 5 years beyond
build out.
Continued efforts should be made in obtaining and assessing historical
and ongoing monitoring data from developed sites in a similar
physiography.
City, CVC and Landowners to design monitoring program. A separate Monitoring Plan will be developed subsequent to the
completion of the EIR in consultation with the City, CVC and MNR. The EIR (Section 12) outlines this requirement.

Final Environmental Implementation Report Mount Pleasant Sub-Area 51-1
September 2011
Page 13-17
Table 13.2.2 – How the EIR Meets SWS Targets
Objective Indicator Results System Integration
Source – Pathways – Receptors Linkage
Potential Impacts to 3G Plan
(Land Use/Management Practices)
EIR Results/Recommendations
SURFACE WATER
4c Flow Time Series Ratio of flows has been mostly maintained. Low
flow durations have been marginally reduced, while
mid-range flow durations have increased slightly. Peak
flows have been maintained
Linked impact pathways: • Stable Bed Sediment Regime (5c)
• Low Flow Function (NEW 4)
Linked impact receptors:
• Protection of Life & Property (7a & NEW 1)
• Fish Communities (16a)
• Fish Productive Capacity (16b) • Species at Risk (aquatic) (16c) • Riparian cover (15a and 15b) • Species at Risk (aquatic) (16c) • Benthic Invertebrate Community (New13)
No change required EIR designs have incorporated HFSWS recommendations for stormwater facilities and
LID design including types of facilities/measures and HFSWS unit storage
and unit discharge requirements to meet existing peak flow targets. By utilizing the
HFSWS recommendations for pond design and LID measures, the HFSWS targets have been
met.
5b Instream Erosion
Potential 2
Erosion thresholds have
been calculated for sites both within and outside of
the North West Brampton study area.
Exceedences of erosion
critical flows have been
maintained
Linked impact pathways:
• Stable Bed Sediment Regime (5c)
• Low Flow Function (NEW4)
Linked impact receptors: • Protection of Life & Property (7a & NEW 1)
• Fish Communities (16a)
• Fish Productive Capacity (16b) • Species at Risk (aquatic) (16c) • Benthic Invertebrate Community (New13)
• Riparian cover (15a and 15b)
Recommended that EIR work to be conducted (including
field verification) in order to establish final discharge rates and resident time for Erosion Control ED
HFSWS recommendations provide unit storage
and unit discharge requirements for erosion control to satisfy requirements to maintain
exceedences of erosion critical flows. By utilizing the HFSWS recommendations, the
HFSWS targets have been met.
The HFSWS recommended that additional work
be completed including field verification to establish final discharge and resident time for
erosion control for Fletcher’s Creek. This work was completed and erosion thresholds were
established to address erosion control requirements for SWM facility design in
Fletchers’ Creek.
9d-k Contaminants of
Concern
Contaminants loadings with
LID would be better than Level 1 treatment
(Enhanced Standard)
Loadings with LID would be better than Level 1 treatment
protection.
Linked impact receptors • Fish Communities (16a)
• Fish Productive Capacity (16b) • Species at Risk (aquatic) (16c) • Benthic Invertebrate Community New13)
• No change required
• End-of-pipe facilities designed to MOE Level 1 Guidelines along with at source LID BMPs exceed
current provincial guidelines for SWM. • Retrofits of either neighbourhoods at source or
existing SWM facilities (to improve performance) or
existing outfalls (to provide treatment where currently there is none) would be required to reach
CVC’s ‘zero’ annual loading objective
EIR SWM design includes end-of-pipe facilities
designed to MOE Level 1 Guidelines along with at source LID BMPs as recommended in the
HFSWS. HFSWS targets are met through the use and application of the HFSWS
recommendations.
Separate from the EIR, the City is proceeding
with a water quality retrofit study to work towards achieving a zero loading objective.

Final Environmental Implementation Report Mount Pleasant Sub-Area 51-1
September 2011
Page 13-18
Table 13.2.2 – How the EIR Meets SWS Targets
Objective Indicator Results System Integration
Source – Pathways – Receptors Linkage
Potential Impacts to 3G Plan
(Land Use/Management Practices)
EIR Results/Recommendations
7a Protection of Life
and Property
100yr flow control provided.
Regional Storm Hurricane Hazel flood control (post-
pre) results in significant volume requirements
Channel dimensioning incorporated into fluvial design to
accommodate storage.
Based on meander belt and hydraulics the following
channel corridors widths would be required: i) West - 62.5 +/-
ii) Central Eastern - 55m +/- iii) Central Western – 55m+/-
iv) Eastern – 55m+/- v) McLaughlin Road 55m+/-
EIR channel dimensions are consistent with or
greater than recommendations in the HFSWS. Channel sizing has confirmed storage volume
requirements for the Regional Storm controls. As a result, EIR channel sizing has been
addressed consistent with the HFSWS.
NEW 1 Protection of Life
and Property (2 to 100 year
Peak flows)
2 to 100 Year Post-
development Peaks meet Pre-development
Peak flows maintained, required input into fluvial design No change required EIR designs have incorporated HFSWS
recommendations for SWM including types of facilities/measures and unit storage and unit
discharge requirements to meet existing peak flow targets. By utilizing the HFSWS
recommendations, the HFSWS targets have been met. The location and number of SWM
facilities are largely consistent with HFSWS recommendations but have been refined based
on further EIR level of detail.
GROUNDWATER
8b Groundwater Discharge
Potential decreases in local groundwater discharge may
occur without LID measures. The overall baseflow
demonstrated increases based on modelled LID
measures. Various local reaches have slight gains or
losses with a general increase in more discharge
areas
Linked impact receptors: • Fish Communities (16a)
• Fish Productive Capacity (16b) • Species at Risk (aquatic) (16c) • Benthic Invertebrate Community (New 13)
No change required The EIR recommends implementation of LID measures for infiltration and construction
techniques to prevent water table lowering. In addition, there are areas where channel
lowering will occur. As such, minor increases in groundwater discharge may be anticipated.
From the perspective of in-stream aquatic habitat, any increases in groundwater
contributions would be a benefit to the maintenance of a permanent fish habitat.
8c Recharge Areas 18% decrease in recharge in both East Huttonville and
Fletcher’s Creeks without LID but potential increase
with LID
Linked impact receptors: • Fish Communities (16a)
• Fish Productive Capacity (16b) • Species at Risk (aquatic) (16c) • Benthic Invertebrate Community (New 13)
No change required The EIR recommends implementation of LID measures throughout the urban area to
promote infiltration as well as maintenance of the surface water contributions to wetlands
and terrestrial features along the NHS to maintain the recharge functions.

Final Environmental Implementation Report Mount Pleasant Sub-Area 51-1
September 2011
Page 13-19
Table 13.2.2 – How the EIR Meets SWS Targets
Objective Indicator Results System Integration
Source – Pathways – Receptors Linkage
Potential Impacts to 3G Plan
(Land Use/Management Practices)
EIR Results/Recommendations
8d Water Table
Elevations
General decrease up to
50cm without LID. Local wet features are not
groundwater derived but potential for small increase
in recharge (infiltration) out of these features.
Application of LID shows a potential increase in the
water table. No impacts to
water supply wells
Provides hydraulic gradients for linkages noted above and
maintains water levels for local domestic wells
Offset potential impact of local lowered water table by
encouraging overland drainage to existing wetland areas from both park area and ‘clean’ urban drainage (rooftops
and FDCs)
The EIR recommends implementation of LID
measures throughout the urban area to promote infiltration as well as maintenance of
the surface water contributions to wetlands and terrestrial features along the NHS to
maintain the recharge functions. In addition, the EIR outlines best management practices for
construction to prevent water table lowering along service trenches.
FISHERIES
16a Healthy fish communities,
appropriate for the habitats
Permanent Habitat Gain; Complex Contributing
Habitat Gain: Tolerant fish species will be present in
headwaters. Expect that
fish communities in lower East Huttonville and
Fletcher’s Creeks will be maintained.
Possible expansion of Redside Dace habitat
upstream
Linked impact pathways: • Flow Time Series (4c)
• Instream Erosion Potential 2 (5b)
• Stable Bed Sediment Regime (5c)
• Low Flow Function (NEW4)
• Contaminants of Concern (5d-k)
• Groundwater Discharge (8b) • Recharge Areas (8c) • Maintenance of drainage density (NEW 2)
• Protection of Property and Structures (meander belt) • Riparian Cover 1 (15a) • Riparian Cover 2 (15b)
No change required The conversion of seasonal habitat to permanent habitat will result in a significant
increase in permanent fish habitat. Minor loss of complex contributing habitat is mitigated
partially through the design and construction of
‘side slope’ swales along the NHS where feasible.
The reaches of East Huttonville Creek, from Wanless Drive downstream to and below the
CNR, is identified as regulated habitat for Redside Dace, and the NHS design has
incorporated various in-channel and riparian habitat elements that will support this species,
as well as other fish that are known to be in the creek system. While attention has been
paid to the provision of habitat components desired by Redside Dace, the tolerant
warmwater species that inhabit the East Huttonville Creek system (such as blacknose
dace, creek chub, and brook stickleback) will also benefit from the habitat diversity of the
new creek channel.
16b Overall Fish Productive Capacity
Increases in flow duration (Permanent Habitat) and
Complex Contributing Habitat, plus large increases
Linked impact pathways: • Flow Time Series (4c)
• Instream Erosion Potential 2 (5b)
• Stable Bed Sediment Regime (5c)
No change required Changes in permanent and complex contributing habitat are addressed in 16a
above. The increase in the length and duration of wetted reaches will create more

Final Environmental Implementation Report Mount Pleasant Sub-Area 51-1
September 2011
Page 13-20
Table 13.2.2 – How the EIR Meets SWS Targets
Objective Indicator Results System Integration
Source – Pathways – Receptors Linkage
Potential Impacts to 3G Plan
(Land Use/Management Practices)
EIR Results/Recommendations
in riparian buffers, expected
to result in net gain in productive capacity of
headwaters
• Low Flow Function (NEW4)
• Contaminants of Concern (5d-k)
• Groundwater Discharge (8b) • Recharge Areas (8c) • Maintenance of drainage density (NEW 2)
• Protection of Property and Structures (meander belt)
• Riparian Cover 1 (15a) • Riparian Cover 2 (15b)
opportunities to establish a benthic
invertebrate community. Compared to existing conditions that exhibit
limited to no riparian habitat, the NHS channel ranging in 45m to 100m in width, provides a
substantial increase in quality and diversity of riparian habitat.
For “coolwater” species such as northern redbelly dace and Redside Dace, the key
habitat requirements will be the ability to
supply flowing conditions with moderate temperature regimes. The present conditions
within East Huttonville Creek, where these specimens were found (i.e., HV19 and HV22),
would not be typical of the headwater/coolwater habitat often associated
with this species. The instream conditions that will suit this species include the provision of
quiescent areas of moderate, current, and effective cover like undercut banks and
overhanging shrub/grass riparian vegetation. These elements are included in channel design.
The resulting overall increase in permanent fish habitat will lead to an increase in Fish
Productive Capacity.
16c Species at Risk (Redside Dace)
Maintenance of groundwater discharge, enhanced riparian
buffers, increases in forest cover expected to benefit
Redside Dace. Potential exists for upstream
expansion of Redside Dace habitat. Water temperature
to be addressed through BMPs; Water quality meets
or exceeds Enhanced Level standard with LID measures
Linked impact pathways: • Flow Time Series (4c)
• Instream Erosion Potential 2 (5b)
• Stable Bed Sediment Regime (5c)
• Low Flow Function (NEW 4)
• Contaminants of Concern (5d-k)
• Groundwater Discharge (8b) • Recharge Areas (8c) • Maintenance of drainage density (NEW 2)
• Protection of Property and Structures (meander belt)
• Riparian Cover 1 (15a) • Riparian Cover 2 (15b)
No changes to 2G land use plan. Further refinement to upstream management practices and design during
subsequent stages (Phase 3/CFCP/EIR)
As indicated above, the design of the new East Huttonville Creek and its associated riparian
zone has been completed with a view to creating a diverse and sustainable aquatic
habitat that will be supportive of the preferences of Redside Dace. The upgrading
of the CNR culvert to create improved fish passage will provide the opportunity for
Redside Dace to move upstream. Recommended SWM design provides Enhanced
Level standard and thermal mitigation; LID measures are also proposed consistent with
HFSWS requirements to address water quality.

Final Environmental Implementation Report Mount Pleasant Sub-Area 51-1
September 2011
Page 13-21
Table 13.2.2 – How the EIR Meets SWS Targets
Objective Indicator Results System Integration
Source – Pathways – Receptors Linkage
Potential Impacts to 3G Plan
(Land Use/Management Practices)
EIR Results/Recommendations
NEW 13 Benthic
Invertebrate Community
Increases in riparian buffers
and flow duration should benefit benthic invertebrate
community. Water temperature to be
addressed through BMPs; Water quality meets or
exceeds Enhanced Level standard with LID measures
Linked impact pathways:
• Flow Time Series (4c)
• Instream Erosion Potential 2 (5b)
• Stable Bed Sediment Regime (5c) • Low Flow Function (NEW 4)
• Contaminants of Concern (5d-k)
• Groundwater Discharge (8b) • Recharge Areas (8c) • Maintenance of drainage density (NEW 2)
• Protection of Property and Structures (meander belt)
• Riparian Cover 1 (15a) • Riparian Cover 2 (15b) Linked impact receptors: • Fish Communities (16a)
• Fish Productive Capacity (16b) • Species at Risk (aquatic) (16c)
No changes to 2G land use plan. Further refinement to
management practices and design during subsequent stages (Phase 3/CFCP/EIR)
The creation of permanent fish habitat from
Wanless Road downstream to the CNR within the NHS (that incorporates increased riparian
buffers from existing conditions) will be a benefit to the benthic invertebrate community
and the extent and diversity of invertebrates should increase. This will partially be due to
the creation of a riffle/pool morphology in the new East Huttonville Creek which should
promote a broader range of insects beyond the
tolerant species that tend to inhabit intermittent and ephemeral stream systems.
FLUVIAL
NEW 2 Maintenance of drainage density
Achievement requires incorporation of
additional channel length in private lands.
Using approach similar to that demonstrated can
ensure appropriate drainage density maintained but
further channel length required to maintain overall
channel length
Linked impact pathways: • Natural Corridors & Linkages (NEW 6 & 7)
Linked impact receptors:
• Riparian cover (15a and 15b) • Fish Communities (16a)
• Fish Productive Capacity (16b) • Species at Risk (aquatic) (16c) • Benthic Invertebrate Community (New13)
Some deficiency in stream length within Fletcher’s Creek. Need to ensure incorporation of appropriate swales using
an approach similar to that demonstrated through the impact assessment. Additional swales within Fletcher’s
Creek should be sought in private lands and as part of LID BMPs
The HFSWS concluded that the drainage density targets within the East Huttonville
Creek are exceeded with the channel lengths noted in the HFSWS Phase 2 Report. The
Block Plan/EIR channel lengths exceed the channel lengths included in the HFSWS
drainage density calculations; hence, drainage density conclusions/targets from the HFSWS
are met and exceeded.
For Fletcher’s Creek, to address the stream length deficiency, the EIR identifies additional
swale lengths on public lands in accordance
with the approach set out in the HFSWS. As a result, the HFSWS target for drainage density
is met.
5c Stable Bed
Sediment Regime
Target to be applied in
later stages. Data gathered regarding
particle size distribution at three monitoring sites.
Linked impact receptors:
• Other fluvial targets • Riparian cover (15a and 15b) • Fish Communities (16a)
• Fish Productive Capacity (16b)
Creation of natural channels and swales that do not flow
through SWM facilities should help maintain stable bed sediment regime. Channel design and subsequent
channel management practices should encourage the delivery of natural sediment supply
The channel design provided in the EIR has
been modelled to ensure that bed stability occurs on a dynamic level; that is there are
expected to be minor fluctuations in bed elevation as part of natural process.

Final Environmental Implementation Report Mount Pleasant Sub-Area 51-1
September 2011
Page 13-22
Table 13.2.2 – How the EIR Meets SWS Targets
Objective Indicator Results System Integration
Source – Pathways – Receptors Linkage
Potential Impacts to 3G Plan
(Land Use/Management Practices)
EIR Results/Recommendations
Sediment characteristic of
stream on Halton Till – dominated by silt and fine
sand
• Species at Risk (aquatic) (16c) • Benthic Invertebrate Community (New 13)
Designed channel does not flow through SWM
facilities and there are undercutting and floodplain source opportunities for sediment
supply.
6a Protection of Property and
Structures
Target achieved. 2G Plan observes stream
corridor widths that take into account the meander
belt width plus erosion setbacks
Linked impact pathways: • Natural Area Protection (NEW 5)
Linked impact receptors:
• Riparian cover (15a and 15b) • Fish Communities (16a)
• Fish Productive Capacity (16b) • Species at Risk (aquatic) (16c) • Benthic Invertebrate Community (New13)
The corridor values for the Central East Channel should be increased to 55m and the West Channel to 57m. In
addition, a new corridor should be considered at the northwest corner of Mayfield and McLaughlin to connect
the drainage feature north of Mayfield to the watercourse east of McLaughlin
EIR channel dimensions are consistent with or greater than recommendations in the HFSWS.
Channel sizing has been confirmed and has addressed meander belt, setbacks, and storage
volume requirements for the Regional Storm controls. As a result, EIR channel sizing has
been addressed consistent with the HFSWS.
NEW 3 Flushing Flow
(sediment mobility)
Target to be applied in
later stages. Since the reaches within this
study area are dominantly
composed of fine sand, silt and clay, rather than coarse
material, flushing flow thresholds are not
considered applicable for these sites
Linked impact receptors:
• Fish Communities (16a)
• Fish Productive Capacity (16b) • Species at Risk (aquatic) (16c) • Benthic Invertebrate Community (New 13)
No impact to land use - to be refined/ applied in Block
Plan EIRs and detail design to inform proposed channel design where riffle features or to be created/maintained
(coarse sediment)
Riffles have been designed at sufficient
gradient to ensure sedimentation under receding hydrograph is limited. Further, the
design has modelled flows through riffles at
multiple events and velocities through the riffles are in excess of the threshold velocity for
fine sediments, thereby ensuring flushing will occur under higher in-channel flows.
NEW 4 Low flow function Target to be applied in later stages.
Existing conditions low flow functions are minimal due to
poor channel formation
Linked pathways: • Stable bed sediment regime (5c)
Linked impact receptors: • Fish Communities (16a)
• Fish Productive Capacity (16b) • Species at Risk (aquatic) (16c) • Benthic Invertebrate Community (New 13)
No impact to land use - achievement of this target will need to be demonstrated through design of the
proposed channels and swales in subsequent phases. Of key importance is maintenance of a defined thalweg
within the channel that will help maintain conveyance of flow and sediment within the lower range of flows
A low flow thread has been included in the channel design to ensure that a defined
thalweg is maintained during the lower flow regimes.
TERRESTRIAL
15a Riparian Cover 1 Target achieved under
2G Plan.
SPNHS achieves minimum 15m setbacks for
warmwater streams and 30m setbacks for
cool/coldwater streams.
Linked pathways:
• Riparian cover (15b) • Forest Cover (15c) • Wetland Cover (15d)
• Interior Forest (15e) • Natural Area Protection (NEW 5) • Natural Corridor & Linkages (NEW 6)
A wide range of riparian vegetation types are envisaged
in the SPNHS and these will require consideration in
Phase 3 and Block Plan EIRs
Riparian Cover 1 regarding buffer width from a
watercourse low flow channel is being provided
consistent with HFSWS requirements. Natural cover within the setback area will provide
increases riparian cover. Riparian vegetation types are addressed in EIR and will be further
determined at detailed design.
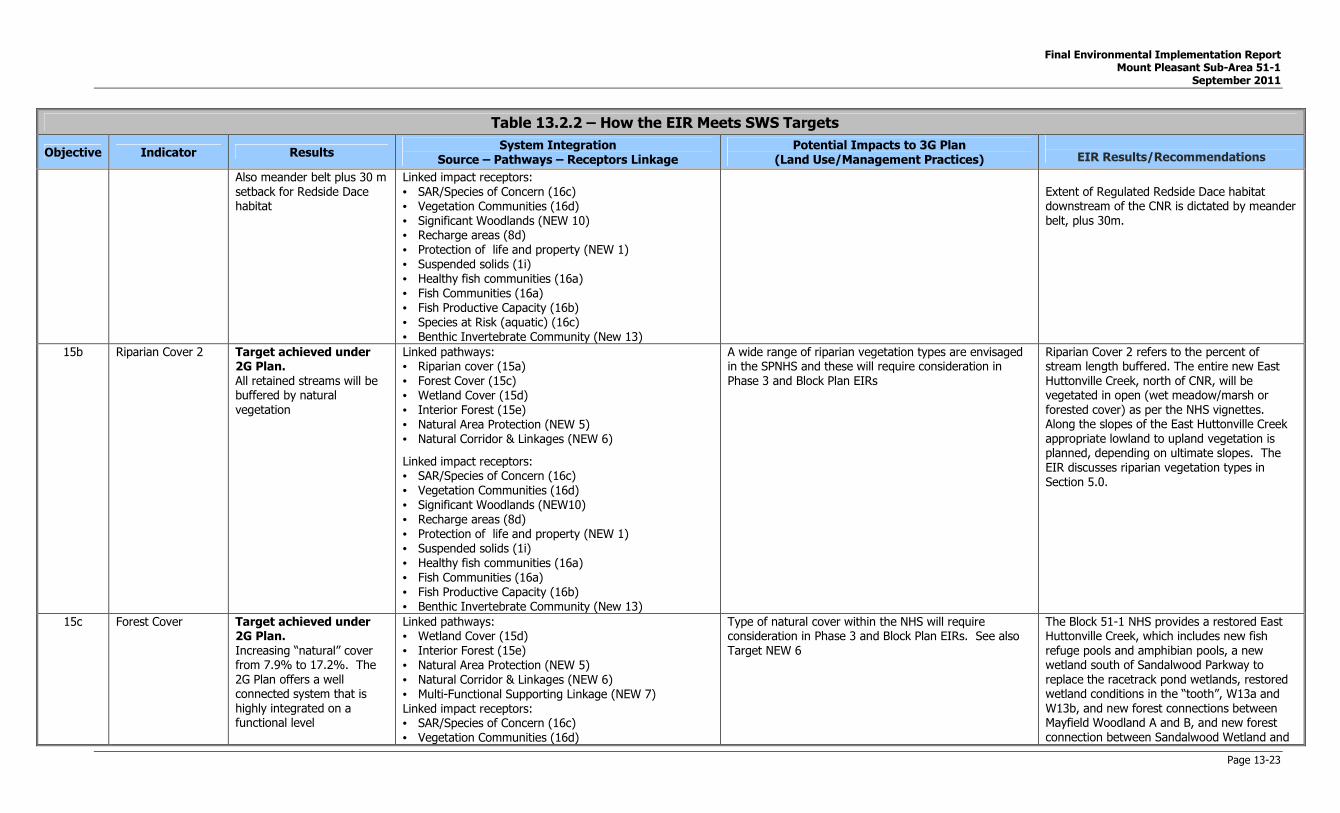
Final Environmental Implementation Report Mount Pleasant Sub-Area 51-1
September 2011
Page 13-23
Table 13.2.2 – How the EIR Meets SWS Targets
Objective Indicator Results System Integration
Source – Pathways – Receptors Linkage
Potential Impacts to 3G Plan
(Land Use/Management Practices)
EIR Results/Recommendations
Also meander belt plus 30 m
setback for Redside Dace habitat
Linked impact receptors:
• SAR/Species of Concern (16c) • Vegetation Communities (16d)
• Significant Woodlands (NEW 10) • Recharge areas (8d) • Protection of life and property (NEW 1)
• Suspended solids (1i) • Healthy fish communities (16a)
• Fish Communities (16a)
• Fish Productive Capacity (16b) • Species at Risk (aquatic) (16c) • Benthic Invertebrate Community (New 13)
Extent of Regulated Redside Dace habitat downstream of the CNR is dictated by meander
belt, plus 30m.
15b Riparian Cover 2 Target achieved under 2G Plan.
All retained streams will be buffered by natural
vegetation
Linked pathways: • Riparian cover (15a) • Forest Cover (15c) • Wetland Cover (15d)
• Interior Forest (15e) • Natural Area Protection (NEW 5)
• Natural Corridor & Linkages (NEW 6)
Linked impact receptors: • SAR/Species of Concern (16c) • Vegetation Communities (16d)
• Significant Woodlands (NEW10)
• Recharge areas (8d) • Protection of life and property (NEW 1)
• Suspended solids (1i) • Healthy fish communities (16a)
• Fish Communities (16a)
• Fish Productive Capacity (16b) • Benthic Invertebrate Community (New 13)
A wide range of riparian vegetation types are envisaged in the SPNHS and these will require consideration in
Phase 3 and Block Plan EIRs
Riparian Cover 2 refers to the percent of stream length buffered. The entire new East
Huttonville Creek, north of CNR, will be vegetated in open (wet meadow/marsh or
forested cover) as per the NHS vignettes. Along the slopes of the East Huttonville Creek
appropriate lowland to upland vegetation is planned, depending on ultimate slopes. The
EIR discusses riparian vegetation types in
Section 5.0.
15c Forest Cover Target achieved under 2G Plan.
Increasing “natural” cover from 7.9% to 17.2%. The
2G Plan offers a well connected system that is
highly integrated on a functional level
Linked pathways: • Wetland Cover (15d)
• Interior Forest (15e) • Natural Area Protection (NEW 5)
• Natural Corridor & Linkages (NEW 6)
• Multi-Functional Supporting Linkage (NEW 7)
Linked impact receptors: • SAR/Species of Concern (16c) • Vegetation Communities (16d)
Type of natural cover within the NHS will require consideration in Phase 3 and Block Plan EIRs. See also
Target NEW 6
The Block 51-1 NHS provides a restored East Huttonville Creek, which includes new fish
refuge pools and amphibian pools, a new wetland south of Sandalwood Parkway to
replace the racetrack pond wetlands, restored wetland conditions in the “tooth”, W13a and
W13b, and new forest connections between Mayfield Woodland A and B, and new forest
connection between Sandalwood Wetland and

Final Environmental Implementation Report Mount Pleasant Sub-Area 51-1
September 2011
Page 13-24
Table 13.2.2 – How the EIR Meets SWS Targets
Objective Indicator Results System Integration
Source – Pathways – Receptors Linkage
Potential Impacts to 3G Plan
(Land Use/Management Practices)
EIR Results/Recommendations
• Significant Woodlands (NEW 10)
• Recharge areas (8d) • Protection of life and property (NEW 1)
• Suspended solids (1i) • Healthy fish communities (16a)
• Baseflow in streams (8a)
• Stable bed sediment regime (5c)
City Park Woodlands.
The NHS covers approximately 97.6ha or
18.9% of Sub-Area 51-1, all of which will be restored with natural cover.
15d Wetland Cover Target achieved under 2G Plan.
Increase from 1% to 5% wetland cover
Linked pathways: • Forest Cover (15c) • Interior Forest (15e) • Natural Area Protection (NEW 5)
• Natural Corridor & Linkages (NEW 6)
• Multi-Functional Supporting Linkage (NEW7)
Linked impact receptors: • SAR/Species of Concern (16c) • Vegetation Communities (16d)
• Significant Woodlands (NEW 10)
• Recharge areas (8d) • Protection of life and property (NEW 1)
• Suspended solids (1i) • Healthy fish communities (16a)
• Stable bed sediment regime (5c)
A wide range of wetland types are envisaged in the SPNHS and these will require consideration in Phase 3
and Block Plan EIRs. See also Target NEW 5
In the Block 51-1 NHS existing forested and thicket swamps, and woodland vernal pools are
retained (W1-W9, W13) and there are numerous new wetlands planned:
• wetland south of Sandalwood Parkway to
replace racetrack pond wetlands, final design to be determined at detailed
design; • open and forested riparian communities
in the realigned East Huttonville Creek
and associated fish refuge and amphibian habitat pools in the floodplain; and,
• restored wetland conditions in the
“tooth” and W13a and W13b. Some changes from the HFSWS projected
wetland areas have resulted from Agency requests to remove the proposed open water
wetland north of Sandalwood Parkway and remove suggested vignette forested restoration
of existing W7a and W7c.
15e Interior Forest/Core
Habitat
Target achieved under
2G Plan.
Increase in Interior Forest from 0.2% to potential
maximum of 1.2%
Linked pathways
• Natural Area Protection (NEW 5)
• Natural Corridor & Linkages (NEW 6)
• Multi-Functional Supporting Linkage (NEW 7)
Linked impact receptors:
• SAR/Species of Concern (16c) • Recharge areas (8d) • Protection of life and property (NEW 1)
Ultimate interior habitat achieved is dependent upon
location and extent of forest cover added over time as
part of the Phase 3 recommendations, subsequent Block Plan EIRs, and open space management by the City
The semi-passive restoration of the “tooth” to a
future forested swamp condition will create a
large forest block that includes all of the City Park Woodlands and the “tooth” and thereby
increase interior forest habitat within the Block 51-1 NHS. Interior forest conditions will also
be increased when Mayfield Woodland A and B are connected by planned forest restoration.
16c Species At Risk and
Special Status Species
Target achieved under
2G Plan. (Redside Dace); Bobolink is a new matter to
be considered
Linked pathways:
• Forest Cover (15c) • Wetland Cover (15d)
• Natural Area Protection (NEW 5)
A wide range of habitat types are envisaged in the
SPNHS and these will require consideration in Phase 3 and Block Plan EIRs. See also Target NEW 5. Bobolink
requires consultation with MNR
The design of the new East Huttonville Creek
and its associated riparian zone has been completed with a view to creating a diverse
and sustainable aquatic habitat that will be

Final Environmental Implementation Report Mount Pleasant Sub-Area 51-1
September 2011
Page 13-25
Table 13.2.2 – How the EIR Meets SWS Targets
Objective Indicator Results System Integration
Source – Pathways – Receptors Linkage
Potential Impacts to 3G Plan
(Land Use/Management Practices)
EIR Results/Recommendations
• Natural Corridor & Linkages (NEW 6)
Linked impact receptors:
• Interior Forest (15e) • Healthy fish communities (16a)
• Vegetation Communities (16d)
• Significant Woodlands (NEW 10)
supportive of the preferences of Redside Dace.
The upgrading of the CNR culvert to create improved fish passage will provide the
opportunity for Redside Dace to move upstream. Recommended SWM design
provides Enhanced Level standard and thermal mitigation; LID measures also proposed
consistent with HFSWS requirements to address water quality.
A small area of Bobolink habitat was confirmed by MNR in 2011. The MPLG is currently in the
ESA permitting process to address overall benefit requirements of the ESA.
There was no other SAR observed on the Block
51-1 lands.
16d Vegetation
Communities
Target achieved under
2G Plan.
Linked pathways:
• Riparian cover (15a/15b) • Forest Cover (15c) • Wetland Cover (15d)
• Natural Area Protection (NEW 5) • Natural Corridor & Linkages (NEW 6)
• Multi-Functional Supporting Linkage (NEW 7)
Linked impact receptors: • Interior Forest (15e) • SAR/Species of Concern (16c) • Significant Woodlands (NEW 10)
• Suspended solids (1i) • Healthy fish communities (16a)
• Protection of life and property (NEW 1) • Stable bed sediment regime (5c)
Strategies will be necessary to manage vegetation
community diversity in the long term, through Phase 3 recommendations, Block Plan EIRs, and open space
management by the City. Community cover along riparian corridors will need to consider runoff
conveyance, fluvial and fisheries implications
The Block 51-1 NHS has an increase in number
of Ecological Land Classification vegetation types as well as area occupied by a given
vegetation type. See Section 5.0 for planned vegetation types by each restoration area
shown on the NHS vignettes.

Final Environmental Implementation Report Mount Pleasant Sub-Area 51-1
September 2011
Page 13-26
Table 13.2.2 – How the EIR Meets SWS Targets
Objective Indicator Results System Integration
Source – Pathways – Receptors Linkage
Potential Impacts to 3G Plan
(Land Use/Management Practices)
EIR Results/Recommendations
NEW 5 Natural Area
Protection
Target achieved under
2G Plan. Proposed buffer system of
10m from staked dripline of woodlands, 20m from
staked limit of wetlands, min. 15m from warmwater
streams, and 30m from cool/coldwater streams
Linked pathways:
• Riparian cover (15a/15b) • Forest Cover (15c) • Wetland Cover (15d) • Natural Corridor & Linkages (NEW 6)
• Multi-Functional Supporting Linkage (NEW 7)
Linked impact receptors: • Recharge areas (8d) • Interior Forest (15e) • SAR/Species of Concern (16c) • Vegetation Communities (16d)
• Significant Woodlands (NEW 10)
• Suspended solids (1i) • Healthy fish communities (16a)
• Protection of life and property (NEW 1)
• Stable bed sediment regime (5c)
Additional functional protection may be gained through
complementary land uses. Buffer implementation and management strategies to be addressed through
Phase 3 recommendations and Block Plan EIRs
In the Block 51-1 NHS, there is a 10m buffer
from woodland dripline, a 20m buffer from wetland boundary and a 5m buffer between
existing woodlands/ wetlands and the realigned East Huttonville Creek. Feature boundaries
were staked in the field with Agencies and are presented on EIR drawings and reflected in the
Block Plan.
The majority of the trail alignment is at the
top-of-bank of the East Huttonville Creek and not adjacent to wetlands/woodlands.
Opportunities to increase buffer between the East Huttonville Creek top-of-bank and start of
trail are to be explored at detailed design through variable channel side slopes, where
feasible.
Complementary land uses, such as SWM facilities, are located adjacent to the NHS in
appropriate locations consistent with the approved Secondary Plan.
Potential corridor habitat enhancement
opportunities (i.e., use of snags, creation of hibernacula) will be determined in NHS detailed
design.

Final Environmental Implementation Report Mount Pleasant Sub-Area 51-1
September 2011
Page 13-27
Table 13.2.2 – How the EIR Meets SWS Targets
Objective Indicator Results System Integration
Source – Pathways – Receptors Linkage
Potential Impacts to 3G Plan
(Land Use/Management Practices)
EIR Results/Recommendations
NEW 6 Natural Corridors
and Linkages
Target achieved under
2G Plan. Dedicated corridor widths of
45 to 100m, and “net corridor” widths of 145 –
450 m throughout most of the East Huttonville Creek
system; corridor widths 55-62.5 m for Fletcher’s Creek
system
Linked pathways:
• Riparian cover (15a/15b) • Forest Cover (15c) • Wetland Cover (15d) • Natural Area Protection (NEW 5)
• Multi-Functional Supporting Linkage (NEW 7)
Linked impact receptors: • Recharge areas (8d) • Interior Forest (15e) • SAR/Species of Concern (16c) • Vegetation Communities (16d)
• Significant Woodlands (NEW 10)
• Suspended solids (1i) • Healthy fish communities (16a)
• Protection of life and property (NEW 1) • Stable bed sediment regime (5c)
Locations of trails, road crossings, and planning of
corridor interfaces at Wanless Drive and Mayfield Road to be further clarified in the Block Plan EIRs
Corridor widths noted are incorporated into the
NHS design.
Road crossing locations are consistent with those envisaged at the HFSWS stage; although
specific locations adjacent to features have been determined through feature staking.
Design elements have been incorporated into the NHS to encourage small and medium
wildlife movement through the culverts and not
over roadways. Signage and vegetative planting along road alignments are planned to
alert motorists and promote safe movement of deer across roadways. See Section 10 for
wildlife design element details.
The proposed trail alignment is presented based on discussions with the City and input
from the CVC. The majority of the trail alignment is at the top-of-bank of the East
Huttonville Creek and not adjacent to wetlands/woodlands. Opportunities to increase
buffer between East Huttonville Creek top-of-bank and start of trail is being explored to
increase East Huttonville Creek, slope where feasible. See Section 3 for trail details.

Final Environmental Implementation Report Mount Pleasant Sub-Area 51-1
September 2011
Page 13-28
Table 13.2.2 – How the EIR Meets SWS Targets
Objective Indicator Results System Integration
Source – Pathways – Receptors Linkage
Potential Impacts to 3G Plan
(Land Use/Management Practices)
EIR Results/Recommendations
NEW 7 Corridor Type 2
Multi-Functional Supporting Linkage
Applied where feasible in
SPNHS. Stream corridor-based NHS reinforced
through placement of supportive land uses.
Strengthened connections northward to the existing
east-west Etobicoke Creek valley corridor in Town of
Caledon
Linked pathways:
• Riparian cover (15a/15b) • Forest Cover (15c) • Wetland Cover (15d) • Natural Area Protection (NEW 5)
• Natural Corridor & Linkages (NEW 6)
Linked impact receptors: • Recharge areas (8d) • Interior Forest (15e) • SAR/Species of Concern (16c) • Vegetation Communities (16d)
• Significant Woodlands (NEW 10)
• Suspended solids (1i) • Healthy fish communities (16a)
• Protection of life and property (NEW 1) • Stable bed sediment regime (5c)
Final locations, configurations, and specialized
components of SWM facilities (FDCs, swale compensation, habitat elements) to be further clarified in
the Block Plan EIRs
EIR provides locations, configurations and
preliminary design of SWM facilities adjacent to the NHS. Side slope swales and bioswales in
outer limits of NHS are also addressed. FDC/RDC requirements are identified.
NHS provides strengthened connections northerly into Caledon.

Final Environmental Implementation Report Mount Pleasant Sub-Area 51-1
September 2011
Page 13-29
Table 13.2.2 – How the EIR Meets SWS Targets
Objective Indicator Results System Integration
Source – Pathways – Receptors Linkage
Potential Impacts to 3G Plan
(Land Use/Management Practices)
EIR Results/Recommendations
NEW 10 Significant
Woodlands
Target achieved under
2G Plan. All Core and NAC features
retained (with a minor encroachment into one
woodland feature located along the East Huttonville
Creek corridor)
Linked pathways:
• Riparian cover (15a/15b) • Forest Cover (15c) • Wetland Cover (15d) • Natural Area Protection (NEW 5)
• Natural Corridor & Linkages (NEW 6)
Linked impact receptors: • Recharge areas (8d) • Interior Forest (15e) • SAR/Species of Concern (16c) • Vegetation Communities (16d)
• Suspended solids (1i) • Healthy fish communities (16a)
• Protection of life and property (NEW 1)
• Stable bed sediment regime (5c)
Management strategies to be proposed in the Phase 3
recommendations and subsequent Block Plan EIRs
Multi-disciplinary field studies (ie. hydrology,
terrestrial, aquatic) were completed as part of the EIR. Management strategies from HFSWS
are addressed in EIR.
The Block 51-1 NHS includes all significant woodlands identified as the suggested criteria
under the Region of Pee/Caledon Significant Woodland and Significant Wildlife Habitat Study
Report.
Woodland dripline boundaries were staked in
the field with agencies and area presented on EIR drawings and reflected in the Block Plan.
The majority of the trail alignment is at the top
of bank of EHC and not adjacent to wetlands/woodlands.
Many of the significant woodlands have
internal wetlands, and to the best extent feasible, inlets and outlets have been
maintained. Occurrence of invasive and rare species has been recorded for all woodlands
and a City operations and maintenance plan, which includes a discussion on invasive species
management will be prepared post
Note: Source of Columns 1 to 5 is from Table 4.1, Phase 2 Impact Assessment Target Summary and 2G Plan Directives, Phase 2 HFSWS Report (June 2011).

Final Environmental Implementation Report Mount Pleasant Sub-Area 51-1
September 2011
Page 1
REFERENCES
AME – Materials Engineering. Constructability of Stormwater Water Ponds, Sewers and Spine
Channel, Soils Testpit Investigation and Summary, City of Brampton, Ontario. Draft Report,
November 2008.
AME – Materials Engineering. Preliminary Geotechnical Investigation for Northwest Corner of Mississauga and Mayfield, Brampton, May 2007.
AME – Materials Engineering. Preliminary Geotechnical Investigation for Proposed Residential Subdivision on Keith Monkman Property at Northeast Corner of Creditview Road and Wanless
Drive in Brampton, Ontario, May 2007.
AME – Materials Engineering. Preliminary Geotechnical Investigation for Proposed Residential Subdivision at Northwest Corner of Mississauga Road and Mayfield Road in Brampton, Ontario,
May 2007.
AME – Materials Engineering. Preliminary Geotechnical Investigation for Proposed Residential
Subdivision on Property for Rosma Development at Southwest Corner of Creditview Road and Wanless Drive in Brampton, Ontario, May 2007.
AME – Materials Engineering. Preliminary Geotechnical Investigation for Proposed Residential Subdivision on Ralph Monkman Property at Creditview Road and Bovaird Drive West in Brampton,
Ontario, May 2007.
AME – Materials Engineering. Geotechnical Investigation, Proposed McClure 3 and 4 Subdivision
at Highway 7 and Creditview Road in Brampton, Ontario, February 2003.
AME – Materials Engineering. Geotechnical Investigation, Proposed Sharf Property Subdivision at Highway 7 and Mississauga Road in Brampton, Ontario, June 2003.
AME – Materials Engineering. Geotechnical Investigation, West Side of Creditview Road, South of
Wanless Drive in Brampton, Ontario, October 2001.
AMEC Earth & Environmental Limited. Geotechnical Investigation for Proposed Residential
Subdivision on Mississauga Road in Brampton, Ontario, October 2002.
AMEC Earth & Environmental Limited. Preliminary Geotechnical Investigation Report at Creditview
Road and Wanless Drive in Brampton, Ontario, May 2004.
AMEC Earth & Environmental Limited. Preliminary Geotechnical Investigation, Proposed Residential Subdivision at Mayfield Road, East of Creditview Road in Brampton, Ontario, June
2004.
AMEC Earth & Environmental Limited. Preliminary Geotechnical Investigation, Proposed
Residential Subdivision, Southeast Corner of Mississauga Road and Wanless Road, Brampton, August 2004.

Final Environmental Implementation Report Mount Pleasant Sub-Area 51-1
September 2011
Page 2
AMEC Earth & Environmental Limited. Preliminary Geotechnical Investigation Report, Part of West
Half of Lot 14, Concession 4, 10737 Mississauga Road in Brampton, Ontario, April 2003.
AMEC Earth & Environmental Limited. Report on Preliminary Geotechnical Investigation for
Proposed Residential Subdivision at 1930 Wanless Drive in Brampton, Ontario, May 2003.
AMEC Earth & Environmental Limited. Report on Preliminary Geotechnical Investigation for Proposed Residential Subdivision on Wanless Drive in Brampton, Ontario, January 2003.
AMEC Earth & Environmental Limited, et.al. Working Paper, Phase 2: Subwatershed Impact
Assessment Testing of the Point of Departure Plans, North West Brampton, Mount Pleasant
Community, June 2009.
AMEC Earth & Environmental Limited, et.al. Working Paper, Phase 2: Subwatershed Impact Assessment Testing of the Second Generation (2G) Land Use Plan, Mount Pleasant Community,
March 2010.
AMEC Earth & Environmental Limited, et.al. Phase 1: Subwatershed Characterization and
Integration, Huttonville and Fletcher’s Creek Subwatershed Study, December 2010.
AMEC Earth & Environmental Limited, et. al. Phase 2: Subwatershed Impact Assessment, Huttonville and Fletcher’s Creek Subwatershed Study, June 9, 2011.
AMEC Earth & Environmental Limited, et.al. Phase 3: Management Strategies and Implementation Plan, Huttonville and Fletcher’s Creek Subwatershed Study, June 2011.
Aresco, Matthew J., 2003. Highway mortality of turtles and other herpetofauna at Lake Jackson,
Florida, USA, and the efficacy of a temporary fence/culvert system to reduce roadkills. UC Davis:
Road Ecology Center. Retrieved from: http://escholarship.org/uc/item/0kr0x064.
Azous, A.L. and R.R. Horner. (Eds.), 1997. Final Report of the Puget Sound Wetlands and Stormwater Management Research Program. Seattle Washington: Washington State Department
of Ecology, Olympia, WA. King County Water and Land Resources Division and the University of
Washington.
Azous, A. L., Reinhelt, L. E., and J. Bunkey. T2000. Chapter 13: Managing Wetland Hydroperiod: Issues and Concerns. Edited by Amanda L. Azous and Richard R. Horner, Wetlands and Urbanization: Implications for the Future. Seattle, Washington: CRC Press.
BA Group. The Mount Pleasant Block 51-1 Collector Road Environmental Assessment Study and
Transportation Study, August 2011.
Bakowsky, W.D. 1996 (draft). Natural heritage resources in Ontario: S-ranks for communities in Site Regions 6 and 7. Natural Heritage Information Centre, Ontario Ministry of Natural
Resources, Peterborough. 11 pp.
Bird Studies Canada, 1994. The marsh monitoring program (MMP).
Brehm, K., 1989. The acceptance of 0.2m tunnels by amphibians during their migration to the
breeding site. Pp. 29-42. In: T. E. S. Langton (ed.) Amphibians and roads proceedings of the Toad Tunnel Conference. ACO Polymer Products, Shefford, England.

Final Environmental Implementation Report Mount Pleasant Sub-Area 51-1
September 2011
Page 3
Cadman, M.D., D.A.Sutherland, G.G.Beck, D.Lepage, and A.R.Couturier (eds.). 2007. Atlas of the Breeding Birds of Ontario, 2001-2005. Bird Studies Canada, Environment Canada, Ontario Field
Ornithologists, Ontario Ministry of Natural Resources, and Ontario Nature, Toronto, xxii + 706 pp.
Cain, A.T., Tuovila, V.R., Hewitt, D.G., and M.E. Tewes. 2003. Effects of a highway and mitigation
projects on bobcats in Southern Texas. Biological Conservation 114: 189-197.
Center For Watershed Protection. 1995. Pollutant Dynamics Within Stormwater Wetlands. I. Plant Uptake. Watershed Protection Techniques 1(4): 210-216.
Center For Watershed Protection. 1995. Wetter Is Not Always Better – Flood Tolerance of Woody
Species. Watershed Protection Techniques 1(4): 208-210.
Center For Watershed Protection. 2000. The Impact of Stormwater on Puget Sound Wetlands.
Watershed Protection Techniques 3(2): 670-675.
Chapman, L.J. and D.F. Putnam, 1984. The Physiography of Southern Ontario, Third Edition;
Ontario Geological Survey, Special Volume 2, 270p. Accompanied by Map 2715.
City of Brampton, Official Plan, 2008.
City of Brampton, Mount Pleasant Secondary Plan, 2010.
Coleman, J.S., S.A. Temple and S.R. Craven, 1997. Cats and Wildlife: A Conservation Dilemma.
Wisconsin Cooperative Extension, Madison W1
Committee on the Status of Endangered Wildlife in Canada (COSEWIC), 2007. COSEWIC assessment and update status report on the redside dace Clinostomus elongatus in Canada.
Committee on the Status of Endangered Wildlife in Canada. Ottawa.
Conservation Ontario. Integrated Watershed Management – Water Budget Overview, October,
2009.
Cooke, S . and A. L. Azous. 2000. Chapter 3: Characterization of Puget Sound Basin Palustrine
Wetland Vegetation. Edited by Amanda L. Azous and Richard R. Horner, Wetlands and Urbanization: Implications for the Future. Seattle, Washington: CRC Press.
Cooke, S . and A. L. Azous. 2000. Chapter 10: The Hydrologic Requirements of Common Pacific
Northwest Wetland Plant Species. Edited by Amanda L. Azous and Richard R. Horner, Wetlands and Urbanization: Implications for the Future. Seattle, Washington: CRC Press.
COSEWIC 2010. COSEWIC assessment and status report on the Bobolink Dolichonyx oryivorus in Canada. Committee on the Status of Endangered Wildlife in Canada. Ottawa. I + 42 pp.
(www.sararegistry.gc.ca/status/status_e.cfm).
COSEWIC. 2011. Species at Risk Registry. Accessed September 25, 2011. Available online:
http://www.sararegistry.gc.ca/.
Credit Valley Conservation, Thermal Impacts of Urbanization including Preventative and Mitigation Techniques, draft, December 2010

Final Environmental Implementation Report Mount Pleasant Sub-Area 51-1
September 2011
Page 4
Dexel, R. 1989. Investigations into the protection of migrant amphibians from the threats from road traffic in the Federal Republic of Germany: a summary. Pp. 43-49 In T.E.S. Langton (ed.)
Amphibians and Roads, proceedings of the toad tunnel conference. ACO Polymer Products, Shefford, England.
Dobbyn, J. 1994. Atlas of the Mammals of Ontario. Federation of Ontario Naturalists. 120pp.
Dodd, C. K. Jr., W. J. Barichivich, and L. L. Smith. 2004. Effectiveness of a barrier wall and culverts in reducing wildlife mortality on a heavily traveled highway in Florida. Biological
Conservation 118: 619-631.
Dougan & Associates. Draft North West Brampton Landscape Scale Analysis in Support of the
Mount Pleasant Secondary Plan Subwatershed Study, August 2007.
Ehrenfeld, J. G. (2000), Defining the Limits of Restoration: The Need for Realistic Goals. Restoration Ecology, 8: 2–9.
Entra Consultants and Philips Engineering. Sandalwood Parkway Extension from Creditview Road to Mississauga Road Class Environmental Assessment – Environmental Study Report, September
2010.
Environment Canada. Canadian Climate records 1971-2010, Pearson International Airport, Ontario.
Environmental Guide for Wildlife in the Oak Ridges Moraine, October 2006. Ministry of Transportation Ontario.
Eriksson, O., A. Sjolund, and C. Andren. 2000. Amphibians and Roads. Vagverket, Swedish
National Road Administration Publication 7.
Foresman, K.R. 2004. The effects of highways on fragmentation of small mammal populations
and modifications of crossing structures to mitigate such impacts. Report by the Division of Biological Sciences. University of Montana for the Montana Department of Transportation,
Helena, Montana, 39 pp.
Forman, R.T.T., D. Sperling, J.A. Bissonette, A.P Clevenger, C.D. Cutshall, V.H. Dale, L. Fahrig, R.
France, C.R. Goldman, K. Heanue, J.A. Jones, F.J. Swanson, T. Turrentine and T.C. Winter. 2003. Road Ecology: Science and Solutions. Island Press. Washington, D.C., 481 pp.
Gagnon + Law Urban Planners, Growth Management Staging and Sequencing Strategy Report –
Mount Pleasant Secondary Plan Block Plan Area 51-1, August 2011.
Geomorphic Solutions, 2009. Guidance Document: Application of Fluvial Geomorphology in
Common Submissions.
Golder Associates. IWA Landfill Site Search Peel Region – Step 6 Hydrogeological Report Site B-
22d, December, 2003.
Golder Associates. IWA Landfill Site Search Peel Region – Step 6 Hydrogeological Report Site B-15b, December, 2003.

Final Environmental Implementation Report Mount Pleasant Sub-Area 51-1
September 2011
Page 5
Golder Associates. IWA Landfill Site Search Peel Region – Step 6 Hydrogeological Report Site B-
21c, December, 2003.
Greater Toronto Area Conservation Authorities. Erosion and Sediment Control Guidelines, May 2006.
Guidelines for Developing and Managing Ecological Restoration Projects, 2nd Edition. Andre Clewell, John Rieger, and John Munro. December 2005. www.ser.org and Tucson: Society for
Ecological Restoration International.
Havinga, D. and J.M. Daigle. 1996. Restoring Nature’s Place. A Guide to Naturalizing Ontario Parks and Greenspace. Ecological Outlook and Ontario Parks Association. Schomberg, Ontario.
Higgs, E. S., 1997. What is Good Ecological Restoration? Conservation Biology, 11: 338–348.
Higgs, E., 2003. Nature by design: people, natural process and ecological restoration. MIT Press, Cambridge, Massachusetts, USA.
Jackson, S. D. 1996. Underpass systems for amphibians. Pp. 224-227. In G.L. Evink, P. Garrett, D. Zeigler and J. Berry (eds.), Trends in Addressing Transportation Related Wildlife Mortality,
Proceedings of the Transportation Related Wildlife Mortality Seminar. Florida Department of Transportation, Tallahassee, Florida.
Jackson, S. D., 1999. Overview of transportation related wildlife problems. Pp. 1-4. In: G.L.
Evink, P. Garrett, D. Zeigler and J. Berry (eds.), Proceedings of the International Conference on
Wildlife Ecology and Transportation. State of Florida Department of Transportation, Tallahassee, Florida. FL-ER-73-99.
Jochimsen, D.M., Peterson, C. R., Andrews, K.M., and J. Whitfield Gibbons. 2004. A Literature
Review of the Effects of Roads on Amphibians and Reptiles and the Measures Used to Minimize
Those Effects. Idaho Fish and Game Department USDA Forest Service. 78 pp.
Karrow, P., 1991. Quaternary Geology, Brampton Area (Map P3171).
Kays, R.W. and A.A. DeWan. 2004. Ecological Impact of Inside/Outside House Cats Around a
Suburban Nature Preserve. Animal Conservation.
Krikowski, L., 1989. The 'light and dark zones': two examples of tunnel and fence systems. Pp 89-91. In T. E. S. Langton (ed.), Amphibians and Roads Proceedings of the Toad Tunnel
Conference. ACO Polymer Products, Shefford, England.
Langton, T.E.S. 1989. Tunnels and temperature: results from a study of a drift fence and tunnel
system at Henley-on-Thames, Buckinghamshire, England. Pp. 145-152 In T.E.S. Langton (ed.) Amphibians and Roads, proceedings of the toad tunnel conference. ACO Polymer Products,
Shefford, England.
Lee, H.T., W.D. Bakowsky, J. Riley, J. Bowles, M. Puddister, P. Uhlig and S. McMurrey. 1998.
Ecological Land Classification for Southern Ontario: First Approximation and its Application.
Ontario Ministry of Natural Resources. Southcentral Science Section, Science Development and Transfer Branch. SCSS Field Guide FG-02.

Final Environmental Implementation Report Mount Pleasant Sub-Area 51-1
September 2011
Page 6
Natural Heritage Information Centre (NHIC). 2011. Provincial status of plants, wildlife and vegetation
communities databases. Ontario Ministry of Natural Resources, Peterborough. Available online: http://www.mnr.gov.on.ca/MNR/nhic/nhic.html/.
North-South Environmental Inc., Dougan & Associates and Sorenson Gravely Lowes. 2009. Peel-Caledon Significant Woodlands and Significant Wildlife Habitat Study. Report prepared for the Region of Peel and the Town of Caledon, Ontario. xi + 187 pp + app. Oldham, M. J., W. D. Bakowsky and D. A. Sutherland. 1995. Floristic quality assessment for
southern Ontario. Natural Heritage Information Centre, Peterborough. 68 pp. Oldham, M.J., and S.R. Brinker. 2009. Rare Vascular Plants of Ontario, Fourth Edition. Natural
Heritage Information Centre, Ontario Ministry of Natural Resources. Peterborough, Ontario. 188
pp.
OMNR, 2011: Redside Dace (Clinostomus elongates) in Ontario. Ontario Recovery Strategy Series. Queen’s Printer for Ontario.
Ontario Geological Survey. 1991. Bedrock Geology of Ontario, southern sheet, Ontario Geological Survey, Map 2544, scale 1:1,000,000.
Ontario Geological Survey. 2003. Surficial Geology of Southern Ontario: Ontario Geological
Survey – Miscellaneous Release Data 128.
Ontario Ministry of the Environment. Storm Water Management Planning and Design Manual,
March 2003.
Ontario Ministry of Environment and Energy. Ontario Drinking Water Standards, Revised January 2001.
Ontario Ministry of the Environment. Water Well Records.
Ontario Ministry of Natural Resources. 2011. Species at Risk in Ontario website, List dated June 8, 2011.
Ontario Ministry of Natural Resources. 2010. Natural Heritage Reference Manual for Policy 2.3 of the Provincial Policy Statement. Ontario Ministry of Natural Resources 245 pp.
Ontario Ministry of Natural Resources. 2000. Significant Wildlife Habitat Technical Guide. Fish and
Wildlife Branch, Wildlife Section, Science Development and Transfer Branch, Southcentral Sciences Section. 151 pp.
The Ontario Gazette; e-Laws, July 9, 2001. Ontario Regulation 293/11 made under the Endangered Species Act. Amending Ontario Regulation 242/08.
Ontario Ministry of Natural Resources. Southern Ontario Wetland Evaluation Manual, December
2002.
Ontario Ministry of Natural Resources (MNR) 2011. Draft Guideline for Development Activities in
Redside Dace Protected Habitat. OMNR, Peterborough, ON. Ii-42pp
Ontario Ministry of Natural Resources. 2010a. Recovery Strategy for Redside Dace in Ontario. Queens Printer for Ontario, Toronto ON. 29pp.

Final Environmental Implementation Report Mount Pleasant Sub-Area 51-1
September 2011
Page 7
Ontario Road Ecology Group, Toronto Zoo. 2010. A Guide to Road Ecology in Ontario, prepared for the Environmental Canada Habitat Stewardship Program for Species at Risk.
Parish Geomorphic, 2004. Redside Dace Recovery Strategy Fluvial Geomorphology Study.
Philips Engineering Limited. Draft Phase 1: Subwatershed Characterization and Integration Report, December 2007.
Reinhelt, L.E., Taylor, B. and R.R. Horner. 2000. Chapter 1: Morphologoy and Hydrology. Edited
by Amanda L. Azous and Richard R. Horner, Wetlands and Urbanization: Implications for the Future. Seattle, Washington: CRC Press.
Reinhelt, L.E., and B. Taylor. 2000. Chapter 8: Effects of Watershed Development on Hydrology. Edited by Amanda L. Azous and Richard R. Horner, Wetlands and Urbanization: Implications for the Future. Seattle, Washington: CRC Press.
RISC (Resources Inventory Standards Committee). 1998. BC Ministry of Environment, Lands and
Parks, Resources Inventory Branch for the Terrestrial Ecosystems Task Force Resources Inventory Committee.
Rodriguez, A, Crema, G., and M. Delibes. 1996. Use of non-wildlife passages across a high speed
railway by terrestrial vertebrates. Journal of Applied Ecology 33: 1527-1540.
Savanta Inc. October 2011. Comprehensive Fisheries Compensation Plan.
R. J. Burnside and Associates Limited. Infrastructure Servicing Study, Mount Pleasant Secondary
Plan, Block 51, May 2008.
Savanta Inc. North West Brampton Wildlife Summary Report, March 2009.
Savanta Inc. Mount Pleasant Conceptual Fisheries Compensation Plan, January 2011.
Semlitsch, R. D., 2000. Principles for management of aquatic-breeding amphibians. Journal of
Wildlife Management 64: 615-631.
Shad & Associates Inc. Geotechnical Investigation Report, Proposed Stormwater Management
Ponds and Culvert Crossings for Mount Pleasant Community, Block 51-1 in Brampton, Ontario – Draft Report, December 2010.
Shad & Associates Inc. Topsoil Test Pit Investigation for Block Plan 51-1 in Brampton, Ontario,
July 2010.
Society for Ecological Restoration International Science & Policy Working Group. 2004. The SER
International Primer on Ecological Restoration. www.ser.org & Tucson: Society for Ecological Restoration International.
Soil Engineers Ltd. A Soil Investigation for Proposed Creditview Citywide Park at Creditview Road and Sandalwood Parkway in Brampton, Ontario, November 2003.
Soil Engineers Ltd. A Soil Investigation for Proposed Residential Subdivision at Mayfield Road and
Creditview Road in Brampton, Ontario, November 2004.

Final Environmental Implementation Report Mount Pleasant Sub-Area 51-1
September 2011
Page 8
Soil Engineers Ltd. A Soil Investigation for Proposed Residential Subdivision at the Northwest Quadrant of Creditview Road and Wanless Drive in Brampton, Ontario, August 2004.
Soil Engineers Ltd. A Soil Investigation for Proposed Residential Subdivision, Part of Lot 17,
Concession 2, WHS, 11624 McLaughlin Road, Brampton, Ontario, June 2003.
Soil Engineers Ltd. A Soil Investigation for Proposed Residential Subdivision, Part of Lot 17,
Concession 2, WHS, West Side of McLaughlin Road, Brampton, Ontario, June 2003.
Soil Engineers Ltd. A Soil Investigation for Proposed Residential Development, Part of Lot 17, Concession 3, WHS, East Side of Creditview Road, Brampton, Ontario, June 2003.
STAL. Mount Pleasant Block 51-1 Community Design Guidelines, January 2011.
Stonybrook Consulting et al., Scoped Environmental Implementation Report, Mount Pleasant Block 51-1, August 2010.
Veenbaas, G. and J. Brandjes. 1999. Use of fauna passages along waterways and under highways. Pp. 253-258 In G.L. Evink, P. Garrett, and D. Zeigler (eds.). Proceedings of the Third International Conference on Wildlife Ecology and Transportation. FL-ER-73-99. Florida Department of Transportation, Tallahassee, Florida.
Yanes, J., M. Velasco, and F. Suarez. 1995. Permeability of roads and railways to vertebrates:
The importance of culverts. Biological Conservation 71: 217-222.

Final Environmental Implementation Report Mount Pleasant Sub-Area 51-1
September 2011
Page 1
REFERENCES
AME – Materials Engineering. Constructability of Stormwater Water Ponds, Sewers and Spine
Channel, Soils Testpit Investigation and Summary, City of Brampton, Ontario. Draft Report,
November 2008.
AME – Materials Engineering. Preliminary Geotechnical Investigation for Northwest Corner of Mississauga and Mayfield, Brampton, May 2007.
AME – Materials Engineering. Preliminary Geotechnical Investigation for Proposed Residential Subdivision on Keith Monkman Property at Northeast Corner of Creditview Road and Wanless
Drive in Brampton, Ontario, May 2007.
AME – Materials Engineering. Preliminary Geotechnical Investigation for Proposed Residential Subdivision at Northwest Corner of Mississauga Road and Mayfield Road in Brampton, Ontario,
May 2007.
AME – Materials Engineering. Preliminary Geotechnical Investigation for Proposed Residential
Subdivision on Property for Rosma Development at Southwest Corner of Creditview Road and Wanless Drive in Brampton, Ontario, May 2007.
AME – Materials Engineering. Preliminary Geotechnical Investigation for Proposed Residential Subdivision on Ralph Monkman Property at Creditview Road and Bovaird Drive West in Brampton,
Ontario, May 2007.
AME – Materials Engineering. Geotechnical Investigation, Proposed McClure 3 and 4 Subdivision
at Highway 7 and Creditview Road in Brampton, Ontario, February 2003.
AME – Materials Engineering. Geotechnical Investigation, Proposed Sharf Property Subdivision at Highway 7 and Mississauga Road in Brampton, Ontario, June 2003.
AME – Materials Engineering. Geotechnical Investigation, West Side of Creditview Road, South of
Wanless Drive in Brampton, Ontario, October 2001.
AMEC Earth & Environmental Limited. Geotechnical Investigation for Proposed Residential
Subdivision on Mississauga Road in Brampton, Ontario, October 2002.
AMEC Earth & Environmental Limited. Preliminary Geotechnical Investigation Report at Creditview
Road and Wanless Drive in Brampton, Ontario, May 2004.
AMEC Earth & Environmental Limited. Preliminary Geotechnical Investigation, Proposed Residential Subdivision at Mayfield Road, East of Creditview Road in Brampton, Ontario, June
2004.
AMEC Earth & Environmental Limited. Preliminary Geotechnical Investigation, Proposed
Residential Subdivision, Southeast Corner of Mississauga Road and Wanless Road, Brampton, August 2004.

Final Environmental Implementation Report Mount Pleasant Sub-Area 51-1
September 2011
Page 2
AMEC Earth & Environmental Limited. Preliminary Geotechnical Investigation Report, Part of West
Half of Lot 14, Concession 4, 10737 Mississauga Road in Brampton, Ontario, April 2003.
AMEC Earth & Environmental Limited. Report on Preliminary Geotechnical Investigation for
Proposed Residential Subdivision at 1930 Wanless Drive in Brampton, Ontario, May 2003.
AMEC Earth & Environmental Limited. Report on Preliminary Geotechnical Investigation for Proposed Residential Subdivision on Wanless Drive in Brampton, Ontario, January 2003.
AMEC Earth & Environmental Limited, et.al. Working Paper, Phase 2: Subwatershed Impact
Assessment Testing of the Point of Departure Plans, North West Brampton, Mount Pleasant
Community, June 2009.
AMEC Earth & Environmental Limited, et.al. Working Paper, Phase 2: Subwatershed Impact Assessment Testing of the Second Generation (2G) Land Use Plan, Mount Pleasant Community,
March 2010.
AMEC Earth & Environmental Limited, et.al. Phase 1: Subwatershed Characterization and
Integration, Huttonville and Fletcher’s Creek Subwatershed Study, December 2010.
AMEC Earth & Environmental Limited, et. al. Phase 2: Subwatershed Impact Assessment, Huttonville and Fletcher’s Creek Subwatershed Study, June 9, 2011.
AMEC Earth & Environmental Limited, et.al. Phase 3: Management Strategies and Implementation Plan, Huttonville and Fletcher’s Creek Subwatershed Study, June 2011.
Aresco, Matthew J., 2003. Highway mortality of turtles and other herpetofauna at Lake Jackson,
Florida, USA, and the efficacy of a temporary fence/culvert system to reduce roadkills. UC Davis:
Road Ecology Center. Retrieved from: http://escholarship.org/uc/item/0kr0x064.
Azous, A.L. and R.R. Horner. (Eds.), 1997. Final Report of the Puget Sound Wetlands and Stormwater Management Research Program. Seattle Washington: Washington State Department
of Ecology, Olympia, WA. King County Water and Land Resources Division and the University of
Washington.
Azous, A. L., Reinhelt, L. E., and J. Bunkey. T2000. Chapter 13: Managing Wetland Hydroperiod: Issues and Concerns. Edited by Amanda L. Azous and Richard R. Horner, Wetlands and Urbanization: Implications for the Future. Seattle, Washington: CRC Press.
BA Group. The Mount Pleasant Block 51-1 Collector Road Environmental Assessment Study and
Transportation Study, August 2011.
Bakowsky, W.D. 1996 (draft). Natural heritage resources in Ontario: S-ranks for communities in Site Regions 6 and 7. Natural Heritage Information Centre, Ontario Ministry of Natural
Resources, Peterborough. 11 pp.
Bird Studies Canada, 1994. The marsh monitoring program (MMP).
Brehm, K., 1989. The acceptance of 0.2m tunnels by amphibians during their migration to the
breeding site. Pp. 29-42. In: T. E. S. Langton (ed.) Amphibians and roads proceedings of the Toad Tunnel Conference. ACO Polymer Products, Shefford, England.

Final Environmental Implementation Report Mount Pleasant Sub-Area 51-1
September 2011
Page 3
Cadman, M.D., D.A.Sutherland, G.G.Beck, D.Lepage, and A.R.Couturier (eds.). 2007. Atlas of the Breeding Birds of Ontario, 2001-2005. Bird Studies Canada, Environment Canada, Ontario Field
Ornithologists, Ontario Ministry of Natural Resources, and Ontario Nature, Toronto, xxii + 706 pp.
Cain, A.T., Tuovila, V.R., Hewitt, D.G., and M.E. Tewes. 2003. Effects of a highway and mitigation
projects on bobcats in Southern Texas. Biological Conservation 114: 189-197.
Center For Watershed Protection. 1995. Pollutant Dynamics Within Stormwater Wetlands. I. Plant Uptake. Watershed Protection Techniques 1(4): 210-216.
Center For Watershed Protection. 1995. Wetter Is Not Always Better – Flood Tolerance of Woody
Species. Watershed Protection Techniques 1(4): 208-210.
Center For Watershed Protection. 2000. The Impact of Stormwater on Puget Sound Wetlands.
Watershed Protection Techniques 3(2): 670-675.
Chapman, L.J. and D.F. Putnam, 1984. The Physiography of Southern Ontario, Third Edition;
Ontario Geological Survey, Special Volume 2, 270p. Accompanied by Map 2715.
City of Brampton, Official Plan, 2008.
City of Brampton, Mount Pleasant Secondary Plan, 2010.
Coleman, J.S., S.A. Temple and S.R. Craven, 1997. Cats and Wildlife: A Conservation Dilemma.
Wisconsin Cooperative Extension, Madison W1
Committee on the Status of Endangered Wildlife in Canada (COSEWIC), 2007. COSEWIC assessment and update status report on the redside dace Clinostomus elongatus in Canada.
Committee on the Status of Endangered Wildlife in Canada. Ottawa.
Conservation Ontario. Integrated Watershed Management – Water Budget Overview, October,
2009.
Cooke, S . and A. L. Azous. 2000. Chapter 3: Characterization of Puget Sound Basin Palustrine
Wetland Vegetation. Edited by Amanda L. Azous and Richard R. Horner, Wetlands and Urbanization: Implications for the Future. Seattle, Washington: CRC Press.
Cooke, S . and A. L. Azous. 2000. Chapter 10: The Hydrologic Requirements of Common Pacific
Northwest Wetland Plant Species. Edited by Amanda L. Azous and Richard R. Horner, Wetlands and Urbanization: Implications for the Future. Seattle, Washington: CRC Press.
COSEWIC 2010. COSEWIC assessment and status report on the Bobolink Dolichonyx oryivorus in Canada. Committee on the Status of Endangered Wildlife in Canada. Ottawa. I + 42 pp.
(www.sararegistry.gc.ca/status/status_e.cfm).
COSEWIC. 2011. Species at Risk Registry. Accessed September 25, 2011. Available online:
http://www.sararegistry.gc.ca/.
Credit Valley Conservation, Thermal Impacts of Urbanization including Preventative and Mitigation Techniques, draft, December 2010
Final Environmental Implementation Report Mount Pleasant Sub-Area 51-1
September 2011
Page 4
Dexel, R. 1989. Investigations into the protection of migrant amphibians from the threats from road traffic in the Federal Republic of Germany: a summary. Pp. 43-49 In T.E.S. Langton (ed.)
Amphibians and Roads, proceedings of the toad tunnel conference. ACO Polymer Products, Shefford, England.
Dobbyn, J. 1994. Atlas of the Mammals of Ontario. Federation of Ontario Naturalists. 120pp.
Dodd, C. K. Jr., W. J. Barichivich, and L. L. Smith. 2004. Effectiveness of a barrier wall and culverts in reducing wildlife mortality on a heavily traveled highway in Florida. Biological
Conservation 118: 619-631.
Dougan & Associates. Draft North West Brampton Landscape Scale Analysis in Support of the
Mount Pleasant Secondary Plan Subwatershed Study, August 2007.
Ehrenfeld, J. G. (2000), Defining the Limits of Restoration: The Need for Realistic Goals. Restoration Ecology, 8: 2–9.
Entra Consultants and Philips Engineering. Sandalwood Parkway Extension from Creditview Road to Mississauga Road Class Environmental Assessment – Environmental Study Report, September
2010.
Environment Canada. Canadian Climate records 1971-2010, Pearson International Airport, Ontario.
Environmental Guide for Wildlife in the Oak Ridges Moraine, October 2006. Ministry of Transportation Ontario.
Eriksson, O., A. Sjolund, and C. Andren. 2000. Amphibians and Roads. Vagverket, Swedish
National Road Administration Publication 7.
Foresman, K.R. 2004. The effects of highways on fragmentation of small mammal populations
and modifications of crossing structures to mitigate such impacts. Report by the Division of Biological Sciences. University of Montana for the Montana Department of Transportation,
Helena, Montana, 39 pp.
Forman, R.T.T., D. Sperling, J.A. Bissonette, A.P Clevenger, C.D. Cutshall, V.H. Dale, L. Fahrig, R.
France, C.R. Goldman, K. Heanue, J.A. Jones, F.J. Swanson, T. Turrentine and T.C. Winter. 2003. Road Ecology: Science and Solutions. Island Press. Washington, D.C., 481 pp.
Gagnon + Law Urban Planners, Growth Management Staging and Sequencing Strategy Report –
Mount Pleasant Secondary Plan Block Plan Area 51-1, August 2011.
Geomorphic Solutions, 2009. Guidance Document: Application of Fluvial Geomorphology in
Common Submissions.
Golder Associates. IWA Landfill Site Search Peel Region – Step 6 Hydrogeological Report Site B-
22d, December, 2003.
Golder Associates. IWA Landfill Site Search Peel Region – Step 6 Hydrogeological Report Site B-15b, December, 2003.

Final Environmental Implementation Report Mount Pleasant Sub-Area 51-1
September 2011
Page 5
Golder Associates. IWA Landfill Site Search Peel Region – Step 6 Hydrogeological Report Site B-
21c, December, 2003.
Greater Toronto Area Conservation Authorities. Erosion and Sediment Control Guidelines, May 2006.
Guidelines for Developing and Managing Ecological Restoration Projects, 2nd Edition. Andre Clewell, John Rieger, and John Munro. December 2005. www.ser.org and Tucson: Society for
Ecological Restoration International.
Havinga, D. and J.M. Daigle. 1996. Restoring Nature’s Place. A Guide to Naturalizing Ontario Parks and Greenspace. Ecological Outlook and Ontario Parks Association. Schomberg, Ontario.
Higgs, E. S., 1997. What is Good Ecological Restoration? Conservation Biology, 11: 338–348.
Higgs, E., 2003. Nature by design: people, natural process and ecological restoration. MIT Press, Cambridge, Massachusetts, USA.
Jackson, S. D. 1996. Underpass systems for amphibians. Pp. 224-227. In G.L. Evink, P. Garrett, D. Zeigler and J. Berry (eds.), Trends in Addressing Transportation Related Wildlife Mortality,
Proceedings of the Transportation Related Wildlife Mortality Seminar. Florida Department of Transportation, Tallahassee, Florida.
Jackson, S. D., 1999. Overview of transportation related wildlife problems. Pp. 1-4. In: G.L.
Evink, P. Garrett, D. Zeigler and J. Berry (eds.), Proceedings of the International Conference on
Wildlife Ecology and Transportation. State of Florida Department of Transportation, Tallahassee, Florida. FL-ER-73-99.
Jochimsen, D.M., Peterson, C. R., Andrews, K.M., and J. Whitfield Gibbons. 2004. A Literature
Review of the Effects of Roads on Amphibians and Reptiles and the Measures Used to Minimize
Those Effects. Idaho Fish and Game Department USDA Forest Service. 78 pp.
Karrow, P., 1991. Quaternary Geology, Brampton Area (Map P3171).
Kays, R.W. and A.A. DeWan. 2004. Ecological Impact of Inside/Outside House Cats Around a
Suburban Nature Preserve. Animal Conservation.
Krikowski, L., 1989. The 'light and dark zones': two examples of tunnel and fence systems. Pp 89-91. In T. E. S. Langton (ed.), Amphibians and Roads Proceedings of the Toad Tunnel
Conference. ACO Polymer Products, Shefford, England.
Langton, T.E.S. 1989. Tunnels and temperature: results from a study of a drift fence and tunnel
system at Henley-on-Thames, Buckinghamshire, England. Pp. 145-152 In T.E.S. Langton (ed.) Amphibians and Roads, proceedings of the toad tunnel conference. ACO Polymer Products,
Shefford, England.
Lee, H.T., W.D. Bakowsky, J. Riley, J. Bowles, M. Puddister, P. Uhlig and S. McMurrey. 1998.
Ecological Land Classification for Southern Ontario: First Approximation and its Application.
Ontario Ministry of Natural Resources. Southcentral Science Section, Science Development and Transfer Branch. SCSS Field Guide FG-02.

Final Environmental Implementation Report Mount Pleasant Sub-Area 51-1
September 2011
Page 6
Natural Heritage Information Centre (NHIC). 2011. Provincial status of plants, wildlife and vegetation
communities databases. Ontario Ministry of Natural Resources, Peterborough. Available online: http://www.mnr.gov.on.ca/MNR/nhic/nhic.html/.
North-South Environmental Inc., Dougan & Associates and Sorenson Gravely Lowes. 2009. Peel-Caledon Significant Woodlands and Significant Wildlife Habitat Study. Report prepared for the Region of Peel and the Town of Caledon, Ontario. xi + 187 pp + app. Oldham, M. J., W. D. Bakowsky and D. A. Sutherland. 1995. Floristic quality assessment for
southern Ontario. Natural Heritage Information Centre, Peterborough. 68 pp. Oldham, M.J., and S.R. Brinker. 2009. Rare Vascular Plants of Ontario, Fourth Edition. Natural
Heritage Information Centre, Ontario Ministry of Natural Resources. Peterborough, Ontario. 188
pp.
OMNR, 2011: Redside Dace (Clinostomus elongates) in Ontario. Ontario Recovery Strategy Series. Queen’s Printer for Ontario.
Ontario Geological Survey. 1991. Bedrock Geology of Ontario, southern sheet, Ontario Geological Survey, Map 2544, scale 1:1,000,000.
Ontario Geological Survey. 2003. Surficial Geology of Southern Ontario: Ontario Geological
Survey – Miscellaneous Release Data 128.
Ontario Ministry of the Environment. Storm Water Management Planning and Design Manual,
March 2003.
Ontario Ministry of Environment and Energy. Ontario Drinking Water Standards, Revised January 2001.
Ontario Ministry of the Environment. Water Well Records.
Ontario Ministry of Natural Resources. 2011. Species at Risk in Ontario website, List dated June 8, 2011.
Ontario Ministry of Natural Resources. 2010. Natural Heritage Reference Manual for Policy 2.3 of the Provincial Policy Statement. Ontario Ministry of Natural Resources 245 pp.
Ontario Ministry of Natural Resources. 2000. Significant Wildlife Habitat Technical Guide. Fish and
Wildlife Branch, Wildlife Section, Science Development and Transfer Branch, Southcentral Sciences Section. 151 pp.
The Ontario Gazette; e-Laws, July 9, 2001. Ontario Regulation 293/11 made under the Endangered Species Act. Amending Ontario Regulation 242/08.
Ontario Ministry of Natural Resources. Southern Ontario Wetland Evaluation Manual, December
2002.
Ontario Ministry of Natural Resources (MNR) 2011. Draft Guideline for Development Activities in
Redside Dace Protected Habitat. OMNR, Peterborough, ON. Ii-42pp
Ontario Ministry of Natural Resources. 2010a. Recovery Strategy for Redside Dace in Ontario. Queens Printer for Ontario, Toronto ON. 29pp.

Final Environmental Implementation Report Mount Pleasant Sub-Area 51-1
September 2011
Page 7
Ontario Road Ecology Group, Toronto Zoo. 2010. A Guide to Road Ecology in Ontario, prepared for the Environmental Canada Habitat Stewardship Program for Species at Risk.
Parish Geomorphic, 2004. Redside Dace Recovery Strategy Fluvial Geomorphology Study.
Philips Engineering Limited. Draft Phase 1: Subwatershed Characterization and Integration Report, December 2007.
Reinhelt, L.E., Taylor, B. and R.R. Horner. 2000. Chapter 1: Morphologoy and Hydrology. Edited
by Amanda L. Azous and Richard R. Horner, Wetlands and Urbanization: Implications for the Future. Seattle, Washington: CRC Press.
Reinhelt, L.E., and B. Taylor. 2000. Chapter 8: Effects of Watershed Development on Hydrology. Edited by Amanda L. Azous and Richard R. Horner, Wetlands and Urbanization: Implications for the Future. Seattle, Washington: CRC Press.
RISC (Resources Inventory Standards Committee). 1998. BC Ministry of Environment, Lands and
Parks, Resources Inventory Branch for the Terrestrial Ecosystems Task Force Resources Inventory Committee.
Rodriguez, A, Crema, G., and M. Delibes. 1996. Use of non-wildlife passages across a high speed
railway by terrestrial vertebrates. Journal of Applied Ecology 33: 1527-1540.
Savanta Inc. October 2011. Comprehensive Fisheries Compensation Plan.
R. J. Burnside and Associates Limited. Infrastructure Servicing Study, Mount Pleasant Secondary
Plan, Block 51, May 2008.
Savanta Inc. North West Brampton Wildlife Summary Report, March 2009.
Savanta Inc. Mount Pleasant Conceptual Fisheries Compensation Plan, January 2011.
Semlitsch, R. D., 2000. Principles for management of aquatic-breeding amphibians. Journal of
Wildlife Management 64: 615-631.
Shad & Associates Inc. Geotechnical Investigation Report, Proposed Stormwater Management
Ponds and Culvert Crossings for Mount Pleasant Community, Block 51-1 in Brampton, Ontario – Draft Report, December 2010.
Shad & Associates Inc. Topsoil Test Pit Investigation for Block Plan 51-1 in Brampton, Ontario,
July 2010.
Society for Ecological Restoration International Science & Policy Working Group. 2004. The SER
International Primer on Ecological Restoration. www.ser.org & Tucson: Society for Ecological Restoration International.
Soil Engineers Ltd. A Soil Investigation for Proposed Creditview Citywide Park at Creditview Road and Sandalwood Parkway in Brampton, Ontario, November 2003.
Soil Engineers Ltd. A Soil Investigation for Proposed Residential Subdivision at Mayfield Road and
Creditview Road in Brampton, Ontario, November 2004.

Final Environmental Implementation Report Mount Pleasant Sub-Area 51-1
September 2011
Page 8
Soil Engineers Ltd. A Soil Investigation for Proposed Residential Subdivision at the Northwest Quadrant of Creditview Road and Wanless Drive in Brampton, Ontario, August 2004.
Soil Engineers Ltd. A Soil Investigation for Proposed Residential Subdivision, Part of Lot 17,
Concession 2, WHS, 11624 McLaughlin Road, Brampton, Ontario, June 2003.
Soil Engineers Ltd. A Soil Investigation for Proposed Residential Subdivision, Part of Lot 17,
Concession 2, WHS, West Side of McLaughlin Road, Brampton, Ontario, June 2003.
Soil Engineers Ltd. A Soil Investigation for Proposed Residential Development, Part of Lot 17, Concession 3, WHS, East Side of Creditview Road, Brampton, Ontario, June 2003.
STAL. Mount Pleasant Block 51-1 Community Design Guidelines, January 2011.
Stonybrook Consulting et al., Scoped Environmental Implementation Report, Mount Pleasant Block 51-1, August 2010.
Veenbaas, G. and J. Brandjes. 1999. Use of fauna passages along waterways and under highways. Pp. 253-258 In G.L. Evink, P. Garrett, and D. Zeigler (eds.). Proceedings of the Third International Conference on Wildlife Ecology and Transportation. FL-ER-73-99. Florida Department of Transportation, Tallahassee, Florida.
Yanes, J., M. Velasco, and F. Suarez. 1995. Permeability of roads and railways to vertebrates:
The importance of culverts. Biological Conservation 71: 217-222.

Figures