Embed Size (px)
Citation preview
FINAL GROUNDWATER PERIODIC MONITORING REPORT
FOR APRIL 2012
(VERSION 1)
FORT WINGATE DEPOT ACTIVITY McKinley County, New Mexico
January 2013
Customer Order No. W45XMA20300591
Prepared by:
U.S. Army Corps of Engineers
Albuquerque District
Prepared for:
Base Realignment and Closure Division
Standard Form 298 (Rev. 8/98)
REPORT DOCUMENTATION PAGE
Prescribed by ANSI Std. Z39.18
Form Approved OMB No. 0704-0188
The public reporting burden for this collection of information is estimated to average 1 hour per response, including the time for reviewing instructions, searching existing data sources, gathering and maintaining the data needed, and completing and reviewing the collection of information. Send comments regarding this burden estimate or any other aspect of this collection of information, including suggestions for reducing the burden, to Department of Defense, Washington Headquarters Services, Directorate for Information Operations and Reports (0704-0188), 1215 Jefferson Davis Highway, Suite 1204, Arlington, VA 22202-4302. Respondents should be aware that notwithstanding any other provision of law, no person shall be subject to any penalty for failing to comply with a collection of information if it does not display a currently valid OMB control number. PLEASE DO NOT RETURN YOUR FORM TO THE ABOVE ADDRESS. 1. REPORT DATE (DD-MM-YYYY) 2. REPORT TYPE 3. DATES COVERED (From - To)
4. TITLE AND SUBTITLE 5a. CONTRACT NUMBER
5b. GRANT NUMBER
5c. PROGRAM ELEMENT NUMBER
5d. PROJECT NUMBER
5e. TASK NUMBER
5f. WORK UNIT NUMBER
6. AUTHOR(S)
7. PERFORMING ORGANIZATION NAME(S) AND ADDRESS(ES) 8. PERFORMING ORGANIZATION REPORT NUMBER
9. SPONSORING/MONITORING AGENCY NAME(S) AND ADDRESS(ES) 10. SPONSOR/MONITOR'S ACRONYM(S)
11. SPONSOR/MONITOR'S REPORT NUMBER(S)
12. DISTRIBUTION/AVAILABILITY STATEMENT
13. SUPPLEMENTARY NOTES
14. ABSTRACT
15. SUBJECT TERMS
16. SECURITY CLASSIFICATION OF: a. REPORT b. ABSTRACT c. THIS PAGE
17. LIMITATION OF ABSTRACT
18. NUMBER OF PAGES
19a. NAME OF RESPONSIBLE PERSON
19b. TELEPHONE NUMBER (Include area code)
01-31-2013 Final, Version 1 January 2012 through April 2012
Final Groundwater Periodic Monitoring Report forApril 2012 - Final Version 1
Customer Order No. W45XMA20300591
NA
Environmental Engineering SectionU.S. Army Corps of EngineersAlbuquerque District
U.S. Army Corps of Engineers4101 Jefferson Plaza NEAlbuquerque, NM 87109-3435
This report summarizes groundwater sampling and monitoring field activities, chemical analytical results of groundwater samples,
In April 2008, the U.S. Army Corps of Engineers (USACE) began monitoring groundwater at Fort Wingate Depot Activity as resultof the issuance of Resource Conservation and Recovery Act (RCRA) Permit (NM 6213820974). Groundwater samples arecollected semi-annually, and groundwater elevation measurements are made quarterly. On a semi-annual basis, activities arereported to the New Mexico Environment Department (NMED) – Hazardous Waste Bureau (HWB). This Groundwater PeriodicMonitoring Report was prepared for submission to NMED–HWB and describes January 2012 through April 2012 groundwatermonitoring activities and results.
Groundwater Periodic Monitoring ReportFort Wingate Depot Activity
C C C SARMark Patterson
330/358-7312

Final Approval Letter Place Holder
Upon approval by the New Mexico Environment Department Hazardous Waste Bureau of this Off-Site Groundwater Monitoring Work Plan, a copy of the signed approval letter will be placed here.

DOCUMENT DISTRIBUTION April 2012 FWDA Groundwater Periodic Monitoring Report
BIA = Bureau of Indian Affairs BIA-NR = Bureau of Indian Affairs – Navajo Regional Office BIA-Zuni = Bureau of Indian Affairs – Zuni Agency BRACD = U.S. Army Base Realignment and Closure Division FWDA = Fort Wingate Depot Activity FWDA-AR = Fort Wingate Depot Activity - Administrative Record FWDA-BEC = Fort Wingate Depot Activity Base Realignment and Closure – Environmental Coordinator NMED-HWB = New Mexico Environment Department – Hazardous Waste Bureau NN = Navajo Nation POZ = Pueblo of Zuni USACE SPA = U.S. Army Corps of Engineers – Albuquerque District USACE SWF = U.S. Army Corps of Engineers – Fort Worth District USAEC = U.S. Army Environmental Command USEPA = U.S. Environmental Protection Agency
Organization (Name) Number of Printed Copies
Number of Electronic Copies
BIA-NR (Rose Duwyenie) 1 2 BIA-Zuni (Clayton Seoutewa) 1 1 BRACD (Bill O'Donnell) 0 1 BIA (Eldine Stevens) 0 1 BIA (Angela Kelsey) 0 1 DOI/BLM (Ben Burshia) 0 1 DOI/BLM (Judith Wilson) 0 1 FWDA-BEC (Mark Patterson) 1 1 FWDA-AR (Lura Micki Gonzales) 1 1 FWDA (Richard Cruz) 1 1 NMED-HWB (David Cobrain) See John Kieling NMED-HWB (John Kieling) 2 2 NMED-HWB (Shannon Duran) See John Kieling
NN (Jarvis Williams) 1 7 POZ (Darrel Tsabetsaye) 1 8 USACE SPA (David Henry) 1 1 USACE SWF (Steve Smith) 1 1 USAEC (Mike Kipp) 0 1 USEPA (Chuck Hendrickson) 1 1 Web Manager (Pat Ryan) 0 1

Page ES-1
E.S.1.0 EXECUTIVE SUMMARY
In April 2008, the U.S. Army Corps of Engineers (USACE) began monitoring groundwater at Fort Wingate Depot Activity (FWDA) at the request of the U.S. Department of Defense, U.S. Army Base Realignment and Closure (BRAC) Division. This ongoing project is being conducted under Resource Conservation and Recovery Act (RCRA) Permit (EPA ID No. NM 6213820974) (NMED 2005). Groundwater samples are collected semi-annually, and groundwater elevation measurements are made quarterly. On a semi-annual basis, activities are reported to the New Mexico Environment Department (NMED) – Hazardous Waste Bureau (HWB). This Groundwater Periodic Monitoring Report (GPMR) was prepared for submission to NMED–HWB and describes the April 2012 groundwater monitoring activities and results at FWDA.
E.S.1.1 Purpose
The purpose of this GPMR is to describe the results of groundwater monitoring program executed by the USACE, on behalf of BRAC for the reporting period of April 2012. This report summarizes groundwater sampling and monitoring field activities, chemical analytical results of groundwater samples, and the evaluation of groundwater elevation measurements.
E.S.1.2 Investigation
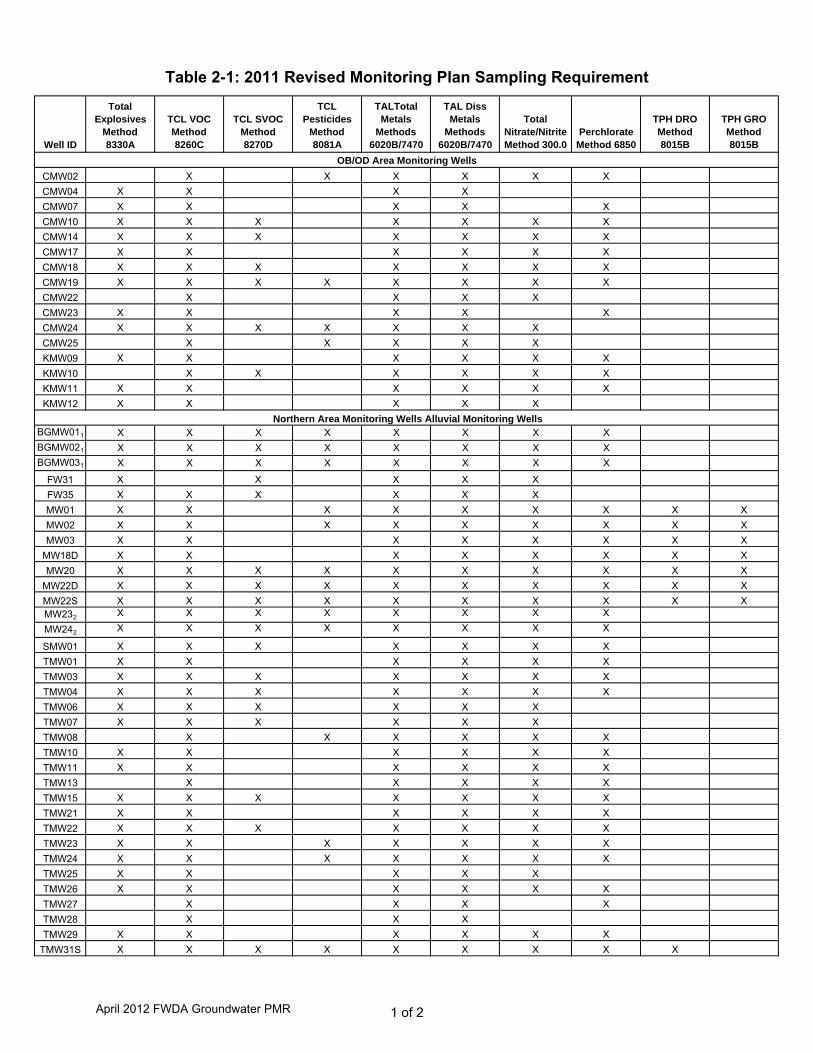
The depth to water (DTW) in monitoring wells was measured during the month of January and April 2012. Groundwater samples were collected from 82 monitoring wells during the month of April 2012. Groundwater samples were analyzed for constituent groups shown in Table 2-1 of this report. The monitoring wells are located in two major areas of FWDA (Figure 1-1): the Northern Area, and the Open Burn and Open Detonation (OB/OD) Area. Monitoring wells are discussed throughout the report relative to the area in which they are located. Eight new monitoring wells installed in the Northern Area during February 2012 were sampled and water levels were measured.
E.S.1.2.1 Groundwater Measurements
USACE evaluated DTW measurements from monitoring wells located in the Northern Area of the installation to determine the gradient of groundwater in alluvium and bedrock. Additionally, DTW measurements from U.S. Geological Survey (USGS) piezometers along the South Fork of the Rio Puerco were incorporated into the evaluation of the groundwater gradient and flow in the Northern Area. Likewise, OB/OD Area monitoring well DTW measurements were evaluated to determine the gradient of groundwater in the OB/OD Area.
E.S.1.2.2 Groundwater Sampling
Samples were collected from 66 groundwater monitoring wells located in the Northern Area (Figure 2-1). These monitoring wells were installed primarily to characterize releases from the 2,4,6-trinitrotoluene (TNT) Leaching Beds Area, Administration Area [multiple Solid Waste Management Units (SWMUs) and areas of concern (AOCs)]
April 2012 FWDA Groundwater PMR
Page ES-2
located in Parcels 6, 7, 11, 21 and 22, Eastern Landfill Area, and the Buildings 542 and 600 Area (TPMC 2008). Groundwater samples collected from these monitoring wells were analyzed for constituents/constituent groups identified in Table 2-1 of this report. Samples were also collected from 16 existing groundwater monitoring wells located in the OB/OD Area (Figure 2-1). As noted in the 2011 Interim Facility-Wide Groundwater Monitoring Plan (GWMP) (HGS 2011), existing monitoring wells were installed to characterize releases from the Hazardous Waste Management Unit (HWMU) and SWMUs located in Parcel 3 (TPMC 2008). Groundwater samples collected from monitoring wells located in the OB/OD Area were analyzed for constituents/constituent groups identified in Table 2-1 of this report.
E.S.1.3 Results
Northern Area groundwater flow in the alluvium is generally from potentiometric highs in the east, north, and south to a potentiometric low in the Administration Area. From the Administration Area, groundwater locally flows to the west (Alluvial Figures 4-1 and 4-2). This trend is consistent with previous reporting periods. In addition to the alluvial groundwater flow, groundwater is also present in fine grained sandstone beneath the Workshop Area (Bedrock Figures 4-3 and 4-4). Bedrock monitoring well measurements indicate bedrock groundwater flow is generally in a westerly direction in this sandstone. Groundwater elevation measurements for the OB/OD Area indicate a general northern gradient that roughly follows the topography.
Figures 4-1 through 4-4 of this report are groundwater elevation contour maps for the Northern Area, and Figure 4-5 is the groundwater elevation contour map for the OB/OD Area. Tables 4-1, 4-2 and 4-4 tabulate DTW measurements and groundwater elevations of monitoring wells and piezometers in the Northern Area, and Table 4-3 tabulates DTW measurements and groundwater elevations of monitoring wells in the OB/OD Area.
Groundwater samples were collected from all monitoring wells that yielded sufficient groundwater volume and/or discharge. Groundwater samples were not collected from those wells that were dry or nearly dry. Nitrate, nitrite, volatile organic compounds (VOC), semi-volatile organic compounds (SVOC), hexahydro-1,3,5-trinitro-1,3,5-triazine (RDX), 1,3-dinitrobenzene, 2,4-dinitrotoluene, perchlorate, and metals were detected above regulatory health standards in the Northern Area alluvium and bedrock groundwater systems. Other constituents were detected but at concentrations below regulatory health standards. Groundwater samples collected from monitoring wells located in the OB/OD Area contained SVOCs, RDX, 1,3-dinitrobenzene, 2,4,6-trinitrotoluene, and metals above regulatory health standards. Other constituents were detected in OB/OD Area groundwater samples, but these concentrations were below established regulatory health standards.
Chemical results for this reporting period are tabulated in Tables 5-1 through 5-14. Figures 5-1 through 5-4 illustrate constituent concentrations for Northern Area monitoring wells, and Figure 5-5 illustrates constituent concentrations for OB/OD Area
April 2012 FWDA Groundwater PMR
Page ES-3
monitoring wells. Appendix E contains the laboratory analytical results, Data Validation Reports (DVR), and Quality Control Summary Reports (QCSR) for all groundwater samples analyzed. A Comparison of October 2010, April 2011, October 2011, and April 2012 chemical analytical results is presented in Tables 5-8 through 5-14. This comparison did not indicate significant changes in groundwater chemical concentrations from previous sampling events in either the Northern Area or OB/OD Area.
E.S.1.4 New Findings
Five new monitoring wells and three new background monitoring wells were installed in the Northern Area during February 2012. Chemical analytical results of groundwater samples collected from new monitoring wells provided more information as to the extent of nitrate and RDX in the alluvial groundwater system. The new wells further delineated the nitrate plume on the west side of the TNT leaching beds and contributed to slight changes in the model of the nitrate plume’s shape. RDX results contributed to changes in the east and west boundaries, delineating the extent of the explosives plume. Background monitoring wells were sampled for the first time in April 2012. Nitrate, perchlorate and other chemicals were detected. These wells will be included in an upcoming study to determine background chemical concentrations. The two sentinel wells were sampled. Nitrate, VOCs, SVOCs, metals, and a pesticide were detected. Toluene, dissolved iron, and dissolved manganese were the only chemicals whose concentrations exceeded regulatory health standards. As of April 2012, there is no evidence of off-site contaminant migration. Additional information related to chemical results of groundwater samples collected from new monitoring wells is presented in Section 5.0. A discussion of these new findings is presented in Section 5.5, New Findings and Comparative Trends. Figures 5-1 and 5-3 contain concentration contours that were developed based on chemical analytical results from new and existing monitoring wells for Northern Area nitrate and explosives concentrations, respectively. Table 5-1 tabulates the nitrate results and Table 5-2 tabulates the explosives results.
April 2012 FWDA Groundwater PMR
Page i
TABLE OF CONTENTS 1.0 INTRODUCTION ................................................................................................. 1-12.0 SCOPE OF SERVICES ....................................................................................... 2-1
2.1 GROUNDWATER ELEVATIONS ................................................................ 2-12.2 GROUNDWATER SAMPLING .................................................................... 2-1
3.0 REGULATORY CRITERIA .................................................................................. 3-14.0 GROUNDWATER ELEVATION .......................................................................... 4-1
4.1 NORTHERN AREA GROUNDWATER ELEVATIONS ................................ 4-14.1.1 Northern Area Alluvial Groundwater System .................................. 4-14.1.2 Northern Area Bedrock Groundwater System ................................ 4-1
4.2 OB/OD AREA GROUNDWATER ELEVATIONS ......................................... 4-25.0 GROUNDWATER CHEMICAL ANALYTICAL DATA RESULTS ....................... 5-1
5.1 NORTHERN AREA CHEMICAL ANALYTICAL RESULTS ......................... 5-15.1.1 Nitrate and Nitrite ........................................................................... 5-15.1.2 Total Explosives ............................................................................. 5-15.1.3 Perchlorate ..................................................................................... 5-25.1.4 Volatile Organic Compounds .......................................................... 5-25.1.5 Semi-Volatile Organic Compounds ................................................ 5-25.1.6 Diesel and Gasoline Range Organics ............................................ 5-35.1.7 Total and Dissolved Metals, Including Mercury .............................. 5-35.1.8 Pesticides ....................................................................................... 5-3
5.2 OB/OD AREA SAMPLING RESULTS ......................................................... 5-35.2.1 Nitrate and Nitrite ........................................................................... 5-35.2.2 Total Explosives ............................................................................. 5-45.2.3 Perchlorate ..................................................................................... 5-45.2.4 Volatile Organic Compounds .......................................................... 5-45.2.5 Semi-Volatile Organic Compounds ................................................ 5-45.2.6 Total and Dissolved Metals, Including Mercury .............................. 5-45.2.7 Pesticides ....................................................................................... 5-4
5.3 SENTINEL WELL SAMPLING RESULTS ................................................... 5-45.3.1 Nitrate and Nitrite ........................................................................... 5-55.3.2 Total Explosives ............................................................................. 5-55.3.3 Perchlorate ..................................................................................... 5-55.3.4 Volatile Organic Compounds .......................................................... 5-55.3.5 Semi-Volatile Organic Compounds ................................................ 5-55.3.6 Total and Dissolved Metals, Including Mercury .............................. 5-55.3.7 Pesticides ....................................................................................... 5-5
April 2012 FWDA Groundwater PMR
Page ii
5.4 BACKGROUND WELL SAMPLING RESULTS ........................................... 5-65.4.1 Nitrate and Nitrite ........................................................................... 5-65.4.2 Total Explosives ............................................................................. 5-65.4.3 Perchlorate ..................................................................................... 5-65.4.4 Volatile Organic Compounds .......................................................... 5-65.4.5 Semi-Volatile Organic Compounds ................................................ 5-65.4.6 Total and Dissolved Metals, Including Mercury .............................. 5-65.4.7 Pesticides ....................................................................................... 5-6
5.5 NEW FINDINGS AND COMPARATIVE TRENDS ...................................... 5-75.5.1 Background Monitoring Well Results .............................................. 5-75.5.2 Alterations to Model of Alluvial Nitrate Plume ................................. 5-75.5.3 Alterations to Model of Alluvial RDX Plume .................................... 5-7
5.6 FIELD VARIANCES FROM WORK PLAN .................................................. 5-75.6.1 Variation between Sampling Plan and Sample Collection .............. 5-75.6.2 Laboratory Anomalies: CMW18 ..................................................... 5-85.6.3 Laboratory Anomalies: MW23 and MW24 ...................................... 5-85.6.4 Laboratory Anomalies: TMW33 Equipment Blank .......................... 5-85.6.5 Laboratory Anomalies: TMW03 and CMW24 ................................. 5-8
6.0 ANCILLARY ACTIVITIES ................................................................................... 6-17.0 GROUNDWATER MONITORING AND SAMPLING ACTIVITY SUMMARY ...... 7-18.0 REFERENCES .................................................................................................... 8-1
April 2012 FWDA Groundwater PMR
Page iii
LIST OF TABLES Table 2-1: 2011 Revised Monitoring Plan Sampling Requirement Table 2-2: April 2012 Groundwater Purge Records Table 4-1: July 2010-April 2012 Northern Area Alluvial Groundwater Elevations Table 4-2: July 2010-April 2012 Northern Area Bedrock Groundwater Elevations Table 4-3: July 2010-April 2012 OB/OD Area Groundwater Elevations Table 4-4: July 2010-April 2012 USGS Piezometer Groundwater Elevations Table 5-1: April 2012 Nitrate and Nitrite Detected Table 5-2: April 2012 Total Explosives Detected Table 5-3: April 2012 Perchlorate Detected Table 5-4: April 2012 Volatile Organic Compounds Detected Table 5-5: April 2012 Semi-Volatile Organic Compounds Detected Table 5-6: April 2012 Mercury and Metals Detected Above Regulatory Health
Standards Table 5-7: April 2012 Pesticides Detected Table 5-8: October 2010 – April 2012 Nitrate and Nitrite Detected Table 5-9: October 2010 – April 2012 Total Explosives Detected Table 5-10: October 2010 – April 2012 Perchlorate Detected Table 5-11: October 2010 – April 2012 Volatile Organic Compounds Detected Table 5-12: October 2010 – April 2012 Semi-Volatile Organic Compounds Detected Table 5-13: October 2010 – April 2012 Diesel and Gasoline Range Organics Detected Table 5-14: October 2010 – April 2012 Pesticides Detected
April 2012 FWDA Groundwater PMR

Page iv
LIST OF FIGURES
Figure 1-1: Fort Wingate Depot Activity Location Map Figure 2-1: Monitoring Well Locations Figure 4-1: January 2012 Northern Area Alluvial Groundwater Contour Map Figure 4-2: April 2012 Northern Area Alluvial Groundwater Contour Map Figure 4-3: January 2012 Northern Area Bedrock Groundwater Contour Map Figure 4-4: April 2012 Northern Area Bedrock Groundwater Contour Map Figure 4-5: April 2012 OB/OD Area Groundwater Contour Map Figure 5-1: April 2012 Northern Area Nitrite and Nitrate Concentrations in Alluvial
Groundwater Figure 5-2: April 2012 Northern Area Nitrite and Nitrate Concentrations in Bedrock
Groundwater Figure 5-3: April 2012 Northern Area Explosives and Perchlorate Concentrations in
Alluvial Groundwater Figure 5-4: April 2012 Northern Area Explosives and Perchlorate Concentrations in
Bedrock Groundwater Figure 5-5: April 2012 Northern Area VOCs, SVOCs, and Pesticides Concentration in
Alluvial and Bedrock Groundwater Figure 5-6: April 2012 OB/OD Area Groundwater Constituent Concentrations
April 2012 FWDA Groundwater PMR
Page v
LIST OF APPENDICES (On Disc)
Appendix A Sampling Equipment Appendix A1 Hydrolab Operating Manual Appendix A2 Field Potable Turbidity Meter Appendix A3 Solinst Water Level Meter Appendix A4 Disposable Hand Bailer Specifications Appendix A5 12-Volt Purge Pump Specifications Appendix A6 Bennett Pump Specifications Appendix A7 BESST Low Flow Pump Specifications Appendix A8 BESST Low Flow Pump with Zone Isolation Technology
Specifications
Appendix B Groundwater Monitoring Field Books
Appendix C NMED Position Paper: Use of Low-Flow and Other Non-Traditional Sampling Techniques for RCRA Compliant Groundwater Monitoring
Appendix D Well Sampling Data Forms
Appendix E Groundwater Chemical Supporting Documentation Appendix E1 April 2012 Quality Control Summary Report and Data Validation
Report Appendix E2 April 2012 Quality Assurance and Quality Control Sample Relative
Percentages Difference Tables Appendix E3 October 2010-April 2012 Total and Dissolved Metals Detected Appendix E4 April 2012 Environmental Data Management System Database
Appendix F New Monitoring Well Information Appendix F1 New Monitoring Well Control Survey Appendix F2 New Monitoring Well Geologist Logs Appendix F3 New Monitoring Well Construction Diagram
Appendix G Laboratory Anomalies Documentation Appendix G1 CMW18 Re-Analysis Results Appendix G2 CMW24 Re-Analysis Results Appendix G3 TMW03 Re-Analysis Results
April 2012 FWDA Groundwater PMR
Page vi
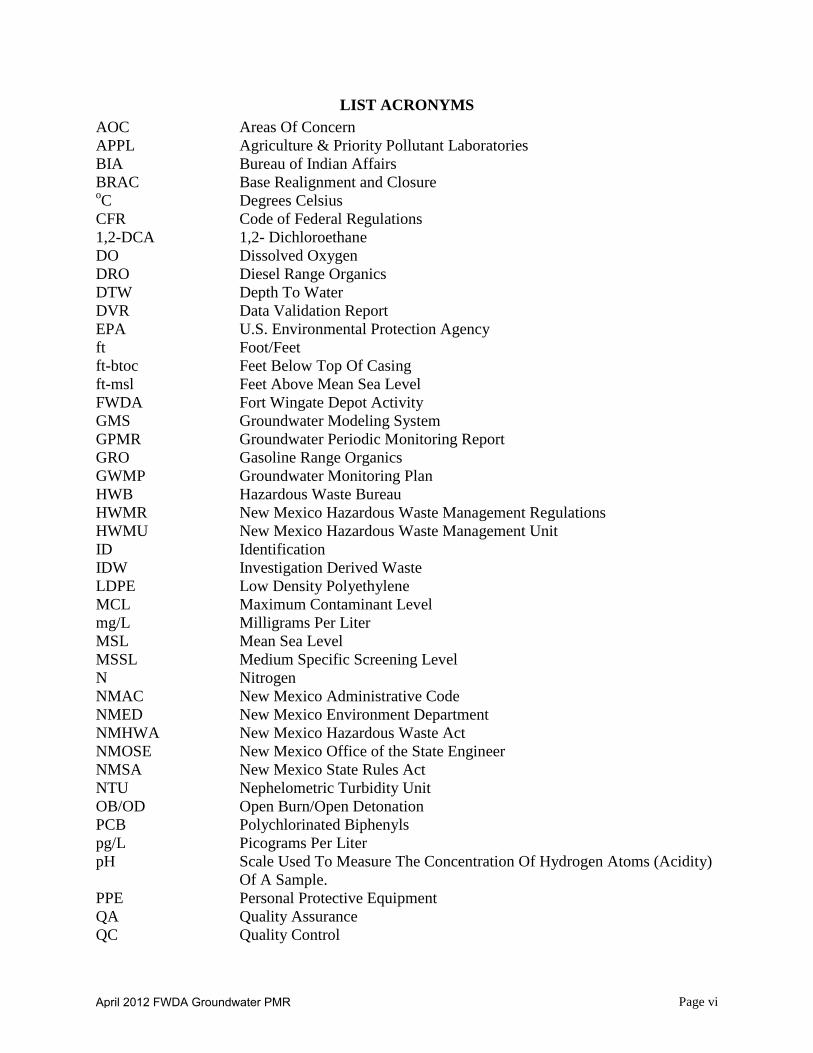
LIST ACRONYMS
AOC Areas Of Concern
APPL Agriculture & Priority Pollutant Laboratories
BIA Bureau of Indian Affairs
BRAC Base Realignment and Closure oC Degrees Celsius
CFR Code of Federal Regulations
1,2-DCA 1,2- Dichloroethane
DO Dissolved Oxygen
DRO Diesel Range Organics
DTW Depth To Water
DVR Data Validation Report
EPA U.S. Environmental Protection Agency
ft Foot/Feet
ft-btoc Feet Below Top Of Casing
ft-msl Feet Above Mean Sea Level
FWDA Fort Wingate Depot Activity
GMS Groundwater Modeling System
GPMR Groundwater Periodic Monitoring Report
GRO Gasoline Range Organics
GWMP Groundwater Monitoring Plan
HWB Hazardous Waste Bureau
HWMR New Mexico Hazardous Waste Management Regulations
HWMU New Mexico Hazardous Waste Management Unit
ID Identification
IDW Investigation Derived Waste
LDPE Low Density Polyethylene
MCL Maximum Contaminant Level
mg/L Milligrams Per Liter
MSL Mean Sea Level
MSSL Medium Specific Screening Level
N Nitrogen
NMAC New Mexico Administrative Code
NMED New Mexico Environment Department
NMHWA New Mexico Hazardous Waste Act
NMOSE New Mexico Office of the State Engineer
NMSA New Mexico State Rules Act
NTU Nephelometric Turbidity Unit
OB/OD Open Burn/Open Detonation
PCB Polychlorinated Biphenyls
pg/L Picograms Per Liter
pH Scale Used To Measure The Concentration Of Hydrogen Atoms (Acidity)
Of A Sample.
PPE Personal Protective Equipment
QA Quality Assurance
QC Quality Control
April 2012 FWDA Groundwater PMR

Page vii
QCSR Quality Control Summary Report
RCRA Resource Conservation and Recovery Act
RDX Hexahydro-1,3,5-trinitro-1,3,5-triazine
RSL Regional Screening Level
SU Standard Unit
SVOC Semi-Volatile Organic Compound
SWMU Solid Waste Management Unit
TAL Target Analyte List
TCL Target Compound List
TNT 2,4,6-trinitrotoluene
TOC Top of Casing
TPH Total Petroleum Hydrocarbons
µg/L Micrograms Per Liter
USACE United States Army Corps of Engineers
µS/cm Micro-Siemens Per Centimeter
USGS United States Geological Survey
VOC Volatile Organic Compound
WQCC New Mexico Water Quality Control Commission
ZIST Zone Isolation Sampling Technology
April 2012 FWDA Groundwater PMR
Page viii
This page intentionally left blank.
Page 1-1
1.0 INTRODUCTION This Groundwater Periodic Monitoring Report (GPMR) for Fort Wingate Depot Activity (FWDA) describes groundwater monitoring activities conducted as part of the FWDA Environmental Restoration Program. The GPMR was prepared by the U.S. Army Corps of Engineers (USACE), Albuquerque District, and reviewed by USACE, Fort Worth District. The GPMR was prepared on behalf of the U.S. Army Base Realignment and Closure (BRAC) Division for submission to the New Mexico Environment Department (NMED) – Hazardous Waste Bureau (HWB) as required by Section V.A of the Resource, Conservation, and Recovery Act (RCRA) Permit (hereinafter referred to as “the Permit”) for FWDA. The Permit (EPA ID No. NM 6213820974) was finalized in December 2005 and issued December 1, 2005 (NMED 2005). FWDA currently occupies approximately 24 square miles (approximately 15,277 acres) of land in McKinley County in northwestern New Mexico. The installation is located approximately seven miles east of Gallup on U.S. Highway 66 and appr oximately 130 miles west of Albuquerque on Interstate 40 (Figure 1-1) (TPMC 2007). FWDA is almost entirely surrounded by Federally owned or administered lands, including both National Forest System lands and Tribal lands. North and w est of FWDA are Navajo Nation Tribal Trust and Allotment lands. East of FWDA is land administered by the Bureau of Indian Affairs (BIA). City of Gallup Red Rock Park, an El Paso Natural Gas fractioning plant and housing area, the Navajo Nation community of Church Rock, and transportation corridors for Interstate 40, U.S. Highway 66 and the Burlington Northern Santa Fe Railway, are located north of the installation (TPMC 2006). The town of Fort Wingate is located to the east of FWDA on BIA administered land and was the original Fort Wingate headquarters site (TPMC 2006). Cibola National Forest borders the south and southeast of the installation and is mostly undeveloped forestlands (TPMC 2006). FWDA is now an inactive U.S. Army depot whose former mission was to receive, store, ship and dispose of obsolete/deteriorated explosives and m ilitary munitions (TPMC 2007). Facilities at FWDA were used to operate a reserve storage activity providing for the care, preservation, and minor maintenance of assigned commodities, primarily conventional military munitions (TPMC 2006). The active mission of FWDA ceased and the installation closed in January 1993 as a r esult of the Defense Authorization Amendments and BRAC Act of 1988.
April 2012 FWDA Groundwater PMR
Page 2-1
2.0 This section summarizes the scope of activities conducted for the April 2012 sampling event. USACE measured and recorded groundwater elevations and collected groundwater samples from monitoring wells in accordance with the Interim Facility-Wide Groundwater Monitoring Plan (GWMP), as revised in 2011 (TPMC 2008; NMED 2010; HGS 2011).
SCOPE OF SERVICES
2.1 GROUNDWATER ELEVATIONS
Depth to water (DTW) measurements were taken in January and April of 2012. DTW was measured in 61 monitoring wells and 10 piezometers in January 2012 an d 85 monitoring wells and 10 piezometers in April 2012. Monitoring well and piezometer locations are shown in Figure 2-1. The DTW was measured from the top of casing (TOC) of each monitoring well and pi ezometer by lowering the tape measure of a Solinst™ water level meter into the monitoring well or piezometer casing down to the top of groundwater. Refer to Appendix A for water level measuring equipment specifications. Measurements from the TOC surveyed reference mark were then recorded to the nearest 0.01 feet (ft) in field books. Appendix B contains copies of field books. To calculate the elevation of groundwater from mean sea level (MSL), static water level measurements were subtracted from the TOC surveyed reference mark elevation. Section 4 of this GPMR contains groundwater measurement details and the interpretation of groundwater flow and gradient.
2.2 GROUNDWATER SAMPLING
Groundwater samples were collected from 82 monitoring wells in April 2012. Table 2-1 summarizes sampling plan requirements based on the 2011 revised GWMP. Section 5 contains a des cription of sampling activities, chemical analytical results, and interpretation of chemical data. Variances or deviations from the revised GWMP requirements are discussed in Section 5.6. Samples were collected from monitoring wells using several sampling techniques. Groundwater was sampled by low-flow sampling technique, low-flow sampling with zone isolation sampling technology (ZIST), pumping or bailing monitoring wells dry, or by removing three times the volume of water in the casing and annular space with pumps or bailers. Appendix A4 through A8 contain specifications and information related to dedicated pumps, reusable 12-volt pumps and disposable hand bailers. Monitoring wells having low-flow pumps, and low-flow pumps with ZIST assemblies were low-flow purged in accordance with the GWMP and in accordance with the NMED position paper Use of Low-Flow and Other Non-Traditional Sampling Techniques for RCRA Compliant Groundwater Monitoring. The NMED position paper, Use of Low-Flow and Other Non-Traditional Sampling Techniques for RCRA Compliant Groundwater Monitoring (NMED 2001), is presented in Appendix C. During the low-flow purge cycle, samplers monitored purge water quality parameters and recorded: dissolved oxygen (DO) in milligrams per liter (mg/L), turbidity in nephelometric turbidity units (NTU), conductivity in micro-Siemens per centimeter
April 2012 FWDA Groundwater PMR
Page 2-2
(µS/cm), pH in standard units (SU), and temperature in degrees Celsius (°C). Purge water was monitored until parameters stabilized within the following specifications over three recording intervals: turbidity (±10%), DO (±10%), conductance (±10%), temperature (±10%), and pH (±0.5 unit). These parameters are in accordance with the GWMP (HSG 2011). Groundwater parameters, except for turbidity, were measured using a t ransparent flow-through cell attached to the water-quality meter. Refer to Appendix A for equipment specifications, and operating procedures. Turbidity was measured using a separate, hand-held meter. Parameter measurements were recorded on well sampling data forms. Table 2-2 tabulates April 2012 water quality parameter measurements recorded during the purging process. Appendix D contains copies of well sampling data forms. Several wells could not be sampled using low-flow purging techniques due to extremely limited formation discharge rates. These monitoring wells were purged and sampled with dedicated Bennett pumps, a 12-volt-battery pump, or disposable bailers. Samplers collected groundwater samples from these wells after three volumes of water standing in the well casing and annular space were removed, or, if the monitoring well emptied before three volumes were removed, samples were collected the following day, or later, when a volume of formation water adequate for sampling had refilled the well casing.
At least three sets of groundwater quality parameters were recorded for each monitoring well that was pumped or hand-bailed. For hand-bailed monitoring wells, groundwater was poured from the bailer directly into a graduated beaker, and parameters were measured with hand-held meters and recorded on well sampling data forms. When pumps were used, the graduated beaker was filled via the discharge tube of the pump and parameters were measured in the graduated beaker.
After the purging process, primary groundwater samples were collected for all wells. Groundwater samples were collected in their respective bottles, preserved as specified in the GWMP, placed in a cooler, and shipped overnight to RTI Laboratories at the end of each day. When laboratory groundwater sample chemical results were received, USACE submitted the results to Laboratory Data Consultants, Inc. for independent validation. Validated data were then compared to applicable regulatory requirements or health standards. USACE collected QA and QC groundwater samples from approximately 10% of the total samples collected. QC samples were submitted to the primary laboratory as blind duplicates with fictitious monitoring well identifications. Blind duplicate groundwater samples were collected from eight on-site monitoring wells. An additional ninth duplicate sample was also collected, but from an off-site well. The results of the off-site well sample were reported in a s eparate report Off-Site Wells Groundwater Periodic Monitoring Report for April 2012 (Version 1), but are included in the overall QA/QC program. The eight on-site QA/QC samples were collected from the following wells:
• TMW11 with QC identification FW01
April 2012 FWDA Groundwater PMR
Page 2-3
MW22D with QC identification FW02
CMW18 with QC identification FW03
TMW13 with QC identification FW04
TMW15 with QC identification FW05
TMW48 with QC identification FW07
TMW30 with QC identification FW08
TMW36 with QC identification FW09
QA triplicate groundwater samples were collected from the same monitoring wells as the QC blind duplicate samples and shipped to third party Laboratory. The field sample identification for QA triplicate samples has the same corresponding field sample identification number used to identify primary samples submitted to RTI Laboratories. Appendix E contains additional information on the QA/QC program. Primary and QC blind duplicate samples were sent to RTI Laboratories in Livonia, Michigan, for analysis. QA triplicate samples were shipped to Agriculture & Priority Pollutants Laboratories (APPL) in Clovis, California. Primary, QC, and QA samples were shipped to the appropriate laboratory via Federal Express overnight delivery. Investigative Derived Waste (IDW), such as purge water and decontamination fluids were handled in accordance with the GWMP (HGS 2011). USACE placed purge water in an evaporation tank. During monitoring well purging, water discharged from each monitoring well was temporarily placed in five-gallon buckets and sealed. At the end of each day, purge water was transported in these five-gallon buckets and poured into the evaporation tank. All decontamination fluid was poured into the evaporation tank. All solid waste, such as used non-decontaminated disposable sampling equipment and personal protective equipment (PPE), general refuse, and decontaminated sampling equipment/PPE, was placed in FWDA refuse containers. No hazardous waste was generated during the sampling event. All waste was disposed of in accordance with FWDA and/or State rules and regulations.
April 2012 FWDA Groundwater PMR

Page 3-1
3.0 REGULATORY CRITERIA On December 1, 2005, NMED issued a RCRA Permit (EPA ID No. NM 6213820974) to the United States Department of the Army (Permittee), the owner and oper ator of FWDA located in McKinley County, New Mexico. The Permit established the general and specific standards and requirements for these activities pursuant to the New Mexico Hazardous Waste Act (NMHWA), as amended; New Mexico State Rules Act (NMSA) 1978, §§ 74 -4-1 et seq.; and the New Mexico Hazardous Waste Management Regulations (HWMR), 20.4.1 New Mexico Administrative Code (NMAC) (NMED 2005). As required by Section V.A of the Permit, the Army developed and implemented the groundwater monitoring program. A GWMP was prepared in consultation with the Pueblo of Zuni and t he Navajo Nation according to provisions of the Permit, Section VIII.B.1 [(20.4.1.500 NMAC, incorporating 40 C ode of Federal Regulations (CFR) 264.101)] (TPMC 2008). NMED approved the initial GWMP in March 2008, which has been revised three times. Revisions were submitted to NMED in 2009, 2010, and 2011. Therefore, all groundwater monitoring, sampling, and reporting activities are conducted in compliance with the Permit, applicable Permit attachments, and the approved GWMP. Attachment 7 of the Permit provides cleanup levels applicable to the FWDA groundwater monitoring program. Groundwater chemical results are evaluated and compared to these cleanup levels (referred to as regulatory health standards). Therefore, the following documents and regulations are used to determine if the concentration of a p articular hazardous constituent exceeds the Permit cleanup level (NMED 2005).
• New Mexico Water Quality Control Commission (WQCC) standards of 20.6.2.4103.A and B NMAC.
• U.S. Environmental Protection Agency (EPA) drinking water maximum
contaminant level (MCL) under 40 CFR Parts 141 and 142.
• If both a WQCC standard and an EPA MCL have been established for a contaminant, the lower of the two was used as a criterion.
• If no WQCC standard or EPA MCL has been established for a particular
carcinogenic hazardous constituent, the April 2012 version of the EPA regional screening level (RSL) for residential tapwater was used.
• If no WQCC standard or EPA MCL has been established for a particular
noncarcinogenic hazardous constituent, the April 2012 version of the EPA RSL for residential tapwater was used.
• Currently, there is no WQCC groundwater standard or MCL for perchlorate;
however, perchlorate concentrations were compared to the value noted in the Permit, 6 micrograms per liter (µg/L).
April 2012 FWDA Groundwater PMR
Page 3-2
The Permit, Section V.A.2, requires the Army to submit periodic monitoring reports within 60 days of receipt of groundwater chemical analytical results in a format consistent with the NMED General Reporting Requirements for Routine Groundwater Monitoring at RCRA Sites (NMED 2003). Therefore, results and activities conducted are presented in the format recommended by this guidance document.
April 2012 FWDA Groundwater PMR
Page 4-1
4.0 GROUNDWATER ELEVATION
This section summarizes static water level measurements and the evaluation of groundwater flow and gradient. Static water levels were measured at monitoring wells and USGS piezometers. These measurements were used to determine the gradient and flow of groundwater in the Northern Area alluvium, Northern Area bedrock, and the OB/OD Area.
4.1 NORTHERN AREA GROUNDWATER ELEVATIONS
Two groundwater systems are monitored in the Northern Area, one in alluvium and the other in bedrock. Table 4-1 contains tabulated elevation data for wells screened in the alluvial system and Table 4-2 contains tabulated elevation data for wells screened in the bedrock system. Additionally, U.S. Geological Survey (USGS) piezometer elevation measurements are tabulated in Table 4-4. Figures 4-1 through 4-4 present Northern Area groundwater elevation contour maps. Groundwater elevation contours presented in these figures were developed with the Groundwater Modeling System (GMS) software, Version 6.5.
4.1.1 Northern Area Alluvial Groundwater System
Groundwater elevation data from monitoring wells screened in the alluvium and the USGS piezometers, also screened in alluvium, were used to construct groundwater elevation contour maps (Figures 4-1 and 4-2). Groundwater in the alluvial system locally flows from potentiometric highs in the north and south to a potentiometric low in the Administration Area. A groundwater mound was observed in the center of the Administration Area, which may be caused by a leaking water storage cistern. This mounding effect has been documented previous reports and does not appear to influence the general flow of groundwater. From the Administration Area, groundwater locally flows to the west. This trend is consistent with previous reporting periods. The general groundwater gradient in the alluvium is 0.01 ft/ft, although, it is steeper to the south. In February 2012, background monitoring wells BGMW01, BGMW02, and BGMW03 were installed in the Northern Area alluvial groundwater system along with wells TMW43, TMW44, TMW45, TMW46, and TMW47, see Appendix F for drilling logs and completion diagrams. A borehole for BGMW04 was drilled. However, BGMW04 was dry, thus the borehole was abandoned and the well was not installed. The groundwater elevations measured at the eight newly installed wells had no significant effect on the shape of the groundwater elevation contours in the Northern Area alluvial groundwater system.
4.1.2 Northern Area Bedrock Groundwater System
Groundwater connectivity in the sandstone-bedrock is not completely understood in the Northern Area, but connectivity is assumed given the relatively smooth potentiometric surface and observed migration of perchlorate found in bedrock monitoring wells. However, the static water levels measured in TMW02 do not correspond with other measured static water levels found in the alluvial or sandstone-bedrock monitoring wells in this area of FWDA. Static water levels measured in TMW02 are 8 to 25 feet different
April 2012 FWDA Groundwater PMR
Page 4-2
than that of other nearby sandstone-bedrock monitoring wells. It is because of this difference in static water level measurements that TMW02 was not included in the contour interpolations for Figures 4-3 through 4-4. TMW02 is thought to be constructed in a locally discontinuous sandstone that is stratigraphically higher than the sandstone containing the perchlorate plume. Figures 4-3 and 4-4 are sandstone-bedrock groundwater elevation contour maps for January and A pril of 2012. Bedrock groundwater generally flows west. This is a common trend noted in previous reporting periods. The general groundwater elevation gradient in the bedrock is 0.006 ft/ft.
4.2 OB/OD AREA GROUNDWATER ELEVATIONS
Table 4-3 tabulates OB/OD Area groundwater elevation data. Figure 4-5 is a groundwater elevation contour map for April of 2012. Groundwater elevations in the OB/OD area were not measured in January, since snow cover in the area prevented safe entry due to unexploded ordnance. USACE also developed groundwater elevation contours for the OB/OD Area using GMS software, Version 6.5. Groundwater flows in a northerly direction, approximately following the surface topography. This is a general trend noted in previous reporting periods. The general groundwater gradient in the OB/OD area is 0.03 ft/ft. Monitoring wells KMW09, KMW10, KMW11, KMW12, and KMW13 are screened in the Cretaceous or Jurassic formations associated with the Hogback (PMC 1999). Bedding planes of these formations dip steeply, between 42° and 64°, to the west and contain mudstone and claystone beds (the Mancos Shale), which potentially prevents the horizontal flow of groundwater (NMT 2003). USACE did not include static water level measurements from KMW09, KMW10, KMW11, or KMW12 in the evaluation of groundwater movement in the OB/OD Area. KMW13 is a dry well. Groundwater contours in Figure 4-5 are based only on the static water levels measured in monitoring wells CMW02, CMW04, CMW07, CMW10, CMW14, CMW17, CMW19, CMW22, CMW23, CMW24, and CMW25. USACE assumes that these monitoring wells are screened in one of two units, either the Painted Desert or the Sonsela Members of the Triassic Petrified Forest Formation (PMC 1999). Geologic descriptions provided in well logs for these monitoring wells supports this assumption.
April 2012 FWDA Groundwater PMR
Page 5-1
5.0 GROUNDWATER CHEMICAL ANALYTICAL DATA RESULTS Sampling crews mobilized in April 2012 to the FWDA facility to collect groundwater samples in accordance with the 2011 GWMP. Groundwater samples were collected from 82 monitoring wells, which included collecting samples from eight new monitoring wells installed during February of 2012 in the Northern Area. New monitoring wells sampled were BGMW01, BGMW02, BGMW03, TMW43, TMW44, TMW45, TMW46, and TMW47. Tables 5-1 through 5-7 present chemical analytical results of groundwater samples for April 2012. Tables 5-8 through 5-14 compare the results of the four most recent sampling events, providing a 2-year comparative summary. Primary samples from October 2010 were analyzed by ANA-Lab Corp. Refer to Appendix E for the Quality Control Summary Report (QCSR). The following is a summary of the findings related to chemical analytical results for this reporting period.
5.1 NORTHERN AREA CHEMICAL ANALYTICAL RESULTS
The following paragraphs summarize chemical constituents detected in Northern Area groundwater samples collected in April 2012. Wells beginning with EMW, FW, MW, SMW, and TMW are located in the Northern Area of FWDA. Sampling results from the sentinel wells (MW23 and M W24) and the background monitoring wells (BGMW01, BGMW02, and BGMW03) are discussed in Section 5.3 and 5.4 respectively. Because TMW02 is thought to be screened in a discontinuous sandstone, constituent concentrations detected in groundwater samples from this location were not used in the interpolation of concentration contours. As with groundwater elevation measurements, TMW02 sample results do n ot correlate with chemical analytical results reported in groundwater samples from nearby monitoring wells.
5.1.1 Nitrate and Nitrite
Tables 5-1 and 5-8 tabulate nitrate and nitrite results. Figure 5-1 is the isoconcentration map for nitrate in alluvium. Figure 5-2 shows nitrate and nitrite results for each bedrock monitoring well. For both nitrate and nitrite, the MCL is the applicable regulatory health standard. MCLs for nitrate and nitrite are 10.0 mg/L and 1.0 mg/L, respectively. Nitrate concentrations above the MCL were detected in groundwater samples collected from monitoring wells MW20, MW22D, MW22S, TMW02, TMW03, TMW06, TMW22, TMW23, TMW30, TMW31D, TMW34, TMW35, TMW40S, TMW44, TMW46, TMW47, TMW48. The highest nitrate concentration detected was 150 mg/L from the groundwater sample collected from monitoring well TMW03. Nitrite was detected above the MCL of 1.0 mg/L in samples collected from monitoring wells MW20 and TMW40S. The concentrations of MW20 and TMW40S were 4.3 mg/L and 1.6 mg/L respectively.
5.1.2 Total Explosives
Tables 5-2 and 5-9 tabulate total explosives results from April 2012. Of the explosive compounds that were analyzed for, hexahydro-1,3,5-trinitro-1,3,5-triazine (RDX), 2,4-dinitrotoluene, and 1,3-dinitrobenzene were the only compounds detected above a
April 2012 FWDA Groundwater PMR
Page 5-2
regulatory health standard in the Northern Area. Because there are no MCL or WQCC standards for these explosives, RSL values were used for comparison. Northern Area groundwater samples collected from TMW03, TMW21, TMW23, and TMW43 contained RDX at concentrations of 250 µg/L, 1.0 µg/L, 36 µg/L, and 2.5 µg/L, respectively. The RSL for RDX is 0.61 µg/L. 1,3-dinitrobenzene was detected above the RSL of 1.5 µg/L in the Northern Area groundwater samples collected from MW18D and TMW38 at concentrations of 4.5 µg/L and 1.9 µg/L, respectively. 2,4-dinitrotoluene was also detected above the RSL of 0.2 µg/L in groundwater samples collected from TMW03 at concentrations of 0.40 µg/L. RDX was the most spatially prevalent explosive compound detected in groundwater samples for this sampling event; therefore, RDX results were used to construct the concentration contours shown in Figure 5-3 to represent the explosives plume in the alluvium groundwater. Other explosive compounds were detected in Northern Area groundwater samples, but at concentrations below applicable regulatory health standards.
5.1.3 Perchlorate
Tables 5-3 and 5-10 tabulate perchlorate results for April 2012. Figure 5-3 shows perchlorate and explosives concentrations in the alluvium with concentration contours for RDX and perchlorate. Figure 5-4 shows concentration contours for perchlorate in bedrock groundwater. USACE compared perchlorate results to the value noted in the Permit, 6 µg/L. Groundwater samples collected in April from TMW01, TMW02, TMW30, TMW31D&S, TMW32, TMW39D&S, TMW40D&S, TMW48, and TMW49 contained perchlorate above 6 µg/L. The groundwater samples collected from TMW30 and TMW49 contained the highest concentrations at 2570 µg/L each.
5.1.4 Volatile Organic Compounds
Tables 5-4 and 5-11 tabulate volatile organic compounds (VOC) results for April 2012. 1,2-dichloroethane (1,2-DCA) was detected above the regulatory health standards in three wells in the Northern Area. Groundwater samples collected from MW18D, MW20, and TMW33 contained 1,2–DCA above the MCL of 5.0 µg/L with concentrations of 110 µg/L, 9.0 µg/L, and 42 µg/L, respectively. Other VOCs were detected in Northern Area groundwater samples, but at concentrations below applicable regulatory health standards. No isoconcentration map was developed for VOCs; however, Figure 5-5 shows all VOCs detected at each monitoring well sampled.
5.1.5 Semi-Volatile Organic Compounds Tables 5-5 and 5-12 tabulate semi-volatile organic compounds (SVOCs) results. In the
April 2012 FWDA Groundwater PMR
Page 5-3
Northern Area, 2,4-dinitrotoluene and bis(2-ethylhexyl)phthalate were detected above applicable regulatory health standards in April 2012. 2,4-dinitrotoluene was detected above the RSL of 0.2 µg/L in TMW03 and TMW04 at concentrations of 0.32 µg/L and 0.62 µg/L, respectively. Bis(2-ethylhexyl)phthalate was detected above the MCL of 6 µg/L in TMW19 at a concentration of 13 µg/L.
Other SVOCs were detected in Northern Area groundwater samples but at concentrations below applicable regulatory health standards. An isoconcentration map could not be constructed for SVOCs because there was no pattern associated with constituent concentrations; however, Figure 5-5 shows the concentrations of the SVOC detected at each sampled monitoring well.
5.1.6 Diesel and Gasoline Range Organics
No diesel range organics (DRO) or gasoline range organics (GRO) constituents were detected in groundwater samples collected in April 2012.
5.1.7 Total and Dissolved Metals, Including Mercury
Because metals and mercury are naturally occurring, it is difficult to determine if laboratory results represent natural conditions or anthropogenic impacts; therefore, the results presented in Table 5-6 are values only for those metals that exceed applicable regulatory health standards. Table 5-6 shows both dissolved and total metals, including mercury. Appendix E presents results for all metals and mercury with detectable concentrations. In the future, metals results will be compared to a background value after completion of an upcoming background study.
5.1.8 Pesticides
Tables 5-7 and 5-14 tabulate pesticide compounds results, and Figure 5-5 shows results of pesticide compounds at each monitoring well in April 2012. No pesticide compound was detected above a regulatory health standard. Methoxychlor and p, p’-DDE were detected in Northern Area groundwater samples, but at concentrations below their regulatory health standards. Endrin aldehyde was detected at TMW37 but this compound does not have an applicable regulatory health standard.
5.2 OB/OD AREA SAMPLING RESULTS
OB/OD Area monitoring wells have prefixes KMW and CMW. Groundwater samples collected from these monitoring wells were analyzed for constituents and constituent groups presented in Table 2-1. No isoconcentration maps could be constructed for the OB/OD Area because constituents detected in groundwater samples do no t have a pattern that can be i nterpreted. However, Figure 5-6 shows the results for all detections, except for metals and mercury.
5.2.1 Nitrate and Nitrite
Tables 5-1 and 5-8 tabulate nitrate and nitrite results. While there were detections, no OB/OD Area groundwater sample results exceeded the nitrate or the nitrite MCLs in April 2012.
April 2012 FWDA Groundwater PMR
Page 5-4
5.2.2 Total Explosives
Tables 5-2 and 5-9 tabulate groundwater sample results of all detected total explosives compounds. 2,4,6-trinitrotoluene, 1,3-dinitrobenzene, and RDX explosive compounds were detected at concentrations above a regulatory health standard in the OB/OD Area. 1,3-dinitrobenzene was detected above the RSL of 1.5 µg/L in the OB/OD groundwater samples collected from CMW04, CMW19, CMW24, and KMW09 at concentrations of 4.6 µg/L, 6.3 µg/L, 32 µg/L, and 8.8 µg/L, respectively. 2,4,6-trinitrotoluene was detected in KMW09 at a concentration of 2.5 µg/L. The RSL for 2,4,6-trinitrotoluene is 2.2 µg/L. RDX was detected above the RSL of 0.61 µg/L in CMW18 at a concentration of 58 µg/L. Other explosive compounds were detected in groundwater samples collected from the OB/OD area but at concentrations below applicable regulatory health standards.
5.2.3 Perchlorate
Tables 5-3 and 5-10 tabulate perchlorate results. Perchlorate was detected in several OB/OD area wells, but no OB/OD Area groundwater samples exceeded the regulatory health standard of 6 µg/L.
5.2.4 Volatile Organic Compounds
Tables 5-4 and 5-11 tabulate VOC results. VOCs were detected in OB/OD area wells. However, no OB/OD Area groundwater samples exceeded a VOC applicable regulatory health standard.
5.2.5 Semi-Volatile Organic Compounds
Tables 5-5 and 5-12 tabulate the SVOCs results. In the OB/OD Area, 2,4-dinitrotoluene and bis(2-ethylhexyl)phthalate were detected above applicable regulatory health standards in April 2012. 2,4-dinitrotoluene was detected above the RSL of 0.2 µg/L in CMW24 with a concentration of 0.28 µg/L. Bis(2-ethylhexyl)phthalate was detected above the MCL of 6 µg/L in CMW10 at a concentration of 8.5 µg/L.
5.2.6 Total and Dissolved Metals, Including Mercury
Refer to Subsection 5.1.7 for total and dissolved metals/mercury discussions.
5.2.7 Pesticides
Tables 5-7 and 5-14 tabulate pesticide results. No OB/OD Area groundwater samples exceeded applicable pesticide compound regulatory health standards. Alpha-chlordane was detected in CMW24, but this compound does not have a regulatory health standard.
5.3 SENTINEL WELL SAMPLING RESULTS The following paragraphs summarize chemical constituents detected in groundwater
April 2012 FWDA Groundwater PMR

Page 5-5
samples collected from Sentinel Wells, MW23 and MW24.
5.3.1 Nitrate and Nitrite
Tables 5-1 and 5-8 tabulate nitrate and nitrite results. Figure 5-1 is the isoconcentration map for nitrate in alluvium and also shows nitrite results. Nitrate was detected in MW23 at a concentration of 0.42 mg/L, well below the MCL of 10 mg/L. Nitrite was not detected in either sentinel well.
5.3.2 Total Explosives
Tables 5-2 and 5-9 and Figure 5-3 show total explosives results from April 2012. No explosive compounds were detected in either sentinel well.
5.3.3 Perchlorate
Tables 5-3 and 5-10 and Figure 5-3 show perchlorate results from April 2012. No perchlorate was detected in either sentinel well.
5.3.4 Volatile Organic Compounds
Tables 5-4 and 5-11 and Figure 5-5 show VOCs results from April 2012. The groundwater samples from MW23 and MW24 were found to have a toluene concentration of 920 µg/L and 75 µg/L, respectively. The applicable regulatory health standard for toluene is the WQCC which is set at 750 µg/L. See Section 5.6.3 for a discussion of the toluene results.
5.3.5 Semi-Volatile Organic Compounds
Tables 5-5 and 5-12 and Figure 5-5 show SVOC results from April 2012. M,p-cresol was detected in MW23 at a concentration of 2.5 µg/L. There is no applicable regulatory health standard for m,p-cresol. Phenol was detected in MW23 at a concentration of 23 µg/L, which is above the WQCC of 5 µg/L.
5.3.6 Total and Dissolved Metals, Including Mercury
Table 5-6 shows total and dissolved metals results from April 2012. A variety of metals were detected in both MW23 and MW24, however, iron, manganese, and thallium were the only metals detected at concentrations above their regulatory health standards. Dissolved iron and dissolved manganese both exceeded the WQCCs of 1.0 mg/L and 0.2 mg/L, respectively in MW24. In the sample from MW24, the concentration of dissolved iron was 1.8 mg/L and the concentration of dissolved manganese was 0.5 mg/L. Total manganese and iron also exceeded the WQCCs in MW23 and MW24. Total thallium exceeded the MCL of 0.002 mg/L in MW24. These results will be compared to background concentrations after a study of background chemical concentrations in the alluvial aquifer has been performed. 5.3.7 Pesticides
Tables 5-7 and 5-14 and Figure 5-5 show pesticides results from April 2012. The
April 2012 FWDA Groundwater PMR
Page 5-6
pesticide p,p’-DDE was detected in the sample collect from MW23 at a concentration of 0.0073 µg/L, which is below the regulatory health standard (the RSL of 0.2 µg/L).
5.4 BACKGROUND WELL SAMPLING RESULTS
The following paragraphs summarize chemical constituents detected in groundwater samples collected from BGMW01, BGMW02, and BGMW03 in April 2012.
5.4.1 Nitrate and Nitrite
Tables 5-1 and 5-8 and Figure 5-1 show nitrate and nitrite results from April 2012. Nitrate was the only analyte found in concentrations above the applicable regulatory health standard in any of the background monitoring wells. Nitrate was detected in BGMW02 at concentrations of 18 mg/L, which is above the MCL of 10 mg/L. BGMW01 and BGMW03 also had nitrate detected in them, but below the MCL. Nitrite was also detected in BGMW03, but below the MCL.
5.4.2 Total Explosives
No explosives compounds were detected in any of the background monitoring wells.
5.4.3 Perchlorate
Tables 5-3 and 5-10 and Figure 5-3 show perchlorate results from April 2012. Perchlorate was detected in BGMW02 and BGMW03 at concentrations of 0.510 µg/L and 0.579 µg/L respectively. These concentrations are below the value of 6 µg/L dictated by the Permit for comparison.
5.4.4 Volatile Organic Compounds
No VOCs were detected in any of the background monitoring wells.
5.4.5 Semi-Volatile Organic Compounds
Tables 5-5 and 5-12 and Figure 5-5 show SVOCs results from April 2012. SVOCs detected were all below applicable regulatory health standards. Butyl benzyl phthalate was detected in BGMW02 and bis(2-chloroisopropyl)ether and bis(2-ethylhexyl)phthalate were detected in BGMW03, but below regulatory health standards.
5.4.6 Total and Dissolved Metals, Including Mercury
Table 5-6 shows total and dissolved metals results from April 2012. Many dissolved and total metals were detected in each background monitoring well. The only metals to exceed the regulatory health standards were total selenium, dissolved selenium, and dissolved inorganic arsenic, all in BGMW02.
5.4.7 Pesticides
No pesticides were detected in any of the background monitoring wells.
April 2012 FWDA Groundwater PMR
Page 5-7
5.5 NEW FINDINGS AND COMPARATIVE TRENDS
Eight new monitoring wells were installed in the Northern Area during February of 2012. Specific information related to each of these monitoring wells is located in Appendix F. The new wells provide new insight into background concentrations and the alluvial nitrate and RDX plumes.
5.5.1 Background Monitoring Well Results
BGMW01, BGMW02, and BGMW03 were sampled for the first time in April 2012. The concentration of nitrate, perchlorate, and other chemicals in the background wells are not yet conclusive as only one s ampling has been performed. The Environmental Protection Agency (EPA) guidance, “Statistical Analysis of Groundwater Monitoring Data at RCRA Facilities,” (EPA 2009) recommends at least four observations on a set of background wells be conducted before determining background chemical concentrations. These wells will be included in an upcoming study to determine background chemical concentrations.
5.5.2 Alterations to Model of Alluvial Nitrate Plume
Results from the new wells TMW43, TMW44, TMW45, TMW46, and TMW47 provided new information on alluvial nitrate concentration gradients in the Northern Area, leading to significant alterations to the nitrate plume shown in Figure 5-1. The elevated nitrate concentration found in TMW46 of 97 mg/L indicates that the nitrate plume is larger than previous data indicated. TMW43 further delineated the nitrate plume on the west side of the TNT leaching beds. TMW44, TMW45, and TMW47 also contributed to slight changes in the geometry of the nitrate plume.
5.5.3 Alterations to Model of Alluvial RDX Plume
Due to RDX results of newly installed monitoring wells TMW43 and TMW44, the RDX plume’s east and west boundaries have been modified in Figure 5-3. These two wells were installed to define these areas. The results indicate that the RDX plume is about 650 ft wide and 2000 ft long. Previous reports depicted this plume wider, perpendicular to the center line of the plume.
5.6 FIELD VARIANCES FROM WORK PLAN
The purpose of this section is to describe any variances from the established monitoring plan or sampling program. The following subsections describe variances and discrepancies for this reporting period.
5.6.1 Variation between Sampling Plan and Sample Collection
Eight new monitoring wells were sampled in April 2012: BGMW01, BGMW02, BGMW03, TMW43, TMW44, TMW45, TMW46, and TMW47. The 2011 GWMP does not specifically address collecting samples from these new monitoring wells. The 2011 GWMP also does not specifically address collecting samples from the sentinel wells. USACE collected a standard suite of groundwater samples from each new monitoring
April 2012 FWDA Groundwater PMR
Page 5-8
well and from MW23 and MW24 consisting of: nitrate/nitrite, total explosives, perchlorate, VOCs, SVOCS, pesticides, and metals (totals and dissolved). Due to limited groundwater availability, USACE was only able to collect nitrate/nitrite, VOCs and perchlorate samples from TMW40S.
5.6.2 Laboratory Anomalies: CMW18
Historically, CMW18 has had elevated concentrations of RDX and octahydro-1,3,5,7-tetranitro-1,3,5,7-tetrazocine (HMX). However, the analytical results from CMW18 in April showed a non-detect for RDX and HMX. The QC blind duplicate for CMW18, identified as FW03, and the QA triplicate for CMW18 both had elevated concentrations for RDX and HMX consistent with historical results. Suspecting a laboratory error, USACE requested the extra sample volume for CMW18 (held by the laboratory) be analyzed. The results from the subsequent analysis had elevated RDX and HMX concentrations that were consistent with previous sampling events and the QA/QC results. However, the extra sample volume was analyzed after the holding time specified in EPA Method 8330B, and thus results are qualified as estimated. USACE concludes that the original results from CMW18’s analysis for RDX and HMX are incorrect, most likely due to a labeling error in laboratory preparation or possibly an instrument loading error. Explosives results from the blind duplicate (FW03) are reported for CMW18 in Tables 5-2 and 5-9 and Figures 5-3 and 5-4. Refer to Appendix G1 for a narrative from the laboratory of the re-test of CMW18 for explosives and for the results of the re-test.
5.6.3 Laboratory Anomalies: MW23 and MW24
The results of samples from MW23 and MW24 showed elevated concentrations of toluene. USACE suspects that the concentration of toluene found in the sentinel wells is abnormally high. USACE will continue to monitor toluene in MW23 and MW24 in future sampling events to determine if the April 2012 toluene detections were accurate.
5.6.4 Laboratory Anomalies: TMW33 Equipment Blank
The results for the equipment blank rinsate for TMW33 (TMW33EB) showed an elevated concentration of nitrate, 12 mg/L. However, the primary sample for TMW33 had no nitrate detected in it.
5.6.5 Laboratory Anomalies: TMW03 and CMW24
The sample bottles for the explosives and SVOCs analyses of TMW03 and CMW24 were accidentally swapped in the laboratory. The results were initially reported under the wrong well identifications (due to the in-laboratory swap). However, the mistake was discovered when USACE compared the results to historical data, and the correct results are given in this report. The results reported for CMW24 contained RDX at high concentrations similar to those historically seen at TMW03. The results for CMW24 also reported detections of 2,4-dinitrotoluene, 2-amino-4,6-dinitrotoluene, HMX, and 1,3,5-trinitrobenzene, which are
April 2012 FWDA Groundwater PMR
Page 5-9
non-detect result for RDX, which CMW24 has historically had. The samples for TMW03 and CMW24 were prepped for explosives analysis at the same time. Suspecting that the samples were swapped in the laboratory, USACE requested that the additional collected sample volume, unused and held by the laboratory, for TMW03 and CMW24 be re-analyzed for explosives. For SVOCs, the laboratory originally reported that CMW24’s sample contained 19 µg/L of 2,4-dinitrophenol and TMW03’s sample was non-detect for 2,4-dinitrophenol. Historically, CMW24 has not had detections of 2,4-dinitrophenol while TMW03 has consistently had high concentrations of it. The samples for TMW03 and CMW24 were prepped for SVOCs analysis at the same time. Suspecting that the samples were swapped in the laboratory, USACE requested that the additional collected sample volume, unused and held by the laboratory, for TMW03 and CMW24 be re-analyzed for SVOCs. The re-analyses were conducted after the allowable hold times and thus the results are qualified. However, the results from these re-analyses more closely matched historical results, confirming USACE suspicions that the bottles were misidentified. USACE concludes that results were inadvertently assigned to the wrong sample ID. See Appendices G2 and G3 for the re-analysis results for CMW24 and TMW03, respectively.
April 2012 FWDA Groundwater PMR
Page 6-1
6.0 ANCILLARY ACTIVITIES Additional activities related to the groundwater monitoring program were executed during this reporting period. They are described in the paragraphs below. In February 2012, background monitoring wells BGMW01, BGMW02, and BGMW03 were installed in the Northern Area alluvial groundwater system along with wells TMW43, TMW44, TMW45, TMW46, and TMW47, refer to the 2011 and 2012 Monitoring Well Installation and Abandonment Report (USACE 2012). These efforts were conducted under the FWDA Monitoring Well Installation and Abandonment Work Plan (USGS 2011) submitted and approved by NMED in the spring of 2011. A summary of well installation and abandonment work completed in 2011 and 2012 was provided to NMED in December of 2012. The eight new wells and TMW40D were surveyed on April 18, 2012. Appendix F contains information on the installation of these new wells including the control survey (Appendix F1), the geologist logs (Appendix F2), and the construction diagrams (Appendix F3). The leaking cistern located in the Administration Area was shut off by USACE in August, with the purpose of reducing potential migration and dilution of contaminants. Surrounding monitoring wells will be used to evaluate the effects of shutting off the cistern, to include nitrate concentration and static water levels. There is a possibility that monitoring wells, MW01 and MW02 will become dry due to the drop in the water table.
April 2012 FWDA Groundwater PMR
Page 7-1
7.0 GROUNDWATER MONITORING AND SAMPLING ACTIVITY SUMMARY
Monitoring well static water levels measured in January and April 2012 were evaluated to determine groundwater flow and gradient. In the Northern Area of the installation, groundwater in the alluvial system locally flows from potentiometric highs in the north and south to a potentiometric low under the Administration Area. A groundwater mound was observed in the center of the Administration Area, which may be caused by a leaking water storage cistern. This mounding effect has been documented previous reports and does not appear to influence the general flow of groundwater. From the Administration Area, groundwater locally flows to the west. This general flow has been documented in previously submitted groundwater periodic monitoring reports.
In addition to the alluvial groundwater, groundwater is also present in bedrock beneath the Workshop Area, in a fine grained sandstone. Bedrock monitoring well measurements indicates bedrock groundwater flows in a westerly direction. Groundwater elevation measurements for the OB/OD Area indicate a general northern flow that roughly follows the topography.
Groundwater samples were collected during April 2012 from 82 monitoring wells. Groundwater samples collected from Northern Area monitoring wells contained nitrate, nitrite, VOCs, SVOCs, explosives, perchlorate, and metals in concentrations above regulatory health standards. Pesticides were also detected but at concentrations below applicable regulatory health standards. Five new monitoring wells (TMW43, TMW44, TMW45, TMW46, and TMW47) were installed to define the extent of the nitrate and RDX plume in the Northern Area alluvial groundwater system. Chemical analytical results of groundwater samples from these new alluvial monitoring wells contribute to changes in the geometry of the nitrate plume and indicate that the plume is larger than previous data indicated. Additionally, Chemical analytical results also indicate that the RDX plume is narrower than previously assumed. Three new monitoring wells (BGMW01, BGMW02, and BGMW03) were installed to define background chemical concentrations in alluvial Northern Area groundwater system. A borehole for BGMW04 was drilled. However, BGMW04 was dry, thus the borehole was abandoned and the well was not installed. Samples from background monitoring wells that were installed contained nitrate, dissolved selenium, and dissolved inorganic arsenic in levels above regulatory health standards. They also contained nitrite, perchlorate, SVOCs, and other metals, but at levels below regulatory health standards. Results from these wells will be used in an upcoming study of background chemical concentrations. In all, there are five distinct plumes in groundwater located in the Northern Area, a nitrate plume in the alluvial groundwater, an RDX plume in the alluvial groundwater, a perchlorate plume in the sandstone-bedrock groundwater, a low concentration 1,2-DCA
April 2012 FWDA Groundwater PMR
Page 7-2
plume in the alluvial groundwater in the Administration Area, and a perchlorate plume in the alluvial groundwater. In addition to these plumes, nitrate concentrations above the MCL are found in samples collected from bedrock monitoring wells. This bedrock nitrate appears to be comingled with the perchlorate plume but is not especially definable. USACE has attempted to correlate bedrock nitrate concentrations, but no definitive pattern has been found. Groundwater samples collected from monitoring wells located in the OB/OD Area contained SVOCs, explosives, and metals above applicable regulatory health standards. Additional chemical constituents were detected in OB/OD Area groundwater samples, but these concentrations were below established regulatory health standards. Because no apparent pattern exists in OB/OD groundwater sample results, no isoconcentration maps were created. However, results are shown in Figure 5-6. Samples collected from the two Sentinel Wells contained nitrate, VOCs, SVOCs, metals, and a pesticide in April 2012. Toluene, dissolved iron, and dissolved manganese were the only chemicals whose concentrations exceeded regulatory health standards. As of April 2012, there is no evidence of off-site contaminant migration.
April 2012 FWDA Groundwater PMR
Page 8-1
8.0 REFERENCES Environmental Protection Agency (EPA). 2009. Statistical Analysis of Groundwater Monitoring Data at RCRA Facilities. EPA Office of Resource Conservation and Recovery, March 2009. Herndon Solutions Group (HSG) 2011. Interim Facility-Wide Groundwater Monitoring Plan, Version 5, Fort Wingate Depot Activity, McKinley County, New Mexico, July 2011. Herndon Solutions Group (HSG) 2011. Interim Facility-Wide Groundwater Monitoring Plan, Version 5, Fort Wingate Depot Activity, McKinley County, New Mexico, July 2011. New Mexico Environment Department (NMED). 2001. Use of Low-Flow and Other Non-Traditional Sampling Techniques for RCRA Compliant Groundwater Monitoring. New Mexico Environment Department, October 30, 2001. New Mexico Environment Department (NMED). 2003. General Reporting Requirements for Routine Groundwater Monitoring at RCRA Sites. New Mexico Environment Department, February 14, 2003. New Mexico Environment Department (NMED). 2005. Resource Conservation and Recovery Act permit, EPA ID No. NM 6213820974. New Mexico Environment Department Hazardous Waste Bureau, December 1, 2005. New Mexico Environment Department (NMED). 2009. Tammy Diaz “Proposed Groundwater Sample Collection,” Email to David Henry at USACE, September 23, 2009. New Mexico Environment Department (NMED). 2010. Approval with Modifications to the March 28, 2008 Interim Facility Wide Ground Water Monitoring Plan, Fort Wingate Depot Activity, EPA ID No. NM6213820974, April 2010. New Mexico Environment Department (NMED). 2011. Approval with Modifications, FWDA Groundwater Periodic Monitoring Report for April 2010 to July 2010, Fort Wingate Depot Activity, EPA No. NM 6213820974, August 2011. New Mexico Institute of Mining and Technology (NMT). 2003. Geology of Fort Wingate Quadrangle, McKinley County, New Mexico, Orin J. Anderson, Charles H. Maxwell, and Spencer G. Lucas, New Mexico Institute of Mining and Technology, Socorro, New Mexico, September 2003. PMC Environmental (PMC). 1999. Final Open Burning/Open Detonation Area RCRA Interim Status Closure Plan Phase IB - Characterization and Assessment of Site Conditions for the Groundwater Matrix, FWDA, Gallup, New Mexico. TerranearPMC (TPMC). 2006. Supplemental Groundwater Investigation – Administration and TNT Leaching Beds Areas, FWDA, Gallup, New Mexico, March
April 2012 FWDA Groundwater PMR

Page 8-2
2006. TerranearPMC (TPMC). 2008. Interim Facility-Wide Groundwater Monitoring Plan, FWDA, Gallup, New Mexico, March 2008. U.S. Army Corps of Engineers, Albuquerque District (USACE). 2010. Groundwater Periodic Monitoring Report for October 2010 through January 2010, FWDA, McKinley County, New Mexico, May 2011. U.S. Army Corps of Engineers, Albuquerque District (USACE). 2011. Groundwater Periodic Monitoring Report for April through July 2010, FWDA, McKinley County, New Mexico, December 2010. U.S. Army Corps of Engineers, Albuquerque District (USACE). 2012. 2011 and 2012 Monitoring Well Installation and Abandonment Report, Version 1, Fort Wingate Depot Activity (EPA ID NM6213820974), McKinley County, New Mexico, December 2012. U.S. Army Corps of Engineers, Albuquerque District (USACE). 2013. Off-Site Wells Groundwater Periodic Monitoring Report for April 2012 (Version 1), Prepared for Fort Ingate Depot Activity, Gallup, New Mexico, January 2013. U.S. Army Corps of Engineers, Fort Worth District (USACE). 2011. Final RCRA Facility Investigation, Parcel 22, Fort Wingate Depot Activity, McKinley County, December 9, 2011. U.S. Geological Survey. (USGS) 2011. Fort Wingate Depot Activity Monitoring Well Installation and Abandonment Work Plan, FWDA, McKinley County, New Mexico, April 2011.
April 2012 FWDA Groundwater PMR
TABLES
SECTION 2 TABLES
Well ID
Total Explosives
Method 8330A
TCL VOC Method 8260C
TCL SVOC Method 8270D
TCL Pesticides
Method 8081A
TALTotal Metals
Methods 6020B/7470
TAL Diss Metals
Methods 6020B/7470
Total Nitrate/Nitrite Method 300.0
Perchlorate Method 6850
TPH DRO Method 8015B
TPH GRO Method 8015B
CMW02 X X X X X XCMW04 X X X XCMW07 X X X X XCMW10 X X X X X X XCMW14 X X X X X X XCMW17 X X X X X XCMW18 X X X X X X XCMW19 X X X X X X X XCMW22 X X X XCMW23 X X X X XCMW24 X X X X X X XCMW25 X X X X XKMW09 X X X X X XKMW10 X X X X X XKMW11 X X X X X XKMW12 X X X X X
BGMW011 X X X X X X X XBGMW021 X X X X X X X XBGMW031 X X X X X X X X
FW31 X X X X XFW35 X X X X X XMW01 X X X X X X X X XMW02 X X X X X X X X XMW03 X X X X X X X X
MW18D X X X X X X X XMW20 X X X X X X X X X X
MW22D X X X X X X X X X XMW22S X X X X X X X X X XMW232 X X X X X X X XMW242 X X X X X X X X
SMW01 X X X X X X XTMW01 X X X X X XTMW03 X X X X X X XTMW04 X X X X X X XTMW06 X X X X X XTMW07 X X X X X XTMW08 X X X X X XTMW10 X X X X X XTMW11 X X X X X XTMW13 X X X X XTMW15 X X X X X X XTMW21 X X X X X XTMW22 X X X X X X XTMW23 X X X X X X XTMW24 X X X X X X XTMW25 X X X X XTMW26 X X X X X XTMW27 X X X XTMW28 X X XTMW29 X X X X X X
TMW31S X X X X X X X X X
OB/OD Area Monitoring Wells
Northern Area Monitoring Wells Alluvial Monitoring Wells
Table 2-1: 2011 Revised Monitoring Plan Sampling Requirement
1 of 2April 2012 FWDA Groundwater PMR
Well ID
Total Explosives
Method 8330A
TCL VOC Method 8260C
TCL SVOC Method 8270D
TCL Pesticides
Method 8081A
TALTotal Metals
Methods 6020B/7470
TAL Diss Metals
Methods 6020B/7470
Total Nitrate/Nitrite Method 300.0
Perchlorate Method 6850
TPH DRO Method 8015B
TPH GRO Method 8015B
TMW33 X X X x x X XTMW34 X X X X X X XTMW35 X X X X X X X
TMW39S X X X X X X X XTMW40S X X X X X X X XTMW41 X X X X X X X XTMW431 X X X X X X X XTMW441 X X X X X X X XTMW451 X X X X X X X XTMW461 X X X X X X X XTMW471 X X X X X X X
EMW01 X X X X X X XEMW02 X X X X X X XEMW03 X X X X X X XEMW04 X X X X XTMW02 X X X X X X
TMW14A X X X X X X XTMW16 X X X X X XTMW17 X X X X XTMW18 X X X X X X XTMW19 X X X X XTMW30 X X X X X X X X X
TMW31D X X X X X X X X XTMW32 X X X X X X X X XTMW36 X X X X X X X X XTMW37 X X X X X X X X XTMW38 X X X X X X X X
TMW39D X X X X X X X XTMW40D X X X X X X X XTMW48 X X X X X X X XTMW49 X X X X X X X X
X: Sample To Be Collected
TAL: Target Analyte ListSVOC: Semi-Volatile Organic Compounds VOC: Volatile Organic Compounds
GRO/DRO: Gasoline Range Organics/Diesel Range Organics
2. New monitoring wells installed Fall 2011
Northern Area Monitoring Wells Monitoring Bedrock Wells
1. New monitoring well installed February 2012
TPH: Total Petroleum HydrocarbonsTCL: Target Compound List
Table 2-1: 2011 Revised Monitoring Plan Sampling Requirement
2 of 2April 2012 FWDA Groundwater PMR
Well ID Casing Dia. (in)
Well TD (ft-btoc)
Screen Length (ft) Date
Purge Method
Start DTW
(ft-btoc)
End DTW
(ft-btoc)
Purge Time (min)
Flow Rate
(mL/min)
Purge Volume (gals) pH
Cond. (uS/cm)
Temp. (C)
Turbidity (NTU)
DO (mg/L)
BGMW01* 2.5 34 20 04/25/12 Low flow 18.38 18.71 30 180 1.57 7.57 3560 12.71 0.93 0.48BGMW02* 2.5 34.2 20 04/25/12 Low flow 20.46 20.56 30 200 1.61 7.55 5440 14.1 2.38 0.12BGMW03* 2.5 30.9 20 04/21/12 Baiter 15.60 30.23 35 N/A 7 8.15 3140 11.99 1100 4.38CMW02 2 37.9 10 04/16/12 Low flow 14.41 14.41 45 200 2.67 8.29 730 10.68 2.68 0.94CMW04 2 137.91 20 04/17/12 Low flow 46.31 46.32 20 200 1.03 8.3 521 12.93 0.00 0.31CMW07 2 66.6 20 04/19/12 Low flow 42.34 42.07 67 100 1.73 8.21 1520 14.32 0.00 1.04CMW10 2 73.1 20 04/17/12 Bailed dry 65.27 70 85 N/A 5 11.72 5600 11.86 4.4 4.98CMW14 2 96.75 10 04/19/12 ZIST, low flow 65.84 67.89 47 30 1 11.87 5840 15.31 8.61 0.04CMW17 2 54.24 20 04/16/12 12-volt pump 23.68 51 27 N/A 16 8.8 1130 11.80 600.00 1.69CMW18 2 54.1 20 04/17/12 Low flow 41.9 42.12 22 150 1 7.41 867 13.72 0.00 4.95CMW19 2 51.3 15 04/19/12 ZIST low flow 26.04 N/A 215 200 3 9.89 1530 12.50 53.35 1.14CMW22 2 120.23 20 04/17/12 Bailed dry 114.59 120.1 20 N/A 1.75 7.30 N/A N/A 413.10 N/ACMW23 2 106.6 20 04/17/12 Bailed dry 97.50 104.25 17 N/A 3 8.34 5450 12.13 161.8 2.89CMW24 2 262.34 30 04/24/12 Low flow 45.63 50.75 150 75 2.96 8.76 2810 19.00 76.96 0.06CMW25 2 98.78 25 04/20/12 Low flow ZIST 37.59 37.59 15 100 1.5 8.69 1064 14.99 27.64 0.13EMW01 2 120.7 15 04/23/12 Low flow 104.09 106.48 12 50 0.3 8.55 8090 19.41 1.09 1.73EMW02 2 108.4 15 04/23/12 Low flow 46.73 44.57 14 75 0.4 8.18 6790 19.97 0.30 0.92EMW03 2 92.9 15 04/23/12 Low flow 46.73 37.86 12 40 0.2 11.03 6410 22.41 0.30 1.18EMW04 2 115 15 04/13/12 Bennett pump 101.4 Dry 10 N/A 8 7.45 1093 13.3 8.34 1.40FW31 4 52 40 04/17/12 12-volt pump 41.91 43 14 N/A 13 8.27 2285 12.6 74.6 4.05FW35 4 32.15 20 04/17/12 12-volt pump 22.56 23.23 11 NA 11 7.35 4120 12 54 1.2KMW09 2 72.9 10 04/18/12 Low flow ZIST 40.72 42.48 65 75 1.29 7.46 352 15.95 0.00 1.37KMW10 2 171.02 10 04/18/12 Bailed dry 166.81 169.04 35 N/A 4.00 7.09 900 12.86 304.00 4.00KMW11 2 57.44 20 04/18/12 Low flow 32.71 33.64 40 80 0.85 8.62 1014 12.81 0.1 1.26KMW12 2 75.49 20 04/17/12 Bennett pump 54.53 72.00 17 N/A 19.00 7.37 4090 11.50 33.60 4.34MW01 4 54.8 20 04/17/12 Bailed dry 42.11 53.75 21 N/A 4 7.78 3630 14.89 759.3 2.99MW02 2 49.45 10 04/16/12 Bailed dry 39.01 49.02 35 N/A 2.5 7.05 2430 14.81 638.8 6.72MW03 2 56.2 10 04/20/12 Low flow 46.1 46.52 25 90 0.57 7.37 5070 14.54 0 2.3MW18D 2 59.9 10 04/19/12 Low flow 42.93 44.19 30 90 0.71 6.96 8010 17.34 0.97 1.93MW20 2 59.4 10 04/24/12 Low flow 44.95 45.48 45 100 1.19 6.92 18400 1570 0 1.17MW22D 2 58.7 10 04/19/12 Low flow 41.68 42.03 35 210 1.94 6.76 5015 15.15 0.65 1.72MW22S 2 43.54 10 04/16/12 Bailed dry 41.74 43.28 18 N/A 1 7.23 4220 15.91 1100 3.22MW23** 2.5 134 70 04/25/12 Bennett Pump 14.4 >80 42 N/A 55.6 8.01 1930 13.55 109.3 4.31MW24** 2.5 68.5 50 04/26/12 Bennett Pump 19 30.8 16 1.25 150 8.41 1307 11.8 119.9 0.76SMW01 2 52.15 20 04/20/12 Low flow 28.82 30.78 35 150 1.39 7.87 1970 12.58 0.38 2.3TMW01 2 61.23 15 04/23/12 Low flow 36.96 37.47 50 250 3.31 7.48 2880 13.62 0.94 1.09TMW02 2 84.09 14 04/24/12 Low flow 55.44 55.97 30 140 1.1 7.95 4420 16.49 0 0.42TMW03 2 72.06 20 04/25/12 Low flow 56.95 57.13 45 150 1.78 7.73 4320 15.79 0.71 1.2
Table 2-2: April 2012 Groundwater Purge Records
1 of 3April 2012 FWDA Groundwater PMR
Well ID Casing Dia. (in)
Well TD (ft-btoc)
Screen Length (ft) Date
Purge Method
Start DTW
(ft-btoc)
End DTW
(ft-btoc)
Purge Time (min)
Flow Rate
(mL/min)
Purge Volume (gals) pH
Cond. (uS/cm)
Temp. (C)
Turbidity (NTU)
DO (mg/L)
TMW04 2 72.36 20 04/25/12 Low flow 56.37 57.01 53 130 2.4 7.93 3960 15.44 0.51 0.65TMW06 2 57.24 10 04/18/12 Low flow 46.98 47.18 45 140 1.66 7.61 3740 17.53 0.01 0.71TMW07 2 67.37 10 04/18/12 Bailed dry 47.03 64.65 20 N/A 5 7.55 5110 13.13 491.9 3.68TMW08 2 62.41 30 04/19/12 Low flow 36.58 36.79 40 140 1.48 6.87 1670 13.9 66.08 2.1TMW10 2 61.8 30 04/24/12 Low flow 37.28 38.9 27 200 2.49 7.42 8880 15.04 0 1.3TMW11 2 82.68 25 04/20/12 Low flow 66.32 67.23 48 200 2.53 7.68 2160 13.96 1.02 3.67TMW13 2 73.78 10 04/23/12 Low flow 59.82 59.98 42 100 1.11 7.49 2270 17.24 1.88 1.61TMW14A 2 112.1 15 04/21/12 ZIST low flow 63.56 63.56 47 60 0.74 8.72 1880 14.95 0.00 1.48TMW15 2 76.65 15 04/23/12 Low flow 64.00 64.29 33 200 1.74 7.72 2240 15.22 0.77 2.57TMW16 2 142.2 15 04/19/12 Bennett pump 69.70 138.00 30 N/A 40 8.51 1875 13.2 392.0 3.25TMW17 2 130.45 15 04/24/12 Low flow 62.18 63.7 25 80 0.55 9.26 1860 14.08 0 0.3TMW18 2 160.7 10 04/17/12 Bennett pump 136.93 157.00 9 N/A 22 9.55 2890 13.9 58.0 4.85TMW19 2 187.97 15 04/17/12 Bennet pump 42.30 42.30 48 N/A 55 8.16 2880 15.1 102 0.88TMW21 2 61.43 10 04/17/12 Low flow 50.63 52.62 21 100 2 7.82 2670 14.67 1.6 0.24TMW22 2 65.23 10 04/16/12 Bailed dry 48.85 60.42 47 NA 8 8.20 3620 13.42 1100.0 3.81TMW23 2 59.57 10 04/21/12 Bailed dry 45.65 55.52 16 N/A 5 7.94 3280 12.8 433.20 6.59TMW24 2 55.41 10 04/23/12 Low flow 38.82 42.15 35 155 1.5 7.77 3860 15 0.49 0.65TMW25 2 55 10 04/17/12 Low flow 39.04 42.06 27 140 2 7.67 3910 12.87 5.36 0.14TMW26 2 58.24 10 04/20/12 Low flow 26.36 29.10 34 200 3 7.96 3530 12.92 1.20 0.07TMW27 2 73.26 10 04/25/12 Low flow 27.71 28.69 37 125 1.22 7.86 1530 14.93 0.00 1.08TMW28 2 50.3 10 04/21/12 Low flow 19.04 19.08 55 120 1.8 7.24 1520 13.06 0.00 1.23TMW29 2 61.65 10 04/21/12 Bailed dry 57.12 59.98 10 N/A 0.2 8.24 2500 13.21 257.40 4.93TMW30 2 46.65 10 04/18/12 12-volt pump 39.71 Dry 17 N/A 15 7.78 2347 13.3 7.99 5.56TMW31D 2 107.03 30 04/23/12 Low flow 36.34 36.74 40 280 2.96 7.58 2520 13.71 0.00 1.88TMW31S 2 62.85 10 04/18/12 12-volt pump 36.12 61.00 17 N/A 14 7.46 2960 13.3 763.00 2.90TMW32 2 139.1 20 04/24/12 Low flow 38.80 39.10 30 154 1.26 8.34 3370 16 0.00 0.42TMW33 2 60.65 20 04/18/12 12-volt pump 43.46 43.61 14 NA 14 7.48 1100 15.7 150.00 0.34TMW34 2 60.01 20 04/24/12 Low flow 45.50 38.79 21 180 2 7.08 6110 16.44 6.46 1.17TMW35 2 57.31 20 04/23/12 Low flow 43.60 43.69 70 120 2.22 7.24 5200 17.88 0.00 0.16TMW36 2 154.35 20 04/19/12 Bennett pump 26.18 152.00 38 N/A 30 7.80 2970 13.2 12.01 0.55TMW37 2 110.7 20 04/20/12 Bennett pump 61.25 107.00 15 N/A 33 8.69 2410 13.4 28.50 3.28TMW38 2 115.02 40 04/20/12 Bennett pump 46.25 51.14 25 170 1.13 8.64 2500 13.69 2.04 1.35TMW39D 2 102.77 30 04/23/12 Low flow 34.31 34.55 52 250 3.44 7.73 2890 13.42 0.00 0.11TMW39S 2 55.5 10 04/19/12 12 volt pump 34.90 38.94 12 N/A 8.5 7.70 4210 13.7 869.00 1.94TMW40D 2 158.13 20 04/23/12 Low flow 31.30 31.38 35 270 2.6 8.17 3180 14.13 0.17 0.31TMW40S 2 62 10 04/23/12 Bailed 60.35 61.65 20 N/A 2 8.14 3430 13.05 1100.00 4.73TMW41 2 67.8 10 04/19/12 12-volt pump 40.05 Dry 17 N/A 18 7.98 4280 12.9 62.50 0.83TMW43* 2.5 79.6 20 04/24/12 Low flow 53.26 53.40 77 130 4.23 7.49 2450 16.12 5.74 0.91
Table 2-2: April 2012 Groundwater Purge Records
2 of 3April 2012 FWDA Groundwater PMR

Well ID Casing Dia. (in)
Well TD (ft-btoc)
Screen Length (ft) Date
Purge Method
Start DTW
(ft-btoc)
End DTW
(ft-btoc)
Purge Time (min)
Flow Rate
(mL/min)
Purge Volume (gals) pH
Cond. (uS/cm)
Temp. (C)
Turbidity (NTU)
DO (mg/L)
TMW44* 2.5 66.2 20 04/25/12 12 volt pump 52.60 52.72 11 N/A 10.5 7.97 3330 13.4 946.00 2.65TMW45* 2.5 61.8 20 04/23/12 12 volt pump 47.90 47.90 28 N/A 18 7.72 3890 13.1 793.00 2.72TMW46* 2.5 60.7 20 04/23/12 12 volt pump 44.40 44.40 14 N/A 14 7.60 5390 13.9 332.00 1.63TMW47* 2.5 105.6 20 04/25/12 Low flow 46.38 47.93 50 35 0.52 8.48 2320 19.13 3.89 1.26TMW48 2 93.55 20 04/25/12 Low flow 34.78 34.80 60 450 7.14 7.38 2450 12.74 0.00 3.56TMW49 2 62.17 20 04/25/12 Low flow 42.94 43.82 31 130 2.4 7.73 2700 13.41 0.11 3.69
**: New monitoring well installed Fall 2011
btoc: Below Top of Casing
gals: Gallons
N/A: Not Applicable*: New monitoring well installed February 2012
Dia.: Diameter
TD: Total Depth
DTW: Depth to Water
Cond.: Conductivty
DO: Dissolved Oxygen
in: Inches
min: Minutes
uS/cm: MicroSiemens per Centimeter
NTU: Nephelometric Turbidity Units
mg/L: Milligrams per LiterZIST: Zone Isolation System Technology
ft: Feet
mL/min: Milliliters per Minute
Temp. (C): Temperature in Celsius
Table 2-2: April 2012 Groundwater Purge Records
3 of 3April 2012 FWDA Groundwater PMR
SECTION 4 TABLES
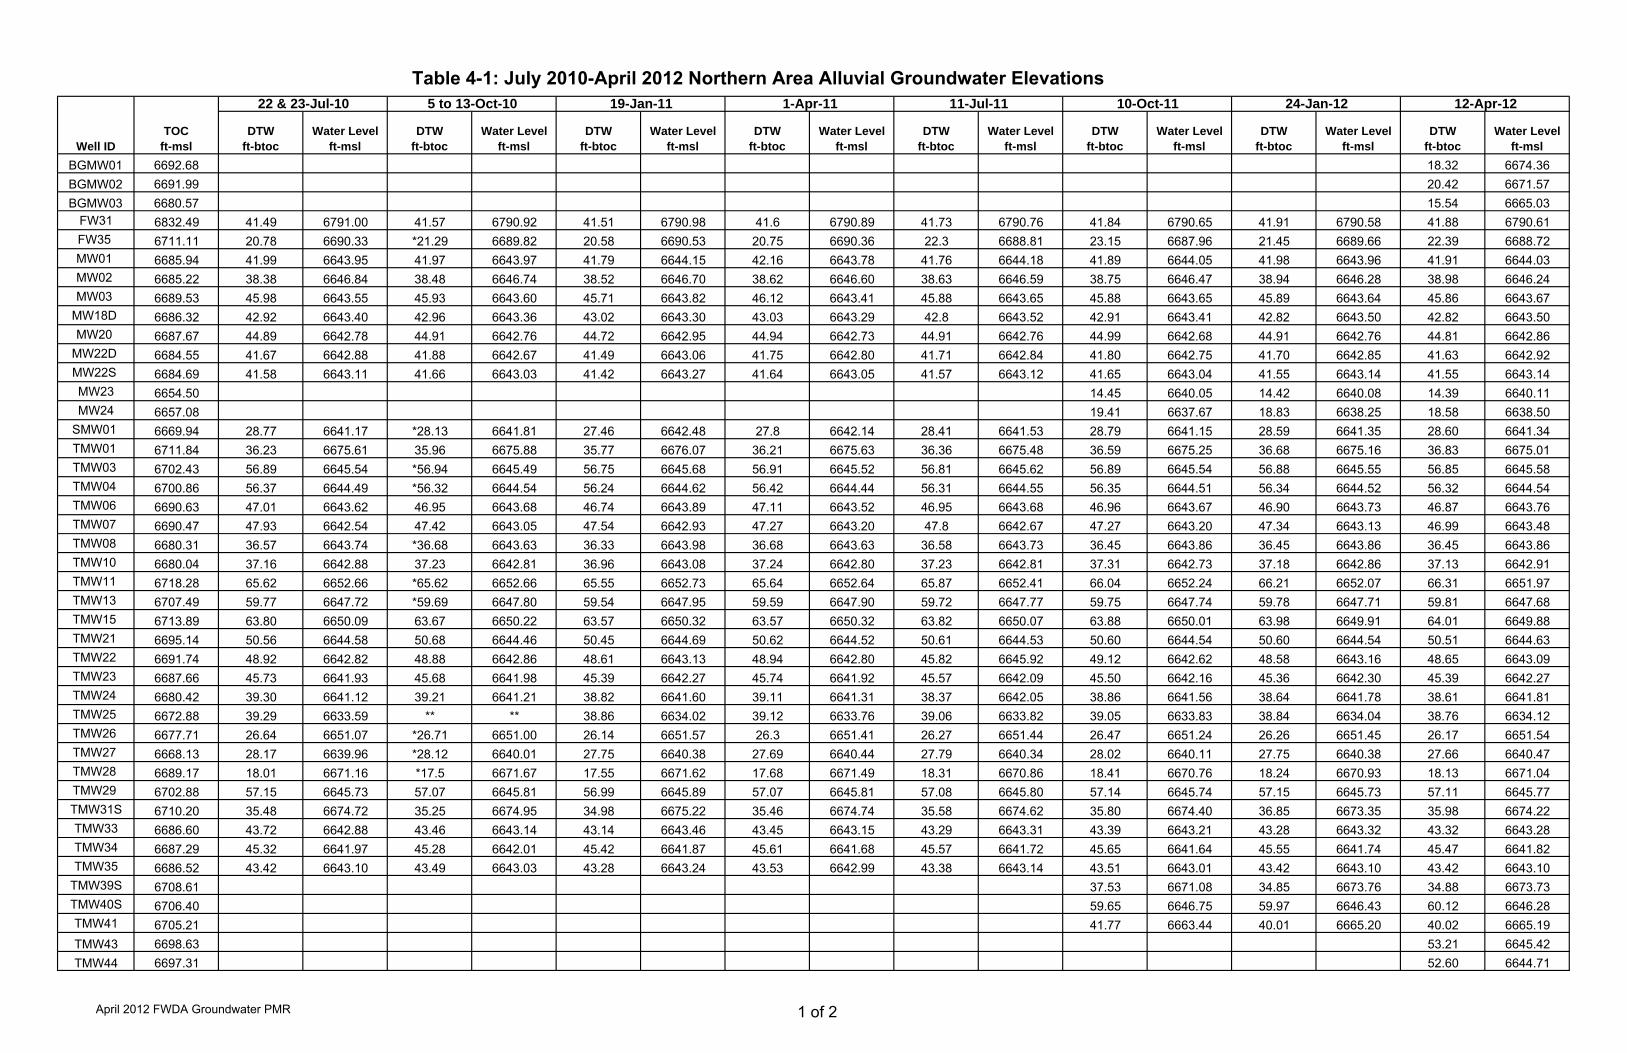
BGMW01 6692.68 18.32 6674.36BGMW02 6691.99 20.42 6671.57BGMW03 6680.57 15.54 6665.03
FW31 6832.49 41.49 6791.00 41.57 6790.92 41.51 6790.98 41.6 6790.89 41.73 6790.76 41.84 6790.65 41.91 6790.58 41.88 6790.61FW35 6711.11 20.78 6690.33 *21.29 6689.82 20.58 6690.53 20.75 6690.36 22.3 6688.81 23.15 6687.96 21.45 6689.66 22.39 6688.72MW01 6685.94 41.99 6643.95 41.97 6643.97 41.79 6644.15 42.16 6643.78 41.76 6644.18 41.89 6644.05 41.98 6643.96 41.91 6644.03MW02 6685.22 38.38 6646.84 38.48 6646.74 38.52 6646.70 38.62 6646.60 38.63 6646.59 38.75 6646.47 38.94 6646.28 38.98 6646.24MW03 6689.53 45.98 6643.55 45.93 6643.60 45.71 6643.82 46.12 6643.41 45.88 6643.65 45.88 6643.65 45.89 6643.64 45.86 6643.67
MW18D 6686.32 42.92 6643.40 42.96 6643.36 43.02 6643.30 43.03 6643.29 42.8 6643.52 42.91 6643.41 42.82 6643.50 42.82 6643.50MW20 6687.67 44.89 6642.78 44.91 6642.76 44.72 6642.95 44.94 6642.73 44.91 6642.76 44.99 6642.68 44.91 6642.76 44.81 6642.86
MW22D 6684.55 41.67 6642.88 41.88 6642.67 41.49 6643.06 41.75 6642.80 41.71 6642.84 41.80 6642.75 41.70 6642.85 41.63 6642.92MW22S 6684.69 41.58 6643.11 41.66 6643.03 41.42 6643.27 41.64 6643.05 41.57 6643.12 41.65 6643.04 41.55 6643.14 41.55 6643.14MW23 6654.50 14.45 6640.05 14.42 6640.08 14.39 6640.11MW24 6657.08 19.41 6637.67 18.83 6638.25 18.58 6638.50
SMW01 6669.94 28.77 6641.17 *28.13 6641.81 27.46 6642.48 27.8 6642.14 28.41 6641.53 28.79 6641.15 28.59 6641.35 28.60 6641.34TMW01 6711.84 36.23 6675.61 35.96 6675.88 35.77 6676.07 36.21 6675.63 36.36 6675.48 36.59 6675.25 36.68 6675.16 36.83 6675.01TMW03 6702.43 56.89 6645.54 *56.94 6645.49 56.75 6645.68 56.91 6645.52 56.81 6645.62 56.89 6645.54 56.88 6645.55 56.85 6645.58TMW04 6700.86 56.37 6644.49 *56.32 6644.54 56.24 6644.62 56.42 6644.44 56.31 6644.55 56.35 6644.51 56.34 6644.52 56.32 6644.54TMW06 6690.63 47.01 6643.62 46.95 6643.68 46.74 6643.89 47.11 6643.52 46.95 6643.68 46.96 6643.67 46.90 6643.73 46.87 6643.76TMW07 6690.47 47.93 6642.54 47.42 6643.05 47.54 6642.93 47.27 6643.20 47.8 6642.67 47.27 6643.20 47.34 6643.13 46.99 6643.48TMW08 6680.31 36.57 6643.74 *36.68 6643.63 36.33 6643.98 36.68 6643.63 36.58 6643.73 36.45 6643.86 36.45 6643.86 36.45 6643.86TMW10 6680.04 37.16 6642.88 37.23 6642.81 36.96 6643.08 37.24 6642.80 37.23 6642.81 37.31 6642.73 37.18 6642.86 37.13 6642.91TMW11 6718.28 65.62 6652.66 *65.62 6652.66 65.55 6652.73 65.64 6652.64 65.87 6652.41 66.04 6652.24 66.21 6652.07 66.31 6651.97TMW13 6707.49 59.77 6647.72 *59.69 6647.80 59.54 6647.95 59.59 6647.90 59.72 6647.77 59.75 6647.74 59.78 6647.71 59.81 6647.68TMW15 6713.89 63.80 6650.09 63.67 6650.22 63.57 6650.32 63.57 6650.32 63.82 6650.07 63.88 6650.01 63.98 6649.91 64.01 6649.88TMW21 6695.14 50.56 6644.58 50.68 6644.46 50.45 6644.69 50.62 6644.52 50.61 6644.53 50.60 6644.54 50.60 6644.54 50.51 6644.63TMW22 6691.74 48.92 6642.82 48.88 6642.86 48.61 6643.13 48.94 6642.80 45.82 6645.92 49.12 6642.62 48.58 6643.16 48.65 6643.09TMW23 6687.66 45.73 6641.93 45.68 6641.98 45.39 6642.27 45.74 6641.92 45.57 6642.09 45.50 6642.16 45.36 6642.30 45.39 6642.27TMW24 6680.42 39.30 6641.12 39.21 6641.21 38.82 6641.60 39.11 6641.31 38.37 6642.05 38.86 6641.56 38.64 6641.78 38.61 6641.81TMW25 6672.88 39.29 6633.59 ** ** 38.86 6634.02 39.12 6633.76 39.06 6633.82 39.05 6633.83 38.84 6634.04 38.76 6634.12TMW26 6677.71 26.64 6651.07 *26.71 6651.00 26.14 6651.57 26.3 6651.41 26.27 6651.44 26.47 6651.24 26.26 6651.45 26.17 6651.54TMW27 6668.13 28.17 6639.96 *28.12 6640.01 27.75 6640.38 27.69 6640.44 27.79 6640.34 28.02 6640.11 27.75 6640.38 27.66 6640.47TMW28 6689.17 18.01 6671.16 *17.5 6671.67 17.55 6671.62 17.68 6671.49 18.31 6670.86 18.41 6670.76 18.24 6670.93 18.13 6671.04TMW29 6702.88 57.15 6645.73 57.07 6645.81 56.99 6645.89 57.07 6645.81 57.08 6645.80 57.14 6645.74 57.15 6645.73 57.11 6645.77TMW31S 6710.20 35.48 6674.72 35.25 6674.95 34.98 6675.22 35.46 6674.74 35.58 6674.62 35.80 6674.40 36.85 6673.35 35.98 6674.22TMW33 6686.60 43.72 6642.88 43.46 6643.14 43.14 6643.46 43.45 6643.15 43.29 6643.31 43.39 6643.21 43.28 6643.32 43.32 6643.28TMW34 6687.29 45.32 6641.97 45.28 6642.01 45.42 6641.87 45.61 6641.68 45.57 6641.72 45.65 6641.64 45.55 6641.74 45.47 6641.82TMW35 6686.52 43.42 6643.10 43.49 6643.03 43.28 6643.24 43.53 6642.99 43.38 6643.14 43.51 6643.01 43.42 6643.10 43.42 6643.10
TMW39S 6708.61 37.53 6671.08 34.85 6673.76 34.88 6673.73TMW40S 6706.40 59.65 6646.75 59.97 6646.43 60.12 6646.28TMW41 6705.21 41.77 6663.44 40.01 6665.20 40.02 6665.19TMW43 6698.63 53.21 6645.42TMW44 6697.31 52.60 6644.71
12-Apr-12
DTW ft-btoc
Water Level ft-msl
22 & 23-Jul-10 19-Jan-11
Water Level ft-msl
1-Apr-11 24-Jan-12
DTW ft-btoc
Water Level ft-msl
DTW ft-btoc
Water Level ft-msl
DTW ft-btoc
Water Level ft-msl
Water Level ft-msl
DTW ft-btoc
Water Level ft-msl
DTW ft-btoc
DTW ft-btocWell ID
TOC ft-msl
5 to 13-Oct-10
DTW ft-btoc
Water Level ft-msl
11-Jul-11 10-Oct-11
Table 4-1: July 2010-April 2012 Northern Area Alluvial Groundwater Elevations
1 of 2April 2012 FWDA Groundwater PMR
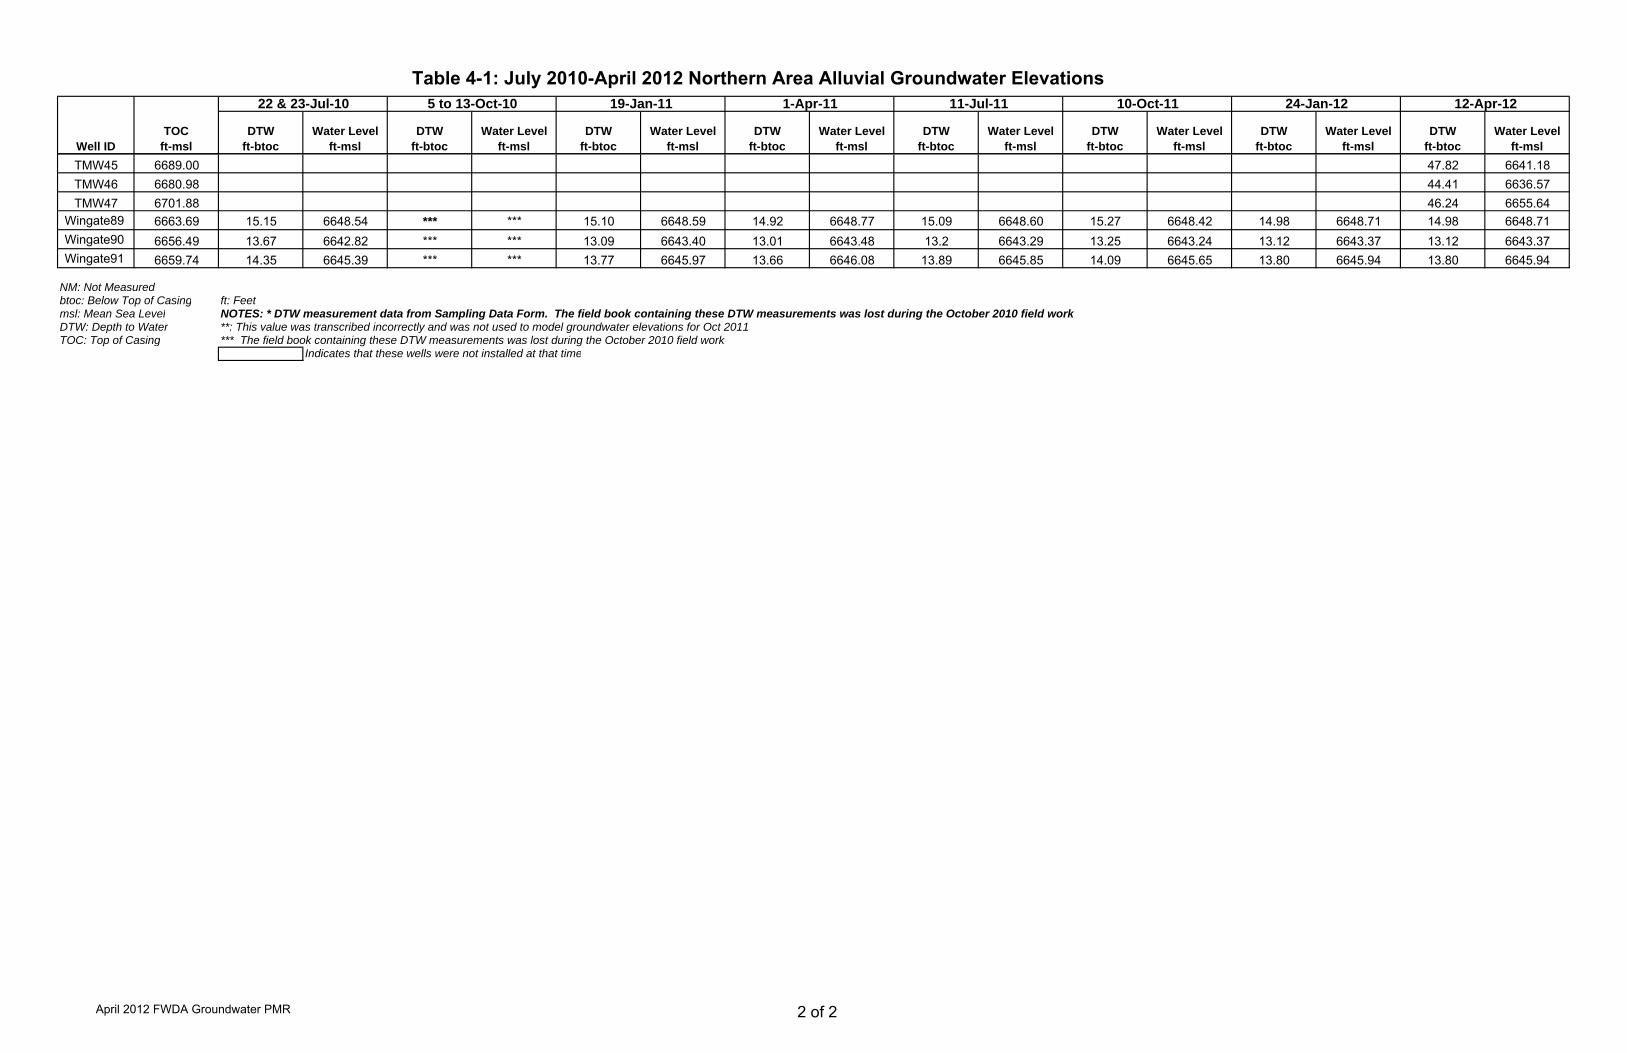
12-Apr-12
DTW ft-btoc
Water Level ft-msl
22 & 23-Jul-10 19-Jan-11
Water Level ft-msl
1-Apr-11 24-Jan-12
DTW ft-btoc
Water Level ft-msl
DTW ft-btoc
Water Level ft-msl
DTW ft-btoc
Water Level ft-msl
Water Level ft-msl
DTW ft-btoc
Water Level ft-msl
DTW ft-btoc
DTW ft-btocWell ID
TOC ft-msl
5 to 13-Oct-10
DTW ft-btoc
Water Level ft-msl
11-Jul-11 10-Oct-11
TMW45 6689.00 47.82 6641.18TMW46 6680.98 44.41 6636.57TMW47 6701.88 46.24 6655.64
Wingate89 6663.69 15.15 6648.54 *** *** 15.10 6648.59 14.92 6648.77 15.09 6648.60 15.27 6648.42 14.98 6648.71 14.98 6648.71Wingate90 6656.49 13.67 6642.82 *** *** 13.09 6643.40 13.01 6643.48 13.2 6643.29 13.25 6643.24 13.12 6643.37 13.12 6643.37Wingate91 6659.74 14.35 6645.39 *** *** 13.77 6645.97 13.66 6646.08 13.89 6645.85 14.09 6645.65 13.80 6645.94 13.80 6645.94
ft: FeetNOTES: * DTW measurement data from Sampling Data Form. The field book containing these DTW measurements was lost during the October 2010 field work**: This value was transcribed incorrectly and was not used to model groundwater elevations for Oct 2011 *** The field book containing these DTW measurements was lost during the October 2010 field work.
Indicates that these wells were not installed at that timeTOC: Top of Casing
NM: Not Measured
msl: Mean Sea LevelDTW: Depth to Water
btoc: Below Top of Casing
Table 4-1: July 2010-April 2012 Northern Area Alluvial Groundwater Elevations
2 of 2April 2012 FWDA Groundwater PMR
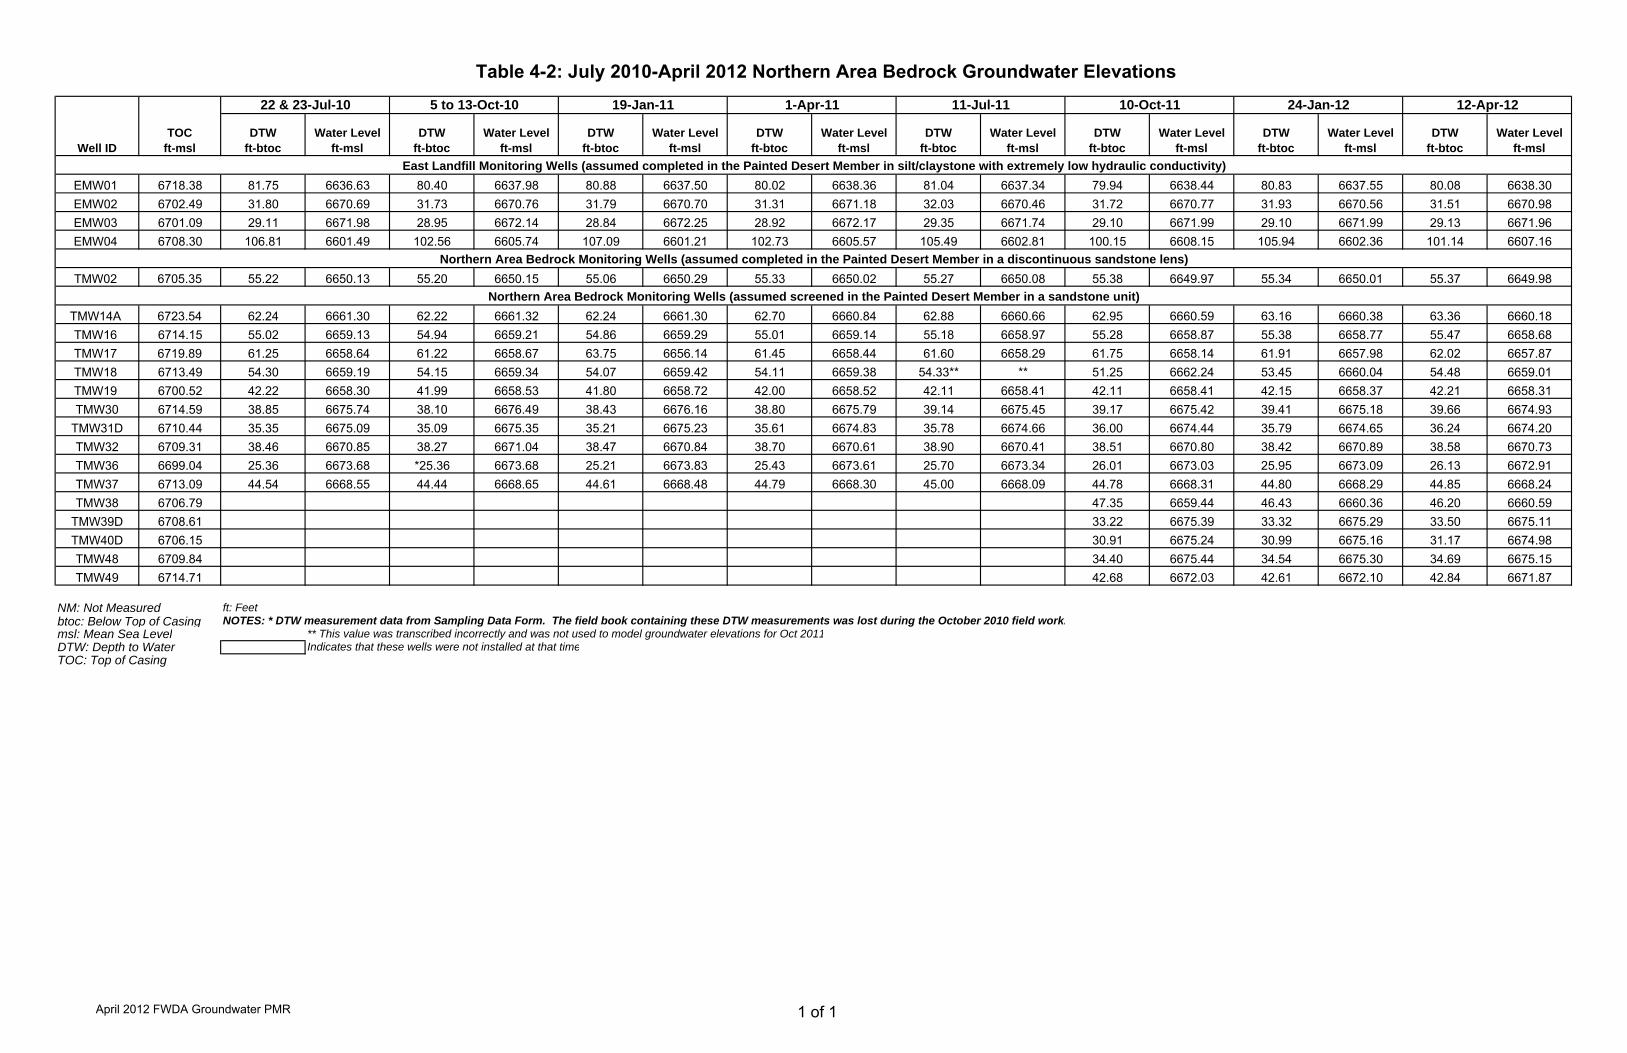
EMW01 6718.38 81.75 6636.63 80.40 6637.98 80.88 6637.50 80.02 6638.36 81.04 6637.34 79.94 6638.44 80.83 6637.55 80.08 6638.30EMW02 6702.49 31.80 6670.69 31.73 6670.76 31.79 6670.70 31.31 6671.18 32.03 6670.46 31.72 6670.77 31.93 6670.56 31.51 6670.98EMW03 6701.09 29.11 6671.98 28.95 6672.14 28.84 6672.25 28.92 6672.17 29.35 6671.74 29.10 6671.99 29.10 6671.99 29.13 6671.96EMW04 6708.30 106.81 6601.49 102.56 6605.74 107.09 6601.21 102.73 6605.57 105.49 6602.81 100.15 6608.15 105.94 6602.36 101.14 6607.16
TMW02 6705.35 55.22 6650.13 55.20 6650.15 55.06 6650.29 55.33 6650.02 55.27 6650.08 55.38 6649.97 55.34 6650.01 55.37 6649.98
TMW14A 6723.54 62.24 6661.30 62.22 6661.32 62.24 6661.30 62.70 6660.84 62.88 6660.66 62.95 6660.59 63.16 6660.38 63.36 6660.18TMW16 6714.15 55.02 6659.13 54.94 6659.21 54.86 6659.29 55.01 6659.14 55.18 6658.97 55.28 6658.87 55.38 6658.77 55.47 6658.68TMW17 6719.89 61.25 6658.64 61.22 6658.67 63.75 6656.14 61.45 6658.44 61.60 6658.29 61.75 6658.14 61.91 6657.98 62.02 6657.87TMW18 6713.49 54.30 6659.19 54.15 6659.34 54.07 6659.42 54.11 6659.38 54.33** ** 51.25 6662.24 53.45 6660.04 54.48 6659.01TMW19 6700.52 42.22 6658.30 41.99 6658.53 41.80 6658.72 42.00 6658.52 42.11 6658.41 42.11 6658.41 42.15 6658.37 42.21 6658.31TMW30 6714.59 38.85 6675.74 38.10 6676.49 38.43 6676.16 38.80 6675.79 39.14 6675.45 39.17 6675.42 39.41 6675.18 39.66 6674.93
TMW31D 6710.44 35.35 6675.09 35.09 6675.35 35.21 6675.23 35.61 6674.83 35.78 6674.66 36.00 6674.44 35.79 6674.65 36.24 6674.20TMW32 6709.31 38.46 6670.85 38.27 6671.04 38.47 6670.84 38.70 6670.61 38.90 6670.41 38.51 6670.80 38.42 6670.89 38.58 6670.73TMW36 6699.04 25.36 6673.68 *25.36 6673.68 25.21 6673.83 25.43 6673.61 25.70 6673.34 26.01 6673.03 25.95 6673.09 26.13 6672.91TMW37 6713.09 44.54 6668.55 44.44 6668.65 44.61 6668.48 44.79 6668.30 45.00 6668.09 44.78 6668.31 44.80 6668.29 44.85 6668.24TMW38 6706.79 47.35 6659.44 46.43 6660.36 46.20 6660.59
TMW39D 6708.61 33.22 6675.39 33.32 6675.29 33.50 6675.11TMW40D 6706.15 30.91 6675.24 30.99 6675.16 31.17 6674.98TMW48 6709.84 34.40 6675.44 34.54 6675.30 34.69 6675.15TMW49 6714.71 42.68 6672.03 42.61 6672.10 42.84 6671.87
ft: Feetbtoc: Below Top of Casing NOTES: * DTW measurement data from Sampling Data Form. The field book containing these DTW measurements was lost during the October 2010 field work.
** This value was transcribed incorrectly and was not used to model groundwater elevations for Oct 2011Indicates that these wells were not installed at that time
24-Jan-12
DTW ft-btoc
Water Level ft-msl
12-Apr-12
DTW ft-btoc
Water Level ft-msl
DTW ft-btoc
22 & 23-Jul-10 5 to 13-Oct-10 19-Jan-11 1-Apr-11 11-Jul-11
DTW ft-btoc
DTW ft-btoc
DTW ft-btoc
DTW ft-btoc
Water Level ft-msl
TOC: Top of CasingDTW: Depth to Watermsl: Mean Sea Level
NM: Not Measured
Water Level ft-msl
DTW ft-btoc
Northern Area Bedrock Monitoring Wells (assumed completed in the Painted Desert Member in a discontinuous sandstone lens)
Northern Area Bedrock Monitoring Wells (assumed screened in the Painted Desert Member in a sandstone unit)
East Landfill Monitoring Wells (assumed completed in the Painted Desert Member in silt/claystone with extremely low hydraulic conductivity)
Well ID TOC
ft-mslWater Level
ft-mslWater Level
ft-msl
10-Oct-11
Water Level ft-msl
Water Level ft-msl
Table 4-2: July 2010-April 2012 Northern Area Bedrock Groundwater Elevations
1 of 1April 2012 FWDA Groundwater PMR
CMW02 7258.00 10.90 7247.10 13.50 7244.50 NM NM 12.81 7245.19 15.78 7242.22 15.68 7242.32 NM NM 14.02 7243.98CMW04 7251.15 45.10 7206.05 45.08 7206.07 NM NM 45.56 7205.59 45.95 7205.20 46.13 7205.02 NM NM 46.28 7204.87CMW07 7235.16 38.74 7196.42 39.08 7196.08 NM NM 39.78 7195.38 40.26 7194.90 41.13 7194.03 NM NM 42.29 7192.87CMW10 7179.31 66.87 7112.44 63.70 7115.61 NM NM 64.04 7115.27 67.92 7111.39 64.88 7114.43 NM NM 65.27 7114.04CMW14 7153.06 27.77 7125.29 27.43 7125.63 NM NM 29.93 7123.13 30.52 7122.54 30.59 7122.47 NM NM 32.2 7120.86CMW17 7145.18 17.00 7128.18 17.51 7127.67 NM NM 20.77 7124.41 22.11 7123.07 19.54 7125.64 NM NM 23.5 7121.68CMW18 7158.24 38.28 7119.96 39.42 7118.82 NM NM 40.31 7117.93 40.94 7117.30 41.41 7116.83 NM NM 41.85 7116.39CMW19 7129.85 22.39 7107.46 23.29 7106.56 NM NM 23.30 7106.55 25.19 7104.66 25.88 7103.97 NM NM 25.97 7103.88CMW20 7194.68 3.00 7191.68 NM NM NM NM NM NM NM NM NM NM NM NM NM NMCMW21 7088.19 Buried Buried Buried Buried Buried Buried Buried Buried Buried Buried Buried Buried Buried Buried Buried BuriedCMW22 7081.94 114.65 6967.29 114.63 6967.31 NM NM 115.56 6966.38 114.62 6967.32 114.51 6967.43 NM NM 114.55 6967.39CMW23 7035.58 97.38 6938.20 97.32 6938.26 NM NM 97.31 6938.27 97.38 6938.20 97.21 6938.37 NM NM 97.35 6938.23CMW24 7099.68 45.75 7053.93 45.65 7054.03 NM NM 47.47 7052.21 45.63 7054.05 45.32 7054.36 NM NM 45.42 7054.26CMW25 7007.52 36.28 6971.24 36.31 6971.21 NM NM 37.18 6970.34 ** ** 37.35 6970.17 NM NM 37.58 6969.94FW24 6999.19 24.05 6975.14 * * NM NM NM NM NM NM NM NM NM NM NM NMFW38 7172.02 Dry Dry Dry Dry NM NM Dry Dry Dry Dry Dry Dry NM NM Dry Dry
KMW09 7187.93 39.29 7148.64 39.50 7148.43 NM NM 39.91 7148.02 40.35 7147.58 40.39 7147.54 NM NM 40.69 7147.24KMW10 7131.38 166.73 6964.65 166.71 6964.67 NM NM 166.90 6964.48 166.75 6964.63 166.72 6964.66 NM NM 166.67 6964.71KMW11 7108.78 36.83 7071.95 31.27 7077.51 NM NM 31.51 7077.27 32.06 7076.72 32.42 7076.36 NM NM 32.7 7076.08KMW12 7193.08 48.66 7144.42 47.59 7145.49 NM NM 48.71 7144.37 49.30 7143.78 49.07 7144.01 NM NM 49.12 7143.96
ft: Feetbtoc: Below Top of Casing NOTES: * DTW measurement data from Sampling Data Form. The field book containing these DTW measurements was lost during the October 2010 field work
** This value was transcribed incorrectly and was not used to model groundwater elevations for Oct 2011
24-Jan-12
DTW ft-btoc
Water Level ft-msl
12-Apr-12
DTW ft-btoc
Water Level ft-msl
DTW ft-btoc
NM: Not Measured
Water Level ft-mslWell ID
TOC ft-msl
22 & 23-Jul-10 4-Oct-10 19-Jan-11 10-Oct-11
Water Level ft-msl
Water Level ft-msl
DTW ft-btoc
1-Apr-11 11-Jul-11
DTW ft-btoc
DTW ft-btoc
DTW: Depth to Water
Water Level ft-msl
ft-msl: Mean Sea Level
Water Level ft-msl
TOC: Top of Casing
DTW ft-btoc
DTW ft-btoc
Water Level ft-msl
Table 4-3: July 2010-April 2012 OB/OD Area Groundwater Elevations
1 of 1April 2012 FWDA Groundwater PMR
ID Easting Northing
Ground Elevation
(msl)Stick-Up
(ft)
TOC Elevation
(msl)DTW (bgs)
Water Level (msl)
DTW (bgs)
Water Level (msl)
DTW (bgs)
Water Level (msl)
DTW (ft-btoc)
Water Level (msl)
DTW (ft-btoc)
Water Level (msl)
DTW (ft-btoc)
Water Level (msl)
DTW (ft-btoc)
Water Level (msl)
DTW (ft-btoc)
Water Level (msl)
PZ01 2499236.22 1645310.72 6674.71 2.581 6677.29 24.16 6650.55 24.00 6650.71 23.58 6651.13 26.45 6650.84 26.39 6650.90 26.36 6650.93 26.15 6651.14 26.22 6651.07PZ02 2499258.64 1645426.78 6672.50 2.454 6674.95 21.25 6651.25 20.43 6652.07 20.16 6652.34 22.52 6652.43 22.52 6652.43 22.70 6652.25 22.39 6652.56 22.34 6652.61PZ03 2499288.54 1645502.88 6676.86 2.581 6679.44 24.27 6652.59 24.18 6652.68 23.49 6653.37 26.02 6653.42 26.07 6653.37 26.22 6653.22 25.99 6653.45 25.81 6653.63PZ04 2498592.56 1645288.26 6674.17 2.506 6676.68 25.63 6648.54 25.44 6648.73 25.06 6649.11 27.51 6649.17 27.58 6649.10 27.78 6648.90 27.48 6649.20 27.47 6649.21PZ05 2498263.13 1646574.66 6671.53 2.623 6674.15 17.95 6653.58 17.64 6653.89 16.86 6654.67 19.37 6654.78 19.57 6654.58 20.12 6654.03 19.40 6654.75 19.30 6654.85PZ06 2498718.95 1646327.75 6673.29 2.751 6676.04 17.38 6655.91 16.44 6656.85 15.26 6658.03 17.86 6658.18 19.51 6656.53 19.04 6657.00 17.88 6658.16 17.66 6658.38PZ07 2500958.18 1645600.75 6682.38 2.150 6684.53 9.66 6672.72 8.26 6674.12 9.89 6672.49 12.85 6671.68 13.66 6670.87 13.09 6671.44 13.72 6670.81 13.98 6670.55PZ08 2500744.34 1645511.30 6684.11 2.697 6686.81 13.48 6670.63 11.95 6672.16 13.22 6670.89 16.41 6670.40 17.49 6669.32 16.04 6670.77 17.03 6669.78 17.35 6669.46PZ09 2495520.51 1648138.17 6651.12 2.495 6653.61 13.76 6637.36 12.96 6638.16 12.11 6639.01 14.34 6639.27 15.30 6638.31 15.36 6638.25 14.53 6639.08 14.21 6639.40PZ10 2495406.66 1648008.28 6654.83 2.436 6657.27 17.59 6637.24 16.83 6638.00 15.93 6638.90 19.18 6638.09 19.17 6638.10 19.21 6638.06 18.36 6638.91 18.06 6639.21
ft-BTOC: Feet Below Top of Casing
ft: Feet
USGS South Fork Rio Puerco Piezometer Measurements 4-Oct-10 19-Jan-1122-Jul-10 12-Apr-1226-Jan-1210-Oct-1111-Jul-114-Apr-11
Note: In previous reports, groundwater measurements were obtained from the USGS. Groundwater elevation measurements were calculated from the ground elevation. As of April 2011, measurements were made in the field with water level sounders, and groundwater elevations were calculated from the top of the casing.
DTW: Depth to WaterTOC: Top of Casing
BGS: Below Ground SurfaceMSL: Mean Sea Level
Table 4-4: July 2010-April 2012 USGS Piezometer Groundwater Elevations
1 of 1April 2012 FWDA Groundwater PMR
SECTION 5 TABLES
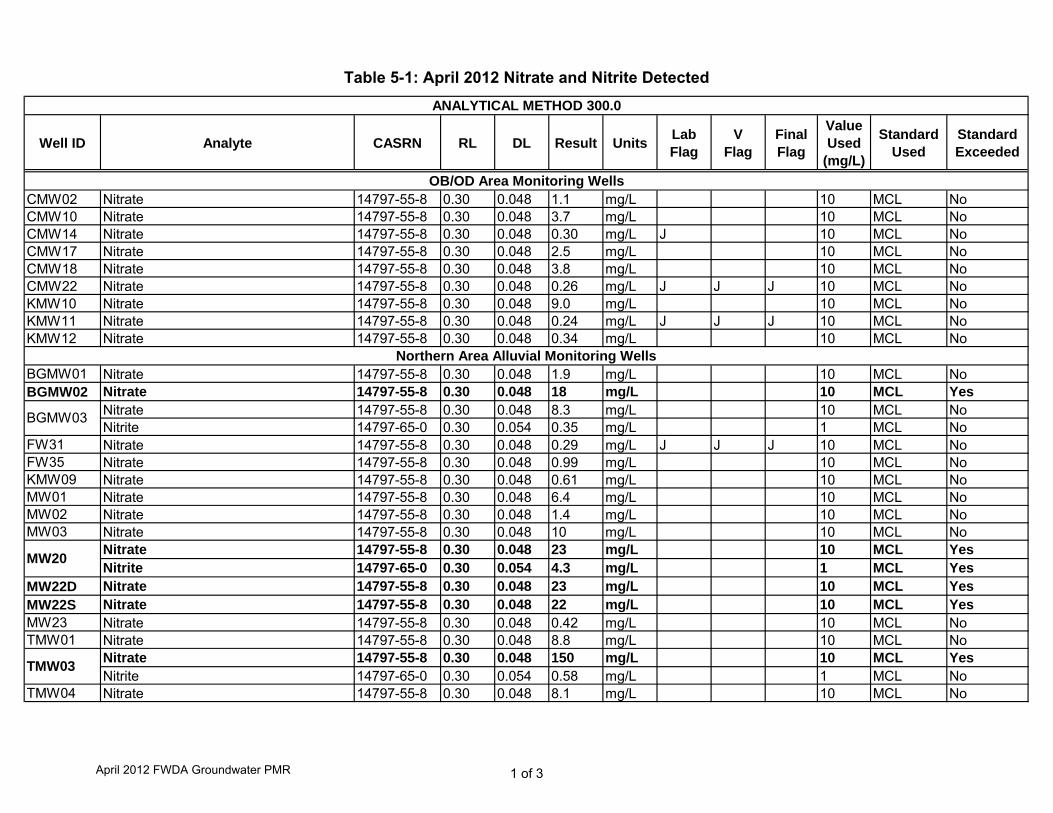
Well ID Analyte CASRN RL DL Result UnitsLabFlag
VFlag
FinalFlag
Value Used
(mg/L)
Standard Used
Standard Exceeded
CMW02 Nitrate 14797-55-8 0.30 0.048 1.1 mg/L 10 MCL NoCMW10 Nitrate 14797-55-8 0.30 0.048 3.7 mg/L 10 MCL NoCMW14 Nitrate 14797-55-8 0.30 0.048 0.30 mg/L J 10 MCL NoCMW17 Nitrate 14797-55-8 0.30 0.048 2.5 mg/L 10 MCL NoCMW18 Nitrate 14797-55-8 0.30 0.048 3.8 mg/L 10 MCL NoCMW22 Nitrate 14797-55-8 0.30 0.048 0.26 mg/L J J J 10 MCL NoKMW10 Nitrate 14797-55-8 0.30 0.048 9.0 mg/L 10 MCL NoKMW11 Nitrate 14797-55-8 0.30 0.048 0.24 mg/L J J J 10 MCL NoKMW12 Nitrate 14797-55-8 0.30 0.048 0.34 mg/L 10 MCL No
BGMW01 Nitrate 14797-55-8 0.30 0.048 1.9 mg/L 10 MCL NoBGMW02 Nitrate 14797-55-8 0.30 0.048 18 mg/L 10 MCL Yes
Nitrate 14797-55-8 0.30 0.048 8.3 mg/L 10 MCL NoNitrite 14797-65-0 0.30 0.054 0.35 mg/L 1 MCL No
FW31 Nitrate 14797-55-8 0.30 0.048 0.29 mg/L J J J 10 MCL NoFW35 Nitrate 14797-55-8 0.30 0.048 0.99 mg/L 10 MCL NoKMW09 Nit t 14797 55 8 0 30 0 048 0 61 /L 10 MCL N
ANALYTICAL METHOD 300.0
BGMW03
Northern Area Alluvial Monitoring Wells
OB/OD Area Monitoring Wells
KMW09 Nitrate 14797-55-8 0.30 0.048 0.61 mg/L 10 MCL NoMW01 Nitrate 14797-55-8 0.30 0.048 6.4 mg/L 10 MCL NoMW02 Nitrate 14797-55-8 0.30 0.048 1.4 mg/L 10 MCL NoMW03 Nitrate 14797-55-8 0.30 0.048 10 mg/L 10 MCL No
Nitrate 14797-55-8 0.30 0.048 23 mg/L 10 MCL YesNitrite 14797-65-0 0.30 0.054 4.3 mg/L 1 MCL Yes
MW22D Nitrate 14797-55-8 0.30 0.048 23 mg/L 10 MCL YesMW22S Nitrate 14797-55-8 0.30 0.048 22 mg/L 10 MCL YesMW23 Nitrate 14797-55-8 0.30 0.048 0.42 mg/L 10 MCL NoTMW01 Nitrate 14797-55-8 0.30 0.048 8.8 mg/L 10 MCL No
Nitrate 14797-55-8 0.30 0.048 150 mg/L 10 MCL YesNitrite 14797-65-0 0.30 0.054 0.58 mg/L 1 MCL No
TMW04 Nitrate 14797-55-8 0.30 0.048 8.1 mg/L 10 MCL No
MW20
TMW03
Table 5-1: April 2012 Nitrate and Nitrite Detected
1 of 3April 2012 FWDA Groundwater PMR
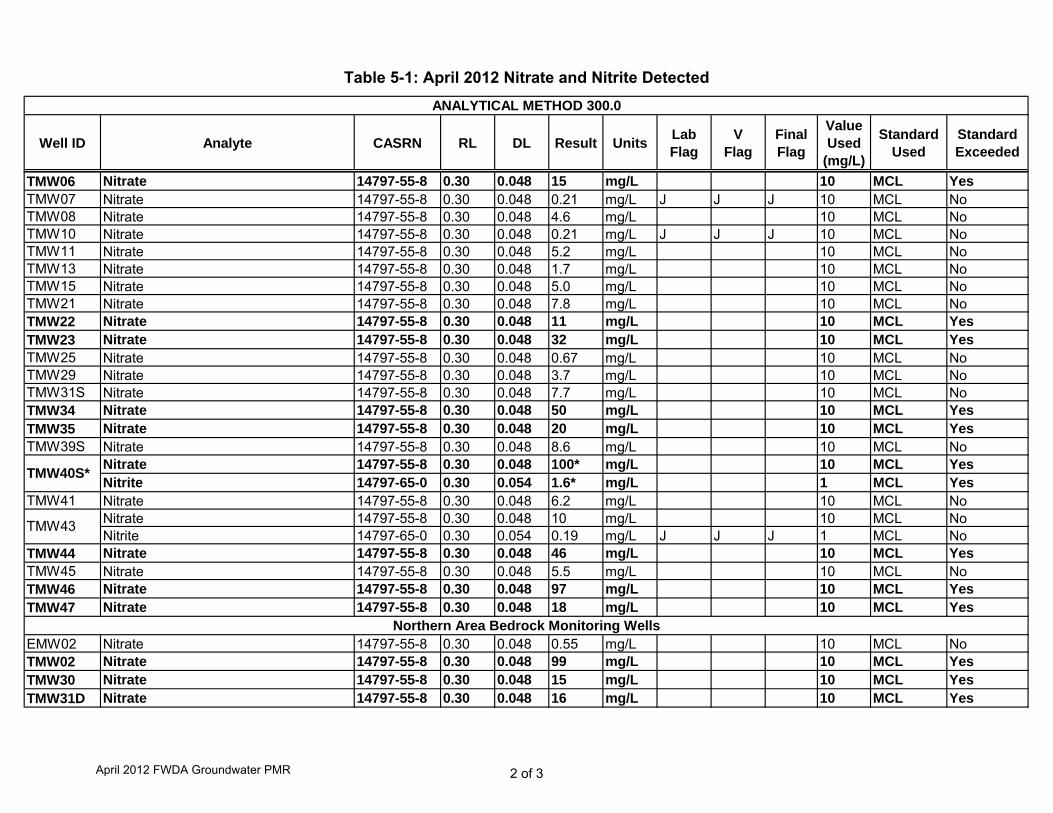
Well ID Analyte CASRN RL DL Result UnitsLabFlag
VFlag
FinalFlag
Value Used
(mg/L)
Standard Used
Standard Exceeded
ANALYTICAL METHOD 300.0
TMW06 Nitrate 14797-55-8 0.30 0.048 15 mg/L 10 MCL YesTMW07 Nitrate 14797-55-8 0.30 0.048 0.21 mg/L J J J 10 MCL NoTMW08 Nitrate 14797-55-8 0.30 0.048 4.6 mg/L 10 MCL NoTMW10 Nitrate 14797-55-8 0.30 0.048 0.21 mg/L J J J 10 MCL NoTMW11 Nitrate 14797-55-8 0.30 0.048 5.2 mg/L 10 MCL NoTMW13 Nitrate 14797-55-8 0.30 0.048 1.7 mg/L 10 MCL NoTMW15 Nitrate 14797-55-8 0.30 0.048 5.0 mg/L 10 MCL NoTMW21 Nitrate 14797-55-8 0.30 0.048 7.8 mg/L 10 MCL NoTMW22 Nitrate 14797-55-8 0.30 0.048 11 mg/L 10 MCL YesTMW23 Nitrate 14797-55-8 0.30 0.048 32 mg/L 10 MCL YesTMW25 Nitrate 14797-55-8 0.30 0.048 0.67 mg/L 10 MCL NoTMW29 Nitrate 14797-55-8 0.30 0.048 3.7 mg/L 10 MCL NoTMW31S Nitrate 14797-55-8 0.30 0.048 7.7 mg/L 10 MCL NoTMW34 Nitrate 14797-55-8 0.30 0.048 50 mg/L 10 MCL YesTMW35 Nitrate 14797-55-8 0.30 0.048 20 mg/L 10 MCL YesTMW39S Nitrate 14797-55-8 0.30 0.048 8.6 mg/L 10 MCL No
Nitrate 14797-55-8 0.30 0.048 100* mg/L 10 MCL YesTMW40S*
Nitrite 14797-65-0 0.30 0.054 1.6* mg/L 1 MCL YesTMW41 Nitrate 14797-55-8 0.30 0.048 6.2 mg/L 10 MCL No
Nitrate 14797-55-8 0.30 0.048 10 mg/L 10 MCL NoNitrite 14797-65-0 0.30 0.054 0.19 mg/L J J J 1 MCL No
TMW44 Nitrate 14797-55-8 0.30 0.048 46 mg/L 10 MCL YesTMW45 Nitrate 14797-55-8 0.30 0.048 5.5 mg/L 10 MCL NoTMW46 Nitrate 14797-55-8 0.30 0.048 97 mg/L 10 MCL YesTMW47 Nitrate 14797-55-8 0.30 0.048 18 mg/L 10 MCL Yes
EMW02 Nitrate 14797-55-8 0.30 0.048 0.55 mg/L 10 MCL NoTMW02 Nitrate 14797-55-8 0.30 0.048 99 mg/L 10 MCL YesTMW30 Nitrate 14797-55-8 0.30 0.048 15 mg/L 10 MCL YesTMW31D Nitrate 14797-55-8 0.30 0.048 16 mg/L 10 MCL Yes
TMW40S
TMW43
Northern Area Bedrock Monitoring Wells
Table 5-1: April 2012 Nitrate and Nitrite Detected
2 of 3April 2012 FWDA Groundwater PMR
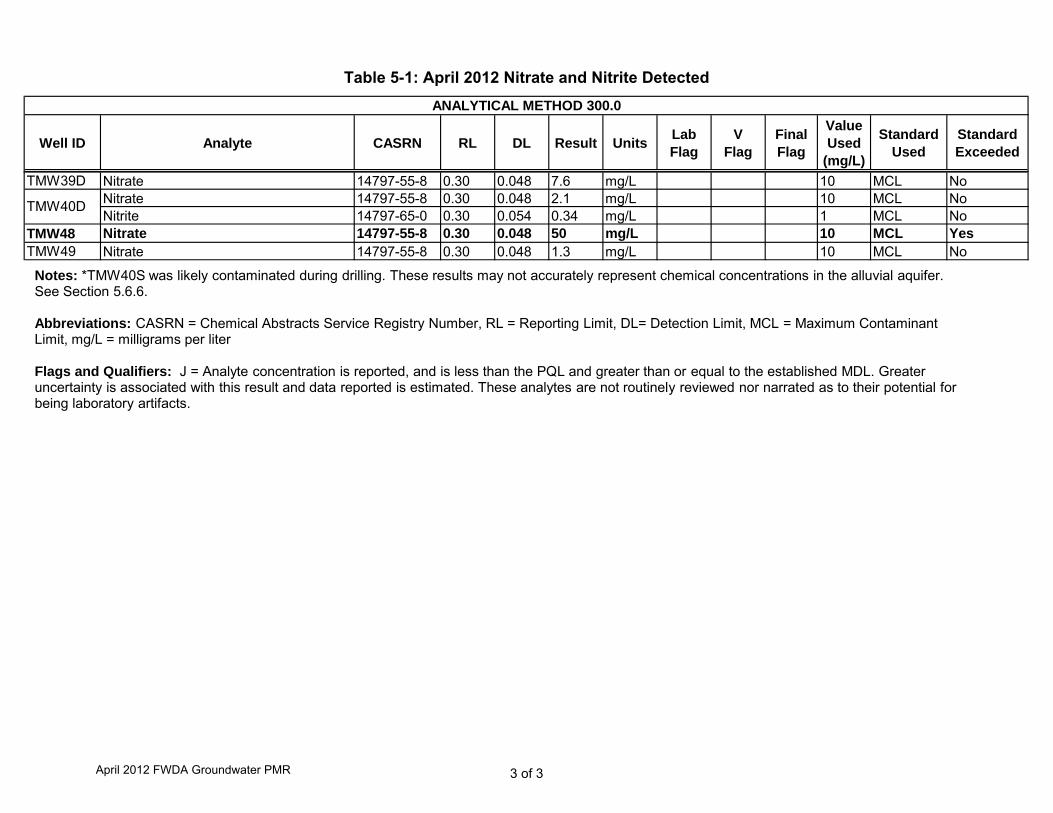
Well ID Analyte CASRN RL DL Result UnitsLabFlag
VFlag
FinalFlag
Value Used
(mg/L)
Standard Used
Standard Exceeded
ANALYTICAL METHOD 300.0
TMW39D Nitrate 14797-55-8 0.30 0.048 7.6 mg/L 10 MCL NoNitrate 14797-55-8 0.30 0.048 2.1 mg/L 10 MCL NoNitrite 14797-65-0 0.30 0.054 0.34 mg/L 1 MCL No
TMW48 Nitrate 14797-55-8 0.30 0.048 50 mg/L 10 MCL YesTMW49 Nitrate 14797-55-8 0.30 0.048 1.3 mg/L 10 MCL No
TMW40D
Notes: *TMW40S was likely contaminated during drilling. These results may not accurately represent chemical concentrations in the alluvial aquifer. See Section 5.6.6.
Abbreviations: CASRN = Chemical Abstracts Service Registry Number, RL = Reporting Limit, DL= Detection Limit, MCL = Maximum Contaminant Limit, mg/L = milligrams per liter
Flags and Qualifiers: J = Analyte concentration is reported, and is less than the PQL and greater than or equal to the established MDL. Greater uncertainty is associated with this result and data reported is estimated. These analytes are not routinely reviewed nor narrated as to their potential for being laboratory artifacts.
Table 5-1: April 2012 Nitrate and Nitrite Detected
3 of 3April 2012 FWDA Groundwater PMR
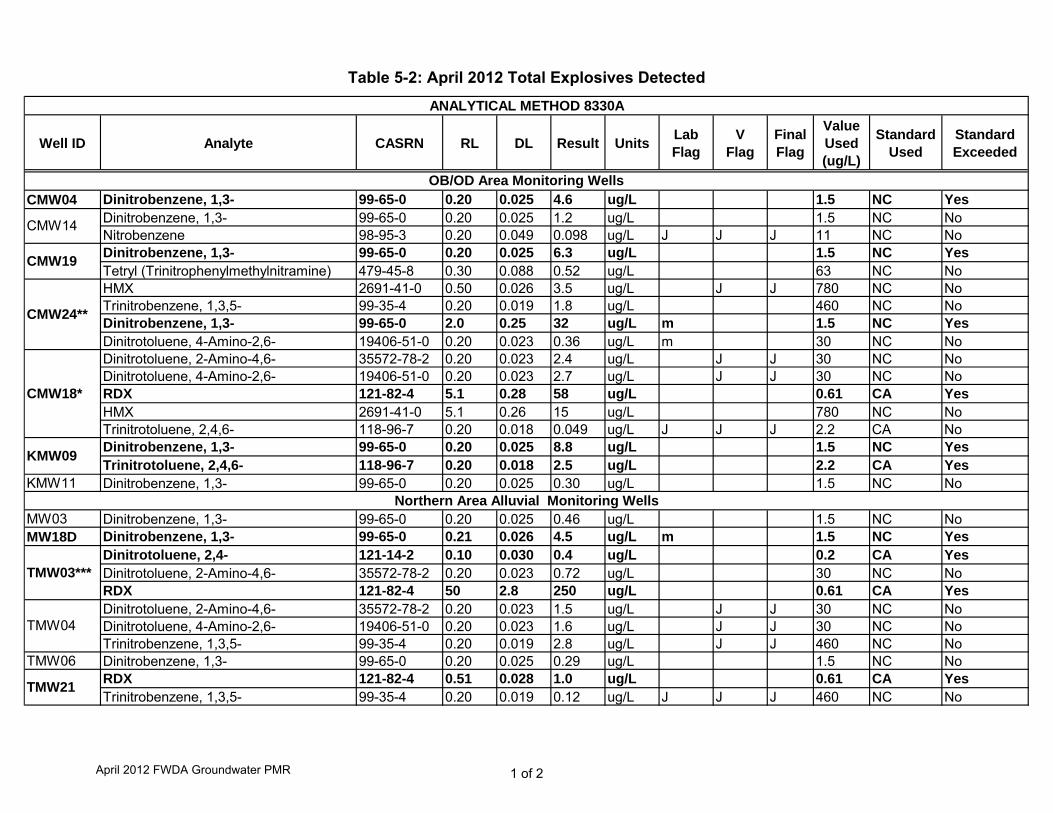
Well ID Analyte CASRN RL DL Result UnitsLabFlag
VFlag
FinalFlag
Value Used (ug/L)
Standard Used
Standard Exceeded
CMW04 Dinitrobenzene, 1,3- 99-65-0 0.20 0.025 4.6 ug/L 1.5 NC YesDinitrobenzene, 1,3- 99-65-0 0.20 0.025 1.2 ug/L 1.5 NC NoNitrobenzene 98-95-3 0.20 0.049 0.098 ug/L J J J 11 NC NoDinitrobenzene, 1,3- 99-65-0 0.20 0.025 6.3 ug/L 1.5 NC YesTetryl (Trinitrophenylmethylnitramine) 479-45-8 0.30 0.088 0.52 ug/L 63 NC NoHMX 2691-41-0 0.50 0.026 3.5 ug/L J J 780 NC NoTrinitrobenzene, 1,3,5- 99-35-4 0.20 0.019 1.8 ug/L 460 NC NoDinitrobenzene, 1,3- 99-65-0 2.0 0.25 32 ug/L m 1.5 NC YesDinitrotoluene, 4-Amino-2,6- 19406-51-0 0.20 0.023 0.36 ug/L m 30 NC NoDinitrotoluene, 2-Amino-4,6- 35572-78-2 0.20 0.023 2.4 ug/L J J 30 NC NoDinitrotoluene, 4-Amino-2,6- 19406-51-0 0.20 0.023 2.7 ug/L J J 30 NC NoRDX 121-82-4 5.1 0.28 58 ug/L 0.61 CA YesHMX 2691-41-0 5.1 0.26 15 ug/L 780 NC NoTrinitrotoluene, 2,4,6- 118-96-7 0.20 0.018 0.049 ug/L J J J 2.2 CA NoDinitrobenzene, 1,3- 99-65-0 0.20 0.025 8.8 ug/L 1.5 NC YesTrinitrotoluene, 2,4,6- 118-96-7 0.20 0.018 2.5 ug/L 2.2 CA Yes
KMW09
CMW24**
ANALYTICAL METHOD 8330A
CMW14
CMW19
CMW18*
OB/OD Area Monitoring Wells
KMW11 Dinitrobenzene, 1,3- 99-65-0 0.20 0.025 0.30 ug/L 1.5 NC No
MW03 Dinitrobenzene, 1,3- 99-65-0 0.20 0.025 0.46 ug/L 1.5 NC NoMW18D Dinitrobenzene, 1,3- 99-65-0 0.21 0.026 4.5 ug/L m 1.5 NC Yes
Dinitrotoluene, 2,4- 121-14-2 0.10 0.030 0.4 ug/L 0.2 CA YesDinitrotoluene, 2-Amino-4,6- 35572-78-2 0.20 0.023 0.72 ug/L 30 NC NoRDX 121-82-4 50 2.8 250 ug/L 0.61 CA YesDinitrotoluene, 2-Amino-4,6- 35572-78-2 0.20 0.023 1.5 ug/L J J 30 NC NoDinitrotoluene, 4-Amino-2,6- 19406-51-0 0.20 0.023 1.6 ug/L J J 30 NC NoTrinitrobenzene, 1,3,5- 99-35-4 0.20 0.019 2.8 ug/L J J 460 NC No
TMW06 Dinitrobenzene, 1,3- 99-65-0 0.20 0.025 0.29 ug/L 1.5 NC NoRDX 121-82-4 0.51 0.028 1.0 ug/L 0.61 CA YesTrinitrobenzene, 1,3,5- 99-35-4 0.20 0.019 0.12 ug/L J J J 460 NC No
TMW03***
TMW04
TMW21
Northern Area Alluvial Monitoring Wells
Table 5-2: April 2012 Total Explosives Detected
1 of 2April 2012 FWDA Groundwater PMR
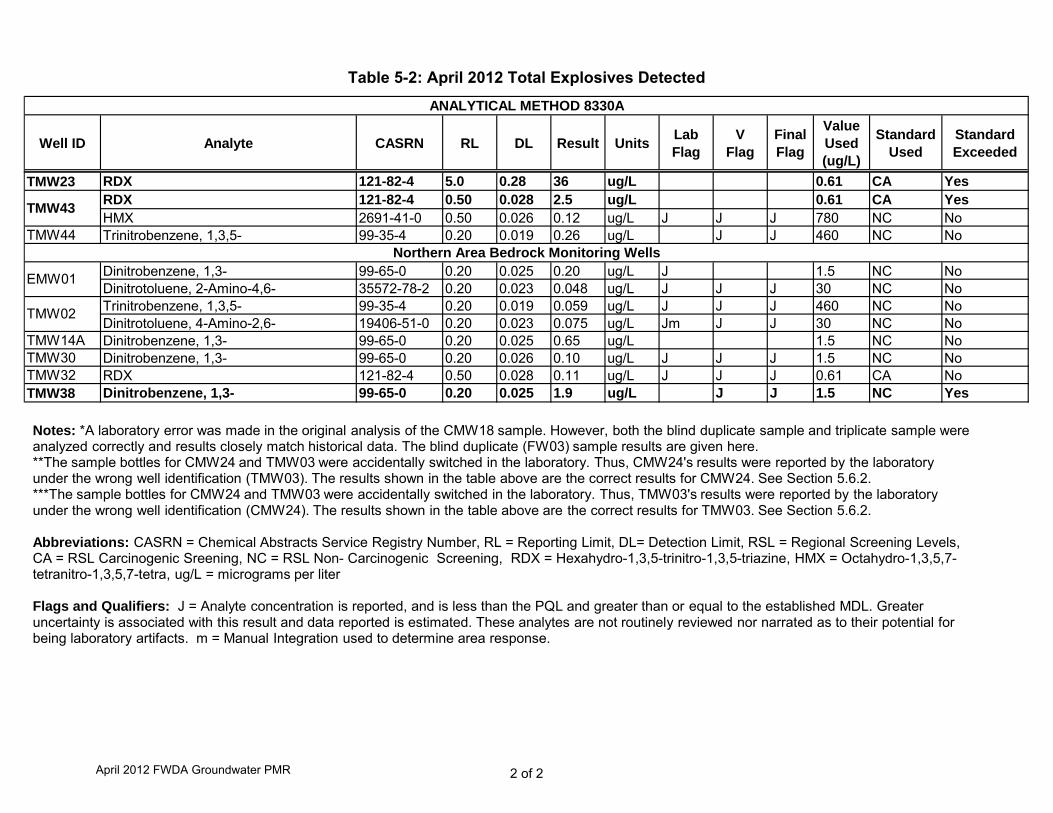
Well ID Analyte CASRN RL DL Result UnitsLabFlag
VFlag
FinalFlag
Value Used (ug/L)
Standard Used
Standard Exceeded
ANALYTICAL METHOD 8330A
TMW23 RDX 121-82-4 5.0 0.28 36 ug/L 0.61 CA YesRDX 121-82-4 0.50 0.028 2.5 ug/L 0.61 CA YesHMX 2691-41-0 0.50 0.026 0.12 ug/L J J J 780 NC No
TMW44 Trinitrobenzene, 1,3,5- 99-35-4 0.20 0.019 0.26 ug/L J J 460 NC No
Dinitrobenzene, 1,3- 99-65-0 0.20 0.025 0.20 ug/L J 1.5 NC NoDinitrotoluene, 2-Amino-4,6- 35572-78-2 0.20 0.023 0.048 ug/L J J J 30 NC NoTrinitrobenzene, 1,3,5- 99-35-4 0.20 0.019 0.059 ug/L J J J 460 NC NoDinitrotoluene, 4-Amino-2,6- 19406-51-0 0.20 0.023 0.075 ug/L Jm J J 30 NC No
TMW14A Dinitrobenzene, 1,3- 99-65-0 0.20 0.025 0.65 ug/L 1.5 NC NoTMW30 Dinitrobenzene, 1,3- 99-65-0 0.20 0.026 0.10 ug/L J J J 1.5 NC NoTMW32 RDX 121-82-4 0.50 0.028 0.11 ug/L J J J 0.61 CA NoTMW38 Dinitrobenzene, 1,3- 99-65-0 0.20 0.025 1.9 ug/L J J 1.5 NC Yes
TMW02
EMW01
TMW43
Northern Area Bedrock Monitoring Wells
Notes: *A laboratory error was made in the original analysis of the CMW18 sample. However, both the blind duplicate sample and triplicate sample were analyzed correctly and results closely match historical data. The blind duplicate (FW03) sample results are given here.**The sample bottles for CMW24 and TMW03 were accidentally switched in the laboratory. Thus, CMW24's results were reported by the laboratory under the wrong well identification (TMW03) The results shown in the table above are the correct results for CMW24 See Section 5 6 2under the wrong well identification (TMW03). The results shown in the table above are the correct results for CMW24. See Section 5.6.2.***The sample bottles for CMW24 and TMW03 were accidentally switched in the laboratory. Thus, TMW03's results were reported by the laboratory under the wrong well identification (CMW24). The results shown in the table above are the correct results for TMW03. See Section 5.6.2.
Abbreviations: CASRN = Chemical Abstracts Service Registry Number, RL = Reporting Limit, DL= Detection Limit, RSL = Regional Screening Levels, CA = RSL Carcinogenic Sreening, NC = RSL Non- Carcinogenic Screening, RDX = Hexahydro-1,3,5-trinitro-1,3,5-triazine, HMX = Octahydro-1,3,5,7-tetranitro-1,3,5,7-tetra, ug/L = micrograms per liter
Flags and Qualifiers: J = Analyte concentration is reported, and is less than the PQL and greater than or equal to the established MDL. Greater uncertainty is associated with this result and data reported is estimated. These analytes are not routinely reviewed nor narrated as to their potential for being laboratory artifacts. m = Manual Integration used to determine area response.
Table 5-2: April 2012 Total Explosives Detected
2 of 2April 2012 FWDA Groundwater PMR
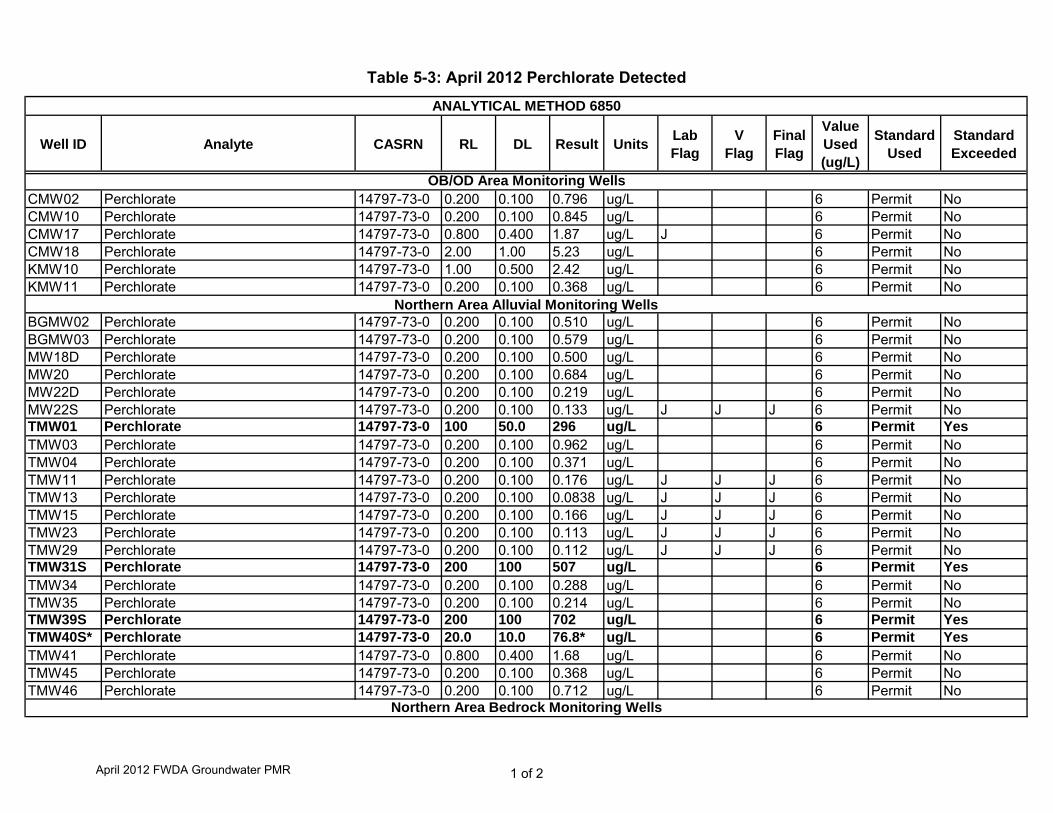
Well ID Analyte CASRN RL DL Result UnitsLabFlag
VFlag
FinalFlag
Value Used (ug/L)
Standard Used
Standard Exceeded
CMW02 Perchlorate 14797-73-0 0.200 0.100 0.796 ug/L 6 Permit NoCMW10 Perchlorate 14797-73-0 0.200 0.100 0.845 ug/L 6 Permit NoCMW17 Perchlorate 14797-73-0 0.800 0.400 1.87 ug/L J 6 Permit NoCMW18 Perchlorate 14797-73-0 2.00 1.00 5.23 ug/L 6 Permit NoKMW10 Perchlorate 14797-73-0 1.00 0.500 2.42 ug/L 6 Permit NoKMW11 Perchlorate 14797-73-0 0.200 0.100 0.368 ug/L 6 Permit No
BGMW02 Perchlorate 14797-73-0 0.200 0.100 0.510 ug/L 6 Permit NoBGMW03 Perchlorate 14797-73-0 0.200 0.100 0.579 ug/L 6 Permit NoMW18D Perchlorate 14797-73-0 0.200 0.100 0.500 ug/L 6 Permit NoMW20 Perchlorate 14797-73-0 0.200 0.100 0.684 ug/L 6 Permit NoMW22D Perchlorate 14797-73-0 0.200 0.100 0.219 ug/L 6 Permit NoMW22S Perchlorate 14797-73-0 0.200 0.100 0.133 ug/L J J J 6 Permit NoTMW01 Perchlorate 14797-73-0 100 50.0 296 ug/L 6 Permit YesTMW03 Perchlorate 14797-73-0 0.200 0.100 0.962 ug/L 6 Permit NoTMW04 Perchlorate 14797-73-0 0.200 0.100 0.371 ug/L 6 Permit NoTMW11 P hl t 14797 73 0 0 200 0 100 0 176 /L J J J 6 P it N
ANALYTICAL METHOD 6850
Northern Area Alluvial Monitoring Wells
OB/OD Area Monitoring Wells
TMW11 Perchlorate 14797-73-0 0.200 0.100 0.176 ug/L J J J 6 Permit NoTMW13 Perchlorate 14797-73-0 0.200 0.100 0.0838 ug/L J J J 6 Permit NoTMW15 Perchlorate 14797-73-0 0.200 0.100 0.166 ug/L J J J 6 Permit NoTMW23 Perchlorate 14797-73-0 0.200 0.100 0.113 ug/L J J J 6 Permit NoTMW29 Perchlorate 14797-73-0 0.200 0.100 0.112 ug/L J J J 6 Permit NoTMW31S Perchlorate 14797-73-0 200 100 507 ug/L 6 Permit YesTMW34 Perchlorate 14797-73-0 0.200 0.100 0.288 ug/L 6 Permit NoTMW35 Perchlorate 14797-73-0 0.200 0.100 0.214 ug/L 6 Permit NoTMW39S Perchlorate 14797-73-0 200 100 702 ug/L 6 Permit YesTMW40S* Perchlorate 14797-73-0 20.0 10.0 76.8* ug/L 6 Permit YesTMW41 Perchlorate 14797-73-0 0.800 0.400 1.68 ug/L 6 Permit NoTMW45 Perchlorate 14797-73-0 0.200 0.100 0.368 ug/L 6 Permit NoTMW46 Perchlorate 14797-73-0 0.200 0.100 0.712 ug/L 6 Permit No
Northern Area Bedrock Monitoring Wells
Table 5-3: April 2012 Perchlorate Detected
1 of 2April 2012 FWDA Groundwater PMR
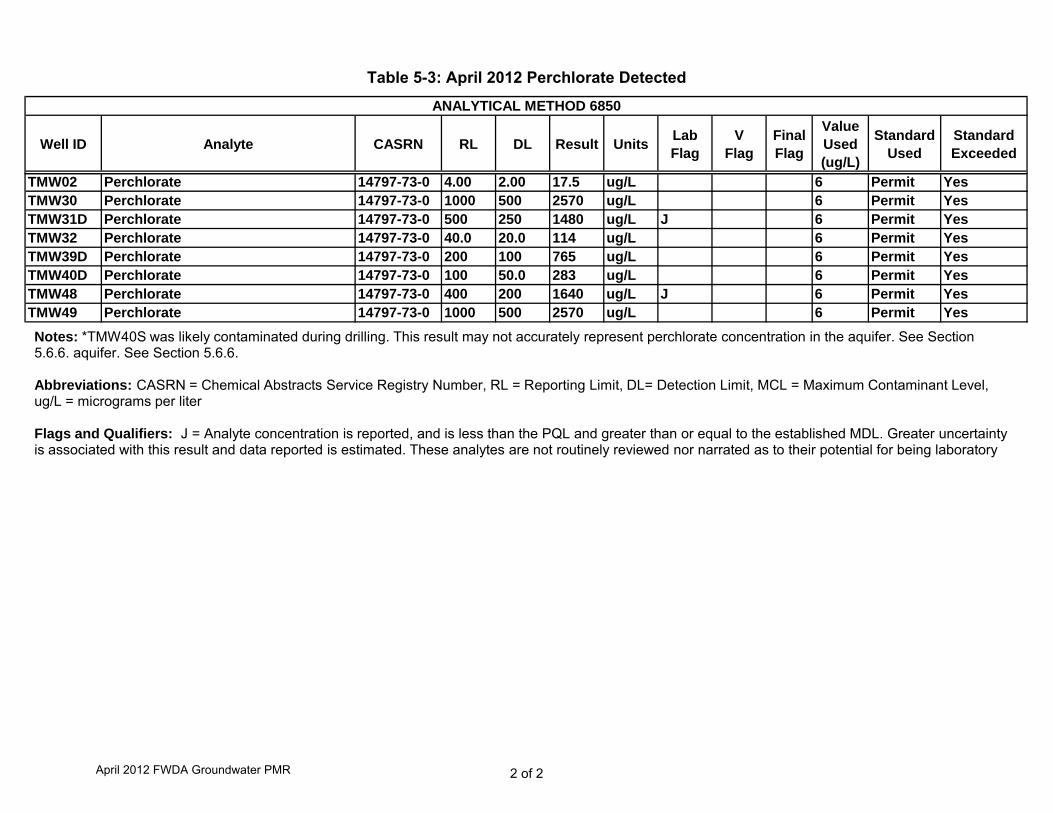
Well ID Analyte CASRN RL DL Result UnitsLabFlag
VFlag
FinalFlag
Value Used (ug/L)
Standard Used
Standard Exceeded
ANALYTICAL METHOD 6850
TMW02 Perchlorate 14797-73-0 4.00 2.00 17.5 ug/L 6 Permit YesTMW30 Perchlorate 14797-73-0 1000 500 2570 ug/L 6 Permit YesTMW31D Perchlorate 14797-73-0 500 250 1480 ug/L J 6 Permit YesTMW32 Perchlorate 14797-73-0 40.0 20.0 114 ug/L 6 Permit YesTMW39D Perchlorate 14797-73-0 200 100 765 ug/L 6 Permit YesTMW40D Perchlorate 14797-73-0 100 50.0 283 ug/L 6 Permit YesTMW48 Perchlorate 14797-73-0 400 200 1640 ug/L J 6 Permit YesTMW49 Perchlorate 14797-73-0 1000 500 2570 ug/L 6 Permit Yes
Notes: *TMW40S was likely contaminated during drilling. This result may not accurately represent perchlorate concentration in the aquifer. See Section 5.6.6. aquifer. See Section 5.6.6.
Abbreviations: CASRN = Chemical Abstracts Service Registry Number, RL = Reporting Limit, DL= Detection Limit, MCL = Maximum Contaminant Level, ug/L = micrograms per liter
Flags and Qualifiers: J = Analyte concentration is reported, and is less than the PQL and greater than or equal to the established MDL. Greater uncertainty is associated with this result and data reported is estimated. These analytes are not routinely reviewed nor narrated as to their potential for being laboratory
Table 5-3: April 2012 Perchlorate Detected
2 of 2April 2012 FWDA Groundwater PMR
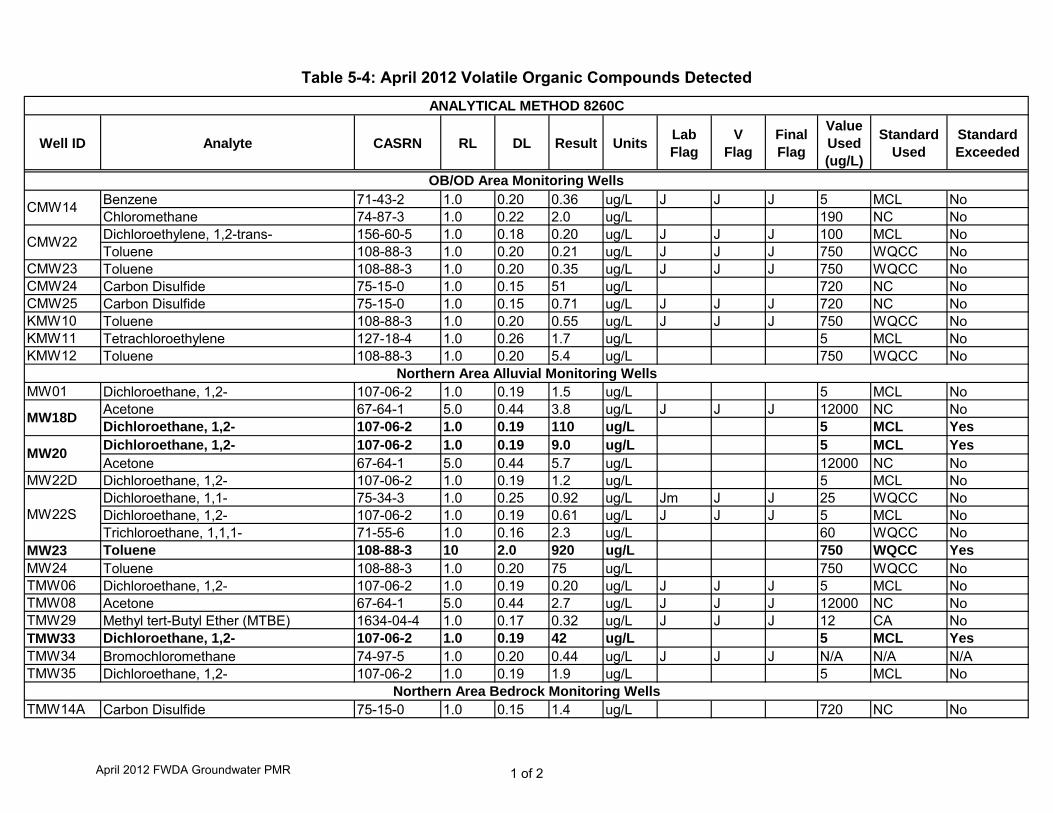
Well ID Analyte CASRN RL DL Result UnitsLabFlag
VFlag
FinalFlag
Value Used (ug/L)
Standard Used
Standard Exceeded
Benzene 71-43-2 1.0 0.20 0.36 ug/L J J J 5 MCL NoChloromethane 74-87-3 1.0 0.22 2.0 ug/L 190 NC NoDichloroethylene, 1,2-trans- 156-60-5 1.0 0.18 0.20 ug/L J J J 100 MCL NoToluene 108-88-3 1.0 0.20 0.21 ug/L J J J 750 WQCC No
CMW23 Toluene 108-88-3 1.0 0.20 0.35 ug/L J J J 750 WQCC NoCMW24 Carbon Disulfide 75-15-0 1.0 0.15 51 ug/L 720 NC NoCMW25 Carbon Disulfide 75-15-0 1.0 0.15 0.71 ug/L J J J 720 NC NoKMW10 Toluene 108-88-3 1.0 0.20 0.55 ug/L J J J 750 WQCC NoKMW11 Tetrachloroethylene 127-18-4 1.0 0.26 1.7 ug/L 5 MCL NoKMW12 Toluene 108-88-3 1.0 0.20 5.4 ug/L 750 WQCC No
MW01 Dichloroethane, 1,2- 107-06-2 1.0 0.19 1.5 ug/L 5 MCL NoAcetone 67-64-1 5.0 0.44 3.8 ug/L J J J 12000 NC NoDichloroethane, 1,2- 107-06-2 1.0 0.19 110 ug/L 5 MCL YesDichloroethane, 1,2- 107-06-2 1.0 0.19 9.0 ug/L 5 MCL YesAcetone 67-64-1 5.0 0.44 5.7 ug/L 12000 NC No
MW22D Di hl th 1 2 107 06 2 1 0 0 19 1 2 /L 5 MCL N
CMW22
MW18D
MW20
ANALYTICAL METHOD 8260C
OB/OD Area Monitoring Wells
Northern Area Alluvial Monitoring Wells
CMW14
MW22D Dichloroethane, 1,2- 107-06-2 1.0 0.19 1.2 ug/L 5 MCL NoDichloroethane, 1,1- 75-34-3 1.0 0.25 0.92 ug/L Jm J J 25 WQCC NoDichloroethane, 1,2- 107-06-2 1.0 0.19 0.61 ug/L J J J 5 MCL NoTrichloroethane, 1,1,1- 71-55-6 1.0 0.16 2.3 ug/L 60 WQCC No
MW23 Toluene 108-88-3 10 2.0 920 ug/L 750 WQCC YesMW24 Toluene 108-88-3 1.0 0.20 75 ug/L 750 WQCC NoTMW06 Dichloroethane, 1,2- 107-06-2 1.0 0.19 0.20 ug/L J J J 5 MCL NoTMW08 Acetone 67-64-1 5.0 0.44 2.7 ug/L J J J 12000 NC NoTMW29 Methyl tert-Butyl Ether (MTBE) 1634-04-4 1.0 0.17 0.32 ug/L J J J 12 CA NoTMW33 Dichloroethane, 1,2- 107-06-2 1.0 0.19 42 ug/L 5 MCL YesTMW34 Bromochloromethane 74-97-5 1.0 0.20 0.44 ug/L J J J N/A N/A N/ATMW35 Dichloroethane, 1,2- 107-06-2 1.0 0.19 1.9 ug/L 5 MCL No
TMW14A Carbon Disulfide 75-15-0 1.0 0.15 1.4 ug/L 720 NC No
MW22S
Northern Area Bedrock Monitoring Wells
Table 5-4: April 2012 Volatile Organic Compounds Detected
1 of 2April 2012 FWDA Groundwater PMR
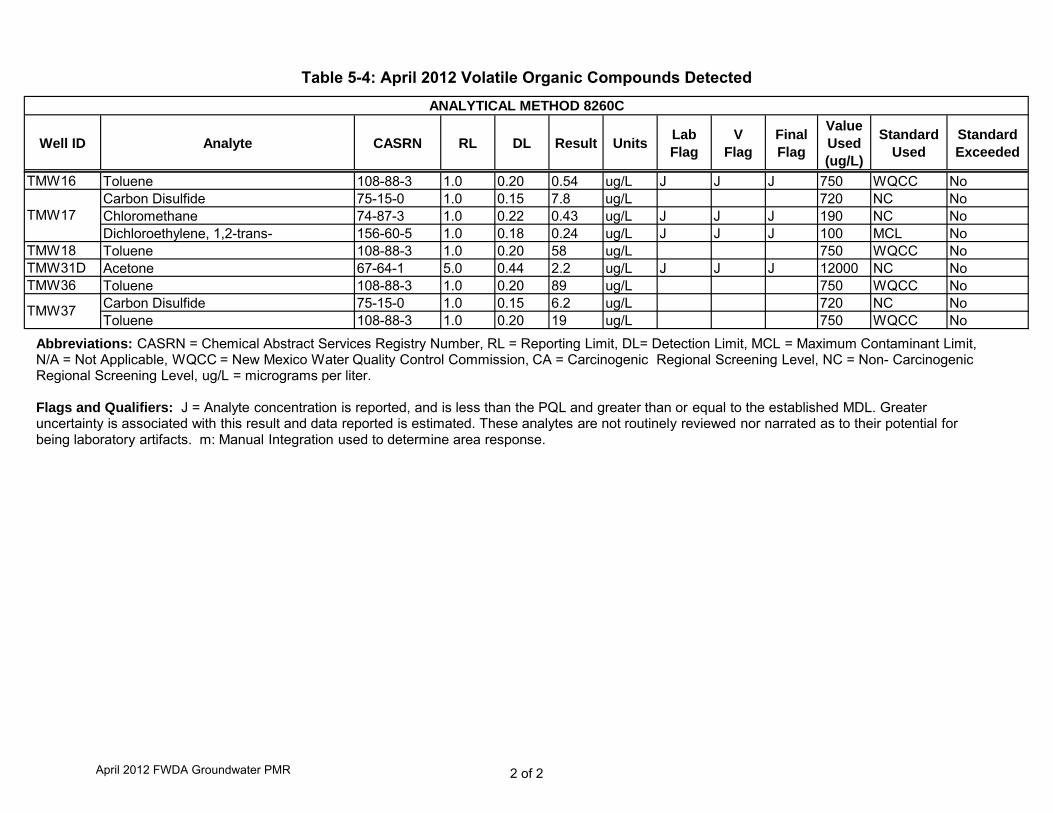
Well ID Analyte CASRN RL DL Result UnitsLabFlag
VFlag
FinalFlag
Value Used (ug/L)
Standard Used
Standard Exceeded
ANALYTICAL METHOD 8260C
TMW16 Toluene 108-88-3 1.0 0.20 0.54 ug/L J J J 750 WQCC NoCarbon Disulfide 75-15-0 1.0 0.15 7.8 ug/L 720 NC NoChloromethane 74-87-3 1.0 0.22 0.43 ug/L J J J 190 NC NoDichloroethylene, 1,2-trans- 156-60-5 1.0 0.18 0.24 ug/L J J J 100 MCL No
TMW18 Toluene 108-88-3 1.0 0.20 58 ug/L 750 WQCC NoTMW31D Acetone 67-64-1 5.0 0.44 2.2 ug/L J J J 12000 NC NoTMW36 Toluene 108-88-3 1.0 0.20 89 ug/L 750 WQCC No
Carbon Disulfide 75-15-0 1.0 0.15 6.2 ug/L 720 NC NoToluene 108-88-3 1.0 0.20 19 ug/L 750 WQCC No
TMW17
TMW37
Abbreviations: CASRN = Chemical Abstract Services Registry Number, RL = Reporting Limit, DL= Detection Limit, MCL = Maximum Contaminant Limit, N/A = Not Applicable, WQCC = New Mexico Water Quality Control Commission, CA = Carcinogenic Regional Screening Level, NC = Non- Carcinogenic Regional Screening Level, ug/L = micrograms per liter.
Flags and Qualifiers: J = Analyte concentration is reported, and is less than the PQL and greater than or equal to the established MDL. Greater uncertainty is associated with this result and data reported is estimated. These analytes are not routinely reviewed nor narrated as to their potential for being laboratory artifacts. m: Manual Integration used to determine area response.
Table 5-4: April 2012 Volatile Organic Compounds Detected
2 of 2April 2012 FWDA Groundwater PMR
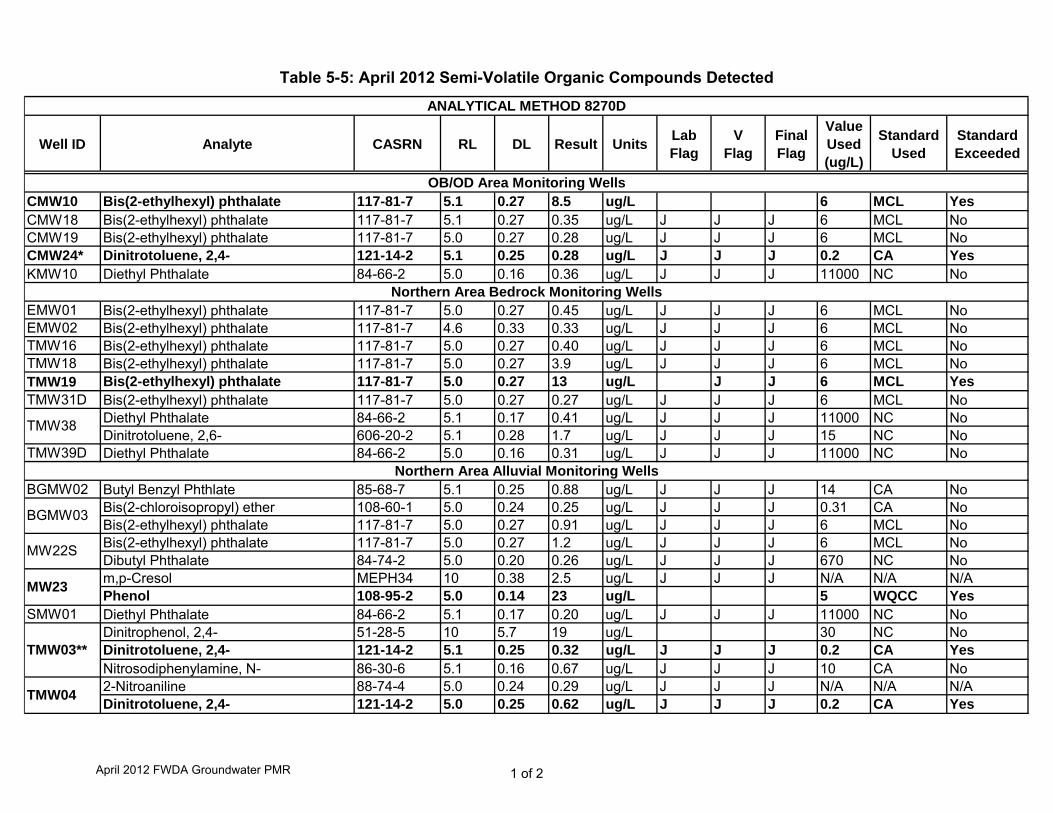
Well ID Analyte CASRN RL DL Result UnitsLabFlag
VFlag
FinalFlag
Value Used (ug/L)
Standard Used
Standard Exceeded
CMW10 Bis(2-ethylhexyl) phthalate 117-81-7 5.1 0.27 8.5 ug/L 6 MCL YesCMW18 Bis(2-ethylhexyl) phthalate 117-81-7 5.1 0.27 0.35 ug/L J J J 6 MCL NoCMW19 Bis(2-ethylhexyl) phthalate 117-81-7 5.0 0.27 0.28 ug/L J J J 6 MCL NoCMW24* Dinitrotoluene, 2,4- 121-14-2 5.1 0.25 0.28 ug/L J J J 0.2 CA YesKMW10 Diethyl Phthalate 84-66-2 5.0 0.16 0.36 ug/L J J J 11000 NC No
EMW01 Bis(2-ethylhexyl) phthalate 117-81-7 5.0 0.27 0.45 ug/L J J J 6 MCL NoEMW02 Bis(2-ethylhexyl) phthalate 117-81-7 4.6 0.33 0.33 ug/L J J J 6 MCL NoTMW16 Bis(2-ethylhexyl) phthalate 117-81-7 5.0 0.27 0.40 ug/L J J J 6 MCL NoTMW18 Bis(2-ethylhexyl) phthalate 117-81-7 5.0 0.27 3.9 ug/L J J J 6 MCL NoTMW19 Bis(2-ethylhexyl) phthalate 117-81-7 5.0 0.27 13 ug/L J J 6 MCL YesTMW31D Bis(2-ethylhexyl) phthalate 117-81-7 5.0 0.27 0.27 ug/L J J J 6 MCL No
Diethyl Phthalate 84-66-2 5.1 0.17 0.41 ug/L J J J 11000 NC NoDinitrotoluene, 2,6- 606-20-2 5.1 0.28 1.7 ug/L J J J 15 NC No
TMW39D Diethyl Phthalate 84-66-2 5.0 0.16 0.31 ug/L J J J 11000 NC No
ANALYTICAL METHOD 8270D
OB/OD Area Monitoring Wells
Northern Area Bedrock Monitoring Wells
Northern Area Alluvial Monitoring Wells
TMW38
BGMW02 Butyl Benzyl Phthlate 85-68-7 5.1 0.25 0.88 ug/L J J J 14 CA NoBis(2-chloroisopropyl) ether 108-60-1 5.0 0.24 0.25 ug/L J J J 0.31 CA NoBis(2-ethylhexyl) phthalate 117-81-7 5.0 0.27 0.91 ug/L J J J 6 MCL NoBis(2-ethylhexyl) phthalate 117-81-7 5.0 0.27 1.2 ug/L J J J 6 MCL NoDibutyl Phthalate 84-74-2 5.0 0.20 0.26 ug/L J J J 670 NC Nom,p-Cresol MEPH34 10 0.38 2.5 ug/L J J J N/A N/A N/APhenol 108-95-2 5.0 0.14 23 ug/L 5 WQCC Yes
SMW01 Diethyl Phthalate 84-66-2 5.1 0.17 0.20 ug/L J J J 11000 NC NoDinitrophenol, 2,4- 51-28-5 10 5.7 19 ug/L 30 NC NoDinitrotoluene, 2,4- 121-14-2 5.1 0.25 0.32 ug/L J J J 0.2 CA YesNitrosodiphenylamine, N- 86-30-6 5.1 0.16 0.67 ug/L J J J 10 CA No2-Nitroaniline 88-74-4 5.0 0.24 0.29 ug/L J J J N/A N/A N/ADinitrotoluene, 2,4- 121-14-2 5.0 0.25 0.62 ug/L J J J 0.2 CA Yes
MW22S
MW23
TMW03**
TMW04
g
BGMW03
Table 5-5: April 2012 Semi-Volatile Organic Compounds Detected
1 of 2April 2012 FWDA Groundwater PMR
Well ID Analyte CASRN RL DL Result UnitsLabFlag
VFlag
FinalFlag
Value Used (ug/L)
Standard Used
Standard Exceeded
ANALYTICAL METHOD 8270D
Diethyl Phthalate 84-66-2 4.9 0.16 0.17 ug/L J J J 11000 NC NoNitrosodiphenylamine, N- 86-30-6 4.9 0.15 0.18 ug/L J J J 10 CA No
TMW15 Bis(2-ethylhexyl) phthalate 117-81-7 5.0 0.27 0.30 ug/L J J J 6 MCL NoTMW22 Bis(2-ethylhexyl) phthalate 117-81-7 5.2 0.27 1.3 ug/L J J J 6 MCL NoTMW31S Diethyl Phthalate 84-66-2 5.0 0.16 0.31 ug/L J J J 11000 NC NoTMW33 Bis(2-ethylhexyl) phthalate 117-81-7 5.1 0.27 3.6 ug/L J J J 6 MCL NoTMW39S Diethyl Phthalate 84-66-2 5.0 0.16 0.40 ug/L J J J 11000 NC No
Cresol, o- 95-48-7 5.0 0.18 2.3 ug/L J J J 720 NC Nom,p-Cresol MEPH34 10 0.38 0.52 ug/L J J J N/A N/A N/A
TMW43 Bis(2-ethylhexyl) phthalate 117-81-7 5.0 0.27 0.53 ug/L J J J 6 MCL NoTMW44 Bis(2-ethylhexyl) phthalate 117-81-7 5.1 0.27 3.2 ug/L J J J 6 MCL NoTMW45 Bis(2-ethylhexyl) phthalate 117-81-7 5.0 0.27 1.5 ug/L J J J 6 MCL No
TMW07
TMW41
Abbreviations: CASRN = Chemical Abstract Services Registry Number, RL = Reporting Limit, DL= Detection Limit, MCL = Maximum Contaminant Limit, N/A = Not Applicable, WQCC = New Mexico Water Quality Control Commission, CA = Carcinogenic Regional Screening Level, NC = Non- Carcinogenic Regional Screening Level, ug/L = micrograms per liter.
Notes: *The sample bottles for CMW24 and TMW03 were accidentally switched in the laboratory. Thus, CMW24's results were reported by the laboratory d th ll id tifi ti (TMW03) Th lt h i th t bl b th t lt f CMW24 S S ti 5 6 2under the wrong well identification (TMW03). The results shown in the table above are the correct results for CMW24. See Section 5.6.2.
**The sample bottles for CMW24 and TMW03 were accidentally switched in the laboratory. Thus, TMW03's results were reported by the laboratory under the wrong well identification (CMW24). The results shown in the table above are the correct results for TMW03. See Section 5.6.2.
Table 5-5: April 2012 Semi-Volatile Organic Compounds Detected
2 of 2April 2012 FWDA Groundwater PMR

Well ID Analyte Analytical Method CASRN RL DL Result UnitsLabFlag
VFlag
FinalFlag
Value Used
(mg/L)
Standard Used
Standard Exceeded
Arsenic 6020B (DISSOLVED) 7440-38-2 0.0015 0.00061 0.011 mg/L 0.01 MCL YesSelenium 6020B (TOTAL) 7782-49-2 0.0050 0.0015 0.095 mg/L 0.05 MCL YesSelenium 6020B (DISSOLVED) 7782-49-2 0.0050 0.0015 0.11 mg/L 0.05 MCL Yes
FW31 Manganese 6020B (TOTAL) 7439-96-5 0.0050 0.00027 0.22 mg/L 0.2 WQCC YesMW01 Manganese 6020B (TOTAL) 7439-96-5 0.0050 0.00027 0.40 mg/L 0.2 WQCC Yes
Iron 6020B (TOTAL) 7439-89-6 0.10 0.048 2.9 mg/L 1 WQCC YesManganese 6020B (TOTAL) 7439-96-5 0.0050 0.00027 1.7 mg/L 0.2 WQCC YesManganese 6020B (DISSOLVED) 7439-96-5 0.0050 0.00027 0.39 mg/L 0.2 WQCC Yes
MW18D Iron 6020B (TOTAL) 7439-89-6 0.10 0.048 1.7 mg/L 1 WQCC YesArsenic 6020B (TOTAL) 7440-38-2 0.0015 0.00061 0.021 mg/L 0.01 MCL YesArsenic 6020B (DISSOLVED) 7440-38-2 0.0015 0.00061 0.021 mg/L 0.01 MCL YesManganese 6020B (TOTAL) 7439-96-5 0.0050 0.00027 2.1 mg/L 0.2 WQCC YesManganese 6020B (DISSOLVED) 7439-96-5 0.10 0.0053 2.2 mg/L 0.2 WQCC YesSelenium 6020B (TOTAL) 7782-49-2 0.0050 0.0015 0.21 mg/L 0.05 MCL YesSelenium 6020B (DISSOLVED) 7782-49-2 0.0050 0.0015 0.23 mg/L 0.05 MCL Yes
MW22D Selenium 6020B (DISSOLVED) 7782-49-2 0.0050 0.0015 0.052 mg/L 0.05 MCL YesIron 6020B (TOTAL) 7439-89-6 0.10 0.048 1.9 mg/L 1 WQCC YesManganese 6020B (TOTAL) 7439-96-5 0.0050 0.00027 0.38 mg/L 0.2 WQCC YesIron 6020B (TOTAL) 7439-89-6 0 10 0 048 1 8 mg/L 1 WQCC Yes
ANALYTICAL METHOD 6020
BGMW02
Northern Area Alluvial Monitoring Wells
MW02
MW20
MW22SIron 6020B (TOTAL) 7439-89-6 0.10 0.048 1.8 mg/L 1 WQCC YesManganese 6020B (TOTAL) 7439-96-5 0.0050 0.00027 0.46 mg/L 0.2 WQCC YesIron 6020B (TOTAL) 7439-89-6 0.10 0.048 2.3 mg/L 1 WQCC YesIron 6020B (DISSOLVED) 7439-89-6 0.10 0.048 1.8 mg/L 1 WQCC YesManganese 6020B (TOTAL) 7439-96-5 0.0050 0.00027 0.49 mg/L 0.2 WQCC YesManganese 6020B (DISSOLVED) 7439-96-5 0.0050 0.00027 0.50 mg/L 0.2 WQCC YesThallium 6020B (TOTAL) 7440-28-0 0.0020 0.00016 0.014 mg/L 0.002 MCL YesSelenium 6020B (TOTAL) 7782-49-2 0.0050 0.0015 0.070 mg/L 0.05 MCL YesSelenium 6020B (DISSOLVED) 7782-49-2 0.0050 0.0015 0.072 mg/L 0.05 MCL YesArsenic 6020B (DISSOLVED) 7440-38-2 0.0015 0.00061 0.011 mg/L 0.01 MCL YesSelenium 6020B (TOTAL) 7782-49-2 0.0050 0.0015 0.096 mg/L 0.05 MCL YesSelenium 6020B (DISSOLVED) 7782-49-2 0.0050 0.0015 0.11 mg/L 0.05 MCL YesManganese 6020B (TOTAL) 7439-96-5 0.0050 0.00027 0.32 mg/L 0.2 WQCC YesManganese 6020B (DISSOLVED) 7439-96-5 0.0050 0.00027 0.31 mg/L 0.2 WQCC YesArsenic 6020B (DISSOLVED) 7440-38-2 0.0015 0.00061 0.012 mg/L 0.01 MCL YesIron 6020B (TOTAL) 7439-89-6 0.10 0.048 2.6 mg/L 1 WQCC Yes
MW24
TMW03
TMW04
MW23
TMW07
TMW08
Table 5-6: April 2012 Mercury and Metals Detected Above Regulatory Health Standards
1 of 3April 2012 FWDA Groundwater PMR
Well ID Analyte Analytical Method CASRN RL DL Result UnitsLabFlag
VFlag
FinalFlag
Value Used
(mg/L)
Standard Used
Standard Exceeded
ANALYTICAL METHOD 6020
Manganese 6020B (TOTAL) 7439-96-5 0.0050 0.00027 0.23 mg/L 0.2 WQCC YesManganese 6020B (DISSOLVED) 7439-96-5 0.0050 0.00027 0.21 mg/L 0.2 WQCC YesSelenium 6020B (TOTAL) 7782-49-2 0.0050 0.0015 0.059 mg/L 0.05 MCL YesSelenium 6020B (DISSOLVED) 7782-49-2 0.0050 0.0015 0.066 mg/L 0.05 MCL Yes
TMW10 Thallium 6020B (TOTAL) 7440-28-0 0.0020 0.00016 0.037 mg/L 0.002 MCL YesTMW24 Thallium 6020B (DISSOLVED) 7440-28-0 0.0050 0.00016 0.010 mg/L 0.002 MCL YesTMW25 Manganese 6020B (TOTAL) 7439-96-5 0.0050 0.00027 0.28 mg/L 0.2 WQCC Yes
Arsenic 6020B (TOTAL) 7440-38-2 0.0015 0.00061 0.019 mg/L 0.01 MCL YesArsenic 6020B (DISSOLVED) 7440-38-2 0.0015 0.00061 0.021 mg/L 0.01 MCL YesIron 6020B (TOTAL) 7439-89-6 0.10 0.048 1.5 mg/L 1 WQCC YesManganese 6020B (TOTAL) 7439-96-5 0.0050 0.00027 0.65 mg/L 0.2 WQCC YesManganese 6020B (DISSOLVED) 7439-96-5 0.0050 0.00027 0.59 mg/L 0.2 WQCC YesManganese 6020B (TOTAL) 7439-96-5 0.0050 0.00027 0.30 mg/L 0.2 WQCC YesManganese 6020B (DISSOLVED) 7439-96-5 0.0050 0.00027 0.29 mg/L 0.2 WQCC YesIron 6020B (TOTAL) 7439-89-6 0.10 0.048 1.6 mg/L 1 WQCC YesManganese 6020B (TOTAL) 7439-96-5 0.0050 0.00027 0.43 mg/L 0.2 WQCC YesThallium 6020B (TOTAL) 7440-28-0 0.0020 0.00016 0.0063 mg/L 0.002 MCL YesManganese 6020B (TOTAL) 7439-96-5 0.0050 0.00027 0.70 mg/L 0.2 WQCC YesManganese 6020B (DISSOLVED) 7439-96-5 0.0050 0.00027 0.56 mg/L 0.2 WQCC YesThallium 6020B (TOTAL) 7440-28-0 0.0020 0.00016 0.0041 mg/L 0.002 MCL Yes
TMW27
TMW28
TMW29
TMW33
TMW08
Thallium 6020B (TOTAL) 7440 28 0 0.0020 0.00016 0.0041 mg/L 0.002 MCL YesArsenic 6020B (TOTAL) 7440-38-2 0.0015 0.00061 0.011 mg/L 0.01 MCL YesSelenium 6020B (TOTAL) 7782-49-2 0.0050 0.0015 0.11 mg/L 0.05 MCL YesSelenium 6020B (DISSOLVED) 7782-49-2 0.0050 0.0015 0.12 mg/L 0.05 MCL Yes
TMW39S Iron 6020B (TOTAL) 7439-89-6 0.10 0.048 1.9 mg/L 1 WQCC YesTMW44 Manganese 6020B (TOTAL) 7439-96-5 0.0050 0.00027 0.54 mg/L 0.2 WQCC Yes
Iron 6020B (TOTAL) 7439-89-6 0.10 0.048 1.3 mg/L 1 WQCC YesThallium 6020B (DISSOLVED) 7440-28-0 0.0050 0.00016 0.0038 mg/L J J J 0.002 MCL YesArsenic 6020B (TOTAL) 7440-38-2 0.0015 0.00061 0.011 mg/L 0.01 MCL YesSelenium 6020B (TOTAL) 7782-49-2 0.0050 0.0015 0.11 mg/L 0.05 MCL YesSelenium 6020B (DISSOLVED) 7782-49-2 0.0050 0.0015 0.11 mg/L 0.05 MCL Yes
Chromium 6020B (TOTAL) 7440-47-3 0.010 0.00030 0.078 mg/L 0.05 WQCC YesChromium 6020B (DISSOLVED) 7440-47-3 0.010 0.00030 0.060 mg/L 0.05 WQCC Yes
CMW17 Iron 6020B (TOTAL) 7439-89-6 0.10 0.048 1.9 mg/L 1 WQCC YesArsenic 6020B (TOTAL) 7440-38-2 0.0015 0.00061 0.028 mg/L 0.01 MCL Yes
CMW14OB/OD Area Monitoring Wells
TMW34
TMW45
KMW11
TMW46
Table 5-6: April 2012 Mercury and Metals Detected Above Regulatory Health Standards
2 of 3April 2012 FWDA Groundwater PMR
Well ID Analyte Analytical Method CASRN RL DL Result UnitsLabFlag
VFlag
FinalFlag
Value Used
(mg/L)
Standard Used
Standard Exceeded
ANALYTICAL METHOD 6020
Arsenic 6020B (DISSOLVED) 7440-38-2 0.0015 0.00061 0.026 mg/L 0.01 MCL YesKMW11 Thallium 6020B (DISSOLVED) 7440-28-0 0.0050 0.00016 0.0021 mg/L J J J 0.002 MCL Yes
Iron 6020B (TOTAL) 7439-89-6 0.10 0.048 1.2 mg/L 1 WQCC YesManganese 6020B (TOTAL) 7439-96-5 0.0050 0.00027 0.68 mg/L 0.2 WQCC YesManganese 6020B (DISSOLVED) 7439-96-5 0.0050 0.00027 0.72 mg/L 0.2 WQCC Yes
Chromium 6020B (TOTAL) 7440-47-3 0.010 0.00030 0.19 mg/L 0.05 WQCC YesIron 6020B (TOTAL) 7439-89-6 0.10 0.048 2.2 mg/L 1 WQCC YesSelenium 6020B (TOTAL) 7782-49-2 0.0050 0.0015 0.080 mg/L 0.05 MCL YesSelenium 6020B (DISSOLVED) 7782-49-2 0.0050 0.0015 0.082 mg/L 0.05 MCL Yes
TMW16 Thallium 6020B (DISSOLVED) 7440-28-0 0.0050 0.00016 0.0081 mg/L 0.002 MCL YesTMW40D Thallium 6020B (DISSOLVED) 7440-28-0 0.0050 0.00016 0.0040 mg/L J J J 0.002 MCL Yes
Well ID Analyte Analytical Method CASNR RL DL Result UnitsLabFlag
VFlag
FinalFlag
Value Used
(mg/L)
Standard Used
Standard Exceeded
CMW02 Mercury 7470 (DISSOLVED) 7439-97-6 0 00020 0 00005 0 00018 mg/L J J J 0 002 MCL No
EMW04
KMW12
TMW02
Northern Area Bedrock Monitoring Wells
OB/OD Area Monitoring Wells
ANALYTICAL METHOD 7470
KMW11
CMW02 Mercury 7470 (DISSOLVED) 7439 97 6 0.00020 0.00005 0.00018 mg/L J J J 0.002 MCL No
TMW10 Mercury 7470 (TOTAL) 7439-97-6 0.00020 0.00002 0.00027 mg/L 0.002 MCL No
TMW25 Mercury 7470 (DISSOLVED) 7439-97-6 0.00020 0.00005 0.00005 mg/L J J J 0.002 MCL NoTMW39D Mercury 7470 (TOTAL) 7439-97-6 0.00020 0.00002 0.00010 mg/L J J J 0.002 MCL No
Northern Area Bedrock Monitoring Wells
Northern Area Alluvial Monitoring Wells
Abbreviations: CASRN = Chemical Abstract Services Registry Number, RL = Reporting Limit, DL= Detection Limit, MCL = Maximum Contaminant Limit, WQCC = New Mexico Water Quality Control Commission, V Flag = Validation Flag, mg/L = milligrams per liter
Flags and Qualifiers: J = Analyte concentration is reported, and is less than the PQL and greater than or equal to the established MDL. Greater uncertainty is associated with this result and data reported is estimated. These analytes are not routinely reviewed nor narrated as to their potential for being laboratory artifacts
Table 5-6: April 2012 Mercury and Metals Detected Above Regulatory Health Standards
3 of 3April 2012 FWDA Groundwater PMR
Well ID Analyte CASNR RL DL Result UnitsLabFlag
VFlag
FinalFlag
Value Used
Standard Used
Standard Exceeded
CMW24 alpha-Chlordane 5103-71-9 0.010 0.0031 0.025 ug/L m N/A N/A N/A
MW22D Methoxychlor 72-43-5 0.010 0.0030 0.0072 ug/L Jm J J 40 MCL NoMW23 DDE, p,p'- 72-55-9 0.016 0.0043 0.0073 ug/L J J J 0.2 CA NoTMW47 DDE, p,p'- 72-55-9 0.010 0.0026 0.032 ug/L 0.2 CA No
TMW37 Endrin aldehyde 7421-93-4 0.010 0.0035 0.016 ug/L N/A N/A N/A
ANALYTICAL METHOD 8081A
OB/OD Area Monitoring Wells
Northern Area Alluvial Monitoring Wells
Northern Area Bedrock Monitoring Wells
Abbreviations: CASRN = Chemical Abstract Services Registry Number, RL = Reporting Limit, DL= Detection Limit, MCL = Maximum Contaminant Limit, N/A = Not Applicable, CA = Carcinogenic Regional Screening Level, ug/L = micrograms per liter
Flags and Qualifiers: J = Analyte concentration is reported, and is less than the PQL and greater than or equal to the established MDL. Greater uncertainty is associated with this result and data reported is estimated. These analytes are not routinely reviewed nor narrated as to their potential for being laboratory artifacts. m = Manual Integration used to determine area response.
Table 5-7: April 2012 Pesticide Compounds Detected
1 of 1April 2012 FWDA Groundwater PMR
Result (mg/L) Flag Result (mg/L) Flag Result (mg/L) Flag Result (mg/L) Flag
CMW02 Nitrate 14797-55-8 1.34 J 3.0 3.1 1.1Nitrate 14797-55-8 4.02 3.7 4.1 J 3.7Nitrite 14797-65-0 ND 0.21 J ND ND
CMW14 Nitrate 14797-55-8 ND 2.0 ND 0.30CMW17 Nitrate 14797-55-8 0.0323 2.0 2.4 2.5CMW18 Nitrate 14797-55-8 6.19 J 0.098 J 4.5 3.8
Nitrate 14797-55-8 ND 0.095 J ND NDNitrite 14797-65-0 0.059 J ND ND ND
CMW22 Nitrate 14797-55-8 ND 0.089 J ND 0.26 JCMW25 Nitrite 14797-65-0 ND ND 0.27 J ND
Nitrate 14797-55-8 ND 0.36 J ND 0.61Nitrite 14797-65-0 ND 0.26 J ND ND
KMW10 Nitrate 14797-55-8 8.6 J 9.2 10 J 9.0KMW11 Nitrate 14797-55-8 0.262 0.26 J 0.21 J 0.24 J
Nitrate 14797-55-8 0.223 J ND 0.51 0.34Nitrite 14797-65-0 0.056 J ND 0.39 NDKMW12
ANALYTICAL METHOD 300.0
Well ID Analyte CASNR
October 2010 October 2011
CMW10
CMW19
KMW09
April 2011 April 2012
OB/OD Area Wells
BGMW01 Nitrate 14797-55-8 NA NA NA 1.9BGMW02 Nitrate 14797-55-8 NA NA NA 18
Nitrate 14797-55-8 NA NA NA 8.3Nitrite 14797-65-0 NA NA NA 0.35Nitrate 14797-55-8 0.0039 0.091 J 0.19 J 0.29 JNitrite 14797-65-0 ND ND 0.22 J ND
FW35 Nitrate 14797-55-8 0.951 0.98 0.88 J 0.99MW01 Nitrate 14797-55-8 7.16 J 7.1 7.5 6.4MW02 Nitrate 14797-55-8 0.98 0.75 1.4 1.4MW03 Nitrate 14797-55-8 11.5 J 12 10 10MW18D Nitrate 14797-55-8 ND ND 0.18 J NDMW20 Nitrate 14797-55-8 28.9 J 29 J 21 23
FW31
BGMW03
Northern Area Alluvial Wells
Table 5-8: October 2010 - April 2012 Nitrate and Nitrite Detected
1 of 4April 2012 FWDA Groundwater PMR
Result (mg/L) Flag Result (mg/L) Flag Result (mg/L) Flag Result (mg/L) Flag
ANALYTICAL METHOD 300.0
Well ID Analyte CASNR
October 2010 October 2011April 2011 April 2012
MW20 Nitrite 14797-65-0 6.48 J 4.9 J 7.0 4.3Nitrate 14797-55-8 18.4 J 24 28 23Nitrite 14797-65-0 ND ND 0.16 J ND
MW22S Nitrate 14797-55-8 26.2 J 26 J 25 22MW23 Nitrate 14797-55-8 NA NA ND 0.42
Nitrate 14797-55-8 7.66 J 8.9 9.3 8.8Nitrite 14797-65-0 ND 0.19 J ND NDNitrate 14797-55-8 142 J ND 160 150Nitrite 14797-65-0 0.056 J 3.1 0.49 0.58
TMW04 Nitrate 14797-55-8 42.5 J 46 J 49 8.1TMW06 Nitrate 14797-55-8 26.2 J 21 25 15
Nitrate 14797-55-8 0.309 0.98 9.2 J 0.21 JNitrite 14797-65-0 ND ND 0.56 J ND
TMW08 Nitrate 14797-55-8 2.37 J 5.0 4.0 4.6TMW10 Nitrate 14797-55-8 0.488 0.21 J 0.25 J 0.21 JTMW11 Nitrate 14797-55-8 1.36 3.5 J 4.8 J 5.2TMW13 Nitrate 14797-55-8 1.58 2.0 J 1.9 1.7TMW15 Nit t 14797 55 8 0 985 1 6 3 3 J 5 0
MW22D
TMW01
TMW03
TMW07
TMW15 Nitrate 14797-55-8 0.985 1.6 3.3 J 5.0Nitrate 14797-55-8 7.39 J 50 8.2 7.8Nitrite 14797-65-0 ND 0.83 ND ND
TMW22 Nitrate 14797-55-8 9.15 J 9.5 11 11Nitrate 14797-55-8 33 J 33 J 35 32Nitrite 14797-65-0 ND 0.20 J ND ND
TMW24 Nitrate 14797-55-8 ND ND 0.16 J NDTMW25 Nitrate 14797-55-8 0.621 0.80 1.2 0.67TMW29 Nitrate 14797-55-8 4.26 3.5 4.0 3.7TMW29 Nitrite 14797-65-0 ND 0.53 ND ND
Nitrate 14797-55-8 7.59 J 4.8 J 8.4 7.7Nitrite 14797-65-0 ND ND 0.13 J ND
TMW34 Nitrate 14797-55-8 40.2 J 47 51 J 50
TMW21
TMW23
TMW31S
Table 5-8: October 2010 - April 2012 Nitrate and Nitrite Detected
2 of 4April 2012 FWDA Groundwater PMR
Result (mg/L) Flag Result (mg/L) Flag Result (mg/L) Flag Result (mg/L) Flag
ANALYTICAL METHOD 300.0
Well ID Analyte CASNR
October 2010 October 2011April 2011 April 2012
TMW35 Nitrate 14797-55-8 18.7 J 22 23 J 20TMW39S Nitrate 14797-55-8 NA NA 9.8 J 8.6
Nitrate 14797-55-8 NA NA 28* 100*Nitrite 14797-65-0 NA NA 6.9* 1.6*
TMW41 Nitrate 14797-55-8 NA NA 5.7 J 6.2Nitrate 14797-55-8 NA NA NA 10Nitrite 14797-65-0 NA NA NA 0.19
TMW44 Nitrate 14797-55-8 NA NA NA 46TMW45 Nitrate 14797-55-8 NA NA NA 5.5TMW46 Nitrate 14797-55-8 NA NA NA 97TMW47 Nitrate 14797-55-8 NA NA NA 18
EMW02 Nitrate 14797-55-8 0.407 J 0.20 J 0.87 0.55EMW03 Nitrate 14797-55-8 ND 0.16 J ND NDEMW04 Nitrate 14797-55-8 3.39 J 3.1 2.2 J NDTMW02 Nitrate 14797-55-8 90.6 J 100 110 J 99
Nitrate 14797-55-8 ND 0.077 J 17 NDTMW14A
TMW40S*
TMW43
Northern Area Bedrock Wells
Nitrite 14797-65-0 ND 0.19 J ND NDTMW17 Nitrate 14797-55-8 ND ND 0.23 J NDTMW30 Nitrate 14797-55-8 18.9 J 19 18 15TMW31D Nitrate 14797-55-8 14.5 J 16 ND 16
Nitrate 14797-55-8 1.26 1.4 1.2 NDNitrite 14797-65-0 0.0176 J 0.22 J 0.27 J ND
TMW36 Nitrate 14797-55-8 ND 0.093 J ND NDTMW37 Nitrate 14797-55-8 ND ND 0.14 J ND
Nitrate 14797-55-8 NA NA 9.4 J 7.6Nitrite 14797-65-0 NA NA 0.62 J NDNitrate 14797-55-8 NA NA 2.8 2.1Nitrite 14797-65-0 NA NA 0.38 0.34
TMW48 Nitrate 14797-55-8 NA NA 20 J 50
TMW14A
TMW32
TMW39D
TMW40D
Table 5-8: October 2010 - April 2012 Nitrate and Nitrite Detected
3 of 4April 2012 FWDA Groundwater PMR
Result (mg/L) Flag Result (mg/L) Flag Result (mg/L) Flag Result (mg/L) Flag
ANALYTICAL METHOD 300.0
Well ID Analyte CASNR
October 2010 October 2011April 2011 April 2012
TMW48 Nitrite 14797-65-0 NA NA 0.20 J NDTMW49 Nitrate 14797-55-8 NA NA 8.4 1.3Notes: *TMW40S was likely contaminated during drilling. These results may not accurately represent chemical concentrations in the alluvial aquifer. See Section 5.6.6.October 2010 primary samples were analyzed by ANA-Lab Corp.
Abbreviations: CASRN = Chemical Abstracts Service Registry Number, NA = Not Applicable, ND = Not Detected
Table 5-8: October 2010 - April 2012 Nitrate and Nitrite Detected
4 of 4April 2012 FWDA Groundwater PMR

Result Flag Result Flag Result Flag Result Flag
CMW04 Dinitrobenzene, 1,3- 99-65-0 ND 3.3 ND 4.6Dinitrobenzene, 1,3- 99-65-0 ND 2.2 ND 1.2Methyl-2,4,6-trinitrophenylnitramine 479-45-8 ND 14 ND NDNitrobenzene 98-95-3 ND ND ND 0.098 JTrinitrotoluene, 2,4,6- 118-96-7 ND 1.7 ND NDHexahydro-1,3,5-trinitro-1,3,5-triazine (RDX) 121-82-4 1.48 1.1 1.8 NDOctahydro-1,3,5,7-tetranitro-1,3,5,7-tetra (HMX) 2691-41-0 ND ND 0.20 J NDDinitrotoluene, 2-Amino-4,6- 35572-78-2 1.95 1.7 J 2.3 2.4* JDinitrotoluene, 4-Amino-2,6- 19406-51-0 2.48 1.8 J 2.7 2.7* JHexahydro-1,3,5-trinitro-1,3,5-triazine (RDX) 121-82-4 59.6 48 70.1 58*Octahydro-1,3,5,7-tetranitro-1,3,5,7-tetra (HMX) 2691-41-0 15.8 14 20.9 15*Trinitrotoluene, 2,4,6- 118-96-7 ND 0.17 J ND 0.049* JDinitrobenzene, 1,3- 99-65-0 ND 11 J ND 6.3Tetryl (Trinitrophenylmethylnitramine) 479-45-8 ND ND ND 0.52Nitrotoluene, o- 88-72-2 0.205 J ND ND NDTrinitrotoluene, 2,4,6- 118-96-7 ND ND 0.24 ND
April 2012
OB/OD Area Wells
ANALYTICAL METHOD 8330 (Results in ug/L)
Well ID Analyte CASNR
October 2010 April 2011 October 2011
CMW14
CMW17
CMW18
CMW19
CMW23
Dinitrobenzene, 1,3- 99-65-0 ND 12 ND 32**Dinitrotoluene, 2-Amino-4,6- 35572-78-2 ND ND 0.064 J 0.36**Dinitrobenzene, 1,3- 99-65-0 ND 12 ND 8.8Tetryl (Trinitrophenylmethylnitramine) 479-45-8 ND ND 0.47 J NDTrinitrotoluene, 2,4,6- 118-96-7 ND ND ND 2.5
KMW11 Dinitrobenzene, 1,3- 99-65-0 ND ND ND 0.30
FW35 Trinitrotoluene, 2,4,6- 118-96-7 ND ND 0.14 NDDinitrobenzene, 1,3- 99-65-0 ND 0.26 J ND NDDinitrotoluene, 4-Amino-2,6- 19406-51-0 ND 0.13 J ND NDTrinitrotoluene, 2,4,6- 118-96-7 ND ND 0.097 J ND
MW02 Trinitrotoluene, 2,4,6- 118-96-7 ND ND 0.30 NDMW03 Dinitrobenzene, 1,3- 99-65-0 ND ND ND 0.46
Northern Area Alluvial Wells
CMW24
KMW09
MW01
Table 5-9: October 2010 - April 2012 Total Explosives Detected
1 of 3April 2012 FWDA Groundwater PMR
Result Flag Result Flag Result Flag Result FlagApril 2012
ANALYTICAL METHOD 8330 (Results in ug/L)
Well ID Analyte CASNR
October 2010 April 2011 October 2011
MW18D Dinitrobenzene, 1,3- 99-65-0 ND 40 ND 4.5Dinitrotoluene, 4-Amino-2,6- 19406-51-0 ND 0.072 J ND NDNitrotoluene, p- 99-99-0 ND 0.32 J ND NDTrinitrotoluene, 2,4,6- 118-96-7 ND ND 0.34 ND
SMW01 Dinitrobenzene, 1,3- 99-65-0 ND 0.096 J ND NDDinitrobenzene, 1,3- 99-65-0 ND 0.036 J 0.20 ND***Dinitrotoluene, 2,4- 121-14-2 ND 0.35 J 0.36 0.40***Dinitrotoluene, 2-Amino-4,6- 35572-78-2 0.777 0.68 J 0.74 0.72***Dinitrotoluene, 4-Amino-2,6- 19406-51-0 1.38 1.0 J 1.2 ND***Hexahydro-1,3,5-trinitro-1,3,5-triazine (RDX) 121-82-4 497 360 466 250***Nitrobenzene 98-95-3 ND 7.4 ND ND***Octahydro-1,3,5,7-tetranitro-1,3,5,7-tetra (HMX) 2691-41-0 126 5.0 5.9 J 3.5*** JTrinitrobenzene, 1,3,5- 99-35-4 2.00 1.5 J 0.51 ND***Dinitrotoluene, 2,4- 121-14-2 ND 0.091 J 0.14 NDDinitrotoluene, 2-Amino-4,6- 35572-78-2 1.85 1.8 1.5 1.5 JDinitrotoluene, 4-Amino-2,6- 19406-51-0 2.61 2.2 2.2 1.6 JHexahydro-1,3,5-trinitro-1,3,5-triazine (RDX) 121-82-4 2.17 17 2.3 NDT i it b 1 3 5 99 35 4 6 55 6 4 1 4 2 8 J
MW22S
TMW03
TMW04
Trinitrobenzene, 1,3,5- 99-35-4 6.55 6.4 1.4 2.8 JTMW06 Dinitrobenzene, 1,3- 99-65-0 ND ND ND 0.29TMW11 Hexahydro-1,3,5-trinitro-1,3,5-triazine (RDX) 121-82-4 ND 0.12 J 0.14 ND
Hexahydro-1,3,5-trinitro-1,3,5-triazine (RDX) 121-82-4 ND ND ND 1.0Trinitrobenzene, 1,3,5- 99-35-4 ND ND ND 0.12 J
TMW23 Hexahydro-1,3,5-trinitro-1,3,5-triazine (RDX) 121-82-4 50.2 J 50 93.3 36Dinitrobenzene, 1,3- 99-65-0 ND 1.3 ND NDDinitrotoluene, 4-Amino-2,6- 19406-51-0 ND 0.043 J ND ND
TMW31S Trinitrotoluene, 2,4,6- 118-96-7 ND ND 0.15 NDTMW41 Trinitrotoluene, 2,4,6- 118-96-7 NA NA 0.11 ND
Hexahydro-1,3,5-trinitro-1,3,5-triazine (RDX) 121-82-4 NA NA ND 2.5Octahydro-1,3,5,7-tetranitro-1,3,5,7-tetra (HMX) 2691-41-0 NA NA ND 0.12 J
TMW44 Trinitrobenzene, 1,3,5- 99-35-4 NA NA ND 0.26 J
TMW21
TMW26
TMW43
Table 5-9: October 2010 - April 2012 Total Explosives Detected
2 of 3April 2012 FWDA Groundwater PMR
Result Flag Result Flag Result Flag Result FlagApril 2012
ANALYTICAL METHOD 8330 (Results in ug/L)
Well ID Analyte CASNR
October 2010 April 2011 October 2011
Dinitrobenzene, 1,3- 99-65-0 ND ND ND 0.20Dinitrotoluene, 2-Amino-4,6- 35572-78-2 ND ND ND 0.048 JDinitrotoluene, 4-Amino-2,6- 19406-51-0 ND 0.030 J ND NDNitrobenzene 98-95-3 ND 0.089 J ND NDTrinitrobenzene, 1,3,5- 99-35-4 ND ND ND 0.059 JDinitrotoluene, 4-Amino-2,6- 19406-51-0 ND ND ND 0.075 J
TMW14A Dinitrobenzene, 1,3- 99-65-0 ND 1.3 ND 0.65TMW16 Trinitrotoluene, 2,4,6- 118-96-7 ND ND 0.18 NDTMW18 Methyl-2,4,6-trinitrophenylnitramine 479-45-8 ND 0.23 J ND ND
Dinitrobenzene, 1,3- 99-65-0 ND 0.48 ND NDTrinitrobenzene, 1,3,5- 99-35-4 ND 0.23 ND ND
TMW30 Dinitrobenzene, 1,3- 99-65-0 ND ND ND 0.10 JTMW32 Hexahydro-1,3,5-trinitro-1,3,5-triazine (RDX) 121-82-4 ND ND ND 0.11 J
Dinitrobenzene, 1,3- 99-65-0 ND 0.40 J ND NDTrinitrobenzene, 1,3,5- 99-35-4 ND 0.072 J ND ND
TMW37 Dinitrobenzene, 1,3- 99-65-0 ND 0.76 ND ND
Northern Area Bedrock Wells
TMW19
TMW36
EMW01
EMW03
TMW02
TMW38 Dinitrobenzene, 1,3- 99-65-0 NA NA ND 1.9 JNotes: *A laboratory error was made in the original analysis of the CMW18 sample. However, both the blind duplicate sample and triplicate sample were analyzed correctly and results closely match historical data. The blind duplicate (FW03) sample results are given here. See Section 5.6.2.**The sample bottles for CMW24 and TMW03 were accidentally switched in the laboratory. Thus, CMW24's results were reported by the laboratory under the wrong well identification (TMW03). The results shown in the table above are the correct results for CMW24. See Section 5.6.5.***The sample bottles for CMW24 and TMW03 were accidentally switched in the laboratory. Thus, TMW03's results were reported by the laboratory under the wrong well identification (CMW24). The results shown in the table above are the correct results for TMW03. See Section 5.6.5.October 2010 primary samples were analyzed by ANA-Lab Corp.
Table 5-9: October 2010 - April 2012 Total Explosives Detected
3 of 3April 2012 FWDA Groundwater PMR
Result Flag Result Flag Result Flag Result Flag
CMW02 Perchlorate 14797-73-0 0.689 0.815 ND 0.796CMW10 Perchlorate 14797-73-0 0.920 0.942 ND 0.845CMW14 Perchlorate 14797-73-0 ND 0.0676 J ND NDCMW17 Perchlorate 14797-73-0 ND 1.88 1.8 J 1.87CMW18 Perchlorate 14797-73-0 4.10 4.19 4.5 5.23CMW23 Perchlorate 14797-73-0 ND 0.144 J ND NDKMW10 Perchlorate 14797-73-0 2.26 2.50 2.3 2.42KMW11 Perchlorate 14797-73-0 0.555 0.546 ND 0.368
BGMW03 Perchlorate 14797-73-0 NA NA NA 0.579MW18D Perchlorate 14797-73-0 ND ND ND 0.500MW20 Perchlorate 14797-73-0 0.825 0.746 ND 0.684MW22D Perchlorate 14797-73-0 0.237 0.434 ND 0.219MW22S Perchlorate 14797-73-0 0.352 0.143 J ND 0.133 JSMW01 Perchlorate 14797-73-0 1.66 ND ND NDTMW01 Perchlorate 14797-73-0 288 ND 270 296
April 2011 October 2011ANALYTICAL METHOD 6850 (Results in ug/L)
April 2012
OB/OD Area Wells
Nothern Area Alluvial Wells
Well ID Analyte CASNR
October 2010
TMW03 Perchlorate 14797-73-0 0.869 1.00 ND 0.962TMW04 Perchlorate 14797-73-0 0.398 0.360 ND 0.371TMW11 Perchlorate 14797-73-0 ND 0.143 J ND 0.176 JTMW13 Perchlorate 14797-73-0 ND 0.0743 J ND 0.0838 JTMW15 Perchlorate 14797-73-0 ND 0.117 J ND 0.166 JTMW23 Perchlorate 14797-73-0 ND 0.053 J ND 0.113 JTMW27 Perchlorate 14797-73-0 0.312 ND ND NDTMW29 Perchlorate 14797-73-0 ND 0.123 J ND 0.112 JTMW31S Perchlorate 14797-73-0 554 495 500 507TMW34 Perchlorate 14797-73-0 0.282 0.280 ND 0.288TMW35 Perchlorate 14797-73-0 ND ND ND 0.214TMW39S Perchlorate 14797-73-0 NA NA 640 702TMW40S* Perchlorate 14797-73-0 NA NA 140* 76.8*
Table 5-10: October 2010 - April 2012 Perchlorate Detected
1 of 2April 2012 FWDA Groundwater PMR
Result Flag Result Flag Result Flag Result FlagApril 2011 October 2011
ANALYTICAL METHOD 6850 (Results in ug/L)April 2012
Well ID Analyte CASNR
October 2010
TMW41 Perchlorate 14797-73-0 NA NA 1.5 J 1.68TMW45 Perchlorate 14797-73-0 NA NA ND 0.368TMW46 Perchlorate 14797-73-0 NA NA ND 0.712
EMW01 Perchlorate 14797-73-0 ND 0.0796 J ND NDTMW02 Perchlorate 14797-73-0 1.51 1.44 1.5 J 17.5TMW30 Perchlorate 14797-73-0 5010 3280 2700 2570TMW31D Perchlorate 14797-73-0 1660 1450 1400 1480TMW32 Perchlorate 14797-73-0 2680 254 190 114TMW39D Perchlorate 14797-73-0 NA NA 810 765TMW40D Perchlorate 14797-73-0 NA NA 320 283TMW48 Perchlorate 14797-73-0 NA NA 1600 1640TMW49 Perchlorate 14797-73-0 NA NA 2100 2570
Nothern Area Bedrock Wells
Notes: *TMW40S was likely contaminated during drilling. These results may not accurately represent chemical concentrations in the alluvial aquifer. See Section 5.6.6.October 2010 primary samples were analyzed by ANA-Lab Corp.
Abbreviations: CASRN = Chemical Abstracts Service Registry Number, NA = Not Applicable, ND = Not Detected
Table 5-10: October 2010 - April 2012 Perchlorate Detected
2 of 2April 2012 FWDA Groundwater PMR
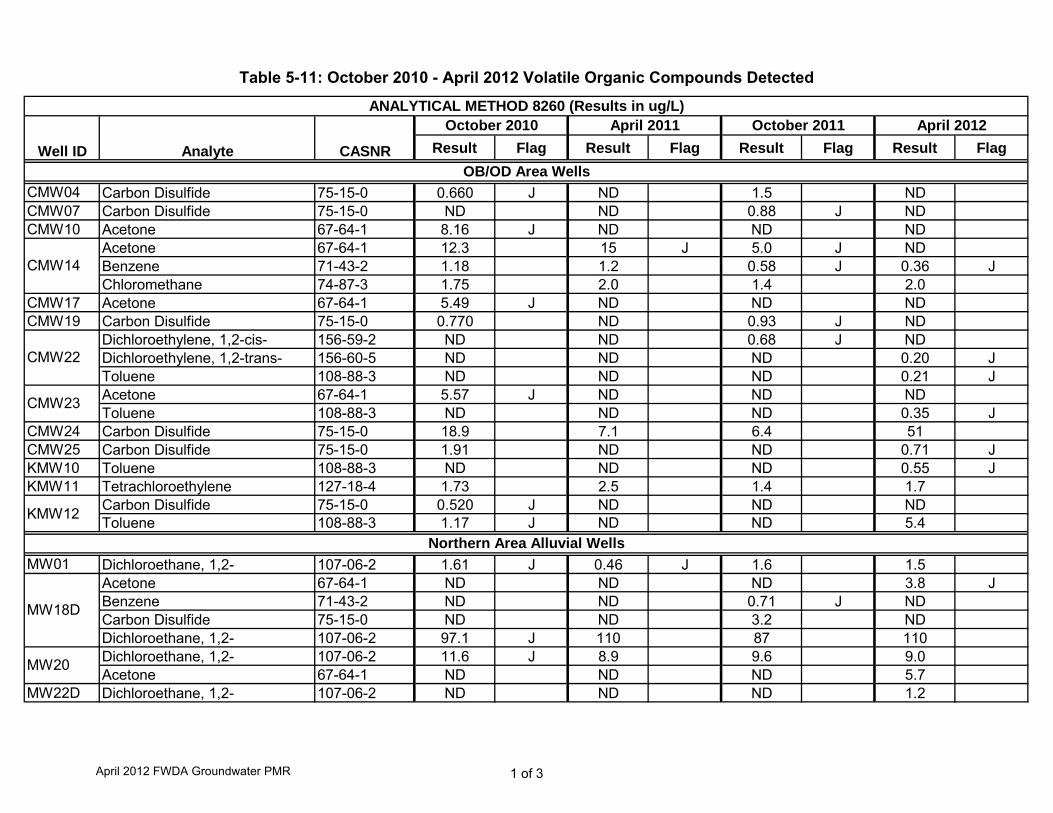
Result Flag Result Flag Result Flag Result Flag
CMW04 Carbon Disulfide 75-15-0 0.660 J ND 1.5 NDCMW07 Carbon Disulfide 75-15-0 ND ND 0.88 J NDCMW10 Acetone 67-64-1 8.16 J ND ND ND
Acetone 67-64-1 12.3 15 J 5.0 J NDBenzene 71-43-2 1.18 1.2 0.58 J 0.36 JChloromethane 74-87-3 1.75 2.0 1.4 2.0
CMW17 Acetone 67-64-1 5.49 J ND ND NDCMW19 Carbon Disulfide 75-15-0 0.770 ND 0.93 J ND
Dichloroethylene, 1,2-cis- 156-59-2 ND ND 0.68 J NDDichloroethylene, 1,2-trans- 156-60-5 ND ND ND 0.20 JToluene 108-88-3 ND ND ND 0.21 JAcetone 67-64-1 5.57 J ND ND NDToluene 108-88-3 ND ND ND 0.35 J
CMW24 Carbon Disulfide 75-15-0 18.9 7.1 6.4 51CMW25 Carbon Disulfide 75-15-0 1.91 ND ND 0.71 JKMW10 Toluene 108-88-3 ND ND ND 0.55 J
April 2011 October 2011 April 2012
OB/OD Area Wells
CMW14
CMW22
CMW23
ANALYTICAL METHOD 8260 (Results in ug/L)
Well ID Analyte CASNR
October 2010
KMW11 Tetrachloroethylene 127-18-4 1.73 2.5 1.4 1.7Carbon Disulfide 75-15-0 0.520 J ND ND NDToluene 108-88-3 1.17 J ND ND 5.4
MW01 Dichloroethane, 1,2- 107-06-2 1.61 J 0.46 J 1.6 1.5Acetone 67-64-1 ND ND ND 3.8 JBenzene 71-43-2 ND ND 0.71 J NDCarbon Disulfide 75-15-0 ND ND 3.2 NDDichloroethane, 1,2- 107-06-2 97.1 J 110 87 110Dichloroethane, 1,2- 107-06-2 11.6 J 8.9 9.6 9.0Acetone 67-64-1 ND ND ND 5.7
MW22D Dichloroethane, 1,2- 107-06-2 ND ND ND 1.2
Northern Area Alluvial Wells
MW18D
MW20
KMW12
Table 5-11: October 2010 - April 2012 Volatile Organic Compounds Detected
1 of 3April 2012 FWDA Groundwater PMR
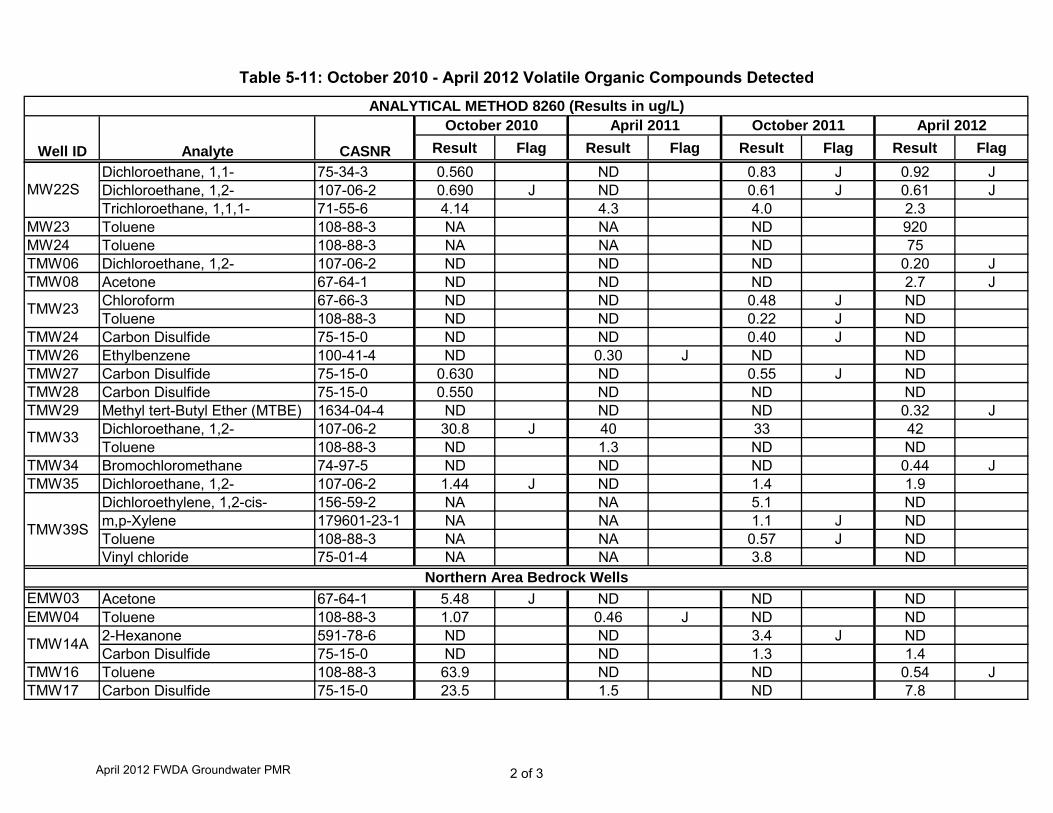
Result Flag Result Flag Result Flag Result Flag
April 2011 October 2011 April 2012ANALYTICAL METHOD 8260 (Results in ug/L)
Well ID Analyte CASNR
October 2010
Dichloroethane, 1,1- 75-34-3 0.560 ND 0.83 J 0.92 JDichloroethane, 1,2- 107-06-2 0.690 J ND 0.61 J 0.61 JTrichloroethane, 1,1,1- 71-55-6 4.14 4.3 4.0 2.3
MW23 Toluene 108-88-3 NA NA ND 920MW24 Toluene 108-88-3 NA NA ND 75TMW06 Dichloroethane, 1,2- 107-06-2 ND ND ND 0.20 JTMW08 Acetone 67-64-1 ND ND ND 2.7 J
Chloroform 67-66-3 ND ND 0.48 J NDToluene 108-88-3 ND ND 0.22 J ND
TMW24 Carbon Disulfide 75-15-0 ND ND 0.40 J NDTMW26 Ethylbenzene 100-41-4 ND 0.30 J ND NDTMW27 Carbon Disulfide 75-15-0 0.630 ND 0.55 J NDTMW28 Carbon Disulfide 75-15-0 0.550 ND ND NDTMW29 Methyl tert-Butyl Ether (MTBE) 1634-04-4 ND ND ND 0.32 J
Dichloroethane, 1,2- 107-06-2 30.8 J 40 33 42Toluene 108-88-3 ND 1.3 ND ND
TMW34 Bromochloromethane 74-97-5 ND ND ND 0.44 J
MW22S
TMW23
TMW33
TMW35 Dichloroethane, 1,2- 107-06-2 1.44 J ND 1.4 1.9Dichloroethylene, 1,2-cis- 156-59-2 NA NA 5.1 NDm,p-Xylene 179601-23-1 NA NA 1.1 J NDToluene 108-88-3 NA NA 0.57 J NDVinyl chloride 75-01-4 NA NA 3.8 ND
EMW03 Acetone 67-64-1 5.48 J ND ND NDEMW04 Toluene 108-88-3 1.07 0.46 J ND ND
2-Hexanone 591-78-6 ND ND 3.4 J NDCarbon Disulfide 75-15-0 ND ND 1.3 1.4
TMW16 Toluene 108-88-3 63.9 ND ND 0.54 JTMW17 Carbon Disulfide 75-15-0 23.5 1.5 ND 7.8
Northern Area Bedrock Wells
TMW39S
TMW14A
Table 5-11: October 2010 - April 2012 Volatile Organic Compounds Detected
2 of 3April 2012 FWDA Groundwater PMR
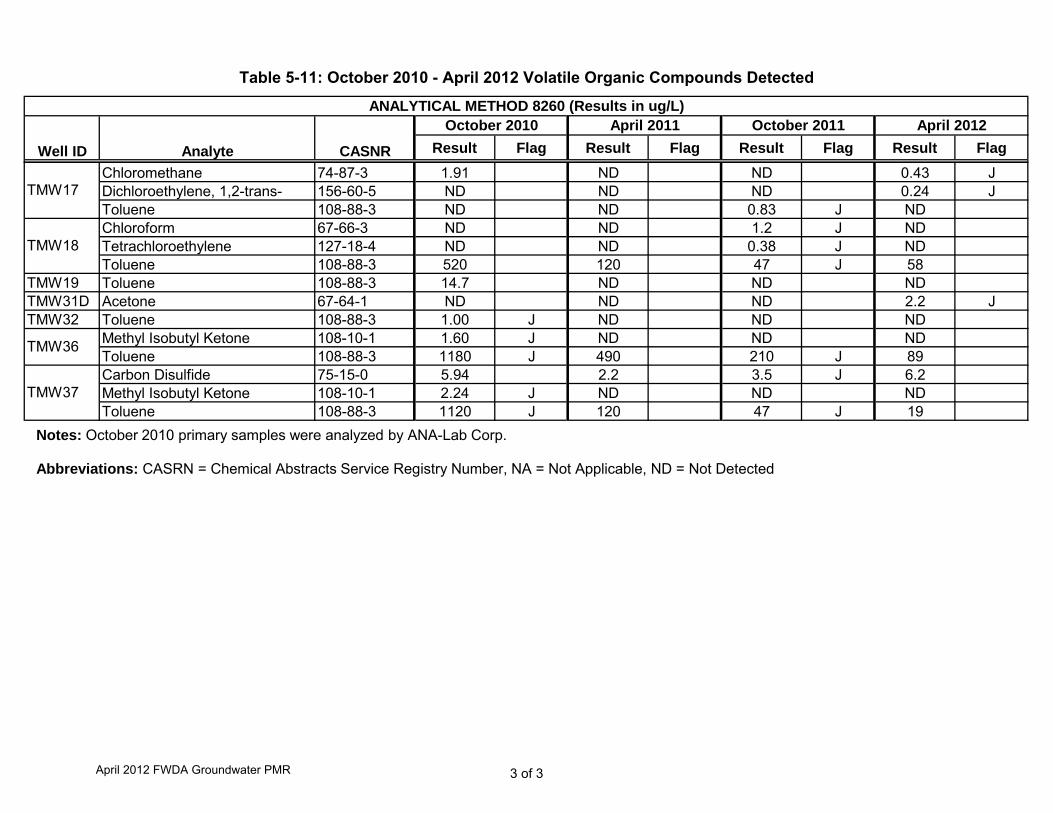
Result Flag Result Flag Result Flag Result Flag
April 2011 October 2011 April 2012ANALYTICAL METHOD 8260 (Results in ug/L)
Well ID Analyte CASNR
October 2010
Chloromethane 74-87-3 1.91 ND ND 0.43 JDichloroethylene, 1,2-trans- 156-60-5 ND ND ND 0.24 JToluene 108-88-3 ND ND 0.83 J NDChloroform 67-66-3 ND ND 1.2 J NDTetrachloroethylene 127-18-4 ND ND 0.38 J NDToluene 108-88-3 520 120 47 J 58
TMW19 Toluene 108-88-3 14.7 ND ND NDTMW31D Acetone 67-64-1 ND ND ND 2.2 JTMW32 Toluene 108-88-3 1.00 J ND ND ND
Methyl Isobutyl Ketone 108-10-1 1.60 J ND ND NDToluene 108-88-3 1180 J 490 210 J 89Carbon Disulfide 75-15-0 5.94 2.2 3.5 J 6.2Methyl Isobutyl Ketone 108-10-1 2.24 J ND ND NDToluene 108-88-3 1120 J 120 47 J 19
TMW17
TMW18
TMW36
TMW37
Notes: October 2010 primary samples were analyzed by ANA-Lab Corp.
Abbreviations: CASRN = Chemical Abstracts Service Registry Number, NA = Not Applicable, ND = Not Detectedg y pp
Table 5-11: October 2010 - April 2012 Volatile Organic Compounds Detected
3 of 3April 2012 FWDA Groundwater PMR
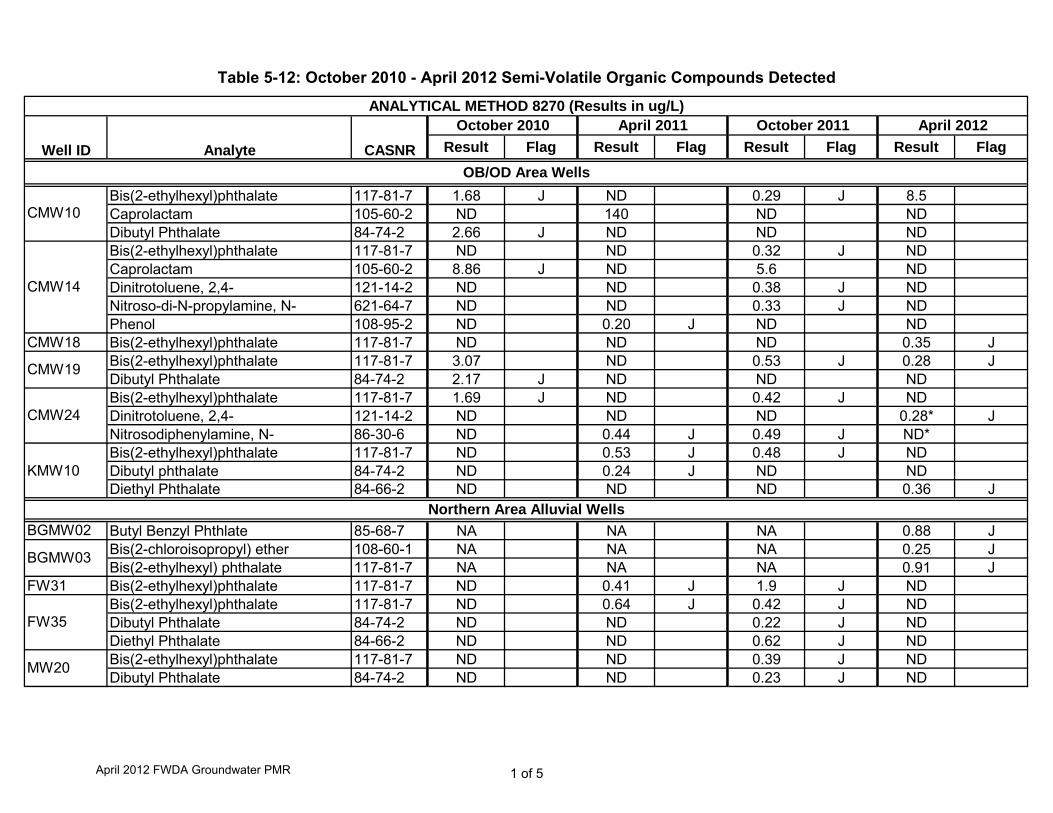
Result Flag Result Flag Result Flag Result Flag
Bis(2-ethylhexyl)phthalate 117-81-7 1.68 J ND 0.29 J 8.5Caprolactam 105-60-2 ND 140 ND NDDibutyl Phthalate 84-74-2 2.66 J ND ND NDBis(2-ethylhexyl)phthalate 117-81-7 ND ND 0.32 J NDCaprolactam 105-60-2 8.86 J ND 5.6 NDDinitrotoluene, 2,4- 121-14-2 ND ND 0.38 J NDNitroso-di-N-propylamine, N- 621-64-7 ND ND 0.33 J NDPhenol 108-95-2 ND 0.20 J ND ND
CMW18 Bis(2-ethylhexyl)phthalate 117-81-7 ND ND ND 0.35 JBis(2-ethylhexyl)phthalate 117-81-7 3.07 ND 0.53 J 0.28 JDibutyl Phthalate 84-74-2 2.17 J ND ND NDBis(2-ethylhexyl)phthalate 117-81-7 1.69 J ND 0.42 J NDDinitrotoluene, 2,4- 121-14-2 ND ND ND 0.28* JNitrosodiphenylamine, N- 86-30-6 ND 0.44 J 0.49 J ND*Bis(2-ethylhexyl)phthalate 117-81-7 ND 0.53 J 0.48 J NDDibutyl phthalate 84-74-2 ND 0.24 J ND ND
October 2011April 2011October 2010
CASNRAnalyte
ANALYTICAL METHOD 8270 (Results in ug/L)
Well ID
OB/OD Area Wells
CMW10
CMW14
CMW19
CMW24
KMW10
April 2012
bu y p a a e 8 0 JDiethyl Phthalate 84-66-2 ND ND ND 0.36 J
BGMW02 Butyl Benzyl Phthlate 85-68-7 NA NA NA 0.88 JBis(2-chloroisopropyl) ether 108-60-1 NA NA NA 0.25 JBis(2-ethylhexyl) phthalate 117-81-7 NA NA NA 0.91 J
FW31 Bis(2-ethylhexyl)phthalate 117-81-7 ND 0.41 J 1.9 J NDBis(2-ethylhexyl)phthalate 117-81-7 ND 0.64 J 0.42 J NDDibutyl Phthalate 84-74-2 ND ND 0.22 J NDDiethyl Phthalate 84-66-2 ND ND 0.62 J NDBis(2-ethylhexyl)phthalate 117-81-7 ND ND 0.39 J NDDibutyl Phthalate 84-74-2 ND ND 0.23 J ND
BGMW03
Northern Area Alluvial Wells
FW35
MW20
Table 5-12: October 2010 - April 2012 Semi-Volatile Organic Compounds Detected
1 of 5April 2012 FWDA Groundwater PMR
Result Flag Result Flag Result Flag Result Flag
October 2011April 2011October 2010
CASNRAnalyte
ANALYTICAL METHOD 8270 (Results in ug/L)
Well ID
April 2012
Bis(2-chloro-1-methylethyl) ether 108-60-1 ND ND 0.28 J NDBis(2-ethylhexyl)phthalate 117-81-7 2.25 J ND ND NDNitroso-di-N-propylamine, N- 621-64-7 ND ND 0.31 J NDBis(2-ethylhexyl)phthalate 117-81-7 ND ND 0.29 J 1.2 JDibutyl Phthalate 84-74-2 ND ND 0.24 J 0.26 Jm,p-Cresol MEPH34 NA NA ND 2.5 JPhenol 108-95-2 NA NA ND 23
SMW01 Diethyl Phthalate 84-66-2 ND ND ND 0.20 JDinitrophenol, 2,4- 51-28-5 45.2 9.6 J 37 19**Dinitrotoluene, 2,4- 121-14-2 ND 0.41 J 0.96 J 0.32** JPhenol 108-95-2 1.26 J ND ND ND**Nitrosodiphenylamine, N- 86-30-6 ND ND ND 0.67** J2-Nitroaniline 88-74-4 ND 0.30 J 0.32 J 0.29 JDinitrotoluene, 2,4- 121-14-2 ND 1.8 J ND 0.62 JDinitrotoluene, 2,6- 606-20-2 ND ND 0.29 J NDPhenol 108-95-2 1.14 J ND ND NDCresol, o- 95-48-7 3.01 J ND ND ND
MW23
TMW03
TMW04
TMW06
MW22D
MW22S
Dinitrotoluene, 2,4- 121-14-2 ND ND 0.28 J NDBis(2-ethylhexyl)phthalate 117-81-7 ND 6.2 J 0.64 J NDDibutyl Phthalate 84-74-2 ND ND 0.24 J NDDiethyl Phthalate 84-66-2 ND ND ND 0.17 JDi-n-octyl phthalate 117-84-0 ND 0.82 J ND NDNitrosodiphenylamine, N- 86-30-6 ND ND ND 0.18 JBis(2-ethylhexyl)phthalate 117-81-7 1.51 J ND ND 0.30 JDibutyl Phthalate 84-74-2 2.42 J ND ND NDDiethyl Phthalate 84-66-2 ND ND 0.23 J ND
TMW22 Bis(2-ethylhexyl)phthalate 117-81-7 ND ND 0.85 J 1.3 JBis(2-ethylhexyl)phthalate 117-81-7 ND ND 0.066 J NDDiethyl Phthalate 84-66-2 ND ND 0.026 J 0.31 J
TMW06
TMW07
TMW15
TMW31S
Table 5-12: October 2010 - April 2012 Semi-Volatile Organic Compounds Detected
2 of 5April 2012 FWDA Groundwater PMR
Result Flag Result Flag Result Flag Result Flag
October 2011April 2011October 2010
CASNRAnalyte
ANALYTICAL METHOD 8270 (Results in ug/L)
Well ID
April 2012
Bis(2-ethylhexyl)phthalate 117-81-7 ND ND 1.4 J 3.6 JDibutyl Phthalate 84-74-2 ND ND 0.22 J NDDiethyl phthalate 84-66-2 ND 0.41 J ND NDBis(2-ethylhexyl)phthalate 117-81-7 ND ND 0.31 J NDDimethyl phthalate 131-11-3 ND 0.27 J ND NDPhenol 108-95-2 ND ND 0.31 J NDBis(2-ethylhexyl)phthalate 117-81-7 NA NA 6.5 NDCaprolactam 105-60-2 NA NA 46 NDDiethyl Phthalate 84-66-2 NA NA ND 0.40 JPhenol 108-95-2 NA NA 0.21 J NDBis(2-ethylhexyl)phthalate 117-81-7 NA NA 0.65 J NDCresol, o- 95-48-7 NA NA ND 2.3 Jm,p-Cresol MEPH34 NA NA ND 0.52 J
TMW43 Bis(2-ethylhexyl) phthalate 117-81-7 NA NA ND 0.53 JTMW44 Bis(2-ethylhexyl)phthalate 117-81-7 NA NA ND 3.2 JTMW45 Bis(2-ethylhexyl) phthalate 117-81-7 NA NA ND 1.5 J
Northern Area Bedrock Wells
TMW33
TMW35
TMW39S
TMW41
Bis(2-ethylhexyl)phthalate 117-81-7 2.26 J ND 0.28 J 0.45 JDiethyl Phthalate 84-66-2 ND ND 0.28 J NDBis(2-ethylhexyl)phthalate 117-81-7 ND ND ND 0.33 JDimethyl phthalate 131-11-3 ND 0.22 J ND ND
EMW03 Phenol 108-95-2 1.18 J ND ND NDBis(2-chloro-1-methylethyl) ether 108-60-1 ND ND 9.3 NDBis(2-ethylhexyl)phthalate 117-81-7 2.18 J ND 0.48 J NDCresol, o- 95-48-7 ND ND 1.2 J ND
TMW14A Bis(2-ethylhexyl)phthalate 117-81-7 2.38 J ND 8.5 NDBis(2-ethylhexyl)phthalate 117-81-7 ND ND 0.74 J 0.40 JDibutyl Phthalate 84-74-2 ND ND 0.26 J ND
EMW04
TMW16
EMW02
EMW01
Table 5-12: October 2010 - April 2012 Semi-Volatile Organic Compounds Detected
3 of 5April 2012 FWDA Groundwater PMR
Result Flag Result Flag Result Flag Result Flag
October 2011April 2011October 2010
CASNRAnalyte
ANALYTICAL METHOD 8270 (Results in ug/L)
Well ID
April 2012
Acetophenone 98-86-2 10.5 ND 5.1 NDBis(2-ethylhexyl)phthalate 117-81-7 3.10 J ND 1.7 J 3.9 JDiethyl Phthalate 84-66-2 ND ND 0.30 J NDNitroso-di-N-propylamine, N- 621-64-7 ND ND 1.1 J ND2,6-Dinitrotoluene 606-20-2 ND 0.39 J ND NDBis(2-ethylhexyl)phthalate 117-81-7 ND 21 J 1.8 J 13 JDibutyl Phthalate 84-74-2 ND ND 0.32 J NDDiethyl Phthalate 84-66-2 ND ND 0.30 J ND
TMW30 Bis(2-ethylhexyl)phthalate 117-81-7 3.96 J ND 0.32 J NDBis(2-ethylhexyl)phthalate 117-81-7 ND ND ND 0.27 JDimethyl phthalate 131-11-3 ND 0.23 J ND NDBis(2-ethylhexyl)phthalate 117-81-7 1.58 J ND ND NDDibutyl Phthalate 84-74-2 3.16 J ND ND NDDimethyl phthalate 131-11-3 ND 0.25 J ND NDPhenol 108-95-2 2.85 J ND ND NDBis(2-ethylhexyl)phthalate 117-81-7 1.57 J ND 0.64 J NDCresol, o- 95-48-7 1.84 J 0.58 J 1.3 J ND
TMW18
TMW19
TMW31D
TMW32
Dibutyl Phthalate 84-74-2 3.62 J ND ND NDDiethyl Phthalate 84-66-2 ND ND 0.27 J NDIsophorone 78-59-1 1.20 J ND ND NDM,P-CRESOL MEPH34 1.69 J ND ND NDPhenol 108-95-2 11.8 ND ND ND2-Methylphenol 95-48-7 ND 5.6 3.7 J NDBis(2-ethylhexyl)phthalate 117-81-7 ND ND 3.6 J NDCresol, o- 95-48-7 ND 5.6 3.7 J NDm,p-Cresol MEPH34 ND 9.6 J ND NDPhenol 108-95-2 1.16 J 0.29 J ND NDBis(2-ethylhexyl)phthalate 117-81-7 NA NA 1.3 J NDCresol, o- 95-48-7 NA NA 0.52 J NDDiethyl Phthalate 84-66-2 NA NA ND 0.41 J
TMW38
TMW36
TMW37
Table 5-12: October 2010 - April 2012 Semi-Volatile Organic Compounds Detected
4 of 5April 2012 FWDA Groundwater PMR
Result Flag Result Flag Result Flag Result Flag
October 2011April 2011October 2010
CASNRAnalyte
ANALYTICAL METHOD 8270 (Results in ug/L)
Well ID
April 2012
TMW38 Dinitrotoluene, 2,6- 606-20-2 NA NA ND 1.7 JTMW39D Diethyl Phthalate 84-66-2 NA NA ND 0.31 JTMW48 Bis(2-ethylhexyl)phthalate 117-81-7 NA NA 0.32 J ND
Bis(2-ethylhexyl)phthalate 117-81-7 NA NA 3.0 J NDCresol, o- 95-48-7 NA NA 0.69 J NDDiethyl Phthalate 84-66-2 NA NA 0.76 J ND
TMW49
Notes: *The sample bottles for CMW24 and TMW03 were accidentally switched in the laboratory. Thus, CMW24's results were reported by the laboratory under the wrong well identification (TMW03). The results shown in the table above are the correct results for CMW24. See Section 5.6.5.**The sample bottles for CMW24 and TMW03 were accidentally switched in the laboratory. Thus, TMW03's results were reported by the laboratory under the wrong well identification (CMW24). The results shown in the table above are the correct results for TMW03. See Section 5.6.5.October 2010 primary samples were analyzed by ANA-Lab Corp.
Abbreviations: CASRN = Chemical Abstracts Service Registry Number, NA = Not Applicable, ND = Not Detected
Table 5-12: October 2010 - April 2012 Semi-Volatile Organic Compounds Detected
5 of 5April 2012 FWDA Groundwater PMR
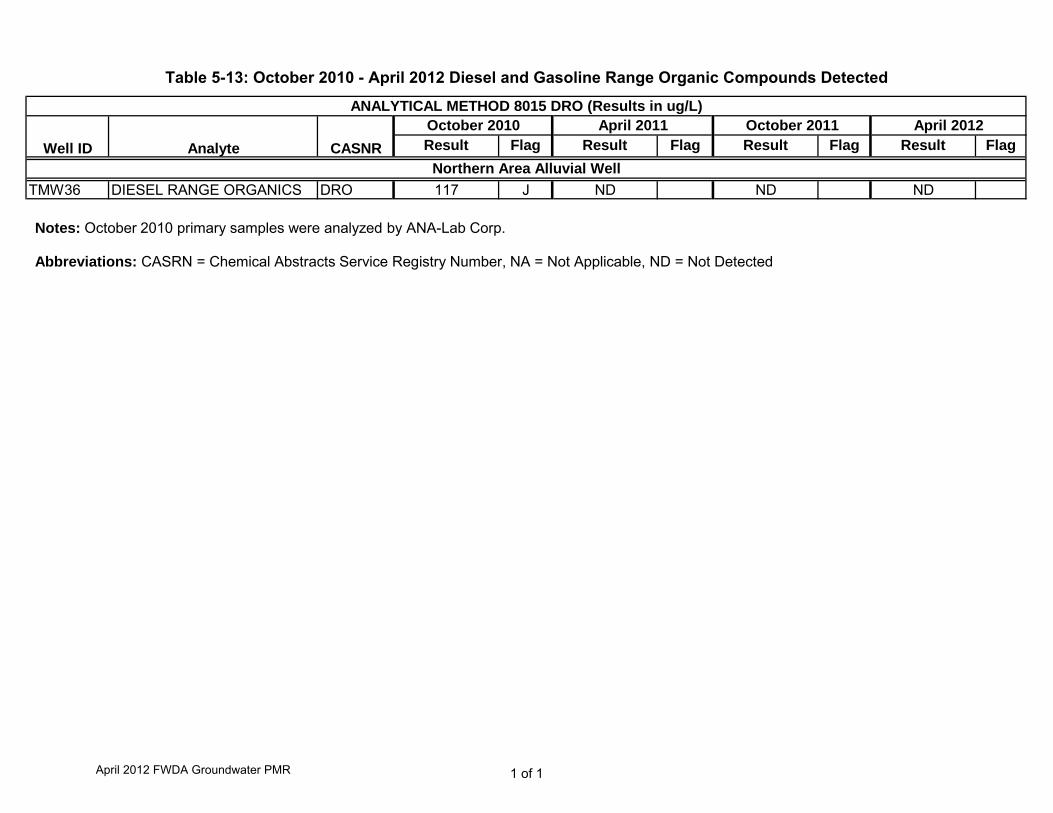
Result Flag Result Flag Result Flag Result Flag
TMW36 DIESEL RANGE ORGANICS DRO 117 J ND ND ND
ANALYTICAL METHOD 8015 DRO (Results in ug/L)April 2012
Northern Area Alluvial WellWell ID Analyte CASNR
October 2010 April 2011 October 2011
Notes: October 2010 primary samples were analyzed by ANA-Lab Corp.
Abbreviations: CASRN = Chemical Abstracts Service Registry Number, NA = Not Applicable, ND = Not Detected
Table 5-13: October 2010 - April 2012 Diesel and Gasoline Range Organic Compounds Detected
1 of 1April 2012 FWDA Groundwater PMR
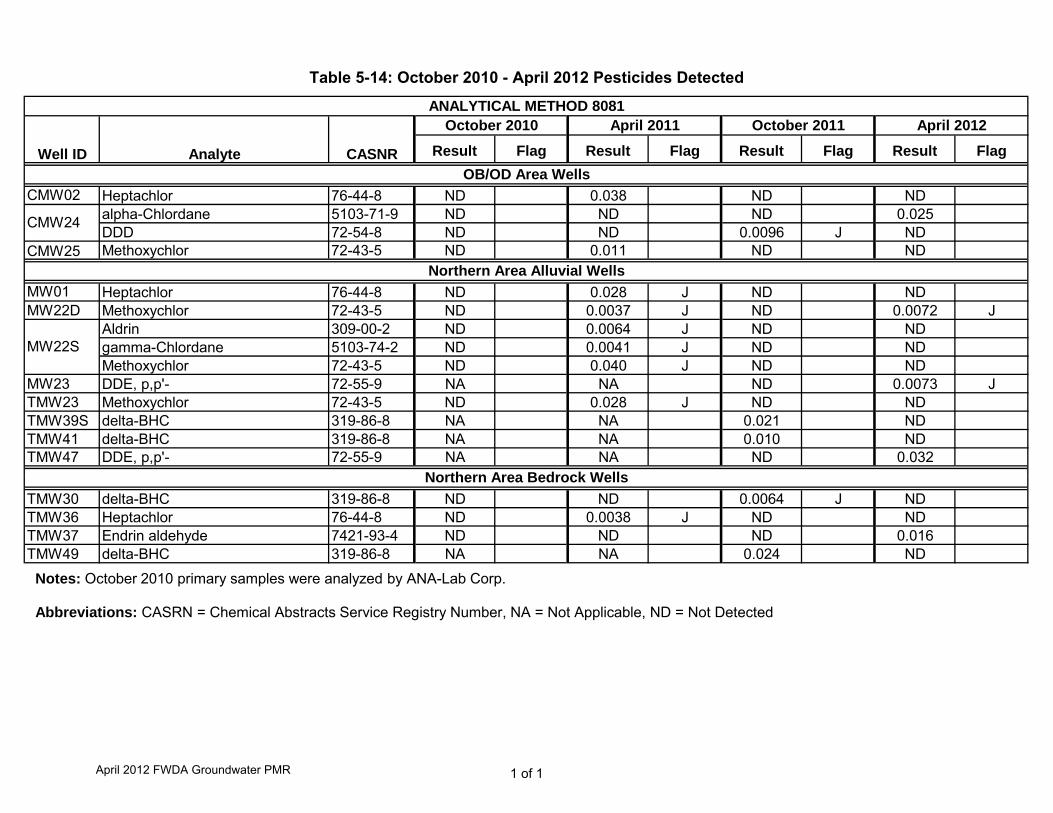
Result Flag Result Flag Result Flag Result Flag
CMW02 Heptachlor 76-44-8 ND 0.038 ND NDalpha-Chlordane 5103-71-9 ND ND ND 0.025DDD 72-54-8 ND ND 0.0096 J ND
CMW25 Methoxychlor 72-43-5 ND 0.011 ND ND
MW01 Heptachlor 76-44-8 ND 0.028 J ND NDMW22D Methoxychlor 72-43-5 ND 0.0037 J ND 0.0072 J
Aldrin 309-00-2 ND 0.0064 J ND NDgamma-Chlordane 5103-74-2 ND 0.0041 J ND NDMethoxychlor 72-43-5 ND 0.040 J ND ND
MW23 DDE, p,p'- 72-55-9 NA NA ND 0.0073 JTMW23 Methoxychlor 72-43-5 ND 0.028 J ND NDTMW39S delta-BHC 319-86-8 NA NA 0.021 NDTMW41 delta-BHC 319-86-8 NA NA 0.010 NDTMW47 DDE, p,p'- 72-55-9 NA NA ND 0.032
Northern Area Alluvial Wells
CMW24
MW22S
Northern Area Bedrock Wells
ANALYTICAL METHOD 8081
Well ID Analyte CASNR
October 2010 April 2011 October 2011 April 2012
OB/OD Area Wells
TMW30 delta-BHC 319-86-8 ND ND 0.0064 J NDTMW36 Heptachlor 76-44-8 ND 0.0038 J ND NDTMW37 Endrin aldehyde 7421-93-4 ND ND ND 0.016TMW49 delta-BHC 319-86-8 NA NA 0.024 ND
Northern Area Bedrock Wells
Notes: October 2010 primary samples were analyzed by ANA-Lab Corp.
Abbreviations: CASRN = Chemical Abstracts Service Registry Number, NA = Not Applicable, ND = Not Detected
Table 5-14: October 2010 - April 2012 Pesticides Detected
1 of 1April 2012 FWDA Groundwater PMR
FIGURES
SECTION 1 FIGURES
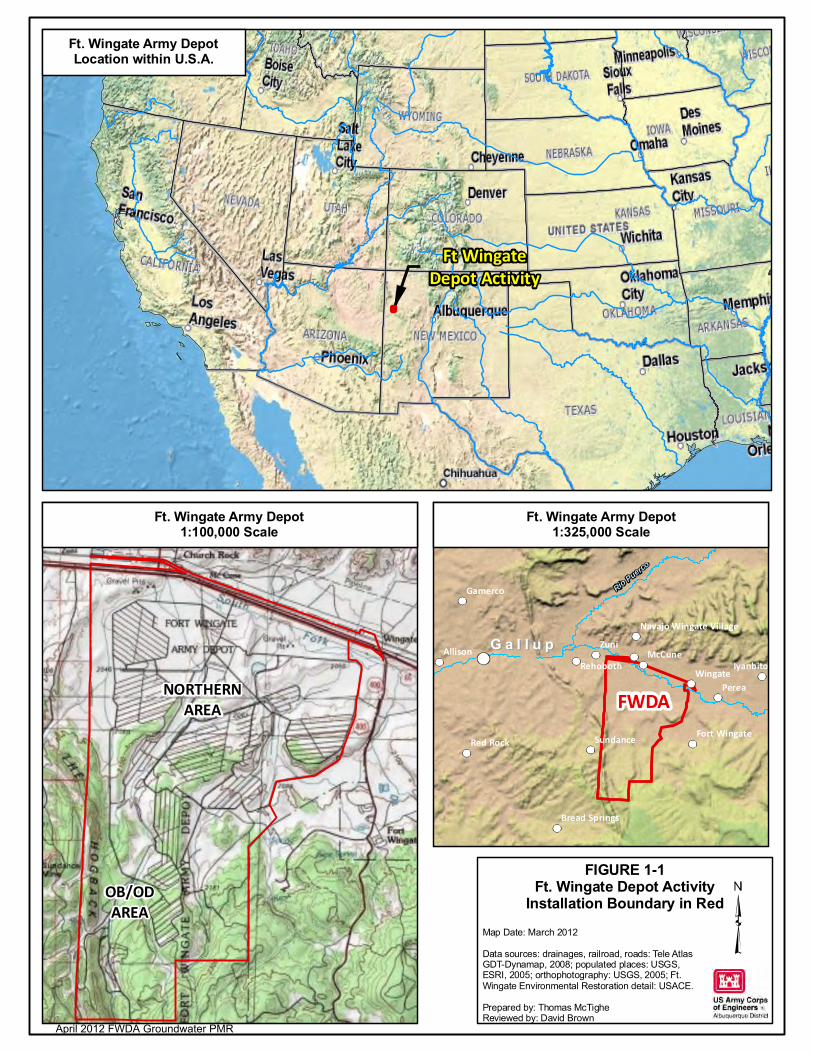
NORTHERNAREA
OB/ODAREA
Ft WingateDepot Activity
Rio Puerco
FWDA
G a l l u pG a l l u p Zuni
Perea
McCuneWingate
Gamerco
Allison
Sundance
Rehoboth
Red Rock
Iyanbito
Yah-ta-hey
Fort Wingate
Bread Springs
Navajo Wingate Village
Map Date: March 2012
Data sources: drainages, railroad, roads: Tele Atlas GDT-Dynamap, 2008; populated places: USGS, ESRI, 2005; orthophotography: USGS, 2005; Ft. Wingate Environmental Restoration detail: USACE.
Prepared by: Thomas McTigheReviewed by: David Brown
FIGURE 1-1Ft. Wingate Depot Activity
Installation Boundary in Red
Ft. Wingate Army Depot1:325,000 Scale
Ft. Wingate Army DepotLocation within U.S.A.
Ft. Wingate Army Depot1:100,000 Scale
April 2012 FWDA Groundwater PMR
SECTION 2 FIGURES

State Plane Coordinate System, New Mexico West, North American Datum 1983. Units in US Survey Feet North America VerticalDatum (NAVD) 88. Map Scale: 1:20,000 (1" = 1,667')Map Date: September 26,2012Data sources: drainages, railroad, roads: Tele Atlas GDT-Dynamap, 2008; populated places: USGS, ESRI, 2005; orthophotography: USGS, 2005; Ft. Wingate Environmental Restoration detail: USACE.Prepared by: Jonathan Hall - LRLReviewed by: David Henry
Rio Puerco
666 566
400
32
602 564
602
40Albuquerque
Santa Fe
Las Cruces
Santa Rosa
Tucumcari
Rio G
rande New
Mexico
Gallup
Ft. WingateArmy Depot
FIGURE 2-1Ft. Wingate Army Depot
Monitoring Well Locations
Ft. Wingate Army Depot Property Boundary Indicated in Red
QALQAL
QALQALQALQAL
QALQAL
QALQAL
QALQAL
QALQAL
QALQAL
QALQAL
QCLQCL
QCLQCL
QCLQCL
QCLQCL
KCCKCC
KGKG
KGKG
KGKG
KMKM
KMKMKMKM
KMKM
KDKD
KDKD
KDKD
JMJM
JZJZ
JZJZ
JEJE
JEJE
TROTRO
TROTRO
TROTRO
TRPPTRPP
TRPPTRPP
TRPPTRPP
TRPPTRPP
TRPPTRPP
TRPPTRPPTRPPTRPP
TRPPTRPP
TRPPTRPP
TRPPTRPP
TRPSTRPS
TRPSTRPS
TRPSTRPS
TRPSTRPS
TRPBTRPB
TRPBTRPB
TRPBTRPB
TRBTRB
TRBTRB
TRBTRB
TRBTRB
TRMTRM
TRMTRM
QALQAL
QALQAL
QALQAL
QCLQCL
SMW01
PZ05
PZ06 PZ03PZ02PZ01
PZ07PZ08
FW31
BGMW03
BGMW02
BGMW01
TMW02TMW39DTMW39STMW41TMW40D
TMW40S
TMW29TMW38
TMW36TMW04TMW03
TMW48TMW31S
TMW31DTMW01TMW30
TMW49
TMW37
TMW15
TMW14A
TMW17TMW11TMW16
TMW32
TMW13TMW18TMW19TMW21MW18DMW18SMW20TMW25
TMW34TMW33
MW22DMW22STMW10
TMW27PZ10PZ09
Wingate91
MW23MW24
Wingate90Wingate89
TMW26
TWM28
TMW07
TMW06TMW22
TMW23MW03MW01MW02TMW24
TMW35TMW08
EMW01EMW04
EMW03EMW02
FW35
CMW25 FW24
CMW23
CMW22
CMW21
CMW16
CMW24
KMW11KMW10
KMW13KMW09
KMW12CMW19
CMW17
CMW18 CMW14
FW38 CMW10CMW20 CMW07
CMW06
CMW04
CMW02
FW26
PATENTED(PRIVATE)
PATENTED(PRIVATE)
FEDERAL GOVERNMENT INDIAN TRUST LANDS
FEDERAL GOVERNMENTBIA MANAGED
PATENTED(PRIVATE)
FEDERAL GOVERNMENTBLM MANAGED
FEDERAL GOVERNMENTBLM MANAGED
FEDERALGOVERNMENTINDIANTRUSTLANDS
STATE
FEDERAL GOVERNMENTBLM MANAGED
Nutri
a Mon
oclin
e
Nutria Monocline
NORTHERNAREA
WELLS
OB/ODAREA
WELLS
Atchison Topeka Santa Fe Railway
6640
PATENTED(PRIVATE)
South Fork Rio Puerco
Nava
jo Blv
d
20
4B
2
5B5A
4A19
17
23 22
16
15
68
14
12
10A25
FWDA SURFACE GEOLOGYQAL, QUATERNARY ALLUVIAL DEPOSITSQCL, QUATERNARY COLLUVIAL AND GRAVEL DEPOSITSKCC, CREVASSE CANYON FORMATIONKG, GALLUP SANDSTONEKM, MANCOS SHALEKD, DAKOTA SANDSTONEJM, MORRISON FORMATIONJZ, ZUNI SANDSTONEJE, ENTRADA SANDSTONETRO, OWL ROCK FORMATIONTRPP, PETRIFIED FOREST FORMATION - PAINTED DESERT MEMBERTRPS, PETRIFIED FOREST FORMATION - SONSELA SANDSTONE MEMBERTRPB, PETRIFIED FOREST FORMATION - BLUE MESA MEMBERTRB, BLUEWATER CREEK FORMATIONTRM, SHINARUMP FORMATION AND MOENKOPI FORMATION
NORTHERN AREA BEDROCK MONITORING WELLSBURIED MONITORING WELLS
FLOW DIRECTION OF THE SOUTH FORK RIO PUERCOSOLID AND HAZARDOUS WASTE MANAGEMENT UNITSADJOINING PROPERTY BOUNDARYBUILDINGSFWDA PROPERTY BOUNDARY, FEB 2002
TRANSFERRED FWDA PROPERTYPROPERTY TRANSFER PARCEL BOUNDARYRAILROADROADARROYO
PROPERTY TRANSFER PARCEL IDENTIFICATION NUMBER
OB/OD AREA MONITORING WELLS
NORTHERN AREA ALLUVIAL MONITORING WELLSNORTHERN AREA ALLUVIAL NON-MONITORING WELLS
USGS TOPOGRAPHIC CONTOUR (20 FT INTERVAL)
1Miles
1Kilometers
NORTHERN AREA ALLUVIAL PIEZOMETERSNORTHERN AREA ALLUVIAL DRY MONITORING WELLS
April 2012 FWDA Groundwater PMR

SECTION 4 FIGURES

QALQAL
TRPPTRPP
QCLQCL
6700
6680
6660
0
6740
6720
6820
6760
6680
6840
6680
Wingate916645.94
Wingate906643.37
TMW276640.38
SMW016641.35
TMW286670.93
TMW266651.45
TMW106642.86
TMW086643.86
TMW246641.78
MW22D6642.85
MW18D6643.50
MW206642.76
MW026646.28
MW016643.96
MW036643.64
TMW066643.73
TMW256634.04
TMW216644.54
TMW296645.73
TMW226643.16
TMW046644.52
TMW136647.71
TMW016675.16
TMW156649.91
TMW116652.07
Wingate896648.71
MW22S6643.14
TMW236642.30
TMW036645.55
FW356689.66
TMW076643.13
Sout h Fork Rio Puerco
TMW31S6673.35
TMW346641.74
TMW356643.10
TMW336643.32
PZ106638.91
PZ096639.08
PZ056654.75
PZ066658.16
PZ086669.78
PZ076670.81
PZ036653.45
PZ026652.56
PZ016651.14
PZ046649.20
QALQAL
MW246638.25
MW236640.08
TMW40S6646.43 TMW39S
6673.76
TMW416665.20
Nava
jo B
lvd
13
11
7
12
10B
25
6670
6665
6660
6650
6675
6670666
5
66606655
6645
6655
6640
6635 6645
State Plane Coordinate System, New Mexico West, North American Datum 1983. Units in US Survey Feet North America VerticalDatum (NAVD) 88.
Map Scale: 1:6,000 (1" = 500')Map Date: September 26, 2012
Ground water measurements in US feet; Dry, no water in wells; N.M., not measured.
Data sources: drainages, railroad, roads: Tele Atlas GDT-Dynamap, 2008; populated places: USGS, ESRI, 2005; orthophotography: USGS, 2005; Ft. Wingate Environmental Restoration detail: USACE.
Prepared by: Jonathan Hall - LRLReviewed by: David Henry
Rio Puerco
666566
400
32
602564
602
40
FIGURE 4-1January 2012 Northern Area
Alluvial Groundwater Elevation Contour Map
Ft. Wingate Army Depot Property Boundary Indicated in RedNorthern Area Groundwater Map Area in Yellow
NORTHERN AREA ALLUVIAL MONITORING WELLS
NORTHERN AREA ALLUVIAL NON-MONITORING WELLS
NORTHERN AREA ALLUVIAL PIEZOMETERS
NORTHERN AREA BEDROCK MONITORING WELLS
FLOW DIRECTION OF THE SOUTH FORK RIO PUERCO
GROUNDWATER ELEVATION CONTOUR (5 FT INTERVAL)
GROUNDWATER ELEVATION CONTOUR ESTIMATE (5 FT INTERVAL)
BUILDINGS
FWDA PROPERTY BOUNDARY, FEB 2002
PROPERTY TRANSFER PARCEL IDENTIFICATION NUMBER
PROPERTY TRANSFER PARCEL BOUNDARY
RAILROAD
ROAD
ARROYO
USGS TOPOGRAPHIC CONTOUR (20 FT INTERVAL)
QCL, QUATERNARY COLLUVIAL AND GRAVEL DEPOSITS
FWDA SURFACE GEOLOGYQAL, QUATERNARY ALLUVIAL DEPOSITS
TRPP, PETRIFIED FOREST FORMATION - PAINTED DESERT MEMBER
QCL, QUATERNARY COLLUVIAL AND GRAVEL DEPOSITS
0.25Miles
0.25Kilometers
ADMINISTRATION AREA
WORK SHOP AREA
April 2012 FWDA Groundwater PMR
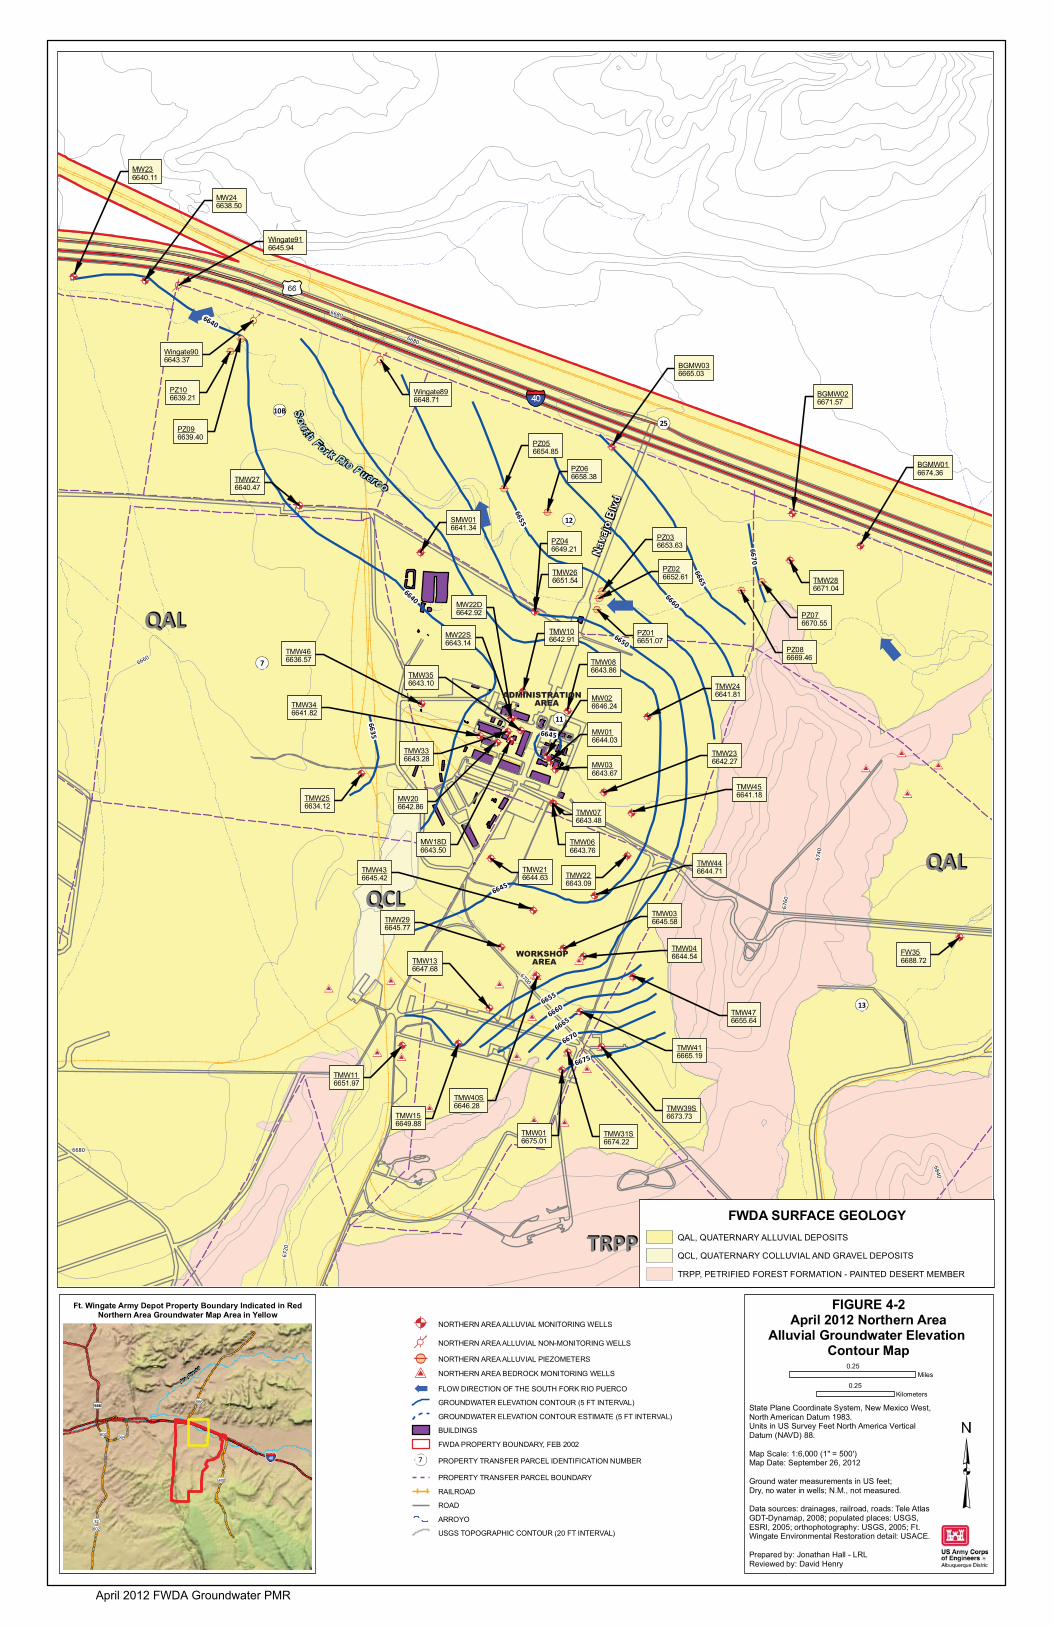
QALQAL
TRPPTRPP
QCLQCL
6700
6680
6660
0
6740
6720
6820
6760
6680
6840
6680
Wingate916645.94
Wingate906643.37
TMW276640.47
SMW016641.34
TMW286671.04
TMW266651.54
TMW106642.91
TMW086643.86
TMW246641.81
MW22D6642.92
MW18D6643.50
MW206642.86
MW026646.24
MW016644.03
MW036643.67
TMW066643.76
TMW256634.12
TMW216644.63
TMW296645.77
TMW226643.09
TMW046644.54TMW13
6647.68
TMW016675.01
TMW156649.88
TMW116651.97
Wingate896648.71
MW22S6643.14
TMW236642.27
TMW036645.58
FW356688.72
TMW076643.48
Sout h Fork Rio Puerco
TMW31S6674.22
TMW346641.82
TMW356643.10
TMW336643.28
PZ106639.21
PZ096639.40
PZ056654.85
PZ066658.38
PZ086669.46
PZ076670.55
PZ036653.63
PZ026652.61
PZ016651.07
PZ046649.21
QALQAL
MW246638.50
MW236640.11
TMW40S6646.28 TMW39S
6673.73
TMW416665.19
BGMW036665.03
BGMW026671.57
BGMW016674.36
TMW466636.57
TMW456641.18
TMW446644.71TMW43
6645.42
TMW476655.64
Nava
jo B
lvd
13
11
7
12
10B25
6670
6665
6660
6650
6675
6670
6665
6660
6655
6645
6655
6640
6635
6640
6645
State Plane Coordinate System, New Mexico West, North American Datum 1983. Units in US Survey Feet North America Vertical Datum (NAVD) 88.
Map Scale: 1:6,000 (1" = 500')Map Date: September 26, 2012
Ground water measurements in US feet; Dry, no water in wells; N.M., not measured.
Data sources: drainages, railroad, roads: Tele Atlas GDT-Dynamap, 2008; populated places: USGS, ESRI, 2005; orthophotography: USGS, 2005; Ft. Wingate Environmental Restoration detail: USACE.
Prepared by: Jonathan Hall - LRLReviewed by: David Henry
Rio Puerco
666566
400
32
602564
602
40
FIGURE 4-2April 2012 Northern Area
Alluvial Groundwater Elevation Contour Map
Ft. Wingate Army Depot Property Boundary Indicated in RedNorthern Area Groundwater Map Area in Yellow
NORTHERN AREA ALLUVIAL MONITORING WELLS
NORTHERN AREA ALLUVIAL NON-MONITORING WELLS
NORTHERN AREA ALLUVIAL PIEZOMETERS
NORTHERN AREA BEDROCK MONITORING WELLS
FLOW DIRECTION OF THE SOUTH FORK RIO PUERCO
GROUNDWATER ELEVATION CONTOUR (5 FT INTERVAL)
GROUNDWATER ELEVATION CONTOUR ESTIMATE (5 FT INTERVAL)
BUILDINGS
FWDA PROPERTY BOUNDARY, FEB 2002
PROPERTY TRANSFER PARCEL IDENTIFICATION NUMBER
PROPERTY TRANSFER PARCEL BOUNDARY
RAILROAD
ROAD
ARROYO
USGS TOPOGRAPHIC CONTOUR (20 FT INTERVAL)
QCL, QUATERNARY COLLUVIAL AND GRAVEL DEPOSITS
FWDA SURFACE GEOLOGYQAL, QUATERNARY ALLUVIAL DEPOSITS
TRPP, PETRIFIED FOREST FORMATION - PAINTED DESERT MEMBER
QCL, QUATERNARY COLLUVIAL AND GRAVEL DEPOSITS
0.25Miles
0.25Kilometers
ADMINISTRATION AREA
WORKSHOP AREA
April 2012 FWDA Groundwater PMR
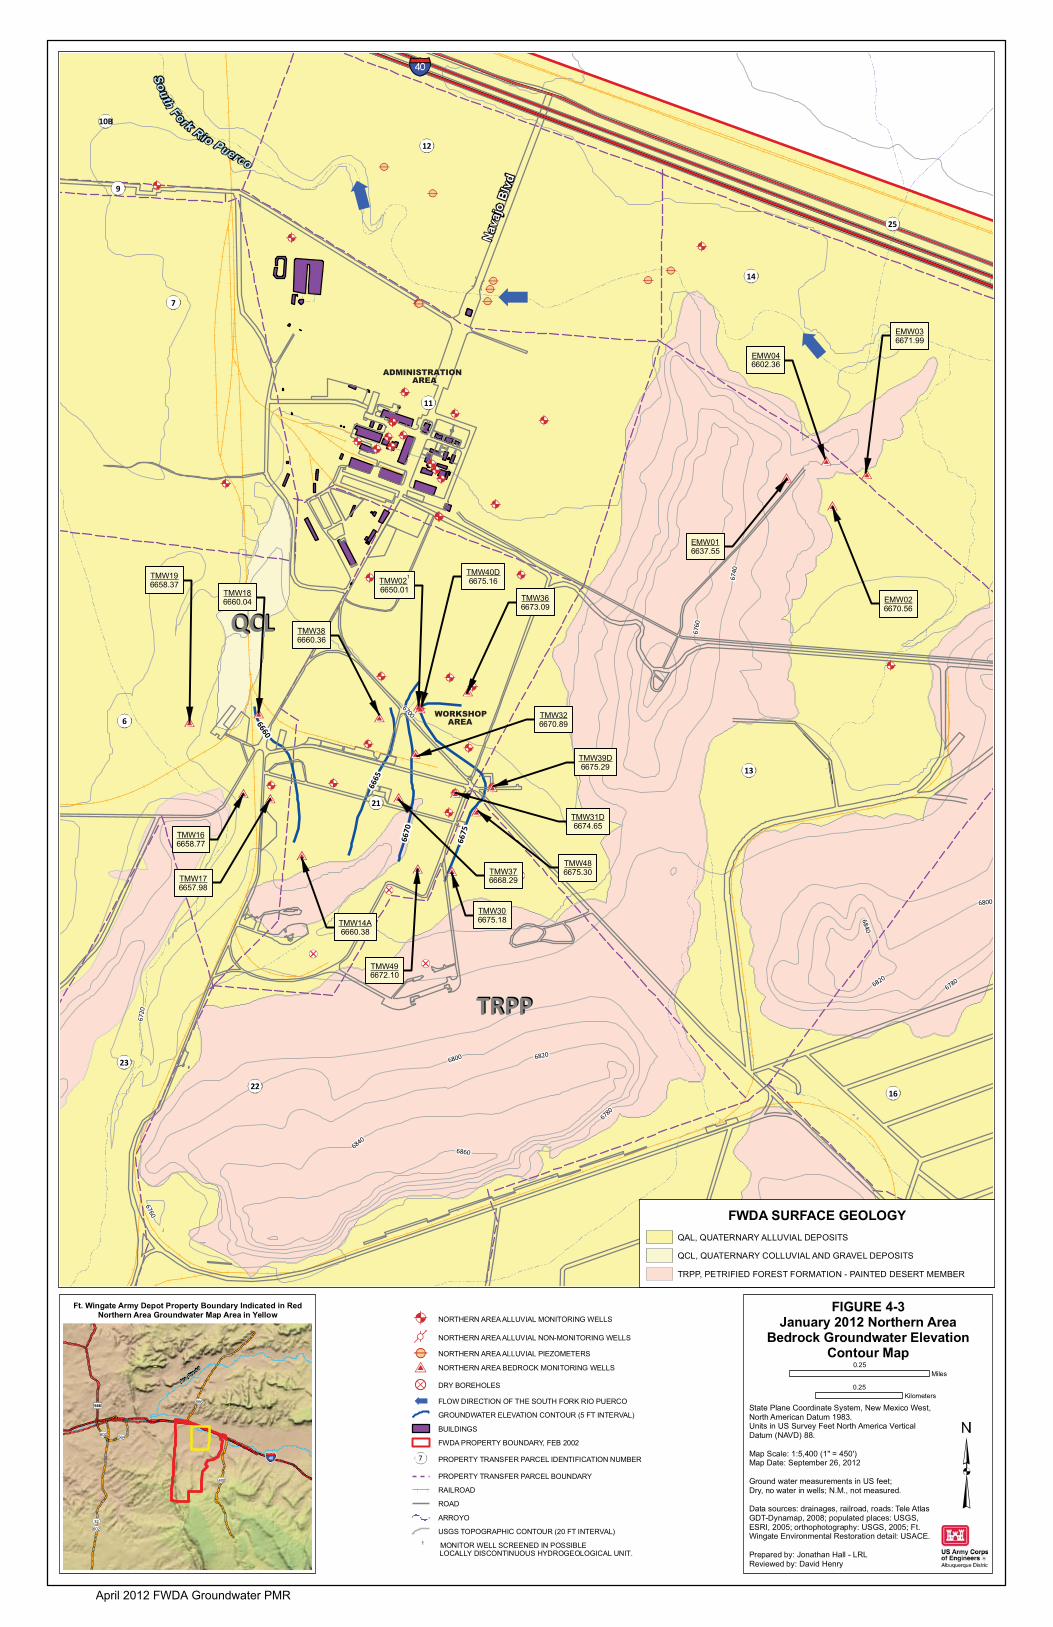
TRPPTRPP
QCLQCL6700
6780
6800
6800
6820
6780
6840
6740
6860
6720
6820
6760
6840
6760South Fork R io Puerco
TMW196658.37
TMW186660.04
TMW021
6650.01
TMW166658.77
TMW176657.98
TMW14A6660.38
TMW326670.89
TMW376668.29
TMW31D6674.65
TMW306675.18
TMW366673.09
EMW016637.55
EMW026670.56
EMW036671.99
EMW046602.36
TMW496672.10
TMW486675.30
TMW39D6675.29
TMW40D6675.16
TMW386660.36
Nava
jo B
lvd
19
23
2216
21
6
13
11
7
14
9
12
10B
25
6660
6665
6670
6675
State Plane Coordinate System, New Mexico West, North American Datum 1983. Units in US Survey Feet North America VerticalDatum (NAVD) 88.
Map Scale: 1:5,400 (1" = 450')Map Date: September 26, 2012
Ground water measurements in US feet; Dry, no water in wells; N.M., not measured.
Data sources: drainages, railroad, roads: Tele Atlas GDT-Dynamap, 2008; populated places: USGS, ESRI, 2005; orthophotography: USGS, 2005; Ft. Wingate Environmental Restoration detail: USACE.
Prepared by: Jonathan Hall - LRLReviewed by: David Henry
Rio Puerco
666566
400
32
602564
602
40
FIGURE 4-3January 2012 Northern Area
Bedrock Groundwater ElevationContour Map
Ft. Wingate Army Depot Property Boundary Indicated in RedNorthern Area Groundwater Map Area in Yellow
FWDA SURFACE GEOLOGYQAL, QUATERNARY ALLUVIAL DEPOSITS
TRPP, PETRIFIED FOREST FORMATION - PAINTED DESERT MEMBER
QCL, QUATERNARY COLLUVIAL AND GRAVEL DEPOSITS
NORTHERN AREA ALLUVIAL MONITORING WELLS
NORTHERN AREA ALLUVIAL NON-MONITORING WELLS
NORTHERN AREA ALLUVIAL PIEZOMETERS
NORTHERN AREA BEDROCK MONITORING WELLS
DRY BOREHOLES
FLOW DIRECTION OF THE SOUTH FORK RIO PUERCO
GROUNDWATER ELEVATION CONTOUR (5 FT INTERVAL)
BUILDINGS
FWDA PROPERTY BOUNDARY, FEB 2002
PROPERTY TRANSFER PARCEL IDENTIFICATION NUMBER
PROPERTY TRANSFER PARCEL BOUNDARY
RAILROAD
ROAD
ARROYO
USGS TOPOGRAPHIC CONTOUR (20 FT INTERVAL)1 MONITOR WELL SCREENED IN POSSIBLE LOCALLY DISCONTINUOUS HYDROGEOLOGICAL UNIT.
0.25Miles
0.25Kilometers
ADMINISTRATION AREA
WORKSHOP AREA
April 2012 FWDA Groundwater PMR
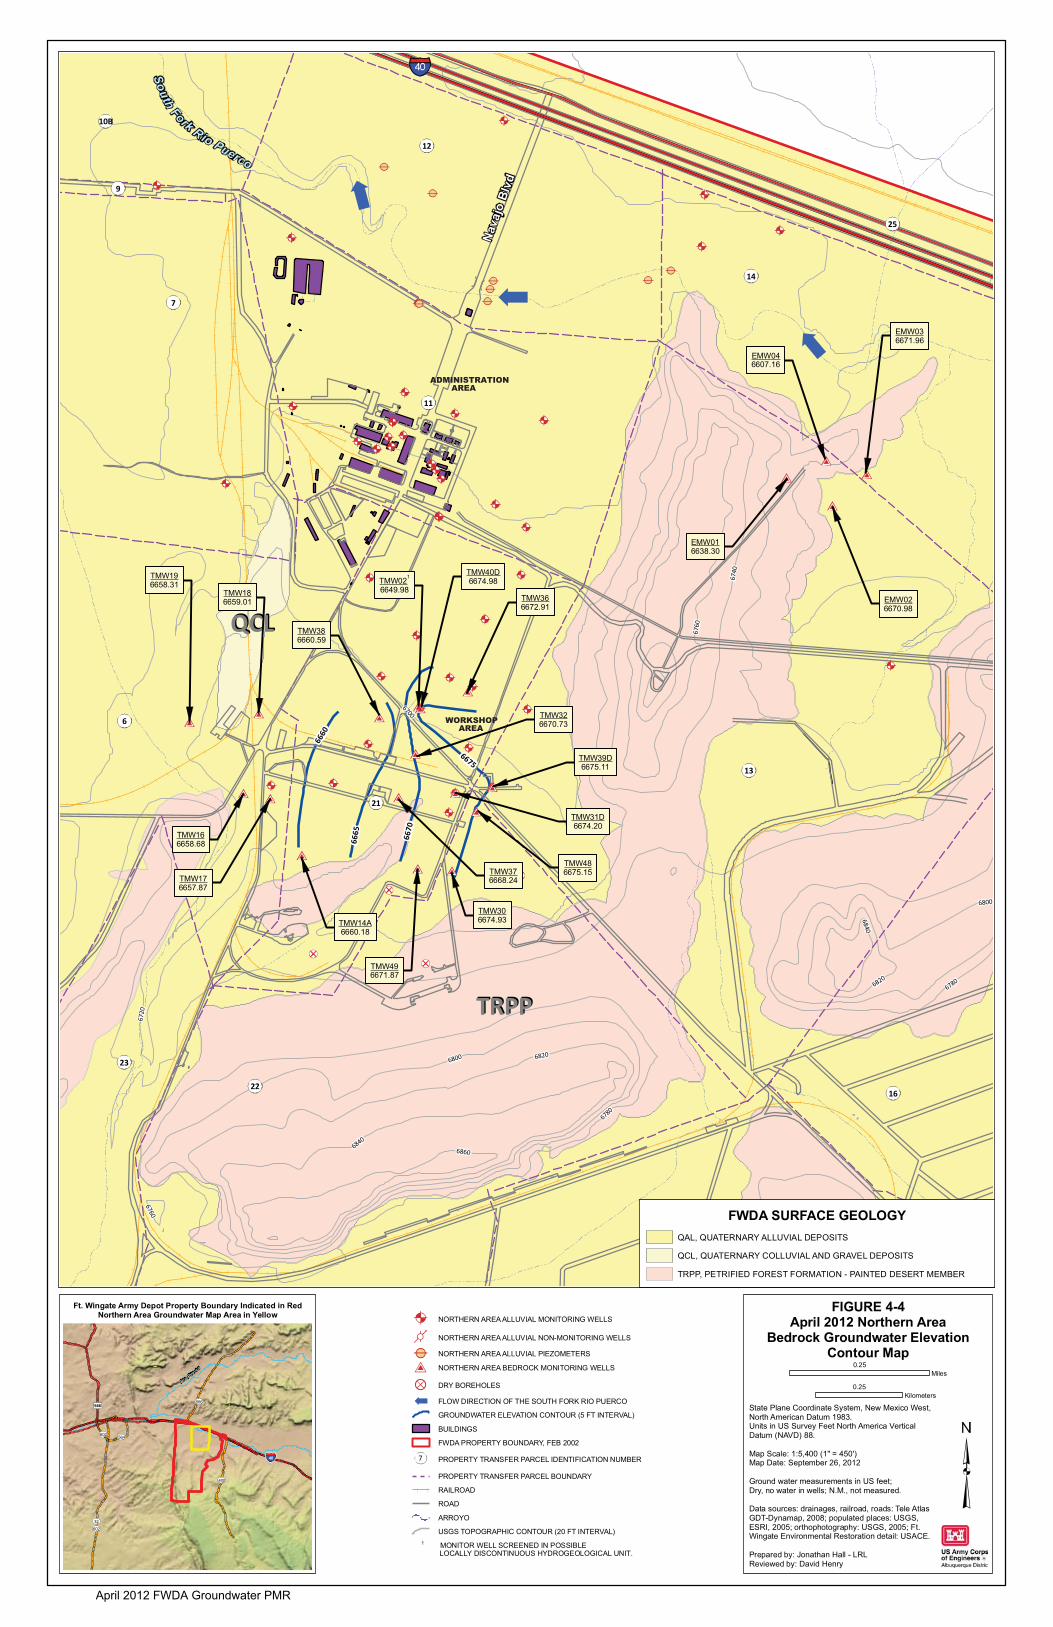
TRPPTRPP
QCLQCL6700
6780
6800
6800
6820
6780
6840
6740
6860
6720
6820
6760
6840
6760South Fork R io Puerco
TMW196658.31
TMW186659.01
TMW021
6649.98
TMW166658.68
TMW176657.87
TMW14A6660.18
TMW326670.73
TMW376668.24
TMW31D6674.20
TMW306674.93
TMW366672.91
EMW016638.30
EMW026670.98
EMW036671.96
EMW046607.16
TMW496671.87
TMW486675.15
TMW39D6675.11
TMW40D6674.98
TMW386660.59
Nava
jo B
lvd
19
23
2216
21
6
13
11
7
14
9
12
10B
25
6660
6665 6670
6675
State Plane Coordinate System, New Mexico West, North American Datum 1983. Units in US Survey Feet North America VerticalDatum (NAVD) 88.
Map Scale: 1:5,400 (1" = 450')Map Date: September 26, 2012
Ground water measurements in US feet; Dry, no water in wells; N.M., not measured.
Data sources: drainages, railroad, roads: Tele Atlas GDT-Dynamap, 2008; populated places: USGS, ESRI, 2005; orthophotography: USGS, 2005; Ft. Wingate Environmental Restoration detail: USACE.
Prepared by: Jonathan Hall - LRLReviewed by: David Henry
Rio Puerco
666566
400
32
602564
602
40
FIGURE 4-4April 2012 Northern Area
Bedrock Groundwater ElevationContour Map
Ft. Wingate Army Depot Property Boundary Indicated in RedNorthern Area Groundwater Map Area in Yellow
FWDA SURFACE GEOLOGYQAL, QUATERNARY ALLUVIAL DEPOSITS
TRPP, PETRIFIED FOREST FORMATION - PAINTED DESERT MEMBER
QCL, QUATERNARY COLLUVIAL AND GRAVEL DEPOSITS
NORTHERN AREA ALLUVIAL MONITORING WELLS
NORTHERN AREA ALLUVIAL NON-MONITORING WELLS
NORTHERN AREA ALLUVIAL PIEZOMETERS
NORTHERN AREA BEDROCK MONITORING WELLS
DRY BOREHOLES
FLOW DIRECTION OF THE SOUTH FORK RIO PUERCO
GROUNDWATER ELEVATION CONTOUR (5 FT INTERVAL)
BUILDINGS
FWDA PROPERTY BOUNDARY, FEB 2002
PROPERTY TRANSFER PARCEL IDENTIFICATION NUMBER
PROPERTY TRANSFER PARCEL BOUNDARY
RAILROAD
ROAD
ARROYO
USGS TOPOGRAPHIC CONTOUR (20 FT INTERVAL)1 MONITOR WELL SCREENED IN POSSIBLE LOCALLY DISCONTINUOUS HYDROGEOLOGICAL UNIT.
0.25Miles
0.25Kilometers
ADMINISTRATION AREA
WORKSHOP AREA
April 2012 FWDA Groundwater PMR
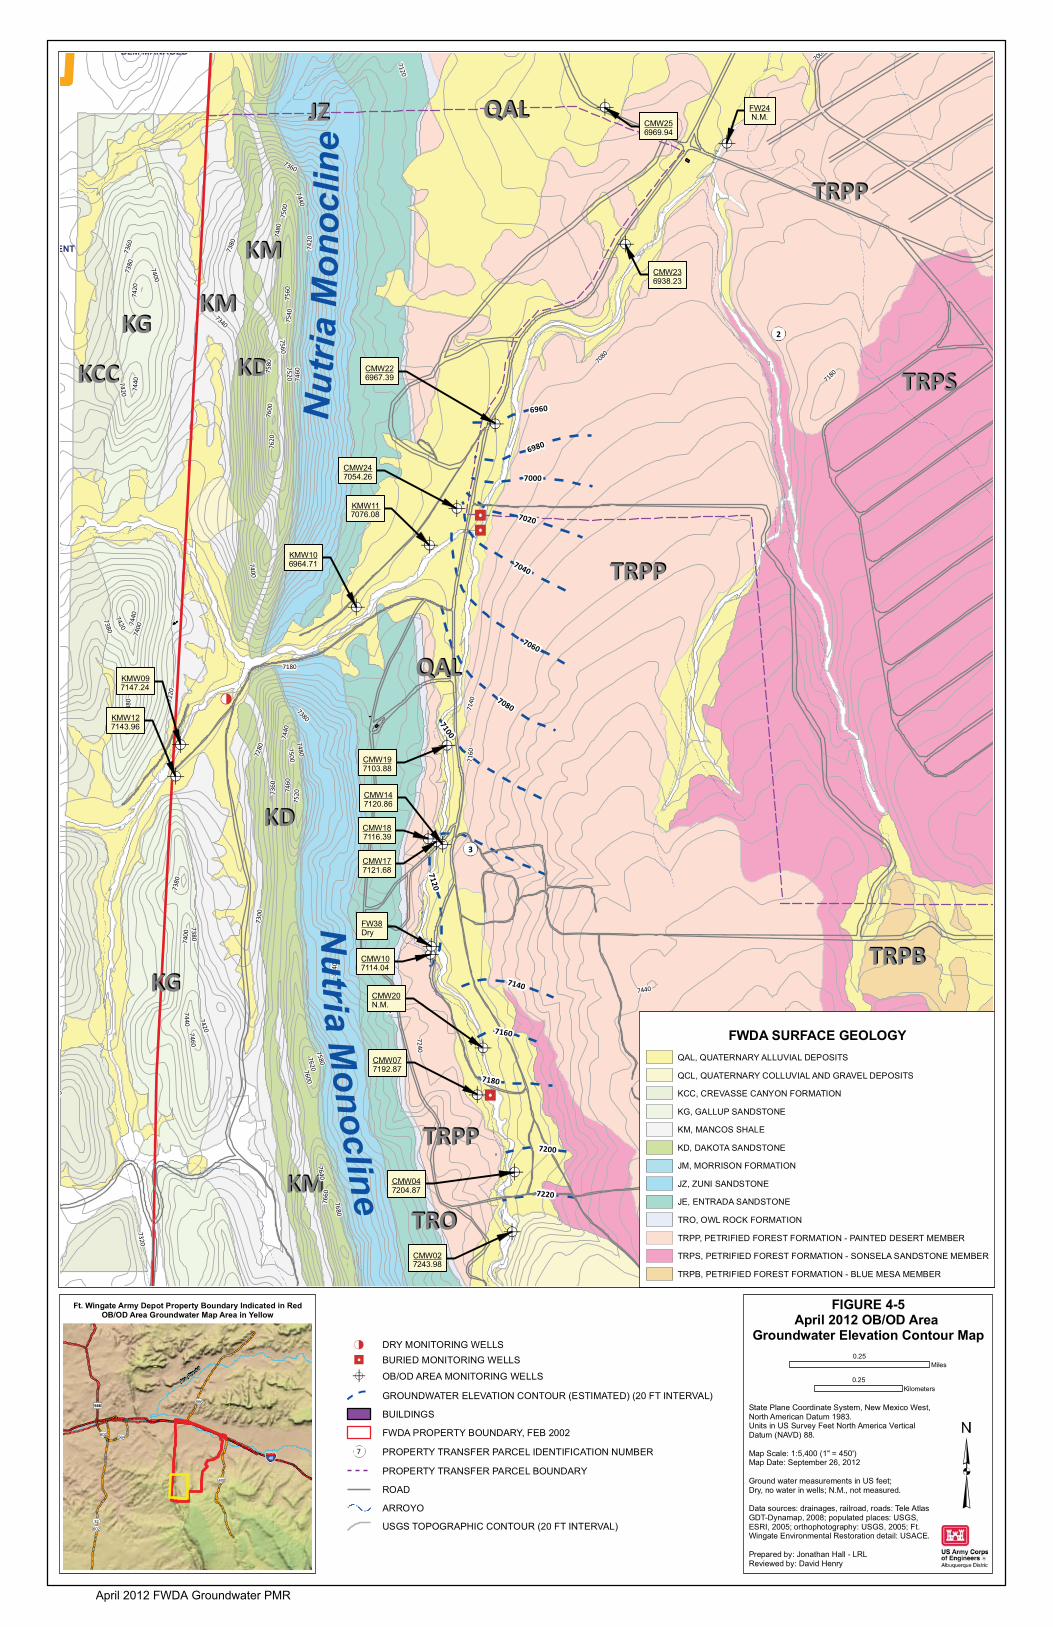
QALQAL
QALQAL
QALQAL
KCCKCC
KGKG
KGKG
KMKM
KMKM
KMKM
KDKD
KDKD
JZJZ
TROTRO
TRPPTRPP
TRPPTRPP
TRPPTRPP
TRPSTRPS
TRPSTRPS
TRPBTRPB
7320
7220
7240
7360
7080
7000
7260
7180
7160
7300
7380
7280
7340
7120
7140
7520
7340
7360
7380
7400
7420
7440
7460
7480
7500
7520
7540
7380
7360
7400
7620
7380 7400
7640
7560
7640
7440
7460
7580
7420
7660
7480
7680
7660
7440
7500
7380
00
7600
7400
7580
7180
7420
7600
7420
7520
7420
7560
7380
7620
7680
7380
7440
7440
7460
7520
7620
7440
CMW256969.94
CMW236938.23
CMW226967.39
CMW247054.26
CMW197103.88
CMW047204.87
CMW027243.98
CMW077192.87
CMW107114.04
FW38Dry
CMW177121.68
CMW187116.39
CMW147120.86
FW24N.M.
KMW117076.08
KMW106964.71
KMW097147.24
KMW127143.96
CMW20N.M.
Nutria M
onocline
Nut
ria M
onoc
line
BLM MANAGED
ENT
7080
7040
7020
7000
6980
6960
7100
7220
7200
7180
7160
7140
7060
7120
3
2
State Plane Coordinate System, New Mexico West, North American Datum 1983. Units in US Survey Feet North America VerticalDatum (NAVD) 88.
Map Scale: 1:5,400 (1" = 450')Map Date: September 26, 2012
Ground water measurements in US feet; Dry, no water in wells; N.M., not measured.
Data sources: drainages, railroad, roads: Tele Atlas GDT-Dynamap, 2008; populated places: USGS, ESRI, 2005; orthophotography: USGS, 2005; Ft. Wingate Environmental Restoration detail: USACE.
Prepared by: Jonathan Hall - LRLReviewed by: David Henry
Rio Puerco
666566
400
32
602564
602
40
FIGURE 4-5April 2012 OB/OD Area
Groundwater Elevation Contour Map
Ft. Wingate Army Depot Property Boundary Indicated in RedOB/OD Area Groundwater Map Area in Yellow
DRY MONITORING WELLSBURIED MONITORING WELLS
OB/OD AREA MONITORING WELLS
GROUNDWATER ELEVATION CONTOUR (ESTIMATED) (20 FT INTERVAL)
BUILDINGS
FWDA PROPERTY BOUNDARY, FEB 2002
PROPERTY TRANSFER PARCEL IDENTIFICATION NUMBER
PROPERTY TRANSFER PARCEL BOUNDARY
ROAD
ARROYO
USGS TOPOGRAPHIC CONTOUR (20 FT INTERVAL)
FWDA SURFACE GEOLOGYQAL, QUATERNARY ALLUVIAL DEPOSITS
QCL, QUATERNARY COLLUVIAL AND GRAVEL DEPOSITS
KCC, CREVASSE CANYON FORMATION
KG, GALLUP SANDSTONE
KM, MANCOS SHALE
KD, DAKOTA SANDSTONE
JM, MORRISON FORMATION
JZ, ZUNI SANDSTONE
JE, ENTRADA SANDSTONE
TRO, OWL ROCK FORMATION
TRPP, PETRIFIED FOREST FORMATION - PAINTED DESERT MEMBER
TRPS, PETRIFIED FOREST FORMATION - SONSELA SANDSTONE MEMBER
TRPB, PETRIFIED FOREST FORMATION - BLUE MESA MEMBER
0.25Miles
0.25Kilometers
April 2012 FWDA Groundwater PMR
SECTION 5 FIGURES
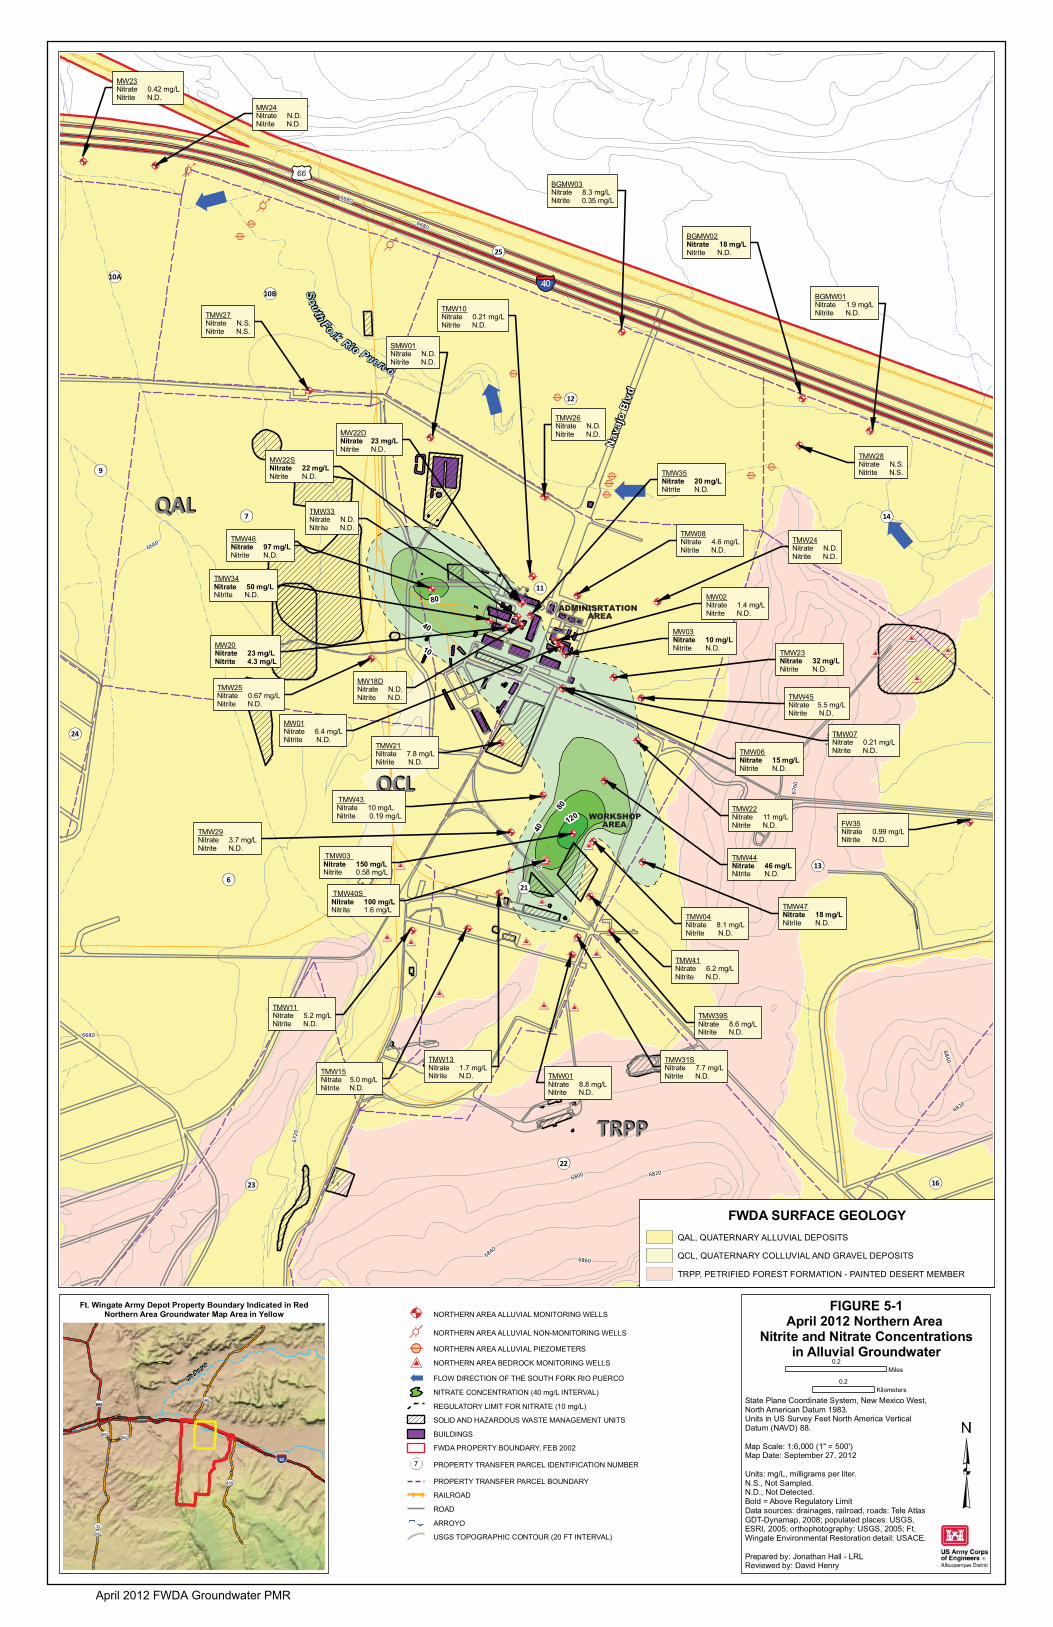
QALQAL
TRPPTRPP
QCLQCL
6700
6680
6660
6780
6800 6820
6840
6740
6860
6720
6820
6760
6680
6840
6680
South Fork Rio Puerco
TMW27Nitrate N.S.Nitrite N.S.
TMW26Nitrate N.D.Nitrite N.D.
TMW28Nitrate N.S.Nitrite N.S.
TMW25Nitrate 0.67 mg/LNitrite N.D.
TMW34Nitrate 50 mg/LNitrite N.D.
TMW10Nitrate 0.21 mg/LNitrite N.D.
MW20Nitrate 23 mg/LNitrite 4.3 mg/L
MW22DNitrate 23 mg/LNitrite N.D.
TMW33Nitrate N.D.Nitrite N.D.
MW18DNitrate N.D.Nitrite N.D.
TMW35Nitrate 20 mg/LNitrite N.D.
TMW08Nitrate 4.6 mg/LNitrite N.D.
TMW24Nitrate N.D.Nitrite N.D.
MW02Nitrate 1.4 mg/LNitrite N.D.
MW01Nitrate 6.4 mg/LNitrite N.D.
MW03Nitrate 10 mg/LNitrite N.D.
TMW06Nitrate 15 mg/LNitrite N.D.
TMW07Nitrate 0.21 mg/LNitrite N.D.
TMW23Nitrate 32 mg/LNitrite N.D.
TMW21Nitrate 7.8 mg/LNitrite N.D.
TMW22Nitrate 11 mg/LNitrite N.D. FW35
Nitrate 0.99 mg/LNitrite N.D.
TMW04Nitrate 8.1 mg/LNitrite N.D.
TMW29Nitrate 3.7 mg/LNitrite N.D.
TMW13Nitrate 1.7 mg/LNitrite N.D.
TMW11Nitrate 5.2 mg/LNitrite N.D.
TMW15Nitrate 5.0 mg/LNitrite N.D.
TMW01Nitrate 8.8 mg/LNitrite N.D.
MW22SNitrate 22 mg/LNitrite N.D.
TMW31SNitrate 7.7 mg/LNitrite N.D.
TMW03 Nitrate 150 mg/LNitrite 0.58 mg/L
TMW40S Nitrate 100 mg/LNitrite 1.6 mg/L
TMW43 Nitrate 10 mg/LNitrite 0.19 mg/L
TMW39SNitrate 8.6 mg/LNitrite N.D.
TMW41Nitrate 6.2 mg/LNitrite N.D.
TMW47Nitrate 18 mg/LNitrite N.D.
TMW44Nitrate 46 mg/LNitrite N.D.
TMW45Nitrate 5.5 mg/LNitrite N.D.
TMW46Nitrate 97 mg/LNitrite N.D.
BGMW03Nitrate 8.3 mg/LNitrite 0.35 mg/L
BGMW02Nitrate 18 mg/LNitrite N.D.
BGMW01Nitrate 1.9 mg/LNitrite N.D.
MW23Nitrate 0.42 mg/LNitrite N.D.
MW24Nitrate N.D. Nitrite N.D.
SMW01Nitrate N.D.Nitrite N.D.
Nava
jo B
lvd
19
23
22
16
216
13
24
11
7 14
9
12
10B
10A
25
120
80
40
80
40
10
State Plane Coordinate System, New Mexico West, North American Datum 1983. Units in US Survey Feet North America VerticalDatum (NAVD) 88.
Map Scale: 1:6,000 (1" = 500')Map Date: September 27, 2012
Units: mg/L, milligrams per liter.N.S., Not Sampled.N.D., Not Detected.Bold = Above Regulatory LimitData sources: drainages, railroad, roads: Tele Atlas GDT-Dynamap, 2008; populated places: USGS, ESRI, 2005; orthophotography: USGS, 2005; Ft. Wingate Environmental Restoration detail: USACE.
Prepared by: Jonathan Hall - LRLReviewed by: David Henry
Rio Puerco
666566
400
32
602564
602
40
FIGURE 5-1April 2012 Northern Area
Nitrite and Nitrate Concentrationsin Alluvial Groundwater
Ft. Wingate Army Depot Property Boundary Indicated in RedNorthern Area Groundwater Map Area in Yellow
FWDA SURFACE GEOLOGYQAL, QUATERNARY ALLUVIAL DEPOSITS
TRPP, PETRIFIED FOREST FORMATION - PAINTED DESERT MEMBER
QCL, QUATERNARY COLLUVIAL AND GRAVEL DEPOSITS
0.2Miles
0.2Kilometers
NORTHERN AREA ALLUVIAL MONITORING WELLS
NORTHERN AREA ALLUVIAL NON-MONITORING WELLS
NORTHERN AREA ALLUVIAL PIEZOMETERS
NORTHERN AREA BEDROCK MONITORING WELLS
FLOW DIRECTION OF THE SOUTH FORK RIO PUERCO
NITRATE CONCENTRATION (40 mg/L INTERVAL)
REGULATORY LIMIT FOR NITRATE (10 mg/L)
SOLID AND HAZARDOUS WASTE MANAGEMENT UNITS
BUILDINGS
FWDA PROPERTY BOUNDARY, FEB 2002
PROPERTY TRANSFER PARCEL IDENTIFICATION NUMBER
PROPERTY TRANSFER PARCEL BOUNDARY
RAILROAD
ROAD
ARROYO
USGS TOPOGRAPHIC CONTOUR (20 FT INTERVAL)
ADMINISRTATION AREA
WORKSHOP AREA
April 2012 FWDA Groundwater PMR
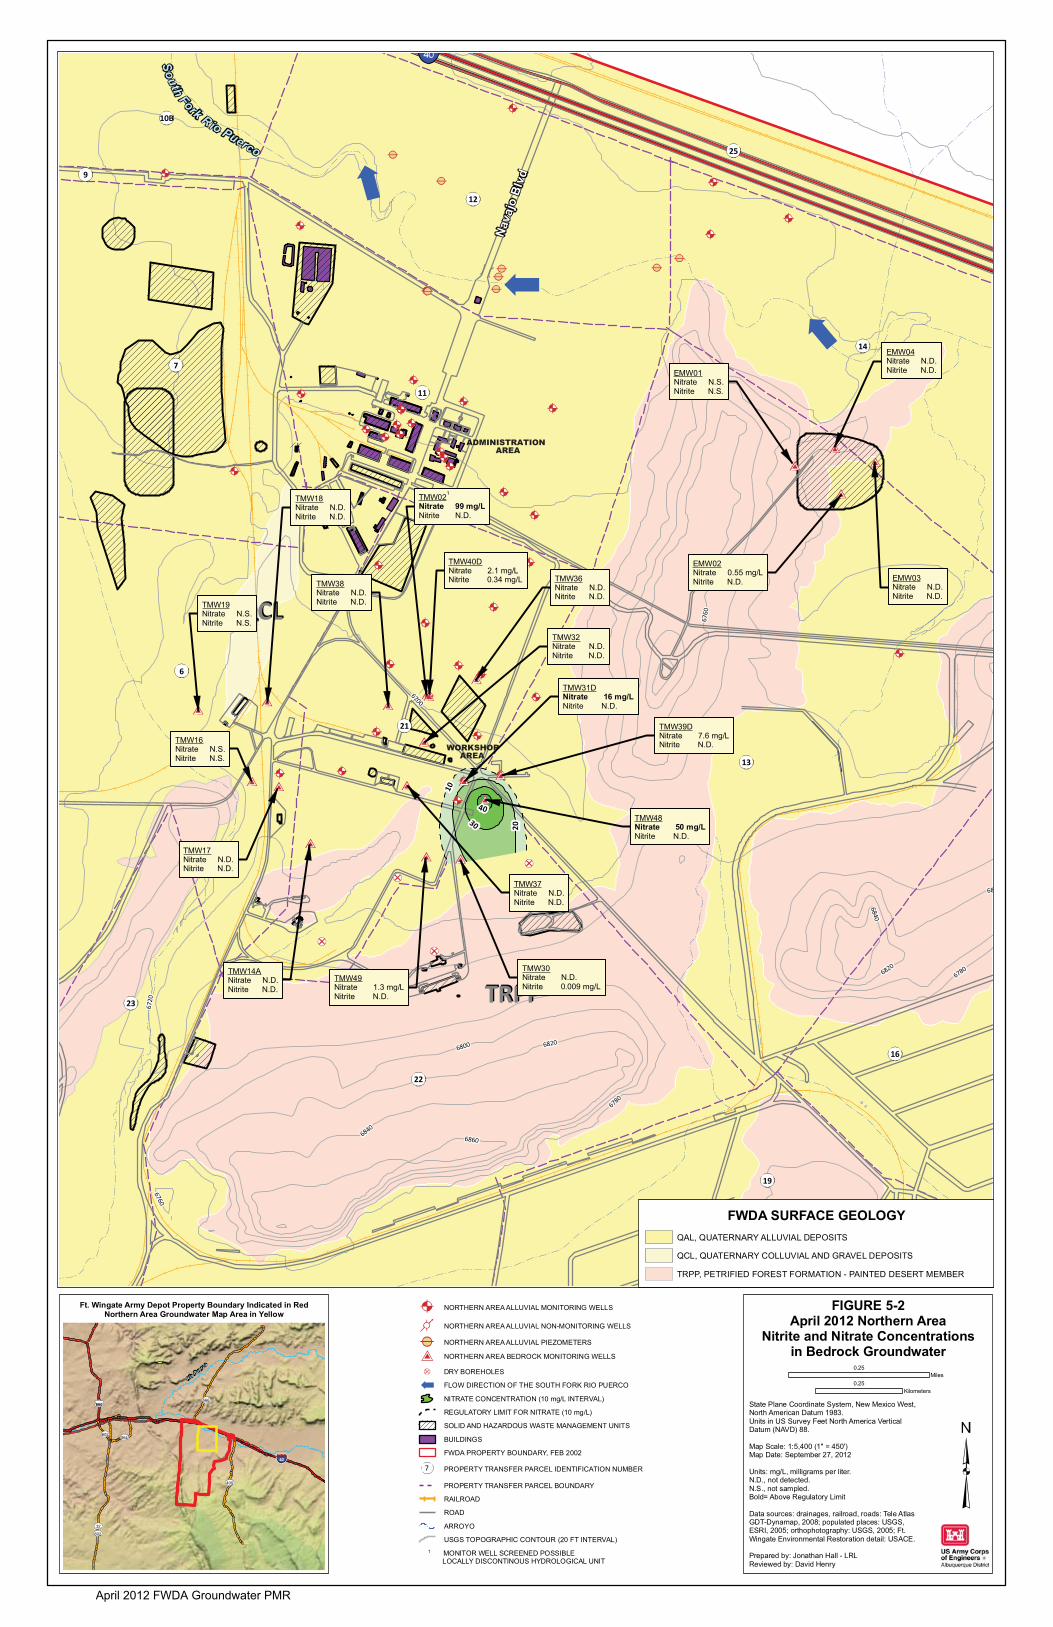
TRPPTRPP
QCLQCL6700
6780
6800
68
6820
6780
6840
6740
6860
6720
6820
6760
6840
6760South Fork Rio Puerco
TMW021
Nitrate 99 mg/LNitrite N.D.
TMW36Nitrate N.D.Nitrite N.D.
TMW32Nitrate N.D.Nitrite N.D.
TMW31DNitrate 16 mg/LNitrite N.D.
TMW37Nitrate N.D.Nitrite N.D.
TMW30Nitrate N.D.Nitrite 0.009 mg/L
TMW14ANitrate N.D.Nitrite N.D.
TMW18Nitrate N.D.Nitrite N.D.
TMW19Nitrate N.S.Nitrite N.S.
TMW16Nitrate N.S.Nitrite N.S.
EMW01Nitrate N.S.Nitrite N.S.
EMW02Nitrate 0.55 mg/LNitrite N.D. EMW03
Nitrate N.D.Nitrite N.D.
EMW04Nitrate N.D.Nitrite N.D.
TMW17Nitrate N.D.Nitrite N.D.
TMW38Nitrate N.D.Nitrite N.D.
TMW40DNitrate 2.1 mg/LNitrite 0.34 mg/L
TMW39DNitrate 7.6 mg/LNitrite N.D.
TMW48Nitrate 50 mg/LNitrite N.D.
TMW49Nitrate 1.3 mg/LNitrite N.D.
Nava
jo B
lvd
19
23
22
16
21
6
13
11
7
14
9
12
10B
25
4030 20
10
State Plane Coordinate System, New Mexico West, North American Datum 1983. Units in US Survey Feet North America VerticalDatum (NAVD) 88.
Map Scale: 1:5,400 (1" = 450')Map Date: September 27, 2012
Units: mg/L, milligrams per liter.N.D., not detected.N.S., not sampled.Bold= Above Regulatory Limit
Data sources: drainages, railroad, roads: Tele Atlas GDT-Dynamap, 2008; populated places: USGS, ESRI, 2005; orthophotography: USGS, 2005; Ft. Wingate Environmental Restoration detail: USACE.
Prepared by: Jonathan Hall - LRLReviewed by: David Henry
Rio Puerco
666566
400
32
602564
602
40
FIGURE 5-2April 2012 Northern Area
Nitrite and Nitrate Concentrationsin Bedrock Groundwater
Ft. Wingate Army Depot Property Boundary Indicated in RedNorthern Area Groundwater Map Area in Yellow
FWDA SURFACE GEOLOGYQAL, QUATERNARY ALLUVIAL DEPOSITS
TRPP, PETRIFIED FOREST FORMATION - PAINTED DESERT MEMBER
QCL, QUATERNARY COLLUVIAL AND GRAVEL DEPOSITS
0.25Miles
0.25Kilometers
NORTHERN AREA ALLUVIAL MONITORING WELLS
NORTHERN AREA ALLUVIAL NON-MONITORING WELLS
NORTHERN AREA ALLUVIAL PIEZOMETERS
NORTHERN AREA BEDROCK MONITORING WELLS
DRY BOREHOLES
FLOW DIRECTION OF THE SOUTH FORK RIO PUERCO
NITRATE CONCENTRATION (10 mg/L INTERVAL)
REGULATORY LIMIT FOR NITRATE (10 mg/L)
SOLID AND HAZARDOUS WASTE MANAGEMENT UNITS
BUILDINGS
FWDA PROPERTY BOUNDARY, FEB 2002
PROPERTY TRANSFER PARCEL IDENTIFICATION NUMBER
PROPERTY TRANSFER PARCEL BOUNDARY
RAILROAD
ROAD
ARROYO
USGS TOPOGRAPHIC CONTOUR (20 FT INTERVAL) 1 MONITOR WELL SCREENED POSSIBLE LOCALLY DISCONTINOUS HYDROLOGICAL UNIT
WORKSHOP AREA
ADMINISTRATION AREA
April 2012 FWDA Groundwater PMR

QALQAL
TRPPTRPP
QCLQCL
6700
6680
6660
6780
6800 6820
6740
6720
6820
6760
6680
6840
6680
South Fork Rio Puerco
MW20Explosives N.D.Perchlorate 0.684 ug/L
TMW03Dinitro-benzene,1,3 32 ug/LDinitro-toluene,2-Amino-4,6 0.72 ug/LHexahydro-1,3,5-trinitro-1,3,5-triazine (RDX) 250 ug/LOctahydro-1,3,5,7-tetranitro-1,3,5,7-tetra (HMX) 3.5 ug/LTrinitro-benzene,1,3,5 1.8 ug/LPerchlorate 0.962 ug/L
TMW04Dinitrotoluene, 2-Amino-4,6- 1.5 ug/LDinitrotoluene, 4-Amino-2,6- 1.6 ug/LTrinitrobenzene, 1,3,5- 2.8 ug/LPerchlorate 0.37 ug/L
TMW23Hexahydro-1,3,5-trinitro-1,3,5-triazine (RDX) 36 ug/LPerchlorate 0.113 ug/L
MW22DExplosives N.D.Perchlorate 0.219 ug/L
TMW34Explosives N.S.Perchlorate 0.288 ug/L
MW22SExplosives N.D.Perchlorate 0.133 ug/L
TMW01Explosives N.D.Perchlorate 296 ug/L
TMW31SExplosives N.D.Perchlorate 507 ug/L
TMW29Explosives N.D.Perchlorate 0.112 ug/L
TMW15Explosives N.D.Perchlorate 0.166 ug/L
TMW13Explosives N.S. Perchlorate 0.0838 ug/L
TMW22Explosives N.D.Perchlorate N.D.
TMW07 Explosives N.D.Perchlorate N.S.
TMW06 Dinitrobenzene, 1,3 0.29 ug/LPerchlorate N.S.
TMW24 Explosives N.D.Perchlorate N.D.
TMW08 Explosives N.S.Perchlorate N.D.
TMW35Explosives N.D.Perchlorate 0.214 ug/L
TMW10Explosives N.D.Perchlorate N.D.
TMW27Explosives N.S.Perchlorate N.D.
TMW28Explosives N.S.Perchlorate N.S.
TMW25 Explosives N.D.Perchlorate N.S.
TMW33Explosives N.D.Perchlorate N.S.
MW18DDinitrobenzene, 1,3- 4.5 ug/LPerchlorate 0.5 ug/L
TMW21Hexahydro-1,3,5-trinitro-1,3,5-triazine (RDX) 1.0 ug/LTrinitrobenzene, 1,3,5 0.12 ug/LPerchlorate N.D.
MW02Explosives N.D.Perchlorate N.D.
MW03Dinitrobenzene 0.46 ug/LPerchlorate N.D.
FW35 Explosives N.D.Perchlorate N.S.
MW23Explosives N.D.Perchlorate N.D.
MW24Explosives N.D.Perchlorate N.D.
TMW11Explosives N.D.Perchlorate 0.176 ug/L
MW01 Explosives N.D.Perchlorate N.D.
TMW26Explosives N.D.Perchlorate N.D.
BGMW03Explosives N.D.Perchlorate 0.579 ug/L
BGMW02Explosives N.D.Perchlorate 0.510 ug/L
BGMW01Explosives N.D.Perchlorate N.D.
TMW46Explosives N.D.Perchlorate 0.712 ug/L
TMW43Hexahydro-1,3,5-trinitro-1,3,5-triazine (RDX) 2.5 ug/LOctahydro-1,3,5,7-tetranitro-1,3,5,7-tetra (HMX) 0.12 ug/LPerchlorate N.D.
TMW40SExplosives N.S.Perchlorate 76.8 ug/L
TMW45Explosives N.D.Perchlorate 0.368 ug/L
TMW44Trinitrobenzene, 1,3,5- 0.26 ug/LPerchlorate N.D.
TMW47Explosives N.D.Perchlorate N.D.
TMW41Explosives N.S. Perchlorate 1.68 ug/L
TMW39SExplosives N.D.Perchlorate 702 ug/L
TMW02Explosives N.S.Perchlorate 17.5 ug/L
Nava
jo B
lvd
19
23
22
16
216
13
24
11
7
14
9
12
10B
10A
25
240
0.61
200
160120
80
400.61
State Plane Coordinate System, New Mexico West, North American Datum 1983. Units in US Survey Feet North America VerticalDatum (NAVD) 88.
Map Scale: 1:6,000 (1" = 500')Map Date: September 27, 2012
Units: ug/L, micrograms per liter.Bold= Above Regulatory LimitN.D., Not Detected.N.S., Not Sampled.Data sources: drainages, railroad, roads: Tele Atlas GDT-Dynamap, 2008; populated places: USGS, ESRI, 2005; orthophotography: USGS, 2005; Ft. Wingate Environmental Restoration detail: USACE.
Prepared by: Jonathan Hall - LRLReviewed by: David Henry
Rio Puerco
666566
400
32
602564
602
40
FIGURE 5-3April 2012 Northern Area
Explosives and Perchlorate Concentrations
in Alluvial Groundwater
Ft. Wingate Army Depot Property Boundary Indicated in RedNorthern Area Groundwater Map Area in Yellow
NORTHERN AREA ALLUVIAL MONITORING WELLS
NORTHERN AREA ALLUVIAL NON-MONITORING WELLS
NORTHERN AREA ALLUVIAL PIEZOMETERS
NORTHERN AREA BEDROCK MONITORING WELLS
FLOW DIRECTION OF THE SOUTH FORK RIO PUERCO
RDX CONCENTRATION (40 UG/L INTERVAL)
REGULATORY LIMIT FOR RDX (0.61 UG/L)
SOLID AND HAZARDOUS WASTE MANAGEMENT UNITS
ADJOINING PROPERTY BOUNDARY
BUILDINGS
FWDA PROPERTY BOUNDARY, FEB 2002
PROPERTY TRANSFER PARCEL IDENTIFICATION NUMBER
PROPERTY TRANSFER PARCEL BOUNDARY
RAILROAD
ROAD
ARROYO
USGS TOPOGRAPHIC CONTOUR (20 FT INTERVAL)
FWDA SURFACE GEOLOGYQAL, QUATERNARY ALLUVIAL DEPOSITS
TRPP, PETRIFIED FOREST FORMATION - PAINTED DESERT MEMBER
QCL, QUATERNARY COLLUVIAL AND GRAVEL DEPOSITS
0.25Miles
0.25Kilometers
WORKSHOP AREA
ADMINISTRATION AREA
April 2012 FWDA Groundwater PMR
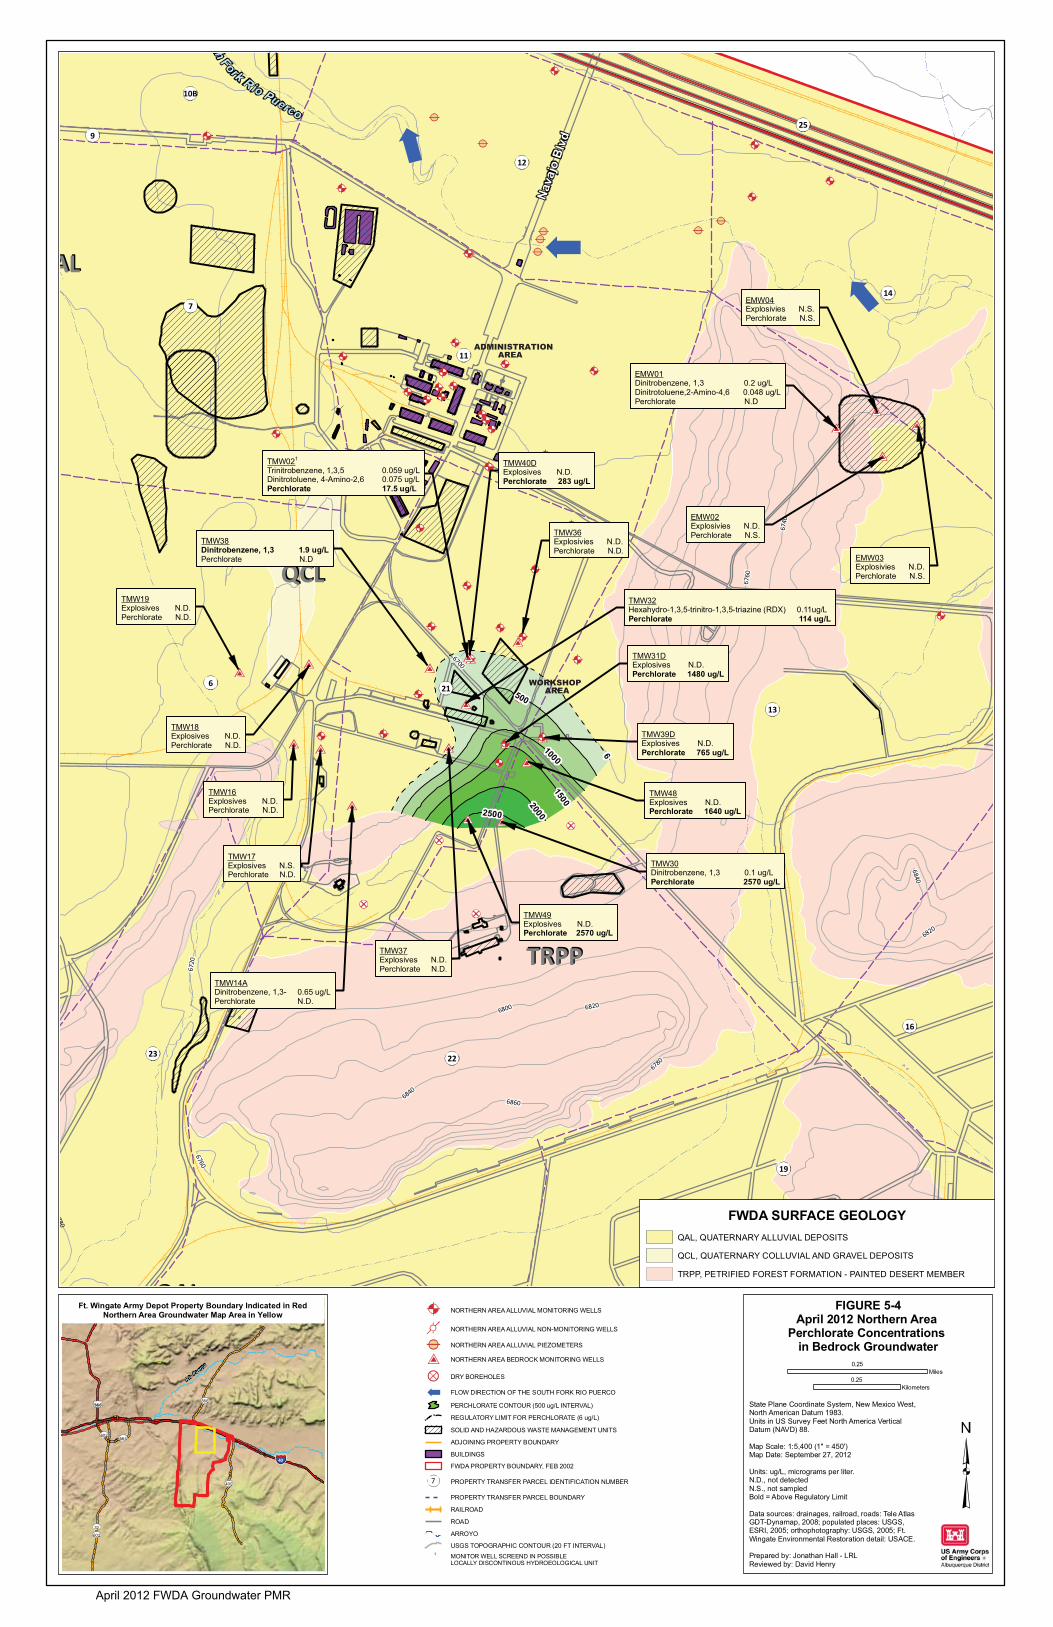
ALAL
TRPPTRPP
TRPPTRPP
QALQAL
QCLQCL6700
6780
6780
6800 6820
6840
6740
6860
6720
6820
6760
6840
6760
th Fork Rio Puerco
TMW31DExplosives N.D.Perchlorate 1480 ug/L
TMW32Hexahydro-1,3,5-trinitro-1,3,5-triazine (RDX) 0.11ug/LPerchlorate 114 ug/L
TMW30Dinitrobenzene, 1,3 0.1 ug/LPerchlorate 2570 ug/L
TMW14ADinitrobenzene, 1,3- 0.65 ug/LPerchlorate N.D.
TMW17Explosives N.S.Perchlorate N.D.
TMW16Explosives N.D.Perchlorate N.D.
TMW021
Trinitrobenzene, 1,3,5 0.059 ug/LDinitrotoluene, 4-Amino-2,6 0.075 ug/LPerchlorate 17.5 ug/L
EMW01Dinitrobenzene, 1,3 0.2 ug/LDinitrotoluene,2-Amino-4,6 0.048 ug/LPerchlorate N.D
EMW02Explosivies N.D.Perchlorate N.S.
EMW04Explosivies N.S.Perchlorate N.S.
EMW03Explosivies N.D.Perchlorate N.S.
TMW36Explosivies N.D.Perchlorate N.D.
TMW37Explosives N.D.Perchlorate N.D.
TMW18Explosives N.D.Perchlorate N.D.
TMW19Explosives N.D.Perchlorate N.D.
TMW38Dinitrobenzene, 1,3 1.9 ug/LPerchlorate N.D
TMW40DExplosives N.D.Perchlorate 283 ug/L
TMW49Explosives N.D.Perchlorate 2570 ug/L
TMW48Explosives N.D.Perchlorate 1640 ug/L
TMW39DExplosives N.D.Perchlorate 765 ug/L
Nava
jo B
lvd
19
23 22
16
216
13
11
714
9
12
10B
25
2500
2000
1500
1000
500
6
State Plane Coordinate System, New Mexico West, North American Datum 1983. Units in US Survey Feet North America VerticalDatum (NAVD) 88.
Map Scale: 1:5,400 (1" = 450')Map Date: September 27, 2012
Units: ug/L, micrograms per liter.N.D., not detectedN.S., not sampledBold = Above Regulatory Limit
Data sources: drainages, railroad, roads: Tele Atlas GDT-Dynamap, 2008; populated places: USGS, ESRI, 2005; orthophotography: USGS, 2005; Ft. Wingate Environmental Restoration detail: USACE.
Prepared by: Jonathan Hall - LRLReviewed by: David Henry
Rio Puerco
666566
400
32
602564
602
40
FIGURE 5-4April 2012 Northern Area
Perchlorate Concentrations in Bedrock Groundwater
Ft. Wingate Army Depot Property Boundary Indicated in RedNorthern Area Groundwater Map Area in Yellow
FWDA SURFACE GEOLOGYQAL, QUATERNARY ALLUVIAL DEPOSITS
TRPP, PETRIFIED FOREST FORMATION - PAINTED DESERT MEMBER
QCL, QUATERNARY COLLUVIAL AND GRAVEL DEPOSITS
NORTHERN AREA ALLUVIAL MONITORING WELLS
NORTHERN AREA ALLUVIAL NON-MONITORING WELLS
NORTHERN AREA ALLUVIAL PIEZOMETERS
NORTHERN AREA BEDROCK MONITORING WELLS
DRY BOREHOLES
FLOW DIRECTION OF THE SOUTH FORK RIO PUERCO
PERCHLORATE CONTOUR (500 ug/L INTERVAL)
REGULATORY LIMIT FOR PERCHLORATE (6 ug/L)
SOLID AND HAZARDOUS WASTE MANAGEMENT UNITS
ADJOINING PROPERTY BOUNDARY
BUILDINGS
FWDA PROPERTY BOUNDARY, FEB 2002
PROPERTY TRANSFER PARCEL IDENTIFICATION NUMBER
PROPERTY TRANSFER PARCEL BOUNDARY
RAILROAD
ROAD
ARROYO
USGS TOPOGRAPHIC CONTOUR (20 FT INTERVAL)1 MONITOR WELL SCREEND IN POSSIBLE LOCALLY DISCONTINOUS HYDROEOLOGICAL UNIT
0.25Miles
0.25Kilometers
ADMINISTRATION AREA
WORKSHOP AREA
April 2012 FWDA Groundwater PMR
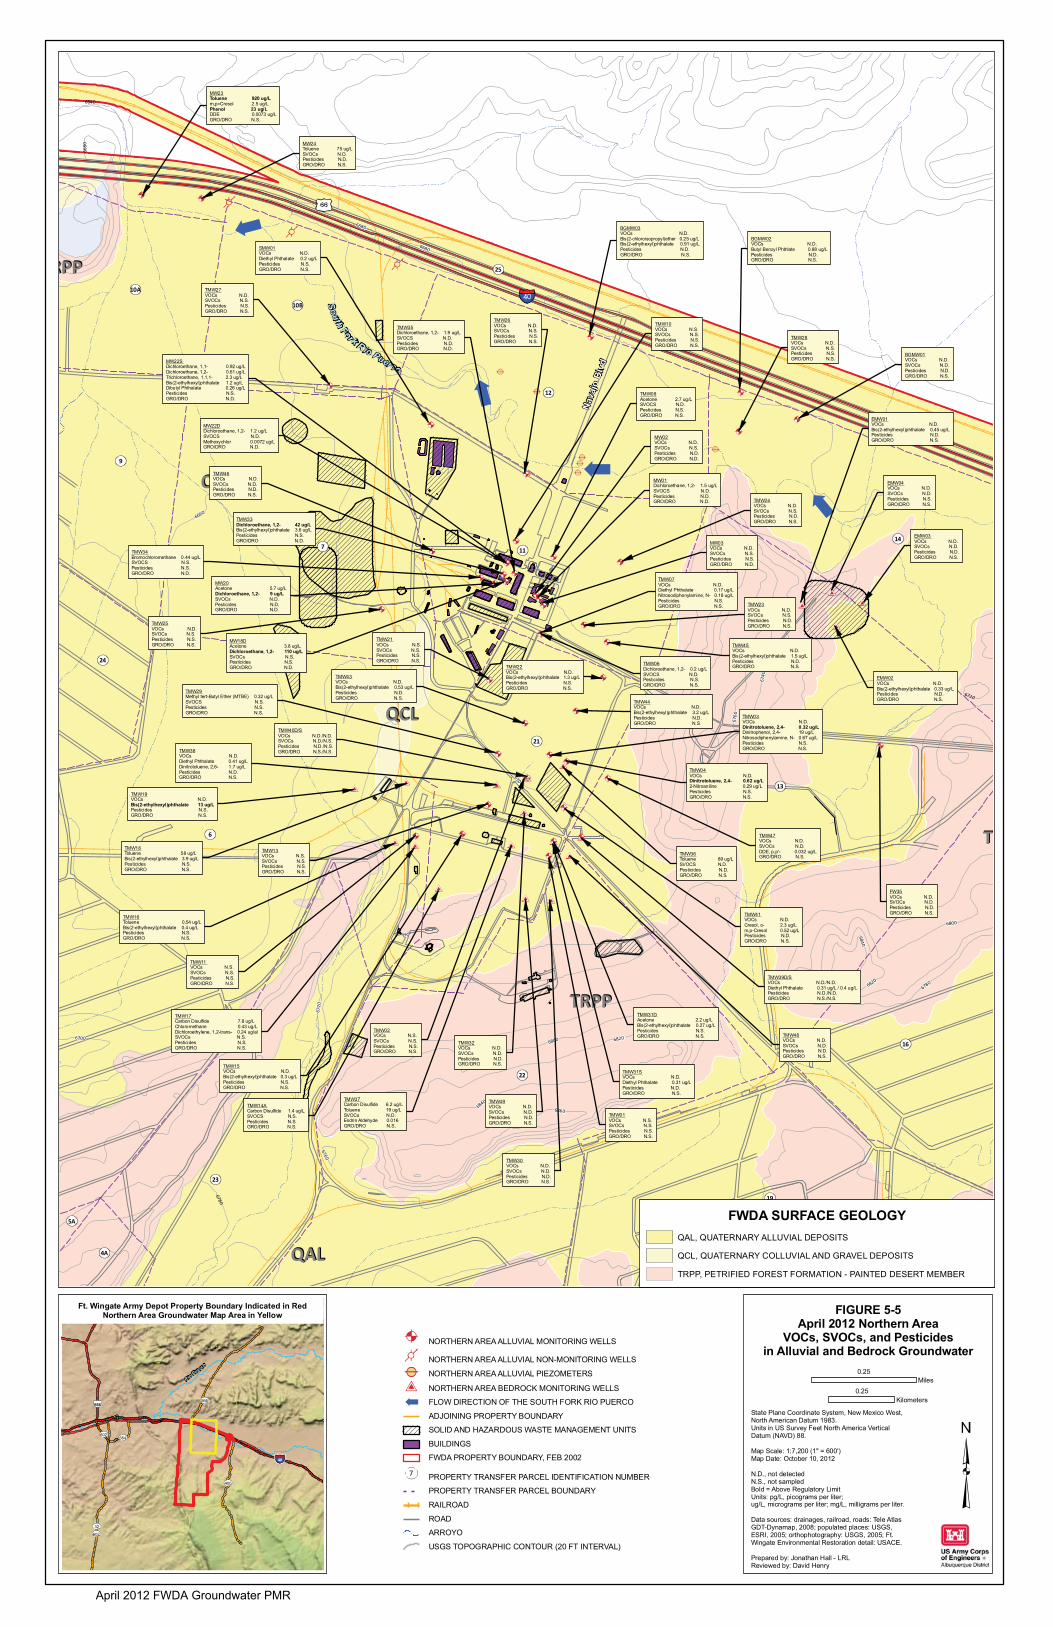
QALQAL
TRPPTRPP
TT
TRPPTRPP
RPPRPP
QALQAL
QCLQCL
6700
6680
6780
6660
6640
6780
6800
6800
6820
6780
6840
6740
6860
6720
6700
6820
6760
6680
6840
6860
6680
6680
6720
6760South Fork Rio Puerco
TMW27VOCs N.D.SVOCs N.S.Pesticides N.S.GRO/DRO N.S.
MW22SDichloroethane, 1,1- 0.92 ug/LDichloroethane, 1,2- 0.61 ug/LTrichloroethane, 1,1,1- 2.3 ug/LBis(2-ethylhexyl)phthalate 1.2 ug/LDibutyl Phthalate 0.26 ug/LPesticides N.S.GRO/DRO N.D.
SMW01VOCs N.D.Diethyl Phthalate 0.2 ug/LPesticides N.S.GRO/DRO N.S.
TMW35Dichloroethane, 1,2- 1.9 ug/LSVOCS N.D.Pesticides N.D.GRO/DRO N.D.
TMW26VOCs N.D.SVOCs N.S.Pesticides N.S.GRO/DRO N.S.
TMW10VOCs N.S.SVOCs N.S.Pesticides N.S.GRO/DRO N.S.
TMW08Acetone 2.7 ug/LSVOCS N.D.Pesticides N.S.GRO/DRO N.S.
MW02VOCs N.D.SVOCs N.S.Pesticides N.D.GRO/DRO N.D.
TMW28VOCs N.D.SVOCs N.S.Pesticides N.S.GRO/DRO N.S.
MW01Dichloroethane, 1,2- 1.5 ug/LSVOCS N.D.Pesticides N.D.GRO/DRO N.D.
EMW01VOCs N.D.Bis(2-ethylhexyl)phthalate 0.45 ug/LPesticides N.D.GRO/DRO N.S.
EMW02VOCs N.D.Bis(2-ethylhexyl)phthalate 0.33 ug/LPesticides N.D.GRO/DRO N.S.
EMW04VOCs N.D.SVOCs N.D.Pesticides N.S.GRO/DRO N.S.
EMW03VOCs N.D.SVOCs N.D.Pesticides N.D.GRO/DRO N.S.
TMW24VOCs N.D.SVOCs N.S.Pesticides N.D.GRO/DRO N.S.
MW03VOCs N.D.SVOCs N.S.Pesticides N.S.GRO/DRO N.D.
TMW23VOCs N.D.SVOCs N.S.Pesticides N.D.GRO/DRO N.S.
TMW07VOCs N.D.Diethyl Phthalate 0.17 ug/LNitrosodiphenylamine, N- 0.18 ug/LPesticides N.S.GRO/DRO N.S.
TMW06Dichloroethane, 1,2- 0.2 ug/LSVOCS N.D.Pesticides N.S.GRO/DRO N.S.
TMW22VOCs N.D.Bis(2-ethylhexyl)phthalate 1.3 ug/LPesticides N.S.GRO/DRO N.S.
TMW03VOCs N.D.Dinitrotoluene, 2,4- 0.32 ug/LDinitrophenol, 2,4- 19 ug/LNitrosodiphenylamine, N- 0.67 ug/LPesticides N.S.GRO/DRO N.S.
TMW04VOCs N.D.Dinitrotoluene, 2,4- 0.62 ug/L2-Nitroaniline 0.29 ug/LPesticides N.S.GRO/DRO N.S.
TMW36Toluene 89 ug/LSVOCS N.D.Pesticides N.D.GRO/DRO N.S.
TMW32VOCs N.D.SVOCs N.D.Pesticides N.D.GRO/DRO N.S.
TMW31DAcetone 2.2 ug/LBis(2-ethylhexyl)phthalate 0.27 ug/LPesticides N.S.GRO/DRO N.S.
TMW31SVOCs N.D.Diethyl Phthalate 0.31 ug/LPesticides N.D.GRO/DRO N.S.
FW35VOCs N.D.SVOCs N.D.Pesticides N.D.GRO/DRO N.S.
TMW01VOCs N.S.SVOCs N.S.Pesticides N.S.GRO/DRO N.S.
TMW30VOCs N.D.SVOCs N.D.Pesticides N.D.GRO/DRO N.S.
TMW37Carbon Disulfide 6.2 ug/LToluene 19 ug/LSVOCs N.D.Endrin Aldehyde 0.016GRO/DRO N.S.
TMW14ACarbon Disulfide 1.4 ug/LSVOCS N.S.Pesticides N.S.GRO/DRO N.S.
TMW15VOCs N.D.Bis(2-ethylhexyl)phthalate 0.3 ug/LPesticides N.S.GRO/DRO N.S.
TMW17Carbon Disulfide 7.8 ug/LChloromethane 0.43 ug/LDichloroethylene, 1,2-trans- 0.24 ug/alSVOCs N.S.Pesticides N.S.GRO/DRO N.S.
TMW11VOCs N.S.SVOCs N.S.Pesticides N.S.GRO/DRO N.S.
TMW16Toluene 0.54 ug/LBis(2-ethylhexyl)phthalate 0.4 ug/LPesticides N.S.GRO/DRO N.S.
TMW13VOCs N.S.SVOCs N.S.Pesticides N.S.GRO/DRO N.S.
TMW19VOCs N.D.Bis(2-ethylhexyl)phthalate 13 ug/LPesticides N.S.GRO/DRO N.S.
TMW18Toluene 58 ug/LBis(2-ethylhexyl)phthalate 3.9 ug/LPesticides N.S.GRO/DRO N.S.
TMW02VOCs N.S.SVOCs N.S.Pesticides N.S.GRO/DRO N.S.
TMW21VOCs N.S.SVOCs N.S.Pesticides N.S.GRO/DRO N.S.
TMW29Methyl tert-Butyl Ether (MTBE) 0.32 ug/LSVOCS N.S.Pesticides N.S.GRO/DRO N.S.
MW20Acetone 5.7 ug/LDichloroethane, 1,2- 9 ug/LSVOCs N.D.Pesticides N.D.GRO/DRO N.D.
MW18DAcetone 3.8 ug/LDichloroethane, 1,2- 110 ug/LSVOCs N.S.Pesticides N.S.GRO/DRO N.D.
TMW25VOCs N.D.SVOCs N.S.Pesticides N.S.GRO/DRO N.S.
TMW34Bromochloromethane 0.44 ug/LSVOCS N.S.Pesticides N.S.GRO/DRO N.D.
TMW33Dichloroethane, 1,2- 42 ug/LBis(2-ethylhexyl)phthalate 3.6 ug/LPesticides N.S.GRO/DRO N.D.
MW22DDichloroethane, 1,2- 1.2 ug/LSVOCS N.D.Methoxychlor 0.0072 ug/LGRO/DRO N.D.
BGMW03VOCs N.D.Bis(2-chloroisopropyl)ether 0.25 ug/LBis(2-ethylhexyl)phthalate 0.91 ug/LPesticides N.D.GRO/DRO N.S.
BGMW02VOCs N.D.Butyl Benzyl Phthlate 0.88 ug/LPesticides N.D.GRO/DRO N.S.
BGMW01VOCs N.D.SVOCs N.D.Pesticides N.D.GRO/DRO N.S.
MW23Toluene 920 ug/Lm,p=Cresol 2.5 ug/LPhenol 23 ug/LDDE 0.0073 ug/LGRO/DRO N.S.
MW24Toluene 75 ug/LSVOCs N.D.Pesticides N.D.GRO/DRO N.S.
TMW46VOCs N.D.SVOCs N.D.Pesticides N.D.GRO/DRO N.S.
TMW38VOCs N.D.Diethyl Phthalate 0.41 ug/LDinitrotoluene, 2,6- 1.7 ug/LPesticides N.D.GRO/DRO N.S.
TMW49VOCs N.D.SVOCs N.D.Pesticides N.D.GRO/DRO N.S.
TMW48VOCs N.D.SVOCs N.D.Pesticides N.D.GRO/DRO N.S.
TMW43VOCs N.D.Bis(2-ethylhexyl)phthalate 0.53 ug/LPesticides N.D.GRO/DRO N.S.
TMW40D/SVOCs N.D./N.D.SVOCs N.D./N.S.Pesticides N.D./N.S.GRO/DRO N.S./N.S.
TMW39D/SVOCs N.D./N.D.Diethyl Phthalate 0.31 ug/L / 0.4 ug/LPesticides N.D./N.D.GRO/DRO N.S./N.S.
TMW41VOCs N.D.Cresol, o- 2.3 ug/Lm,p-Cresol 0.52 ug/LPesticides N.D.GRO/DRO N.S.
TMW47VOCs N.D.SVOCs N.D.DDE, p,p'- 0.032 ug/LGRO/DRO N.S.
TMW44VOCs N.D.Bis(2-ethylhexyl)phthalate 3.2 ug/LPesticides N.D.GRO/DRO N.S.
TMW45VOCs N.D.Bis(2-ethylhexyl)phthalate 1.5 ug/LPesticides N.D.GRO/DRO N.S.
Nava
jo B
lvd
5A
4A
19
23
22
16
21
6
13
24
11714
9
12
10B
10A
25
State Plane Coordinate System, New Mexico West, North American Datum 1983. Units in US Survey Feet North America VerticalDatum (NAVD) 88.
Map Scale: 1:7,200 (1" = 600')Map Date: October 10, 2012
N.D., not detectedN.S., not sampled Bold = Above Regulatory LimitUnits: pg/L, picograms per liter; ug/L, micrograms per liter; mg/L, milligrams per liter.
Data sources: drainages, railroad, roads: Tele Atlas GDT-Dynamap, 2008; populated places: USGS, ESRI, 2005; orthophotography: USGS, 2005; Ft. Wingate Environmental Restoration detail: USACE.
Prepared by: Jonathan Hall - LRLReviewed by: David Henry
Rio Puerco
666566
400
32
602564
602
40
FIGURE 5-5April 2012 Northern Area
VOCs, SVOCs, and Pesticidesin Alluvial and Bedrock Groundwater
Ft. Wingate Army Depot Property Boundary Indicated in RedNorthern Area Groundwater Map Area in Yellow
NORTHERN AREA ALLUVIAL MONITORING WELLS
NORTHERN AREA ALLUVIAL NON-MONITORING WELLS
NORTHERN AREA ALLUVIAL PIEZOMETERS
NORTHERN AREA BEDROCK MONITORING WELLS
FLOW DIRECTION OF THE SOUTH FORK RIO PUERCO
ADJOINING PROPERTY BOUNDARY
SOLID AND HAZARDOUS WASTE MANAGEMENT UNITS
BUILDINGS
FWDA PROPERTY BOUNDARY, FEB 2002
PROPERTY TRANSFER PARCEL IDENTIFICATION NUMBER
PROPERTY TRANSFER PARCEL BOUNDARY
RAILROAD
ROAD
ARROYO
USGS TOPOGRAPHIC CONTOUR (20 FT INTERVAL)
FWDA SURFACE GEOLOGYQAL, QUATERNARY ALLUVIAL DEPOSITS
TRPP, PETRIFIED FOREST FORMATION - PAINTED DESERT MEMBER
QCL, QUATERNARY COLLUVIAL AND GRAVEL DEPOSITS
0.25Miles
0.25Kilometers
April 2012 FWDA Groundwater PMR
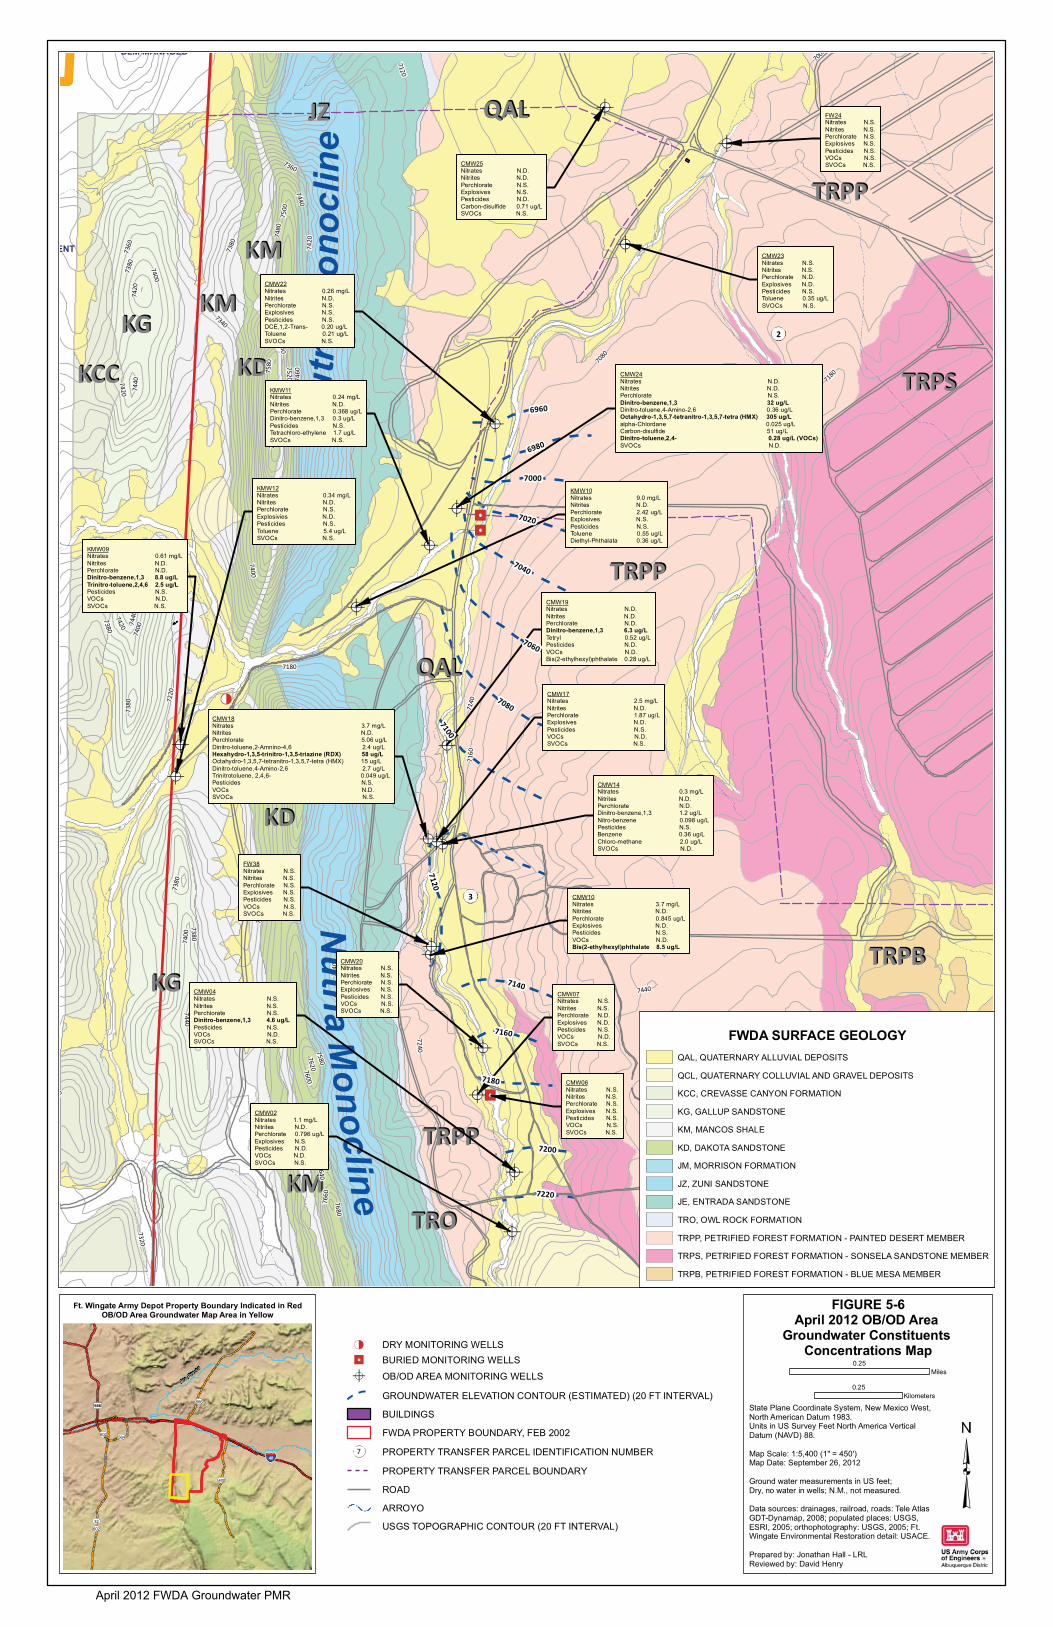
QALQAL
QALQAL
QALQAL
KCCKCC
KGKG
KGKG
KMKM
KMKM
KMKM
KDKD
KDKD
JZJZ
TROTRO
TRPPTRPP
TRPPTRPP
TRPPTRPP
TRPSTRPS
TRPSTRPS
TRPBTRPB
7320
7220
7240
7360
7080
7000
7260
7180
7160
7300
7380
7280
7340
7120
7140
7520
7340
7360
7380
7400
7420
7440
7460
7480
7500
7520
7540
7380
7360
7400
7620
7380 7400
7640
7560
7640
7440
7460
7580
7420
7660
7480
7680
7660
7440
7500
7380
00
7600
7400
7580
7180
7420
7600
7420
7520
7420
7560
7380
7620
7680
7380
7440
7440
7460
7520
7620
7440
FW24Nitrates N.S.Nitrites N.S.Perchlorate N.S.Explosives N.S.Pesticides N.S.VOCs N.S.SVOCs N.S.
Nutria M
onocline
Nut
ria M
onoc
line
BLM MANAGED
ENT
CMW25Nitrates N.D.Nitrites N.D.Perchlorate N.S.Explosives N.S.Pesticides N.D.Carbon-disulfide 0.71 ug/LSVOCs N.S.
CMW23Nitrates N.S.Nitrites N.S.Perchlorate N.D.Explosives N.D.Pesticides N.S.Toluene 0.35 ug/LSVOCs N.S.
CMW22Nitrates 0.26 mg/LNitrites N.D.Perchlorate N.S.Explosives N.S.Pesticides N.S.DCE,1,2-Trans- 0.20 ug/LToluene 0.21 ug/LSVOCs N.S.
CMW24Nitrates N.D.Nitrites N.D.Perchlorate N.S.Dinitro-benzene,1,3 32 ug/L Dinitro-toluene,4-Amino-2,6 0.36 ug/LOctahydro-1,3,5,7-tetranitro-1,3,5,7-tetra (HMX) 305 ug/L alpha-Chlordane 0.025 ug/LCarbon-disulfide 51 ug/LDinitro-toluene,2,4- 0.28 ug/L (VOCs)SVOCs N.D.
KMW11Nitrates 0.24 mg/LNitrites N.D.Perchlorate 0.368 ug/LDinitro-benzene,1,3 0.3 ug/LPesticides N.S.Tetrachloro-ethylene 1.7 ug/LSVOCs N.S.
KMW10Nitrates 9.0 mg/LNitrites N.D.Perchlorate 2.42 ug/LExplosives N.S.Pesticides N.S.Toluene 0.55 ug/LDiethyl-Phthalata 0.36 ug/L
KMW09Nitrates 0.61 mg/LNitrites N.D.Perchlorate N.D.Dinitro-benzene,1,3 8.8 ug/LTrinitro-toluene,2,4,6 2.5 ug/LPesticides N.S.VOCs N.D.SVOCs N.S.
KMW12Nitrates 0.34 mg/LNitrites N.D.Perchlorate N.S.Explosivies N.D.Pesticides N.S.Toluene 5.4 ug/LSVOCs N.S.
CMW19Nitrates N.D.Nitrites N.D.Perchlorate N.D.Dinitro-benzene,1,3 6.3 ug/LTetryl 0.52 ug/LPesticides N.D.VOCs N.D.Bis(2-ethylhexyl)phthalate 0.28 ug/L
CMW17Nitrates 2.5 mg/LNitrites N.D.Perchlorate 1.87 ug/LExplosives N.D.Pesticides N.S.VOCs N.D.SVOCs N.S.
CMW14Nitrates 0.3 mg/LNitrites N.D.Perchlorate N.D.Dinitro-benzene,1,3 1.2 ug/LNitro-benzene 0.098 ug/LPesticides N.S.Benzene 0.36 ug/LChloro-methane 2.0 ug/LSVOCs N.D.
CMW18Nitrates 3.7 mg/LNitrites N.D.Perchlorate 5.06 ug/LDinitro-toluene,2-Amnino-4,6 2.4 ug/LHexahydro-1,3,5-trinitro-1,3,5-triazine (RDX) 58 ug/LOctahydro-1,3,5,7-tetranitro-1,3,5,7-tetra (HMX) 15 ug/LDinitro-toluene,4-Amino-2,6 2.7 ug/LTrinitrotoluene, 2,4,6- 0.049 ug/LPesticides N.S.VOCs N.D.SVOCs N.S.
FW38Nitrates N.S.Nitrites N.S.Perchlorate N.S.Explosives N.S.Pesticides N.S.VOCs N.S.SVOCs N.S.
CMW10Nitrates 3.7 mg/LNitrites N.D.Perchlorate 0.845 ug/LExplosives N.D.Pesticides N.S.VOCs N.D.Bis(2-ethylhexyl)phthalate 8.5 ug/L
CMW07Nitrates N.S.Nitrites N.S.Perchlorate N.D.Explosives N.D.Pesticides N.S.VOCs N.D.SVOCs N.S.
CMW04Nitrates N.S.Nitrites N.S.Perchlorate N.S.Dinitro-benzene,1,3 4.6 ug/L Pesticides N.S.VOCs N.D.SVOCs N.S.
CMW02Nitrates 1.1 mg/LNitrites N.D.Perchlorate 0.796 ug/LExplosives N.S.Pesticides N.D.VOCs N.D.SVOCs N.S.
CMW20Nitrates N.S.Nitrites N.S.Perchlorate N.S.Explosives N.S.Pesticides N.S.VOCs N.S.SVOCs N.S.
CMW06Nitrates N.S.Nitrites N.S.Perchlorate N.S.Explosives N.S.Pesticides N.S.VOCs N.S.SVOCs N.S.
7080
7040
7020
7000
6980
6960
7100
7220
7200
7180
7160
7140
7060
7120
3
2
State Plane Coordinate System, New Mexico West, North American Datum 1983. Units in US Survey Feet North America VerticalDatum (NAVD) 88.
Map Scale: 1:5,400 (1" = 450')Map Date: September 26, 2012
Ground water measurements in US feet; Dry, no water in wells; N.M., not measured.
Data sources: drainages, railroad, roads: Tele Atlas GDT-Dynamap, 2008; populated places: USGS, ESRI, 2005; orthophotography: USGS, 2005; Ft. Wingate Environmental Restoration detail: USACE.
Prepared by: Jonathan Hall - LRLReviewed by: David Henry
Rio Puerco
666566
400
32
602564
602
40
FIGURE 5-6April 2012 OB/OD Area
Groundwater Constituents Concentrations Map
Ft. Wingate Army Depot Property Boundary Indicated in RedOB/OD Area Groundwater Map Area in Yellow
DRY MONITORING WELLSBURIED MONITORING WELLS
OB/OD AREA MONITORING WELLS
GROUNDWATER ELEVATION CONTOUR (ESTIMATED) (20 FT INTERVAL)
BUILDINGS
FWDA PROPERTY BOUNDARY, FEB 2002
PROPERTY TRANSFER PARCEL IDENTIFICATION NUMBER
PROPERTY TRANSFER PARCEL BOUNDARY
ROAD
ARROYO
USGS TOPOGRAPHIC CONTOUR (20 FT INTERVAL)
FWDA SURFACE GEOLOGYQAL, QUATERNARY ALLUVIAL DEPOSITS
QCL, QUATERNARY COLLUVIAL AND GRAVEL DEPOSITS
KCC, CREVASSE CANYON FORMATION
KG, GALLUP SANDSTONE
KM, MANCOS SHALE
KD, DAKOTA SANDSTONE
JM, MORRISON FORMATION
JZ, ZUNI SANDSTONE
JE, ENTRADA SANDSTONE
TRO, OWL ROCK FORMATION
TRPP, PETRIFIED FOREST FORMATION - PAINTED DESERT MEMBER
TRPS, PETRIFIED FOREST FORMATION - SONSELA SANDSTONE MEMBER
TRPB, PETRIFIED FOREST FORMATION - BLUE MESA MEMBER
0.25Miles
0.25Kilometers
April 2012 FWDA Groundwater PMR
APPENDICES (ON DISK)