Embed Size (px)
Citation preview

Final Progress Report for Research Projects Funded by
Health Research Grants
Instructions: Please complete all of the items as instructed. Do not delete instructions. Do not
leave any items blank; responses must be provided for all items. If your response to an item is
“None”, please specify “None” as your response. “Not applicable” is not an acceptable response
for any of the items. There is no limit to the length of your response to any question. Responses
should be single-spaced, no smaller than 12-point type. The report must be completed using
MS Word. Submitted reports must be Word documents; they should not be converted to pdf
format. Questions? Contact Health Research Program staff at 717-783-2548.
1. Grantee Institution: Lehigh University
2. Reporting Period (start and end date of grant award period): 1/1/2010-12/31/2013
3. Grant Contact Person (First Name, M.I., Last Name, Degrees): Xuanhong Cheng, PhD
4. Grant Contact Person’s Telephone Number: 610-758-2002
5. Grant SAP Number: 4100050899
6. Project Number and Title of Research Project: 1 - Development of a Point-of-Care Opto-
Fluidic HIV Viral Load Detector
7. Start and End Date of Research Project: 1/1/2010-12/31/2013
8. Name of Principal Investigator for the Research Project: Xuanhong Cheng, PhD
9. Research Project Expenses.
9(A) Please provide the total amount of health research grant funds spent on this project for
the entire duration of the grant, including indirect costs and any interest earned that was
spent:
$ 121,164.05
9(B) Provide the last names (include first initial if multiple individuals with the same last
name are listed) of all persons who worked on this research project and were supported with
health research funds. Include position titles (Principal Investigator, Graduate Assistant,
Post-doctoral Fellow, etc.), percent of effort on project and total health research funds
expended for the position. For multiple year projects, if percent of effort varied from year to
year, report in the % of Effort column the effort by year 1, 2, 3, etc. of the project (x% Yr 1;
z% Yr 2-3).

2
Last Name, First Name Position Title % of Effort on
Project
Cost
Hu, Yi Graduate Research
Assistant
50% in year 1 and
2
$14,000
Zhao, Chao Graduate Research
Assistant
50% in year 3 $17,000
Heinz, Keely Graduate Research
Assistant
50% in year 4 $20,500
9(C) Provide the names of all persons who worked on this research project, but who were not
supported with health research funds. Include position titles (Research Assistant,
Administrative Assistant, etc.) and percent of effort on project. For multiple year projects, if
percent of effort varied from year to year, report in the % of Effort column the effort by year
1, 2, 3, etc. of the project (x% Yr 1; z% Yr 2-3).
Last Name, First Name Position Title % of Effort on Project
Cheng, Xuanhong Principle Investigator 10% in year 1-4
Ou-yang, Daniel Co-PI 10% in year 1-2
Surawathanawises,
Krissada
Graduate Research Assistant 50% in year 3-4
9(D) Provide a list of all scientific equipment purchased as part of this research grant, a short
description of the value (benefit) derived by the institution from this equipment, and the cost
of the equipment.
Type of Scientific Equipment Value Derived Cost
None
10. Co-funding of Research Project during Health Research Grant Award Period. Did this
research project receive funding from any other source during the project period when it was
supported by the health research grant?
Yes___x_____ No____ ______
If yes, please indicate the source and amount of other funds:
NIH R21AI081638, $400,000

3
11. Leveraging of Additional Funds
11(A) As a result of the health research funds provided for this research project, were you
able to apply for and/or obtain funding from other sources to continue or expand the
research?
Yes_________ No____x______
If yes, please list the applications submitted (column A), the funding agency (National
Institutes of Health—NIH, or other source in column B), the month and year when the
application was submitted (column C), and the amount of funds requested (column D). If
you have received a notice that the grant will be funded, please indicate the amount of funds
to be awarded (column E). If the grant was not funded, insert “not funded” in column E.
Do not include funding from your own institution or from CURE (tobacco settlement funds).
Do not include grants submitted prior to the start date of the grant as shown in Question 2. If
you list grants submitted within 1-6 months of the start date of this grant, add a statement
below the table indicating how the data/results from this project were used to secure that
grant.
A. Title of research
project on grant
application
B. Funding
agency (check
those that apply)
C. Month
and Year
Submitted
D. Amount
of funds
requested:
E. Amount
of funds to
be awarded:
None NIH
Other federal
(specify:________
______________)
Nonfederal
source (specify:
_____________)
$ $
NIH
Other federal
(specify:________
______________)
Nonfederal
source (specify:
_____________)
$ $
11(B) Are you planning to apply for additional funding in the future to continue or expand
the research?
Yes___x______ No__________
If yes, please describe your plans:
R21 to NIH-NIAID under preparation.

4
12. Future of Research Project. What are the future plans for this research project?
The research team plans to apply for NIH grant to perform clinical evaluation.
13. New Investigator Training and Development. Did students participate in project
supported internships or graduate or post-graduate training for at least one semester or one
summer?
Yes____x_____ No__________
If yes, how many students? Please specify in the tables below:
Undergraduate Masters Pre-doc Post-doc
Male 2
Female 2
Unknown
Total 4
Undergraduate Masters Pre-doc Post-doc
Hispanic 0
Non-Hispanic 4
Unknown
Total 4
Undergraduate Masters Pre-doc Post-doc
White 1
Black
Asian 3
Other
Unknown
Total 4
14. Recruitment of Out-of–State Researchers. Did you bring researchers into Pennsylvania to
carry out this research project?
Yes_________ No_____x_____
If yes, please list the name and degree of each researcher and his/her previous affiliation:

5
15. Impact on Research Capacity and Quality. Did the health research project enhance the
quality and/or capacity of research at your institution?
Yes____x_____ No__________
If yes, describe how improvements in infrastructure, the addition of new investigators, and
other resources have led to more and better research.
The project facilitated researchers at Lehigh University to build the connection with
clinicians at the Lehigh Valley Hospital, thus it enhanced the quality of medical research at
Lehigh University.
16. Collaboration, business and community involvement.
16(A) Did the health research funds lead to collaboration with research partners outside of
your institution (e.g., entire university, entire hospital system)?
Yes_____x____ No__________
If yes, please describe the collaborations:
The project facilitated researchers at Lehigh University to build collaboration with clinicians
at the Lehigh Valley Hospital. Although no clinical tests were performed under the CURE
grant support, Dr. Friel from Lehigh Valley Hospital did consult for the project.
16(B) Did the research project result in commercial development of any research products?
Yes_________ No_____x_____
If yes, please describe commercial development activities that resulted from the research
project:
16(C) Did the research lead to new involvement with the community?
Yes_________ No____x______
If yes, please describe involvement with community groups that resulted from the
research project:
17. Progress in Achieving Research Goals, Objectives and Aims. List the project goals, objectives and specific aims (as contained in the grant agreement).
Summarize the progress made in achieving these goals, objectives and aims for the period

6
that the project was funded (i.e., from project start date through end date). Indicate whether
or not each goal/objective/aim was achieved; if something was not achieved, note the reasons
why. Describe the methods used. If changes were made to the research
goals/objectives/aims, methods, design or timeline since the original grant application was
submitted, please describe the changes. Provide detailed results of the project. Include
evidence of the data that was generated and analyzed, and provide tables, graphs, and figures
of the data. List published abstracts, poster presentations and scientific meeting presentations
at the end of the summary of progress; peer-reviewed publications should be listed under
item 20.
This response should be a DETAILED report of the methods and findings. It is not sufficient
to state that the work was completed. Insufficient information may result in an unfavorable
performance review, which may jeopardize future funding. If research findings are pending
publication you must still include enough detail for the expert peer reviewers to evaluate the
progress during the course of the project.
Health research grants funded under the Tobacco Settlement Act will be evaluated via a
performance review by an expert panel of researchers and clinicians who will assess project
work using this Final Progress Report, all project Annual Reports and the project’s strategic
plan. After the final performance review of each project is complete, approximately 12-16
months after the end of the grant, this Final Progress Report, as well as the Final Performance
Review Report containing the comments of the expert review panel, and the grantee’s written
response to the Final Performance Review Report, will be posted on the CURE Web site.
There is no limit to the length of your response. Responses must be single-spaced below,
no smaller than 12-point type. If you cut and paste text from a publication, be sure
symbols print properly, e.g., the Greek symbol for alpha () and beta (ß) should not
print as boxes () and include the appropriate citation(s). DO NOT DELETE THESE
INSTRUCTIONS.
The goal of this project is to create a novel, low-cost, globally deployable diagnostic device
capable of detecting viral loads in HIV patients. The three specific aims are
Specific Aim 1. To develop the microfluidic nano-filtration chip for viral sample processing.
Specific Aim 2. To design the optically forced cytometry and integrate it with the
microfluidics for fluorescent nanoparticle counting.
Specific Aim 3. Clinical evaluation of the optofluidic system using plasma samples from a
small feasibility cohort of HIV-infected patients.
The accomplishment to achieve these goals are summarized below.
1. Microfluidic nano-filtration chip for viral sample processing
Under this aim, microfluidic devices containing nanoporous membranes are fabricated
and used to purify and concentrate HIV viruses.
7
Methods:
The microfluidic device consists of three parts, two identical micro-channels with structure
shown in Fig. 1(a) and Fig. 1(b) made of polydimethylsiloxane (PDMS) on an SU8 mold,
and a polycarbonate membrane with pore size 20 nm. PDMS and toluene are mixed at 1:1
ratio, and used as a glue for bonding. Next, the inner surfaces of the channels are stamped
with the glue, and channels are aligned perpendicularly with the membrane sandwiched in
the middle (as shown in Fig. 1(c). The assembly is then baked overnight at 140C so that the
toluene evaporates. The bars in the channels serve as supporting bridges for the membrane,
and also to increase the bonding area. The assembled chamber is shown in Fig. 1(d).
Depending on the openings of the four ports, the direction of the flow in the chamber, either
perpendicular or tangential to the membrane, can be controlled. This device is used for
multiple purposes, viral purification, concentration and staining.
Figure 1. Microfluidic devices used for viral sample processing.
8
Alternatively, monolithic nanoporous devices are created by templating molding. Two templates
are used, leading to high aspect ratio nanopost arrays and interconnected nano-spherical pore
matrices (Figure 2). The nanopost array device in poly(methyl methacrylate) (PMMA) device is
fabricated by templating of anodic aluminum oxide (AAO) film of straight through pores.
Methyl methacrylate (MMA) monomer solution, containing 1% w/v PMMA granules and 1%
w/v benzoin methyl ether, is introduced into AAO nanopores under vacuum for 15 min. After
drying, the sample is attached to a PMMA substrate using the MMA solution as adhesive, and is
UV-polymerized for 30 min. Afterwards, AAO is etched and the resulting device is lyophilized
to ensure the standing PMMA nanoposts. Eventually the device is attached to a roof, sealed and
connected to tubing by epoxy glue.
The spherical pore device was fabricated by templating of 3D packing crystal of silica beads.
Polystyrene (PS) nanoparticles are co-deposited with 1m silica beads into a PDMS mold and
PS nanobeads are later melted at 240 °C for 10 min. Next, the sample is glued to a PS substrate
and detached from the PDMS mold. After etching the silica beads, the porous PS sample is
attached to a 25×8 mm2 PS top roof having inlet and outlet by thermal compression of 500 g at
140 °C for 40 min.
Results:
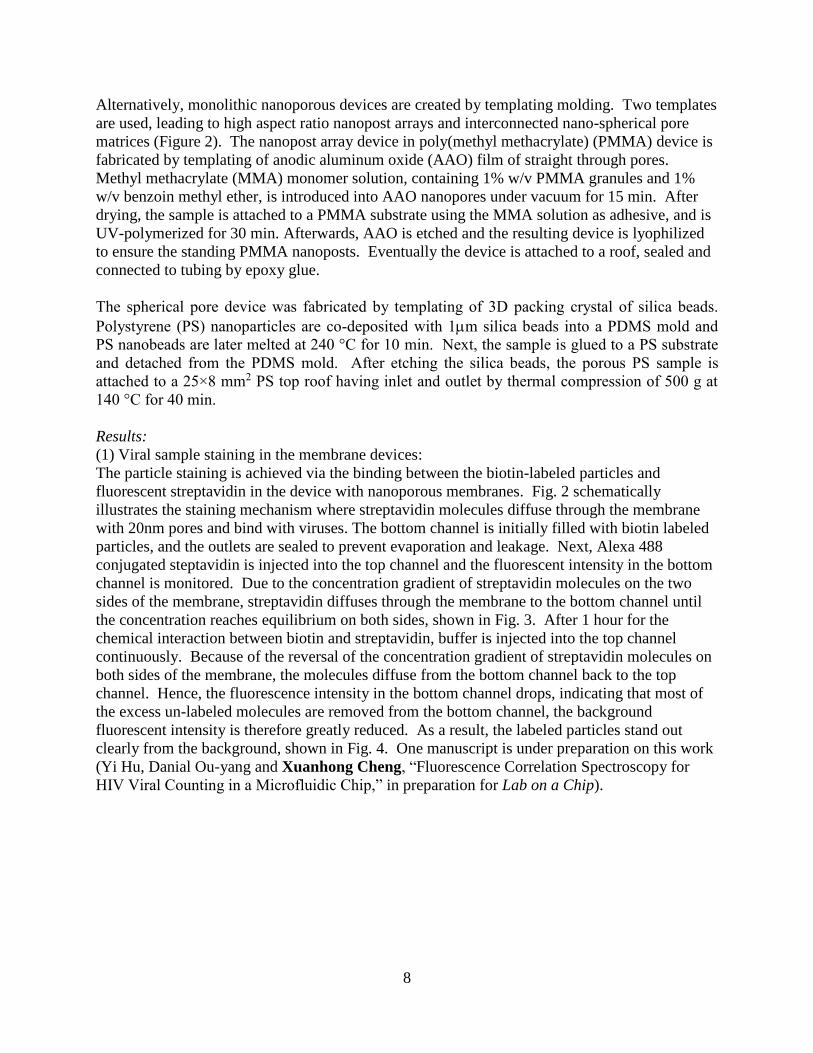
(1) Viral sample staining in the membrane devices:
The particle staining is achieved via the binding between the biotin-labeled particles and
fluorescent streptavidin in the device with nanoporous membranes. Fig. 2 schematically
illustrates the staining mechanism where streptavidin molecules diffuse through the membrane
with 20nm pores and bind with viruses. The bottom channel is initially filled with biotin labeled
particles, and the outlets are sealed to prevent evaporation and leakage. Next, Alexa 488
conjugated steptavidin is injected into the top channel and the fluorescent intensity in the bottom
channel is monitored. Due to the concentration gradient of streptavidin molecules on the two
sides of the membrane, streptavidin diffuses through the membrane to the bottom channel until
the concentration reaches equilibrium on both sides, shown in Fig. 3. After 1 hour for the
chemical interaction between biotin and streptavidin, buffer is injected into the top channel
continuously. Because of the reversal of the concentration gradient of streptavidin molecules on
both sides of the membrane, the molecules diffuse from the bottom channel back to the top
channel. Hence, the fluorescence intensity in the bottom channel drops, indicating that most of
the excess un-labeled molecules are removed from the bottom channel, the background
fluorescent intensity is therefore greatly reduced. As a result, the labeled particles stand out
clearly from the background, shown in Fig. 4. One manuscript is under preparation on this work
(Yi Hu, Danial Ou-yang and Xuanhong Cheng, “Fluorescence Correlation Spectroscopy for
HIV Viral Counting in a Microfluidic Chip,” in preparation for Lab on a Chip).

9
Figure 2. Illustration of the device operation mechanism through molecular diffusion
through a nanoporous membrane.
Figure 3. Time dependent fluorescence change in the bottom chamber of the device
indicates diffusion and elution of the fluorescence dye into the detection chamber.
10
Figure 4. A fluorescence image showing labeled viruses in the device.
(2) Viral sample purification and enrichment:
Viral purification and enrichment is achieved in two types of devices, the nanoporous membrane
devices and the nanoporous monolith. In the nanoporous monolith, we first optimized the
surface chemistries on different materials to form a monolayer of affinity proteins for virus
capture (Fig. 5). Next, we compared the virus capture efficiency in microchannels with and
without the nanoporous structures (Fig. 6). Without the nanostructures, a flatbed microchannel
captures minimal amount of viruses, due to the low concentration of viruses in biological fluids
and a corresponding low opportunity of virus collision with the functional surface. The two
nanostructured monoliths, on the other hand, increase the surface area by 4 orders of magnitude
in the same channel geometry. This greatly enhances the virus-surface collision and promotes
viral capture. As the viruses are specifically immobilized in the matrix and the non-specific
components are flushed out, the viruses are also concentrated and purified from contaminants in
the original sample. These facilitate downstream viral detection, since the presence of non-
specific nanoparticles creates high background for detection.
When the two monolithic nanostructures are compared, obvious differences were observed. The
two monoliths contain high aspect-ratio nanopost arrays and spherical interconnected nanopores,
respectively. Although they have comparable internal surface area, the nanopillar array has a
capture yield of ~100% from 400L of viral suspensions at a concentration of 1 million HIV
virions/mL. The monolith with spherical pores, on the other hand, captures only 70% of the HIV
virions. The sacrificed capture yield in the spherical pore materials can be explained by large
dead volumes. In our test condition, the Peclet number are much greater than 1, thus convection
dominates over diffusion. The particles mostly follow the streamlines, which concentrate around
the pore neck in the spherical pore structure, but are scarce away from the neck. As a result,
particles have a high collision rate with the wall near the pore neck only, but have little chance to
interact with the curved pore wall away from the neck. In the nanopillar device, the streamlines
distribute much more uniformly in all dimensions, as indicated by fluid dynamics simulations
using the COMSOL program (Fig. 7). This leads to more active capture area in the nano-pillar
device. In addition to the difference in active capture area, the capture yield in the spherical
devices is further compromised by the relatively high wall shear stress around the pore neck

11
compared to that on the surface of the nanopillars. The wall shear stress counteracts the affinity
binding and reduces initial interaction of viruses with the spherical pores. One manuscript is
under preparation about this work (Krissada Surawathanawises and Xuanhong Cheng,
“Monolithic microfluidic chips for processing of HIV viruses in plasma,” in preparation for
Analytical Chemistry).
Figure 5. Virus binding on PMMA and PS functionalized by different amount of
streptavidin. Coating poly(methyl methacrylate) (PMMA) with 20g/mL streptavidin
yields similar virus binding as coating polystyrene (PS) with 10g/mL streptavidin.
Figure 6. Comparison of virus binding in flatbed and nanoporous microfluidic devices.
Significantly enhanced capture happens in nanoporous devices, especially the devices
with nanopost arrays. PMMA: poly(methyl methacrylate). PS: polystyrene.

12
Figure 7. Fluid dynamics simulations of streamlines in nanopost array and nanospherical
pore matrices using the COMSOL program.
The monolith nanostructured materials have only one characteristic dimension, which is
comparable to the size of viruses. Thus they can be clogged when large size contaminants exist
in the original viral sample. To process more complicated mixture of viruses, we fabricated
another type of device based on the concept of nanofiltration. This device contains a nanoporous
membrane sandwiched between two PDMS channels. The membrane is functionalized with
affinity molecules to specifically isolate target viruses. To prevent membrane clogging, we
operate the device in a tangential flow mode: a shear flow tangential to the membrane reduces
cake formation, while a through-membrane flow drives viral particles to the functional surface
for their capture. The relative fraction flowing tangential and through the membranes are
controlled by resistance channels connected to the tangential fraction. In our preliminary tests,
the resistance channel is selected to allow 20% tangential flow and 80% filtration. The capture
yield on the membrane is not only controlled by the filtration fraction, but also the sample flow
rate (Fig. 8). When the flow rate is low, non-specific binding from the sample could coat the
membrane and prevent the interaction between target viruses and the affinity coating. On the
other hand, specific interactions are interrupted at high flow rates or great wall shear stress. The
optimized flow rate was identified that corresponds to a wall shear stress of ~2dyne/cm2 on the
membrane. The capture yield is ~60% at the optimal flow rate. In contrast, minimal capture
happens when the device is a simple flat bed channel. Although the capture in the membrane
device is less than the fraction transported through the membrane, the capture yield holds for
suspensions containing different concentration of virions. As the viruses are confined in a small
volume in the device, the effective concentration is enhanced by two orders of magnitude
through the filtration process. One manuscript is under preparation about this work (Keely
Heintz and Xuanhong Cheng, “Microfilturation devices for HIV separation and enrichment” in
preparation for Biomicrofluidics).
SphericNanopost

13
Figure 8. Capture of HIV virus in nanofiltration devices.
2. Optically force cytometry for fluorescent microparticle counting
An optical setup is constructed to concentrate and enumerate nanoparticles. Theories are
developed to predict the concentration factor.
As one of the most sensitive techniques to detect molecules and nanoparticles, fluorescence
correlation spectroscopy (FCS) has been applied by several groups to directly measure both the
dynamics and the statistics information of fluorescently labeled species. The statistics
characterized by the zero-time autocorrelation opens the area of low concentration detection of
dilute bio-molecules. However, the sensitivity of FCS is not enough to detect concentration of
bionanoparticles such as viruses in their native environment. Recently, optical trapping has been
shown to be an effective approach to enhance nanoparticle concentration. A highly focused laser
beam creates a gradient potential with Gaussian profile. The trapping energy characterizes the
depth of the potential well and is related to the size of trapped particles as well as the refractive
index difference between the medium and particle. For colloid particles of size much smaller
than the laser wavelength, the trapping energy is on the same order as the thermal energy at
ambient temperature. Thus, many nanoparticles can be transiently confined in the optical
potential well, achieving significant concentration enhancement. Here, we combine FCS with
optical trapping and establish a relationship between the target concentration inside the trap and
in the ambient for nanoparticle enumeration.
Methods:
The schematic of the optical apparatus that combines FCS and optical trapping is illustrated in
Figure 9. Here, an IR laser (1064 nm, TREM-C1, Spectra-Physics) is used for trapping
fluorescent nanoparticles and a blue laser (488 nm, FV-1000, Olympus) is used for fluorescence
excitation. A half-wave plate and a polarization beam splitter are used for adjusting the power of
the trapping laser. The power of the 488 nm excitation laser at the focal point is kept at a low
and constant power of 5 µW to minimize photo bleaching. The trapping and excitation beams

14
are combined by a dichroic mirror and aligned confocally at the detection point. A microscope
objective lens (UPlanFluor 100X, NA 1.3, Olympus, Japan) is used to focus the laser beams and
to collect the emitted fluorescence. The fluorescence emission passing a band-pass filter and a
beam splitter is detected by two photon-counting avalanche photo diodes (APD) (SPCM-AQRH-
13-FC, Perkin Elmer). To minimize the adverse effects due to dark count noises intrinsic to
APDs and to enhance the S/N ratio, the autocorrelation function G(τ) is obtained from cross-
correlation of the APD outputs by the use of a digital correlator (Flex02-01D, Correlator.com,
USA). The geometrical parameters of the FCS detection volume are determined by using a 10
nM solution of Alexa 488 dye. Using the known diffusivity of Alexa 488 molecules in water
(430 µm2/s) in fitting Eq. 2 to autocorrelation function (ACF), the radial dimension (beam waist)
w0 and the axial dimension z0 of the FCS detection volume are determined to be 0.22 µm and 2
µm, respectively.
Figure 9. Illustration of the experiment apparatus.
Results:
The ACF G(τ) from 110 nm PS nanoparticle suspensions are shown in Fig. 10(a) using trapping
laser powers between 0 and 16mW. Each autocorrelation function (ACF) curve represents an
average of 10 independent measurements. Fitting Eq. 2 to the trap-free (0 mW) curve yields a
particle number density <N0> = 0.165 in the observation volume and diffusivity D = 4.5 µm2/s.
The measured diffusivity is in reasonable agreement with that obtained by the Stokes-Einstein
equation D = kBT/(6a) = 4.35µm2/s, where is the viscosity of water at the ambient
temperature and a is the particle radius.
In the presence of the optical trap, the average number of particles in the trap can be determined
independently by total photon counts: <Ntrap> = <Ftrap>/. Here, is the average fluorescence
luminosity per particle at fixed excitation light intensity, and can be determined by the ratio
<F0>/G(0)-10, where <F0> is the average fluorescence photon counts at zero trapping laser
power, and G(0)-1 at zero trapping laser power is equal to the mean number of particle in the FCS
observation volume. Fig. 10(b) shows a plot of G(0)-1trap vs. <Ntrap>. The linearity in Fig. 10(b)
with a slope of 1 suggests G(0)-1trap equals the average number of particles in the presence of
optical trapping for all trapping powers tested here up to 18mW. A semi-log plot of G(0)-
1trap/G(0)-1
0 vs. the power of trapping laser is shown in Fig. 10(c). Since G(0)-1trap/G(0)-

15
10=<Ntrap>/<N0>, Fig. 10(c) implies the number of particles in the optical trap follows a
Boltzmann distribution with the trapping potential:
⟨𝑁𝑡𝑟𝑎𝑝⟩ = ⟨𝑁0⟩𝑒𝑥𝑝(𝑈𝑡𝑟𝑎𝑝 𝑘𝐵𝑇⁄ )
Where Utrap, the average trapping potential in the FCS illumination volume, is the slope of the
semi-log plot in Fig. 10(c). The Boltzmann distribution is understandable since the particles
have negligible interaction in the suspension. The trapping energy of 110 nm PS spheres is
found to be 0.1 ± 0.04 kBT per mW of laser.
Fig. 10(d) shows a constant ratio of G(0)trap-1/<Ntrap> =1 for trapping potential energies up to 1.8
kBT, suggesting our experimental result agrees with the theoretical prediction by Meng et al.
Figure 10. (a) Fluorescence correlation spectroscopy (FCS) autocorrelation functions of
0.01% (v/v) 110 nm polystyrene (PS) particle suspensions at selected trapping laser
powers. Each curve represents an average of 10 measurements. (b) G(0)-1trap from 10(a) is
found to increase linearly with <Ntrap> measured by <Ftrap>/ε; the dashed line is a fit
with slope = 1 and intercept = 0. (c) Semi-natural log plot of G(0)-1trap/G(0)-1
0 vs. the
trapping power suggests the average number of particles in the optical trap follows a
Boltzmann distribution. (d) G(0)trap-1/<Ntrap>≈1 for trapping energies up to 1.8 kBT.
To examine to what the relationship <Ntrap> = 1/G(0) can be used to describe ACFs for particles
in an optical trap, we plot the same data in Fig. 10(a) along with fitting curves for various
trapping energies, 0 kBT (0 mW), 0.6 kBT (6 mW), 1.2 kBT (12 mW) and 1.6 kBT (16 mW), in
Fig. 11. The excellent match between prediction and the experimental ACF data suggests that
the conventional ACF can be used to interpret the behavior of nanoparticles in a potential well up
to 1.8 kBT. This range exceeds the one predicted by Ito et al. through Brownian dynamic
simulation, where the conventional theory is only applicable with trapping energies up to 1 kBT.
The upper range of trapping energy used in this is study is limited by the optical setup, and
conventional theory could potentially describe nanoparticle concentration in even deeper
potential wells.

16
Figure 11. The experimental autocorrelation function curves (black) are fitted using Eq.
(2) (red) for trapping laser powers of (a) 0 mW (b) 6 mW; (c) 12 mW; (d) 16 mW.
An SEM image, fluorescence micrography and FCS autocorrelation curve of the VLPs
suspended in culture medium are shown in Fig. 12. Fitting the curve by conventional theory, the
ACF yields a diffusion coefficient 3.79 µm2/s. Using the Stokes-Einstein equation
D=kBT/(6a) and medium viscosity =0.98 cP, the diameter of the VLPs is found to be 115
14 nm (average and standard deviation from 10 independent measurements), consistent with
results obtained by SEM.
Figure 12. (a) A scanning electron microscope image of one viral like particle (VLP).
Diameter of the particles is measured to be 11011 nm. (b) A fluorescent image of VLPs
under 100X objective. (c) Autocorrelation curve of VLPs in culture medium from which
a hydrodynamic size of 11514 nm is obtained. All standard deviation represents 10
independent measurements.

17
Next, we then determine the trapping potential of VLPs. Selected ACF curves for different laser
powers are shown in Fig. 13(a). A semi-nature log plot of G(0)-1 vs. trapping laser power is
shown in Fig. 13(b). For buffer solutions such as PBS containing 135 mM NaCl, the Debye
screening length is on the order of single nanometer. Since the estimated average distance
between two VLPs in our experiments is more than 1 µm, particle interactions can be neglected,
and the number of particles in the optical trap follows Boltzman distribution. A semi-nature log
plot of the average number of particles vs. the trapping power is shown in Fig. 13(b). The
trapping energy for the VLPs is calculated to be 0.02 ± 0.003 kBT per mW.
The trapping energy for VLPs is significantly smaller than that for PS particles of a comparable
size likely due to their hollow structure. VLPs have a hollow core surrounded by capsid proteins
and a thin shell of phosphor lipid bilayer. To illustrate the difference, we use a discrete dipole
approximation method to numerically calculate the optical trapping energy. For the 110 nm
diameter PS spheres (refractive index 1.59) in water, the calculated trapping energy is 0.13
kBT/mW. VLPs were modeled as vesicles with 100 nm inner diameter and 10 nm lipid bilayer
(refractive index 1.46). The calculated trapping energy is 0.017 kBT/mW. Although the VLPs
also contain a capsid and nucleocapsid, the lipid bilayers seems to play a dominant role in their
trapping energy. This work has also been published (Y. Hu, X. Cheng and D. Ou-yang,
Fluorescence Correlation Spectroscopy Analysis of Nanoparticles in an Optical Trap.
Biomedical Optics Express, 2013. 4(9): p. 1646-1653).
Figure 13. (a) Selected autocorrelation function curves of viral like particles in culture
medium at different trapping laser power. (b) a semi-log plot of the average number of
particles in the observation volume vs. the trapping laser power. The slope of the fit (red
solid line) yields a trapping energy per particle of 0.02 kBT per mW of laser power.
18
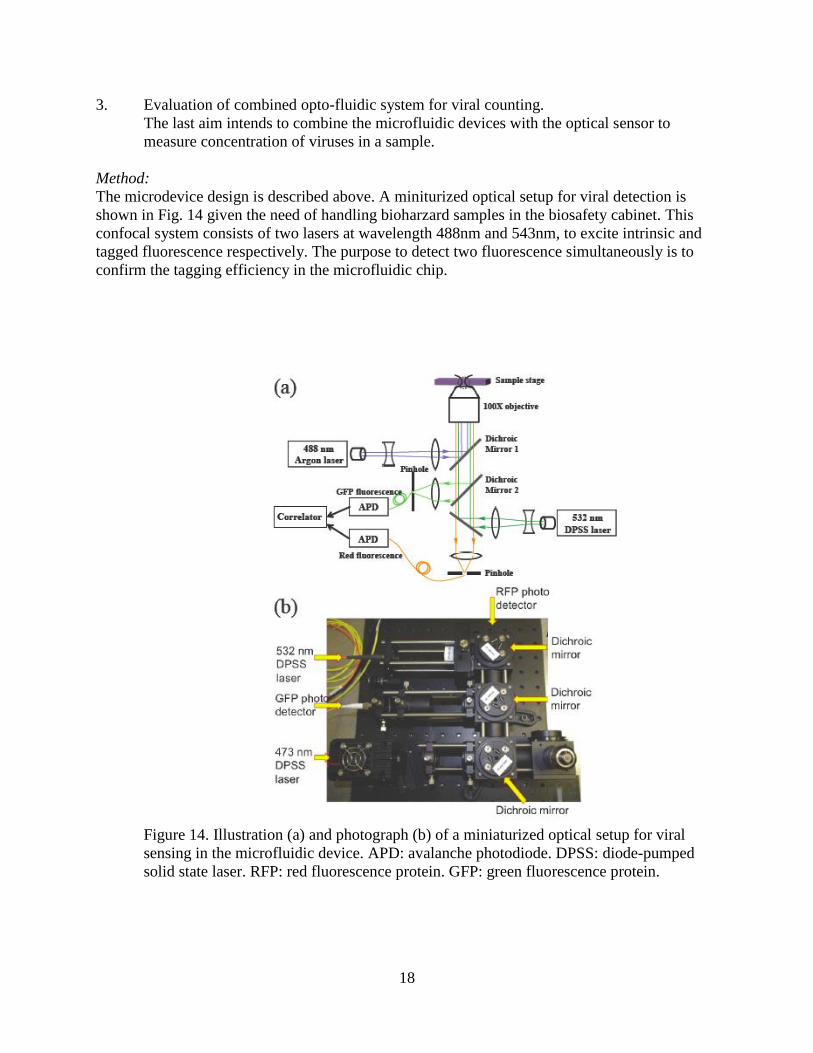
3. Evaluation of combined opto-fluidic system for viral counting.
The last aim intends to combine the microfluidic devices with the optical sensor to
measure concentration of viruses in a sample.
Method:
The microdevice design is described above. A miniturized optical setup for viral detection is
shown in Fig. 14 given the need of handling bioharzard samples in the biosafety cabinet. This
confocal system consists of two lasers at wavelength 488nm and 543nm, to excite intrinsic and
tagged fluorescence respectively. The purpose to detect two fluorescence simultaneously is to
confirm the tagging efficiency in the microfluidic chip.
Figure 14. Illustration (a) and photograph (b) of a miniaturized optical setup for viral
sensing in the microfluidic device. APD: avalanche photodiode. DPSS: diode-pumped
solid state laser. RFP: red fluorescence protein. GFP: green fluorescence protein.

19
Results:
Labeling and preprocessing of viral particles are performed in microfluidic devices as described
above. The particle concentration is then determined by fluorescence correlation spectroscopy
(FCS). In FCS, the event rate for particle occurrence in the detection volume can be described
as:
dNs / dt = 4 w0 D c NA
where w0 is the beam waist of the observation volume, D is the diffusion coefficient of the
species, c is the concentration in molarity and NA is the Avogadro constant. To measure low
species concentration, one can either elongate the sampling time, or enlarge sample volume by
changing to a lower NA objective. Since the observation volume Veff scales proportionally to
1/NA4, changing objectives, for example, from NA = 1.3 to 0.6 would increase the observation
volume by a factor of 22, thus decrease the limit of FCS concentration range by the same order.
However, the trade-off is the signal-to-noise ratio (S/N) decreases with the numerical aperture,
which would lead to an overestimation of the number density. To account for the noise, the
measured correlation function amplitude G(0) is scaled by <F (t)>2 / <F (t)> - FBG, where FBG is
the average background photocount. In this experiment, a dry objective with NA = 0.6 is used.
The particles are coated with biotin, and have intrinsic green fluorescence with excitation at
488nm. The dye molecules Alexa 546 are conjugated with streptavidin molecules which bind
steadily with biotin once they are less than 20 nm apart and would emit fluorescence with the
excitation at 543 nm. The photocount signal and the FCS autocorrelation function of particles
before and after staining is shown in Fig. 15(a). The black curve in Fig. 15(b) shows the ACF of
the original fluorescence from the particle before staining, while the red curve shows the ACF of
the signal from dye molecules after the staining and dialysis process. The two curves show good
agreement.

20
Figure 15(a). Photocount signal after virus staining in the microdevice. (b) FCS
correlation curves from intrinsic and labeled fluorescence signals.
Next, a serial dilution of the biotin labeled particles is prepared, stained in the device
described before, and measured via FCS. Fig. 16 shows that the signal before staining (black
circles) and after staining (blue squares) changes linearly with the number density of the
particles suspension. A linear relation is observed in Fig. 16 confirms that devices are
capable of the staining and enumeration of viral particles. This work is currently under
preparation for a manuscript (Yi Hu, Danial Ou-yang and Xuanhong Cheng, “Fluorescence
Correlation Spectroscopy for HIV Viral Counting in a Microfluidic Chip,” in preparation for
Lab on a Chip).
(a)
(b)

21
Figure 16. Particle number density measured from intrinsic and labeled fluorescence
signals.
List of published abstracts, poster presentations and scientific meeting presentations:
Yi Hu, Joe Junio, Xuanhong Cheng and Daniel Ou-yang, “Fluorescence Correlation
Spectroscopy in an Optical Trap (oral),” Conference on Lasers and Electro Optics 2010
Spring Annual Meeting, San Jose, CA, May 16-21, 2010.
Yi Hu, Daniel Ou-yang, Xuanhong Chneg, “Optically Forced Cytometry for Bio-nano-
particle Enumeration (poster),” Biomedical Engineering Society Annual Fall Meeting,
Austin, TX, Oct. 6-9, 2010.
Krissada Surawathanawises, Xuanhong Cheng, “Nanoporous Polyethylene Glycol Filtration
Membranes Fabricated by Double Templating,” Materials Research Society Annual Fall
Meeting, Boston, MA, Nov 29-Dec 3, 2010.
Yi Hu, Daniel Ou-yang, Xuanhong Cheng, “Whole Particle HIV Counting by Fluorescence
Correlations Spectroscopy (poster),” Biomedical Engineering Society Annual Fall Meeting,
Hartford, CT, Oct. 12-15, 2011
18. Extent of Clinical Activities Initiated and Completed. Items 18(A) and 18(B) should be
completed for all research projects. If the project was restricted to secondary analysis of
clinical data or data analysis of clinical research, then responses to 18(A) and 18(B) should
be “No.”

22
18(A) Did you initiate a study that involved the testing of treatment, prevention or
diagnostic procedures on human subjects?
______Yes
__x____No
18(B) Did you complete a study that involved the testing of treatment, prevention or
diagnostic procedures on human subjects?
______Yes
___x___No
If “Yes” to either 18(A) or 18(B), items 18(C) – (F) must also be completed. (Do NOT
complete 18(C-F) if 18(A) and 18(B) are both “No.”)
18(C) How many hospital and health care professionals were involved in the research
project?
______Number of hospital and health care professionals involved in the research
project
18(D) How many subjects were included in the study compared to targeted goals?
______Number of subjects originally targeted to be included in the study
______Number of subjects enrolled in the study
Note: Studies that fall dramatically short on recruitment are encouraged to
provide the details of their recruitment efforts in Item 17, Progress in Achieving
Research Goals, Objectives and Aims. For example, the number of eligible
subjects approached, the number that refused to participate and the reasons for
refusal. Without this information it is difficult to discern whether eligibility
criteria were too restrictive or the study simply did not appeal to subjects.
18(E) How many subjects were enrolled in the study by gender, ethnicity and race?
Gender:
______Males
______Females
______Unknown
Ethnicity:
______Latinos or Hispanics
______Not Latinos or Hispanics
______Unknown
Race:
______American Indian or Alaska Native
______Asian

23
______Blacks or African American
______Native Hawaiian or Other Pacific Islander
______White
______Other, specify:
______Unknown
18(F) Where was the research study conducted? (List the county where the research
study was conducted. If the treatment, prevention and diagnostic tests were offered in
more than one county, list all of the counties where the research study was
conducted.)
19. Human Embryonic Stem Cell Research. Item 19(A) should be completed for all research
projects. If the research project involved human embryonic stem cells, items 19(B) and
19(C) must also be completed.
19(A) Did this project involve, in any capacity, human embryonic stem cells?
______Yes
___x___ No
19(B) Were these stem cell lines NIH-approved lines that were derived outside of
Pennsylvania?
______Yes
______ No
19(C) Please describe how this project involved human embryonic stem cells:
20. Articles Submitted to Peer-Reviewed Publications.
20(A) Identify all publications that resulted from the research performed during the funding
period and that have been submitted to peer-reviewed publications. Do not list journal
abstracts or presentations at professional meetings; abstract and meeting presentations should
be listed at the end of item 17. Include only those publications that acknowledge the
Pennsylvania Department of Health as a funding source (as required in the grant
agreement). List the title of the journal article, the authors, the name of the peer-reviewed
publication, the month and year when it was submitted, and the status of publication
(submitted for publication, accepted for publication or published.). Submit an electronic
copy of each publication or paper submitted for publication, listed in the table, in a PDF
version 5.0.5 (or greater) format, 1,200 dpi. Filenames for each publication should include
the number of the research project, the last name of the PI, and an abbreviated title of the
publication. For example, if you submit two publications for Smith (PI for Project 01), one
publication for Zhang (PI for Project 03), and one publication for Bates (PI for Project 04),
the filenames would be:
Project 01 – Smith – Three cases of isolated
Project 01 – Smith – Investigation of NEB1 deletions

24
Project 03 – Zhang – Molecular profiling of aromatase
Project 04 – Bates – Neonatal intensive care
If the publication is not available electronically, provide 5 paper copies of the publication.
Note: The grant agreement requires that recipients acknowledge the Pennsylvania
Department of Health funding in all publications. Please ensure that all publications listed
acknowledge the Department of Health funding. If a publication does not acknowledge the
funding from the Commonwealth, do not list the publication.
Title of Journal
Article:
Authors: Name of Peer-
reviewed
Publication:
Month and
Year
Submitted:
Publication
Status (check
appropriate box
below):
1. Enumerating
virus-like particles in
an optically
concentrated
suspension by
fluorescence
correlation
spectroscopy
Yi Hu, Xuanhong
Cheng and Daniel
Ou-Yang
Biomedical
Optics Express
May, 2013 Submitted
Accepted
Published
20(B) Based on this project, are you planning to submit articles to peer-reviewed publications
in the future?
Yes____x_____ No__________
If yes, please describe your plans:
Four journal publications are under preparation:
1. Yi Hu, Danial Ou-yang and Xuanhong Cheng, “Fluorescence Correlation
Spectroscopy for HIV Viral Counting in a Microfluidic Chip,” in preparation for
Lab on a Chip.
2. Keely Heintz and Xuanhong Cheng, “Microfilturation devices for HIV separation
and enrichment” in preparation for Biomicrofluidics.
3. Krissada Surawathanawises and Xuanhong Cheng, “Monolithic microfluidic
chips for processing of HIV viruses in plasma,” in preparation for Analytical
Chemistry.
4. Chao Zhao, Alparsian Oztekin and Xuanhong Cheng, “Viral-antibody binding
assays using microscale thermphoresis,” in preparation for Biophysical Journal.
21. Changes in Outcome, Impact and Effectiveness Attributable to the Research Project.
Describe the outcome, impact, and effectiveness of the research project by summarizing its
impact on the incidence of disease, death from disease, stage of disease at time of diagnosis,

25
or other relevant measures of outcome, impact or effectiveness of the research project. If
there were no changes, insert “None”; do not use “Not applicable.” Responses must be
single-spaced below, and no smaller than 12-point type. DO NOT DELETE THESE
INSTRUCTIONS. There is no limit to the length of your response.
The research provides a prototypic platform for fast viral load analysis at resource limited
settings. It holds a potential to change HIV viral detection at the point of care, thus
benefiting diagnosis of HIV infection and monitoring of anti-retroviral treatment in
developing countries.
22. Major Discoveries, New Drugs, and New Approaches for Prevention Diagnosis and
Treatment. Describe major discoveries, new drugs, and new approaches for prevention,
diagnosis and treatment that are attributable to the completed research project. If there were
no major discoveries, drugs or approaches, insert “None”; do not use “Not applicable.”
Responses must be single-spaced below, and no smaller than 12-point type. DO NOT
DELETE THESE INSTRUCTIONS. There is no limit to the length of your response.
Materials and devices are developed and optimized in this research to purify and concentrate
HIV viruses. Optical sensors are demonstrated to enumerate nanoparticles in a sensitive and
time-efficient fashion. These components are key modules to build a point-of-care viral
detector for the diagnosis of HIV viral load.
23. Inventions, Patents and Commercial Development Opportunities.
23(A) Were any inventions, which may be patentable or otherwise protectable under Title 35
of the United States Code, conceived or first actually reduced to practice in the performance
of work under this health research grant? Yes x No
If “Yes” to 23(A), complete items a – g below for each invention. (Do NOT complete items
a - g if 23(A) is “No.”)
a. Title of Invention: Opto-fluidic Nanoparticle Detection Apparatus
b. Name of Inventor(s): Daniel Ou-yang, Xuanhong Cheng and Yi Hu
c. Technical Description of Invention (describe nature, purpose, operation and physical,
chemical, biological or electrical characteristics of the invention):
This invention involves two components. The first component is a microfluidic chip
with embedded nanoporous membranes to process virion containing plasma. This
chip will contain a pre-filtration element that separates target nano-particles from
other larger particles in the original plasma sample. Purified viral suspension will
then be concentrated through mechanical nanofiltration to strain the plasma, while
retain virions in a suspended state in a controlled small volume above the membrane.
The microfluidic viral concentrator will also be used to label target particles by

26
diffusing fluorescently labeled antibodies through the nanoporous membrane. The
second component of the invention is an optical trap and a confocal fluorescence
intensity detector integrated with the concentration chamber in the microfluidic chip.
The optical trap generated by an IR laser will further concentrate the target particles.
As the normalized change of the fluorescent intensity (ratio of the fluorescent
intensity after applying the optical trap vs. before) at the focus of the optical trap is
directly proportional to the initial target particle concentration, but insensitive to the
absolute intensity of the particles, it will be used to quantify viral concentration. This
intensity ratio will be measured by focusing a separate, visible laser beam at the
center of the optical trap and the fluorescence emission light will be detected
confocally by a photomultiplier (PMT).
d. Was a patent filed for the invention conceived or first actually reduced to practice in
the performance of work under this health research grant?
Yes x No
If yes, indicate date patent was filed: Mar. 2, 2009
e. Was a patent issued for the invention conceived or first actually reduced to practice in
the performance of work under this health research grant?
Yes x No
If yes, indicate number of patent, title and date issued:
Patent number: 2009, PCT/US09/35683
Title of patent: Opto-fluidic Nanoparticle Detection Apparatus
Date issued: Apr. 14, 2011
f. Were any licenses granted for the patent obtained as a result of work performed under
this health research grant? Yes No x
If yes, how many licenses were granted?
g. Were any commercial development activities taken to develop the invention into a
commercial product or service for manufacture or sale? Yes No x
If yes, describe the commercial development activities:
23(B) Based on the results of this project, are you planning to file for any licenses or patents,
or undertake any commercial development opportunities in the future?
Yes___x______ No__________
If yes, please describe your plans:
Lehigh University Technology Transfer Office is helping to identify partners to license the
patent and commercialize the technology from this research.

27
24. Key Investigator Qualifications. Briefly describe the education, research interests and
experience and professional commitments of the Principal Investigator and all other key
investigators. In place of narrative you may insert the NIH biosketch form here; however,
please limit each biosketch to 1-2 pages. For Nonformula grants only – include information
for only those key investigators whose biosketches were not included in the original grant
application.

28
Program Director/Principal Investigator (Last, First, Middle): Cheng, Xuanhong
BIOGRAPHICAL SKETCH
NAME
Xuanhong Cheng
POSITION TITLE
Assistant Professor
Bioengineering
Lehigh University
eRA COMMONS USER NAME (credential, e.g., agency login)
CHENGXU
EDUCATION/TRAINING (Begin with baccalaureate or other initial professional education, such as nursing, and include postdoctoral training.)
INSTITUTION AND LOCATION DEGREE
(if applicable) YEAR(s) FIELD OF STUDY
Wuhan University, Wuhan, China B.S. 1998 Biology
University of Washington, Seattle, WA Ph.D. 2004 Bioengineering
Research Fellow, Massachusetts General Hosp.
/ Harvard Medical School, Boston MA
2005-2007 Bio-MEMS,
Biomedicine
A. Personal Statement
My research is focused on creating microfluidic platforms for diagnosis of infectious and
probing the fundamental cell behavior.
B. Positions and Honors
Positions and Employment
1999 – 2004 Research Assistant, University of Washington, Seattle, WA
2005 – 2007 Research Fellow, Massachusetts General Hosp. / Harvard Medical School,
Boston MA
2008 – now Assistant Professor, Materials Science and Engineering / Bioengineering,
Lehigh University, Bethlehem, PA
Selected Honors
1995 – 1998 Renmin Fellowship, Wuhan University, Wuhan China
2004 Society For Biomaterials 2004 Student Award for Outstanding Research (Ph.D.
category), 7th World Biomaterials Congress, Sydney, Australia
2004 Outstanding Graduate Female of Society of Women Engineers, University of
Washington
2007 Poster of Distinction Travel Award, Massachusetts General Hospital Scientific
Advisory Board, Boston, MA
2008 Young Investigator Award, 15th Conference on Retroviruses and Opportunistic
Infections, Boston MA, 2008
C. Selected peer-reviewed publications (in reverse chronological order).
1. Yi Hu, Xuanhong Cheng and Daniel Ou-yang, “Fluorescence Correlation Spectroscopy
Analysis of Nanoparticles in an Optical Trap,” Biomedical Optics Express, 4(9): p. 1646-
1653 (2013).
2. Chao Zhao, Alp Oztekin, and Xuanhong Cheng, “Gravity-induced swirl of nanoparticles in
microfluidics,” Journal of Nanoparticle Research, 15(5), 1611-1615 (2013).

29
3. Shuhan Wu, Kuangli Lee, Arther Chiou, Peikun Wei and Xuanhong Cheng, “Optofluidic
Platform for Real-Time Monitoring of Live Cell Secretory Activities Using Fano Resonance
in Gold Nanoslits,” Small, DOI: 10.1002/smll.201203125 (2013).
4. Yongkang Gao, Zheming Xin, Beibei Zeng, Qiaoqiang Gan, Xuanhong Cheng and Filbert J.
Bartoli, “Plasmonic interferometric sensor arrays for high-performance label-free
biomolecular detection,” Lab on a Chip, DOI: 10.1039/C3LC50863C (2013)
5. Chao Zhao and Xuanhong Cheng, “Microfluidic Separation of Viruses from Blood Cells
Based on Intrinsic Transport Processes,” Biomicrofluidics, 5(3), 032004_01-10 (2011)
6. Bu Wang, Alex Weldon, Pisist Kumnorkaew, Bu Xu, James F. Gilchrist and Xuanhong
Cheng,“Effect of Surface Nanotopography on Immunoaffinity Cell Capture in Microfluidic
Devices,” Langmuir, 27(17), 11229-11237 (2011).
Patent Applications
1. Buddy D. Ratner, Xuanhong Cheng, Yanbing Wang, Yael Hanein, Ashutosh Shastry and
Karl F. Böhringer, “Apparatus and Methods for Binding Molecules and Cells,” filed, OTL
Ref. No.'s 2061-3773-4435PT (U.S.) & 2061-3773-4437PT (PCT), Jul. 30, 2003.
2. Mehmet Toner, William Rodriguez, Xuanhong Cheng, Daniel Irimia, Meredith Dixon,
Kazuhiko Sekine, Utkan Demirci, Lee Zamir, Ronald G. Tompkins, “A Microfluidic Chip
for CD4+ T Cell Count Based on Flow Assisted Cell Affinity Isolation,” US patent filed,
March 15, 2006, US patent application No. 60/782,470
3. Murat Tunc, Xuanhong Cheng, Buddy D. Ratner, Ellis Meng and Mark Humayun,
“Reversible Attachment of Retinal Implants, Other Implants and Drug Delivery Devices,”
US patent filed, November 29, 2007, US patent application No. 60/867,668
4. Rashid Bashir, Mehmet Toner, Xuanhong Cheng, William Rodriguez, “Methods for
Detecting Cells and Other analytes,” US patent filed, September 15, 2008, US patent
application No. 12/293,046
5. Daniel Ouyang and Xuanhong Cheng, “Opto-fluidic Nanoparticle Detection Apparatus,” US
patent PCT Pub. No. WO2009/108921, PCT Pub. No. WO2009/108921.

30
Program Director/Principal Investigator (Last, First, Middle): Ou-yang, Daniel
BIOGRAPHICAL SKETCH
NAME
H. Daniel Ou-Yang
POSITION TITLE
Professor of Physics
Lehigh University eRA COMMONS USER NAME (credential, e.g., agency login)
OU-YANGD
EDUCATION/TRAINING (Begin with baccalaureate or other initial professional education, such as nursing, and include postdoctoral training.)
INSTITUTION AND LOCATION DEGREE
(if applicable) YEAR(s) FIELD OF STUDY
Fu-Jen Catholic University BS 1971-75 Physics
Fu-Jen Catholic University MS 1975-77 Physics
UCLA Ph.D. 1979-85 Physics
A. Positions and Honors.
Positions and Employment
1975-77 Teaching Assistant, Fu-Jen Catholic University, Taipei, Taiwan
1977-79 Second Lieutenant, Military Service, Taiwan
1979-81 Teaching Assistant, Physics Department, UCLA, CA
1981-85 Research Associate, Chemistry Department, UCLA, CA
1985-88 Postdoctoral Fellow, Physics Department, University of Pennsylvania, PA
1988-94 Assistant Professor of Physics, Lehigh University, Bethlehem, PA
1994-2000 Associate Professor of Physics, Lehigh University, PA
1999-2000 Visiting Research Scientist, Dynamics of Complex Fluids Laboratory, CNRS,
Strasburg, France
2000- now Professor of Physics, Lehigh University
Other Experience and Professional Memberships
1999-2000 Visiting Research Scientist, Dynamics of Complex Fluids Laboratory, CNRS,
Strasburg, France
2002-2004 Co-Director, Bioengineering Program, Lehigh University
2004-now Associate Director, Bioengineering Program, Lehigh University
2008 Visiting Research Scientist, Hong Kong University of Science and Technology,
Hong Kong
2008 Visiting Research Scientist, National Taiwan University, Taipei, Taiwan
2008 Visiting Research Scientist, Korea Advanced Institute of Science and
Technology, Korea
Elected Position and Professional Memberships and Affiliations:
President, Lehigh University Chapter of Sigma Xi, The Scientific Research Society 2002-03
Member, American Physical Society, 1985 – now
Member, SPIE, International Society of Optical Engineers, 2002- now
Member, Project Kaleidoscope Faculty for the 21st Century
Member, Overseas Chinese Physicists Organization 1987 – now

31
Member, Phi Beta Delta, International Honorary Society, Beta Pi Chapter, 2004 - now
B. Selected peer-reviewed publications (in chronological order).
1. M.T. Valentine, L.E. Dewalt, H.D. Ou-Yang, “Forces on a Colloidal Particle in Polymer
Solution: A Study using Optical Tweezers”, Journal of Physics: Condens. Matter (UK) 8,
(1996) 9477-9482
2. H.D. Ou-Yang, “Design and Applications of Oscillating Optical Tweezers for Direct
Measurements of Colloidal Forces” in Polymer-Colloid Interactions: From Fundamentals To
Practice, ed. Paul Dubin and Raymond Farinato, John Wiley and Sons, New York (1999)
Chapter 15, pp. 385-405.
3. L. Hough and H.D. Ou-Yang, “A New Probe for Mechanical Testing of Nanostructures in
Soft Materials, J. Nanoparticle Res. 1(4), (1999) 495-499.
4. E. E. Meyer, M. F. Islam, W. Lau, H. D. Ou-Yang, “Complexation Kinetics of Cyclodextrin
with Hydrophobic Molecules Confined in an Isolated Droplet in Water”, Langmuir 16:13
(2000) 5519-5522.
5. L. A. Hough and H. D. Ou-Yang, “Correlated Motions of Two Hydrodynamically Coupled
Particles Confined in Separate Quadratic Potential Wells”, Phys. Rev. E., 65 (2002) 021906
1-7
6. H. Daniel Ou-Yang, Elizabeth A. Rickter, Chuan Pu, Meron Mengistu, Olga Latinovic, Anil
Kumar, Linda Lowe Krentz and Shu Chien, “Oscillating Optical Tweezer-Based 3-D
Confocal Microrheometer for Investigating the Intracellular Micromechanics and
Structures”, Proceedings SPIE Annual Meeting, San Diego, July 2005
7. L.A. Hough and H.D. Ou-Yang, “Viscoelasticity of Aqueous Telechelic Poly(ethylene oxide)
Solutions: Relaxation and Structure”, Phys. Rev. E. EF10071 (2006)
8. Ming-Tzo Wei, Angela Zaorski, Huseyin C. Yalcin, Jing Wang, Melissa Hallow, Samir N.
Ghadiali, Arthur Chiou, and H. Daniel Ou-Yang, “A comparative study of living cell
micromechanical properties by oscillatory optical tweezers”, 16, OPTICS EXPRESS 8594
(2008)
9. Ming-Tzo Wei, Joseph Junio, H. Daniel Ou-Yang, “Direct Measurements of the Frequency
Dependent Dielectrophoresis Force”, Biomicrofluidics 3, 012003 (2009)