Embed Size (px)
Citation preview

Final Recommendation for the
Maryland Hospital Acquired Conditions Program
for Rate Year 2021
March 13, 2019
Health Services Cost Review Commission
4160 Patterson Avenue
Baltimore, Maryland 21215
(410) 764-2605
FAX: (410) 358-6217
This document contains the final staff recommendations for the Maryland Hospital Acquired
Conditions Program for RY 2021.

Final Recommendations for the Maryland Hospital-Acquired Conditions Program for Rate Year 2021
2
Table of Contents
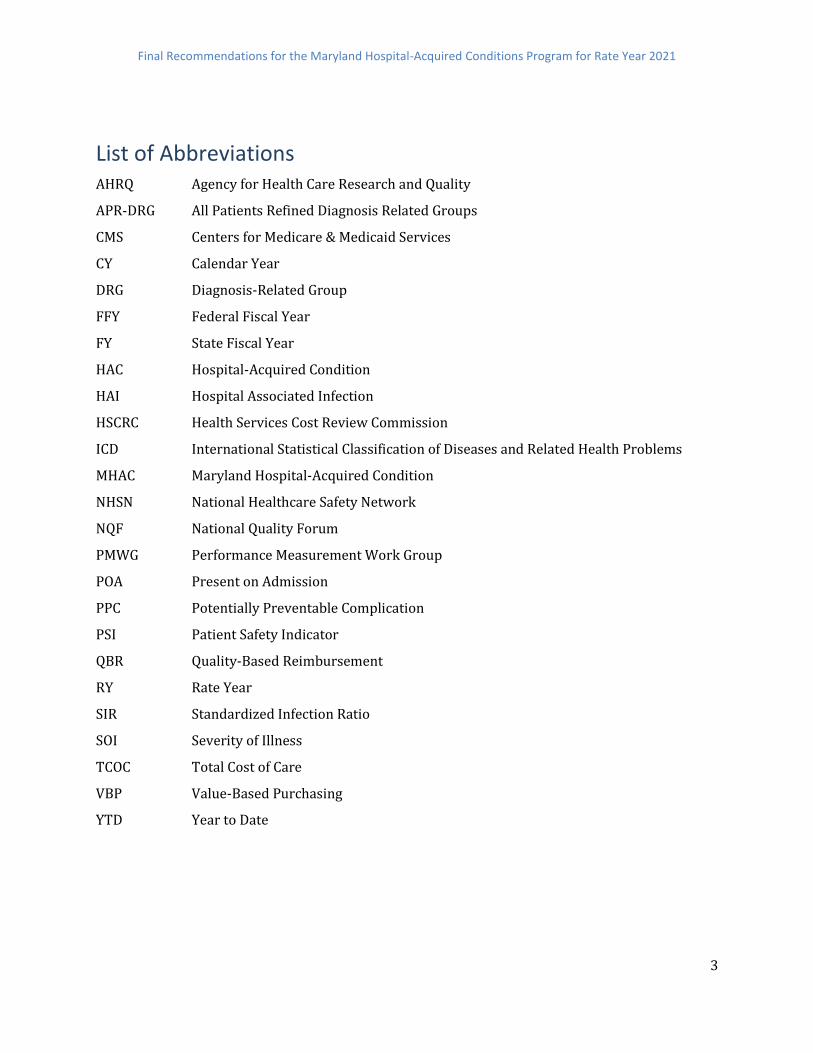
List of Abbreviations .............................................................................................................................................................. 3
Key Methodology Concepts and Definitions ................................................................................................................. 4
Recommendations................................................................................................................................................................... 5
Introduction ............................................................................................................................................................................... 6
Background ................................................................................................................................................................................ 7
Overview of the Federal Hospital-Acquired Condition Programs .................................................................. 7
Overview of the Maryland MHAC Policy ................................................................................................................... 8
RY 2020 MHAC Methodology .................................................................................................................................... 9
RY 2021 MHAC Program Redesign ....................................................................................................................... 10
Assessment ............................................................................................................................................................................... 11
Statewide PPC Performance Trends ......................................................................................................................... 11
RY 2021 MHAC Measures .............................................................................................................................................. 12
Modeling of Scores and Revenue Adjustments .................................................................................................... 26
Additional Future Considerations .................................................................................................................................. 29
Stakeholder Feedback and Staff Response ................................................................................................................. 29
Recommendations................................................................................................................................................................. 32
Appendix I. Clinical Adverse Events Measure Subgroup Report ....................................................................... 33
Appendix II. Additional National and Maryland Complication Programs Background............................ 66
Appendix III: RY 2020 PPCs, Benchmarks, and Tiers ............................................................................................ 68
Appendix IV. Select PPC Histograms ............................................................................................................................. 70
Appendix V: Comparison of PPC Rates under Version 35 and Version 36 ................................................... 77
Appendix VI: HACRP Z-Score Description .................................................................................................................. 78
Appendix VII. PPC Benchmarks and Thresholds under Current and Expanded Methodology (CY
2016) .......................................................................................................................................................................................... 79
Appendix VIII. PPC Benchmarks and Thresholds under Two Years (FY 2017 and FY 2018) and One
Year (FY 2018) Data ............................................................................................................................................................. 80
Appendix IX. Example of Calculation of Hospital Scores ....................................................................................... 81
Appendix X. By hospital Score Modeling ..................................................................................................................... 82
Appendix XI. By Hospital Revenue Modeling ............................................................................................................. 85
Appendix XII. Sensitivity Analysis of MHAC Scores................................................................................................. 88
Appendix XIII. Amended Revenue Adjustment Scale ............................................................................................. 89
Final Recommendations for the Maryland Hospital-Acquired Conditions Program for Rate Year 2021
3
List of Abbreviations AHRQ Agency for Health Care Research and Quality
APR-DRG All Patients Refined Diagnosis Related Groups
CMS Centers for Medicare & Medicaid Services
CY Calendar Year
DRG Diagnosis-Related Group
FFY Federal Fiscal Year
FY State Fiscal Year
HAC Hospital-Acquired Condition
HAI Hospital Associated Infection
HSCRC Health Services Cost Review Commission
ICD International Statistical Classification of Diseases and Related Health Problems
MHAC Maryland Hospital-Acquired Condition
NHSN National Healthcare Safety Network
NQF National Quality Forum
PMWG Performance Measurement Work Group
POA Present on Admission
PPC Potentially Preventable Complication
PSI Patient Safety Indicator
QBR Quality-Based Reimbursement
RY Rate Year
SIR Standardized Infection Ratio
SOI Severity of Illness
TCOC Total Cost of Care
VBP Value-Based Purchasing
YTD Year to Date

Final Recommendations for the Maryland Hospital-Acquired Conditions Program for Rate Year 2021
4
Key Methodology Concepts and Definitions Potentially preventable complications (PPCs): 3M originally developed 65 PPC measures, which
are defined as harmful events that develop after the patient is admitted to the hospital and may
result from processes of care and treatment rather than from the natural progression of the
underlying illness. PPCs, like national claims-based hospital-acquired condition measures, rely on
present-on-admission codes to identify these post-admission complications.
At-risk discharge: Discharge that is eligible for a PPC based on the measure specifications
Diagnosis-Related Group (DRG): A system to classify hospital cases into categories that are
similar clinically and in expected resource use. DRGs are based on a patient’s primary diagnosis and
the presence of other conditions.
All Patients Refined Diagnosis Related Groups (APR-DRG): Specific type of DRG assigned using
3M software that groups all diagnosis and procedure codes into one of 328 All-Patient Refined-
Diagnosis Related Groups.
Severity of Illness (SOI): 4-level classification of minor, moderate, major, and extreme that can be
used with APR-DRGs to assess the acuity of a discharge.
APR-DRG SOI: Combination of Diagnosis Related Groups with Severity of Illness levels, such that
each admission can be classified into an APR-DRG SOI “cell” along with other admissions that have
the same Diagnosis Related Group and Severity of Illness level.
Case-Mix Adjustment: Statewide rate for each PPC (i.e., normative value or “norm”) is calculated
for each diagnosis and severity level. These statewide norms are applied to each hospital’s case-
mix to determine the expected number of PPCs, a process known as indirect standardization.
Observed/Expected Ratio: PPC rates are calculated by dividing the observed number of PPCs by
the expected number of PPCs. Expected PPCs are determined through case-mix adjustment.
Diagnostic Group-PPC Pairings: Complications are measured at the diagnosis and Severity of
Illness level, of which there are approximately 1,200 combinations before one accounts for clinical
logic and PPC variation.
Zero norms: Instances where no PPCs are expected because none were observed in the base
period at the Diagnosis Related Group and Severity of Illness level.
Final Recommendations for the Maryland Hospital-Acquired Conditions Program for Rate Year 2021
5
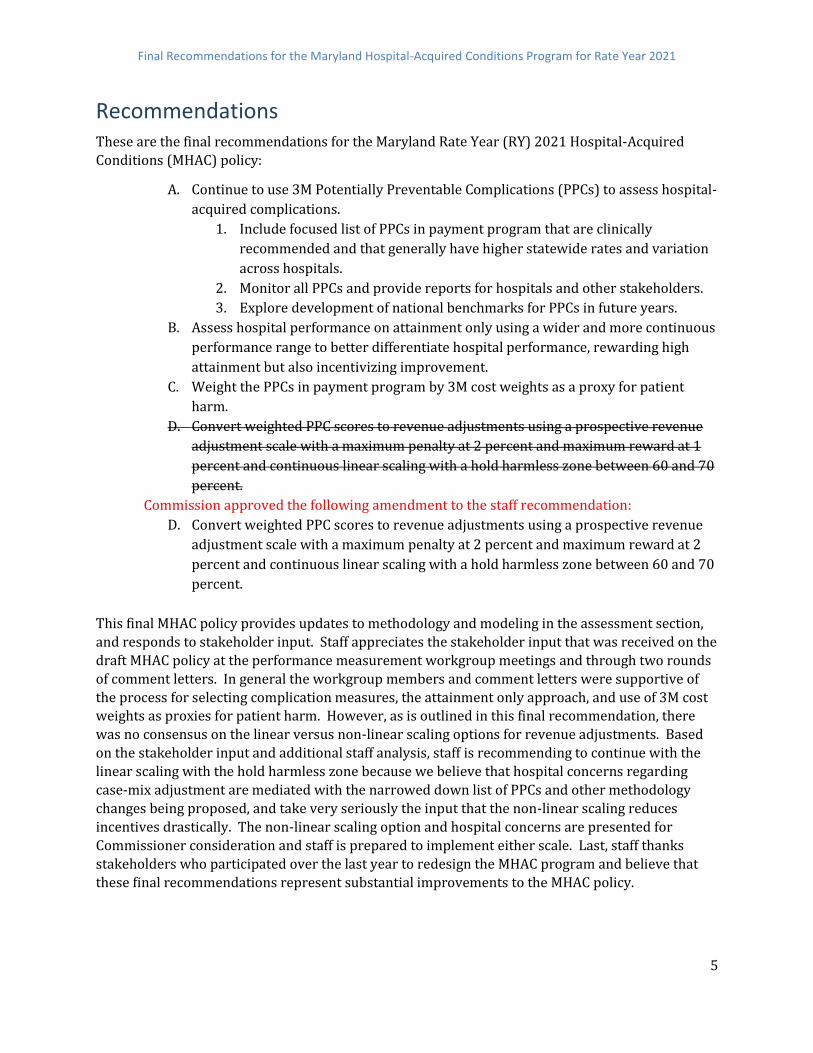
Recommendations These are the final recommendations for the Maryland Rate Year (RY) 2021 Hospital-Acquired
Conditions (MHAC) policy:
A. Continue to use 3M Potentially Preventable Complications (PPCs) to assess hospital-
acquired complications.
1. Include focused list of PPCs in payment program that are clinically
recommended and that generally have higher statewide rates and variation
across hospitals.
2. Monitor all PPCs and provide reports for hospitals and other stakeholders.
3. Explore development of national benchmarks for PPCs in future years.
B. Assess hospital performance on attainment only using a wider and more continuous
performance range to better differentiate hospital performance, rewarding high
attainment but also incentivizing improvement.
C. Weight the PPCs in payment program by 3M cost weights as a proxy for patient
harm.
D. Convert weighted PPC scores to revenue adjustments using a prospective revenue
adjustment scale with a maximum penalty at 2 percent and maximum reward at 1
percent and continuous linear scaling with a hold harmless zone between 60 and 70
percent.
Commission approved the following amendment to the staff recommendation:
D. Convert weighted PPC scores to revenue adjustments using a prospective revenue
adjustment scale with a maximum penalty at 2 percent and maximum reward at 2
percent and continuous linear scaling with a hold harmless zone between 60 and 70
percent.
This final MHAC policy provides updates to methodology and modeling in the assessment section,
and responds to stakeholder input. Staff appreciates the stakeholder input that was received on the
draft MHAC policy at the performance measurement workgroup meetings and through two rounds
of comment letters. In general the workgroup members and comment letters were supportive of
the process for selecting complication measures, the attainment only approach, and use of 3M cost weights as proxies for patient harm. However, as is outlined in this final recommendation, there
was no consensus on the linear versus non-linear scaling options for revenue adjustments. Based
on the stakeholder input and additional staff analysis, staff is recommending to continue with the
linear scaling with the hold harmless zone because we believe that hospital concerns regarding
case-mix adjustment are mediated with the narrowed down list of PPCs and other methodology
changes being proposed, and take very seriously the input that the non-linear scaling reduces
incentives drastically. The non-linear scaling option and hospital concerns are presented for
Commissioner consideration and staff is prepared to implement either scale. Last, staff thanks
stakeholders who participated over the last year to redesign the MHAC program and believe that
these final recommendations represent substantial improvements to the MHAC policy.

Final Recommendations for the Maryland Hospital-Acquired Conditions Program for Rate Year 2021
6
Introduction A central tenet of the healthcare reform in Maryland since 2014 is that hospitals are funded under
Population Based Revenue, a fixed annual revenue cap that is adjusted for inflation, quality
performance, reductions in potentially avoidable utilization, market shifts, and demographic
growth. Under the Population Based Revenue system, hospitals are incentivized to transition
services across the continuum of care and may keep savings that they achieve via improved quality
of care (e.g., reduced hospital-acquired infection or other complications, avoidable utilization,
readmissions). On the other hand, constraining hospital resources can have unintended
consequences, including declining quality of care. Thus, Maryland’s Quality programs must measure
and reward better quality and reinforce the incentives of the Population Based Revenue system, as
well as penalize poor performance and potential unintended consequences.
The Maryland Health Services Cost Review Commission’s (HSCRC’s or Commission’s) Hospital Acquired Conditions (MHAC) program incentivizes hospitals to improve patient safety and value
over time. The MHAC policy currently holds 2 percent of hospital revenue at-risk for performance
measures related to complications that occur during a hospital stay as a result of treatment. Under
the 2014-2018 All-Payer Model Agreement between Maryland and the Centers for Medicare &
Medicaid Services (CMS), there were specific quality performance requirements, including reducing
all-payer complications by 30 percent by the end of 2018 as measured by 3M Potentially
Preventable Complication (PPC) measures. Maryland has well exceeded this target with a 51.54
percent reduction in the all-payer case-mix adjusted complication rate based on data through June
of 2018. However, the hospital industry has expressed concerns that the inclusion of 45 PPC/PPC
combinations in a pay-for-performance program well exceeds the number and type of
complications measured nationally, hindering the ability to focus on priority areas.
As Maryland enters into a new Total Cost of Care (TCOC) Model Agreement with CMS on January 1,
2019, performance standards and targets in HSCRC’s portfolio of quality and value-based payment
programs will be updated. In CY 2018, staff focused on revising two of the Commission’s Quality
programs, the Maryland Hospital-Acquired Conditions program and the Potentially Avoidable
Utilization program, per directives from HSCRC Commissioners.1
For the complications program redesign, staff worked to address industry concerns regarding the
large number of complication measures and to focus on the most meaningful and significant
measures of patient safety. To do this work staff contracted with Dr. Zahid Butt of Medisolv to
provide subject matter expertise and to convene a group of clinical and measurement experts as
well as hospital and payer representatives to review existing all-payer complications measures and
1 In the fall of 2017, HSCRC Commissioners with staff support conducted several strategic planning sessions to outline priorities and guiding principles for the upcoming Total Cost of Care Model.
Based on these sessions, the HSCRC developed a Critical Action Plan that delineates timelines for
review and possible revisions of financial and quality methodologies, as well as other staff
operations.

Final Recommendations for the Maryland Hospital-Acquired Conditions Program for Rate Year 2021
7
provide suggestions for evaluating hospital performance. The Clinical Adverse Event Measures
(CAEM) subgroup met from February through September and their suggestions were then brought
to the Performance Measurement Workgroup (PMWG) for further discussion. Details on the
complication subgroup process and suggestions are provided throughout this policy and Appendix I
contains a report on the process from Dr. Butt.
The final MHAC policy reflects consensus recommendations from the CAEM subgroup and PMWG,
including: maintaining the use of 3M Potentially Preventable Complications but reducing the number of complication measures; moving to an attainment only system given Maryland’s
sustained improvement over the past several years; and weighting complications by their
associated cost weights. Justifications for retaining the PPCs are explained in the Assessment
section, but in short, stakeholders and staff believes these are valid patient safety measures that
address important clinical areas. Moreover, the subgroup expressed concern about utilizing other
viable complication measure sets, i.e., the National Health Safety Network (NHSN) measures and
Agency for Health Care Research and Quality (AHRQ) Patient Safety Indicators (PSI). Specifically,
the subgroup did not support duplicating the use of the NHSN measures, which are already in the
Quality Based Reimbursement program, and was generally concerned about increasing the weight
on NHSN because of the potential for incomplete risk adjustment and the possibility of surveillance
bias, among other things. In terms of AHRQ PSI’s, the subgroup noted that the all-payer risk-
adjustment is not yet available for and therefore is not viable for inclusion in a pay-for-performance
program at this time.
The final policy also recommends the use of a prospective linear scale with a hold harmless zone, as
staff believes this provides the appropriate level of financial incentives for hospitals to address
complications. However, included in this recommendation for reference is the modeling of the non-
linear, continuous scale, which is supported by Maryland Hospital Association and Johns Hopkins
Health System because of their continued concerns on the case-mix adjustment and lack of national
norms. Staff believe that the narrowed down PPC list and use of two years of data for establishing
normative values largely addresses the case-mix concerns, but will continue in future iterations of
the MHAC policy to develop methodologies that strengthen case-mix adjustment and align
Maryland PPC’s with national performance standards.
Background
Overview of the Federal Hospital-Acquired Condition Programs
The Federal Government operates two hospital complications payment programs. Detailed
information may be found in Appendix II.
Beginning in Federal Fiscal Year 2009 (FFY 2009), per the provisions of the Federal Deficit
Reduction Act, the Hospital-Acquired Condition Present on Admission Program was implemented.
Under the program, patients were no longer assigned to higher-paying Diagnosis Related Groups if
certain conditions were acquired in the hospital and could have reasonably been prevented
through the application of evidence-based guidelines.
Final Recommendations for the Maryland Hospital-Acquired Conditions Program for Rate Year 2021
8
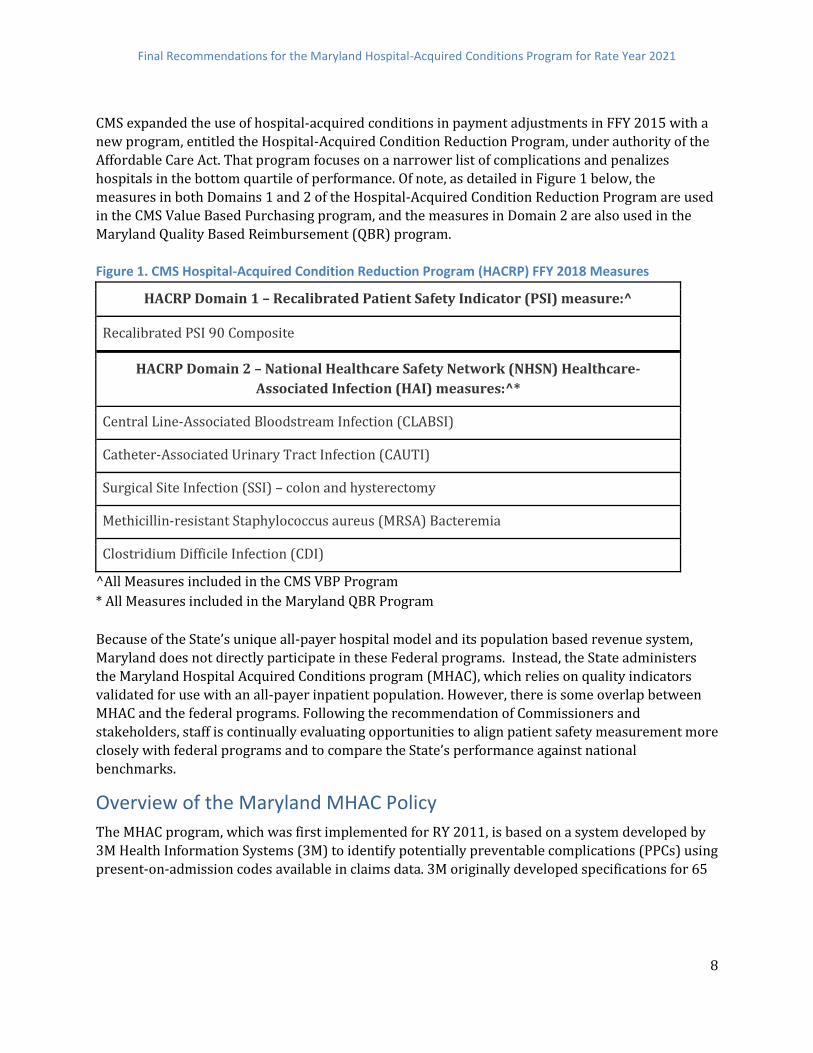
CMS expanded the use of hospital-acquired conditions in payment adjustments in FFY 2015 with a
new program, entitled the Hospital-Acquired Condition Reduction Program, under authority of the
Affordable Care Act. That program focuses on a narrower list of complications and penalizes
hospitals in the bottom quartile of performance. Of note, as detailed in Figure 1 below, the
measures in both Domains 1 and 2 of the Hospital-Acquired Condition Reduction Program are used
in the CMS Value Based Purchasing program, and the measures in Domain 2 are also used in the
Maryland Quality Based Reimbursement (QBR) program.
Figure 1. CMS Hospital-Acquired Condition Reduction Program (HACRP) FFY 2018 Measures
HACRP Domain 1 – Recalibrated Patient Safety Indicator (PSI) measure:^
Recalibrated PSI 90 Composite
HACRP Domain 2 – National Healthcare Safety Network (NHSN) Healthcare-
Associated Infection (HAI) measures:^*
Central Line-Associated Bloodstream Infection (CLABSI)
Catheter-Associated Urinary Tract Infection (CAUTI)
Surgical Site Infection (SSI) – colon and hysterectomy
Methicillin-resistant Staphylococcus aureus (MRSA) Bacteremia
Clostridium Difficile Infection (CDI)
^All Measures included in the CMS VBP Program
* All Measures included in the Maryland QBR Program
Because of the State’s unique all-payer hospital model and its population based revenue system,
Maryland does not directly participate in these Federal programs. Instead, the State administers
the Maryland Hospital Acquired Conditions program (MHAC), which relies on quality indicators
validated for use with an all-payer inpatient population. However, there is some overlap between
MHAC and the federal programs. Following the recommendation of Commissioners and
stakeholders, staff is continually evaluating opportunities to align patient safety measurement more
closely with federal programs and to compare the State’s performance against national
benchmarks.
Overview of the Maryland MHAC Policy
The MHAC program, which was first implemented for RY 2011, is based on a system developed by
3M Health Information Systems (3M) to identify potentially preventable complications (PPCs) using
present-on-admission codes available in claims data. 3M originally developed specifications for 65

Final Recommendations for the Maryland Hospital-Acquired Conditions Program for Rate Year 2021
9
PPCs2, which are defined as harmful events that develop after the patient is admitted to the hospital
and may result from processes of care and treatment rather than from the natural progression of
the underlying illness. For example, the program holds hospitals accountable for adverse drug
reactions and surgical-site infections during inpatient stays. These complications can lead to 1)
poor patient outcomes, including longer hospital stays, permanent harm, and death; and 2)
increased costs. Thus, the MHAC program is designed to provide incentives to improve patient care
by adjusting hospital budgets based on PPC performance.
RY 2020 MHAC Methodology
The initial methodology for the MHAC program estimated the percentage of inpatient revenue
associated with excess PPCs, penalized hospitals that had higher estimated PPC costs than the statewide average, and provided revenue neutral rewards to hospitals with lower-than-average
PPC costs. In RY 2016, the Commission changed the MHAC methodology to evaluate hospital
performance based on case-mix-adjusted PPC rates rather than excess PPC costs. Annual
adjustments have been made to the patient populations and PPCs included in the MHAC payment
program based on stakeholder input and staff analytic findings in order to strengthen its clinical
and statistical merits. The revenue adjustment scales have also been modified over time to better
incentivize improvements. For RY 2020, the Commission approved an interim solution to address
the low normative values by focusing the payment program on the diagnosis and complication pairs
where at least 80 percent of PPCs occurred in the base period. Staff recommends discontinuing this
approach for reasons that will be discussed in the Assessment section
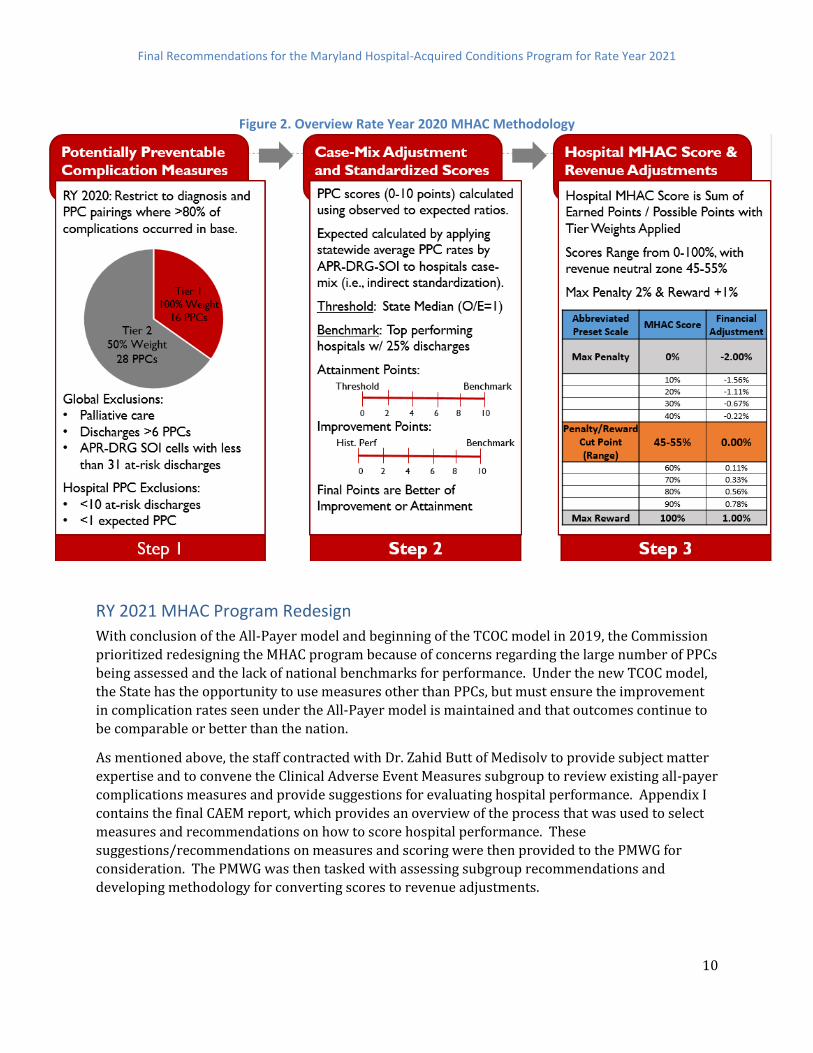
Beyond the annual updates outlined above, the scoring methodology has remained the same since
RY 2016. Figure 2 provides an overview of the three steps in the MHAC methodology that convert
hospital performance, to standardized scores, and then payment adjustments. Step 1, PPCs are
grouped and weighted into tiers according to their level of priority and exclusions are applied. Step
2, case-mix adjustment is used to calculate observed to expected ratios that are then converted to a
standardized point based score (0-10 points) based on the better of improvement or attainment
using the same scoring methodology that is used for CMS Value-Based Purchasing and Maryland
QBR. Step 3 uses a preset linear point scale that is set prospectively to calculate a percent revenue
adjustment. This prospective scaling approach differs from national programs that relatively rank
hospitals after the performance period. A list of the PPCs used in the RY 2020 program is provided
in Appendix III.
2 In RY 2020 there were 45 PPC/PPC combinations included in the program as 3M had discontinued some PPCs
and others were deemed not suitable for a pay-for-performance program
Final Recommendations for the Maryland Hospital-Acquired Conditions Program for Rate Year 2021
10
Figure 2. Overview Rate Year 2020 MHAC Methodology
RY 2021 MHAC Program Redesign
With conclusion of the All-Payer model and beginning of the TCOC model in 2019, the Commission
prioritized redesigning the MHAC program because of concerns regarding the large number of PPCs
being assessed and the lack of national benchmarks for performance. Under the new TCOC model,
the State has the opportunity to use measures other than PPCs, but must ensure the improvement
in complication rates seen under the All-Payer model is maintained and that outcomes continue to
be comparable or better than the nation.
As mentioned above, the staff contracted with Dr. Zahid Butt of Medisolv to provide subject matter
expertise and to convene the Clinical Adverse Event Measures subgroup to review existing all-payer
complications measures and provide suggestions for evaluating hospital performance. Appendix I
contains the final CAEM report, which provides an overview of the process that was used to select
measures and recommendations on how to score hospital performance. These
suggestions/recommendations on measures and scoring were then provided to the PMWG for
consideration. The PMWG was then tasked with assessing subgroup recommendations and
developing methodology for converting scores to revenue adjustments.

Final Recommendations for the Maryland Hospital-Acquired Conditions Program for Rate Year 2021
11
Details on the recommendations and how they were developed are outlined in the assessment
section below. Staff would like to thank Dr. Butt and the dozens of CAEM and PMWG members who
have collaborated with the Commission on the MHAC program redesign. As evidenced below,
significant thought and effort went into the decisions on what measures should be in the RY 2021
MHAC policy and how hospitals should be scored. These changes are supported by many
stakeholders, however there was no consensus on the linear versus non-linear scaling options for
revenue adjustments. Based on the stakeholder input and additional staff analysis, staff is
recommending to continue with the linear scaling with the hold harmless zone because we believe
that hospital concerns regarding case-mix adjustment are mediated with the narrowed down list of
PPCs and other methodology changes being proposed, and take very seriously the input that the
non-linear scaling reduces incentives drastically.
Assessment In this section, staff analyzes statewide PPC trends, discusses the rationale for the RY 2021
recommendations, and provides modelling on proposed measurement and methodology changes,
including:
● Measurement Selection and Weighting
● Scoring (Risk Adjustment, Attainment versus Improvement, Additional Gradations of
Performance)
● Scaling (Reward/Penalty Cut Point, Linear versus Non-Linear)
Statewide PPC Performance Trends
As noted previously, the State has made dramatic progress in reducing PPCs under the MHAC
Program and has continued this improvement under the All-Payer Model, reaching its 30 percent
reduction target under the Agreement in the second year. Most recently, available performance
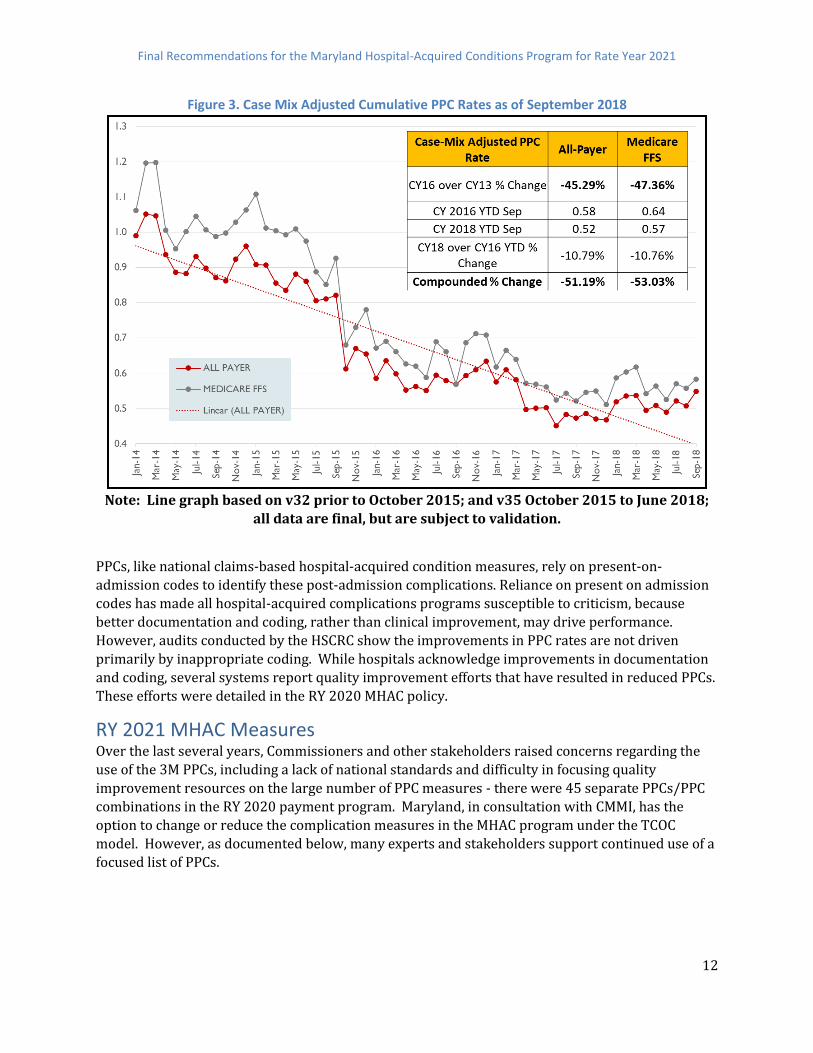
trends reveal a cumulative All-Payer case-mix adjusted PPC rate reduction of 51.19 percent
(compared to the base period of CY 2013) as illustrated in Figure 3 below.
Final Recommendations for the Maryland Hospital-Acquired Conditions Program for Rate Year 2021
12
Figure 3. Case Mix Adjusted Cumulative PPC Rates as of September 2018
Note: Line graph based on v32 prior to October 2015; and v35 October 2015 to June 2018;
all data are final, but are subject to validation.
PPCs, like national claims-based hospital-acquired condition measures, rely on present-on-
admission codes to identify these post-admission complications. Reliance on present on admission
codes has made all hospital-acquired complications programs susceptible to criticism, because
better documentation and coding, rather than clinical improvement, may drive performance.
However, audits conducted by the HSCRC show the improvements in PPC rates are not driven
primarily by inappropriate coding. While hospitals acknowledge improvements in documentation
and coding, several systems report quality improvement efforts that have resulted in reduced PPCs.
These efforts were detailed in the RY 2020 MHAC policy.
RY 2021 MHAC Measures Over the last several years, Commissioners and other stakeholders raised concerns regarding the
use of the 3M PPCs, including a lack of national standards and difficulty in focusing quality
improvement resources on the large number of PPC measures - there were 45 separate PPCs/PPC
combinations in the RY 2020 payment program. Maryland, in consultation with CMMI, has the
option to change or reduce the complication measures in the MHAC program under the TCOC
model. However, as documented below, many experts and stakeholders support continued use of a
focused list of PPCs.
Final Recommendations for the Maryland Hospital-Acquired Conditions Program for Rate Year 2021
13
Commissioners have previously recommended focusing on reliable complication measures that
align with the TCOC model requirements and may be compared to national benchmarks. The
complications subgroup was tasked with developing criteria for measure selection consistent with
Commission guidance, reviewing measure specifications, analyzing performance, and providing
recommendations on what measures to include in RY 2021 and beyond. The criteria to select
measures is listed here and additional details are provided in CAEM subgroup report (Appendix I):
Used in current CMS or public reporting program or reflects key clinical areas within acute care hospital setting
The measure has a strong scientific evidence-base to demonstrate that when implemented can lead to the desired outcome(s) and addresses unwarranted or significant variation in
care that is evidence of a patient safety challenge
The measure contributes to efficient use of measurement resources and/or supports
alignment of measurement across programs.
The measure can be feasibly reported without adding significant reporting burden
The measure is reliable and valid for reporting and analysis at the Hospital level
The measure has high Usability: Clinically actionable and shows variation
No unreasonable implementation issues that outweigh the benefits have been identified Following a comprehensive scan of candidate measures, the CAEM subgroup evaluated the
following three sets of measures in greater detail:
CDC National Health and Safety Network Hospital Acquired Infection measures
AHRQ Patient Safety Indicators
3M Potentially Preventable Complications
CDC National Health and Safety Network (NHSN)
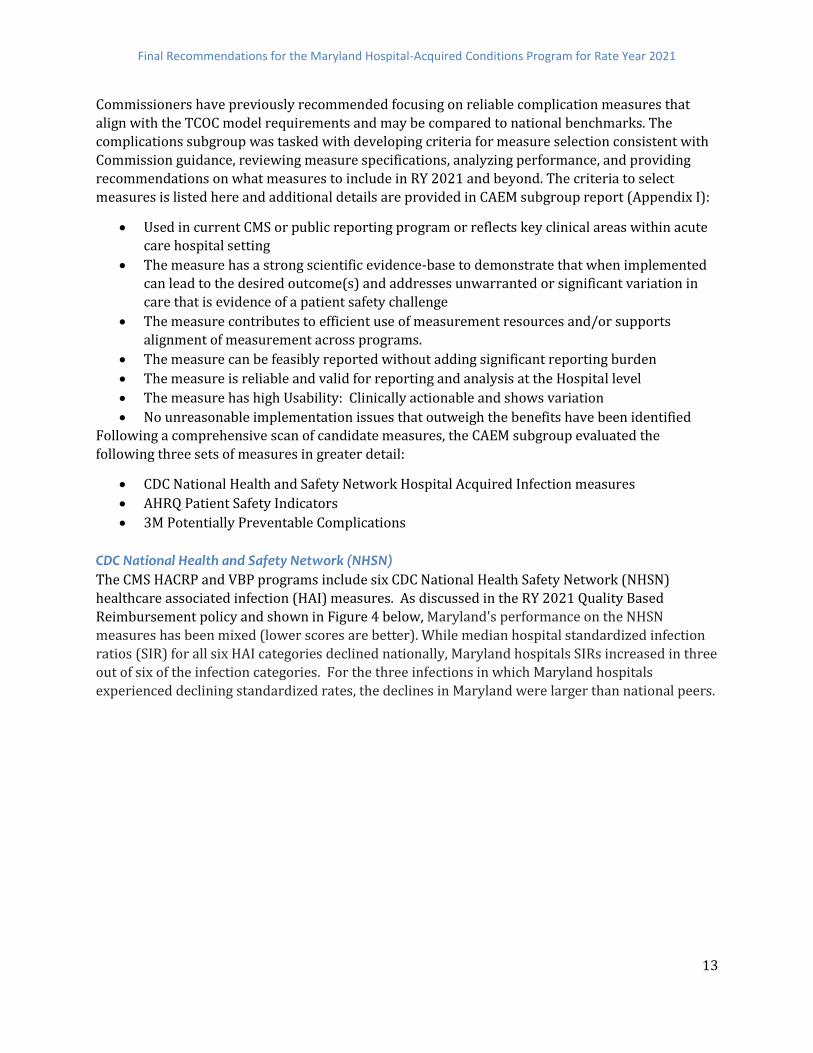
The CMS HACRP and VBP programs include six CDC National Health Safety Network (NHSN)
healthcare associated infection (HAI) measures. As discussed in the RY 2021 Quality Based
Reimbursement policy and shown in Figure 4 below, Maryland's performance on the NHSN
measures has been mixed (lower scores are better). While median hospital standardized infection
ratios (SIR) for all six HAI categories declined nationally, Maryland hospitals SIRs increased in three
out of six of the infection categories. For the three infections in which Maryland hospitals
experienced declining standardized rates, the declines in Maryland were larger than national peers.

Final Recommendations for the Maryland Hospital-Acquired Conditions Program for Rate Year 2021
14
Figure 4. Maryland vs. National Median Hospital SIRs on NHSN HAI Safety Measures (Base period
Calendar Year 2015, Performance period October 1, 2016 to September 30, 2017)
While the CAEM subgroup and PMWG members all agree that Maryland must improve performance
on NHSN measures relative to the nation, the consensus was that including the same measures in
two programs would confuse clinicians and hospital administrators because the results and
revenue adjustments may differ or not align. This has been a concern raised regarding the national
program, and CMS indicated they might remove the NHSN measures from VBP in the Medicare IPPS
2019 proposed rule. But the final rule retained the measures in both programs for at least another
year in order to provide incentives for improvement and opportunity for positive revenue
adjustments through VBP.
Based on CMS policy and Maryland’s need for improvement, staff recommended including the
NHSN measures in the RY 2021 QBR program and weighting the domain more heavily than it is in
VBP (35 percent vs. 25 percent), along with an aggressive revenue adjustment cut point for
rewards. Furthermore, staff agrees with the stakeholders who expressed concerns on duplication
of measures, and thus does not recommend including these measures in the MHAC program.
This recommendation means Maryland hospitals have less revenue at-risk for NHSN measures.
Staff believes this is appropriate given that Maryland has improved on some NHSN measures under
current QBR incentives, and that subgroup members raised concerns methodologic issues related
to NHSN. These include low NHSN event counts at some hospitals, which may result in one event
having a large impact on SIR, the potential for incomplete risk adjustment, and the possibility of
surveillance bias, which would arise if hospitals allocating more resources to identifying infections
experienced inappropriately high SIRs. Staff will continue to monitor CMS policy and may
recommend moving the measures to the MHAC program or consolidating the QBR and MHAC
programs, and increasing revenue at-risk if Maryland performance does not improve.
AHRQ Patient Safety Indicator Measures
As discussed in greater detail in Appendix I, the AHRQ Patient Safety Indicator 90, a composite of 10
PSI measures, is used in the CMS HACRP and will be reintroduced in the FFY2023 VBP program.

Final Recommendations for the Maryland Hospital-Acquired Conditions Program for Rate Year 2021
15
The PSI measures calculated using Medicare data are also used for other public reports such as
those published by The Leapfrog Group and US News and World Report, and given their national
significance Maryland needs to monitor performance on these measures.
In the Leapfrog Group’s Safety Grades Fall 2018 release, which includes 7 PSI measures of the 28
total measures used in the report, 19 Maryland hospitals received high grades, with 15 hospitals
showing improvement from the Spring 2018 release.3 Staff anticipates that these PSI measures can
be calculated on an all-payer basis going forward, but national benchmarks for risk-adjustment under ICD-10 are not yet available.
Because of the lack of risk adjustment the CAEM subgroup recommended to not include these
measures for CY 2019 but recommend monitoring once the risk-adjustment becomes available. In
future years, the clinical logic and overlap with PPCs should be more thoroughly evaluated to
determine whether PSIs should be included in the MHAC program.
3M Potentially Preventable Complications
The 3M PPCs have been used in the MHAC program since its inception in RY 2011. PPC rates for a
given hospital have been shown in published literature to be stable over time, indicating that the
measures have acceptable reliability. Patients with a PPC experience large increases in length of
stay, risk of mortality, and charges. In the case of acute lung edema, for example, patients
experienced a five-fold increase in mortality and a doubling of charges and length of stay.4 The
association of the PPC metrics with downstream consequences of complications suggests that PPCs
are valid measures of in-hospital complications
However, the hospital industry has been concerned about the large number of PPCs included in the
Maryland program compared to national programs, as this has made clinical focus difficult.
Furthermore, some PPCs have low statewide rates and little variation across hospitals. These PPCs
may be less reliable or “topped off”, and instead should be monitored. In addition, stakeholders
expressed concern that some PPCs may measure complications that are not actionable with
evidence-based care interventions (e.g., PPC 14 Ventricular Fibrillation/Cardiac arrest, PPC 11
Acute Myocardial Infarction), and that it may be difficult to determine whether various
complications are present on admission (e.g., PPC 21 Clostridium Difficile Infection). And last, there
are some PPCs with coding concerns that impact comparability across hospitals, such as PPC 40
(Post-Operative Hemorrhage & Hematoma without Hemorrhage Control Procedure), which has a
degree of subjectivity because any documented bleeding flags this PPC, and clinicians use discretion
in determining the degree of bleeding that merits such documentation. Nevertheless, clinical
experts in the CAEM subgroup recommended moving forward with targeted list PPCs in a reformed
MHAC program because of the comprehensibility and all-payer nature of them and because they
have sufficient risk adjustment and opportunity for improvement, as evidenced below.
3 Of the 7 PSI measures included The Leapfrog Group Report, 6 of the PSI measures overlap with the set of 10
PSI measures included in the PSI 90 composite measure. 4 John S., Richard F. Averill, Norbert I. Goldfield, James C. Gay, John Muldoon, Elizabeth McCullough, and Jean Xiang. 2006. “Identifying Potentially Preventable Complications Using a Present on Admission Indicator.” Health Care Financing Review 27 (3): 63–82.

Final Recommendations for the Maryland Hospital-Acquired Conditions Program for Rate Year 2021
16
Criteria for Selection of Potentially Preventable Complications
In order to assess which PPCs should be included in a pay-for-performance program, CAEM and
PMWG members were provided with statewide rates and histograms of hospital performance for
each PPC. Figure 5 provides the Selection Criteria and Considerations recommended by CAEM
subgroup. The overlap and similarity with AHRQ PSIs was also evaluated since the PSIs are areas of
national focus. And while this overlap was surprisingly low for some similar clinical measures due
to the surgical focus and other clinical logic differences for the PSIs, the CAEM members did decide
to retain PPCs that address similar clinical areas of national focus (e.g., sepsis and hospital falls).5
Figure 5. Criteria for PPC Inclusion
Clinical Criteria ● All-payer focus
● Clinically significant complication
● Area of national focus
● Evidence-based prevention protocols/opportunity for improvement
Statistical Criteria ● At least half of hospitals eligible for PPC
● Higher statewide rate (generally 0.5 events per 1,000 discharges)
● Variation across hospitals in performance
Based on these criteria, the CAEM members narrowed the list from 45 candidate PPCs to 15 PPCs,
and the PMWG agreed with all but one of these measures6. Figure 6 lists the 14 PPCs that staff is
proposing to include for CY 2019 performance with descriptive statistics and final rationale for
inclusion and Appendix IV provides histograms for each PPC that show variation across Maryland
hospitals. It should be noted that the PPC rates and histograms that CAEM reviewed used PPC
Grouper Version 35; updated PPC rates under Version 36 in Appendix V show similar statewide
rates.
5 For example, the PSI for sepsis is only for surgical patients and the PPC is for surgical and medical patients.
However analysis of case mix data for same time period identified 305 sepsis PSI cases that were not flagged
as a PPC because of clinical logic differences such as separating out septic shock into different PPC and
requiring a four day length of stay before sepsis is flagged as hospital acquired. 6 Clinicians in the CAEM subgroup and PMWG voiced concerns that PPC 40 post-operative hemorrhage
without procedure is subjectively evaluated and documented by various clinicians. Thus they did not think
PPC 40 should be retained in payment policy. This is not the case with PPC 41 Post-operative Hemorrhage
with Procedure to control the bleeding, which clinicians recommended including in the program, further
arguing that this PPC is more similar to the intent of PSI 09 Perioperative Hemorrhage or Hematoma.

Final Recommendations for the Maryland Hospital-Acquired Conditions Program for Rate Year 2021
17
Figure 6. PPCs Recommended for FY 2021 MHAC Program with Rationale
PPC
#
PPC Description
V35
Eligible Hospitals/
At Risk
Discharges (2 yrs)
Obs/At-Risk*1,000 CAEM, PMWG, HSCRC Staff Recommendation
Rate >1.0 per
1,000
Rate >0.5 per
1,000
3 Acute Pulmonary
Edema and Resp
Failure w/o
Ventilation
46 hospitals
696,950 at risk
discharges 1.78
Meets rate and variation criteria. Clinically supported.
Small overlap with PSI 11 Postoperative Respiratory
Failure. PSI is limited to post-operative patients but PPC
applies to broader patient population.
Include in payment program
4 Acute Pulmonary
Edema, Resp
Failure
w/ventilation
47 hospitals
698,946 at risk
discharges 1.21
Meets rate and variation criteria. Clinically supported.
Small overlap with PSI 11 Postoperative Respiratory
Failure. PSI is limited to post-operative patients but PPC
applies to broader patient population.
Include in payment program
7 Pulmonary
Embolism
44 hospitals
824,106 at risk
discharges 0.49
Nearly meets rate criteria and has variation. Clinically
preventable with well-defined interventions. Overlap
25% with PSI 12 Perioperative Pulmonary Embolism
and Deep Vein Thrombosis but PPC includes broader
patient population. DRA HAC is measured only in
patients with total knee or hip replacements.
Include in payment program.
9 Shock 46 hospitals
833, 605 at risk
discharges 1.18
Meets rate criteria and has variation Clinically
preventable.
Include in payment program.
16 Venous
Thrombosis
44 hospitals
822,712 at risk
discharges 0.36
Below rate threshold but has variation. Clinically
preventable with well-defined interventions. Some
overlap with PSI 12 but PPC rate is lower but with
applicability to a broader population. DRA HAC is
measured only in patients with total knee or hip
replacements.
Include in the payment program.
28 In-Hospital
Trauma and
Fractures
38 hospitals
827456 at risk
discharges 0.13
In hospital injuries are highly preventable and serious.
PPC includes more injury types than PSI 08 In Hospital
Fall with Hip Fracture Rate but PPC rate is lower as it is
applicable to a broader patient population. DRA HAC
applies to a broader set of in hospital injuries. Include in
payment program.
35 Septicemia &
Severe Infections
47 hospitals
289,205 at risk
discharges 2.77
Meets rate and variation criteria. Clinically important.
Include in payment program.
37 Post-Operative
Infection & Deep
Wound Disruption
Without Procedure
39 hospitals
128,674 at risk
discharges 2.48
Meets rate and variation criteria. Clinically preventable.
Overlaps slightly with PSI 14- Postop Wound
Dehiscence, and with NHSN SSI and with DRA HAC but
PPC is broader in scope.
Include in payment program.

Final Recommendations for the Maryland Hospital-Acquired Conditions Program for Rate Year 2021
18
PPC
#
PPC Description
V35
Eligible Hospitals/
At Risk
Discharges (2 yrs)
Obs/At-Risk*1,000 CAEM, PMWG, HSCRC Staff Recommendation
Rate >1.0 per
1,000
Rate >0.5 per
1,000
41 Post-Operative
Hemorrhage &
Hematoma w/
Hemorrhage
Control Procedure
or I&D
32 hospitals
241,162 at risk
discharges 0.69
Meets rate and variation criteria. Clinically preventable.
Overlap with PSI 09- Perioperative Hemorrhage or
Hematoma Rate with PSI having similar applicability but
higher rate.
Include in payment program.
42 Accidental
Puncture/
Laceration During
Invasive
Procedure
43 hospitals
897,351 at risk
discharges 0.49
Meets rate and variation criteria. Clinically supported.
Overlap with PSI 15 Unrecognized Abdominopelvic
Accidental Puncture or Laceration Rate. PPC is
applicable to a much broader patient population so has
a lower rate.
Include in the payment program.
49 Iatrogenic
Pneumothorax 40 hospitals
829,953 at risk
discharges 0.19
Does not meet rate criteria but applicable to large at-risk
denominator population, but observed events are >100.
Clinicians agreed this is an important clinical measure
with national focus. There is hospital variation in
performance, some PSI 06 Iatrogenic Pneumothorax
Rate overlap and DRA HAC is applicable to patients
with infusion catheter insertion procedures only.
Include in the payment program.
60 Major Puerperal
Infection and
Other Major
Obstetric
Complications
27 hospitals
125,667 at risk
discharges 0.98
Meets rate and variation criteria; 3M believes clinical
concerns are addressed in the risk adjustment, and will
address this PPC's overlap with other PPCs in v. 36.
Obstetric morbidity is clinically important in an all-payer
environment.
Include in the payment program.
61 Other
Complications of
Obstetrical
Surgical &
Perineal Wounds
25 hospitals
122,183 at risk
discharges 0.82
Meets rate and variation criteria; 3M believes clinical
concerns are addressed in the risk adjustment, and will
address this PPC's overlap with other PPCs in v. 36.
Obstetric morbidity is clinically important in an all-payer
environment.
Include in the payment program.
67 Pneumonia
Combo (with and
without aspiration)
47 hospitals
713,219 at risk
discharges 1.80
Meets rate and variation criteria. Clinically supported in
combined PPC as 3M also to combine in next grouper
version.
Include in payment program.
The CAEM and PMWG members discussed at length whether very low occurrence PPCs referred to
as “serious reportable events” or “never events” (e.g., transfusion incompatibility) should be
included in the policy. The RY 2020 policy has designated five PPCs as such events, setting their
thresholds and benchmarks at zero. Because these PPCs are rare they would never meet the
selection criteria of high rate, variation, and occurrences in the majority of hospitals. Furthermore

Final Recommendations for the Maryland Hospital-Acquired Conditions Program for Rate Year 2021
19
hospital stakeholders expressed that there were clinical protocols in place if these very serious
events occurred such that they are intensely reviewed regardless of the MHAC policy. Thus, for RY
2021 staff concurred that these PPCs should be monitored by HSCRC and addressed separately with
hospitals if they occur.
PPC Weighting
Since RY 2016, PPCs have been placed into tiers that were weighted in order to prioritize PPCs that
have high volume, high cost, opportunity for improvement, and are of national focus. With the
narrowed list of 14 PPCs, the workgroups discussed whether to continue weighting PPCs.
Weighting options included continuing with the tiered approach, weighting each PPC equally, and
using 3M cost weights.
The 3M cost weights are calculated based on national data and represent the relative incremental
cost associated with a complication and can be considered as a proxy for patient harm7. Figure 7
provides the PPC cost weights sorted from highest to lowest. Based on support from stakeholders,
clinical experts, and MHA, the staff recommends using the 3M cost weights to differentially weight
the PPCs. However, as discussed in the stakeholder feedback section, the industry would like for
clinicians to have opportunity to review version 36 weights before implementation.
Figure 7. 3M PPC Marginal Cost Weights for Proposed MHAC Measures
PPC NUMBER
PPC Description 3M v33 PPC
Marginal Costs
4 Acute Pulmonary Edema and Respiratory Failure with Ventilation 2.74
9 Shock 1.51
16 Venous Thrombosis 1.43
35 Septicemia & Severe Infections 1.37
7 Pulmonary Embolism 1.37
67 Pneumonia Combo (with and without aspiration) 1.30
37 Post-Operative Infection & Deep Wound Disruption Without Procedure 1.27
41 Post-Operative Hemorrhage & Hematoma with Hemorrhage Control Procedure or I&D Proc
1.10
3 Acute Pulmonary Edema and Respiratory Failure without Ventilation 0.80
49 Iatrogenic Pneumothorax 0.61
42 Accidental Puncture/Laceration During Invasive Procedure
0.45
28 In-Hospital Trauma and Fractures 0.34
60 Major Puerperal Infection and Other Major Obstetric Complications 0.17
61 Other Complications of Obstetrical Surgical & Perineal Wounds 0.12
7 Currently the 3M cost weights are under an older version of the PPC grouper, which uses the ICD-9 measure
specifications. 3M anticipates releasing Version 36 cost weights in the near future, and the HSCRC staff
proposes to review updated weights and if similar implement these new cost weights for CY 2019 (otherwise
the current cost weights will be used)..

Final Recommendations for the Maryland Hospital-Acquired Conditions Program for Rate Year 2021
20
MHAC Performance Scoring
In redesigning the MHAC program the CAEM subgroup and PMWG considered the performance
metric and case-mix adjustment, whether measures should be assessed for improvement and
attainment or attainment only, and the methodology to convert measure rates to standardized
scores. The next sections summarize the rationale for:
Continuing to use the observed-to-expected ratio with indirect standardization
Moving to an attainment only program
Using a points system that is similar to the current program but more continuous and better
able to distinguish gradations in performance and incentivize improvement
Performance Metric
The MHAC program assesses performance using an observed to expected ratio for each PPC8. The
expected number of PPCs at a hospital is calculated through indirect standardization, in which a
statewide rate for each PPC (i.e., normative value or “norm”) is calculated for each diagnosis and
severity of illness level. The advantage of this method is that it is conceptually simple to
understand and can be implemented easily in a prospective system. However, over time hospitals
have raised concerns that the low statewide rates and granular indirect standardization at the
diagnosis and severity level have led to what has been termed a “zero-norm” issue, i.e., hospitals are
potentially penalized for a singular random event as opposed to materially poor clinical
performance9. In RY 2020, two changes were made to the program were approved by the
Commission to address this zero-norm concern:
1. The minimum number of at-risk discharges statewide for diagnosis and severity of illness
level was raised from 2 to 31 discharges. This “denominator” change focuses payment
program on diagnosis and severity of illness levels with larger numbers of patients so that a
zero norm is reflective of performance and not small numbers.
2. Exclude low frequency Diagnosis Related Group-PPC pairings from pay-for-performance
program. Staff implemented this policy by restricting the diagnosis and complication pairs
to those that account for at least 80 percent of complications. This “numerator” change was
at the diagnosis level and thus there are still a significant number of zero norms at the
diagnosis and severity of illness level. In the RY 2020 final policy it was estimated that the
two changes above reduced the cells with a zero norm from 88% to 70%, a 21% reduction.
8 The CAEM subgroup also evaluated alternatives to the observed to expected ratio such as an excess PPC rate
that takes into account the number of discharges. However, staff believes that the current performance
metric takes into account the number of discharges through its calculation of the expected rate and that
further adjustment for number of discharges is not warranted. Furthermore, the use of an observed to
expected ratio aligns with other measures such as the NHSN standardized infection ratios. 9 In RY 2020 there were 328 diagnosis groups and 45 PPC/PPC combinations proposed, which results in over
56,000 cells for which a statewide average PPC rate is calculated, majority of which have a normative value of
zero.
Final Recommendations for the Maryland Hospital-Acquired Conditions Program for Rate Year 2021
21
For the RY 2021 policy, staff recommends continuing to require at least 31 discharges per diagnosis
and severity of illness cell. While staff considered raising this even further, concerns about the
comprehensiveness of the measurement were expressed by some stakeholders.
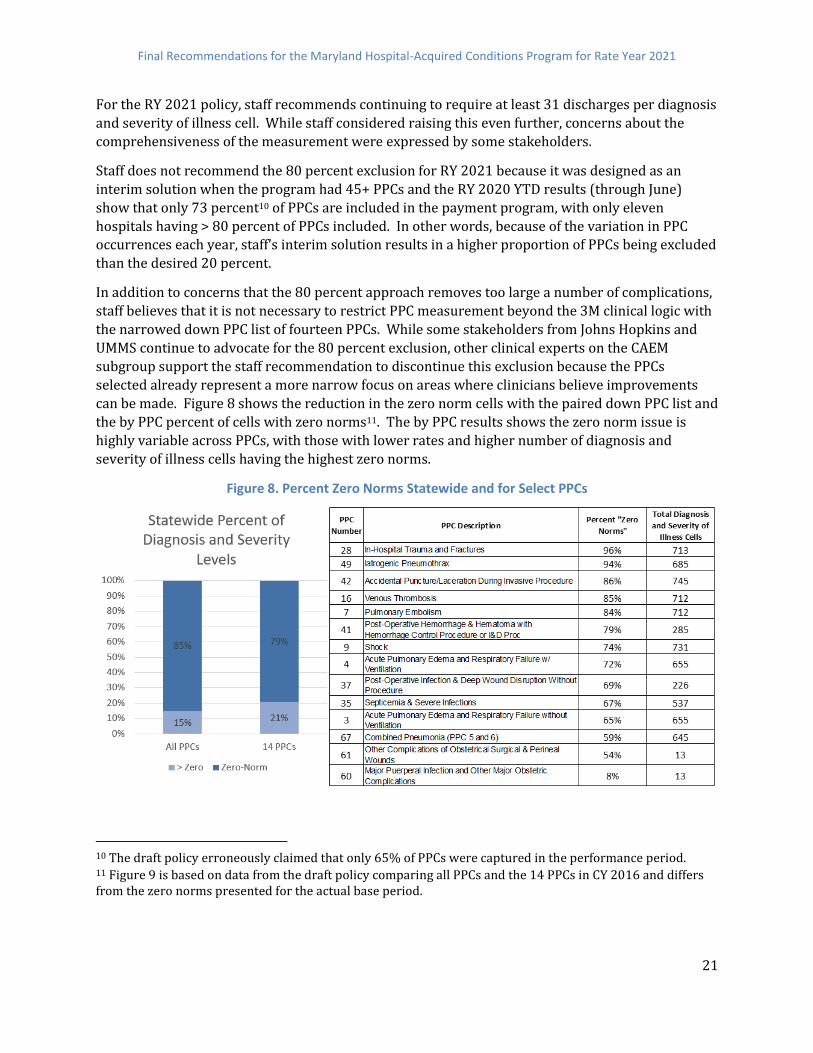
Staff does not recommend the 80 percent exclusion for RY 2021 because it was designed as an
interim solution when the program had 45+ PPCs and the RY 2020 YTD results (through June)
show that only 73 percent10 of PPCs are included in the payment program, with only eleven
hospitals having > 80 percent of PPCs included. In other words, because of the variation in PPC occurrences each year, staff’s interim solution results in a higher proportion of PPCs being excluded
than the desired 20 percent.
In addition to concerns that the 80 percent approach removes too large a number of complications,
staff believes that it is not necessary to restrict PPC measurement beyond the 3M clinical logic with
the narrowed down PPC list of fourteen PPCs. While some stakeholders from Johns Hopkins and
UMMS continue to advocate for the 80 percent exclusion, other clinical experts on the CAEM
subgroup support the staff recommendation to discontinue this exclusion because the PPCs
selected already represent a more narrow focus on areas where clinicians believe improvements
can be made. Figure 8 shows the reduction in the zero norm cells with the paired down PPC list and
the by PPC percent of cells with zero norms11. The by PPC results shows the zero norm issue is
highly variable across PPCs, with those with lower rates and higher number of diagnosis and
severity of illness cells having the highest zero norms.
Figure 8. Percent Zero Norms Statewide and for Select PPCs
10 The draft policy erroneously claimed that only 65% of PPCs were captured in the performance period. 11 Figure 9 is based on data from the draft policy comparing all PPCs and the 14 PPCs in CY 2016 and differs from the zero norms presented for the actual base period.

Final Recommendations for the Maryland Hospital-Acquired Conditions Program for Rate Year 2021
22
An additional consideration proposed in the draft policy was to increase the time period for
determining norms from 1 year to 2 years. As shown in Figure 9, using 2 years for calculating
norms lowers percentage of zero norms for the 14 PPCs (from 81 percent to 73 percent under the
updated version 36 modeling) and increases the number of diagnosis and severity of illness cells
included in payment program because the minimum number of at-risk discharges per cell is kept at
31. The use of the two years norms reduces the percentage of zero norms to a value similar to what
was seen with the 80 percent exclusion (70 percent). It also potentially raises normative values
because it averages across time periods where improvements have been achieved, and thus staff
believes the use of this longer time period provides more stable values given the small numbers.
Based on these analyses staff believes that the RY 2021 policy should use state fiscal year 2017 and
2018 to calculate statewide normative values and that this methodology change significantly
reduces case-mix adjustment concerns.
Figure 9. Percent Zero Norms Using 1 Year vs 2 Years of Data
The RY 2020 policy proposed that statistical techniques such as Bayesian smoothing should be
considered for RY 2021. This was discussed by CAEM, but the statistical complexity remained a
concern for clinicians and quality improvement experts. While staff did not model the use of
Bayesian statistics, it was our understanding that MHA contracted with statistical experts to
develop more reliable risk adjustment and found that it was difficult to employ in a prospective
system. Thus, they could not get agreement from members and did not bring a proposal to CAEM
or PMWG. With additional statistical experts now at the Commission, staff will reconsider during
2019 whether Bayesian statistics or other techniques could be used in a prospective system, at the
same time as 3M national norms are evaluated. It should be noted that the AHRQ PSI do use
Bayesian statistics in its risk adjustment based on national data.

Final Recommendations for the Maryland Hospital-Acquired Conditions Program for Rate Year 2021
23
Attainment Only Prospective System
The CAEM subgroup and PMWG considered recommendations from Commissioners that
performance should be assessed based on attainment only using a scoring methodology that
recognizes improvement for poor performers through reduced attainment penalties. This aligns
with the CMS HACRP program that is attainment only. Furthermore, staff believes that given the
large improvements in PPCs over the past several years, hospital rewards should now focus on
optimal performance and not provide positive revenue adjustments for improvement.
However, it should be noted that stakeholders continue to desire a system that sets prospective
targets and allows hospitals to track performance during the performance period. Thus, the
normative values and performance standards under an attainment only prospective system need to
be set on a historical time period, which differs from the National attainment only program.
Standardized Scoring Methodology
Commission and other stakeholders who have expressed a preference for an attainment only
system believe that such a system could incentivize poor performers to improve through reduced
penalties for improvement. However, the current scoring methodology for attainment assigns all
hospitals that are worse than the statewide median zero points, and thus does not differentiate
hospital performance and may have perverse incentives for poor performers, especially outliers.
Therefore, CAEM and PMWG members collaborated with staff to develop a wider and more
continuous scoring approach. Two approaches for better differentiating performance were
considered: 1) the approach used by the national HACRP to calculate Winsorized z-scores; 2. the
current point-based approach with wider performance standards (i.e., lowering the threshold
where hospitals begin to earn points and raising the benchmark where hospitals receive full
points).
Appendix VI provides details on the Winsorized z-score calculation. However, there was general
consensus that hospitals would prefer adapting the points based scoring approach because of its
consistency with the current program and because of its more intuitive nature. Thus, staff is not
currently recommending to use Winsorized z-scores.
Instead, staff adapted the MHAC points system to allow for greater performance differentiation by
moving the threshold to the value of the observed to expected ratio at the 10th percentile of
hospital performance, moving the benchmark to the value of the observed to expected ratio at the 90th percentile of hospital performance, and assigning 0 to 100 points for each PPC between these
two percentile values. Appendix VII provides the thresholds and benchmarks under the current
methodology and this revised methodology based on 2016 data to show the impact of this
methodology change. Appendix VIII provides the actual FY 2017 and FY 2018 for which CY 2019
performance will be compared, along with a comparison of what the thresholds and benchmarks
would have been with just one year (FY 2018) of data for the normative values. .
As shown in Figure 10, the wider range in the performance standards differentiates hospital
performance at the lower and upper ends and provides more continuous incentives for
improvement. However, because hospitals can begin to earn points for relatively poor
performance, i.e. at the value of the 10th percentile, hospital scores are higher under this modified

Final Recommendations for the Maryland Hospital-Acquired Conditions Program for Rate Year 2021
24
scoring methodology and the preset revenue adjustment scale needs to be adapted so that hospitals
do not receive financial rewards for lackluster performance, as discussed in the next section.
Figure 10. Expanded Scoring Example
Appendix IX provides an example of the points based scoring approach with the 3M cost weights.
Hospital scores across PPCs are calculated by summing the total weighted points awarded to a
hospital, divided by the total possible weighted points (100 per PPC * 3M cost weight). This results
in a percent score (e.g., 85 points earned /100 possible points = 85%) and should not be
interpreted as the percentile of hospital performance.
Prospective Revenue Adjustment Scale
Since RY 2019, the revenue adjustment scale has been based on the mathematical distribution of
possible scores (0 to 100 percent) with a hold harmless zone in the middle of the scale from 45 to
55 percent. This approach is referred to as a prospective revenue adjustment scale as opposed to a
retrospective revenue adjustment scale that determines the scale after the performance period or
by using historical scores to set the scale. Staff continues to support using a prospective scale based
on the range of possible scores, because using a prospective scale provides greater transparency
and predictability for hospitals, which are already assuming risk under a population based revenue
system.
As mentioned above, the use of a wider and more continuous scoring methodology requires that the
revenue adjustment scale be modified. Specifically, the cut point for penalties and rewards should
be adjusted to ensure those who receive positive revenue adjustments are attaining or performing

Final Recommendations for the Maryland Hospital-Acquired Conditions Program for Rate Year 2021
25
well on complications. However, without a national comparison it is difficult to determine an exact
cut point for PPC measurements in an attainment only system, the latter of which were supported
by the CAEM subgroup as two central tenets of the revised MHAC program12.
Given the lack of national norms for the PPCs, staff and stakeholders considered several approaches
for changing the cut point, such as:
applying the average change in scores under the modified scoring approach to the 50
percent cut point
modeling a cut point that results in a distribution of penalties and rewards similar to
that of the current methodology, and
calculating the value of the observed to expected ratio for each PPC at a desired
percentile of performance for rewards for all PPCs (e.g., the values at the 50th or 75th
percentile) and then calculating the percent score that would be associated with that
performance.
Based on all of these approaches staff believes the cut point must be higher than 50% but lower
than 80 percent, and at this time are modeling a cut point of 65 percent. Given a cut point of 65
percent the hold harmless zone would be 60 to 70 percent under the current 10 percent zone
paradigm. The hold harmless zone of 10 percent is important because it reduces the
penalty/reward cliff effect between a score of 49 and 51 percent. However, some Commissioners
and stakeholders have suggested that the hold harmless zone reduces incentives to improve for
those with performance in this range. It should be noted though that the CMS HACRP program,
which only penalizes the lowest quartile of hospitals, has ostensibly a very large hold harmless
zone.
In the draft policy, staff considered non-linear scaling of penalties and rewards, to address
uncertainty regarding the cut point and concerns with the hold harmless zone. This approach,
which was discussed in the RY 2020 policy, reduces the revenue adjustments near the middle of the
scale and maintains higher adjustments for hospitals performing at the high or low ends of the
scale, i.e. outliers. However, as previously noted staff is recommending to continue with the linear scaling with the hold harmless zone because we believe that hospital concerns regarding case-mix
adjustment are mediated with the narrowed down list of PPCs and other methodology changes
being proposed, and take very seriously the input that the non-linear scaling reduces incentives
drastically.
Figure 11 shows the linear scale with a hold harmless zone between 60 and 70 percent, non-linear
with cut point at 65 percent.
12 Currently 3M is working with Medicare claims, large commercial datasets, Maryland data, and other state
Medicaid data to develop national norms, and the Commission will need to consider how these norms could be used
in future years, recognizing Maryland’s coding has been influenced by the use of the PPCs in the MHAC program.

Final Recommendations for the Maryland Hospital-Acquired Conditions Program for Rate Year 2021
26
Figure 11: Linear versus Non-Linear Scaling13
Modeling of Scores and Revenue Adjustments
Scoring Models
Three models were first analyzed to test the impact of moving to an attainment only system. These
models use FY 2017 and FY 2018 for normative values and performance standards (i.e., threshold
and benchmark) and October 2017 to September 2018 for the performance period.
Model 1: Current performance standards and scoring 0 to 10 points for the better of
improvement and attainment
Model 2: Current performance standards and scoring 0 to 10 points for attainment only
Model 3: Wider performance performance standards and scoring 0 to 100 points for attainment only
Figure 12 provides descriptive statistics for the total hospital scores under each of these models. As
would be expected, when moving from improvement and attainment (Model 1) to attainment only
(Model 2) the hospital scores drop from a median score of 51 percent to 43 percent. Under the
wider performance standards (Model 3) scores increase to a median of 63 percent since hospitals
13 At the March meeting, Commissioners voted to amend the linear revenue adjustment scale to have potential rewards of up to 2%. The amended scale is provided in Appendix XIII.

Final Recommendations for the Maryland Hospital-Acquired Conditions Program for Rate Year 2021
27
can begin to score points at a lower percentile of hospital performance, i.e. for performance that is
better than the value of the 10th percentile; this represents a 24 percent increase in the median
score when compared to Model 1. By hospital scores under the three models are shown in
Appendix X.
Figure 12. Hospital Score Models
Revenue Adjustment Scale Modeling
Using scores from the three models presented above, staff modeled revenue adjustments using the
following preset scales:
1. Current Scale: Maximum penalty at 2 percent and maximum reward at 1 percent,
continuous linear scaling with a hold harmless zone between 45 and 55 percent
2. Linear scale with Adjusted cut point: Maximum penalty at 2 percent and maximum
reward at 1 percent and use continuous linear scaling with a hold harmless zone between
60 and 70 percent14
3. Non-Linear Scale with Adjusted cut point: Maximum penalty at 2 percent and maximum
reward at 1 percent and use continuous non-linear scaling with a 65 percent cut point
The modeling of the current scale is for reference only. Staff recommends that the linear scale with
the hold harmless zone be used for RY 2021, but are providing the non-linear option outlined in the
draft policy as well. Figure 13 provides the count of hospitals in the penalty, hold harmless or zero
adjustment, and reward zones. Also provided are the statewide net revenue adjustment, penalties,
rewards, average percent adjustment, and average absolute revenue adjustment (used for realized
risk). Appendix XI contains the by hospital revenue adjustments for the two scales under
consideration under Model 3.
Model 1 scoring with improvement and attainment and the current preset scale, results in 21
hospitals penalized, 6 hospitals in the hold harmless zone, and 20 hospitals rewarded and a
negative net statewide revenue adjustment of $24.5 million ($31.2 M in penalties/$6.7 M in
14 Staff recommends that the average score under the attainment only expanded performance range with an
improvement factor should be used as the cut point for rewards and penalties.

Final Recommendations for the Maryland Hospital-Acquired Conditions Program for Rate Year 2021
28
rewards). Staff does not recommend this model because it maintains improvement, which as
aforementioned is unnecessary after several years of improvement in PPC performance, but is
provided for reference.
As would be expected, the Model 2 attainment only scores with the current preset scale increases
the number of hospitals penalized and the statewide net revenue adjustment is $36.8 million ($42.1
M in penalties/$5.3 M in rewards). The staff believes that an attainment only system with the
current scoring methodology (0 to 10 points) and preset scale is too punitive but presents the modeling of scores and revenue adjustments for comparison.
Model 3 scores use attainment only under wider performance standards and the current preset
scale results in a majority of hospitals being rewarded, with a net positive statewide revenue
adjustments of $18.0 million ($4.6 M in penalties/$22.6 M in rewards). Staff believes that this
model is too generous and that with the wider performance standards that the preset scale cut
point needs to be raised, but again provides the scores and revenue adjustments for comparison.
Figure 13: Revenue Modeling
Model 3 scores using the linear scale and hold harmless zone between 60 and 70 percent results in
negative net revenue adjustment statewide of $7.0 million ($15.7 M in penalties/$8.6 M in
rewards). When this is converted to percent of total inpatient revenue the net change is only -0.08
percent. The reason that staff does not recommend the non-linear scaling is that it drastically
reduces the revenue adjustments statewide with a negative net revenue adjustment statewide of $700 thousand ($3.1 M in penalties/$2.5 million in rewards), which is a net change of of -0.007% of
revenue. While staff indicated in the draft policy that this may be appropriate given the lack of
national performance standards, some stakeholders felt that this reduced the impact of the
program too much given the seriousness of these complications.

Final Recommendations for the Maryland Hospital-Acquired Conditions Program for Rate Year 2021
29
Additional Future Considerations As mentioned previously, staff thanks the members of CAEM and PMWG and other stakeholders for
their input on the RY 2021 MHAC program. The narrowing down of the PPC measures and move to
an attainment only system are important accomplishments that should allow hospitals to focus on
clinically significant complications and be held accountable for performance rates. For future years
it will be important to continue to try and find a national comparison for PPCs, or to move to
measures such as the AHRQ PSIs. In addition, staff should continue to monitor other safety
measures for possible inclusion in the MHAC program, especially for areas such as maternal and
child health. Staff also believes that while there will be a focus on redesigning the readmission
methods in CY 2019, that the review of the QBR program in 2020 will provide an opportunity to
reevaluate complication measures and whether the QBR and MHAC programs should be merged.
Stakeholder Feedback and Staff Response HSCRC received written stakeholder feedback from Anne Arundel Medical Center (AAMC), Johns
Hopkins Health System (JHHS), Maryland Hospital Association (MHA), Medstar Health, Inc., and
CareFirst BCBS. Staff also continued to vet the draft MHAC policy with stakeholders at the January
and February Performance Measurement Workgroup (PMWG) meetings.
There was stakeholder agreement in voicing support for the narrowed down list of PPC measures
proposed for RY 2021, and the use of a wider, attainment only performance scale. There was also conditional support for weighting PPCs differentially in hospitals’ scores using 3M cost weights,
provided the updated weights are evaluated when issued by 3M to ensure they continue to match
clinicians’ expectation of patient harm.
There was not consensus among stakeholders regarding the issues outlined below.
Risk Adjustment MHA and JHHS both express concerns related to the adequacy of the risk adjustment of the PPCs.
JHHS argues that the lack of corrective factors for the indirect standardization used in the
methodology introduces a degree of randomness and instability that can result in a hospital’s
expected values being underestimated. They note further that their concern is heightened with the
discontinuation in RY 2021 of the adjustment applied in RY2020 known as the “80 percent rule,” an
adjustment that restricts the possible combinations of PPCs and diagnoses in the MHAC program to
those where 80% of PPCs occur statewide in the base year. JHHS further supports implementation
of a Bayesian adjustment which adjusts for or smooths small volume events, making them more
statistically stable. MHA also supports continued pursuit of ways to address risk adjustment
concerns. CareFirst BCBS alternatively argues that applying the 80 percent exclusion adjustment
removed a significant percentage of the actual PPCs that occurred in the previous year. In addition,
they assert that focusing on the narrower list of fourteen PPCs and increasing the number of at risk
discharges required for each diagnosis and severity of illness level statewide from 2 to 31
sufficiently addresses the zero-norm concerns.

Final Recommendations for the Maryland Hospital-Acquired Conditions Program for Rate Year 2021
30
Staff Response:
Staff concurs with the CareFirst assessment that the zero norm issue has been minimized by narrowing down the list to the fourteen clinically significant PPCs, increasing the statewide at risk number from 2 to 31 for each diagnosis and severity of illness level, and using a two year period to establish the normative values. Specifically the new rate of zero norms of 73 percent is similar to the 71 percent modeled in the approved RY 2020 policy under the 80 percent exclusion. Furthermore, staff conducted analyses where we ran hospital scores multiple times with one additional observed PPC being added in each iteration to each of the PPCs, and found that the percent revenue adjustments did not vary substantially as discussed in Appendix XII.
National Benchmarks Both MHA and JHHS note their concerns about the non-availability of national benchmarks for
PPCs. MHA recommends that HSCRC staff evaluates Maryland’s hospitals’ performance relative to
the 3M national data set of hospital PPC performance under ICD 10 when it is released to inform
opportunities for continued improvement and risk adjustment. CareFirst supports staff efforts to
consider national norms for calibrating the MHAC methodology in the future, but cautions that we
also consider the program’s impact on coding and documentation related to PPCs in the state as compared with the nation where the program and incentives are different.
Staff Response:
Staff agrees that national benchmarks should be explored when available, and agrees with the concerns that PPC-specific incentives within Maryland may impact coding and documentation patterns and ultimately how Maryland hospital performance may appear relative to national norms.
Reward Penalty Scale MHA and JHHS both support use of a non-linear payment scale in order to focus on outliers because
of concerns with case-mix adjustment and lack of national standards. CareFirst supports the use of
a continuous linear scale with no “hold harmless” zone, and does not understand why scores
around the middle part of the scale are any less precise than the other portions of the distribution.
At the February PMWG meeting, some non-hospital stakeholders expressed concerns when staff
indicated that they were strongly considering the non-linear scale. They stated they felt that the
non-linear scale revenue adjustments were not substantial enough to lead to improvement or
sustained strong performance. They felt that the function of the proposed non-linear scale was a
much wider hold harmless zone, and recommended that staff use the proposed linear scale,
consider an alternative non-linear function, or continue with linear scaling but with wider hold
harmless zone.
Staff Response:
Staff agrees that transitioning to a non-linear scale, with the drastic reduction in revenue adjustments, would dilute incentives and therefore potentially impede continued PPC improvements. This would run counter to the effort that has been undertaken to narrow the PPC list to those that are clinically significant and amenable to improvement through interventions. Also, staff believes that any additional scaling options would require a delay in the policy and that the modeled

Final Recommendations for the Maryland Hospital-Acquired Conditions Program for Rate Year 2021
31
revenue adjustments under the linear scale are reasonable, and further cautions that additional emphasis on the performance outliers may accentuate reliability concerns. These are issues that should continue to be evaluated and staff us amenable to trying to develop a prospective approach for Bayesian smoothing/reliability adjustment should reliability concerns still exist. And last, while the revenue at-risk test is across all quality programs, CMMI may look at individual programs when granting waivers from the CMS programs, especially programs that have significantly reduced at-risk due to non-linear scaling that is unwarranted.
Symmetrical Rewards/Penalties HSCRC Commissioners and the JHHS and MHA letters also recommend that the reward potential be
balanced with the penalty risk at 2% of revenue.
Staff Response
Staff does not agree with increasing the rewards to 2% at this time. This is based on the fact that the national program is a penalty only program. Furthermore, staff does not believe symmetry is necessary or warranted to strengthen the incentives given the large hospital improvements and rewards historically under the program.
Reward/Penalty Cut Point JHHS notes in their letter that the proposed penalty/reward cut point at 65 percent is a substantial
increase from 55 percent, and recommends the cut point remain at or near 55 percent based on a
variety of modelling, sensitivity analyses, and their concerns raised about risk adjustment. CareFirst
supports the staff proposed cut point of 65 percent, as it is based on the statewide average/median
score (62 percent) in modeling and that it builds in improvement based
Staff Response:
As presented in the modeling section, the majority of hospitals would be rewarded if the cut point for penalties and rewards was not adjusted to take into account the higher percent scores under the wider and more continuous scoring methodology. Staff believes that the modeling that JHHS has done indicating lower average scores, and hence a request for a lower cut point, used FY 2018 as both base and performance. This is potentially a circular reference or rather tautological because it does not allow for improvement. Staff further notes that its modeling uses performance period data that overlaps for 3 quarters with the base period data used for generating performance standards. Thus, staff may be underestimating the improvement factor that should be applied to the cut point. Since the latest modeling is consistent with previous modeling where there was no overlap in the base and performance periods, staff does not recommend increasing the cut point.
PPC Appeals JHHS suggests that an appeals process be established for the MHAC program where HSCRC
convenes clinicians to review individual PPC cases in dispute.
Staff Response:
Staff does not support a process for individual PPC cases to be disputed by clinicians. Staff notes the MHAC program is rate-based, and acknowledges that not all PPCs are completely preventable. Staff further notes that we undertake with MHA, hospital clinicians and 3M an annual process to review the PPC clinical assignment and exclusion logic, which results in annual changes to the PPC methodology that 3M

Final Recommendations for the Maryland Hospital-Acquired Conditions Program for Rate Year 2021
32
implements and has also resulted in changes that HSCRC has made outside the PPC grouping software. Therefore, staff believes the current process for clinical vetting with the industry and 3M is adequate. Finally, staff notes that we accept hospital feedback and input throughout the year regarding specific issues related to coding assignment and exclusion logic and work with 3M to resolve the issues as they occur.
Recommendations These are the final recommendations for the Maryland Rate Year (RY) 2021 Hospital-Acquired
Conditions (MHAC) policy:
A. Continue to use 3M Potentially Preventable Complications (PPCs) to assess hospital-
acquired complications.
1. Include focused list of PPCs in payment program that are clinically
recommended and that generally have higher statewide rates and variation
across hospitals.
2. Monitor all PPCs and provide reports for hospitals and other stakeholders.
3. Explore development of national benchmarks for PPCs in future years.
B. Assess hospital performance on attainment only using a wider and more continuous
performance range scale to better differentiates hospital performance, rewarding
high attainment but also incentivizing improvement.
C. Weight the PPCs in payment program by 3M cost weights as a proxy for patient
harm.
D. Convert weighted PPC scores to revenue adjustments using a prospective revenue
adjustment scale with a maximum penalty at 2 percent and maximum reward at 1
percent and continuous linear scaling with a hold harmless zone between 60 and 70
percent.
Commission approved the following change to the staff recommendation:
D. Convert weighted PPC scores to revenue adjustments using a prospective revenue
adjustment scale with a maximum penalty at 2 percent and maximum reward at 2
percent and continuous linear scaling with a hold harmless zone between 60 and 70
percent.

Final Recommendations for the Maryland Hospital-Acquired Conditions Program for Rate Year 2021
33
Appendix I. Clinical Adverse Events Measure Subgroup Report
Health Services Cost Review Commission
Clinical Adverse Events Measure Subgroup Report

Final Recommendations for the Maryland Hospital-Acquired Conditions Program for Rate Year 2021
34
TABLE OF CONTENTS
Introduction
CAEM Subgroup
Measures Selection Process
Payment Methodology Review
Future Considerations
Appendix A: CAEM Members
Appendix B: CAEM Measure Selection Process
Appendix C: PPC Candidate and Final Measure Recommendations
Appendix D. Updated PPC Analysis; Final PPC List Recommendations with Rationale
Appendix E: Additional Details and Key Considerations

Final Recommendations for the Maryland Hospital-Acquired Conditions Program for Rate Year 2021
35
Introduction
The Maryland Health Services Cost Review Commission’s (HSCRC’s or Commission’s) quality-based
measurement and payment initiatives are important policy tools for providing strong incentives to
hospitals for continued improvement to their quality and safety performance. Under the current 5
year (2014-2018) All-Payer Model Agreement (the Agreement) between Maryland and the Centers
for Medicare & Medicaid Services (CMS) there are quality performance requirements for reductions
to inpatient readmissions and hospital acquired conditions (HAC’s). There are also program and performance requirements for all of HSCRC’s quality and value-based programs.
As long as Maryland makes incremental progress towards the Agreement goals, the State receives
automatic exemptions from the CMS Hospital Acquired Conditions Reduction Program (HACRP)
and the Hospital Readmission Reduction program (HRRP). The exemption from the CMS Medicare
Value-Based Purchasing (VBP) program is requested annually. Furthermore, because Maryland sets
all-payer rates and has all acute hospitals under all-payer global budgets, Maryland is also exempt
from the Federal Deficit Reduction Act Hospital-Acquired Condition program (DRA HAC). This
program eliminates additional fee-for-service payments associated with select hospital-acquired
conditions. These exemptions from national quality programs are important because the State of
Maryland’s all-payer global budget system benefits from having autonomous, quality-based
measurement and payment initiatives that set consistent quality incentives across all-payers.
The Maryland Hospital Acquired Conditions (MHAC) program, one of three core quality programs
that the HSCRC administers, was first implemented in state fiscal year 2011 (FY 2011). For the Rate
Year 2020, it places 2 percent of revenue at-risk by scoring a hospital’s performance based on a
broad set of Potentially Preventable Complication (PPC) measures developed by 3M Health
Information Systems. One of the requirements under the current Agreement is for Maryland to
reduce the incidence of PPCs for all-payers by 30 percent by 2018. As noted in the RY 2020 MHAC
policy recommendations, this goal was achieved within the first two years of the Agreement - the
cumulative reduction as of June 2017 is 47.05 percent. However, it should be noted that this
progress must be sustained through the five-year term of the Agreement in order to satisfy the
State’s contractual obligation. For RY 2020, which encompasses the performance results from the
final year of the Agreement (CY 2018), staff recommended minimal changes to the MHAC policy,
with the notable exception of focusing the pay-for-performance incentives on the subset of patients
for whom most complications occur (> 80 percent of PPC).
For RY 2021 and beyond, staff has begun to focus on future policy development to establish quality
strategies and performance goals under the new Total Cost of Care (TCOC) Model, effective
beginning in the CY 2019 performance period. Staff has begun work with key stakeholders to
develop new approaches for reducing HACs in Maryland to support the goals of the TCOC Model.
Specifically, this entails considering new approaches to evaluate Maryland hospital performance
relative to the nation, while at the same time affording the State the opportunity to be aggressive
and progressive in its program(s).

Final Recommendations for the Maryland Hospital-Acquired Conditions Program for Rate Year 2021
36
For the MHAC program updates, staff convened a Clinical Adverse Events Measures (CAEM)
subgroup of the Performance Measurement Workgroup (PMWG) to: 1) consider a broad array of
clinically relevant and preventable hospital patient safety measures including PPC, CMS HAC
measures and other complication measures that cover important all-payer clinical areas that may
not be addressed by the CMS HAC programs; and 2) provide input into stakeholder concerns
regarding the methodology for risk adjustment, scoring and scaling impacting performance linked
payment adjustments. Medisolv was retained as a contractor to assist HSCRC staff in convening the
CAEM subgroup and to provide subject matter expertise. CAEM Subgroup
A call for nominations was issued and members selected from respondents based on their
experience and interest. A list of the CAEM Subgroup members included in Appendix A.
Measures Selection Process
A formal measure selection process was developed in conformance with processes followed by
national consensus organizations such as the National Quality Forum (NQF). The CAEM workgroup
approved and followed the process listed below to select Patient Safety Measures for performance
year 2019 impacting payment year 2021.
a) A preliminary MHAC Measures Under Consideration (MHAC MUC) list was created from
measures currently implemented across a variety of patient safety programs including
MHAC, the patient safety domain of QBR and the CMS programs including DRA HAC, HACRP,
HVBP and the HHS/CMS Measures inventory.
b) Measure selection criteria, listed in Appendix B, were developed and approved for use by
the CAEM subgroup. Measures associated with high-priority, preventable, hospital-safety
events that could be addressed through changes in clinical best practices were identified
and reviewed by the CAEM subgroup through this measure evaluation framework.
c) CAEM subgroup, with assistance from HSCRC staff, applied the measure selection criteria to
the MHAC MUC list in order to produce a final consensus recommendation for consideration
in the MHAC program CY 2019/PY 2021 displayed in Appendices C and D. Results of
measure performance with statistical analysis based on actual historical data from
Maryland hospitals were made available to supplement other information including NQF
endorsements when available. Additional details in some of the key considerations are
discussed in Appendix E.

Final Recommendations for the Maryland Hospital-Acquired Conditions Program for Rate Year 2021
37
Payment Methodology Review
The group discussed overall principles and specific methodology components for the MHAC
program.
The group concurred with the following overall principles that should guide methodology
decisions:
1. Overall transparency in measure selection and payment adjustment methodology.
2. Visibility in alignment or harmonization with national pay-for-performance programs
especially CMS.
3. Measures selected should be actionable and effective in achieving better performance.
4. Measures selected should be balanced and fair to various stakeholders.
5. Measures selected should support the State’s commitments under the TCOC Waiver.
The CAEM subgroup came to consensus on recommending a narrowed list of PPCs for the RY 2021
MHAC program. The group raised concerns about duplicating the NHSN infection measures in the
QBR and MHAC programs and did not recommend inclusion of these measures in the MHAC
program. The group also acknowledged that the AHRQ PSI measures would not be viable for the RY
2021 since all-payer risk adjustment was not available for these measures. Staff presented to the
CAEM subgroup methodology components that could potentially impact performance results and
payment determinations. After review and further discussion, the subgroup recommended an
“Attainment” only framework for payment determination in order to further align with the CMS HAC Reduction Program.
For the PPCs, the group concurred that risk adjustment of observed performance rates is necessary,
especially for outcomes measures, in order to account for variation in patient populations across
hospitals. Indirect standardization is a commonly-used method and is currently incorporated in the
3M PPC methodology utilizing the 3 M APR-DRG Severity of Illness (SOI) subclass categorization.
Some concern was expressed regarding the 3 M methodology for risk adjustment using PPC/APR
DRG/ SOI cells which have only the State of Maryland as the normative reference database to
generate Numerator Expected values. Stakeholders have expressed concern with the "Zero Norm"
issue, which arises because the risk adjustment process segments Maryland's relatively small
inpatient population into a large number of unique combinations of PPC, APR-DRG and SOI groups.
Many of these unique combinations have a statewide mean event rate of zero. It is difficult to
differentiate between a true zero as the expected value versus one resulting simple from data
sparsity. Examples of data analyzed by UMMS and JHH shows significant numbers of such cells
resulting in potentially unexpected results when payment adjustments are applied.
Recommendations to address this issue include increasing the minimum cell size for “At risk”
patients to 30 and to limit the cells to where at least 80 percent of the PPCs occur.
These recommendations will be analyzed further using historical data and are expected to reduce
the number of zero norm cells. Results will be discussed further at the HSCRC Performance
Measurement Work Group meetings. 3M proposed, and the group accepted, the use of the 3M

Final Recommendations for the Maryland Hospital-Acquired Conditions Program for Rate Year 2021
38
Relative Cost Weights to assign relative weights across PPCs in order to generate overall scores for
each hospital.
Future Considerations
The following ideas are included in this report for future consideration by the HSCRC in order to
maintain Maryland’s leadership nationally under the TCOC Model more broadly and more
specifically to improve patient safety through the use of payment adjustments aligned with CMS
programs while also striving towards more aggressive and progressive measurements.
1. Track and share with Maryland hospitals their performance on both the all payer and CMS-
specific Patient Safety and Adverse Events (PSI 90) composite and the ten component PSIs
individually in parallel to the PPCs used for payment determination in CY 2019. Should
variance in performance of “overlapping” PPC/PSI combinations persist to the extent seen
in the MPR analysis, HSCRC could undertake an in-depth analysis to fully understand the
reasons for this variance. Ideally this analysis could also be used for validation to determine
which set of measures (PSI or PPC) more accurately reflects actual adverse events. Finally,
“parallel tracking” of PSIs would also provide direct comparability with CMS national rates.
2. Analysis of the Maryland 2016-2017 PSI data suggests areas of possible interest for tracking
individual PSIs beyond PSI 90 measures representing additional patient safety concerns:
a. Death Rate among Surgical Inpatients with Serious Treatable conditions (PSI 4) of
106 per 1,000 discharges with a total of 334 Numerator cases. These are potentially
preventable post-op complications and CMS has communicated their intent to
undertake the re-endorsement process at the NQF.
b. Another area of potential safety concern is PSI 18 (OB trauma rate – vaginal delivery
with instrument) rate of 107 per 1,000 discharges (545 Numerator events) and
1,336 total numerator events for PSI 19 (OB trauma rate – vaginal delivery without
instrument) with a rate of 16.26 per 1000 discharges. Analysis of the potential
overlap of these two PSIs with PPC 60 and 61 may be helpful in understanding any
potential gaps in OB patient safety coverage within MHAC. Safety related to
childbirth is an important area to cover in the all-payer models (compared to CMS
programs) and is currently a major topic of national conversation as shown in this
ProPublica/NPR study link https://www.propublica.org/article/die-in-childbirth-
maternal-death-rate-health-care-system.
The Joint Commission has added the following measures to its Perinatal Care (PC) Core
Measure Set for reporting in its ORYX® hospital accreditation requirements and has
indicated additional measures related to childbirth will be introduced:

Final Recommendations for the Maryland Hospital-Acquired Conditions Program for Rate Year 2021
39
Set Measure ID: PC-06
Set Measure ID Performance Measure Name
PC-06.0 Unexpected Complications in Term
Newborns - Overall Rate
PC-06.1 Unexpected Complications in Term
Newborns - Severe Rate
PC-06.2 Unexpected Complications in Term
Newborns - Moderate Rate
3. HSCRC should consider development of an Electronic Clinical Quality Measure (eCQM)
strategy more broadly and specifically to support future patient safety measures. CMS
continues to develop new measures including eCQMs in patient safety which is a key
domain within the CMS meaningful measures framework with Hospital Acquired Infections
and Preventable Harms/Complications being the two main areas of focus. Yale New Haven
Health Services Corporation – Center for Outcomes Research and Evaluation (CORE) has
been contracted to develop four hospital-level, outcome eCQMs in patient harm or adverse
patient safety events that can be improved with high quality care. The contract name is
Development, Reevaluation, and Implementation of Outcome/Efficiency Measures for
Hospital and Eligible Clinicians, Option Year 4. The contract number is HHSM-500-2013-
13018I, Task Order HHSM-500-T0001. The specific goal of this project is to develop hospital
harm eCQMs for potential future use in CMS quality reporting programs. Specifically, CORE
has developed four new eCQMs in the areas of hypoglycemia, opioid-related adverse events,
hospital-acquired pressure injury, and acute kidney injury which are currently undergoing
testing.
The following two measures were open for public comment through October 30, 2018.
▪ Hospital Harm – Severe Hyperglycemia
▪ Hospital Harm – Medication-Related Bleeding
More information on these measures can be found at this link.
https://www.cms.gov/Medicare/Quality-Initiatives-Patient-Assessment-
Instruments/MMS/PC-Updates-on-Previous-Comment-Periods.html#Hospital%20Harm While these measures are still under development HSCRC should proactively consider
enhancing its data management capability including consumption of standardized EHR
datasets for quality reporting from hospitals and having the ability to compute measure
results from these data. This important capability would be important as EHR data becomes
more available and is used increasingly by CMS and other payers for both eCQMs and risk
adjustment of claims-based hybrid measures in the future.

Final Recommendations for the Maryland Hospital-Acquired Conditions Program for Rate Year 2021
40
Appendix A: CAEM Members
Richard M. Day
Senior Director, Systems Engineering and Quality Improvement
The Johns Hopkins Hospital and Health System
Armstrong Institute for Patient Safety and Quality
Terry Fairbanks, MD, MS
Assistant Vice President, Ambulatory Quality & Safety, MedStar Health
Founding Director, National Center for Human Factors in Healthcare, MedStar Institute for Innovation
Kristen Geisler
Managing Director
Berkeley Research Group, LLC
Joy Gill
Sr. Manager, Clinical Data Analysis
Adventist HealthCare, Inc.
Tina Gionet
Patient Safety Officer
Sinai Hospital of Baltimore
Lisa Grubb
Senior Director of Quality Management
Howard County General Hospital
Johns Hopkins Medicine
Abel Joy, MD
Assistant Professor, Director of Inpatient Hospitalist Services Operations
University of Maryland Medical Center
Stephanie Klapper
Deputy Director for Community Outreach
Maryland Citizens' Health Initiative
Traci LaValle
Vice President, Financial Policy & Advocacy
Maryland Hospital Association
Sheila McLean
Vice President
Health Quality Innovators
Stephen T. Michaels, MD

Final Recommendations for the Maryland Hospital-Acquired Conditions Program for Rate Year 2021
41
Chief Operating Officer, Chief Medical Officer
MedStar St. Mary’s Hospital
Dale N. Schumacher, MD, MPH
President
Rockburn Institute
Kristin L. Seidl, PhD
Clinical Data Scientist
University of Maryland Medical Center
Michael Sokolow
Director of Quality Management Business Intelligence
University of Maryland Medical System
James Trumble, MD, MBA
Medical Director, Physician Utilization
Frederick Regional Health System
Harold Tucker, MD
Chief Medical Officer
GBMC HealthCare System
Stephen Winn
Senior Director, Encounter Infometrics and Operations
Mid-Atlantic Permanente
David A. Zolet, MD
Physician Advisor
Sinai Hospital of Baltimore
CAEM Project Contractor, HSCRC, MHCC Staff
Zahid Butt, MD
CEO
Medisolv
Dianne Feeney
Associate Director, Quality Initiatives
HSCRC
Alyson Schuster, PhD
Associate Director, Performance Measurement
HSCRC
Theressa Lee
Director, Center for Quality Measurement and Reporting
MHCC

Final Recommendations for the Maryland Hospital-Acquired Conditions Program for Rate Year 2021
42
Appendix B: CAEM Measure Selection Process
Assessment Criteria Definition Decision Logic
1) The measure addresses a
critical MHAC program
objective.
• A. Patient safety measures used in current
CMS payment or public reporting programs • OR • The measure reflects Adverse Events
performance in key clinical areas within
acute care hospital setting AND is currently
endorsed by the NQF.
Yes: Support inclusion of
Measure in MHAC 2021.
• B. The measure reflects Adverse Events
performance in key clinical areas within
acute care hospital setting but is NOT
currently endorsed by the NQF.
Yes: Review can continue
No: Measure will receive a
Do Not Support
2) The measure is evidence-
based and is strongly linked
to a specific safety challenge
or outcome.
• The measure has a strong scientific
evidence-base to demonstrate that when
implemented can lead to the desired
outcome(s) and addresses unwarranted or
significant variation in care that is evidence
of a patient safety challenge.
Yes: Review can continue
No: Measure will receive a
Do Not Support
3) The measure contributes
to efficient use of
measurement resources
and/or supports alignment of
measurement across
programs.
The measure is superior to an existing
measure in the MHAC program;
OR
Captures a broad population (e.g. All-
Payer vs. Medicare only);
OR
Contributes to alignment between
measures in other reporting programs)
Yes: Review can continue
No: Highest rating can be
Refine and Reconsider.

Final Recommendations for the Maryland Hospital-Acquired Conditions Program for Rate Year 2021
43
Assessment Criteria Definition Decision Logic
4) The measure can be
feasibly reported without
adding significant reporting
burden
The measure can be operationalized for
MHAC 2021 i.e. the measure is currently in
“production” for at least one year and will
be available by Sept 30, 2018 for use in
CY 2019 discharges
AND
The value to patients/consumers
outweighs any burden of implementation
for hospitals.
Yes: Review can continue
No: Highest rating can be
Refine and Reconsider.
5) The measure is reliable and
valid for reporting and
analysis at the Hospital level
The measure is fully developed, and
specifications including Risk Adjustment
methodology, if needed, are provided;
AND
Measure testing has demonstrated
Reliability and Validity
OR
Case occurrences indicate clinical face
validity.
AND
Comparative Benchmarks, preferably
National are available
Yes: Measure could be
Supported
No: Highest rating can be
Refine and Resubmit.
6) The measure has high
Usability
Measure is clinically actionable at the
Hospital level
AND
Shows enough variation in risk adjusted
performance to be usable by HSCRC for
Payment Adjustments AND/OR usable by
consumers in public reporting programs
Yes: Measure could be
Supported
No: Highest rating can be
Refine and Resubmit.

Final Recommendations for the Maryland Hospital-Acquired Conditions Program for Rate Year 2021
44
Assessment Criteria Definition Decision Logic
7) If a measure is in current
use, no unreasonable
implementation issues that
outweigh the benefits of the
measure have been identified.
Feedback from implementers or end users
has not identified:
Any unreasonable implementation issues
that outweigh the benefits of the measure;
OR
Any negative unintended consequences
(e.g., premature discharges, overuse or
inappropriate use of care or treatment,
limiting access to care);
Yes: Measure can be
Supported
No: The highest rating can
be Conditional Support.

Final Recommendations for the Maryland Hospital-Acquired Conditions Program for Rate Year 2021
45
Decision Category Assignment Guide
Decision Category Evaluation Criteria
Support to Include in MHAC The measure meets all the required CAEM SG Measure Evaluation
Criteria.
Conditional Support for
Inclusion in MHAC
The measure is fully developed and tested and meets Criteria 1 B - 6 but
not Criteria 7. PMWG has the discretion to propose the measure.
Refine and Resubmit for
Inclusion in MHAC
The measure meets Criteria 1B-3 but needs modifications. A designation
of this decision category assumes at least one Criteria 3-6 is not met.
CAEM SG will provide a rationale that outlines each suggested refinement
Modifications suggested by CAEM SG would be made before the deadline
for acceptance in the MHAC 2021 program.
Do Not Support for Inclusion
in MHAC
The measure under consideration does not meet Measure Selection
Criteria 1 and 2.

Final Recommendations for the Maryland Hospital-Acquired Conditions Program for Rate Year 2021
46
Appendix C: PPC Candidate and Final Measure Recommendations
CAEM Subgroup Initial PPC Analysis and Recommendation:
CY 2016-CY 2017 PPC data with >1 expected and>10 at-risk^
PPC
# PPC Description
Eligible
Hospitals
PSI-
90
Observed
PPCs
At Risk
Discharges
Obs/At-
Risk*1,000
Reliability
Assessment~
Predictive
Validity
Assessment~
Suggest
25 Renal Failure with Dialysis 27 X 70
597,324 0.12 Slight Low
4
Acute Pulmonary Edema and
Respiratory Failure
with Ventilation 47 X 936
707,294 1.32 Substantial Adequate include
9 Shock 46 1042
840,672 1.24 Substantial Adequate include
16 Venous Thrombosis 44 X 306
830,067 0.37 Substantial Adequate include
35 Septicemia & Severe Infections 47 X 868
298,994 2.90 Substantial Adequate include
7 Pulmonary Embolism 44 X 426
831,445 0.51 Moderate Low Consider
5
Pneumonia & Other Lung
Infections 47 843
384,744 2.19 Substantial Low
include
as
Combined
PPC 67 6 Aspiration Pneumonia 47 537
720,408 0.75 Moderate Adequate
3
Acute Pulmonary Edema and
Respiratory Failure without
Ventilation 47 X 1313
707,296 1.86 Substantial Adequate include
49 Iatrogenic Pneumothorax 41 X 162 0.19 Fair Low include

Final Recommendations for the Maryland Hospital-Acquired Conditions Program for Rate Year 2021
47
PPC
# PPC Description
Eligible
Hospitals
PSI-
90
Observed
PPCs
At Risk
Discharges
Obs/At-
Risk*1,000
Reliability
Assessment~
Predictive
Validity
Assessment~
Suggest
844,412
42
Accidental Puncture/Laceration
During Invasive
Procedure 44 X 459
908,377 0.51 Moderate Low include
31 Decubitus Ulcer 47 X 76
251,790 0.30 Moderate Adequate include
37
Post-Operative Infection &
Deep Wound Disruption
Without Procedure 41 341
133,289 2.56 Moderate Low include
41
Post-Operative Hemorrhage &
Hematoma with
Hemorrhage Control Procedure
or I&D Proc 36 X 183
250,945 0.73 Moderate Adequate include
40
Post-Operative Hemorrhage &
Hematoma without
Hemorrhage Control Procedure
or I&D Proc 44 1103
315,393 3.50 Moderate Adequate
Do not
include
28
In-Hospital Trauma and
Fractures 39 X 116
848,033 0.14 Fair Low include
60
Major Puerperal Infection and
Other Major Obstetric
Complications 27 124
125,707 0.99 Moderate Adequate Include
61
Other Complications of
Obstetrical Surgical & Perineal
Wounds 28 104
128,344 0.81 Moderate Low Include

Final Recommendations for the Maryland Hospital-Acquired Conditions Program for Rate Year 2021
48
PPC
# PPC Description
Eligible
Hospitals
PSI-
90
Observed
PPCs
At Risk
Discharges
Obs/At-
Risk*1,000
Reliability
Assessment~
Predictive
Validity
Assessment~
Suggest
14
Ventricular Fibrillation/Cardiac
Arrest. 47 1342
740,927 1.81 Substantial Adequate monitoring
1
Stroke & Intracranial
Hemorrhage 46 675
861,638 0.78 Moderate Low monitoring
8
Other Pulmonary
Complications 47 568
588,283 0.97 Moderate Low monitoring
11 Acute Myocardial Infarction 46 607
848,365 0.72 Moderate Low monitoring
18
Major Gastrointestinal
Complications with Transfusion
or Significant Bleeding 41 148
817,454 0.18 Moderate Adequate
17
Major Gastrointestinal
Complications without
Transfusion or Significant
Bleeding 47 391
846,085 0.46 Substantial Adequate
63
Postoperative Respiratory
Failure with Tracheostomy 16 48
3,961 12.12 Slight Low
54
Infections due to Central
Venous Catheters 28 72
761,808 0.09 Slight Low
38
Post-Operative Wound
Infection & Deep Wound
Disruption with Procedure 15 ? 38
165,445 0.23 Moderate Low
51
Gastrointestinal Ostomy
Complications 42 179
863,404 0.21 Fair Low
21 Clostridium Difficile Colitis 47 783 5.54 Substantial Adequate

Final Recommendations for the Maryland Hospital-Acquired Conditions Program for Rate Year 2021
49
PPC
# PPC Description
Eligible
Hospitals
PSI-
90
Observed
PPCs
At Risk
Discharges
Obs/At-
Risk*1,000
Reliability
Assessment~
Predictive
Validity
Assessment~
Suggest
141,260
48
Other Complications of
Medical Care 37 157
840,758 0.19 Moderate Low
34 Moderate Infectious 31 85
295,818 0.29 Fair Low
2 Extreme CNS Complications 32 100
691,152 0.14 Fair Adequate
20
Other Gastrointestinal
Complications without
Transfusion or Significant
Bleeding 41 271
804,867 0.34 Fair Low
39 Reopening Surgical Site 36 331
230,628 1.44 Moderate Low
50
Mechanical Complication of
Device, Implant &
Graft 44 469
862,621 0.54 Moderate Low
15
Peripheral Vascular
Complications except Venous
Thrombosis 34 160
806,577 0.20 Fair Low
44
Other Surgical Complication -
Mod 30 80
231,235 0.35 Slight Low
52
Inflammation & Other
Complications of Devices,
Implants or Grafts Except
Vascular Infection 47 597
871,769 0.68 Substantial Adequate

Final Recommendations for the Maryland Hospital-Acquired Conditions Program for Rate Year 2021
50
PPC
# PPC Description
Eligible
Hospitals
PSI-
90
Observed
PPCs
At Risk
Discharges
Obs/At-
Risk*1,000
Reliability
Assessment~
Predictive
Validity
Assessment~
Suggest
53
Infection, Inflammation &
Clotting Complications
of Peripheral Vascular
Catheters & Infusions 39 131
849,265 0.15 Substantial Adequate
19 Major Liver Complications 34 139
798,285 0.17 Fair Low
47 Encephalopathy 38 173
572,155 0.30 Substantial Adequate
66
Catheter-Related Urinary Tract
Infection 0
27
Post-Hemorrhagic & Other
Acute Anemia with
Transfusion 43 537
641,587 0.84 Excellent Adequate
26 Diabetic Ketoacidosis & Coma 29 57
753,939 0.08 Moderate Low
33 Cellulitis 44 352
728,231 0.48 Slight Low
65
Urinary Tract Infection without
Catheter 32 94
694,707 0.14 Excellent Adequate
23 GU Complications Except UTI 35 119
807,671 0.15 Fair Low
45 Post Procedure Foreign Body 47 27
300,859 0.09 Slight Low
13 Other Cardiac Complications 39 161
787,985 0.20 Substantial Low

Final Recommendations for the Maryland Hospital-Acquired Conditions Program for Rate Year 2021
51
PPC
# PPC Description
Eligible
Hospitals
PSI-
90
Observed
PPCs
At Risk
Discharges
Obs/At-
Risk*1,000
Reliability
Assessment~
Predictive
Validity
Assessment~
Suggest
10 Congestive Heart Failure 42 225
725,467 0.31 Substantial Low
64
Other In-Hospital Adverse
Events 45 303
885,064 0.34 Excellent Adequate
36 Acute Mental Health Changes 0
29
Poisonings except from
Anesthesia 34 90
764,985 0.12 Slight Low
59
Medical & Anesthesia Obstetric
Complications 32 222
132,493 1.68 Moderate Low
68
Gastrointestinal Complications:
PPC 17 and 18 47 542
846,085 0.64 Substantial Adequate
67
General Combination PPC: PPC
25, 26, 63, 64 47 497
902,336 0.55 Excellent Adequate
71
Infection combination: PPC 34,
54,66 42 177
919,882 0.19 Moderate Low
^This data based on preliminary analysis; final numbers may vary slightly.
~Calculated by Mathematica Policy Research. Given large improvements over time, some measures may have low predictive validity or reliability;
however, input regarding content and face validity by clinicians was also used to determine PPC inclusion.
Key
PPC # Obs/At-Risk Discharges*1,000 Reliability
Assessment
Predictive Validity Assessment
Monitor only Rate >1.0 per 1,000 Excellent or Substantial Adequate
Rate >0.5 per 1,000 Moderate

Final Recommendations for the Maryland Hospital-Acquired Conditions Program for Rate Year 2021
52
Appendix D. Updated PPC Analysis; Final PPC List Recommendations with Rationale
PPC
#
PPC
Description
Eligible
Hospitals
Observed
PPCs
(2 yrs)
At
Risk
Discha
rges
(2 yrs)
3M v33
PPC Wt-
Based
Marginal
Cost
HSCRC Staff Recommendation
3 Acute
Pulmonary
Edema and
Resp Failure
w/o Ventilation
46 1238 696950 0.7958 Meets rate and variation criteria. Clinically supported. Small
overlap with PSI 11 Postoperative Respiratory Failure. PSI
is limited to post-operative patients but PPC applies to
broader patient population.
Include in payment program
4 Acute
Pulmonary
Edema, Resp
Failure
w/ventilation
47 848 698946 2.7409 Meets rate and variation criteria. Clinically supported. Small
overlap with PSI 11 Postoperative Respiratory Failure. PSI
is limited to post-operative patients but PPC applies to
broader patient population.
Include in payment program
7 Pulmonary
Embolism
44 407 824106 1.3671 Nearly meets rate criteria and has variation. Clinically
preventable with well-defined interventions. Overlap 25%
with PSI 12 Perioperative Pulmonary Embolism and Deep
Vein Thrombosis but PPC includes broader patient
population. DRA HAC is measured only in patients with total
knee or hip replacements.
Include in payment program.
9 Shock 46 984 833605 1.5133 Meets rate criteria and has variation Clinically preventable.
Include in payment program.

Final Recommendations for the Maryland Hospital-Acquired Conditions Program for Rate Year 2021
53
PPC
#
PPC
Description
Eligible
Hospitals
Observed
PPCs
(2 yrs)
At
Risk
Discha
rges
(2 yrs)
3M v33
PPC Wt-
Based
Marginal
Cost
HSCRC Staff Recommendation
16 Venous
Thrombosis
44 297 822712 1.4346 Below rate threshold but has variation. Clinically preventable
with well-defined interventions. Some overlap with PPC 12
but PPC rate is lower but with applicability to a broader
population. DRA HAC is measured only in patients with total
knee or hip replacements.
Include in the payment program.
28 In-Hospital
Trauma and
Fractures
38 110 827456 0.3353 In hospital injuries are highly preventable and serious. PPC
includes more injury types than PSI 08 In Hospital Fall with
Hip Fracture Rate but PPC rate is lower as it is applicable to
a broader patient population. DRA HAC applies to a
broader set of in hospital injuries. Include in payment
program.
35 Septicemia &
Severe
Infections
47 801 289205 1.3722 Meets rate and variation criteria. Clinically important.
Include in payment program.
37 Post-Operative
Infection &
Deep Wound
Disruption
Without
Procedure
39 319 128674 1.2701 Meets rate and variation criteria. Clinically preventable.
Overlaps slightly with PSI 14- Postop Wound Dehiscence,
and with NHSN SSI and with DRA HAC but PPC is broader
in scope.
Include in payment program.

Final Recommendations for the Maryland Hospital-Acquired Conditions Program for Rate Year 2021
54
PPC
#
PPC
Description
Eligible
Hospitals
Observed
PPCs
(2 yrs)
At
Risk
Discha
rges
(2 yrs)
3M v33
PPC Wt-
Based
Marginal
Cost
HSCRC Staff Recommendation
41 Post-Operative
Hemorrhage &
Hematoma w/
Hemorrhage
Control
Procedure or
I&D
32 167 241162 1.0951 Meets rate and variation criteria. Clinically preventable.
Overlap with PSI 09- Perioperative Hemorrhage or
Hematoma Rate with PSI having similar applicability but
higher rate.
Include in payment program.
42 Accidental
Puncture/Lacer
ation During
Invasive
Procedure
43 440 897351 0.4466 Meets rate and variation criteria. Clinically supported.
Overlap with PSI 15 Unrecognized Abdominopelvic
Accidental Puncture or Laceration Rate. PPC is applicable
to a much broader patient population so has a lower rate.
Include in the payment program.
49 Iatrogenic
Pneumothorax
40 154 829953 0.6090 Does not meet rate criteria but observed events are >100.
This is an important clinical measure with national focus.
There is hospital variation in performance, some PSI 06
Iatrogenic Pneumothorax Rate overlap and DRA HAC is
applicable to patients with infusion catheter insertion
procedures only.
Include in the payment program.

Final Recommendations for the Maryland Hospital-Acquired Conditions Program for Rate Year 2021
55
PPC
#
PPC
Description
Eligible
Hospitals
Observed
PPCs
(2 yrs)
At
Risk
Discha
rges
(2 yrs)
3M v33
PPC Wt-
Based
Marginal
Cost
HSCRC Staff Recommendation
60 Major Puerperal
Infection and
Other Major
Obstetric
Complications
27 123 125667 0.1729 Meets rate and variation criteria; 3M believes clinical
concerns are addressed in the risk adjustment, and will
address this PPC's overlap with other PPCs in v. 36.
Obstetric morbidity is clinically important in an all-payer
environment.
Include in the payment program.
61 Other
Complications
of Obstetrical
Surgical &
Perineal
Wounds
25 100 122183 0.1172 Meets rate and variation criteria; 3M believes clinical
concerns are addressed in the risk adjustment, and will
address this PPC's overlap with other PPCs in v. 36.
Obstetric morbidity is clinically important in an all-payer
environment.
Include in the payment program.
67 Pneumonia
Combo
47 1282 713219 1.3002 Meets rate and variation criteria. Clinically supported in
combined PPC.
Include in payment program.

Final Recommendations for the Maryland Hospital-Acquired Conditions Program for Rate Year 2021
56
Appendix E: Additional Details and Key Considerations
Three sets of measures in the MHAC MUC list were evaluated in more detail. These include 3M PPCs
used in the current MHAC program and two sets of patient safety measures used in the CMS HACRP
and HVBP programs; AHRQ Patient Safety Indicators (PSI) and select CDC/NHSN Hospital Acquired
Infection measures (HAI).
CDC calculates standardized infection ratios (SIRs) and CMS includes Central Line Associated Blood
Stream Infection (CLABSI), Catheter Associated Urinary Tract Infection (CAUTI), Colon and
Abdominal Hysterectomy Surgical Site Infections (SSI), Methicillin Resistant Staphylococcus Aureus
(MRSA) bacteremia, and Clostridium Difficile Infection (CDI) measures in both the HACRP and
patient safety domain of the HVBP pay-for-performance programs. SIRs are ratios of observed-to-
predicted numbers of healthcare- associated infections (HAIs). The number of predicted infections
is calculated using multivariable regression models generated from nationally aggregated data
during a baseline time period. These models are applied to a facility’s denominator and risk-factor
data to generate a predicted number of infections. The CLABSI and CAUTI measures are risk
adjusted at the hospital level and patient care unit level. The SSI measures are risk adjusted at the
procedure level. MRSA bacteremia and CDI measures are risk-adjusted at the hospital level. The
CLABSI, CAUTI, and SSI measures use NHSN chart-abstracted surveillance data. MRSA bacteremia
and CDI measures use NHSN laboratory- identified surveillance data, which hospitals report to
NHSN. If the predicted number of HAIs is less than one, the CDC will not calculate an SIR for CLABSI,
CAUTI, SSI, MRSA bacteremia, or CDI. The CDC will also not calculate an SIR if the hospital has insufficient data. The CDC will not calculate an SIR for CDI if the community-onset prevalence rates
are within outlier bounds and CMS will not include any such measures in the Domain 2 or Total
HAC score calculations. CDC encourages hospitals to report data monthly within 30 days of the
close of a month. Hospitals can however review and correct the CDC NHSN HAI chart-abstracted or
laboratory-identified data for the full 4.5 months following the end of the reporting quarter data
submitted from NHSN to the CMS Hospital Inpatient Quality Reporting (IQR) Program. Immediately
following the submission deadline, the CDC creates a data file for CMS to use in quality reporting
and pay-for-performance programs.
CMS had proposed to remove these measures from the HVBP program in order to reduce
duplication of measures in its various programs. In its final rule for 2019 performance year CMS
reversed this proposal in light of multiple stakeholder comments against this proposal.
Stakeholders expressed concern that since CMS was not increasing revenue at-risk in the HACRP to
offset the reduction in revenue at-risk related to patient safety in the HVBP program, it would in
effect be reducing the total revenue at-risk inpatient safety. CMS also considered performance-
based penalties and rewards as desirable features of the HVBP program as opposed to the HACRP
being a penalty only program. In order to avoid duplication of HAI patient safety measures in
multiple Maryland pay-for-performance programs and in view of HSCRC’s ability to increase

Final Recommendations for the Maryland Hospital-Acquired Conditions Program for Rate Year 2021
57
weights assigned to these measures in the Quality Based Reimbursement (QBR) program it was
decided not to include these measures in the MHAC program at this time.
Although most of the AHRQ PSIs met key measure selection criteria by virtue of their NQF
endorsement and PSI 90 would have aligned MHAC more directly to CMS HAC Reduction Program
they were nonetheless considered infeasible for the CY 2019 performance period due to
unavailability of the All-Payer Risk Adjusted Version 2018 AHRQ software using one full year of ICD
10 hospital discharge data reference data (HCUP and SID) from CY 2016. AHRQ has released an All-
Payer 2018 Version of the PSI software producing only Observed PSI rates without risk adjustment.
A Medicare only Risk Adjusted Version 8 PSI 90 software is currently available from CMS but would
not have met the MHAC all-payer requirement.
Ten individual PSIs are included in the AHRQ PSI 90 composite measure. Performance of individual
PPCs considered “overlapping” with PSI 90 component measures and recommended for their
clinical importance, volumes, variation in performance across Maryland hospitals and at least
moderate reliability were compared by Mathematica Policy Research (MPR) using the Maryland
hospital discharge data that was most recently available. Results of this analysis in the Table below
show significant variability in the Numerator and Denominator populations and their performance
rates for each matched set of PSI/PPC combinations.
Comparison of PSI 90 Component PSI vs. matching PPC Categorization of
Discharges from Acute Maryland Hospitals in 2016-2017
Measures Compared Measure
Inclusion
Numerator Cases Denominator Cases
Frequency Percent Frequency Percent
PSI 03: Pressure Ulcer
PPC 31: Pressure Ulcers
PSI and PPC 78 5% 232,044 40%
PSI Only 1,580 95% 347,286 59%
PPC Only 0 0% 4,511 1%
PSI 06: Iatrogenic
Pneumothorax Rate
PPC 49: Iatrogenic
Pneumothorax
PSI and PPC 62 26% 678,312 67%
PSI Only 85 35% 174,105 17%
PPC Only 95 39% 158,280 16%
PSI 08: In Hospital Fall with Hip
Fracture Rate
PPC 28: In-Hospital Trauma and
Fractures
PSI and PPC 46 24% 639,474 66%
PSI Only 71 37% 76,032 8%
PPC Only 77 40% 252,146 26%
PSI 09: Perioperative
Hemorrhage or Hematoma
Rate
PPC 41: Peri-Operative
Hemorrhage & Hematoma with
Hemorrhage Control Procedure
or I&D Procedure
PSI and PPC 124 21% 186,281 65%
PSI Only 407 69% 34,501 12%
PPC Only 62 10% 65,793 23%

Final Recommendations for the Maryland Hospital-Acquired Conditions Program for Rate Year 2021
58
Measures Compared Measure
Inclusion
Numerator Cases Denominator Cases
Frequency Percent Frequency Percent
PSI 10: Postoperative Acute
Kidney Injury Requiring Dialysis
Rate
PPC 25: Renal Failure with
Dialysis
PSI and PPC 18 11% 117,181 16%
PSI Only 86 51% 17,122 2%
PPC Only 66 39% 610,198 82%
PSI 11: Postoperative
Respiratory Failure Rate
PPC 03: Acute Pulmonary
Edema and Respiratory Failure
without Ventilation
PSI and PPC 79 5% 103,100 14%
PSI Only 411 24% 12,119 2%
PPC Only 1,234 72% 603,232 84%
PSI 11: Postoperative
Respiratory Failure Rate
PPC 04: Acute Pulmonary
Edema and Respiratory Failure
with Ventilation
PSI and PPC 122 9% 103,282 14%
PSI Only 368 28% 11,937 2%
PPC Only 819 63% 603,420 84%
PSI 12: Perioperative
Pulmonary Embolism or Deep
Vein Thrombosis Rate
PPC 07: Pulmonary Embolism
PSI and PPC 327 25% 193,929 22%
PSI Only 876 67% 41,913 5%
PPC Only 104 8% 646,464 73%
PSI 12: Perioperative
Pulmonary Embolism or Deep
Vein Thrombosis Rate
PPC 16: Venous Thrombosis
PSI and PPC 136 10% 193,882 22%
PSI Only 1,067 77% 41,960 5%
PPC Only 174 13% 646,632 73%
PSI 13: Postoperative Sepsis
Rate
PPC 35: Septicemia & Severe
Infections
PSI and PPC 132 11% 25,838 6%
PSI Only 305 26% 104,487 26%
PPC Only 727 62% 270,936 68%
PSI 14: Postoperative Wound
Dehiscence Rate
PPC 38: Post-Procedural
Infection and Deep Wound
Disruption with Procedure
PSI and PPC 9 8% 44,734 16%
PSI Only 56 53% 25,974 10%
PPC Only 41 39% 201,391 74%
PSI 15: Unrecognized
Abdominopelvic Accidental
Puncture or Laceration Rate
PPC 42: Accidental
Puncture/Laceration During
Invasive Procedure
PSI and PPC 102 19% 118,342 13%
PSI Only 89 16% 35,575 4%
PPC Only 351 65% 770,804 83%
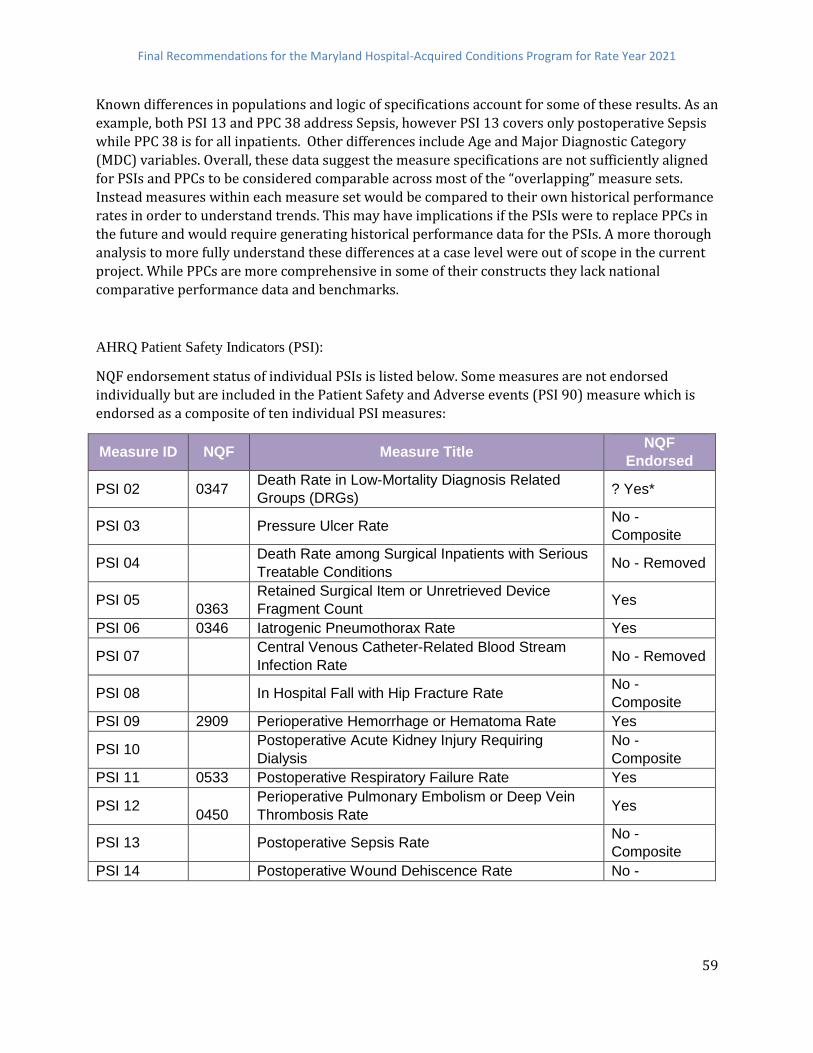
Final Recommendations for the Maryland Hospital-Acquired Conditions Program for Rate Year 2021
59
Known differences in populations and logic of specifications account for some of these results. As an
example, both PSI 13 and PPC 38 address Sepsis, however PSI 13 covers only postoperative Sepsis
while PPC 38 is for all inpatients. Other differences include Age and Major Diagnostic Category
(MDC) variables. Overall, these data suggest the measure specifications are not sufficiently aligned
for PSIs and PPCs to be considered comparable across most of the “overlapping” measure sets.
Instead measures within each measure set would be compared to their own historical performance
rates in order to understand trends. This may have implications if the PSIs were to replace PPCs in
the future and would require generating historical performance data for the PSIs. A more thorough
analysis to more fully understand these differences at a case level were out of scope in the current
project. While PPCs are more comprehensive in some of their constructs they lack national
comparative performance data and benchmarks.
AHRQ Patient Safety Indicators (PSI):
NQF endorsement status of individual PSIs is listed below. Some measures are not endorsed
individually but are included in the Patient Safety and Adverse events (PSI 90) measure which is
endorsed as a composite of ten individual PSI measures:
Measure ID NQF Measure Title NQF
Endorsed
PSI 02 0347 Death Rate in Low-Mortality Diagnosis Related
Groups (DRGs) ? Yes*
PSI 03 Pressure Ulcer Rate No -
Composite
PSI 04 Death Rate among Surgical Inpatients with Serious
Treatable Conditions No - Removed
PSI 05
0363
Retained Surgical Item or Unretrieved Device
Fragment Count Yes
PSI 06 0346 Iatrogenic Pneumothorax Rate Yes
PSI 07 Central Venous Catheter-Related Blood Stream
Infection Rate No - Removed
PSI 08 In Hospital Fall with Hip Fracture Rate No -
Composite
PSI 09 2909 Perioperative Hemorrhage or Hematoma Rate Yes
PSI 10 Postoperative Acute Kidney Injury Requiring
Dialysis
No -
Composite
PSI 11 0533 Postoperative Respiratory Failure Rate Yes
PSI 12
0450
Perioperative Pulmonary Embolism or Deep Vein
Thrombosis Rate Yes
PSI 13 Postoperative Sepsis Rate No -
Composite
PSI 14 Postoperative Wound Dehiscence Rate No -

Final Recommendations for the Maryland Hospital-Acquired Conditions Program for Rate Year 2021
60
Measure ID NQF Measure Title NQF
Endorsed
Composite
PSI 15 0345 Unrecognized Abdominopelvic Accidental
Puncture/Laceration Rate ? Yes*
PSI 16 0349 Transfusion Reaction Count Yes
PSI 17 Birth Trauma Rate - Injury to Neonate No - Removed
PSI 18 Obstetric Trauma Rate - Vaginal Delivery with
Instrument No
PSI 19 Obstetric Trauma Rate - Vaginal Delivery without
Instrument No
* Unable to confirm endorsement status from NQF database (QPS)
PSI 04 was submitted to the National Quality Forum (NQF) for continued endorsement. After three
rounds of intensive review at both the NQF Surgery Standing Committee and the NQF Consensus
Standards Approval Process (CSAC), AHRQ withdrew the measure from further consideration at
NQF. AHRQ states it conducted rigorous testing which demonstrated that the measure is valid and
reliable. Findings were included in the materials submitted and reviewed at NQF
(http://www.qualityforum.org/Publications/2017/04/Surgery_2015-2017_Final_Report.aspx).
However, AHRQ has chosen not to continue with the NQF review process, pending a review of
competing priorities. As with any measure withdrawn from consideration at NQF, endorsement
was removed from the measure. In the 2019 IPPS proposed rule CMS has indicated it plans to continue use of this measure in CMS programs and to undertake the NQF endorsement process
again under its own stewardship.
The most recent ICD 10 version 2018 of the AHRQ PSI software is available for individual PSIs
without risk adjustment. The All-payer Risk adjusted version of the software is expected to be
released by AHRQ in late spring/early summer of 2019 and will be released as Version2019.
Patient Safety and Adverse Events Indicator (PSI 90):
ICD-9-CM/PCS version (v6.0) of PSI 90 composite measure received final endorsement from the
NQF on December 10, 2015 and retained its prior NQF endorsement number 0531. The modified
patient and adverse events composite (PSI 90) measure includes the following ten PSIs:
● PSI 03 – Pressure Ulcer Rate
● PSI 06 – Iatrogenic Pneumothorax Rate
● PSI 08 – In-Hospital Fall with Hip Fracture Rate
● PSI 09 – Perioperative Hemorrhage or Hematoma Rate
● PSI 10 – Postoperative Acute Kidney Injury Requiring Dialysis Rate
● PSI 11 – Postoperative Respiratory Failure Rate
● PSI 12 – Perioperative Pulmonary Embolism or Deep Vein Thrombosis Rate
● PSI 13 – Postoperative Sepsis Rate

Final Recommendations for the Maryland Hospital-Acquired Conditions Program for Rate Year 2021
61
● PSI 14 – Postoperative Wound Dehiscence Rate
● PSI 15 – Unrecognized Abdominopelvic Accidental Puncture/Laceration Rate
An ICD 10 Version of the All-payer PSI 90 measure software is currently unavailable. Per guidance
from AHRQ it is expected to be released in mid-2019. CMS has created a CMS version of the patient
safety and adverse events composite (PSI 90) measure. The most recent CMS Recalibrated v8.0
Patient Safety Indicator (PSI) software (CMS PSI software) uses ICD-10-CM/PCS codes to identify
specific patient safety events and includes risk- and reliability-adjustment models and composite weights developed from Medicare fee-for service (FFS) discharge data. The CMS v8.0 software can
only calculate PSIs from ICD-10-CM/PCS data and is not compatible with ICD-9-CM. It is available
upon request through the QualityNet Help Desk in the SAS version only. Parameters of CMS v8.0 PSI
software differ from those of the AHRQ all-payer PSI software and include risk-adjustment model
coefficients, signal variance, reference population rates used as smoothing targets, and composite
weights. Composite weights include two components: harm and volume. The harm components
between CMS v8.0 and CMS v6.0 PSI software are consistent however updates to the volume
component were based on the number of safety-related events for the component indicators in the
October 1, 2015–September 30, 2016 Medicare FFS reference population. Details of the harm
components and weights used in the composite for CMS PSI 90 are shown in the table below.

Final Recommendations for the Maryland Hospital-Acquired Conditions Program for Rate Year 2021
62
Description of patient harms captured in the AHRQ Patient Safety and Adverse
Events Composite (modified version of PSI 90)

Final Recommendations for the Maryland Hospital-Acquired Conditions Program for Rate Year 2021
63

Final Recommendations for the Maryland Hospital-Acquired Conditions Program for Rate Year 2021
64

Final Recommendations for the Maryland Hospital-Acquired Conditions Program for Rate Year 2021
65
Summary of composite weights in
CMS PSI 90, CMS v6.0 and CMS v8.0 PSI

Final Recommendations for the Maryland Hospital-Acquired Conditions Program for Rate Year 2021
66
Appendix II. Additional National and Maryland Complication Programs Background Hospital-Acquired Conditions Present on Admission Indicator (HAC POA)15
Medicare’s system for the payment of inpatient hospital services is called the inpatient prospective
payment system. Under this system, patients are assigned to a payment category called a Diagnosis
Related Group (DRG), which are based on a patient’s primary diagnosis and the presence of other
conditions. An average cost is calculated for each Diagnosis Related Group relative to the average
cost for all Medicare hospital stays, and these relative costs (or Diagnosis Related Group weights)
are used to calculate Medicare’s payment to the hospital; patients with more co-morbidities or
complications generally are categorized into higher-paying Diagnosis Related Groups. Historically,
Medicare payments under this system were based solely on the Diagnosis Related Group weights
and the volume of services.
In February 8, 2006, the President signed the Deficit Reduction Act (DRA) of 2005. Section 5001(c)
of DRA requires the Secretary to identify conditions that are: (a) high cost or high volume or both,
(b) result in the assignment of a case to a DRG that has a higher payment when present as a
secondary diagnosis, and (c) could reasonably have been prevented through the application of
evidence-based guidelines. Section 5001(c) provides that CMS can revise the list of conditions from
time to time, as long as it contains at least two conditions.
For discharges occurring on or after October 1, 2008, hospitals do not receive additional payment
for cases in which one of the selected conditions was not present on admission. That is, the case
would be paid as though the secondary diagnosis were not present.
CMS also required hospitals to report present on admission information for both primary and
secondary diagnoses when submitting claims for discharges on or after October 1, 2007.
Hospital-Acquired Condition Reduction Program (HACRP)
The HAC Reduction Program is a Medicare pay-for-performance program that supports CMS’s long-
standing effort to link Medicare payments to healthcare quality in the inpatient hospital setting.
Section 1886(p)(6)(B) of the Social Security Act established the statutory requirements for the HAC
Reduction Program. Beginning with Fiscal Year FY 2015 discharges (i.e., effective October 1, 2014),
the HAC Reduction Program requires the Secretary of Health and Human Services (HHS) to adjust
15 For more information on the DRA HAC POA program refer to
http://www.cms.gov/Medicare/Medicare-Fee-for-Service-
Payment/HospitalAcqCond/index.html.

Final Recommendations for the Maryland Hospital-Acquired Conditions Program for Rate Year 2021
67
payments to hospitals that rank in the worst-performing 25 percent of all subsection (d) hospitals
with respect to HAC quality measures. Hospitals with a Total HAC Score greater than the 75th
percentile of all Total HAC Scores (i.e., the worst-performing quartile) will be subject to a 1 percent
payment reduction. This payment adjustment applies to all Medicare discharges between October
1, 2018 and September 30, 2019 (i.e., FY 2019). The payment reduction occurs when CMS pays
hospital claims.
CMS finalized measures and scoring methodology (vol 78, FR 50717) for this program in the FY
2014 Inpatient Prospective Payment System/Long-Term Care Hospital Prospective Payment
System (IPPS/LTCH PPS) Final Rule. CMS uses the Total HAC Score to determine the worst-
performing quartile of all subsection (d) hospitals. For FY 2019, the Total HAC Score is based on
data for six quality measures in two domains16. CMS sends confidential Hospital-Specific Reports
(HSRs) to hospitals. CMS gives hospitals 30 days to review their HAC Reduction Program data,
submit questions about the calculation of their results, and request corrections to the scoring.
Following the Scoring Calculations Review and Corrections period, CMS will next publicly report
hospitals’ HAC Reduction Program data on Hospital Compare in January 2019.
16 For more information on the HACRP program refer to
https://www.cms.gov/Medicare/Medicare-Fee-for-Service-
Payment/AcuteInpatientPPS/Downloads/HAC-Reduction-Program-Fact-Sheet.pdf
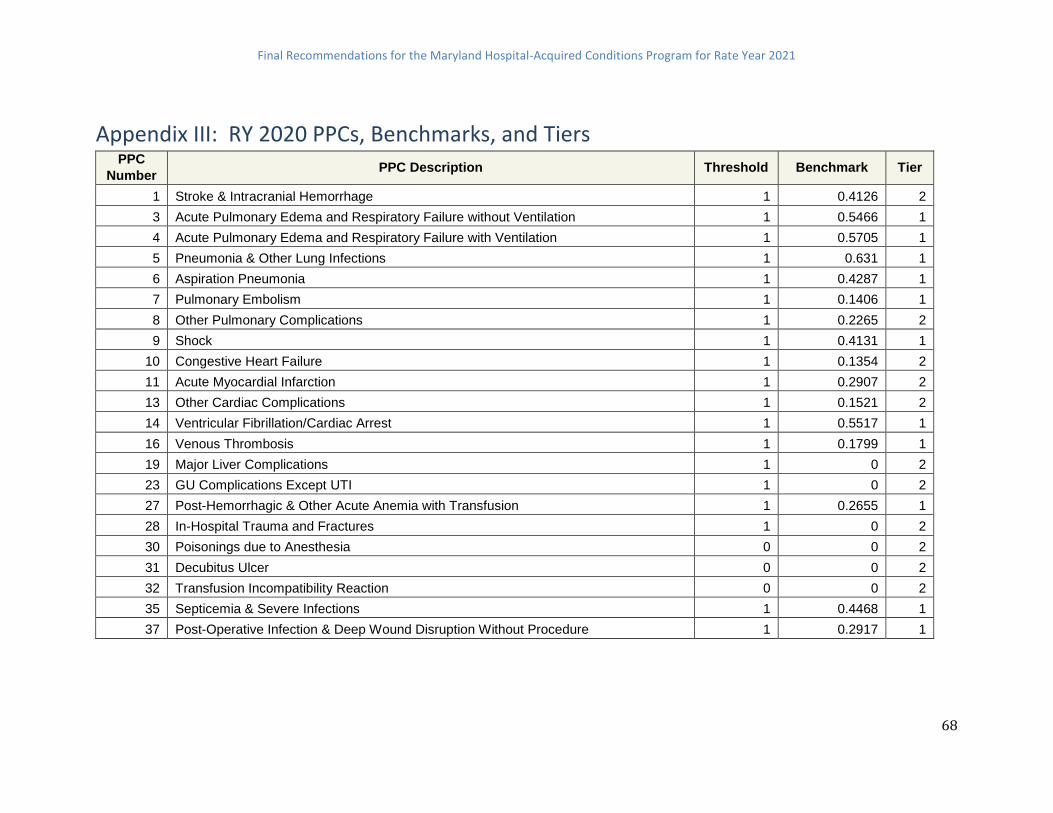
Final Recommendations for the Maryland Hospital-Acquired Conditions Program for Rate Year 2021
68
Appendix III: RY 2020 PPCs, Benchmarks, and Tiers PPC
Number PPC Description Threshold Benchmark Tier
1 Stroke & Intracranial Hemorrhage 1 0.4126 2
3 Acute Pulmonary Edema and Respiratory Failure without Ventilation 1 0.5466 1
4 Acute Pulmonary Edema and Respiratory Failure with Ventilation 1 0.5705 1
5 Pneumonia & Other Lung Infections 1 0.631 1
6 Aspiration Pneumonia 1 0.4287 1
7 Pulmonary Embolism 1 0.1406 1
8 Other Pulmonary Complications 1 0.2265 2
9 Shock 1 0.4131 1
10 Congestive Heart Failure 1 0.1354 2
11 Acute Myocardial Infarction 1 0.2907 2
13 Other Cardiac Complications 1 0.1521 2
14 Ventricular Fibrillation/Cardiac Arrest 1 0.5517 1
16 Venous Thrombosis 1 0.1799 1
19 Major Liver Complications 1 0 2
23 GU Complications Except UTI 1 0 2
27 Post-Hemorrhagic & Other Acute Anemia with Transfusion 1 0.2655 1
28 In-Hospital Trauma and Fractures 1 0 2
30 Poisonings due to Anesthesia 0 0 2
31 Decubitus Ulcer 0 0 2
32 Transfusion Incompatibility Reaction 0 0 2
35 Septicemia & Severe Infections 1 0.4468 1
37 Post-Operative Infection & Deep Wound Disruption Without Procedure 1 0.2917 1

Final Recommendations for the Maryland Hospital-Acquired Conditions Program for Rate Year 2021
69
PPC
Number PPC Description Threshold Benchmark Tier
38 Post-Operative Wound Infection & Deep Wound Disruption with Procedure 1 0 1
39 Reopening Surgical Site 1 0.2615 2
40
Post-Operative Hemorrhage & Hematoma without Hemorrhage Control Procedure or
I&D Proc 1 0.5499 1
41
Post-Operative Hemorrhage & Hematoma with Hemorrhage Control Procedure or I&D
Proc 1 0.1541 1
42 Accidental Puncture/Laceration During Invasive Procedure 1 0.385 1
44 Other Surgical Complication - Mod 1 0 2
45 Post-procedure Foreign Bodies 0 0 2
46 Post-Operative Substance Reaction & Non-O.R. Procedure for Foreign Body 0 0 2
47 Encephalopathy 1 0.0925 2
48 Other Complications of Medical Care 1 0.0904 2
49 Iatrogenic Pneumothorax 1 0.0758 1
50 Mechanical Complication of Device, Implant & Graft 1 0.4843 2
51 Gastrointestinal Ostomy Complications 1 0.1983 2
52
Inflammation & Other Complications of Devices, Implants or Grafts Except Vascular
Infection 1 0.4197 2
53
Infection, Inflammation & Clotting Complications of Peripheral Vascular Catheters &
Infusions 1 0 2
59 Medical & Anesthesia Obstetric Complications 1 0.2625 2
60 Major Puerperal Infection and Other Major Obstetric Complications 1 0.1321 2
61 Other Complications of Obstetrical Surgical & Perineal Wounds 1 0.1592 2
65 Urinary Tract Infection without Catheter 1 0 2
67 Combined PPC 1 (PPC 25, 26, 63, 64 ) 1 0.0669 2
68 Combined PPC 2 (PPC 17, 18) 1 0.2354 2
71 Combined PPC 3 (PPC 34, 54, 66) 1 0.1234 2

Final Recommendations for the Maryland Hospital-Acquired Conditions Program for Rate Year 2021
70
Appendix IV. Select PPC Histograms Frequency Histograms of PPCs Selected for MHAC

Final Recommendations for the Maryland Hospital-Acquired Conditions Program for Rate Year 2021
71

Final Recommendations for the Maryland Hospital-Acquired Conditions Program for Rate Year 2021
72

Final Recommendations for the Maryland Hospital-Acquired Conditions Program for Rate Year 2021
73

Final Recommendations for the Maryland Hospital-Acquired Conditions Program for Rate Year 2021
74
*MedStar Union Memorial (210024) removed as outlier with O/E of 4.988

Final Recommendations for the Maryland Hospital-Acquired Conditions Program for Rate Year 2021
75
*Washington Adventist (210016) removed as outlier with O/E of 3.988

Final Recommendations for the Maryland Hospital-Acquired Conditions Program for Rate Year 2021
76
*UM-Charles Regional (210035) removed as outlier with O/E of 3.615

Final Recommendations for the Maryland Hospital-Acquired Conditions Program for Rate Year 2021
77
Appendix V: Comparison of PPC Rates under Version 35 and Version 36

Final Recommendations for the Maryland Hospital-Acquired Conditions Program for Rate Year 2021
78
Appendix VI: HACRP Z-Score Description The CAEM subgroup considered using the HACRP Z-Score calculation but adapted for a prospective
system where the mean measure result and standard deviation were from a historical time period.
It should be noted that the expanded points based scoring system proposed by staff has set the
threshold and benchmark at similar percentiles of performance as the Winsorized scores.
Below is except from the FY 2019 HACRP Fact Sheet (https://www.cms.gov/Medicare/Medicare-
Fee-for-Service-Payment/AcuteInpatientPPS/Downloads/HAC-Reduction-Program-Fact-
Sheet.pdf):

Final Recommendations for the Maryland Hospital-Acquired Conditions Program for Rate Year 2021
79
Appendix VII. PPC Benchmarks and Thresholds under Current and Expanded Methodology (CY 2016)
PPC # PPC Description
Current Expanded
Threshold
(50th)
Benchmark (top
performers 25%
discharges)
Threshold (10th) Benchmark
(90th)
3 Acute Pulmonary Edema and Respiratory Failure
without Ventilation 1 0.5659 1.6406 0.3483
4 Acute Pulmonary Edema and Respiratory Failure
with Ventilation 1 0.4785 1.6835 0.2530
7 Pulmonary Embolism 1 0.4724 1.9392 0.4070
9 Shock 1 0.4696 1.7393 0.2069
16 Venous Thrombosis 1 0.1658 2.1356 0.0000
28 In-Hospital Trauma and Fractures 1 0.1651 2.6935 0.0000
35 Septicemia & Severe Infections 1 0.4578 1.8121 0.2603
37 Post-Operative Infection & Deep Wound
Disruption Without Procedure 1 0.3684 1.5768 0.0000
41 Post-Operative Hemorrhage & Hematoma with
Hemorrhage Control Procedure or I&D Proc 1 0.2930 1.9154 0.0000
42 Accidental Puncture/Laceration During Invasive
Procedure 1 0.4195 1.8772 0.4281
49 Iatrogenic Pneumothrax 1 0.1077 2.0963 0.0000
60 Major Puerperal Infection and Other Major
Obstetric Complications 1 0.5005 1.9099 0.2944
61 Other Complications of Obstetrical Surgical &
Perineal Wounds 1 0.1710 1.7274 0.0000
67 Combined Pneumonia (PPC 5 and 6) 1 0.4822 1.8745 0.3419

Final Recommendations for the Maryland Hospital-Acquired Conditions Program for Rate Year 2021
80
Appendix VIII. PPC Benchmarks and Thresholds under Two Years (FY 2017 and FY 2018) and One Year (FY 2018) Data

Final Recommendations for the Maryland Hospital-Acquired Conditions Program for Rate Year 2021
81
Appendix IX. Example of Calculation of Hospital Scores Hospital A
PPC Threshold Benchmark Hospital
O/E Ratio ATTAINMENT
POINTS POSSIBLE
DENOMINATOR 3M
Weight Weighted
Points Weighted
Denominators
A B C D = C relative
to A and B E F G = D * F H = E * F
PPC 1 1.75 0.5 0.2 100 100 0.5 50 50
PPC 2 2 0.3 1.1 53 100 2 106 200
PPC 3 2.5 0.4 0.65 88 100 1 88 100
Total 244 350
TOTAL WEIGHTED SCORE G total /H total
70%
Hospital B
PPC Threshold Benchmark Hospital
O/E Ratio ATTAINMENT
POINTS POSSIBLE
DENOMINATOR 3M
Weight Weighted
Points Weighted
Denominators
A B C D = C relative
to A and B E F G = D * F H = E * F
PPC 1 1.75 0.5 2 0 100 0.5 0 50
PPC 2 2 0.3 1.5 30 100 2 60 200
PPC 3 2.5 0.4 1 71 100 1 71 100
Total 131 350
TOTAL WEIGHTED SCORE G total /H total
37%

Final Recommendations for the Maryland Hospital-Acquired Conditions Program for Rate Year 2021
82
Appendix X. By hospital Score Modeling
RY 2021 MHAC Modeling by Hospital Model 1:
Improvement and Attainment
Model 2: Attainment Only
Model 3: Wider Performance
Standards, Attainment Only
Hospital ID
Hospital Name MHAC score MHAC score MHAC score
210001 MERITUS 28% 27% 57%
210002 UNIVERSITY OF MARYLAND 26% 21% 56%
210003 PRINCE GEORGE 34% 28% 46%
210004 HOLY CROSS 72% 71% 85%
210005 FREDERICK MEMORIAL 66% 63% 73%
210006 HARFORD 23% 11% 44%
210008 MERCY 48% 38% 62%
210009 JOHNS HOPKINS 56% 51% 73%
210010 DORCHESTER 70% 70% 80%
210011 ST. AGNES 53% 51% 76%
210012 SINAI 41% 34% 66%
210013 BON SECOURS 22% 12% 17%
210015 FRANKLIN SQUARE 22% 16% 49%
210016 WASHINGTON ADVENTIST 31% 29% 49%
210017 GARRETT COUNTY 76% 76% 89%
210018 MONTGOMERY GENERAL 65% 63% 79%
210019 PENINSULA REGIONAL 51% 51% 66%
210022 SUBURBAN 60% 58% 77%
210023 ANNE ARUNDEL 69% 69% 84%

Final Recommendations for the Maryland Hospital-Acquired Conditions Program for Rate Year 2021
83
RY 2021 MHAC Modeling by Hospital Model 1:
Improvement and Attainment
Model 2: Attainment Only
Model 3: Wider Performance
Standards, Attainment Only
Hospital ID
Hospital Name MHAC score MHAC score MHAC score
210024 UNION MEMORIAL 26% 20% 46%
210027 WESTERN MARYLAND HEALTH SYSTEM
25% 21% 47%
210028 ST. MARY 66% 66% 70%
210029 HOPKINS BAYVIEW MED CTR 45% 40% 71%
210030 CHESTERTOWN 41% 28% 28%
210032 UNION HOSPITAL OF CECIL COUNT
58% 43% 63%
210033 CARROLL COUNTY 28% 27% 41%
210034 HARBOR 28% 22% 37%
210035 CHARLES REGIONAL 76% 75% 85%
210037 EASTON 42% 38% 68%
210038 UMMC MIDTOWN 58% 58% 74%
210039 CALVERT 52% 50% 57%
210040 NORTHWEST 51% 51% 69%
210043 BALTIMORE WASHINGTON MEDICAL CENTER
30% 29% 55%
210044 G.B.M.C. 21% 18% 39%
210048 HOWARD COUNTY 69% 64% 76%
210049 UPPER CHESAPEAKE HEALTH 73% 68% 84%
210051 DOCTORS COMMUNITY 69% 67% 76%
210055 LAUREL REGIONAL 71% 63% 75%

Final Recommendations for the Maryland Hospital-Acquired Conditions Program for Rate Year 2021
84
RY 2021 MHAC Modeling by Hospital Model 1:
Improvement and Attainment
Model 2: Attainment Only
Model 3: Wider Performance
Standards, Attainment Only
Hospital ID
Hospital Name MHAC score MHAC score MHAC score
210056 GOOD SAMARITAN 40% 39% 51%
210057 SHADY GROVE 23% 16% 39%
210058 REHAB & ORTHO 36% 36% 45%
210060 FT. WASHINGTON 100% 100% 100%
210061 ATLANTIC GENERAL 59% 57% 61%
210062 SOUTHERN MARYLAND 20% 4% 21%
210063 UM ST. JOSEPH 37% 37% 59%
210064 LEVINDALE 64% 48% 63%
210065 HC-Germantown 77% 73% 88%
Median 51% 43% 63%
Average 49% 45% 62%
Min 20% 4% 17%
Max 100% 100% 100%
25th 28% 27% 47%
75th 66% 63% 76%

Final Recommendations for the Maryland Hospital-Acquired Conditions Program for Rate Year 2021
85
Appendix XI. By Hospital Revenue Modeling
RY 2021 MHAC Revenue Adjustment Modeling
Linear
60-70% Cutpoint Non-Linear
65% Cutpoint
Hospital ID
Hospital Name
RY18 estimated Permanent Inpatient Revenue
MHAC score
% Adjustment
$ Adjustment %
Adjustment $ Adjustment
210001 MERITUS $190,799,459 57% -0.10% -$190,799 -0.0037% -$7,060
210002 UNIVERSITY OF MARYLAND $919,253,797 56% -0.13% -$1,225,672 -0.0053% -$48,720
210003 PRINCE GEORGE $215,464,625 46% -0.47% -$1,005,502 -0.0500% -$107,732
210004 HOLY CROSS $340,412,069 85% 0.50% $1,702,060 0.1866% $635,209
210005 FREDERICK MEMORIAL $220,972,343 73% 0.10% $220,972 0.0119% $26,296
210006 HARFORD $48,557,781 44% -0.53% -$258,975 -0.0674% -$32,728
210008 MERCY $223,932,822 62% 0.00% $0 -0.0002% -$448
210009 JOHNS HOPKINS $1,378,259,901 73% 0.10% $1,378,260 0.0119% $164,013
210010 DORCHESTER $26,021,222 80% 0.33% $86,737 0.0787% $20,479
210011 ST. AGNES $237,889,236 76% 0.20% $475,778 0.0310% $73,746
210012 SINAI $398,036,508 66% 0.00% $0 0.0000% $0
210013 BON SECOURS $65,798,042 17% -1.43% -$943,105 -0.8054% -$529,937
210015 FRANKLIN SQUARE $300,623,972 49% -0.37% -$1,102,288 -0.0298% -$89,586
210016 WASHINGTON ADVENTIST $158,337,604 49% -0.37% -$580,571 -0.0298% -$47,185
210017 GARRETT COUNTY $21,075,334 89% 0.63% $133,477 0.3224% $67,947
210018 MONTGOMERY GENERAL $77,808,657 79% 0.30% $233,426 0.0640% $49,798
210019 PENINSULA REGIONAL $241,466,813 66% 0.00% $0 0.0000% $0
210022 SUBURBAN $197,431,392 77% 0.23% $460,673 0.0403% $79,565

Final Recommendations for the Maryland Hospital-Acquired Conditions Program for Rate Year 2021
86
RY 2021 MHAC Revenue Adjustment Modeling
Linear
60-70% Cutpoint Non-Linear
65% Cutpoint
Hospital ID
Hospital Name
RY18 estimated Permanent Inpatient Revenue
MHAC score
% Adjustment
$ Adjustment %
Adjustment $ Adjustment
210023 ANNE ARUNDEL $299,264,995 84% 0.47% $1,396,570 0.1600% $478,824
210024 UNION MEMORIAL $235,346,415 46% -0.47% -$1,098,283 -0.0500% -$117,673
210027 WESTERN MARYLAND HEALTH SYSTEM $171,000,183 47% -0.43% -$741,001 -0.0425% -$72,675
210028 ST. MARY $76,303,058 70% 0.00% $0 0.0029% $2,213
210029 HOPKINS BAYVIEW $357,620,585 71% 0.03% $119,207 0.0050% $17,881
210030 CHESTERTOWN $21,139,936 28% -1.07% -$225,493 -0.3689% -$77,985
210032 UNION HOSPITAL OF CECIL COUNT $66,514,320 63% 0.00% $0 -0.0001% -$67
210033 CARROLL COUNTY $132,801,017 41% -0.63% -$841,073 -0.1007% -$133,731
210034 HARBOR $112,526,840 37% -0.77% -$862,706 -0.1599% -$179,930
210035 CHARLES REGIONAL $75,199,112 85% 0.50% $375,996 0.1866% $140,322
210037 EASTON $105,222,295 68% 0.00% $0 0.0006% $631
210038 UMMC MIDTOWN $117,217,727 74% 0.13% $156,290 0.0170% $19,927
210039 CALVERT $63,677,722 57% -0.10% -$63,678 -0.0037% -$2,356
210040 NORTHWEST $133,828,758 69% 0.00% $0 0.0015% $2,007
210043 BALTIMORE WASHINGTON MEDICAL $229,151,792 55% -0.17% -$381,920 -0.0073% -$16,728
210044 G.B.M.C. $225,145,722 39% -0.70% -$1,576,020 -0.1280% -$288,187
210048 HOWARD COUNTY $183,348,539 76% 0.20% $366,697 0.0310% $56,838
210049 UPPER CHESAPEAKE $130,150,364 84% 0.47% $607,368 0.1600% $208,241
210051 DOCTORS COMMUNITY $144,686,192 76% 0.20% $289,372 0.0310% $44,853

Final Recommendations for the Maryland Hospital-Acquired Conditions Program for Rate Year 2021
87
RY 2021 MHAC Revenue Adjustment Modeling
Linear
60-70% Cutpoint Non-Linear
65% Cutpoint
Hospital ID
Hospital Name
RY18 estimated Permanent Inpatient Revenue
MHAC score
% Adjustment
$ Adjustment %
Adjustment $ Adjustment
210055 LAUREL REGIONAL $58,931,276 75% 0.17% $98,219 0.0233% $13,731
210056 GOOD SAMARITAN $140,674,848 51% -0.30% -$422,025 -0.0200% -$28,135
210057 SHADY GROVE $231,939,525 39% -0.70% -$1,623,577 -0.1280% -$296,883
210058 REHAB & ORTHO $69,966,359 45% -0.50% -$349,832 -0.0583% -$40,790
210060 FT. WASHINGTON $19,548,527 100% 1.00% $195,485 1.0000% $195,485
210061 ATLANTIC GENERAL $37,316,219 61% 0.00% $0 -0.0005% -$187
210062 SOUTHERN MARYLAND $163,844,003 21% -1.30% -$2,129,972 -0.6204% -$1,016,488
210063 UM ST. JOSEPH $237,924,618 59% -0.03% -$79,308 -0.0016% -$3,807
210064 LEVINDALE $56,105,767 63% 0.00% $0 -0.0001% -$56
210065 HC-Germantown $60,632,167 88% 0.60% $363,793 0.2838% $172,074
State Total $9,219,170,455
State Total -$7,041,420
-$668,994
Penalty -$15,701,800
-$3,139,074
% Inpatient -0.17%
-0.03%
Reward $8,660,380
$2,470,080
% Inpatient 0.09%
0.03%
# Penalized 20
24
# $0 9
2
# Rewarded 18
21

Final Recommendations for the Maryland Hospital-Acquired Conditions Program for Rate Year 2021
88
Appendix XII. Sensitivity Analysis of MHAC Scores This histogram shows percent of hospital scores by percent change in revenue adjustments when
modeling was done to test the sensitivity of the hospital MHAC scores to an increase in one PPC.
Scores were run for each hospital for each PPC, meaning that if a hospital qualified for all fourteen
PPCs the score was run fourteen times adding one to each PPC. The histogram shows that more
than 60% of the hospital scores had no change in revenue when there was one additional PPC.
This bar chart is of each run of the hospital scores and shows that there are four scenarios where
the addition of one PPC results in a revenue change that is greater than 0.40 percent. These four
scenarios are for the three small hospitals that only are being measured on four PPCs (Levindale,
Garrett, and Chestertown). Thus it is not surprising that the scores for these hospitals are
influenced by a single PPC. However in reviewing the PPCs these hospitals are being evaluated on,
staff believes it is clinically important to include these hospitals in the program.
-0.70%
-0.60%
-0.50%
-0.40%
-0.30%
-0.20%
-0.10%
0.00%
Per
cen
t C
han
ge in
Rev
enu
e
Change in Percent Revenue

Final Recommendations for the Maryland Hospital-Acquired Conditions Program for Rate Year 2021
89
Appendix XIII. Amended Revenue Adjustment Scale
Below is the abbreviated revenue adjustment scale amended to have potential rewards of 2%.