Embed Size (px)
Citation preview

8/3/2019 Final Report 95
http://slidepdf.com/reader/full/final-report-95 1/91
SUMMER INTERNSHIP REPORT
ON
Branding and competitive analysis of portable voice amplifier of
Kores (India) Ltd.
For
Kores (India) Ltd.
In Partial Fulfillment of Award of Master of Business Administration
(M.B.A.)
(Affiliated to U.P. Technical University Lucknow)
Submitted To: - Submitted by:-
Mr. A.S.Chauhan Alok Kumar Singh
Session 2011-2012
Department Of Management
1

8/3/2019 Final Report 95
http://slidepdf.com/reader/full/final-report-95 2/91

8/3/2019 Final Report 95
http://slidepdf.com/reader/full/final-report-95 3/91
Acknowledgement
I would like to express my gratitude to my Industry guide Mr. A.S.Chauhan for his support
and encouragement for the project.
I would also like to thank all my respondents for their support and helping in my project work
Alok Kumar Singh
3
8/3/2019 Final Report 95
http://slidepdf.com/reader/full/final-report-95 4/91
Contents
Declaration
Certificate from Industry Guide
Certificate from Faculty guide
Acknowledgement
S.No. Chapter Name Page No
1 Introduction and objective
2 Literature Review
3 Research Methodology
4 Data Analysis
5 Conclusion
6 Recommendations, suggestions and limitations
References
Appendix
4

8/3/2019 Final Report 95
http://slidepdf.com/reader/full/final-report-95 5/91
CHAPTER 1
INTRODUCTION OF THE COMPANY
&
OBJECTIVE OF THE STUDY
5

8/3/2019 Final Report 95
http://slidepdf.com/reader/full/final-report-95 6/91
INTRODUCTION
Kores (India) Limited was incorporated in 1936 inter-alia with the object to take over the Indian
business operation of W. KORESKA then carried on in Kolkata and Mumbai mainly in the field
of stationery products.
In 1956, the late Mr. Krishnalal Thirani acquired majority share holding and took over the
management of Kores (India) Limited. Since then, it has grown rapidly and diversified into
several fields.
The driving force behind the KORES of today is a dream. The dream of Mr. K.L. Thirani. He
dreamt of India as a country developing innovative technologies and business practices that
would eventually help become a strong economy. In realization of his dream, KORES has
consistently grown by well planned approach of expansion and diversification.
KORES has the seal of excellence and reliability and above all the trust of its customers for the
past more than 75 years. The deep rooted ‘trust’ of customers is earned through the high quality
products and consistent service provided by dedicated employees.
6

8/3/2019 Final Report 95
http://slidepdf.com/reader/full/final-report-95 7/91
Financial
Kores (India) Limited since incorporation has been growing steadily in business while gaining
deep rooted confidence of customers reinforced with trust factor. Year ending March 2010 we
would be closing at a business value of INR 700 Crores. A steady growth is planned to achieve
the long-term business objectives.
Social Responsibilities
Kores (India) Limited has identified ‘Education’ and ‘Health’ as the areas to concentrate on
social cause and have been providing support for running educational institutions and primary
health centers in rural areas.
Walk N Talk Voice Amplifier
Since the last few years Kores been adding more products to its range of Presentation
Accessories which earlier consisted only of Boards, Markers & Dustless Chalk. Products like
7

8/3/2019 Final Report 95
http://slidepdf.com/reader/full/final-report-95 8/91
DLP Projectors, Visualiers, Document Cameras, Projection Screens, etc. have given a new
direction to Kores (Office Products Division) is now a company also into technology driven
products.
When we talk of technology driven products, technology keeps changing at a rapid thus opening
doors for newer and innovative products making life comfortable and easy for the user.
Keeping pace with technology, Kores has now introduced a unique and beautiful product that
fits perfectly into it range of Presentation Accessories –
Kores Walk N Talk Voice Amplifier.
WHAT IS KORES WALK N TALK VOICE AMPLIFIER?
Kores Walk N Talk Voice Amplifier is a personal mini public address system which amplifies
the voice of the speaker and makes him/her audible in any part of the room or in a small crowd.
It enhances the voice of a person 6 times. With Kores Walk N Talk Voice Amplifier, there is no
need of hiring expensive Public Address Systems. Just attach the amplifer to the waist, plug in
the neck-worn microphone to the amplifier, switch the system ON and Kores Walk N Talk
Voice Amplifier is ready for use.
Besides, it is handy and easy to operate. The specifications & features of Kores Walk N Talk
Voice Amplifier are as under: SPECIFICATIONS:
• 8 Watt Speaker (enhances your voice 6 times)
8

8/3/2019 Final Report 95
http://slidepdf.com/reader/full/final-report-95 9/91
• Power Management: 4 x AAA chargeable batteries
• Charging Time: 4 to 8 hours
• Usage Time: Indoor – 10 hours, Outdoor – 6 hours
• Dimensions: 83mm width x 84mm height x 33mm Depth
• Weight : Only 175 grams
FEATURES:
• Portable & can be taken almost anywhere
• Clear Voice Reproduction
• Effective for an audience of 100 to 120 people
• Helps one save your energy and get through your day effortlessly
• Audience can hear and understand the speaker better
• Adjustable strap with quick release buckles (sling across the body or waist) for Women
• Stainless Steel belt clip for easy fastening for Men
• Flexi-arm neck-worn microphone piece for comfortable wearing
Kores aims to target Teacher’s in Schools, Colleges, Educational Institutes, Management
Institutes, Training Institutes, Corporates (for board meetings, presentations) , Hotels, Banks
(for calling token number), Political Parties (for party meetings), Police Force, Airlines (for
making announcements while issuing boarding pass, boarding of aircraft), Courts, etc. for
selling this product. Kores is confident that given the quality of the product, its advantages over
expensive & bulky sound systems and competitive pricing, it will be a big success in time to
9

8/3/2019 Final Report 95
http://slidepdf.com/reader/full/final-report-95 10/91
come. For more details on Kores Walk N Talk Voice Amplifier, please call on 022-
40974460/40974442.
Source: PSS
Project
Branding and competitive analysis
Objectives of the study:
The objective of doing this live project was to know about the branding and competitive
analysis and what should be the strategies adopted to fill the gap areas.
1. To find out areas of improvement in portable voice amplifier of kores’s performance
2. To do a competitive analysis between the performance of kores and other players in the
market
3. To find and analyze the effect of brand over the customers and the level of satisfaction of
kores’s customers and that of the customers of the other players in the market
4. To study the brand awareness and satisfaction level of customers in different attributes of
voice amplifiers.
10

8/3/2019 Final Report 95
http://slidepdf.com/reader/full/final-report-95 11/91
11

8/3/2019 Final Report 95
http://slidepdf.com/reader/full/final-report-95 12/91
CHAPTER 2
REVIEW OF LITERATURE
LITERATURE REVIEW
Secondary Data
12

8/3/2019 Final Report 95
http://slidepdf.com/reader/full/final-report-95 13/91
Kores (India) has many divisions like
Office products
International business
Business and computers
Foundry
Textiles
Pharmaceuticals and chemicals
Real estate
Engineering
International business
Office Stationery
Kores offers an almost entire range of stationery you need in Office Stationery. Name it and you
have it from Kores. Kores prides in being the only stationery company offering the complete
range of Office Stationery Products.
Paper Products
13

8/3/2019 Final Report 95
http://slidepdf.com/reader/full/final-report-95 14/91
• Stencil Paper
• Duplicating Paper
• Pen & Pencil Carbon Papers
Inks
• Duplicating Inks
• Other Inks
Ribbons
Correction Accessories
14

8/3/2019 Final Report 95
http://slidepdf.com/reader/full/final-report-95 15/91
Tapes & Adhesives
Markers
Highlighters
Staplers & Pins
15

8/3/2019 Final Report 95
http://slidepdf.com/reader/full/final-report-95 16/91
Punches
• Punching Machine KP-80
Digital Electronic Safe
• Secura Cash Box
Note Counters
16

8/3/2019 Final Report 95
http://slidepdf.com/reader/full/final-report-95 17/91

8/3/2019 Final Report 95
http://slidepdf.com/reader/full/final-report-95 18/91
Gifting Solutions
Kores presents a range of fabulous gift packs that make the perfect gift for any occasion. These
gifts are certain to leave an everlasting impression.
Presentation Accessories
Add life to your presentation with the Kores range of Presentation Accessories that includes
DLP Projectors, OHP Projectors, Screens, Boards, Mini Voice Amplifier Systems, Markers, etc.
DLP Projectors
Vivitek DLP projector -
OHP Projectors
• LIBERTY VISION 250
Research based on voice amplfiers
18

8/3/2019 Final Report 95
http://slidepdf.com/reader/full/final-report-95 19/91
Teaching is an occupation with a high incidence of voice problems (Herrington-Hall, Lee,
Stemple, Niemi, McHone, 1988; Rantala, & Vilkman, 1999; Smith, Gray, Dove, Kirchner, &
Heras, 1997; Titze, Lemka, Montequin, 1997). Smith and colleagues found that while teachers
comprise only 2% of the working population, they constitute 16% of hospital voice clinic
populations diagnosed with a voice disorder. Twenty percent of the teacher population analyzed
by Smith reported missing work as a result of a voice problem. Research findings in Europe, led
by Rantala, concluded that “as many as 50% to 80% of teachers experience or have experienced
voice problems” (p.484). Eustace (1996) determined that teachers are the second largest
occupational group reporting chronic laryngeal fatigue.
Participants
Teachers from four school systems participated in this study. Data were collected in 2001 and
2002 from approximately 500 teachers from elementary, middle, and secondary schools. The
current data are based on the results of 230 teachers who reported experiencing voice problems
related to classroom teaching. One hundred ninety seven (86%) were female and thirty three
(14%) were male. The mean number of years teaching was 14 with a range of one to 35 years.
Method
Data were collected via questionnaire to obtain information on 29 areas of voice problems and
associated factors, including: school setting, subject area, voice use, gastroesophageal reflux,
sinus/allergy problems, caffeine intake, hydration, presence, symptoms, type and severity of
19

8/3/2019 Final Report 95
http://slidepdf.com/reader/full/final-report-95 20/91
voice problems experienced, if the problem has affected teaching, and the number of days
missed from work.
Results
More than 47% of the teachers surveyed (230 out of 480) thought that they currently had a
voice problem or had experienced a voice problem in the past year.
School Setting
The 230 teachers reporting voice problems in different school settings:
Kindergarten: 5%, 12/230
Elementary: 35%, 79/230
Middle: 22%, 50/230
Secondary: 27%, 61/230
Two or more: 11%, 25/230
Teaching Situation
The 220 teachers reporting voice problems represented a variety of instructional areas and
situations:
79% were Classroom teachers
13% were Music teachers
4% were PE teachers
4% were Band teachers
20

8/3/2019 Final Report 95
http://slidepdf.com/reader/full/final-report-95 21/91
Vocal Demands
Time speaking: 9.57 hours/day
Teaching: 6.57 hours/day, 5.03 days/week
Outside vocal activities: 6.31 hours/week, 2.74 times/week
Teachers Rated Voice Problems as Mild, Moderate, or Significant
Mild: 63%, 140/230
Moderate: 31%, 68/230
Significant: 7%, 15/230
The Five Most Common Voice Symptoms Reported by Teachers:
Hoarseness: 87%, 201/230
Frequent throat clearing: 41%, 95/230
Effort or strain to speak : 38%, 88/230
Voice ‘gives out’ during the day: 31%, 71/230
Weak, tired voice: 27%, 61/230
Most Common Voice Problems Reported by Teachers:
Quality: 47%, 107/23021

8/3/2019 Final Report 95
http://slidepdf.com/reader/full/final-report-95 22/91
Durability: 41%, 96/230
Loudness: 36%, 83/230
Consistency: 21%, 49/230
Pitch: 18%, 43/230
Water intake
Teachers with voice problems drank 3.81 glasses/day
Teachers without voice problems drank 3.24 glasses/day
Caffeine intake
Teachers with voice problems drank 2.15 caffeinated beverages/day
Teachers without voice problems drank 3.22 caffeinated beverages/da
Voice Problems Affect Teaching
52% of teachers (115/222) feel that problems with their voice have mildly to moderately
affected their ability to teach. 9% of teachers (19/222) feel that problems with their voice have
moderately to greatly affected their ability to teach. 21% of the teachers (48/227) or 10% of the
total number surveyed missed work within the past year due to problems with their voice.
Discussion
The results indicate that 47% of teachers experience or have experienced problems with their
voice, which is greater than the 16% found by Smith. Elementary teachers (40%) were most
22
8/3/2019 Final Report 95
http://slidepdf.com/reader/full/final-report-95 23/91
likely to experience voice problems, followed by Secondary teachers (27%), Middle School
teachers (22%). Teachers were asked to rate the severity of voice problems. 63% rated their
voice problem mild, 31% moderate, and 7% significant. 52% think that voice problems have
mildly to moderately affected their ability to teach and 9% think that problems with their voice
have moderately to greatly affected their ability to teach. 21% of the teachers or 10% of the total
number surveyed missed work within the past year due to problems with their voice. Those
teachers missing work missed an average of 2.4 days per teacher per year due to voice
problems. Clearly, teachers are likely to develop voice problems which can affect their ability to
teach. Teachers who complain of sinus problems, throat problems, have vocal activities outside
the classroom are more likely to develop problems. Further research to identify those teachers
most likely to develop problems is necessary.
If problems develop recent work by Roy, N., Gray,S., Simon, M., Dove, H., Corbin-Lewis, K.,
& Stemple, J.(2001) and Roy, N., Weinrich, B., Gray,S., Tanner, K., Toledo, S., Dove, H.,
Corbin-Lewis, K., & Stemple, J.(2002) has demonstrated effective measures, such as vocal
function exercises or the use of amplification in the classroom, to improve voice production in
the classroom.
(Source : Research and Markets )
Research & Development
The Research & Development has an important role in the success of our division. It is
recognized by the Department of Science & Technology, Government of India. With the
well equipped and updated facilities, it is capable of developing and synthesizing molecules
23
8/3/2019 Final Report 95
http://slidepdf.com/reader/full/final-report-95 24/91
up to kilo levels. It undertakes challenging chemical synthesis based on specific customer
requirements. R&D is equipped with Gradient HPLC, FT-IR, GC with Head Space
Analyzer and other regular analytical instruments. The development of the product
characterization, impurity profiling and all other activities follow the ICH Guidelines.
Processes are transferred to the Production Department through documented procedure for
Technology Transfer.
The facilities in R&D provide scope to the qualified and experienced scientists to work in a free
and competitive environment, resulting in a broad range of products. The most noticeable
achievements are in the fields of Xanthine and Oxazole chemistry. The department has
developed a number of products for European customers with complete Confidentiality and
Exclusivity.
Quality Assurance
Quality has always been our motto and our continuous efforts towards attaining the highest
levels of quality have ensured that our product specifications are of international standard.
We have an established Quality Assurance and Quality Control systems, which encompasses
activities both manufacturing control as well as sampling, analysis and release of relevant
raw materials, intermediates and Active Pharmaceutical Ingredients (APIs).
Keeping in mind the fast changing times, our QC is well equipped with sophisticated
equipments / instruments / systems / qualified personnel.
24

8/3/2019 Final Report 95
http://slidepdf.com/reader/full/final-report-95 25/91
The QA / QC system and Laboratory has been audited by a number of overseas as well as
Indian customers and approved as a vendor
Growth Drivers - Service and Modernization:
The underlying growth drivers for maintenance, modernization and service revenue are quite
distinct to those for new equipment sales. In 2005, more than two thirds of all existing units
were estimated to be more than 20 years old. In the context of changing safety and performance
requirements, demands on this old equipment are becoming more stringent. This need for
modernization is not present to the same extent in the developing economies of Asia since the
installed base is much younger and rapidly growing.
Other trends that drive modernization work in the Western world are hardly present in
developing economies; neither does Asia suffer from a rapidly ageing population nor are
regulations as stringent as they are in the West. Maintenance activity is regulated and enforced
by law in most developed countries, with a certain number of maintenance visits required per
year. This provides for relatively predictable future cash flows.
In the industrialized countries, sales of maintenance and upgrade services are expected to grow
at higher rates than new equipment sales supported by an expanding installed base, safety
requirements and the ageing of current installations.
25

8/3/2019 Final Report 95
http://slidepdf.com/reader/full/final-report-95 26/91
( Source : Business Review 2008 )
CONSUMER PERCEPTION IN VOICE AMPLIFIER
INDUSTRY
With better understanding of customer’s perceptions, companies can determine the actions
required to meet the customer’s needs. They can identify their own strengths and weaknesses,
where they stand in comparison to their competitors, chart out the future progress and
improvement. Customer satisfaction measurement helps to promote an increased focus on
customer’s outcomes and stimulate improvements in the work practices and processes used
within the company. Customer expectations are the customer defined attributes of your product
26

8/3/2019 Final Report 95
http://slidepdf.com/reader/full/final-report-95 27/91
or service. We cannot create satisfaction just by meeting customer’s requirements fully because
these have to be met at any case. However falling short is certain to create satisfaction.
Major attributes of customer satisfaction can be summarized as:
• Product quality
• Product packaging
• Keeping delivery commitments
•Price
• Responsiveness and ability to resolve complaints and reject reports
• Overall communication, accessibility and attitudes
27
Values
Benefits
Features =
Attributes
+ -

8/3/2019 Final Report 95
http://slidepdf.com/reader/full/final-report-95 28/91
We cannot begin to address the customer satisfaction issue we define the parameters and
measures clearly.
The buying process involves the following steps:
28
Problem
recognition
Evaluation
Decision
Post purchaseDissonance
Buy
Dissastisfaction= Brand
Information
search
Satisfaction =Brand

8/3/2019 Final Report 95
http://slidepdf.com/reader/full/final-report-95 29/91
“ The fact that word of mouth sales are a big deal in this industry has also helped. Industry
players and market surveys reveal that 30-40 percent of sales are through the word of mouth”.
Recommendation comes from satisfaction and satisfaction comes from quality
29

8/3/2019 Final Report 95
http://slidepdf.com/reader/full/final-report-95 30/91
It is possible to set up any yardstick for relationship between a buyer and a seller. No two
organizations can have similar set of rules for maintaining relationship. Even if on a particular
occasion a situation prompted a particular behaviour, it is not necessary that a similar behaviour
is necessary on other occasion. The time, place and group of person might be the same but
behave in different way, though circumstances and situations might be identical.
A buyer is also a seller. A seller is also a buyer. Both could also be customers. To make the
point clear let us take the example of a trader who buys goods for resale or a buyer who buys
goods and then sells it after value addition. Therefore, you cannot show same behaviour when
you are in the role of a buyer as then your priorities are different then when you are in the role
of a seller.
Let us for some time consider our own behaviour in our own house with our family members.
30

8/3/2019 Final Report 95
http://slidepdf.com/reader/full/final-report-95 31/91
Are we all at times act in similar manner in a given set of situation? Perhaps not! What are the
factors that motivate our behaviour?
It is my sincere opinion that our senses, mental state of mind and our capacity of physical
endure to react to given situation play an important role in our behaviour as seller, buyer or
customer. At no two given time perhaps we are in alike condition. Our behaviour will therefore,
show different relationship. The relationship is product of our own emotions. We may be having
more or less in similar given condition if we can control our emotions. This is very difficult if
perhaps not impossible.
Looking purely from they viewpoint of a customer the relationship could be short time or long
time. it is primarily dependent on the objective of the customer and the supplier or vendor. A
customer will always wish for a long term relationship with the vendor. The vendor on the other
hand has his own values and objectives. The whole talk about customer satisfaction or customer
delight turn meaningless when all over the place we see customers not satisfied with the service
level provided by the vendors. Whether it is seller’s market or buyer’s market in India generally
the customers is taken for granted and his endurance is tested to breaking limit. We have live
examples of customer taken for a ride all around us. The voter is customer to the governments
elected by him. In return he is entitled for certain basic fulfilments of promises by the elected
member of the government. This is the guarantee clause attached to the democratic system. But
where are we in customer satisfaction. What about a builder who has taken advance from
31

8/3/2019 Final Report 95
http://slidepdf.com/reader/full/final-report-95 32/91
persons who booked the flat then to provide the flats by scheduled date? Or he has provided the
flat then the work is not done as promised.
We talk of customer focused management. Who is the customer we are talking about? It is the
ultimate user of goods and services? It is the internal as also external customers? It is an
intermediate customer. Who so ever it may be, there is a foundation laid to build up or develop
relationship on business objectives. The business objectives are based on the return on the
investment. Speaking as a matter of fact no businessman will extend any facility without
charging the price to remain remunerative on the investment pundits. To explain the point
precisely let us sees some of the motives kept in mind to set objectives for objectives for
customer satisfaction.
1. Personal Gains: one of the parties for It’s hidden of some personal gain develops
relationship by showing friendship, nearness and some advantage. The personal gain is so
intense that the party oriented to be a well wisher of the other. In more then 60% cases innocent
people fall prey to the cunnings of one party and repent later. There are several cases in Indian
industry where for personal gains goals have been finalized both in public and private sectors.
Some have been termed as scan other as scandals. This does nor requires any further
explanation.
32

8/3/2019 Final Report 95
http://slidepdf.com/reader/full/final-report-95 33/91
2. Mutual Gains: the two parties in this situation joint together for mutual gain irrespective of
the act that by their personal gains the organization they serve and the ultimate customer is
going to suffer. This involves a give and take policy. One is giving advantage to the others for
mutual gains at the coast of their organizational interest. Both are cheats form an unholy
alliance. The organisational should see through their gain programmes are on rise in present day
economic scene. Many a time dealership is awarded on consideration of mutual gains. This is
very common in large variety of consumer durable, projects floated for investments in mutual
funds, plantation programme etc. where every day we read in newspapers that customers are left
with hardly any avenue for relief. The principal party and agents just disappear in the air. Very
little legal remedy is available against such unholy alliances. Many eminent personalities have
formed such unholy alliance for mutual gains to attract simple customers.
3. Social gains: Alliance formed for social gains are those where society at large is the
gainer. Nationalization of banks, petroleum companies, coal mining industry are few examples
of alliance formed for social gains. The objective was to ensure proper and planned growth of
core sector and save the customers and public at large from exploitation. The story is however,
different as desired objectives could not be reached due to formation of alliances in government
and within organizations based on impersonal and mutual gains. Nowhere the focus is on
customer. Many of us have experienced rude and unbearable treatment at nationalized banks
while drawing our own money. We are drawing our money not begging. I have seen a senior
citizen at the bank counter virtually begging for hours to get his pension cheque en cashed. It is
an ordeal to get the bank draft made at the banks. However, this are easy if one enters into
unholy alliance for mutual and personal gains.
33

8/3/2019 Final Report 95
http://slidepdf.com/reader/full/final-report-95 34/91
4. Organizational gains: This is the area where we should have maintained main trust for long
term benefit to customers. Customer focused management should be the only objective of every
organization. It is at this place that buyer, seller and customer should form a strategic alliance
without taking advantage of one or the other. If they join hand wend work for all round gain the
result would be great. The theory of organizational gain in many western nations, Japan and
some other south eastern countries has already been recognized. These countries have long back
focused their business on customer satisfaction and customer delight. Unfortunately, in India
even alliance made with the industrial giants and premier brand names of these countries could
not show the same results. The only reason that comes to my mind is that we as Indians do not
have a sincere desire on marginal attitude towards customer focussed business or trade. The
Indian entrepreneurs perhaps still not aware of market volatility and the foreign partners have
studied the Indian business mentality. Unfortunately, the economic planners and their mentor
have not seen the plight of ultimate customer both in the industrial or domestic consumables.
There remains a gap in programmes and implementation. This is again due to the relationship
developed for personal and mutual gains. It is for this reason that Indian economy is not able to
reach to a level where it should be after 51 years of independence and our rich heritage. None of
our programmes and policies are really customer oriented. It is therefore, right time that
management at least in Indian industry try and focus attention on the customers.
5. Onetime gains: There are situations where a relationship is made for one time gain. Both the
parties join together, fulfil the task expected from each and then depart with no obligation what
so ever on either side. All onetime contracts are example of such one time gain. Once the deal is
concluded the relationship is severed. But do we have such one time gain contracts?
34

8/3/2019 Final Report 95
http://slidepdf.com/reader/full/final-report-95 35/91
6. Permanent Gains: Such alliances are made in business world for long time gain to both the
sides i.e., the buyer and seller. This is more or less lifetime alliance and therefore, permanent in
nature. The buyer or customer gets goods or services from a supplier for a life time use. The
seller on the other hand buildup a life time goodwill. This is based on zero defect principle. The
seller ensures that after sales service is provided to the customer for the life time utility of the
product, goods and services. The customer receives maximum return on his investment. A
satisfied customer is perhaps the best and least costly advertiser. A dissatisfied customer is
perhaps the worst enemy moving loose in the cruel world of business. Recommendation of a
delightful customer is having stronger unpack on prospective customers than any amount of
multimedia advertisements. A goodwill build upon satisfied customers will be more potent for
growth in sales than any sales promotion gimmicks adopted by any smart salesman. Several
examples of customer’s delight are available for goods and services. A customer makes
sacrifice and in return he expect that he is relieved of after purchase headaches and botheration.
For the sacrifices made the customer expects sound sleep in the night.
7. Promotional Gains: Such alliances are formed at the time of launching of a new products
and or a company. Glorious future is projected to lure the prospective customers. Alliance is
made between the launcher and brokerage agency or advertising agency. Both the partners to
the alliance are gainers. The customer may or may not be the gainer.
It is therefore, clear that objectively all relationships first of all have vested interest. When we
talk about the customer-focused management we implied to certain predetermined objectives as
narrated above. Organizational culture, the work environment and the perception of seller about
35

8/3/2019 Final Report 95
http://slidepdf.com/reader/full/final-report-95 36/91
customer focus play a very important role in setting up the objective for customer satisfaction.
In the business world the relationship are not platonically constructed. There has to be some
motive! Holy or unholy.
The management pundits in recent past in India have been quoting and advocating for Japanese
style of buyer and seller relationship. It is long lasting and rests on very well established sense
of trust. Above all both parties have real price in such long-term relationship. Customer delight
is therefore possible. Japan can boast about the national culture and all citizens have great
patriotism. This is reflected in their business dealings. It is for this reason the war shattered
country rose to a dominating economic and trading force in about thirty years. Japan can today
proudly say that it has best of alliances world over. Other nationals look forward to enter in to
business collaborations with Japan. India is also one such nation! Over and above personal or
mutual gains a Japanese concern would also see the national and social gains. This is customer-
focused management. Can we in India have same perception and fix up out strategies for
customer satisfaction and elite? Unfortunately in India Japanese collaboration could not get
same amount of success due to attitude and outlook of their Indian Counterpart.
Opening of economy and liberalization in trade in the country brought a sea of change in
customer’s perception of buyer and seller relationship. The customer today is not only very
demanding but also likes to know the relationship between the supplier of goods and services
and its relationship with the manufacturer or principal and its antecedents. It is on this
relationship depends the guarantee and warranty terms to which the customer is entitled. A
customer expects trouble free service during the guarantee period. Thereafter it is expected that
36

8/3/2019 Final Report 95
http://slidepdf.com/reader/full/final-report-95 37/91
a product will last to its full productive life with minimum down time and the vendor will
provide the required support service to ensure that customer is not put to trouble.
What is the scene today?
There has been a wide gap between the preaching and practice. Very few organizations in the
country with certainty can say that their main concern is the customer; By and large even today
customers are taken for granted. The objective today also is same what it was yesterday! Just
pass on the goods. Get the payment and forget the customer. It is indeed surprising to see the
cases pending before the consumer courts. Some of the TV channels have also started
programmes to help customers and provide some assistance in solving customer-related
problems. To narrate some examples of famous brand names and their customer oriented
programmes I first refer to a customer’s letter in a newspaper where after making advance
payment a company could not supply a well advertised cooking range for weeks. It is only after
prolonged correspondence and follow up the money was returned to the prospective customer
without any interest. A friend has some time back purchased a Samsung TV set from an
authorized dealer. The TV set developed some problem and it stopped showing picture. In spite
of regular complaints the TV set is still not rectified as the dealer feel that guarantee period is
over and dealer’s responsibility is over. Beside, the service engineers & over worked attending
long list of complaints. The famous AIWA brand of music system came out with sales
promotional scheme on its music system with supply of fifty CDs free of cost. Many of the
customers are still to get all the CDs. A local dealer of computer came out with a sale
promotional scheme of cash discount if an Ink Jet printer and a scanner is taken as a package. I
become a victim myself when the scanner was collected back by the dealer for repairs after
37

8/3/2019 Final Report 95
http://slidepdf.com/reader/full/final-report-95 38/91
three days of delivery and only after scanning four or five pictures. It is now more than three
weeks that a brand new scanner highly recommended by the dealer is not returned after repairs.
Most-depressing part is that neither the dealer nor the service centre at Delhi could provide
positive reply except that they want me to bear some more time with them These are few
examples of customer oriented, customer focused management by International Brands. What
return is there on the investment made by the customer? The vendor is concerned with getting
his money and goes for all sorts of savings by remaining understaffed and under prepared for
immediately and promptly attending to the complaints.
BRAND PERSONALITY IN VOICE AMPLIFIER INDUSTRY
Brand personality is the way a brand speaks and behaves. It means assigning human personality
traits/characteristics to a brand so as to achieve differentiation. These characteristics signify
brand behaviour through both individuals representing the brand (i.e. it’s employees) as well as
through advertising, packaging, etc. When brand image or brand identity is expressed in terms of
human traits, it is called brand personality. For instance - Allen Solly brand speaks the
personality and makes the individual who wears it stand apart from the crowd. Infosys
represents uniqueness, value and intellectualism.
Brand personality is nothing but personification of brand. A brand is expressed either as a
personality who embodies these personality traits (For instance – Shahrukh Khan and Airtel ,
38

8/3/2019 Final Report 95
http://slidepdf.com/reader/full/final-report-95 39/91
John Abraham and Castrol) or distinct personality traits (For instance - Dove as honest, feminist
and optimist; Hewlett Packard brand represents accomplishment, competency and influence).
Brand personality is the result of all the consumer’s experiences with the brand. It is unique and
long lasting.
Brand personality must be differentiated from brand image, in sense that, while brand
image denote the tangible (physical and functional) benefits and attributes of a brand, brand
personality indicates emotional associations of the brand. If brand image is comprehensive
brand according to consumers’ opinion, brand personality is that aspect of comprehensive brand
which generates it’s emotional character and associations in consumers’ mind.
Brand personality develops brand equity. It sets the brand attitude. It is a key input into the look
and feel of any communication or marketing activity by the brand. It helps in gaining thorough
knowledge of customers feelings about the brand. Brand personality differentiates among
brands specifically when they are alike in many attributes. For instance - Sony versus
Panasonic. Brand personality is used to make the brand strategy lively, i.e., to implement brand
strategy. Brand personality indicates the kind of relationship a customer has with the brand. It is
a means by which a customer communicates his own identity.
Brand personality and celebrity should supplement each other. Trustworthy celebrity ensures
immediate awareness, acceptability and optimism towards the brand. This will influence
consumers’ purchase decision and also create brand loyalty. For instance - Bollywood actress
Priyanka Chopra is brand ambassador for J.Hampstead, international line of premium shirts.
39

8/3/2019 Final Report 95
http://slidepdf.com/reader/full/final-report-95 40/91
Brand personality not only includes the personality features/characteristics, but also the
demographic features like age, gender or class and psychographic features. Personality traits are
what the brand exists for.
The creation Of Brand Personality for voice amplifier Industry
Brand personality traits are formed and influenced by any direct or indirect contact that the
consumer has with a brand. A brand, unlike a person, cannot think, feel or act. A brand has no
objective existence at all: it is simply a collection of perception on the mind of the consumer.
Consumers accept the marketing action to humanize brands. One explanation fort this can be
found in the theories of animism, which suggest that there exist need by people to
anthropomorphize objects in order to facilitate interaction with the nonmaterial world.
Anthropomorphize occurs when human qualities are attributed to non human objects, e.g.
brands. Consumers easily assign personality quality to inanimate objects like brand in thinking
about the brands as if they are human characters.
In a direct way, personality traits are associated with a brand by the people associated to that
brand. One direct way to form and influence brand personality is user imaginary. User
imaginary is defined as the set of human characteristics associated with the typical or stereotype
user of the brand. Associations with the company employees or CEO and the brand’s product
endorsers are also direct ways by which brand personality traits are formed and influenced. The
40

8/3/2019 Final Report 95
http://slidepdf.com/reader/full/final-report-95 41/91
Personality traits that of the people associated with a brand are transferred directly to the brand.
the theories of animism describe another process mechanism that directly explains the specific
ways in which the vitality of the brand can be realized. Spokesperson that is used in advertising
can have personalities that fit those of the brand they advertise. Over time, the personalities of
the spokesperson that they transmitted to the brand. The brand person associations can also have
a more personal nature. Brands can be associated with the person from whom the gift was
received. These person associative serve to animate the brand as a vital in the minds of the
consumers. Obviously, this aspect is much less under the control of the marketers.
Indirectly, the brad personality is created by all the elements of the marketing mix. Betra,
Lehman and Singh suggest the personality is created by all the personality of a brand is created
over time, by the entire marketing mix of the brand – “its price (high or low, odd or even), retail
store location (imaginary associations), product formulation (ingredients, benefits) , and product
form (solid, liquid. Etc), packaging details (colour, size, material, shape), symbol; used an all
phases of the brand communication, sales promotion and media advertising”.
Another form of animism explains how brand personality is created more in a more indirect
way. This form of animism involves complete anthropomorphization of the brand object itself.
Human qualities of emotionally and thought are transferred to the brand. This is achieved with
the help of marketing action, especially advertising. For example, the brand character of M&M
in the M&M commercials has the capacity to laugh and joke.
41
8/3/2019 Final Report 95
http://slidepdf.com/reader/full/final-report-95 42/91
One of the advantages of the brand personality is based on their distinctive personalities.
Consumers are able to differentiate between brands. Another advantage is that the consumer can
interpret the brand’s image in such a way that it is personally more meaningful. Brand
personality encourages more active processing on the part of the customer. Thus the consumer
put more efforts in creating and using the brand personality. A further advantage of brand
personality can be examined, namely the role of a brand as relationship partner in a consumer-
brand relationship. Next we will concentrate on these consumer based relationship.
Whether the brand is product or a company, the company has to decide what personality traits
the brand is to have. There are various ways of creating brand personality. One way is to match
the brand personality that they like. The process will be
• define the target audience
• Find out what they need, want and like
• Build a consumer personality profile
• Create the product personality to match that profile
Both profile appeal mostly to the emotional side of the people’s mind to their feelings and
sensory function. This profiling approach aims to reinforce the self concept of the consumers
and their aspirations . the approach is ideal for brands that adopt a market niche- strategy, and
42

8/3/2019 Final Report 95
http://slidepdf.com/reader/full/final-report-95 43/91
can be extremely successful if a market segment has a degree of global homogeneity , as in the
case with Levis.
Non product related brand personality drivers
• User imaginary –user imaginary can be based on either typical users or
idealized users. User imaginary can be powerful driver of brand personality , in
part because the user is already is person and thus the difficulty of
conceptualizing the brand personality is reduced. For example Charlie has a
feminine, strongly independent brand personality driven by it user personality of
Calvin Klein are similarly influenced by user imaginary .
• Sponsorship- activities such as events sponsored by the brand will influence its
personality. Swatch ,for example reinforce its offbeat , youthful personality will
targeted sponsorships that have included the freestyle ski world cup in
Breckenridge, the first international.
• Age- How long a brand has been on the market can effect its personality. thus
new entrants such as Apple, MCI, and Saturn tend to have younger brand
personalities than brand such as IBM, AT&T, and Chevrolet, and it all as too
common for a major dominate brand to see as strongly and old fashioned, a
brand for older people.
43

8/3/2019 Final Report 95
http://slidepdf.com/reader/full/final-report-95 44/91
• Symbol- a symbol can be powerful influence on brand personality because it can
be controlled and can have extremely strong associates. Apple bitten apple, the
Marlboro cowboy, the Michelin mans all help to crate and reinforce a personality
for their brands.
Why use brand personality
The brand personality can help construct the brand strategies by enhanching their
understandings of people’s perceptions of and attitude towards the brand , contributing to a
differentiating brand identity guiding the communication effort and creating brand equality.
• Enriching understanding
The brand personality metaphor can help a manager gain as in depth understanding of consumer
perception and attitudes towards the brand. By asking people to describe a brand personality,
feelings and relationship can be identified that often provide more insight than is gained by
asking about attribute perceptions.
• Contributing to a differentiating identity
Strategically, a brand personality, as a part of a core or extended identity, can serve as the
foundation for meaningful differentiations. Advertising agencies such as young & Rubicam and
Ogilvy & Mather routinely a brand personality statement as a part of their brand positioning
strategy.
44

8/3/2019 Final Report 95
http://slidepdf.com/reader/full/final-report-95 45/91
• Guiding with communication effort
Totally the brand personality concept and vocabulary communication the brand identify which
richness and texture to those who must implement the identity building effort. Practical
decisions need to be made about not only advertising but packaging, promotions, which events
to associate with , and the style of person interactions between the customer with the brand.
• Creating brand equity
The brand personality creates brand equity. The self-expression model explains this. The model
says that for a certain group of customers; some brands become vehicles to express a part of
their self-identity. People express their own or idealized identity in a variety of ways, such as
job choices, attitudes, options, activities, and lifestyles. Brand that people like admire, discuss,
buy and use also provide a vehicle for self-expression.
CHAPTER 345

8/3/2019 Final Report 95
http://slidepdf.com/reader/full/final-report-95 46/91
RESEARCH METHODOLOGY
RESEARCH METHODOLGY
Methodology includes the overall research procedures, which are followed in the research
study. This includes research design, the sampling procedures, and the data collection method
and analysis procedures. To broad methodologies can be used to answer any research question-
experimental research and non- experimental research. The major difference between the two
methodologies lies in the control of extraneous variable by intervention of the investigator in the
experimental research.
46

8/3/2019 Final Report 95
http://slidepdf.com/reader/full/final-report-95 47/91
RESEARCH DESIGN
A research design is defined, as the specification of method and procedures for acquiring of the
information needed. It is a plant or organizing framework for doing the study and collecting the
data. Designing a research plan requires decision all the data sources, research approaches,
research instruments, sampling plan and contact method.
Research design is mainly of following type:-
1. Exploratory research.
2. Descriptive studies
3. Casual Studies
EXPLORATORY RESEARCH
The major purpose of exploratory studies are the identification of problems, the more
precise formulation of problems and the formulations of new alternative course of action. The
design of exploratory studies is characterized by great amount of flexibility and ad-hoc veracity.
47

8/3/2019 Final Report 95
http://slidepdf.com/reader/full/final-report-95 48/91
DESCRIPTIVE STUDIES
Descriptive research in contrast to exploratory research is marked by the prior
formulation of specific research Questions. The investigator already knows a substantial amount
about the research problem. Perhaps as a Result of an exploratory study, before the project is
initiated. Descriptive research is also characterized by a Pre planned and structured design.
CASUAL OR EXPERIMENTAL DESIGN
A casual design investigates the cause and effect relationship between two or more
variables. The hypothesis is tested and the experiment is done. There are following type of
casual design:
I. After only design
II. Before after design
III. Before after with control group design
IV. Four groups, six studies design
V. After only with control group design.
VI. Consumer panel design
48

8/3/2019 Final Report 95
http://slidepdf.com/reader/full/final-report-95 49/91
VII. Exposit facto design
B)
DATA COLLECTION METHOD
SECONDARY
PRIMARY
Direct personal interview
Indirect personal interview
Information from correspondent’s govt. publications
49
Published sources Unpublished
sources

8/3/2019 Final Report 95
http://slidepdf.com/reader/full/final-report-95 50/91
Mailed questionnaire Report committees
Question filled by enumerators & commissions
Private publication
Research institute
PRIMARY DATA
These data are collected first time as original data. The data is recorded as observed or
encountered. Essentially they are raw materials. They may be combined, totalled but they have
not extensively been statically processed. For example, data obtained by the peoples but I did
not used in the Dissertation.
SECONDARY DATA
Sources of secondary Data
Following are the main sources of secondary data:
50

8/3/2019 Final Report 95
http://slidepdf.com/reader/full/final-report-95 51/91
1. Official Publications: Publications of the Pepsi, Dabur & others or the by the corporate
office of Pepsi, Dabur & Others.
2. Publications Relating to Trade: Publications of the trade association, stock exchange,
trade union etc.
3. Journal / Newspapers etc: Some newspapers/ journals collect and publish their own
data, e.g. Indian journal of economics, economist, Economic Times.
4. Data Collected by Industry associations: For example, data available with Pepsi,
Dabur & others.
5. Unpublished Data: Data may be obtained from several companies, organizations,
working in the same areas. For example areas. For example, data on Pepsi, Dabur &
Others by magazines.
Step in the Development of the Survey Instruments: The main instruments required for survey
was a well-developed questionnaire. The questionnaire development took place in a series of
steps as described below:
Research objectives are being transformed into information objectives.
51

8/3/2019 Final Report 95
http://slidepdf.com/reader/full/final-report-95 52/91
Step 1
The appropriate data collection method have been determined
Step 2
The information required by each objective is being determined.
Step 3
Specific Questions/ Scale measurement format is developed.
Step 4
Question/ Scale Measurement is being evaluated.
Step 5
The number of information needed is being determined.
Step 6
The questionnaire and layout is being evaluated.
Step 7
Revise the questionnaire layout if needed.
Step 8
The Questionnaire format is being finalized.
52

8/3/2019 Final Report 95
http://slidepdf.com/reader/full/final-report-95 53/91
Step 9
The selected customers have filled the questionnaires.
Step 10
Filled questionnaire are being analyzed.
Step 11
Conclusion and Recommendations are drawn after the analysis.
QUANTITIVE METHODS:
Data Collection
The whole research is based on primary data as well as secondary data.
Primary Data:
Primary data collected through the questionnaire from the various voice amplifier companies
Secondary data:
secondary data collected through the magazines, newspapers, insurance companies catalogue
and the advertisement.
53

8/3/2019 Final Report 95
http://slidepdf.com/reader/full/final-report-95 54/91
Sample status
STEPS IN SAMPLING PROCESS
Steps Description
1. Define population The population is define in terms of (a) element (b) Units (c)
Extents (d) Time.
2. Specify sampling
frame
The means of representing the element of the population e.g.,
telephone directory, map
3. Specify sampling Unit for sampling which holds the sampling household
elements e.g., city block, household.
4. Specify sampling
method
The method by which the sampling unit to be selected is
described i.e., probability/ non probability.
5. Determine sample
size
The number of elements of the population to be sampled is
chosen.
6. Specify sampling plan The operational procedure for selection of sampling units are
selected.
7. Select the sample The office and field work necessary for the selection of the
54

8/3/2019 Final Report 95
http://slidepdf.com/reader/full/final-report-95 55/91
sample are carried out.
SAMPLE SIZE:
35 respondents.
The respondents of various educational organizations.
The age of respondents is approximately between 25-65 yrs.
It is based on convenient sampling.
Reason for selecting convenient sampling.
• Time constraint
•Resource constraint
• Cost constraint
Limitations of research:
• The results through the questionnaire not always correct.
55

8/3/2019 Final Report 95
http://slidepdf.com/reader/full/final-report-95 56/91
• Convenient sampling some time leads to the distortion in results.
• The sampling size of 35 respondents not sufficient for exact result.
Regional limitations
In conducting the market research on portable voice amplifier and I found the regional
limitations as our research was limited to Lucknow region. Although I conducted telephonic
interviews in different states, but our statistics holds a greater percentage of Lucknow and
Kanpur.
Sample size
The sample size taken for this market research was 30, but this sample size is too small to be a
true representative for population size. The data collected from this sample size cannot be
generalized for the population.
Target population
The target population for this market group was the educational institute. They are mainly
coaching institute and the degree colleges.
56

8/3/2019 Final Report 95
http://slidepdf.com/reader/full/final-report-95 57/91
Class limitation
The target population was in majority from the medium and large no of student institutes.
Generally, the small no of student such as 10 to 20 students in a class don’t use such products.
Thus adding biasness to the inferences.
To the kores Customers, we asked the reason for choosing particular company.
The results shows that the major reasons for choosing particular co are:
1. Level of service provided by the kores company
2. Price Options
3. After Sales services
While option of up gradation and modernization as well as the promotional schemes and
packages offered affects their decision the least while choosing any voice amplifier company.
57

8/3/2019 Final Report 95
http://slidepdf.com/reader/full/final-report-95 58/91
CHAPTER 4
DATA ANALYSIS
58

8/3/2019 Final Report 95
http://slidepdf.com/reader/full/final-report-95 59/91
Firstly, I asked the organizations about their usage of portable voice amplifier, initially, I take
the sample of 35 people, as 35 out of 30 says they use i.e. 85% .but 4 out of these says they
don’t use it. So I take out those five sample and now my sample size reduces to 30.
Do you use the portable voice amplifier?
Frequency Percent Valid Percent Cumulative Percent
Valid yes 30 85.7 85.7 85.7
no 5 14.3 14.3 100.0
Total 35 100.0 100.0
59

8/3/2019 Final Report 95
http://slidepdf.com/reader/full/final-report-95 60/91
So, the conclusion is that most of all the teaching organizations use voice amplifier to address
their students or for the presentation purpose.
60

8/3/2019 Final Report 95
http://slidepdf.com/reader/full/final-report-95 61/91
As those who don’t use voice amplifier I asked them for their refrain for using the same
50% of them said that they don’t have so much public to address, might be they have small
organization and the left 50% says that Do not feel free to use it , as it is heavy and
cumbersome to carry etc .
So , those who use it then we directly move to question no. 3 as per the questionnaire which
brand are they currently using different organization have different products.
61

8/3/2019 Final Report 95
http://slidepdf.com/reader/full/final-report-95 62/91
Which brand are you currently using?
Frequency Percent Valid Percent Cumulative Percent
Valid Sony 4 13.3 13.3 13.3
Philips 11 36.7 36.7 50.0
Intex 5 16.7 16.7 66.7
local brands 6 20.0 20.0 86.7
others 4 13.3 13.3 100.0
Total 30 100.0 100.0
62

8/3/2019 Final Report 95
http://slidepdf.com/reader/full/final-report-95 63/91
Conclusion: A competition is quite tough between the existing brands but most of the
consumers use the Philips brand.
63

8/3/2019 Final Report 95
http://slidepdf.com/reader/full/final-report-95 64/91
Now we move to question no. 4 .How did you hear about the above mentioned brand/s?
As 30% i.e. 9 out of 30 said that they hear through the word of mouth.
How did you hear about the above mentioned brand/s?
Frequency Percent Valid Percent Cumulative Percent
Valid Advertisement 8 26.7 26.7 26.7
Word of mouth 9 30.0 30.0 56.7
Recommended by other
organization
7 23.3 23.3 80.0
Came across it in a electronic
market
6 20.0 20.0 100.0
Total 30 100.0 100.0
64

8/3/2019 Final Report 95
http://slidepdf.com/reader/full/final-report-95 65/91
Conclusion is that they give importance to the saying of the other person rather than the
advertisement or any other source.
65

8/3/2019 Final Report 95
http://slidepdf.com/reader/full/final-report-95 66/91
Now we move further as I asked about their usage of the whole product range offered. As most
out of them 73% said that they don’t use and the remaining 27% said that they use.
Do you use the whole product range offered?
Frequency Percent Valid Percent Cumulative Percent
Valid yes , please specify which
products you use in the range
8 26.7 26.7 26.7
no 22 73.3 73.3 100.0
Total 30 100.0 100.0
66

8/3/2019 Final Report 95
http://slidepdf.com/reader/full/final-report-95 67/91
Conclusion: Is that they don’t bother about the range offered they only use the product of that
brand whatever they want to use.
67

8/3/2019 Final Report 95
http://slidepdf.com/reader/full/final-report-95 68/91
Now move to question no. 7. I asked about their spending on these products. 50% out of the 30
says that they spend between Rs. 5000 to Rs 10,000 on these products. Only 10% said that their
spending are more than Rs 10,000.
68

8/3/2019 Final Report 95
http://slidepdf.com/reader/full/final-report-95 69/91
Approximately how much do you spend on these products ?
Frequency Percent Valid Percent Cumulative Percent
Valid Less than Rs.5000 12 40.0 40.0 40.0
Rs.5000-10000 15 50.0 50.0 90.0
Rs.10000 and above 3 10.0 10.0 100.0
Total 30 100.0 100.0
Conclusion is that they only 10% or less are most brand conscious and the 50% are brand
conscious but they generally don’t go for expensive brands and the left 40% don’t bother about
the brands and quality.
69

8/3/2019 Final Report 95
http://slidepdf.com/reader/full/final-report-95 70/91
I asked about the battery backup they get in one recharge. So the answers came very close
between the 5-10 hrs and 10-15 hrs. 12 says 5-10 and 12says 10-15 hrs. so there is a tie between
the two.
70

8/3/2019 Final Report 95
http://slidepdf.com/reader/full/final-report-95 71/91
How much battery backup you get in one recharge?
Frequency Percent Valid Percent Cumulative Percent
Valid 1-5 Hour 2 6.7 6.7 6.7
5-10 Hour 12 40.0 40.0 46.7
10-15 Hour 12 40.0 40.0 86.7
More than 15 Hour 4 13.3 13.3 100.0
Total 30 100.0 100.0
So the conclusion is that most of the amplifiers have almost the same battery backup i.e.
between 5-15 hrs depends on the usage.
71

8/3/2019 Final Report 95
http://slidepdf.com/reader/full/final-report-95 72/91
0%
27%
40%
33%
Q9. Approximately how much audience youhave to address ?
10-20-
20-50
50-100
More than 1
Approximately how much audience you have to address ?
Frequency Percent Valid Percent Cumulative Percent
Valid 20-50 8 26.7 26.7 26.7
50-100 12 40.0 40.0 66.7
More than 100 10 33.3 33.3 100.0
Total 30 100.0 100.0
72

8/3/2019 Final Report 95
http://slidepdf.com/reader/full/final-report-95 73/91
Now . I asked about “the number of audience they have to address”. Most of them said they
have to address 50 to 100 audience and no one said that they have to address 10 to 20 and use
the voice amplifier.
Conclusion , this clearly shows that voice amplifier is best option when the boss have to address
people between 50 to100.
73

8/3/2019 Final Report 95
http://slidepdf.com/reader/full/final-report-95 74/91
Q 10 How much impact of companies hiring brand ambassadors propelling you to use
such products?
74

8/3/2019 Final Report 95
http://slidepdf.com/reader/full/final-report-95 75/91
How much impact of companies hiring Brand ambassadors propelling you to use such
products. Rate on the scale of 1-7
Frequency Percent Valid Percent Cumulative Percent
Valid 2 1 2.9 3.3 3.3
3 8 22.9 26.7 30.0
4 8 22.9 26.7 56.7
5 5 14.3 16.7 73.3
6 5 14.3 16.7 90.0
7 3 8.6 10.0 100.0
Total 30 85.7 100.0
Missing System 5 14.3
Total 35 100.0
Question no 11 knowing about the marketing techniques.
75

8/3/2019 Final Report 95
http://slidepdf.com/reader/full/final-report-95 76/91
One-Sample Statistics
N Mean Std. Deviation Std. Error Mean
Does the known brand
company’s marketing
techniques affects your buying
decision ?
30 3.40 1.276 .233
76

8/3/2019 Final Report 95
http://slidepdf.com/reader/full/final-report-95 77/91
Does the known brand company’s marketing techniques affects
your buying decision ?
Frequency Percent Valid Percent
Cumulative
Percent
Valid 2 10 28.6 33.3 33.3
3 6 17.1 20.0 53.3
4 8 22.9 26.7 80.0
5 4 11.4 13.3 93.3
6 2 5.7 6.7 100.0
Total 30 85.7 100.0
Missing System 5 14.3
Total 35 100.0
77

8/3/2019 Final Report 95
http://slidepdf.com/reader/full/final-report-95 78/91
CHAPTER 5
CONCLUSION
CONCLUSION
78

8/3/2019 Final Report 95
http://slidepdf.com/reader/full/final-report-95 79/91
To conclude, the result show that the companies are playing on the peripheral cues to maintain
their Total Relationship Management and connect to the customers both present and potential.
The companies are operating in a highly aggressive and competitive global market place and
this climate has led to the emphasis on quality in all aspects.
• TQM focuses on integration and coordination as well as the continuous improvement of
all activities and process. Total Relationship Management (TRM) is a very recent
marketing strategy and philosophy. It focuses on and is concerned with all integrated
internal and external activities within and between the organizations. These two terms
are integrated by the manufactures by building good quality products and building good
relationship with dealers and enhancing service levels.
• However, when studied from the point of the view of a customer there seems to be no
major difference among the voice amplifier brands in a segment as far as performance is
concerned.
• The brand perception is dependant mostly on the peripheral cues depending upon the
nature and quality of the service provided along with the pricing, maintance, availability
of spare parts and related issues. The study shows that brand perception is something
which starts building up before a product is purchased and goes on with its reflected in
the recommendations the customer makes to his acquaintances for the same products.
Also, Its seen that the customer might not be using the products still he holds the
perceptions about it.
79

8/3/2019 Final Report 95
http://slidepdf.com/reader/full/final-report-95 80/91
• Brand personality of tiles product is enforced by the sellers in the mindsets of the
customers and the customers react to it by forming their perceptions about the tiles
products and this reflects in the overall brand image of the products. So brand image and
brand personality complement each other and the brand perception aids the building of
the brand image.
• Finally the major point that emerges out of this detailed study is a caution for the voice
amplifier companies. It says that there is no doubt that Indian amplifier market may be
growing with a double digit figure still the voice amplifier companies have a long way
to travel to convince their customers about the brand personality of their product and
how it suit the prospective buyers. Simply because it simply is not a guarantee that how
so ever good the customer might be holding the brand perception and how so ever good
the brand image may be it is not guarantee that it will convert into sale.
80

8/3/2019 Final Report 95
http://slidepdf.com/reader/full/final-report-95 81/91
CHAPTER 6
RECOMMENDATIONS,
SUGGESTIONS
AND
LIMITATIONS
RECOMMENDATIONS
Promotional activities- this is one of the primary things that are required within the company.
During my visits to different organizations, I came across that there is no awareness of the
81

8/3/2019 Final Report 95
http://slidepdf.com/reader/full/final-report-95 82/91
companying the form of posters, stands and other related things. One thing that would like to
recommend would be the introduction of more promotional activities so as to generate more
revenues for the company. Campany can introduce more
-Schemes
-Get together for channel partners
-Brand recognition in the market
-To keep more inventories
-Advertisement in Industrial area
Focus more on “b” and “c” category companies- This is also one of the prime things that are
required. With around 80% of the revenues coming from less than 20% of the companies , more
focus should be given on ‘b’ and ‘c’ companies .’A’ category agents are said to be the agents
who contribute more than Rs. 50000 of revenues per month. Companies should focus more on
‘b’ and ‘c’ category clients so that more of these clients can be converted into ‘a’ category.
Co-ordination among different channels-
With agency office in a different building and no direct control over the district operations,
transparency between different channels is lacking. With the plan for executives that I have
82

8/3/2019 Final Report 95
http://slidepdf.com/reader/full/final-report-95 83/91
suggested above, there could be more transparency that can come in the overall operations of
the NCR region.
Different commissions slabs for different channels-
With commissions being one of the prime motives for the sales executive to do business with
different companies, more and more emphasis should be given on the commission that are
rendered to the agents.
Very limited corporate tie ups-
This should be one of the most important thing that should be on the agenda for the travel
category. A corporate tie up can easily deliver a business of more than 50000 per month. Other
than that, the contract is on a long term basis. This therefore helps in getting an easy business
for the company. Therefore, from my point of view, more emphasis should be given on category
of business as well.
Suggestions:
83

8/3/2019 Final Report 95
http://slidepdf.com/reader/full/final-report-95 84/91
Product:
- Pricing to be more competitive
- Provide more specifications and designs
- Increase product line
Service:
- Revamp the entire quick reaction procedure for emergencies
- Provide customized contracts and more options as such
- Error diagnosis time and procedure needs to be analyzed
- Price of service contracts and parts should not be increased blindly
LIMITATIONS
84

8/3/2019 Final Report 95
http://slidepdf.com/reader/full/final-report-95 85/91
Although every effort has been in to collect the relevant information through the sources
available, still some relevant information could be gathered.
Busy schedule of concerned executives: The concerned executives were having
very busy schedule because of which they were reluctant to give appointment.
Time: The time duration could not provide ample opportunity to study every
detail of the company.
Unawareness: Executives were unaware of many terms related to same while
asking to them.
Confidential information: As the company on account of confidential report
has not disclosed some figures. Moreover, in some cases separate accounts of
division are not separately maintained thereby, leading to restrictions in study.
REFERENCES
85

8/3/2019 Final Report 95
http://slidepdf.com/reader/full/final-report-95 86/91
BOOKS
• Beri- Marketing Research(Tata McGraw-Hill),1993,2nd ed.
• Kotler,Philip- Marketing Management :Analysis, Planning,Implementations and
Control,Pearson Education, New Delhi.2003, 11th ed.
• Kotler, Philip and Armstrong, Graw – Principles of Marketing, Pearson education,
New Delhi.
• Sharma J.K.- Business Statistics( Pearson Education)
DAILY & JOURNALS
• Article given in Free-Press-Release.com August 26, 2009
• A survey by ‘Research and Markets’ 2009
• Business Today
INTERNET
• http://www.pssmagazine.com/readmore_special.php?newsid=41
86

8/3/2019 Final Report 95
http://slidepdf.com/reader/full/final-report-95 87/91
• Information on portable voice amplifier – ‘http://www.kores-india.com/’
APPENDIXQuestionnaire for Organizations
Kores(India) Ltd.
NOTE: I am management student of Babu Banarasi Das and all the information collected will only be
used for the purpose of research only and in any case the identity of the respondents will not be revealed.
87

8/3/2019 Final Report 95
http://slidepdf.com/reader/full/final-report-95 88/91
NAME_______________________________________________________
ORGANIZATION_________________________________________________
DESIGNATION__________________________________________________
MOBILE NO. ____________________________
1. Do your organization use portable voice amplifier ?
Yes No
(If yes , directly proceed to question 3 and if no only answer 2)
2. Why do you refrain from using such products?
Does not have so much public to address.
Do not feel free to use it , as it is heavy and cumbersome to carry etc
Any other_______________________________________________
3. Which brand are you currently using?
______________________________________________________________________
4. How did you hear about the above mentioned brand/s?
Advertisement Word of mouth
Recommended by other organization Came across it in a electronic
market
Any other____________________________________________________________________
5. What benefits you get using such a particular product?
______________________________________________________________________
6. Do you use the whole product range offered?
88
8/3/2019 Final Report 95
http://slidepdf.com/reader/full/final-report-95 89/91
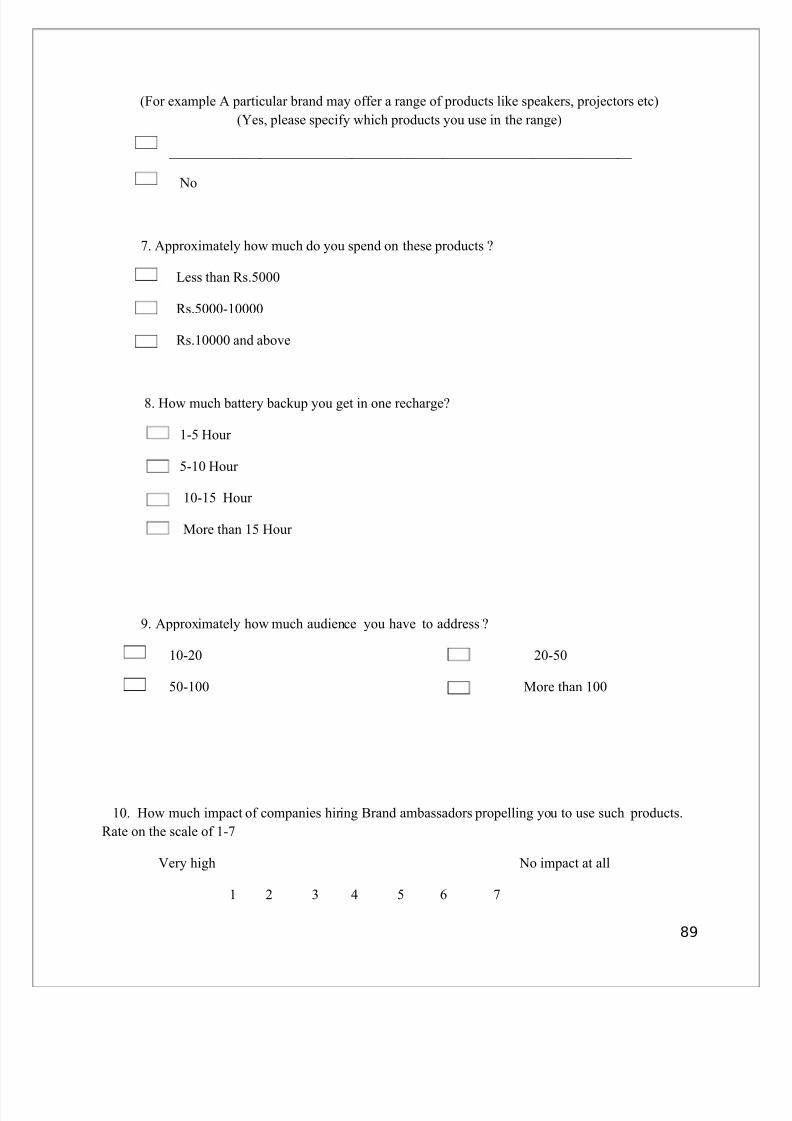
(For example A particular brand may offer a range of products like speakers, projectors etc)
(Yes, please specify which products you use in the range)
__________________________________________________________________
No
7. Approximately how much do you spend on these products ?
Less than Rs.5000
Rs.5000-10000
Rs.10000 and above
8. How much battery backup you get in one recharge?
1-5 Hour
5-10 Hour
10-15 Hour
More than 15 Hour
9. Approximately how much audience you have to address ?
10-20 20-50
50-100 More than 100
10. How much impact of companies hiring Brand ambassadors propelling you to use such products.
Rate on the scale of 1-7
Very high No impact at all
1 2 3 4 5 6 7
89

8/3/2019 Final Report 95
http://slidepdf.com/reader/full/final-report-95 90/91
(______/______/______/______/______/______/______)
11. Does the known brand company’s marketing techniques affects your buying decision ?
Very much Not at all
1 2 3 4 5 6 7
(______/______/______/______/______/______/______)
90

8/3/2019 Final Report 95
http://slidepdf.com/reader/full/final-report-95 91/91