Embed Size (px)
Citation preview
FINAL REPORT AMALGAMATION OF POLICE AND HOSPITAL TRAUMA DATA IN THE AUSTRALIAN CAPITAL TERRITORY 2001-2003 NOVEMBER 2008 Drew B. Richardson M.B., B.S.(Hons), F.A.C.E.M., Grad. Cert. H. E., NRMA-ACT Road Safety Trust Chair of Road Trauma and Emergency Medicine, Australian National University Medical School Address for Correspondence: A/Prof Drew Richardson Emergency Department, The Canberra Hospital Yamba Dr GARRAN ACT Australia 2605 Ph +61 2 6244 2418 Fax +61 2 6244 2594 email [email protected]
PROJECT CONTRIBUTORS Caroline Paini R.N., Research Assistant Patrick Baker, Medical Student, ANU Medical School TiTi Chen, Medical Student, ANU Medical School Jen Moran, Medical Student, ANU Medical School Kaye Robertson MB, BS, The Canberra Hospital ACKNOWLEDGEMENTS This work was undertaken with funding from the NRMA-ACT Road Safety Trust. It would not have been possible without the cooperation of the Australian Federal Police and the Health Information Unit at The Canberra Hospital.
2
INTRODUCTION The annual death rate or “road toll” is one simple and widely reported measure of the consequences of road trauma, but in small jurisdictions this figure may fluctuate dramatically. Whilst the underlying causes of road trauma are well understood, the most appropriate and cost effective interventions are not always known. Trial of possible interventions is likely to occur first in relatively small populations, such as single States or Territories, where the death rate is an insensitive measure of outcome. Data about road crashes is routinely collected by Police services and data on hospital treatment by Health services. However, operational constraints markedly limit the accuracy of data that is not immediately relevant to the service, and privacy concerns limit the linkage between services. For example, in most Australian States, police attending a crash scene do not follow up patients taken to hospital unless a death or criminal charge is thought to be likely, and hospitals do not record structured details about the location or type of causative crashes, and only in Western Australia is the Health system able to easily track the care of a patient across multiple hospitals. There have been studies linking health and police records in various jurisdictions [1-3], but much of the published Australian research has been limited to a particular type of crash [4] or particular type of road user [5]. The most successful long term linkage matches Western Australian public hospital admissions but not Emergency presentations, with Police data using an automated probabilistic match [6]. One of the further difficulties encountered in such research is accurate classification of events as road trauma. Many documents [7, 8] note that all Australian States and territories follow national “Guidelines for reporting and classifying road crashes” (or “road accidents” in earlier versions) but these guidelines have not been widely disseminated [Australian Transport Safety Bureau, personal communication], and are not provided for reference at Police Stations in the ACT. Thus the importance of an accurate record of the type of activity (and even whether it occurred on a public road) may not be apparent at the time many crashes are reported by the public. This study was undertaken to:
1. Create a new and more accurate measure of the health consequences or “burden” of road trauma in the Australian Capital Territory (ACT)
2. Identify the nature and location of crashes contributing to these health consequences
3. Create a three year linked dataset of crashes and outcomes and assess the feasibility and value of an ongoing dataset.
In this region, all trauma cases requiring public hospital admission are treated at a single institution, The Canberra Hospital (TCH). Private hospital treatment of road trauma in the ACT is negligible, but TCH also treats much of the serious trauma occurring in surrounding areas of NSW, and a smaller number of ACT residents who were injured elsewhere. The Australian Federal Police (AFP) record details of all crashes attended by
3

Police, and all crashes reported at Police stations (reporting is a requirement under Road Transport Legislation and for most motor vehicle insurance claims).
4
METHODS This was a retrospective descriptive data matching study of AFP and TCH data covering crashes occurring in calendar years 2001 to 2003. Identifying details were used in the matching process, but deleted before analysis, as approved by the ACT Health Research Ethics Committee. The AFP data supplied consisted of four data tables: Crashes, People, Vehicles and (limited) free text. The Hospital data were Emergency Department (ED) and inpatient databases, which share patient identifiers, supplemented by reference to the hospital notes when necessary. Where appropriate, the information was compared to the publicly available Australian Transport Safety Bureau (ATSB) Fatal Road Crash Database, which is considered to represent the “official” road death toll. An INCIDENT was defined as a crash that caused injury and occurred within the ACT as reported on the AFP database, or described in patient records. Because of the lack of clarity over road crash definitions, a liberal definition including any moving wheeled vehicle larger than a skateboard was used. Incidents were then classified as to the location and vehicle types. An EPISODE was defined as an incident-related patient encounter with the hospital system beginning within 90 calendar days, or a death prior to reaching hospital. Admission to a hospital bed immediately following Emergency Department care was counted a single episode. Lengths of admissions were counted until the first time the patient was physically discharged from hospital, ignoring any “statistical” discharges recorded in the interim. Episodes were classified by the outcome and number of bed-days used, by standard definitions [9]. A PERSON was defined as a “person-incident”, that is, concordance of one individual recognised by a hospital unit record number with a crash. Thus an individual who had 3 admissions from one motorbike crash was counted as one person, but if the same individual was struck by a car two years later this was treated statistically as a second person. A four phase matching process was undertaken: the initial match was automated, searching for concordance of the first four letters of first name and surname between AFP and ED databases, and then manually establishing the accuracy of matches. The second phase was manual search of the Police data for incidents that matched remaining ED presentations with road trauma keywords recorded in their text fields. The third was manual search for incidents matching remaining admissions to hospital that had been classified by trained coders as “transport related”. The fourth was a manual audit of the entire database to identify representations, deaths outside hospital, and multiple patients from the same incident. Matching was undertaken entirely by two researchers: the author and the research assistant.
5
RESULTS The AFP data included 34802 crash records, of which 0.9% described the same type of crash at the same location at the same time as another record, and a further 1.5% described the same type of crash at the same location within 30 minutes of another record. 4000 hospital episodes and 19 non-hospital fatalities involving 3787 people were matched to 1607 different police data incidents (2302 matches). A further 1717 hospital episodes could not be matched to a Police incident record, and these were believed to represent 1586 incidents. 50 episodes with Police reports (including 3 fatalities) and 6 episodes without police reports were classified as due to medical problems and excluded. In total, 3193 incidents injured 3787 people (1.19 per crash), who then averaged 1.06 hospital episodes each as detailed in Tables 1 and 2. The episode count alone (mean 1.26 per crash) may be deceptive, since the most severely injured, who died at the scene, could not experience more than one episode by definition. There were 76 actual patients involved in two different incidents in the three years, and 4 involved in three. As noted above, these are classified as 84 persons in the tables, in order to be able to analyse by road user type. Review of the hospital records suggested that two of the “struck pedestrian” deaths on the AFP and ATSB databases might be better classified differently: one as a suicide (and thus not strictly road trauma) and one as a fall from a moving vehicle. Three deaths were identified in both AFP and TCH data, but subsequently excluded from the ATSB Fatal road crash Database, apparently because medical conditions caused both the crash and the death. One road fatality was found to be missing from the AFP data: a perinatal death resulting directly from trauma to a pregnant vehicle occupant. In line with the inclusive approach of this study, all these deaths are included in the tabulated results. The outcome of hospital episodes is shown in Table 3, the matching rate with Police data in Table 4, and the relative outcomes of crashes on the Police data in Table 5. The age distribution of individual patients is shown in Figure 1, and the total number of bed-days used in figure 2. Figure 4 shows the distribution of episodes over time, and indicates that 27.7% of the episodes fell outside the usual definition of road trauma: they occurred off public roads or involved only pushbikes. The same data analysed by total bed days in Figure 5 shows 21.3% of bed-days arise from incidents off public roads. A sub-project used geographic information system to plot the location of 2002-3 crashes from the Police dataset on the basis of the most severe outcome from each crash. Of 1082 crashes with an injury outcome, 847 could be accurately located. There was no significant statistical association between crash severity and distance from city centre, although numbers were small in the most severe group (only 17 fatal crashes). Distance from the city centre was distributed bimodally with peaks above and below 12km, and direction was markedly different for low severity crashes: 34.6% of crashes recorded as causing death or hospital admission occurred in the northern part of Canberra but only
6

15.7% of those recorded as causing ED presentation(s) only did so (P<0.0001, Chi square). The distribution is shown graphically in Figure 5. A second sub-project analysed the entire 2002-3 Police crash dataset by the rurality of the reported suburb. The rurality index (ARIA score), an Australian measure used in planning, was determined for each suburb. As shown in figure 6, there was a strong correlation between rurality and crash severity.
7
DISCUSSION This combined database provides a powerful tool for description of both individual consequences and the community burden of road trauma. It is already of sufficient magnitude to allow hypothesis testing, and when expanded it will allow detailed tracking of road trauma over time. For the first time in Australia these data allow study of road trauma using crashes (incidents), people, or hospital episodes as the fundamental unit of analysis. There were significant limitations to the data sources. It is probable that around 2.5% of crashes on the AFP database represent duplicate records, resulting from the same crash being reported at different Police stations by different people. The AFP database infrequently included injury/identifying details if patients were not transported to hospital directly from the scene. Those definite car crashes that could not be matched reflected both frequent collisions without adequate distinguishing features (one wet morning in June 2003 had 21 crash reports in a 1-hour period, at least 9 of which represented different rear end collisions), and cases of genuine mis-reporting and non-reporting. Over a 90% match rate for car occupants as achieved is very good for data of this nature, much better than 67% reported in a similar study in Sussex [10] and the reporting rate of 65% (single vehicle) and 79% (multiple vehicle) for car drivers in New Zealand [11]. The much lower rate of matching for motorcycle injuries reflects both under-reporting of single vehicle crashes when there is little vehicular damage (and thus no insurance reason to report), and non-reporting of off-road crashes. Other studies have noted reporting of single motorcycle crashes on the road in the range 41[11] to 69% [10]. Unless hospital data collection of “place of occurrence” improves, it will not be possible to identify how many of the apparently unreported 79% of motorcycle crashes in the ACT occur on the roads. The match rate for cyclists seems to be the lowest ever reported (compared to 22% for “serious” on road cycle crashes in New Zealand [12]). This certainly reflects the inclusive definition, capturing many backyard incidents, but probably also indicates a high use of off-road bicycle paths by the ACT cycling population. The TCH data had no duplications (as befits a hospital records system, all unidentified patients eventually had their records merged correctly), but had inadequate crash descriptions in both computerised data and medical records. Staff generally recorded mechanism of injury well, but had no incentive to record location (even the State) in which the crash occurred, nor the vehicle types. It was also clear that despite the endeavours of hospital staff, some patients chose not to identify their injuries as due to vehicular trauma, and others were dishonest in nominating the driver of a vehicle. These factors, plus the availability of other sources of medical care, mean that the “Emergency Department Care only” group likely underestimates the actual incidence of minor injury. Because TCH is the only source of public inpatient care for trauma in the ACT, and separate staff code admissions, the admissions data is likely to be more complete than any previous Australian study.
8
From the geographic analysis, it is clear that major injury crash distribution reflected urban development, accounting for the bimodal distance distribution. Minor injury crash, distribution however, reflected patient choice of health care provider since the major hospital is in the southern part of the city. These data describe a heavily urbanised population, where road speeds are relatively low, stop-start driving is common, roads are well built and maintained, and vehicle density is high. Despite the urban nature of the ACT, it is of interest that such a large difference in crash outcome could be demonstrated on the basis of suburb rurality. This finding has been reported in many jurisdictions but never one as uniform as Canberra. The reasons normally given for the higher mortality in rural and remote areas include higher vehicle speeds, less well maintained roads, older vehicles, more passenger overloading, long times to discovery, long transport times, and less tertiary health services. Of these, only higher speeds and road quality are likely to be significant in our setting. The contrast with the (largely remote) Northern Territory is dramatic: rollovers and pedestrian incidents each constitute 0.9% of reported ACT crashes, accounting for 2.7% and 3.0% of reported crashes leading to hospital episodes, whereas they account for 30% and 8% of all injury crashes in NT [4]. Choice of length of stay as a major outcome measure was arbitrary, but based on clinical knowledge: patients spending more than one week in hospital are likely to have significant residual impairment, and patients discharged after only one day most likely required only observation or a simple procedure. The divisions chosen appear to be robust and consistent, and the distribution by road user type and frequency of transfers to other hospitals supports their use as an ordinal measure of severity. Total bed-day usage is a reasonable measure of the burden of care provided by the hospital system, but a less consistent metric over time, since it may easily be imbalanced by small numbers of very long stay patients. As illustrated by the difference between fatalities in this study and the ATSB “road toll”, the line between road trauma and other trauma may be blurred even when coronial opinion is the final legal arbiter. Bicycle-related road trauma is grossly under-reported to the Police, even allowing for the high proportion of off-road incidents, but some incidents that are not strictly road trauma such as rally spectator injuries and private car park collisions are commonly reported to the AFP database. It is of some concern that one unequivocal road trauma related death was apparently not reported to the Police or the Coroner, but as noted above, more than 90% accuracy might be considered reasonable in this setting.
9
CONCLUSIONS This amalgamated database provides an important tool in the description and measurement of the overall burden of road trauma in the ACT. It appears to be more robust and inclusive than previous similar Australian studies, although so far significantly smaller. The process of collating the data has highlighted inadequacies in current Police and Hospital data collections, due to both operational constraints and data collection design. In particular the Police database does not identify duplicate records, does not contain adequate identifying data, and does not have a review process that imposes a uniform definition of road trauma. Hospital data collection does not mandate identification of crash location even at a State level, and has insufficient structure around cause of injury to clearly identify all cases. Injured people themselves appear frequently to be less than forthcoming in both crash reports and medical history. Whether injured on- or off-road, those involved in single vehicle crashes with injury but without significant vehicular damage rarely report the case to the Police. This seems unlikely to change without significant legal imposition. With continued expansion of the database, it will represent a powerful research tool, suitable for hypothesis testing and for tracking of changes over time.
10
RECOMMENDATIONS
1. Continue data matching to build the dataset up to approximately 6 months behind “real time”. This is realistic given the time taken to finalise both Police and hospital sources.
2. Link existing data with other hospital information, notably the trauma registry, to expand the information available.
3. Use the dataset for further sub-projects such as the rurality and geography projects to explore hypotheses about road trauma in the ACT.
4. Explore the ethical and privacy issues in linking data with outside sources: notably licensing and prosecution data, possibly insurance data.
5. Explore better data collection by both the hospital and the Australian Federal Police. This is underway at TCH and in implementing a “Smart form” by AFP
6. Make de-identified data available to other researchers in this field
11
REFERENCES 1. Singleton M, Qin H, Luan J. Factors associated with higher levels of injury
severity in occupants of motor vehicles that were severely damaged in traffic crashes in Kentucky, 2000-2001. Traffic Inj Prev. 2004 Jun;5(2):144-50
2. Moore M. Comparison of young and adult driver crashes in Alaska using linked traffic crash and hospital data. Alaska Med. 1997 Oct-Dec;39(4):95-102
3. Tercero F, Andersson R. Measuring transport injuries in a developing country: an application of the capture-recapture method. Accid Anal Prev. 2004 Jan;36(1):13-20
4. Treacy PJ, Jones K, Mansfield C. Flipped out of control: single-vehicle rollover accidents in the Northern Territory. Med J Aust. 2002 Mar 18;176(6):260-3
5. Boufous S, Williamson A. Work-related traffic crashes: a record linkage study. Accid Anal Prev. 2006 Jan;38(1):14-21
6. Rosman DL. The western Australian road injury database (1987-1996): ten years of linked police, hospital and death records of road crashes and injuries. Accid Anal Prev. 2001 Jan;33(1):81-8
7. Henderson M. Child Deaths and Injuries in Driveways: response to the Recommendations of the Child death Review Team. Motor Accidents Authority of NSW. Sydney, Oct 2000. Available at: http://www.maa.nsw.gov.au/getfile.aspx?Type=document&ID=10607&ObjectType=3&ObjectID=12
8. Australian Transport Safety Bureau. Road Safety Statistics Report: serious injuries due to Road Crashes. Canberra, Nov 2004. Available at: http://www.atsb.gov.au/pdfs/serious_injury_2004.pdf
9. Australian Institute of Health and Welfare 2001. National Health Data Dictionary. Version 10. AIHW Catalogue no. HWI 30. Canberra: Australian Institute of Health and Welfare.
10. Alsop J, Langley J. Under-reporting of motor vehicle traffic crash victims in New Zealand. Accid Anal Prev. 2001 May;33(3):353-9
11. Cryer PC, Westrup S, Cook AC, Ashwell V, Bridger P, Clarke C. Investigation of bias after data linkage of hospital admissions data to police road traffic crash reports. Inj Prev. 2001 Sep;7(3):234-41
12. Langley JD, Dow N, Stephenson S, Kypri K. Missing cyclists. Inj Prev. 2003 Dec;9(4):376-9
12
13
PUBLICATIONS ARISING
Richardson DB, Chan M. Matching police and hospital data sources to describe the health burden of road trauma. International Conference on Emergency Medicine, Cairns, June 2004. Emerg Med Aust 2004 Jun; 16 (S1): A116
Paini C., Richardson D.B. Amalgamation of Police and hospital road trauma data. ACEM Annual Scientific Meeting, Melbourne, Nov 2005. Emerg Med Aust 2006 Apr; 18 (S1): A19 Richardson DB. Amalgamation of Police and Hospital Road trauma data. ACRS Workshop, Canberra, Oct 2005 Richardson DB, Moran J, Paini C. Pedestrian and Cyclist Injuries in the Australian Capital Territory. ACRS National Conference, Melbourne, June 2006. Richardson D.B., Paini C. Amalgamation of Police and Hospital Trauma Data in the Australian capital Territory 2002-2003. 2006 Australasian Road Safety, Research Policing and Education; Able Video & Multimedia 2006:1(electronic publication) Richardson DB, Chen TiTi. Are there any “Rural” road crashes in the ACT? ACEM Winter Symposium, Launceston, June 2007. Richardson DB, Baker P. Geographic location of injury crashes in the ACT. ACEM Annual Scientific Meeting, Gold Coast, November 2007.
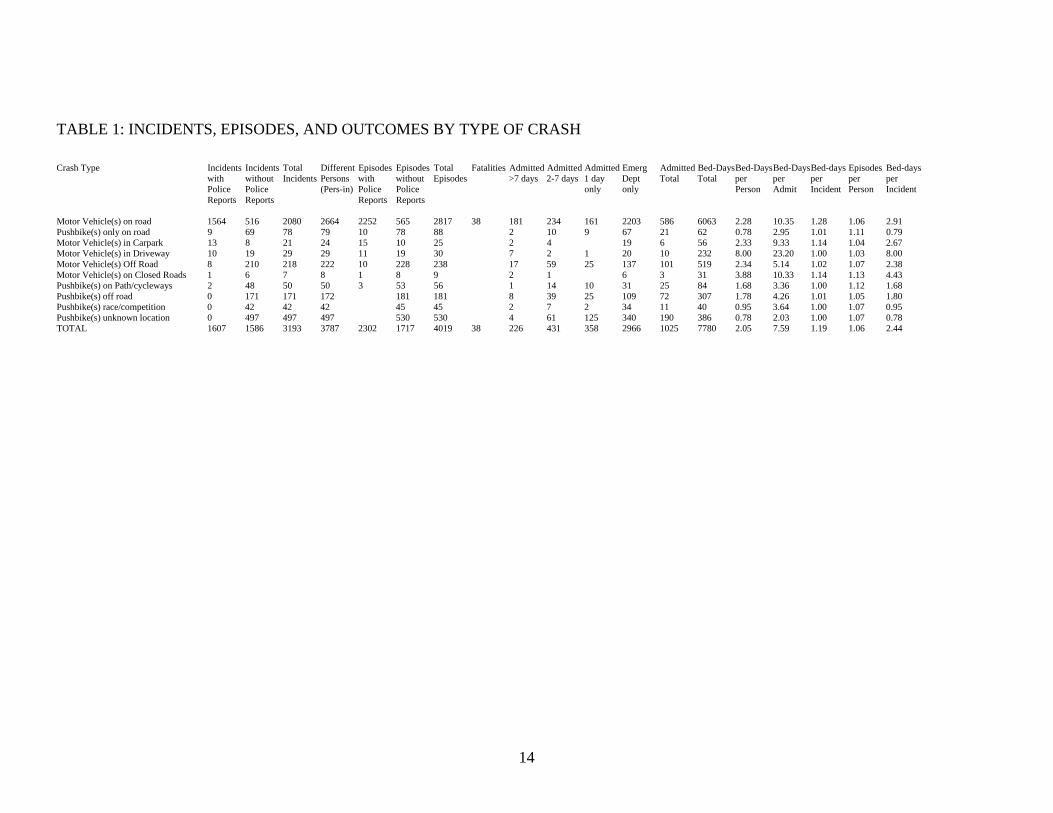
TABLE 1: INCIDENTS, EPISODES, AND OUTCOMES BY TYPE OF CRASH Crash Type Incidents Incidents Total Different Episodes Episodes Total Fatalities Admitted Admitted Admitted Emerg Admitted Bed-Days Bed-Days Bed-Days Bed-days Episodes Bed-days with without Incidents Persons with without Episodes >7 days 2-7 days 1 day Dept Total Total per per per per per Police Police (Pers-in) Police Police only only Person Admit Incident Person Incident Reports Reports Reports Reports Motor Vehicle(s) on road 1564 516 2080 2664 2252 565 2817 38 181 234 161 2203 586 6063 2.28 10.35 1.28 1.06 2.91 Pushbike(s) only on road 9 69 78 79 10 78 88 2 10 9 67 21 62 0.78 2.95 1.01 1.11 0.79 Motor Vehicle(s) in Carpark 13 8 21 24 15 10 25 2 4 19 6 56 2.33 9.33 1.14 1.04 2.67 Motor Vehicle(s) in Driveway 10 19 29 29 11 19 30 7 2 1 20 10 232 8.00 23.20 1.00 1.03 8.00 Motor Vehicle(s) Off Road 8 210 218 222 10 228 238 17 59 25 137 101 519 2.34 5.14 1.02 1.07 2.38 Motor Vehicle(s) on Closed Roads 1 6 7 8 1 8 9 2 1 6 3 31 3.88 10.33 1.14 1.13 4.43 Pushbike(s) on Path/cycleways 2 48 50 50 3 53 56 1 14 10 31 25 84 1.68 3.36 1.00 1.12 1.68 Pushbike(s) off road 0 171 171 172 181 181 8 39 25 109 72 307 1.78 4.26 1.01 1.05 1.80 Pushbike(s) race/competition 0 42 42 42 45 45 2 7 2 34 11 40 0.95 3.64 1.00 1.07 0.95 Pushbike(s) unknown location 0 497 497 497 530 530 4 61 125 340 190 386 0.78 2.03 1.00 1.07 0.78 TOTAL 1607 1586 3193 3787 2302 1717 4019 38 226 431 358 2966 1025 7780 2.05 7.59 1.19 1.06 2.44
14
15
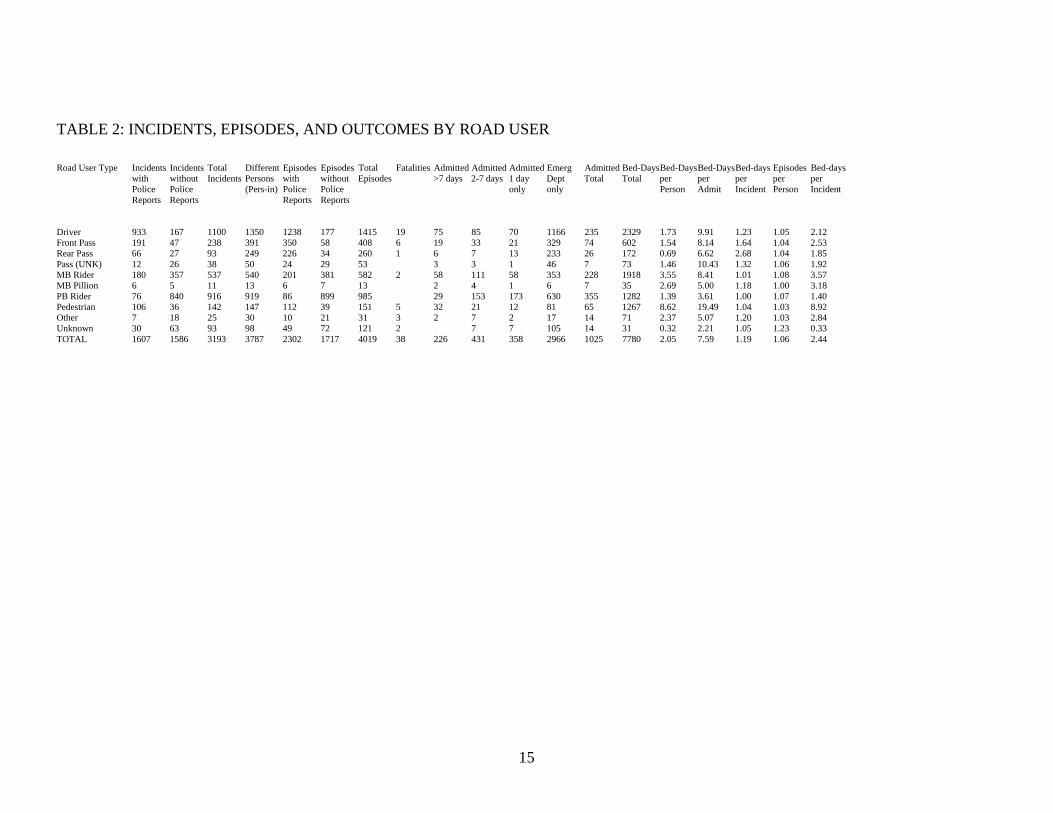
TABLE 2: INCIDENTS, EPISODES, AND OUTCOMES BY ROAD USER Road User Type Incidents Incidents Total Different Episodes Episodes Total Fatalities Admitted Admitted Admitted Emerg Admitted Bed-Days Bed-Days Bed-Days Bed-days Episodes Bed-days with without Incidents Persons with without Episodes >7 days 2-7 days 1 day Dept Total Total per per per per per Police Police (Pers-in) Police Police only only Person Admit Incident Person Incident Reports Reports Reports Reports Driver 933 167 1100 1350 1238 177 1415 19 75 85 70 1166 235 2329 1.73 9.91 1.23 1.05 2.12 Front Pass 191 47 238 391 350 58 408 6 19 33 21 329 74 602 1.54 8.14 1.64 1.04 2.53 Rear Pass 66 27 93 249 226 34 260 1 6 7 13 233 26 172 0.69 6.62 2.68 1.04 1.85 Pass (UNK) 12 26 38 50 24 29 53 3 3 1 46 7 73 1.46 10.43 1.32 1.06 1.92 MB Rider 180 357 537 540 201 381 582 2 58 111 58 353 228 1918 3.55 8.41 1.01 1.08 3.57 MB Pillion 6 5 11 13 6 7 13 2 4 1 6 7 35 2.69 5.00 1.18 1.00 3.18 PB Rider 76 840 916 919 86 899 985 29 153 173 630 355 1282 1.39 3.61 1.00 1.07 1.40 Pedestrian 106 36 142 147 112 39 151 5 32 21 12 81 65 1267 8.62 19.49 1.04 1.03 8.92 Other 7 18 25 30 10 21 31 3 2 7 2 17 14 71 2.37 5.07 1.20 1.03 2.84 Unknown 30 63 93 98 49 72 121 2 7 7 105 14 31 0.32 2.21 1.05 1.23 0.33 TOTAL 1607 1586 3193 3787 2302 1717 4019 38 226 431 358 2966 1025 7780 2.05 7.59 1.19 1.06 2.44

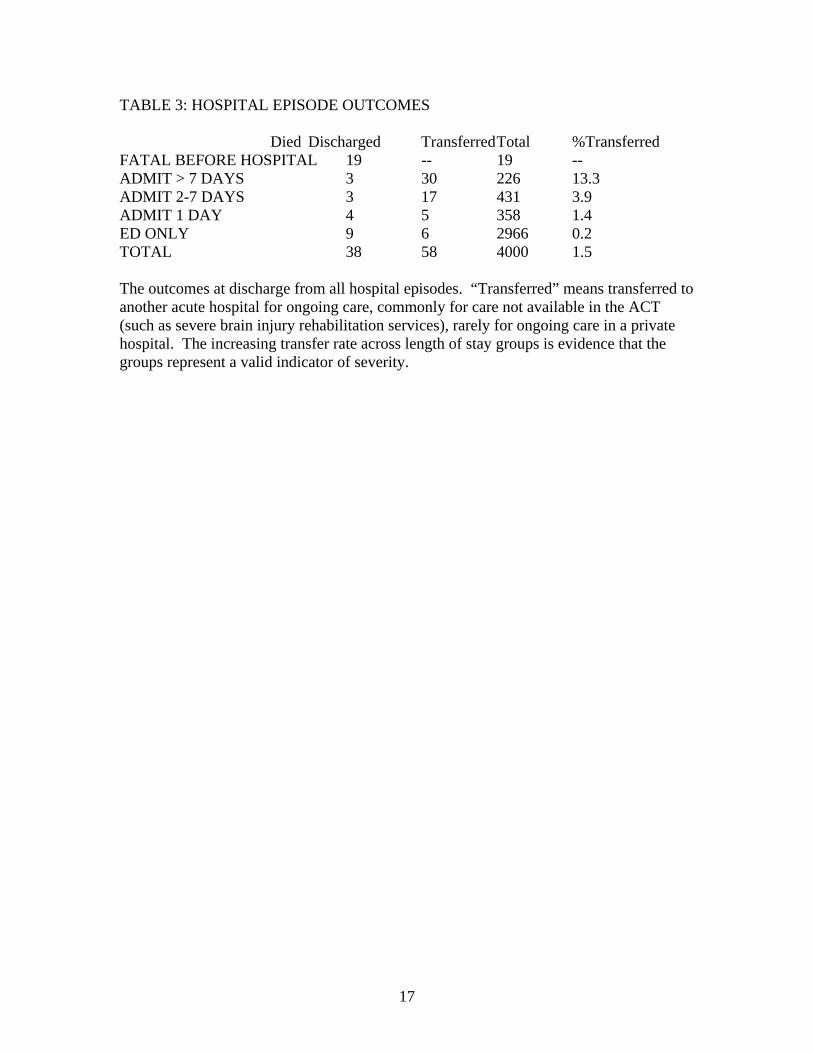
TABLE 3: HOSPITAL EPISODE OUTCOMES Died Discharged Transferred Total %Transferred FATAL BEFORE HOSPITAL 19 -- 19 -- ADMIT > 7 DAYS 3 30 226 13.3 ADMIT 2-7 DAYS 3 17 431 3.9 ADMIT 1 DAY 4 5 358 1.4 ED ONLY 9 6 2966 0.2 TOTAL 38 58 4000 1.5 The outcomes at discharge from all hospital episodes. “Transferred” means transferred to another acute hospital for ongoing care, commonly for care not available in the ACT (such as severe brain injury rehabilitation services), rarely for ongoing care in a private hospital. The increasing transfer rate across length of stay groups is evidence that the groups represent a valid indicator of severity.
17
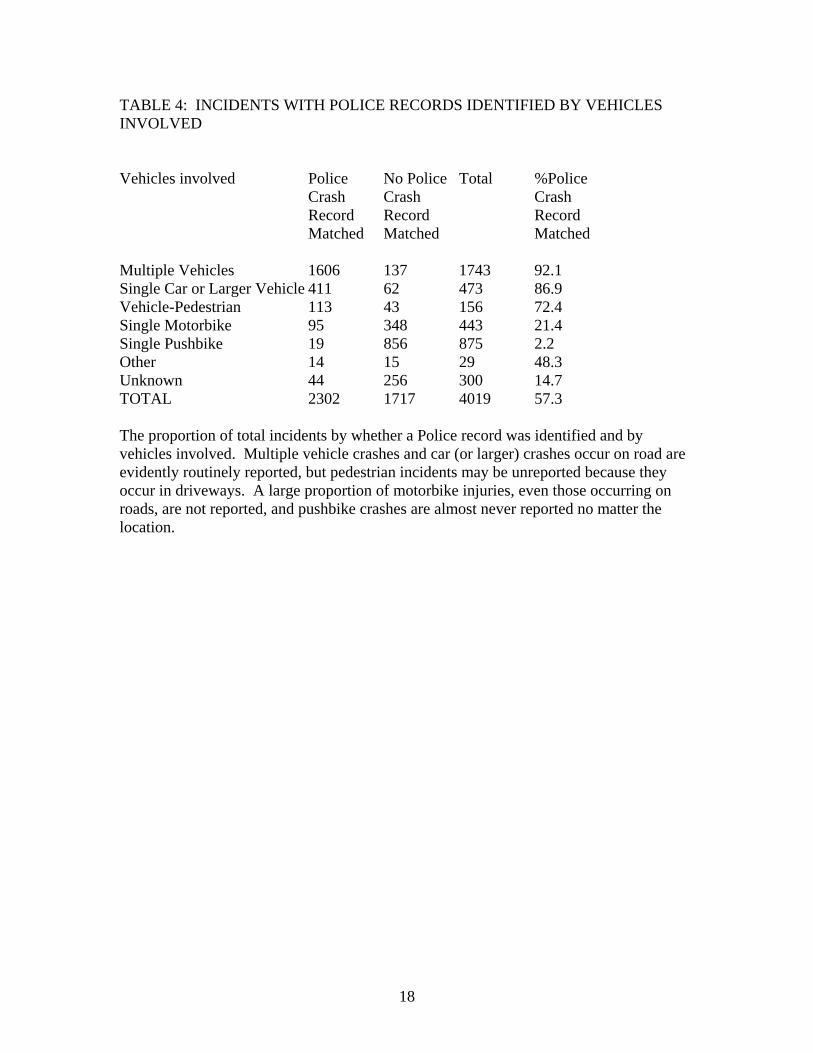
TABLE 4: INCIDENTS WITH POLICE RECORDS IDENTIFIED BY VEHICLES INVOLVED Vehicles involved Police No Police Total %Police Crash Crash Crash Record Record Record Matched Matched Matched Multiple Vehicles 1606 137 1743 92.1 Single Car or Larger Vehicle 411 62 473 86.9 Vehicle-Pedestrian 113 43 156 72.4 Single Motorbike 95 348 443 21.4 Single Pushbike 19 856 875 2.2 Other 14 15 29 48.3 Unknown 44 256 300 14.7 TOTAL 2302 1717 4019 57.3 The proportion of total incidents by whether a Police record was identified and by vehicles involved. Multiple vehicle crashes and car (or larger) crashes occur on road are evidently routinely reported, but pedestrian incidents may be unreported because they occur in driveways. A large proportion of motorbike injuries, even those occurring on roads, are not reported, and pushbike crashes are almost never reported no matter the location.
18
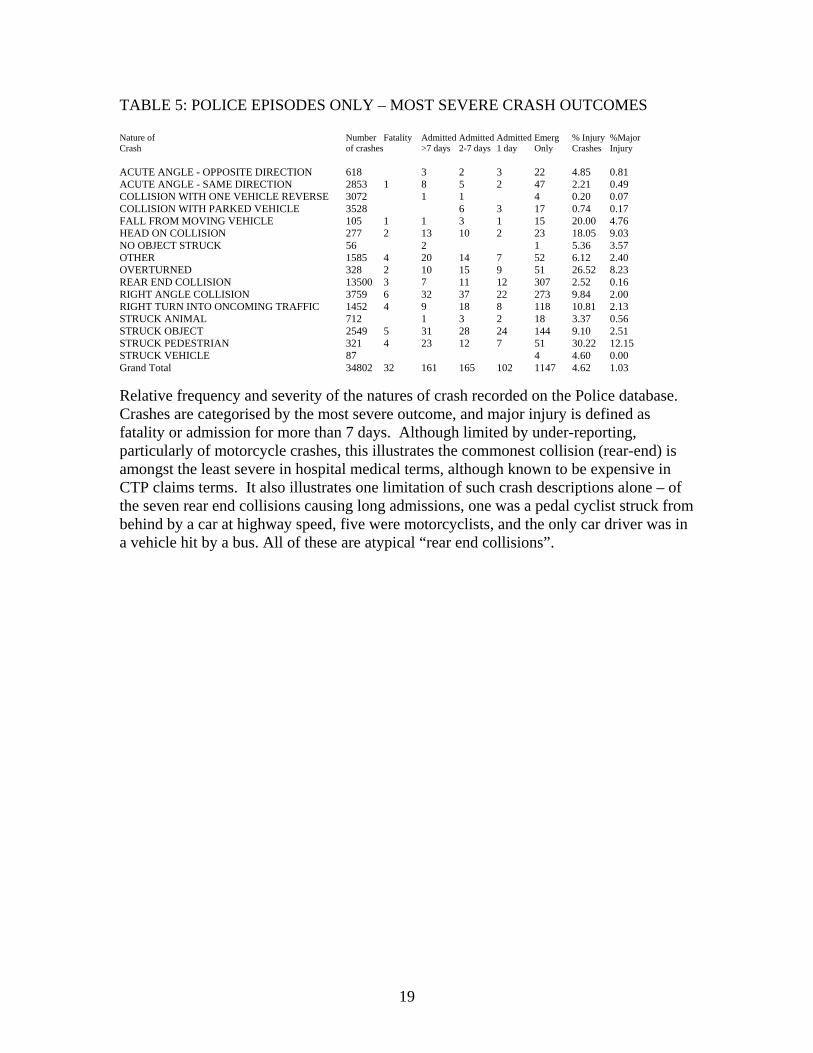
TABLE 5: POLICE EPISODES ONLY – MOST SEVERE CRASH OUTCOMES Nature of Number Fatality Admitted Admitted Admitted Emerg % Injury %Major Crash of crashes >7 days 2-7 days 1 day Only Crashes Injury ACUTE ANGLE - OPPOSITE DIRECTION 618 3 2 3 22 4.85 0.81 ACUTE ANGLE - SAME DIRECTION 2853 1 8 5 2 47 2.21 0.49 COLLISION WITH ONE VEHICLE REVERSE 3072 1 1 4 0.20 0.07 COLLISION WITH PARKED VEHICLE 3528 6 3 17 0.74 0.17 FALL FROM MOVING VEHICLE 105 1 1 3 1 15 20.00 4.76 HEAD ON COLLISION 277 2 13 10 2 23 18.05 9.03 NO OBJECT STRUCK 56 2 1 5.36 3.57 OTHER 1585 4 20 14 7 52 6.12 2.40 OVERTURNED 328 2 10 15 9 51 26.52 8.23 REAR END COLLISION 13500 3 7 11 12 307 2.52 0.16 RIGHT ANGLE COLLISION 3759 6 32 37 22 273 9.84 2.00 RIGHT TURN INTO ONCOMING TRAFFIC 1452 4 9 18 8 118 10.81 2.13 STRUCK ANIMAL 712 1 3 2 18 3.37 0.56 STRUCK OBJECT 2549 5 31 28 24 144 9.10 2.51 STRUCK PEDESTRIAN 321 4 23 12 7 51 30.22 12.15 STRUCK VEHICLE 87 4 4.60 0.00 Grand Total 34802 32 161 165 102 1147 4.62 1.03
Relative frequency and severity of the natures of crash recorded on the Police database. Crashes are categorised by the most severe outcome, and major injury is defined as fatality or admission for more than 7 days. Although limited by under-reporting, particularly of motorcycle crashes, this illustrates the commonest collision (rear-end) is amongst the least severe in hospital medical terms, although known to be expensive in CTP claims terms. It also illustrates one limitation of such crash descriptions alone – of the seven rear end collisions causing long admissions, one was a pedal cyclist struck from behind by a car at highway speed, five were motorcyclists, and the only car driver was in a vehicle hit by a bus. All of these are atypical “rear end collisions”.
19
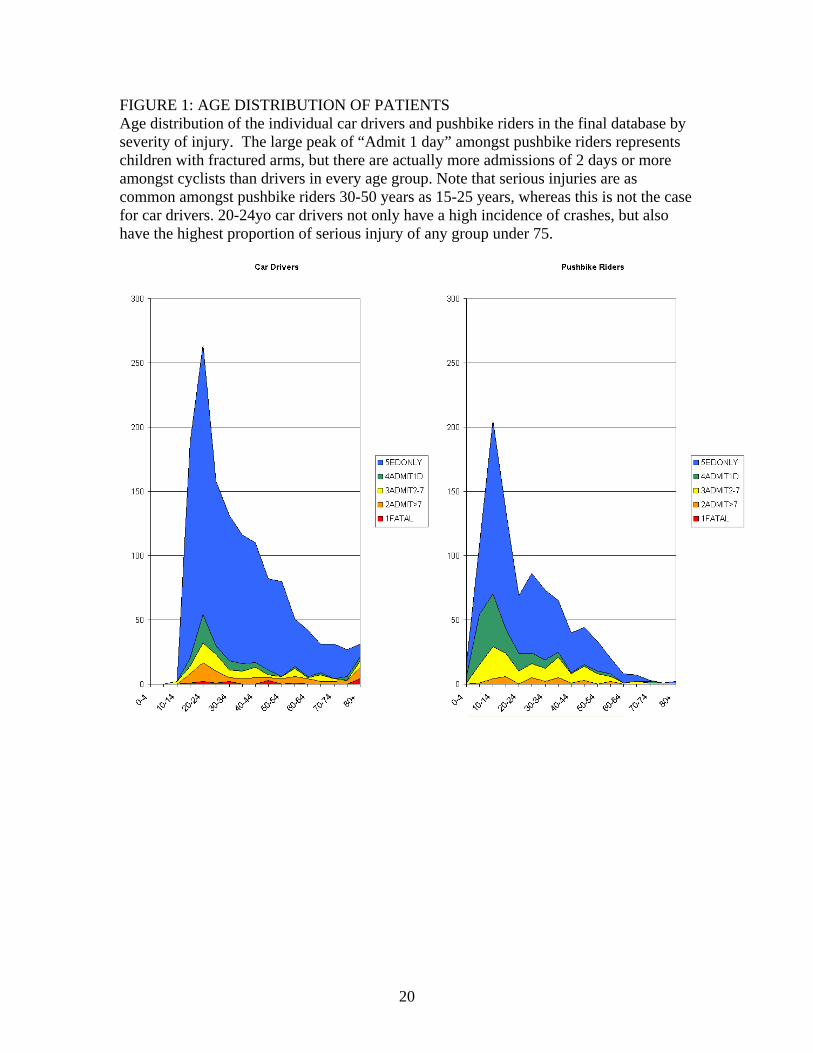
FIGURE 1: AGE DISTRIBUTION OF PATIENTS Age distribution of the individual car drivers and pushbike riders in the final database by severity of injury. The large peak of “Admit 1 day” amongst pushbike riders represents children with fractured arms, but there are actually more admissions of 2 days or more amongst cyclists than drivers in every age group. Note that serious injuries are as common amongst pushbike riders 30-50 years as 15-25 years, whereas this is not the case for car drivers. 20-24yo car drivers not only have a high incidence of crashes, but also have the highest proportion of serious injury of any group under 75.
20
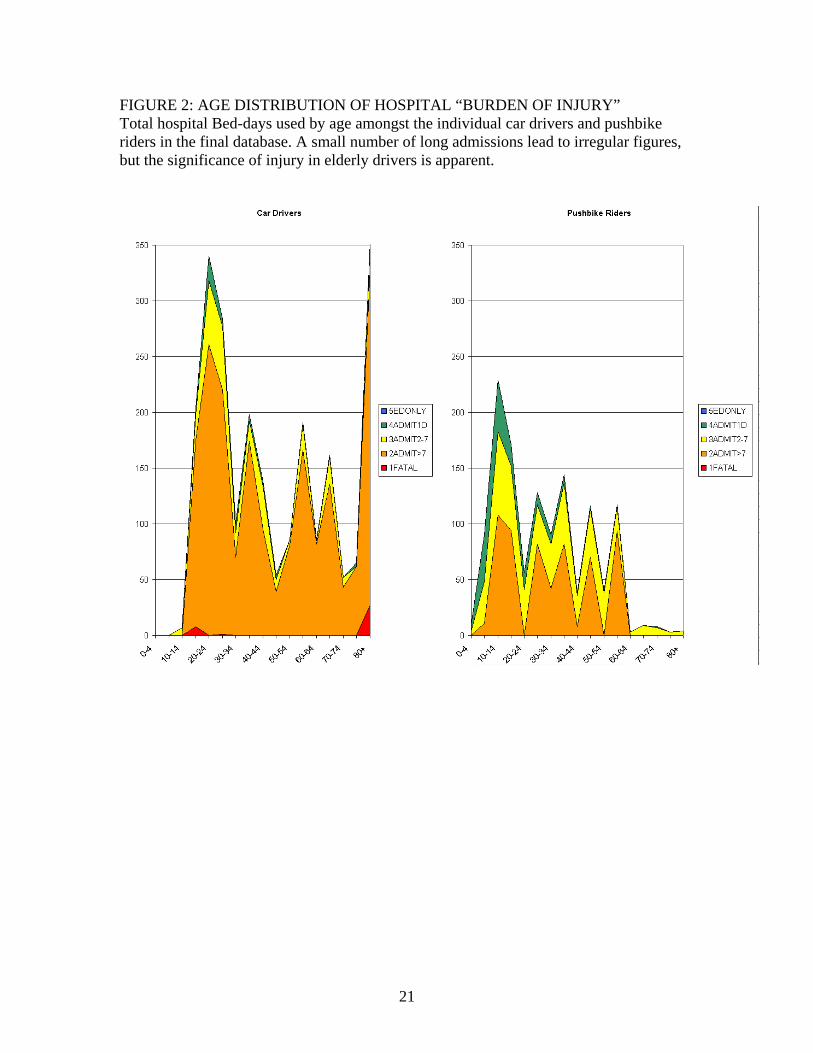
FIGURE 2: AGE DISTRIBUTION OF HOSPITAL “BURDEN OF INJURY” Total hospital Bed-days used by age amongst the individual car drivers and pushbike riders in the final database. A small number of long admissions lead to irregular figures, but the significance of injury in elderly drivers is apparent.
21
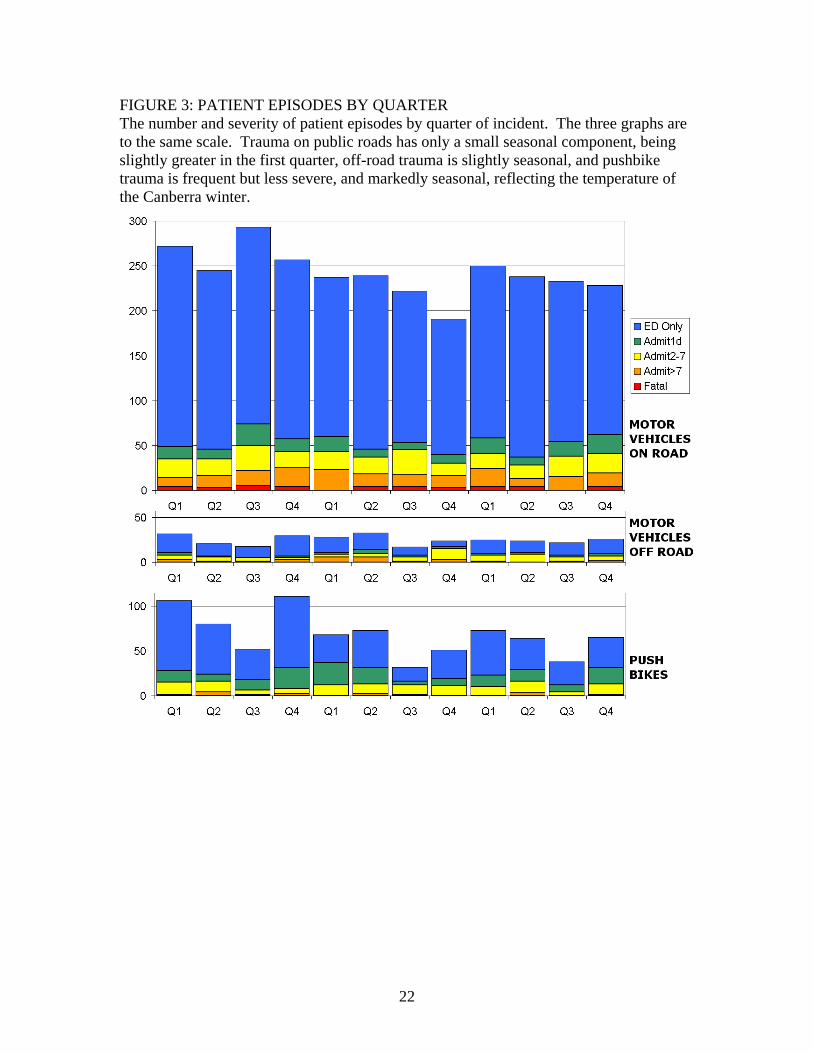
FIGURE 3: PATIENT EPISODES BY QUARTER The number and severity of patient episodes by quarter of incident. The three graphs are to the same scale. Trauma on public roads has only a small seasonal component, being slightly greater in the first quarter, off-road trauma is slightly seasonal, and pushbike trauma is frequent but less severe, and markedly seasonal, reflecting the temperature of the Canberra winter.
22
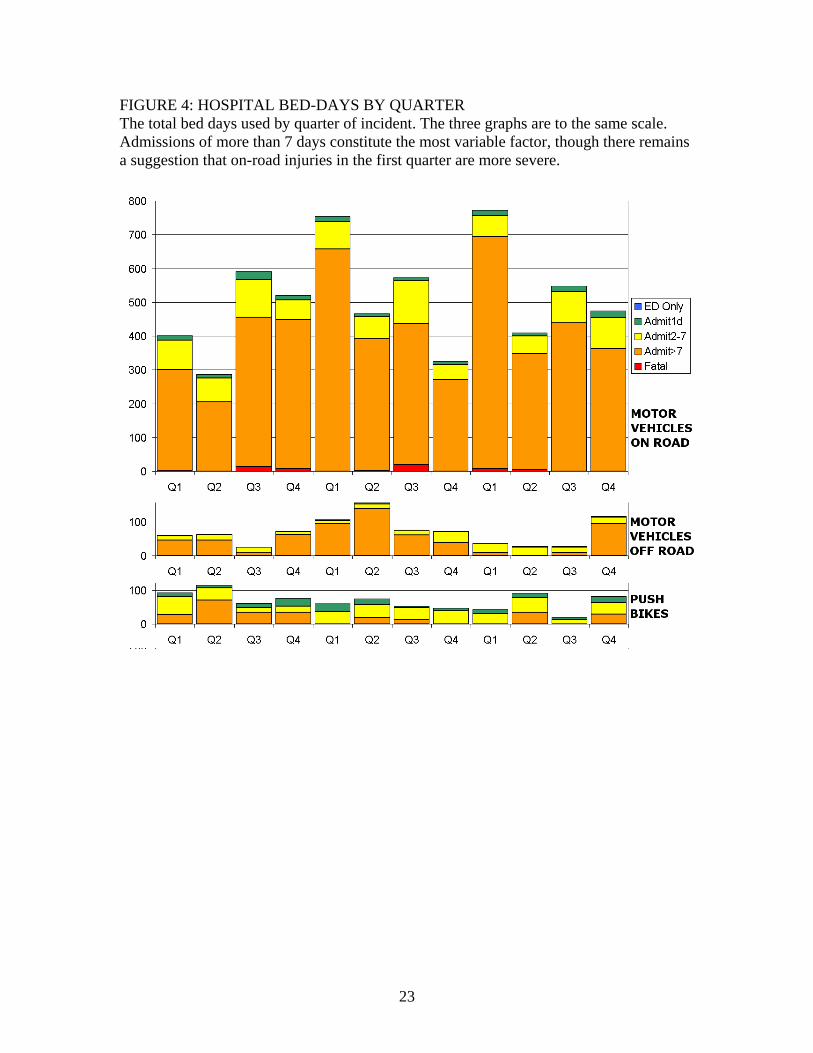
FIGURE 4: HOSPITAL BED-DAYS BY QUARTER The total bed days used by quarter of incident. The three graphs are to the same scale. Admissions of more than 7 days constitute the most variable factor, though there remains a suggestion that on-road injuries in the first quarter are more severe.
23
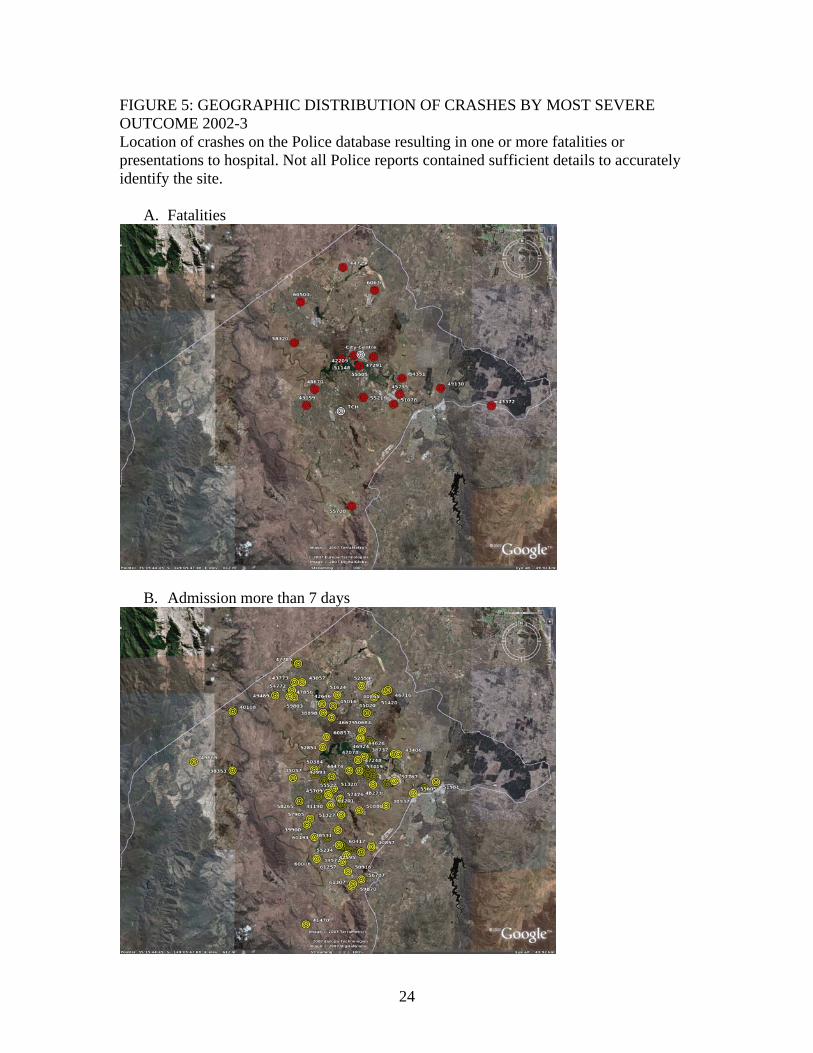
FIGURE 5: GEOGRAPHIC DISTRIBUTION OF CRASHES BY MOST SEVERE OUTCOME 2002-3 Location of crashes on the Police database resulting in one or more fatalities or presentations to hospital. Not all Police reports contained sufficient details to accurately identify the site.
A. Fatalities
B. Admission more than 7 days
24
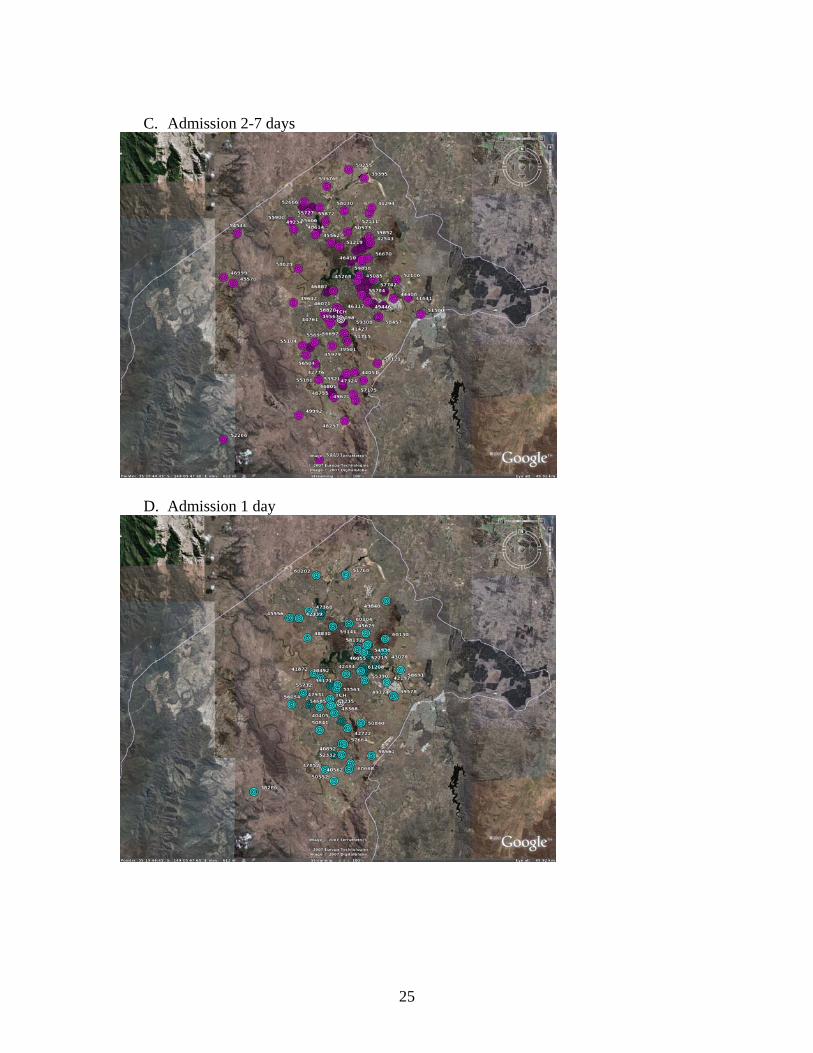
C. Admission 2-7 days
D. Admission 1 day
25
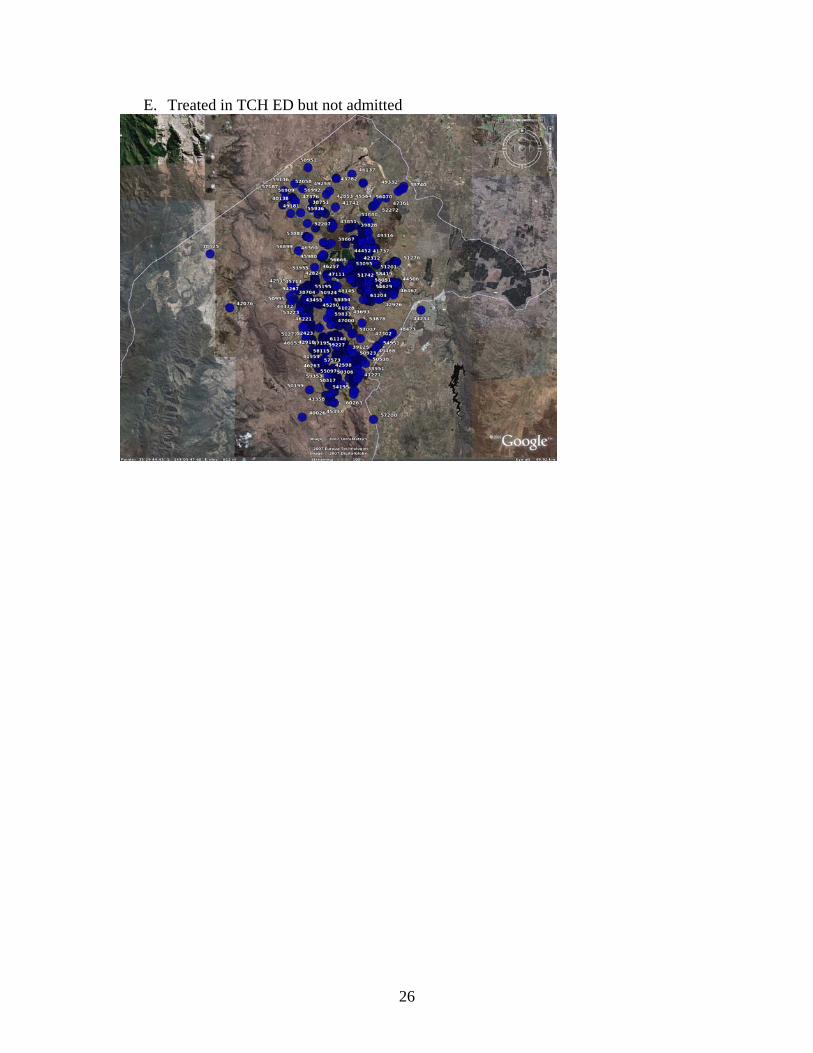
E. Treated in TCH ED but not admitted
26
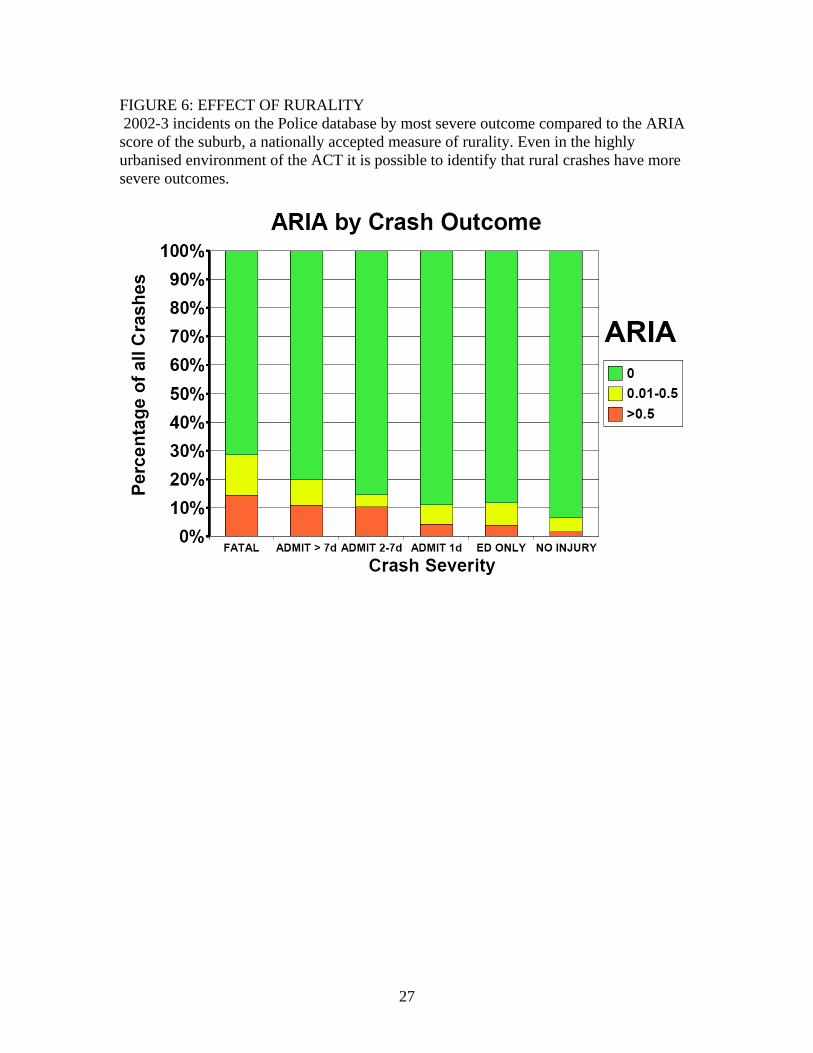
FIGURE 6: EFFECT OF RURALITY 2002-3 incidents on the Police database by most severe outcome compared to the ARIA score of the suburb, a nationally accepted measure of rurality. Even in the highly urbanised environment of the ACT it is possible to identify that rural crashes have more severe outcomes.
27