Embed Size (px)
Citation preview
FINAL REPORT Shredded Waste Downdraft Gasifier for Overseas Contingency
Operations Waste-to-Energy Conversion
SERDP Project WP-2235
JUNE 2015
Michael Cushman Infoscitex Corporation
Distribution Statement A

This report was prepared under contract to the Department of Defense Strategic Environmental Research and Development Program (SERDP). The publication of this report does not indicate endorsement by the Department of Defense, nor should the contents be construed as reflecting the official policy or position of the Department of Defense. Reference herein to any specific commercial product, process, or service by trade name, trademark, manufacturer, or otherwise, does not necessarily constitute or imply its endorsement, recommendation, or favoring by the Department of Defense.

Standard Form 298 (Rev. 8/98)
REPORT DOCUMENTATION PAGE
Prescribed by ANSI Std. Z39.18
Form Approved OMB No. 0704-0188
The public reporting burden for this collection of information is estimated to average 1 hour per response, including the time for reviewing instructions, searching existing data sources, gathering and maintaining the data needed, and completing and reviewing the collection of information. Send comments regarding this burden estimate or any other aspect of this collection of information, including suggestions for reducing the burden, to Department of Defense, Washington Headquarters Services, Directorate for Information Operations and Reports (0704-0188), 1215 Jefferson Davis Highway, Suite 1204, Arlington, VA 22202-4302. Respondents should be aware that notwithstanding any other provision of law, no person shall be subject to any penalty for failing to comply with a collection of information if it does not display a currently valid OMB control number. PLEASE DO NOT RETURN YOUR FORM TO THE ABOVE ADDRESS. 1. REPORT DATE (DD-MM-YYYY) 2. REPORT TYPE 3. DATES COVERED (From - To)
4. TITLE AND SUBTITLE 5a. CONTRACT NUMBER
5b. GRANT NUMBER
5c. PROGRAM ELEMENT NUMBER
5d. PROJECT NUMBER
5e. TASK NUMBER
5f. WORK UNIT NUMBER
6. AUTHOR(S)
7. PERFORMING ORGANIZATION NAME(S) AND ADDRESS(ES) 8. PERFORMING ORGANIZATION REPORT NUMBER
9. SPONSORING/MONITORING AGENCY NAME(S) AND ADDRESS(ES) 10. SPONSOR/MONITOR'S ACRONYM(S)
11. SPONSOR/MONITOR'S REPORT NUMBER(S)
12. DISTRIBUTION/AVAILABILITY STATEMENT
13. SUPPLEMENTARY NOTES
14. ABSTRACT
15. SUBJECT TERMS
16. SECURITY CLASSIFICATION OF: a. REPORT b. ABSTRACT c. THIS PAGE
17. LIMITATION OF ABSTRACT
18. NUMBER OF PAGES
19a. NAME OF RESPONSIBLE PERSON
19b. TELEPHONE NUMBER (Include area code)
06-01-2015 Final Report May 2011 - June 2015
Shredded Waste Downdraft Gasifier for Overseas Contingency Operations Waste to Energy Conversion
W912HQ-12-C-0067
WP-2235Cushman, Barry M. Reed, Matthew Belcher, Jim Sasa, Leslie
Infoscitex Corporation 295 Foster Street, Suite 210 Littleton, MA 01460
SERDP Program Office Bruce Sartwell 901 North Stuart Street, Suite 303 Arlington, VA 22203
Approved for public release; distribution is unlimited.
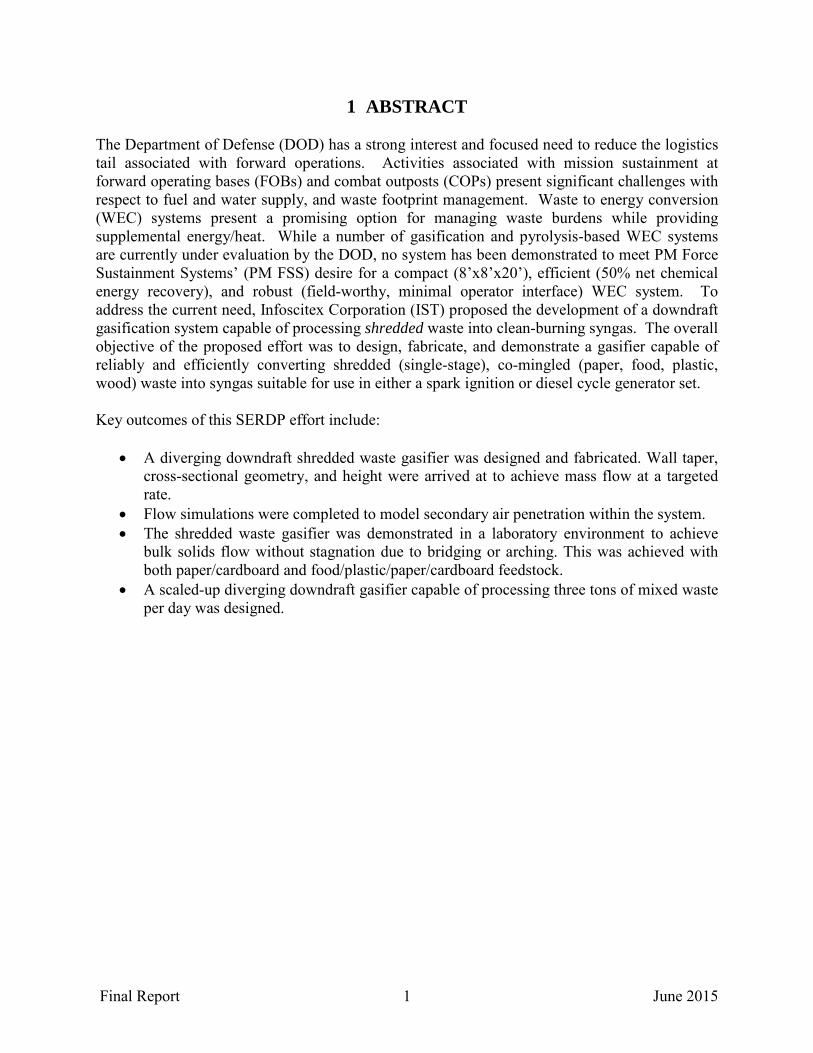
The Department of Defense (DOD) has a strong interest and focused need to reduce the logistics tail associated with forward operations. Activities associated with mission sustainment at forward operating bases (FOBs) and combat outposts (COPs) present significant challenges with respect to fuel and water supply, and waste footprint management. Waste to energy conversion (WEC) systems present a promising option for managing waste burdens while providing supplemental energy/heat. While a number of gasification and pyrolysis-based WEC systems are currently under evaluation by the DOD, no system has been demonstrated to meet PM Force Sustainment Systems’ (PM FSS) desire for a compact (8’x8’x20’), efficient (50% net chemical energy recovery), and robust (field-worthy, minimal operator interface) WEC system. To address the current need, Infoscitex Corporation (IST) proposed the development of a downdraft gasification system capable of processing shredded waste into clean-burning syngas. The overall objective of the proposed effort was to design, fabricate, and demonstrate a gasifier capable of reliably and efficiently converting shredded (single-stage), co-mingled (paper, food, plastic, wood) waste into syngas suitable for use in either a spark ignition or diesel cycle generator set.
Waste-to-energy, gasification, thermal conversion, reactor design, plant design, distributed energy, waste management
U U U UU154
Matt Reed
781-419-6379
Reset

Final Report i June 2015
TABLE OF CONTENTS List of Tables ..................................................................................................................... iii List of Figures .................................................................................................................... iv List of Acronyms ............................................................................................................... vi Keywords .......................................................................................................................... vii Acknowledgements .......................................................................................................... viii 1 ABSTRACT ........................................................................................................................1 2 OBJECTIVE ......................................................................................................................2 3 BACKGROUND ................................................................................................................3 3.1 Gasification ..........................................................................................................................3 3.1.1 General Approaches .............................................................................................................3 3.1.2 Producer Gas and Diesel Engines/Generators .....................................................................4 3.1.3 Shredded Waste Gasification ...............................................................................................4 3.2 Design Approach for Small-Scale Deployable Gasification Systems .................................4 3.2.1 Gasifier/Grate Design and Air Injection ..............................................................................6 3.2.2 Reduction in WEC Footprint ...............................................................................................8 4 MATERIALS AND METHODS ....................................................................................10 4.1 Definition of Needs ............................................................................................................10 4.2 Materials Flow Characterization ........................................................................................11 4.3 Air Flow Modeling ............................................................................................................14 4.4 Gasifier Modification Design/Fabrication .........................................................................17 4.5 Experimentation .................................................................................................................26 5 RESULTS AND DISCUSSION ......................................................................................33 5.1 Material Flow Characterization .........................................................................................33 5.1.1 Shredded Waste Material Flow Characterization ..............................................................33 5.1.1.1 Cohesive Strength Tests .....................................................................................................33 5.1.1.2 Particle Interlocking Tests .................................................................................................33 5.1.1.3 Compressibility Tests.........................................................................................................38 5.1.1.4 Wall Friction Tests .............................................................................................................38 5.1.1.5 Permeability Test ...............................................................................................................38 5.1.2 Char Ash Material Flow Characterization .........................................................................39 5.1.2.1 Cohesive Strength Tests .....................................................................................................39 5.1.2.2 Compressibility Test ..........................................................................................................40 5.1.2.3 Wall Friction Tests .............................................................................................................40 5.1.2.4 Permeability Test ...............................................................................................................40 5.2 Experimentation .................................................................................................................40 5.3 Analyze and Evaluate Results ............................................................................................48

Final Report ii June 2015
6 CONCLUSIONS AND IMPLICATIONS FOR FUTURE RESEARCH/IMPLEMENTATION ..........................................................................................51 6.1 Scale-Up of Shredded Waste Gasifier ...............................................................................51 6.2 System Renderings.............................................................................................................53 7 LITERATURE CITED ...................................................................................................64 APPENDIX A: SUPPORTING DATA ..........................................................................65 A.1 Shredded Waste Material Flow Characterization Data ......................................................65 A.2 Char Ash Material Flow Characterization Data...............................................................107 A.3 Gasifier Test Plots ............................................................................................................120 APPENDIX B: LIST OF SCIENTIFIC/TECHNICAL PUBLICATIONS ..............145

Final Report iii June 2015
LIST OF TABLES Table 1. Shredded waste samples prepared for flow property testing. ......................................... 12 Table 2. Waste composition, ultimate analysis and equilibrium adiabatic gas conditions. .......... 25 Table 3. Major output data for test program. ................................................................................ 27 Table 4. Key variables for test program........................................................................................ 29 Table 5. Summary of waste composition from LIA study. ........................................................... 30 Table 6. Summary of test parameters and temperature results for paper/cardboard waste. ......... 31 Table 7. Summary of producer gas composition and energy density results for paper/cardboard
waste. ............................................................................................................................ 32 Table 8. Density ranges for test materials. .................................................................................... 38 Table 9. Wall friction angles for test materials. ............................................................................ 38 Table 10. Permeability test results. ............................................................................................... 39 Table 11. Summary of test parameters and temperature results for mixed waste #1. .................. 44 Table 12. Summary of producer gas composition results for mixed waste mixture #1. ............... 44 Table 13. Summary of test parameters and temperature results for mixed waste mixture #2. ..... 45 Table 14. Summary of producer gas composition results for mixed waste mixture #2. ............... 46 Table 15. Summary of producer gas energy results. ..................................................................... 49 Table 16. Shredded waste and pelletized waste gasifier configurations. ...................................... 52

Final Report iv June 2015
LIST OF FIGURES
Figure 1. Proposed gasifier configuration with secondary air inlets. ............................................. 5 Figure 2. Wall friction data for IST Energy gasifier at 600°C........................................................ 7 Figure 3. Layout of 3 tons per day shredded waste gasifier WEC system in two 20 ft ISO
containers. ..................................................................................................................... 9 Figure 4. Technical approach. ....................................................................................................... 11 Figure 5. Shredded waste sample #1............................................................................................. 13 Figure 6. Shredded waste sample #3............................................................................................. 13 Figure 7. Shredded waste sample #4............................................................................................. 14 Figure 8. Downdraft Gasifier. ....................................................................................................... 15 Figure 9. Secondary Air Streamlines (Side view). ....................................................................... 16 Figure 10. Secondary Air Streamlines (Top view). ...................................................................... 16 Figure 11. Effect of Secondary Air % on penetration. ................................................................. 17 Figure 12. Effect of Resistance on penetration. ............................................................................ 17 Figure 13. Gasifier and downstream producer gas conditioning system. ..................................... 19 Figure 14. Shredded waste gasifier fire tube shell. ....................................................................... 20 Figure 15. Side view of gasifier shell with refractory. ................................................................. 21 Figure 16. Inside of gasifier shell with refractory. ........................................................................ 21 Figure 17. Reactor base with insulation and grate visible. ........................................................... 22 Figure 18. Reactor base with top plate.......................................................................................... 23 Figure 19. Completed shredded waste gasifier. ............................................................................ 23 Figure 20. Photograph of downdraft gasifier laboratory facility. ................................................. 24 Figure 21. Equilibrium conditions for waste streams used during the test program. Filled circles
indicate adiabatic conditions. ...................................................................................... 26 Figure 22. Summary of waste composition from LIA study. ....................................................... 28 Figure 23. Particle interlock test apparatus schematic. ................................................................. 34 Figure 24. Test apparatus. ............................................................................................................. 35 Figure 25. Arch of sample 1 (view from above). .......................................................................... 35 Figure 26. Arch of sample 1 (view from below). ......................................................................... 36 Figure 27. Unstable arch of sample 3 (view from above)............................................................. 36 Figure 28. Arch of sample 4 (view from above). .......................................................................... 37 Figure 29. Arch of sample 4 (view from below). ......................................................................... 37 Figure 30. Gasifier temperature profiles at time of GC readings on 2/26/2014 for paper/cardboard
waste. .......................................................................................................................... 41 Figure 31. Gasifier temperature profiles at time of GC readings on 4/25/2014 for paper/cardboard
waste. .......................................................................................................................... 42 Figure 32. Gasifier temperature profiles at time of GC readings on 6/25/2014 for paper/cardboard
waste. .......................................................................................................................... 43
Final Report v June 2015
Figure 33. Producer gas energy vs char reduction temperature for mixed waste mixture #2. ...... 47 Figure 34. Producer gas vs flow rate for mixed waste mixture #2. .............................................. 47 Figure 35. Gasifier temperature profiles at time of GC readings on 9/10/2014 for mixed waste
mixture #2 ................................................................................................................... 48 Figure 36. Summary of test data for gasification trials using shredded paper/cardboard and mixed
waste mixtures. ........................................................................................................... 49 Figure 37. Front view of internal components for scaled up shredded waste gasifier system. .... 54 Figure 38. Back view of internal components for scaled up shredded waste gasifier system. ..... 54 Figure 39. Top view of internal components for scaled up shredded waste gasifier system. ....... 54 Figure 40. Front view of shredded waste gasifier container. ........................................................ 55 Figure 41. Back view of shredded waste gasifier container. ........................................................ 55 Figure 42. View of the gasification system featuring the shredded waste reactor. ...................... 57 Figure 43. Alternate view of the gasification system. .................................................................. 57 Figure 44. Integrated containerized waste to energy conversion system featuring shredded waste
gasifier – side views. ................................................................................................... 58 Figure 45. Integrated containerized waste to energy conversion system featuring shredded waste
gasifier – end views. ................................................................................................... 58 Figure 46. Integrated containerized waste to energy conversion system featuring shredded waste
gasifier – alternate side view. ...................................................................................... 59 Figure 47. Integrated containerized waste to energy conversion system featuring shredded waste
gasifier – three dimensional view from end one. ........................................................ 59 Figure 48. Integrated containerized waste to energy conversion system featuring shredded waste
gasifier – three dimensional view from end two. ........................................................ 60 Figure 49. Integrated containerized waste to energy conversion system featuring shredded waste
gasifier – three dimensional view from end two, alternate side. ................................ 60 Figure 50. Integrated containerized waste to energy conversion system featuring shredded waste
gasifier – three dimensional view from end one, alternate side. ................................. 61 Figure 51. Integrated waste to energy conversion system featuring shredded waste gasifier –
internal view of equipment from both sides. .............................................................. 61 Figure 52. Integrated waste to energy conversion system featuring shredded waste gasifier –
internal view of equipment, alternate side view. ........................................................ 62 Figure 53. Integrated waste to energy conversion system featuring shredded waste gasifier –
internal view of equipment, three dimensional view from end one. ........................... 62 Figure 54. Integrated waste to energy conversion system featuring shredded waste gasifier –
internal view of equipment, three dimensional view from end two. .......................... 62 Figure 55. Integrated waste to energy conversion system featuring shredded waste gasifier –
internal view of equipment, three dimensional view from end two, other side. ......... 63 Figure 56. Integrated waste to energy conversion system featuring shredded waste gasifier –
internal view of equipment, three dimensional view from end one, other side. ......... 63

Final Report vi June 2015
LIST OF ACRONYMS AFB Air Force Base CAD Computer-Aided Design COP Combat Outpost DOD Department of Defense ESTCP Environmental Strategic Technology Certification Program ESTOP Emergency Stop FID Flame Ionization Detector FOB Forward Operating Base GC Gas Chromatograph GEM Green Energy Machine I/O Input/Output ISO International Organization for Standardization IST Infoscitex MSW Municipal Solid Waste OFWEC Onsite Field-feeding Waste to Energy Converter PLC Programmable Logic Controller PM FSS Product Manager Force Sustainment Systems SERDP Strategic Environmental Research and Development Program SON Statement of Need STP Standard Temperature and Pressure SWP Solid Waste Preprocessor TCD Thermal Conductivity Detector TQG Tactical Quiet Generator VFD Variable Frequency Drive WEC Waste to Energy Conversion

Final Report vii June 2015
KEYWORDS Waste-to-energy, gasification, thermal conversion, reactor design, plant design, distributed energy, waste management

Final Report viii June 2015
ACKNOWLEDGEMENTS This research was supported fully by the Department of Defense, through the Strategic Environmental Research and Development Program (SERDP). The PI would like to acknowledge the efforts of the following individuals who contributed to the execution of this work:
• Infoscitex Corporation o Matthew Reed, Project Manager o James Belcher o David Montella o Leslie Sasa o Simeon Schlis
• Jenike & Johanson o Roger Barnum o Brian Pittenger
• MSW Power Corporation o Matt Young, co-Principal Investigator o Joe Abner o Steve Chase o Dave Rich
Final Report 1 June 2015
1 ABSTRACT The Department of Defense (DOD) has a strong interest and focused need to reduce the logistics tail associated with forward operations. Activities associated with mission sustainment at forward operating bases (FOBs) and combat outposts (COPs) present significant challenges with respect to fuel and water supply, and waste footprint management. Waste to energy conversion (WEC) systems present a promising option for managing waste burdens while providing supplemental energy/heat. While a number of gasification and pyrolysis-based WEC systems are currently under evaluation by the DOD, no system has been demonstrated to meet PM Force Sustainment Systems’ (PM FSS) desire for a compact (8’x8’x20’), efficient (50% net chemical energy recovery), and robust (field-worthy, minimal operator interface) WEC system. To address the current need, Infoscitex Corporation (IST) proposed the development of a downdraft gasification system capable of processing shredded waste into clean-burning syngas. The overall objective of the proposed effort was to design, fabricate, and demonstrate a gasifier capable of reliably and efficiently converting shredded (single-stage), co-mingled (paper, food, plastic, wood) waste into syngas suitable for use in either a spark ignition or diesel cycle generator set. Key outcomes of this SERDP effort include:
• A diverging downdraft shredded waste gasifier was designed and fabricated. Wall taper, cross-sectional geometry, and height were arrived at to achieve mass flow at a targeted rate.
• Flow simulations were completed to model secondary air penetration within the system. • The shredded waste gasifier was demonstrated in a laboratory environment to achieve
bulk solids flow without stagnation due to bridging or arching. This was achieved with both paper/cardboard and food/plastic/paper/cardboard feedstock.
• A scaled-up diverging downdraft gasifier capable of processing three tons of mixed waste per day was designed.

Final Report 2 June 2015
2 OBJECTIVE
The overall objective of this effort was to design, fabricate, and characterize a gasifier capable of reliably and efficiently converting shredded (single-stage), co-mingled (paper, food, plastic, wood) waste into producer gas suitable for use in a diesel cycle generator set. Specifically, this effort aimed to identify reactor geometries and corresponding processing conditions best suited to enable waste-to-energy conversion system design with minimal preprocessing of the waste prior to conversion.
Final Report 3 June 2015
3 BACKGROUND
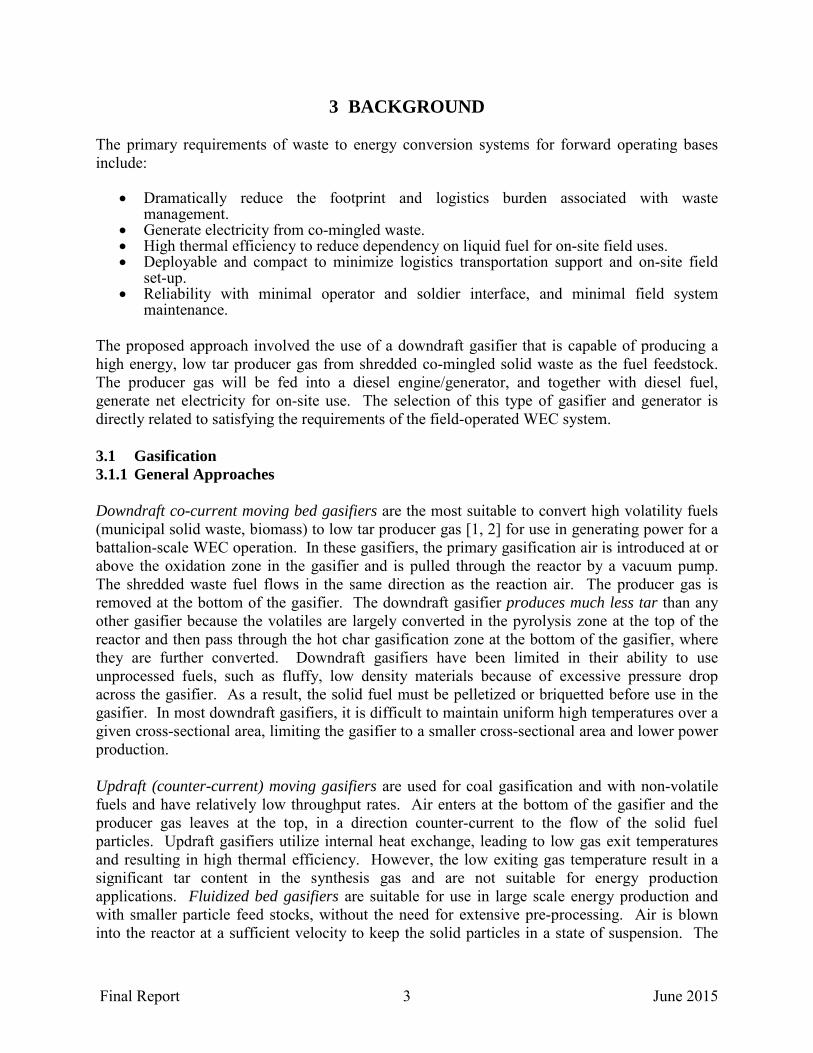
The primary requirements of waste to energy conversion systems for forward operating bases include:
• Dramatically reduce the footprint and logistics burden associated with waste management.
• Generate electricity from co-mingled waste. • High thermal efficiency to reduce dependency on liquid fuel for on-site field uses. • Deployable and compact to minimize logistics transportation support and on-site field
set-up. • Reliability with minimal operator and soldier interface, and minimal field system
maintenance. The proposed approach involved the use of a downdraft gasifier that is capable of producing a high energy, low tar producer gas from shredded co-mingled solid waste as the fuel feedstock. The producer gas will be fed into a diesel engine/generator, and together with diesel fuel, generate net electricity for on-site use. The selection of this type of gasifier and generator is directly related to satisfying the requirements of the field-operated WEC system. 3.1 Gasification 3.1.1 General Approaches Downdraft co-current moving bed gasifiers are the most suitable to convert high volatility fuels (municipal solid waste, biomass) to low tar producer gas [1, 2] for use in generating power for a battalion-scale WEC operation. In these gasifiers, the primary gasification air is introduced at or above the oxidation zone in the gasifier and is pulled through the reactor by a vacuum pump. The shredded waste fuel flows in the same direction as the reaction air. The producer gas is removed at the bottom of the gasifier. The downdraft gasifier produces much less tar than any other gasifier because the volatiles are largely converted in the pyrolysis zone at the top of the reactor and then pass through the hot char gasification zone at the bottom of the gasifier, where they are further converted. Downdraft gasifiers have been limited in their ability to use unprocessed fuels, such as fluffy, low density materials because of excessive pressure drop across the gasifier. As a result, the solid fuel must be pelletized or briquetted before use in the gasifier. In most downdraft gasifiers, it is difficult to maintain uniform high temperatures over a given cross-sectional area, limiting the gasifier to a smaller cross-sectional area and lower power production. Updraft (counter-current) moving gasifiers are used for coal gasification and with non-volatile fuels and have relatively low throughput rates. Air enters at the bottom of the gasifier and the producer gas leaves at the top, in a direction counter-current to the flow of the solid fuel particles. Updraft gasifiers utilize internal heat exchange, leading to low gas exit temperatures and resulting in high thermal efficiency. However, the low exiting gas temperature result in a significant tar content in the synthesis gas and are not suitable for energy production applications. Fluidized bed gasifiers are suitable for use in large scale energy production and with smaller particle feed stocks, without the need for extensive pre-processing. Air is blown into the reactor at a sufficient velocity to keep the solid particles in a state of suspension. The
Final Report 4 June 2015
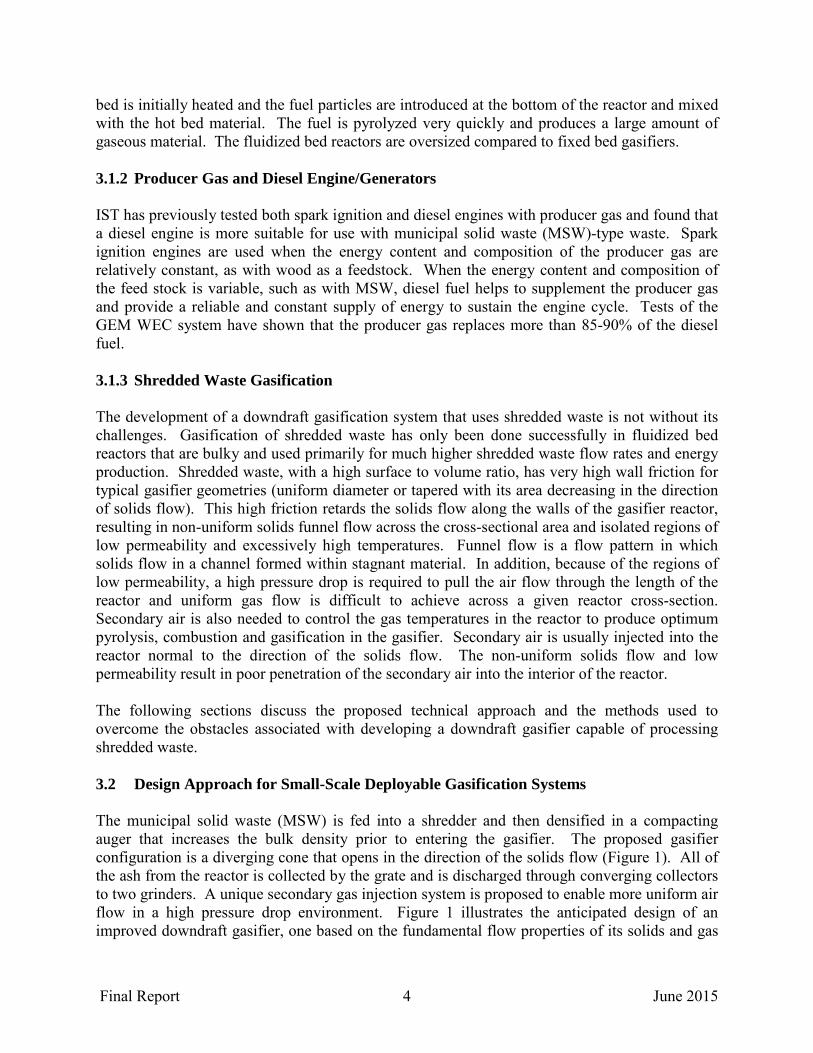
bed is initially heated and the fuel particles are introduced at the bottom of the reactor and mixed with the hot bed material. The fuel is pyrolyzed very quickly and produces a large amount of gaseous material. The fluidized bed reactors are oversized compared to fixed bed gasifiers. 3.1.2 Producer Gas and Diesel Engine/Generators IST has previously tested both spark ignition and diesel engines with producer gas and found that a diesel engine is more suitable for use with municipal solid waste (MSW)-type waste. Spark ignition engines are used when the energy content and composition of the producer gas are relatively constant, as with wood as a feedstock. When the energy content and composition of the feed stock is variable, such as with MSW, diesel fuel helps to supplement the producer gas and provide a reliable and constant supply of energy to sustain the engine cycle. Tests of the GEM WEC system have shown that the producer gas replaces more than 85-90% of the diesel fuel. 3.1.3 Shredded Waste Gasification The development of a downdraft gasification system that uses shredded waste is not without its challenges. Gasification of shredded waste has only been done successfully in fluidized bed reactors that are bulky and used primarily for much higher shredded waste flow rates and energy production. Shredded waste, with a high surface to volume ratio, has very high wall friction for typical gasifier geometries (uniform diameter or tapered with its area decreasing in the direction of solids flow). This high friction retards the solids flow along the walls of the gasifier reactor, resulting in non-uniform solids funnel flow across the cross-sectional area and isolated regions of low permeability and excessively high temperatures. Funnel flow is a flow pattern in which solids flow in a channel formed within stagnant material. In addition, because of the regions of low permeability, a high pressure drop is required to pull the air flow through the length of the reactor and uniform gas flow is difficult to achieve across a given reactor cross-section. Secondary air is also needed to control the gas temperatures in the reactor to produce optimum pyrolysis, combustion and gasification in the gasifier. Secondary air is usually injected into the reactor normal to the direction of the solids flow. The non-uniform solids flow and low permeability result in poor penetration of the secondary air into the interior of the reactor. The following sections discuss the proposed technical approach and the methods used to overcome the obstacles associated with developing a downdraft gasifier capable of processing shredded waste. 3.2 Design Approach for Small-Scale Deployable Gasification Systems The municipal solid waste (MSW) is fed into a shredder and then densified in a compacting auger that increases the bulk density prior to entering the gasifier. The proposed gasifier configuration is a diverging cone that opens in the direction of the solids flow (Figure 1). All of the ash from the reactor is collected by the grate and is discharged through converging collectors to two grinders. A unique secondary gas injection system is proposed to enable more uniform air flow in a high pressure drop environment. Figure 1 illustrates the anticipated design of an improved downdraft gasifier, one based on the fundamental flow properties of its solids and gas
Final Report 5 June 2015
components. The diverging reaction sections are provided with tapered crossbeams (in the flow direction) and annuli for effective injection of secondary air without causing the bulk solids to be hung up in the reactor. The discharge section is designed for bulk solids mass flow to ensure that the velocity of the moving solids is uniform across any given cross-section of the gasifier without any regions of stagnant flow. The primary advantages of this system, compared to a more conventional downdraft gasifier with solid fuel pellets are:
Figure 1. Proposed gasifier configuration with secondary air inlets.
• The diverging gasifer section reduces the friction between the shredded waste and the reactor surface, and reduces the potential for bulk solids flow problems, such as arching and rat-holing.
• Higher fuel (shredded MSW) surface area to volume ratio, resulting in much faster reaction kinetics to increase the conversion efficiency and reduce the reactor height and pressure drop from the primary air flow.
• Reduce the footprint and weight of the pre-processing system by eliminating a pelletizer, drier and non-ferrous metal separator.
The practical challenges to be addressed in design of the system were:
• More difficulty in achieving uniform gas flow in the reactor because of the higher pressure drop across shredded waste with primary and secondary air.
• More difficulty in achieving uniform flow across the reactor cross section because of the diverging area.
• Lower bulk density of shredded waste compared to pellets, resulting in a wider gasifier reactor and making it more difficult to achieve uniform bulk solids and gas flows.

Final Report 6 June 2015
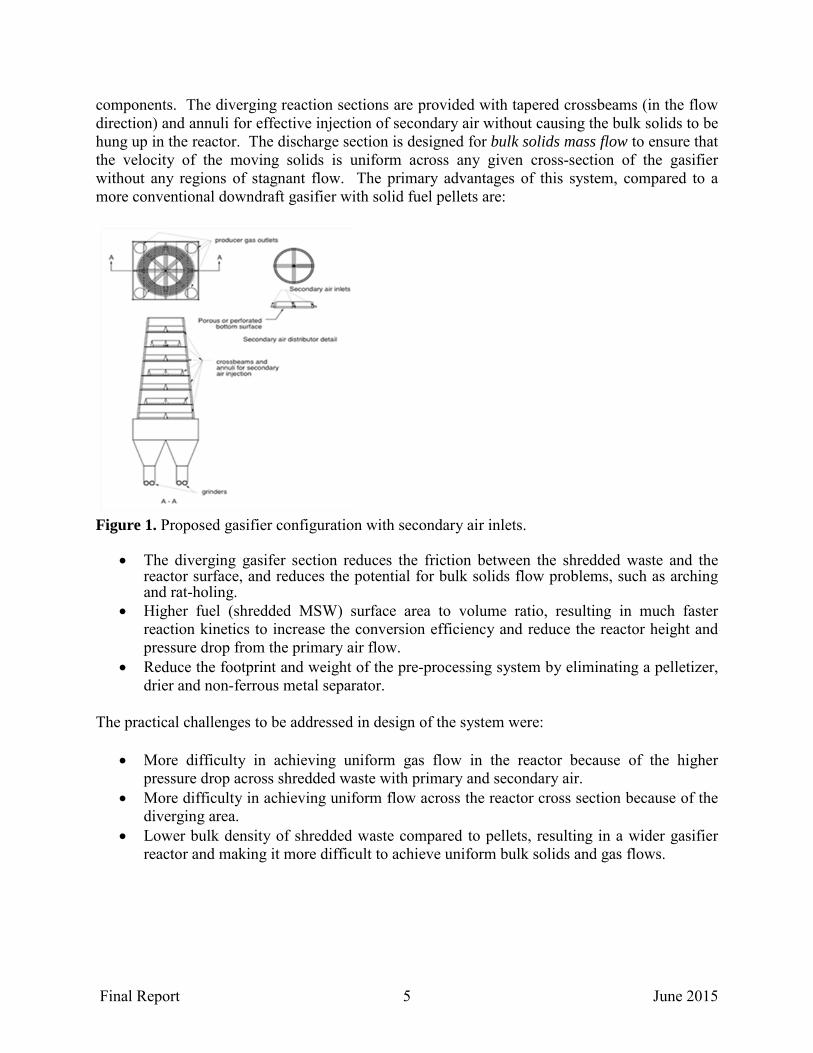
3.2.1 Gasifier/Grate Design and Air Injection Mass flow of the shredded waste solids in the reactor and grate and even distributions of primary and secondary air in the reactor are required to achieve optimum gasifier performance and are described below. Design considerations are given below. Solids Flow in Gasifier and Grate Bulk solids mass flow is required in the reactor and grate to achieve a uniform solids velocity and temperature over the cross-sectional area of the reactor. In mass flow, the entire bulk solids bed is in motion when char is discharged from the outlet of the reactor. For mass flow to occur in the cone configuration, the opening of the grate should be at least large enough to avoid blockages due to the formation of stable, cohesive arches, as well as ‘mechanical’ arches caused by interlocking of larger particles over the grate opening. The advantage of the diverging reactor is that it reduces the friction between the small shredded waste particles and the reactor surface and minimizes the potential for flow problems, such as arching. In a downdraft gasifier, the solids flow through the reactor is controlled by the grate and not by the flow at the top of the reactor. The bulk solids flow through the grate must also be of the mass flow type. This occurs when the walls of the converging section of the reactor are steep enough and low enough in friction to allow char to flow along the walls. Mass flow guarantees complete discharge of the contents of the reactor at predictable flow rates. As shown in Figure 1, the ash will be discharged through two hoppers. This flow is similar to the more conventional reactor geometry in which the top of the reactor has a constant area (parallel walls) and the bottom of the reactor has converging walls; bulk solids flow occurs along the walls of the cylinder. This occurs when the walls of the converging section are steep enough and low enough in friction to allow char to flow along the walls. Wall friction is measured by a method described in ASTM Standard D-6128 [3], where a sample of bulk material is placed inside a retaining ring on a coupon of wall material, various loads are applied, and the shear force required to cause the bulk material to slide along the wall surface is measured. Typical wall friction data obtained at 600oC for a sample of MSW Power Corp. gasifier char on refractory are shown in Figure 2. Knowing the char’s wall friction (and internal friction, which is obtained by shear cell testing), the slope of the walls of the converging section of the reactor can be calculated using a method developed by Jenike [4].
Final Report 7 June 2015
Figure 2. Wall friction data for IST Energy gasifier at 600°C. Prior to this effort, IST and MSW Power worked to optimize bulk solids flow on a three-ton per day pellet-fed gasifier. Flow property tests were performed on samples of municipal solid waste generated by the GEM pre-processing system (pellets), char from within the GEM gasifier, and char/ash fines discharged from the GEM gasifier and recommendations were made to modify the gasifier and grate, primarily by tapering (converging) the reactor and grate geometries in the bulk solids flow direction, resulting in solids mass flow. These recommendations resulted in a number of improvements over the initial gasifier performance:
• Bulk solids moved continuously and uniformly throughout the gasifier and grate. • The gasifier grate operated continuously and the bottom ash removal rate was 3-5% of
the pellet feed rate. • Design values of the pressure drop of the air across the reactor were achieved. • Temperatures throughout the reactor, at a given cross section and through the length of
the reactor, reached steady state and were consistent from run to run. • Hot spots in the reactor were eliminated. • When temperatures in the reduction zone of the gasifier were in the target range, very
little tar was found in the particulate filters. Primary and Secondary Air Injection The gas temperature profile in the gasifier must be controlled in order to keep the composition of the producer gas generated in the gasifier and to reduce the levels of tar that can foul downstream processing equipment and the engine/generator. Primary air must be allowed to flow uniformly through the reactor without channeling and without an excessive pressure drop, while secondary air must also be injected as uniformly as possible across the cross section of the reactor to reach the fuel in the center of the reactor. One of the primary advantages of the proposed gasifier system is that the high surface to volume ratio of the shredded waste will result in faster kinetics than pelletized waste, thereby reducing the reactor height and pressure drop through the reactor. Secondary air injection through nozzles placed around the periphery of the gasifier are less than ideal since the air is injected locally as high-velocity streams, and therefore much of the secondary air bypasses the solids. Improvements in gas uniformity can be achieved instead by
Final Report 8 June 2015
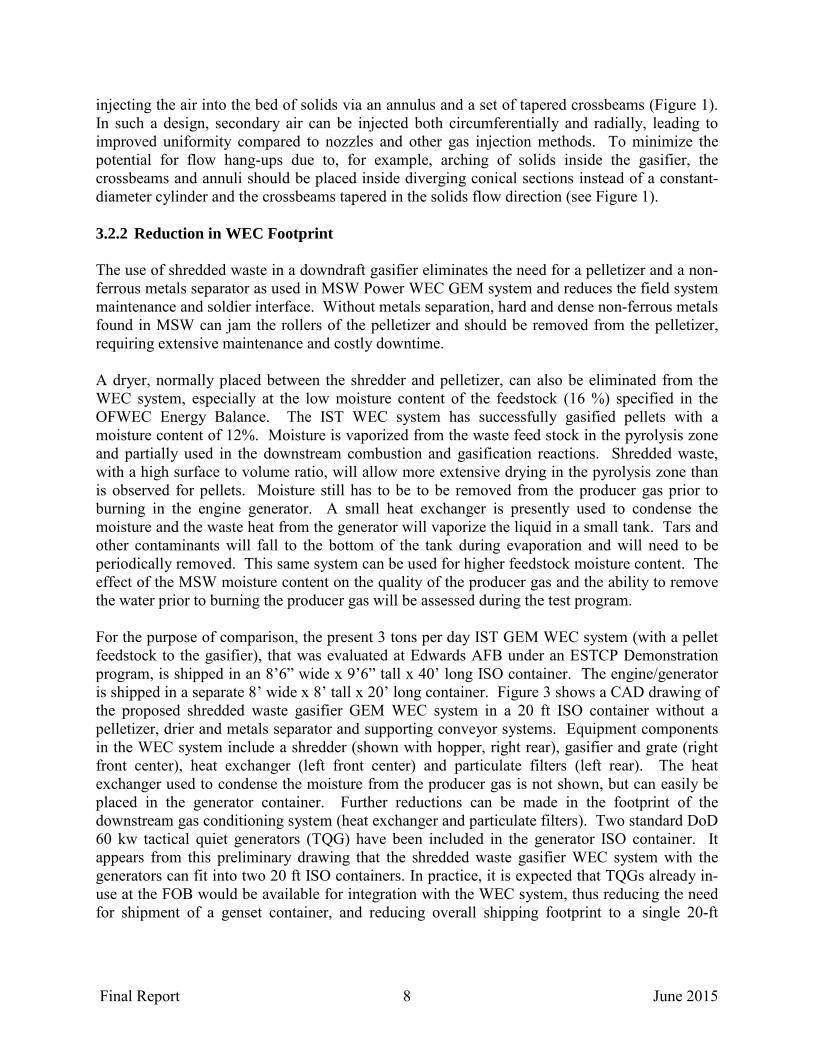
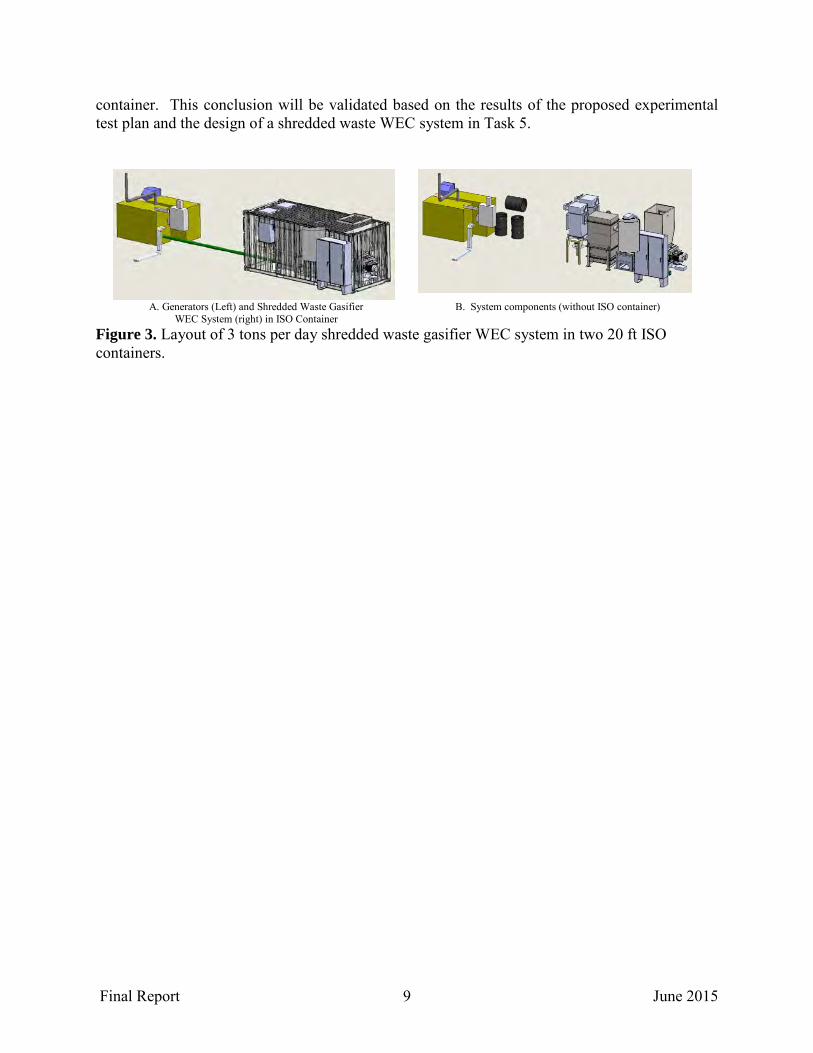
injecting the air into the bed of solids via an annulus and a set of tapered crossbeams (Figure 1). In such a design, secondary air can be injected both circumferentially and radially, leading to improved uniformity compared to nozzles and other gas injection methods. To minimize the potential for flow hang-ups due to, for example, arching of solids inside the gasifier, the crossbeams and annuli should be placed inside diverging conical sections instead of a constant-diameter cylinder and the crossbeams tapered in the solids flow direction (see Figure 1). 3.2.2 Reduction in WEC Footprint The use of shredded waste in a downdraft gasifier eliminates the need for a pelletizer and a non-ferrous metals separator as used in MSW Power WEC GEM system and reduces the field system maintenance and soldier interface. Without metals separation, hard and dense non-ferrous metals found in MSW can jam the rollers of the pelletizer and should be removed from the pelletizer, requiring extensive maintenance and costly downtime. A dryer, normally placed between the shredder and pelletizer, can also be eliminated from the WEC system, especially at the low moisture content of the feedstock (16 %) specified in the OFWEC Energy Balance. The IST WEC system has successfully gasified pellets with a moisture content of 12%. Moisture is vaporized from the waste feed stock in the pyrolysis zone and partially used in the downstream combustion and gasification reactions. Shredded waste, with a high surface to volume ratio, will allow more extensive drying in the pyrolysis zone than is observed for pellets. Moisture still has to be to be removed from the producer gas prior to burning in the engine generator. A small heat exchanger is presently used to condense the moisture and the waste heat from the generator will vaporize the liquid in a small tank. Tars and other contaminants will fall to the bottom of the tank during evaporation and will need to be periodically removed. This same system can be used for higher feedstock moisture content. The effect of the MSW moisture content on the quality of the producer gas and the ability to remove the water prior to burning the producer gas will be assessed during the test program. For the purpose of comparison, the present 3 tons per day IST GEM WEC system (with a pellet feedstock to the gasifier), that was evaluated at Edwards AFB under an ESTCP Demonstration program, is shipped in an 8’6” wide x 9’6” tall x 40’ long ISO container. The engine/generator is shipped in a separate 8’ wide x 8’ tall x 20’ long container. Figure 3 shows a CAD drawing of the proposed shredded waste gasifier GEM WEC system in a 20 ft ISO container without a pelletizer, drier and metals separator and supporting conveyor systems. Equipment components in the WEC system include a shredder (shown with hopper, right rear), gasifier and grate (right front center), heat exchanger (left front center) and particulate filters (left rear). The heat exchanger used to condense the moisture from the producer gas is not shown, but can easily be placed in the generator container. Further reductions can be made in the footprint of the downstream gas conditioning system (heat exchanger and particulate filters). Two standard DoD 60 kw tactical quiet generators (TQG) have been included in the generator ISO container. It appears from this preliminary drawing that the shredded waste gasifier WEC system with the generators can fit into two 20 ft ISO containers. In practice, it is expected that TQGs already in-use at the FOB would be available for integration with the WEC system, thus reducing the need for shipment of a genset container, and reducing overall shipping footprint to a single 20-ft
Final Report 9 June 2015
container. This conclusion will be validated based on the results of the proposed experimental test plan and the design of a shredded waste WEC system in Task 5.
A. Generators (Left) and Shredded Waste Gasifier
WEC System (right) in ISO Container B. System components (without ISO container)
Figure 3. Layout of 3 tons per day shredded waste gasifier WEC system in two 20 ft ISO containers.

Final Report 10 June 2015
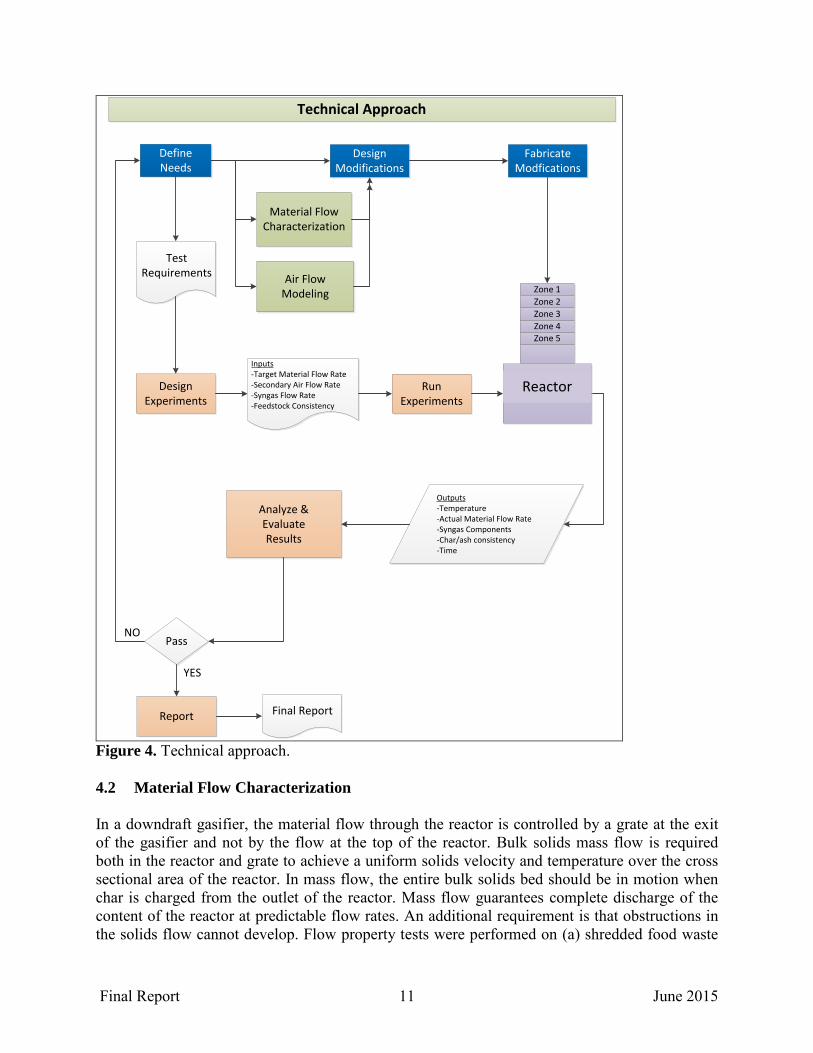
4 MATERIALS AND METHODS
The technical program was focused on developing a downdraft gasification system capable of processing shredded waste into clean-burning producer gas with the objective of supplying a base camp with electricity and heat, while at the same time substantially reducing the footprint of the waste pre-processing system. To accomplish this, efforts were focused on the development of a flow optimized downdraft gasifier. IST’s stratified downdraft gasifier was chosen as a baseline against which to develop enhancements. There were six primary tasks to the research and development effort, all executed in an iterated fashion until program completion:
1. Define needs 2. Material flow characterization 3. Air flow modeling 4. Gasifier modification design/fabrication 5. Experimentation 6. Analyze and Evaluate Results
Details of the overall approach are shown schematically in Figure 4. 4.1 Definition of Needs A needs assessment was performed to ensure the technical effort was constructed to be best positioned to yield impactful outcomes. Based on the SERDP statement of need (SON) and prior experience developing military waste to energy conversion systems, the following requirements were defined:
1. Design a mass flow gasifier to minimize/abate the formation of rat holes and arching. 2. Design gasifier and secondary air injection configuration to efficiently process and
convert shredded waste to producer gas. 3. Demonstrate gasifier reactor in the laboratory. 4. Design complete WEC gasification system to meet footprint requirements. 5. Reduce weight and footprint of preprocessing system by eliminating pelletizer, drier and
non-ferrous metal separator. 6. Characterize shredded waste in gasifier with respect to bulk flow properties. 7. Integrate prototype gasification system with downstream gas conditioning system and
engine/electric generator. 8. Instrument gasification, downstream gas conditioner, and energy/generator subsystems to
quantify performance and provide detailed mass and energy balance. 9. Characterize performance of prototype gasification system. 10. Model pyrolysis and gasification zones in gasifier reactor and determine temperature and
gas composition profiles. 11. Redesign prototype gasifier to improve gasifier operability and conversion efficiency. 12. Design a three-ton per day full-scale shredded waste downdraft gasification system.
Final Report 11 June 2015
Technical Approach
Design Modifications
FabricateModfications
Design Experiments
RunExperiments
Inputs-Target Material Flow Rate-Secondary Air Flow Rate-Syngas Flow Rate-Feedstock Consistency
Outputs-Temperature-Actual Material Flow Rate-Syngas Components-Char/ash consistency-Time
Analyze & Evaluate Results
PassNO
YES
Report Final Report
TestRequirements Air Flow
Modeling
Material Flow Characterization
DefineNeeds
Zone 5Zone 4Zone 3Zone 2Zone 1
Reactor
Figure 4. Technical approach. 4.2 Material Flow Characterization In a downdraft gasifier, the material flow through the reactor is controlled by a grate at the exit of the gasifier and not by the flow at the top of the reactor. Bulk solids mass flow is required both in the reactor and grate to achieve a uniform solids velocity and temperature over the cross sectional area of the reactor. In mass flow, the entire bulk solids bed should be in motion when char is charged from the outlet of the reactor. Mass flow guarantees complete discharge of the content of the reactor at predictable flow rates. An additional requirement is that obstructions in the solids flow cannot develop. Flow property tests were performed on (a) shredded food waste
Final Report 12 June 2015
(44.5% by weight, paper (42.2%) and plastics (13.3%) at different moisture contents and (b) char/ash from a downdraft gasifier. Data was obtained for both unpolished and polished refractory that will be used as the walls of the gasifier. Tests included:
• Cohesive strength and physical modeling - to determine minimum outlet size to prevent arching and to confirm that gas injection and control devices will not interfere with solids flow.
• Wall friction - to determine wall materials and geometry to be used to allow solids mass flow.
• Compressibility – to provide relationship between consolidated pressure and bulk density and provide residence time calculations.
• Permeability – provides relationship between gas velocity and pressure drop for design of secondary air distribution system.
Shredded waste samples, as summarized in Table 1, were prepared for the purpose of assessing how the shredded waste would flow through a gasifier. Table 1. Shredded waste samples prepared for flow property testing. Shredded Waste 1 Shredded Waste 3 Shredded Waste 4 Shred size, mm 20 20 15 Composition Ft. Polk Ft. Polk Ft. Polk Moisture content, % 10 20 10 Photos of each sample type are provided in Figures 5-7. Tests were run to determine the cohesive strength of the material (used for critical arching and ratholing dimensions), particle interlocking (used to evaluate particle size and shape for the potential of interlocking arching through narrow gasifier sections), wall friction angles (used for calculating mass flow hopper angles), permeability (used to determine critical steady-state discharge rates), and bulk density/consolidating pressure relationship. Cohesive strength and wall friction tests were run for continuous flow conditions only at room temperature (72°F). In addition to shredded MSW, char ash produced from the conversion of MSW was tested to assess the cohesive strength, wall friction angles, permeability, and bulk density/consolidating pressure relationship for char ash. As the feedstock under goes significant physical changes as it progresses through a gasifier, it’s critical to understand how the mass flow properties of the material changes. Figure 2 shows some typical wall friction data obtained for char/ash at 850oC on a polished refractory. This data was used to calculate the slope of the walls of the gasifier.

Final Report 13 June 2015
Figure 5. Shredded waste sample #1.
Figure 6. Shredded waste sample #3.

Final Report 14 June 2015
Figure 7. Shredded waste sample #4. Based on the acquired material flow data, key objectives and design requirements for the prototype gasifier were specified as follows:
1. Gasifier walls tapered at 5 degrees. 2. Increasing area from the inlet to the outlet of the reactor. 3. Gasifier inlet rectangular cross sectional area of 102 cm x 15.2 cm (4” x 6”). 4. Gasifier height of 61.0 cm (24”). 5. Polished refractory.
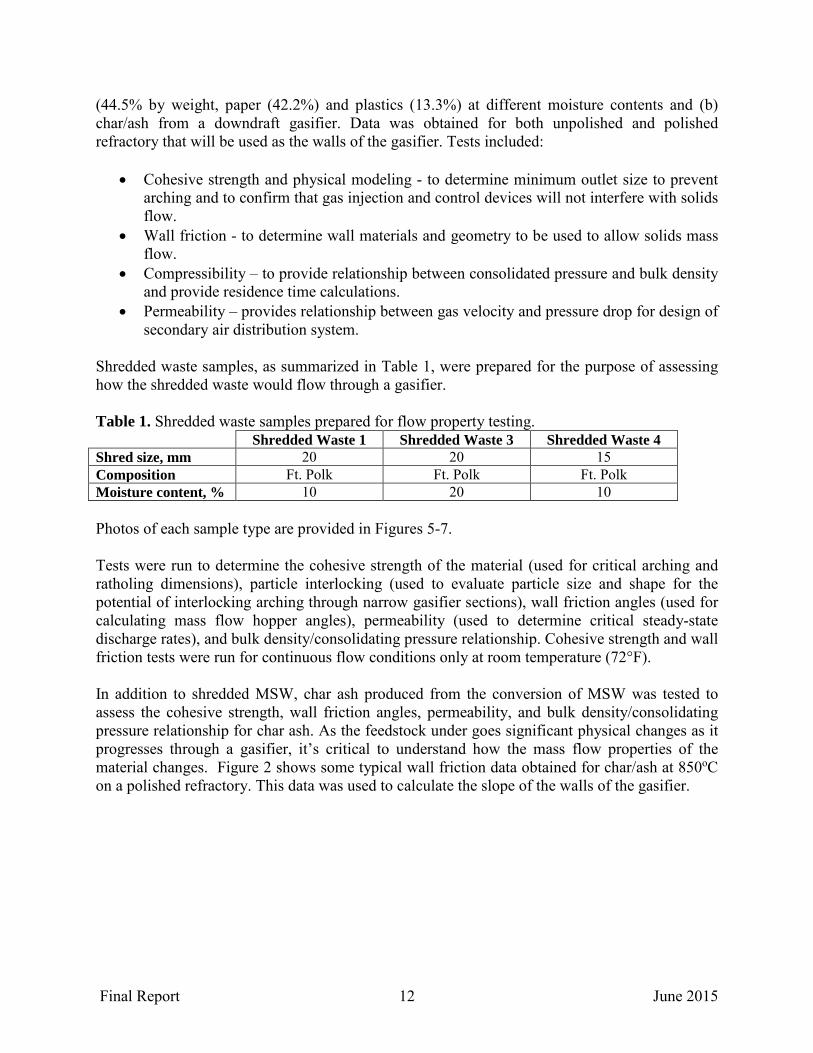
The diverging tapered walls of the gasifier reduce the friction between the shredded waste and the reactor surfaces, thus reducing the potential for bulk solids flow problems such as arching and rat-holing. The rectangular design reduces the distance of secondary air coverage, maximizing its reach without extending nozzles into the reactor. Finally, the gasifier size was specified to handle a shredded waste flow of 7.6 kg/hr (16.7 lb/hr) and a syngas flow rate of 0.61 m3/min (20.0 ft3/min). 4.3 Air Flow Modeling For high conversion efficiency, secondary air should penetrate to the center of the gasifier, reacting with as much of the waste in the pyrolysis zone as possible. Shredded waste has a low permeability (high resistance) to gas flow compared to pellets and the extent of the secondary air gas penetration into the gasifier can be limiting. SolidWorks Flow Simulation analyses [5] were carried out on the gasifier configuration shown in Figure 8 to determine the penetration distance of the secondary air into the solid waste as a function of the following operating conditions:
Final Report 15 June 2015
1. Secondary air flow as a percentage of the total syngas flow 2. Waste permeability (resistance) 3. Nozzle diameter (flow velocity) 4. Mass flow per ring 5. Number of secondary air flow rings
This model does not take into account mixing between the solid waste and the secondary flows. The penetration distance was determined by the distance of the limiting streamline from the wall of the gasifier. The solid waste was considered to be porous, with the permeability determined by the pressure drop along the length of the reactor. The gas flow in the reactor is defined by Darcy’s Law [6]:
m = -A*Δp/(k*L) where:
• m =gas mass flow, kg/sec • A = cross-sectional area in direction of flow, m2 • Δp = pressure difference in direction of flow, kg/m2 • L = length in direction of flow, m • k = porous medium flow resistance, sec/m
Figure 8. Downdraft Gasifier.
For high resistance or low permeability and for a fixed pressure gradient, the mass flow through the porous medium is very low. Conversely, for a fixed mass flow rate and high resistance, the pressure gradient is very large. The resistance coefficient was calculated as 336 sec/m for a full-
Final Report 16 June 2015
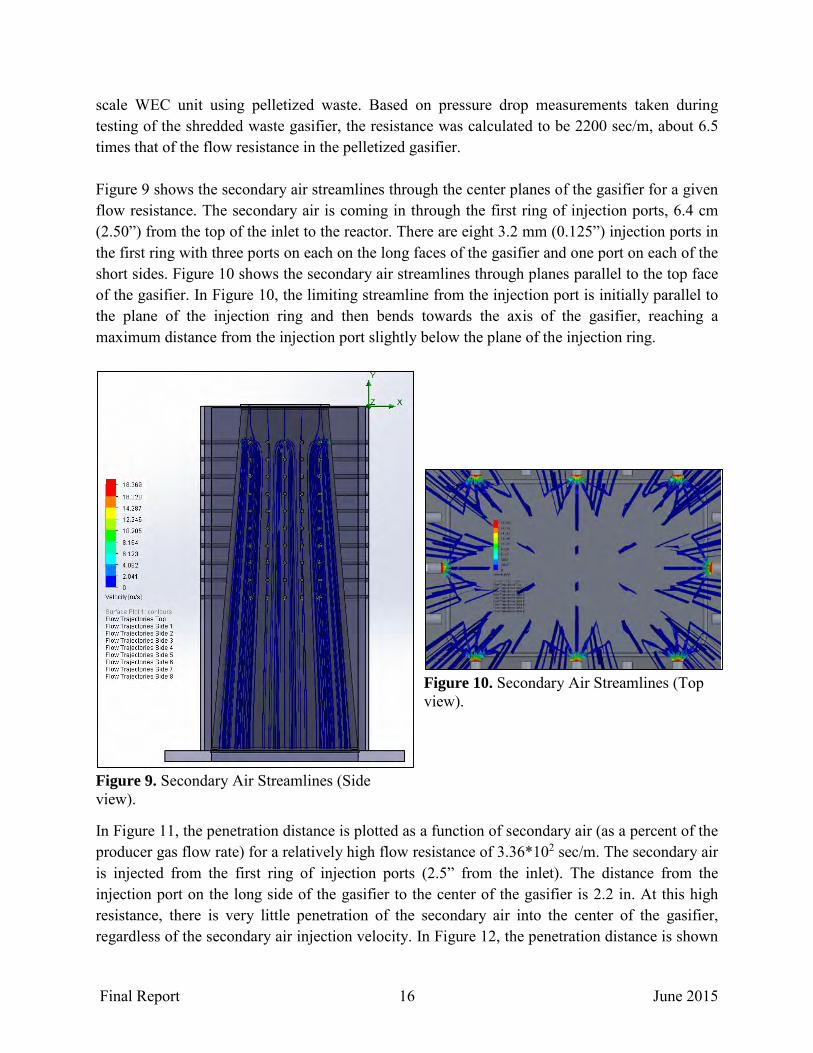
scale WEC unit using pelletized waste. Based on pressure drop measurements taken during testing of the shredded waste gasifier, the resistance was calculated to be 2200 sec/m, about 6.5 times that of the flow resistance in the pelletized gasifier. Figure 9 shows the secondary air streamlines through the center planes of the gasifier for a given flow resistance. The secondary air is coming in through the first ring of injection ports, 6.4 cm (2.50”) from the top of the inlet to the reactor. There are eight 3.2 mm (0.125”) injection ports in the first ring with three ports on each on the long faces of the gasifier and one port on each of the short sides. Figure 10 shows the secondary air streamlines through planes parallel to the top face of the gasifier. In Figure 10, the limiting streamline from the injection port is initially parallel to the plane of the injection ring and then bends towards the axis of the gasifier, reaching a maximum distance from the injection port slightly below the plane of the injection ring.
Figure 9. Secondary Air Streamlines (Side view).
Figure 10. Secondary Air Streamlines (Top view).
In Figure 11, the penetration distance is plotted as a function of secondary air (as a percent of the producer gas flow rate) for a relatively high flow resistance of 3.36*102 sec/m. The secondary air is injected from the first ring of injection ports (2.5” from the inlet). The distance from the injection port on the long side of the gasifier to the center of the gasifier is 2.2 in. At this high resistance, there is very little penetration of the secondary air into the center of the gasifier, regardless of the secondary air injection velocity. In Figure 12, the penetration distance is shown

Final Report 17 June 2015
as a function of the resistance for a constant secondary air flow rate. At relatively high flow resistances, the penetration distance is relatively constant (~1.4 inches), about 33% of the distance to the center of the gasifier. As the flow resistance is reduced, the penetration distance increases until it reaches the center of the gasifier. At a lower flow resistance and for a constant injection flow rate, the penetration distance increases with decreasing nozzle diameter or increasing injection velocity.
Figure 11. Effect of Secondary Air % on penetration.
Figure 12. Effect of Resistance on penetration.
4.4 Gasifier Modification Design/Fabrication In order to optimally process municipal solid waste in a downdraft gasifier several key operating functions must be met. The most important functions are:
• Consistent and controllable pressure drop across the reactor • Controlled ash discharge • Controlled syngas production • Controlled secondary air injection rates • Uniform particle flow
In order to produce a low tar syngas while maximizing energy content of the gas, the downdraft gasifier must allow for the following conditions:
• A pyrolysis zone in which volatile matter can be vaporized from the solid material with minimal oxygen. Ideally this reaction occurs between 400 and 600°C.
• A combustion zone in which the volatile matter from the pyrolysis reaction can be combusted to form carbon dioxide and water vapor while continuing to extract carbon
0.8
1
1.2
1.4
1.6
1.8
2
2.2
2.4
0% 50% 100%
Pene
trat
ion,
inch
es
Secondary Air, percent
D=0.75 in
D=0.25 in
D=0.125 in
Distanceto Center
1.00
1.20
1.40
1.60
1.80
2.00
2.20
2.40
1.E+00 1.E+03
Pene
trat
ion,
inch
es
Resistance, sec/m
NozzleDiameter = 0.75inNozzleDiameter = 0.25inNozzleDiameter = 0.125inDistancetoCenter

Final Report 18 June 2015
from the solid material. This reaction should occur at temperatures exceeding 900°C and ideally around 1000°C. The solid material should only contain fixed carbon (char).
• A reduction zone in which the hot char from the combustion zone interacts with carbon dioxide and water vapor in the absence of oxygen to produce hydrogen and carbon monoxide gases. This reaction occurs at temperatures around 750°C.
In order to achieve these conditions, the feedstock must meet certain requirements. Those conditions are:
• A moisture content below 20% by weight. • A particle size that reacts at the rate in which the velocity of that particle reaches each
zone with the correct properties. For example, the feedstock particle should have all the volatile matter removed from it prior to reaching the reduction zone, but the particle should not have been stripped of all its fixed carbon. If that occurs, only ash will be present in the reduction zone which will not act as a catalyst for the reduction zone.
• A permeability rate that allows for a consistent and low pressure drop across the reactor (3-5” WC). Additionally, the feedstock permeability should allow for penetration of secondary air that can evenly distribute throughout the cross-section of the reactor.
• Low coefficient of friction to allow for mass flow conditions to occur in the reactor. The higher the coefficient of friction the steeper the walls must be to produce mass flow conditions. In some instances, the coefficient of friction is so high that diverging walls must be used.
• Low mechanical interlocking rate, which allows the material to flow uniformly without bridging.
• Uniformity in the feedstock helps control the kinetic rates across each zone. • Feedstock density helps to maximize energy production in a given reactor volume. • Particle size.
Post gasifier, numerous operations are required to condition the gas. First, a shell and tube heat exchanger constructed out of stainless steel material is required to cool the hot syngas. This operation should be done first so that lower cost operations could be used downstream. The syngas could be cooled using water or air as the cooling media. Thermocouples should be placed at all inlets and outlets (4 in total) and a flowmeter should be installed on the cooling media. This will allow for analysis of the thermal performance of the heat exchanger. Additionally, the pressure drop across the heat exchanger should be monitored for fouling. A particle filtration unit, such as a baghouse or cartridge filter, is required to remove any entrained char/ash and tar from the gas stream. The pressure drop along the filter should be monitored to determine if and when the filter is clogged with material. A high pressure blower is required to be able to pull vacuum on the entire system while hitting the targeted syngas flowrate (15-30 CFM in this case). The blower should be able to pull 50” of water column at the upper flowrate target. A regenerative blower is commonly used for this scenario. A pressure sensor should be located just before the suction side of the blower to measure the full vacuum being pulled by the blower. Additionally, a variable frequency drive (VFD) should be used to control the blower speed.
Final Report 19 June 2015
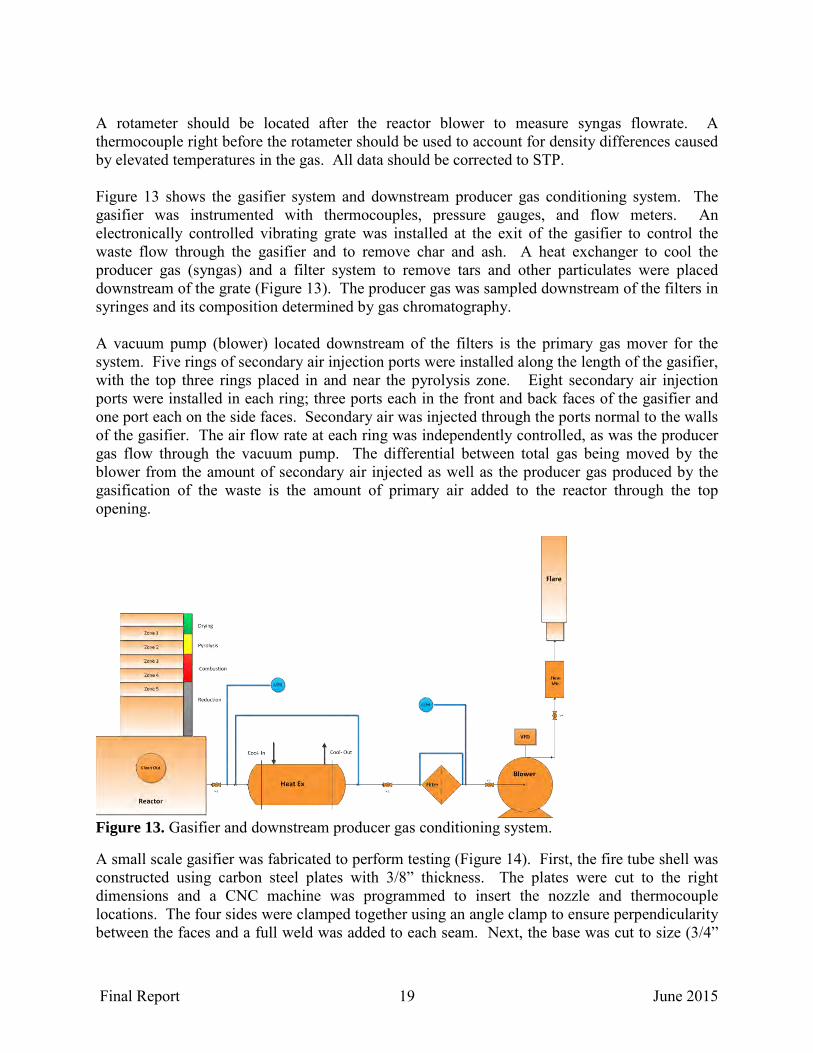
A rotameter should be located after the reactor blower to measure syngas flowrate. A thermocouple right before the rotameter should be used to account for density differences caused by elevated temperatures in the gas. All data should be corrected to STP. Figure 13 shows the gasifier system and downstream producer gas conditioning system. The gasifier was instrumented with thermocouples, pressure gauges, and flow meters. An electronically controlled vibrating grate was installed at the exit of the gasifier to control the waste flow through the gasifier and to remove char and ash. A heat exchanger to cool the producer gas (syngas) and a filter system to remove tars and other particulates were placed downstream of the grate (Figure 13). The producer gas was sampled downstream of the filters in syringes and its composition determined by gas chromatography. A vacuum pump (blower) located downstream of the filters is the primary gas mover for the system. Five rings of secondary air injection ports were installed along the length of the gasifier, with the top three rings placed in and near the pyrolysis zone. Eight secondary air injection ports were installed in each ring; three ports each in the front and back faces of the gasifier and one port each on the side faces. Secondary air was injected through the ports normal to the walls of the gasifier. The air flow rate at each ring was independently controlled, as was the producer gas flow through the vacuum pump. The differential between total gas being moved by the blower from the amount of secondary air injected as well as the producer gas produced by the gasification of the waste is the amount of primary air added to the reactor through the top opening.
Figure 13. Gasifier and downstream producer gas conditioning system.
A small scale gasifier was fabricated to perform testing (Figure 14). First, the fire tube shell was constructed using carbon steel plates with 3/8” thickness. The plates were cut to the right dimensions and a CNC machine was programmed to insert the nozzle and thermocouple locations. The four sides were clamped together using an angle clamp to ensure perpendicularity between the faces and a full weld was added to each seam. Next, the base was cut to size (3/4”

Final Report 20 June 2015
thick carbon steel plate) and the discharge opening was plasma cut from the center and the mounting holes were located by the CNC machine. The plate was placed under the side walls and fully welded together.
Figure 14. Shredded waste gasifier fire tube shell.
The refractory was formed by placing a plastic mold, which was machined to the correct wall angles, into the fire tube structure (Figures 15 and 16). Steel rods that were coated in oil were passed through each opening in the steel walls to form the nozzles and thermocouple ports. Using the vendor’s instructions, R-30 Express refractory material was formulated via mixing of dry product and water. Using a vibratory stick, the refractory was well mixed and poured between the walls and the form. Again the vibrating stick was used to remove any air bubbles in the refractory. It was then soft cured for 24 hours before the plastic mold and rods were removed. Another 24 hours was used to cure the refractory.

Final Report 21 June 2015
Figure 15. Side view of gasifier shell with refractory.
Figure 16. Inside of gasifier shell with refractory.

Final Report 22 June 2015
The reactor base was constructed using ½” thick carbon steel plates (Figure 17). The necessary holes were machined into each face and the structure was fully welded together. Before the top was added to the base, CS85 high temperature board insulation and the grate were installed.
Figure 17. Reactor base with insulation and grate visible. Once the insulation, grate and poking rod were installed, the base top plate was welded on (Figure 18). The base top plate was machined and ¾”-12 by 4” long bolts were welded into it as studs. The head of the bolts were removed to create a smooth bottom surface to mate with the base walls. The discharge opening in the base top plate was formed by a plasma cutter. The entire top plate was fully welded to the base frame. Woven fiberglass gasket material was placed between the reactor base and fire tube assembly before they were coupled together. All secondary air nozzles and thermocouple ports had their couplings welded to the openings in the fire tube. A handle was added to the top for transportability reasons. The completed gasifier is shown in Figure 19. Once the gasifier was fabricated, a secondary air manifold system was designed and fabricated. The system is designed to control inlet air pressure and flowrate through eight different nozzles in each zone. An air compressor was utilized to provide the air. The flare was designed and constructed in order to reduce flame height. A 1” to 4” coupling formed the body of the flare. 1” schedule 40 pipe with threads on one end was welded to the coupling so that it could be threaded into the blower piping. ¼” schedule 40 pipe nipples were added to the 4” section of the coupling and welded in tangentially to the inner diameter. This
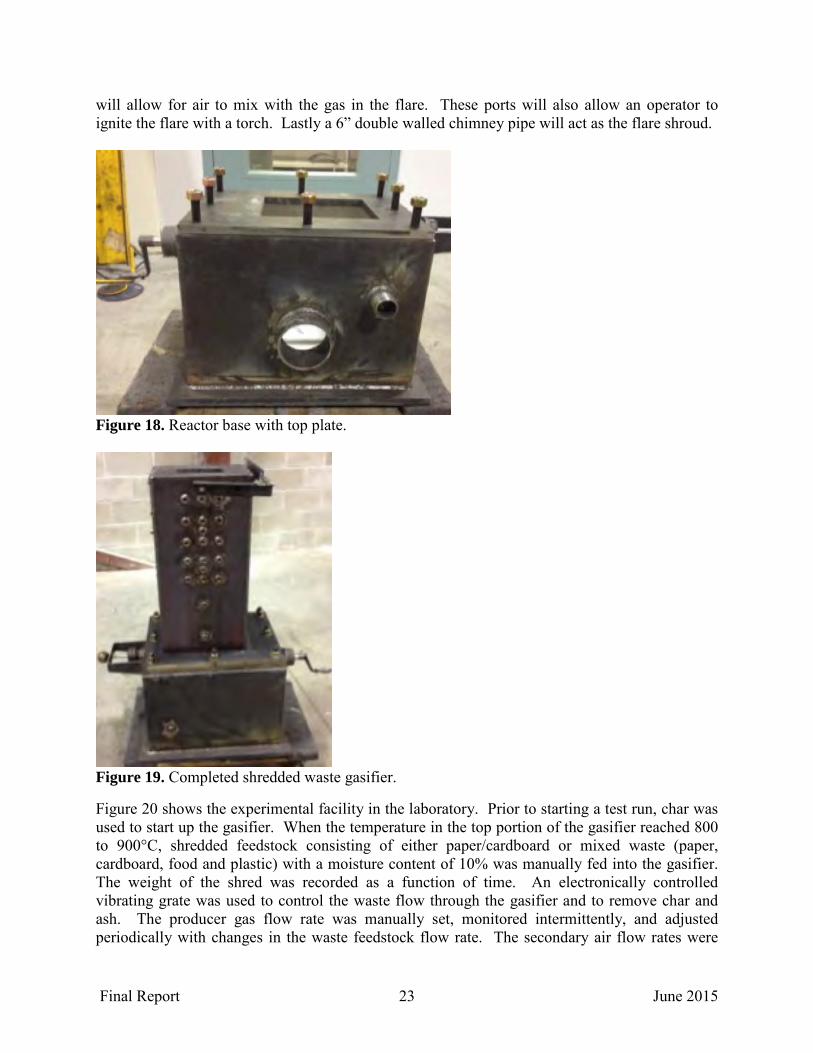
Final Report 23 June 2015
will allow for air to mix with the gas in the flare. These ports will also allow an operator to ignite the flare with a torch. Lastly a 6” double walled chimney pipe will act as the flare shroud.
Figure 18. Reactor base with top plate.
Figure 19. Completed shredded waste gasifier.
Figure 20 shows the experimental facility in the laboratory. Prior to starting a test run, char was used to start up the gasifier. When the temperature in the top portion of the gasifier reached 800 to 900°C, shredded feedstock consisting of either paper/cardboard or mixed waste (paper, cardboard, food and plastic) with a moisture content of 10% was manually fed into the gasifier. The weight of the shred was recorded as a function of time. An electronically controlled vibrating grate was used to control the waste flow through the gasifier and to remove char and ash. The producer gas flow rate was manually set, monitored intermittently, and adjusted periodically with changes in the waste feedstock flow rate. The secondary air flow rates were

Final Report 24 June 2015
also manually set and recorded on a data sheet. For the test program, secondary air was injected through ports in the walls in the top three ring positions of the gasifier (2.5, 5.0 and 7.5 inches). The diameter of the injection ports were 0.269 inches (6.83 mm). For two tests, air was injected into a tube placed across the width of the gasifier through two holes of diameter 0.094 inches (2.38 mm) facing downward; secondary air was also injected through some of the sidewall air injection ports. The gasifier, downstream heat exchanger, filter, and blower temperatures and pressures were electronically monitored and recorded at a 1 Hz rate from system start-up to shut down. In the event of a backdraft from the gasifier, the secondary air flows were reduced until the backdraft disappeared.
Figure 20. Photograph of downdraft gasifier laboratory facility.
The producer gas was sampled via a collection port immediately upstream from a downstream flare. A syringe was connected to the port, the gas was allowed to fill the tube for approximately 20 to 30 seconds to ensure the syringe was completely filled with producer gas, and then the syringe was capped. Three samples were taken for each set of test conditions. The collected gas was injected into a SRI 8610 Gas Chromatograph (GC) to perform compositional analysis. A methanizer equipped flame ionization detector (FID) was utilized to measure the concentrations of carbon monoxide, carbon dioxide, and methane, while a thermal conductivity detector (TCD) was utilized to measure the concentrations of nitrogen, hydrogen, and oxygen. The average of the samples was used to determine the producer gas energy. The operation of the downdraft gasifier was guided by an equilibrium analysis of the gasification process. In the gasification zone, three reactions dominate [2,7,8]: Boudouard reaction: Char + CO2 → 2CO, ∆H = +40,778 kcal/mol Water Gas Reaction: Char + H2O → CO + H2, ∆H= +32,472 kcal/mol Water Gas Shift Reaction: H2O + CO → H2 + CO2, ∆H= -8,306 kcal/mol The char gasification zone is assumed to be adiabatic and the water gas shift reaction is assumed to be at equilibrium [7,8]. Table 2 shows the composition and ultimate analyses of the three waste streams used in the test program. The ultimate analysis for the paper/cardboard waste is
Flare Blower Heat Exchanger Gasifier
Secondary Air Flow Meters

Final Report 25 June 2015
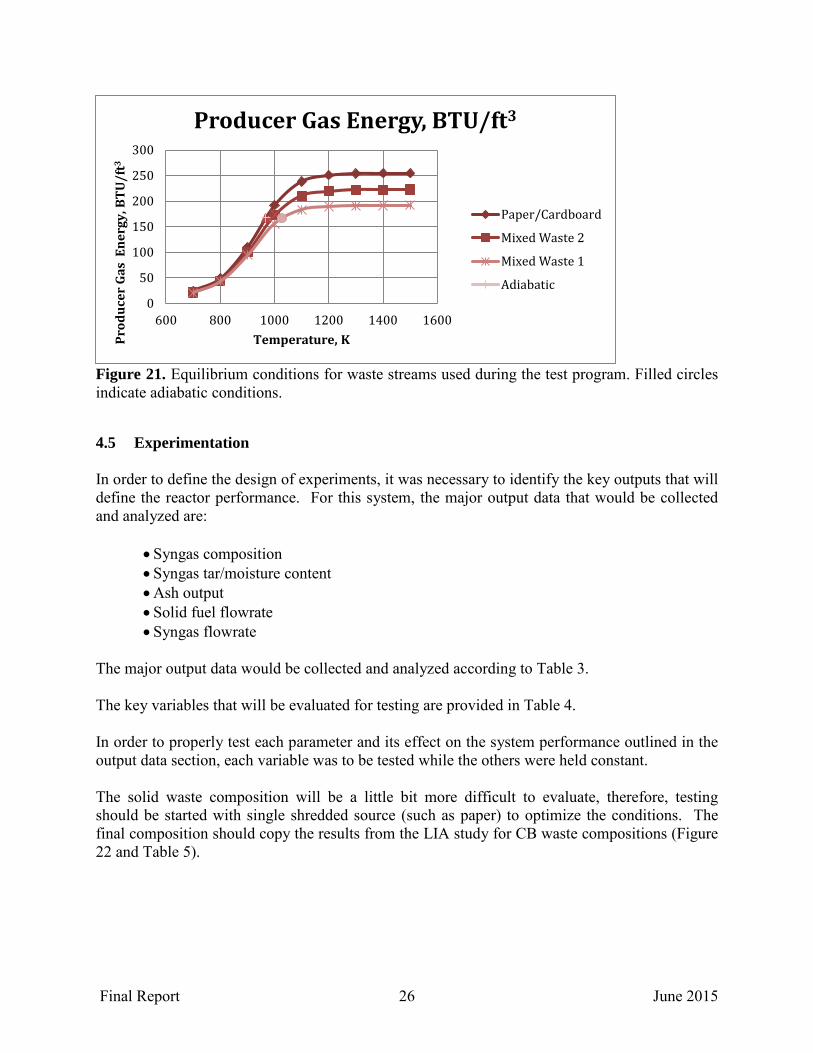
given in [4]; the mixed waste ultimate analyses were determined experimentally by Hazen Research, Inc. (Golden, CO). The equilibrium results are shown in Figure 21 and are based on the ultimate analysis as input. The equilibrium adiabatic gas temperatures and producer gas energies are also shown in Table 2 and Figure 21. This equilibrium model was used to determine how closely the test results approached equilibrium.
Table 2. Waste composition, ultimate analysis and equilibrium adiabatic gas conditions.
Paper/Cardboard Mixed Waste # 1 Mixed Waste # 2 Composition Paper, wt % 50 22 22 Cardboard, wt % 50 22 22 Food, wt % - 38 33 Plastic, wt % - 13 13 Added moisture, wt % - 5 10 Ultimate Analysis, dry, wt % Moisture 0 0 0 Carbon 43.4 57.45 49.33 Hydrogen 5.8 7.51 6.13 Nitrogen 0.3 0.34 0.03 Sulfur 0.2 0.02 0.12 Ash 6.0 5.62 4.68 Oxygen 44.3 29.02 39.71 Total 100.0 100.00 100.00 Adiabatic Gas Temperature, °K
968 1027 1002
Producer Gas Energy BTU/ft3 167 166 174 kJ/m3 6.22*103 6.18*103 6.48*103
The objectives of the test program were to determine if (a) the gasifier design resulted in bulk solids mass flow and (b) the secondary air configurations that resulted in high producer gas energy. The producer gas energy was determined from the GC analysis for hydrogen, carbon monoxide and methane. The maximum temperature was determined from the data set and was taken to be the char combustion temperature just below the flaming pyrolysis zone in the gasifier, where the solid waste and the pyrolysis vapor is combusted by oxygen, producing CO2 and water. The adiabatic char gasification temperature was taken near the bottom of the gasifier, where char is converted to ash.
Final Report 26 June 2015
Figure 21. Equilibrium conditions for waste streams used during the test program. Filled circles indicate adiabatic conditions.
4.5 Experimentation In order to define the design of experiments, it was necessary to identify the key outputs that will define the reactor performance. For this system, the major output data that would be collected and analyzed are:
• Syngas composition • Syngas tar/moisture content • Ash output • Solid fuel flowrate • Syngas flowrate
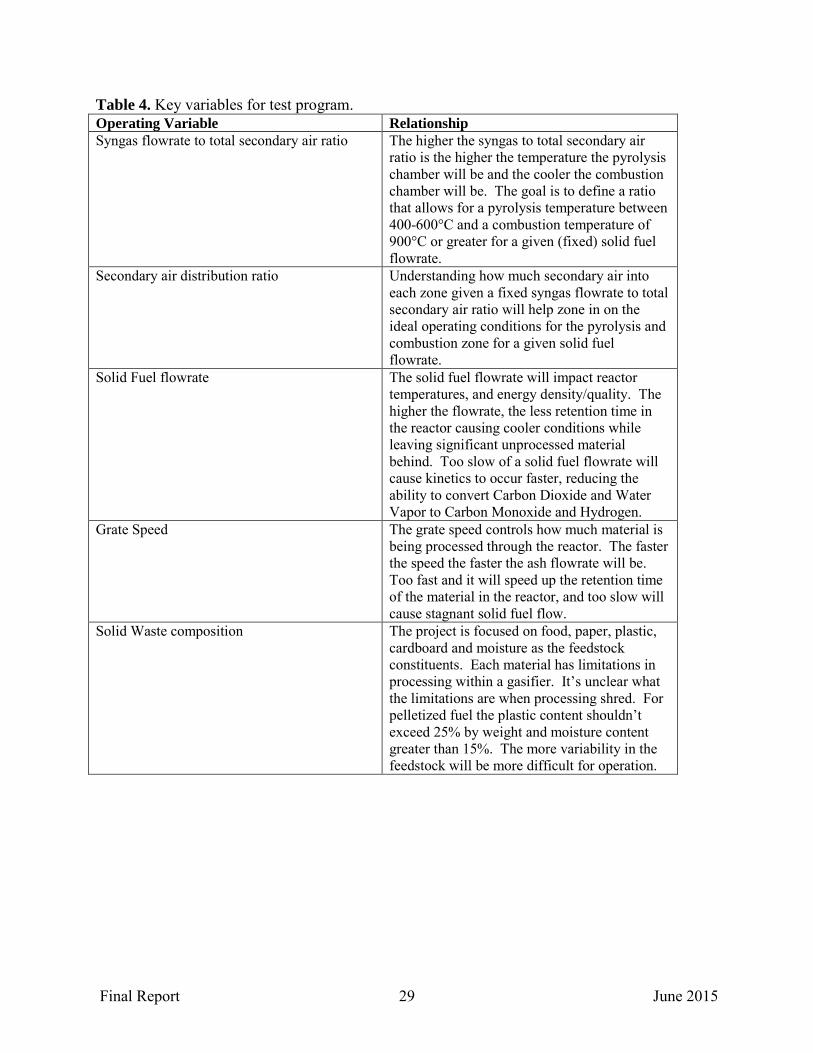
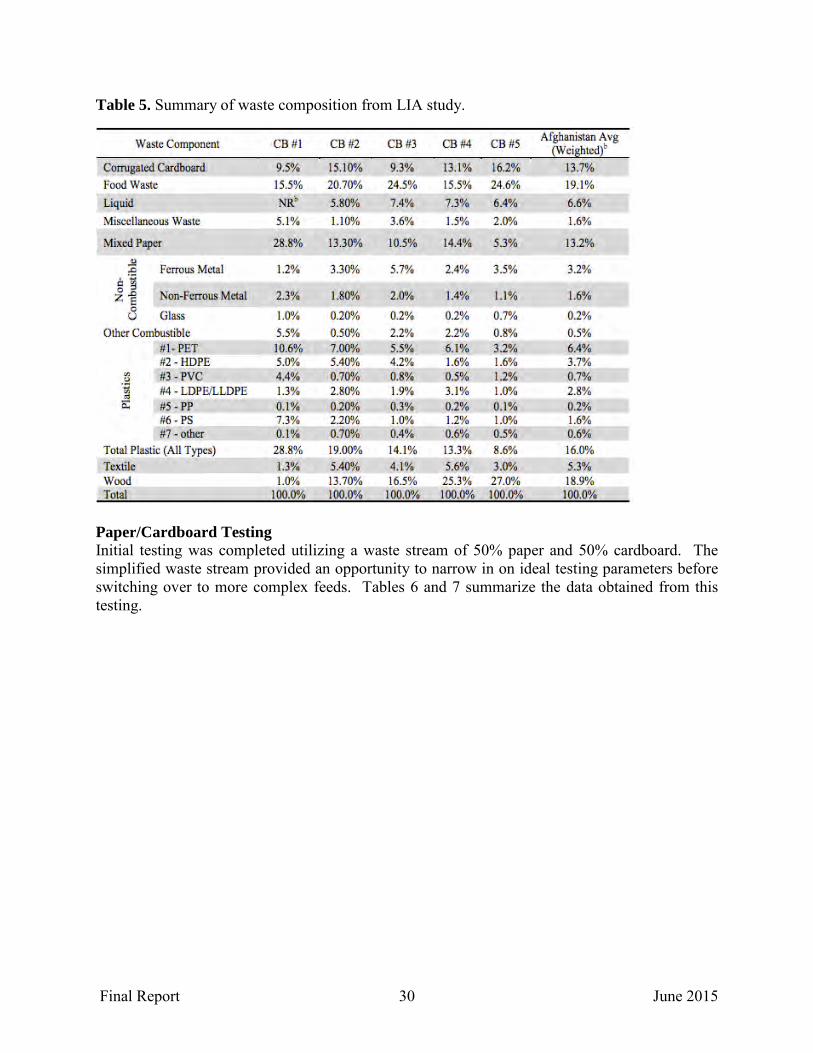
The major output data would be collected and analyzed according to Table 3. The key variables that will be evaluated for testing are provided in Table 4. In order to properly test each parameter and its effect on the system performance outlined in the output data section, each variable was to be tested while the others were held constant. The solid waste composition will be a little bit more difficult to evaluate, therefore, testing should be started with single shredded source (such as paper) to optimize the conditions. The final composition should copy the results from the LIA study for CB waste compositions (Figure 22 and Table 5).
0
50
100
150
200
250
300
600 800 1000 1200 1400 1600
Prod
ucer
Gas
Ene
rgy,
BTU
/ft3
Temperature, K
Producer Gas Energy, BTU/ft3
Paper/Cardboard
Mixed Waste 2
Mixed Waste 1
Adiabatic

Final Report 27 June 2015
Table 3. Major output data for test program. Output Collection Method Analysis Method
Syngas Composition Collecting syngas from the positive pressure side of pump, using a gas collection device for temporary storage.
Utilize Gas Chromatography using a TCD and FID to detect CO, CO2, H2, CH4, N2 and O2.
Syngas Tar/Moisture content Collect a known volume of gas and process through an impinge train where the first three impingers contain solvent that will capture tars and the last three are chilled to condensate moisture.
Measure the weight difference in impingers to quantify the amount of tar and moisture collected. Send collected tar samples to third party for analysis of the different tar constituents.
Ash output Collect all ash from the ash collection bin from each run.
Measure the before and after weight of the bin along with the solid waste throughput (and char start up weight) and duration of test to calculate % reduction and ash flowrate.
Solid fuel flowrate Writing down weight added to the system for each charge and notating the time in the test of each charge.
Calculate the total weight added over the duration of waste being added.
Syngas flowrate Recording the syngas flowrate indicated by an inline flowmeter like a rotameter.
Plot syngas flowrate over time to match up with other secondary data collected.

Final Report 28 June 2015
Figure 22. Summary of waste composition from LIA study.
Final Report 29 June 2015
Table 4. Key variables for test program. Operating Variable Relationship Syngas flowrate to total secondary air ratio The higher the syngas to total secondary air
ratio is the higher the temperature the pyrolysis chamber will be and the cooler the combustion chamber will be. The goal is to define a ratio that allows for a pyrolysis temperature between 400-600°C and a combustion temperature of 900°C or greater for a given (fixed) solid fuel flowrate.
Secondary air distribution ratio Understanding how much secondary air into each zone given a fixed syngas flowrate to total secondary air ratio will help zone in on the ideal operating conditions for the pyrolysis and combustion zone for a given solid fuel flowrate.
Solid Fuel flowrate The solid fuel flowrate will impact reactor temperatures, and energy density/quality. The higher the flowrate, the less retention time in the reactor causing cooler conditions while leaving significant unprocessed material behind. Too slow of a solid fuel flowrate will cause kinetics to occur faster, reducing the ability to convert Carbon Dioxide and Water Vapor to Carbon Monoxide and Hydrogen.
Grate Speed The grate speed controls how much material is being processed through the reactor. The faster the speed the faster the ash flowrate will be. Too fast and it will speed up the retention time of the material in the reactor, and too slow will cause stagnant solid fuel flow.
Solid Waste composition The project is focused on food, paper, plastic, cardboard and moisture as the feedstock constituents. Each material has limitations in processing within a gasifier. It’s unclear what the limitations are when processing shred. For pelletized fuel the plastic content shouldn’t exceed 25% by weight and moisture content greater than 15%. The more variability in the feedstock will be more difficult for operation.
Final Report 30 June 2015
Table 5. Summary of waste composition from LIA study.
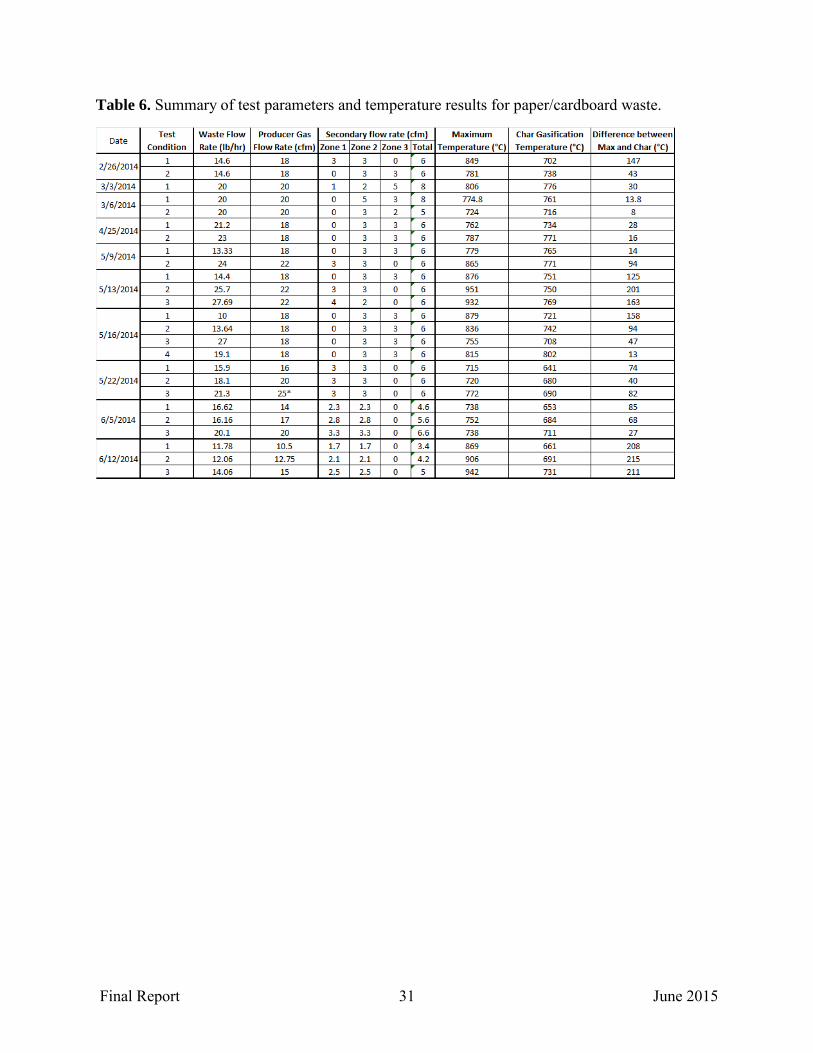
Paper/Cardboard Testing Initial testing was completed utilizing a waste stream of 50% paper and 50% cardboard. The simplified waste stream provided an opportunity to narrow in on ideal testing parameters before switching over to more complex feeds. Tables 6 and 7 summarize the data obtained from this testing.
Final Report 31 June 2015
Table 6. Summary of test parameters and temperature results for paper/cardboard waste.

Final Report 32 June 2015
Table 7. Summary of producer gas composition and energy density results for paper/cardboard waste.
Test Hydrogen Nitrogen carbon monoxide Methane carbon Dioxide Energy Density Date
Condition Content(%) Content(%) content(%) Content (%1 Content(%) (BTU/ft"3)
2/ 26/ 2014 1 15.81 50.17 23.06 1.73 9.22 133.58
2 3.06 60.25 23.91 1.36 11.42 97.83
3/ 3/ 2014 1 7.04 53.29 26.73 2.20 10.73 125.52
3/ 6/ 2014 1 10.38 53.19 24.61 1.88 9.94 124.97
2 6.47 56.65 22.59 1.88 12.41 107.65
4/ 25/ 2014 1 13.11 49.83 23.57 2.02 11.47 130.39
2 11.35 49.69 24.83 2.15 11.98 130.79
5/ 9/ 2014 1 5.36 58.11 23.18 1.6 11.74 103.99
2 6.2 55.92 24.22 1.87 11.79 112.11
1 7.8 57.06 22.13 1.64 11.37 107.68
5/13/ 2014 2 9.94 53.13 23.06 1.94 11.93 119.30
3 5 59.07 19.67 1.88 14.38 94.25
1 11.66 54.61 21.03 1.52 11.19 113.66
5/16/ 2014 2 5.8 58.14 22 1.81 12.24 103.32
3 13.41 53.29 17.92 2.16 13.21 114.30
4 7.97 63.58 12.45 1.04 14.96 71.50
1 4.87 57.64 25.48 2.48 9.53 118.08
5/ 22/ 2014 2 7.68 57.44 22.15 2.09 10.64 111.52
3 7.17 56.95 21.38 2.25 12.27 109.10
1 7.13 59.07 19.57 2.1 12.13 101.80
6/ 5/ 2014 2 5.83 58.92 21.37 2.08 11.8 103.83
3 7.35 54.95 23.89 2.59 11.22 120.79
1 5.27 63.32 17.08 1.7 12.63 85.01
6/12/ 2014 2 4.25 64.34 20.84 1.54 9.04 92.85
3 7.67 62.38 15.52 1.6 12.84 85.67
Final Report 33 June 2015
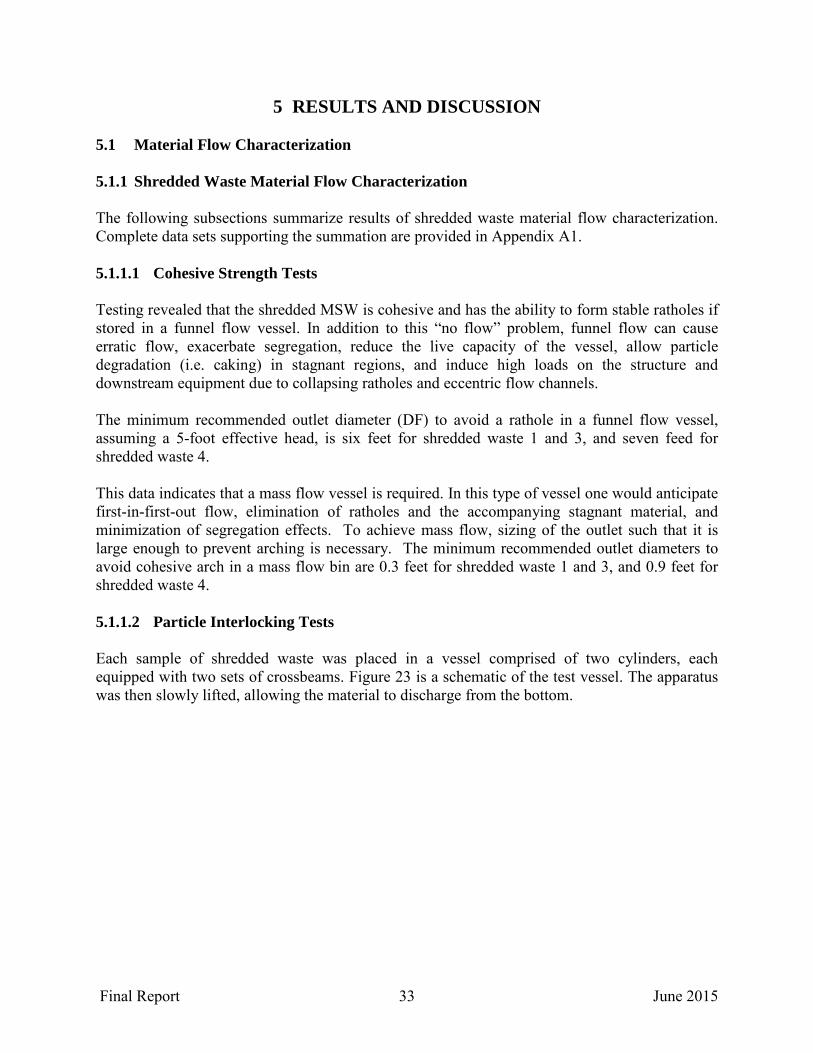
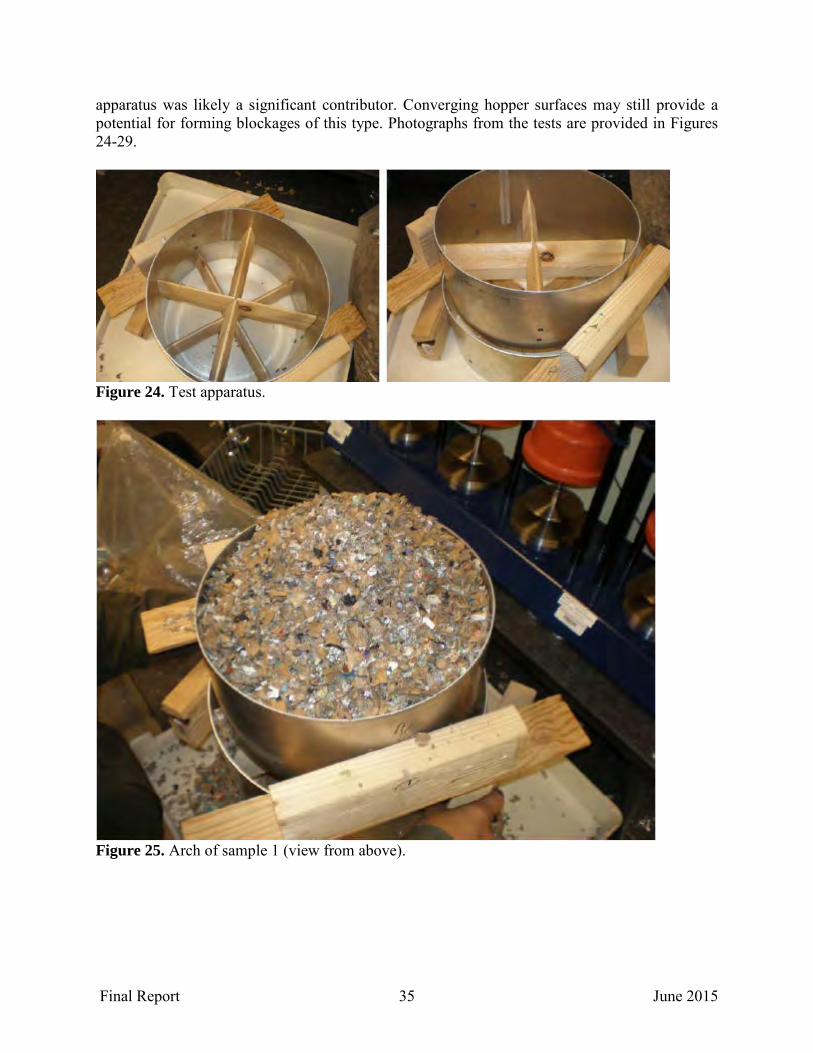
5 RESULTS AND DISCUSSION 5.1 Material Flow Characterization 5.1.1 Shredded Waste Material Flow Characterization The following subsections summarize results of shredded waste material flow characterization. Complete data sets supporting the summation are provided in Appendix A1. 5.1.1.1 Cohesive Strength Tests Testing revealed that the shredded MSW is cohesive and has the ability to form stable ratholes if stored in a funnel flow vessel. In addition to this “no flow” problem, funnel flow can cause erratic flow, exacerbate segregation, reduce the live capacity of the vessel, allow particle degradation (i.e. caking) in stagnant regions, and induce high loads on the structure and downstream equipment due to collapsing ratholes and eccentric flow channels. The minimum recommended outlet diameter (DF) to avoid a rathole in a funnel flow vessel, assuming a 5-foot effective head, is six feet for shredded waste 1 and 3, and seven feed for shredded waste 4. This data indicates that a mass flow vessel is required. In this type of vessel one would anticipate first-in-first-out flow, elimination of ratholes and the accompanying stagnant material, and minimization of segregation effects. To achieve mass flow, sizing of the outlet such that it is large enough to prevent arching is necessary. The minimum recommended outlet diameters to avoid cohesive arch in a mass flow bin are 0.3 feet for shredded waste 1 and 3, and 0.9 feet for shredded waste 4. 5.1.1.2 Particle Interlocking Tests Each sample of shredded waste was placed in a vessel comprised of two cylinders, each equipped with two sets of crossbeams. Figure 23 is a schematic of the test vessel. The apparatus was then slowly lifted, allowing the material to discharge from the bottom.

Final Report 34 June 2015
Figure 23. Particle interlock test apparatus schematic. Each sample tested arched in the apparatus to some degree, with shredded waste 1 having the strongest blockage (entire apparatus was arched), shredded waste 4 having a more moderate blockage (three quarters of the apparatus was arched), and shredded waste 3 having the weakest blockage (one quarter of the apparatus was arched). Note that, although these results imply concerns with particle interlocking, the use of simulated gas injection cross-beams in the test
Final Report 35 June 2015
apparatus was likely a significant contributor. Converging hopper surfaces may still provide a potential for forming blockages of this type. Photographs from the tests are provided in Figures 24-29.
Figure 24. Test apparatus.
Figure 25. Arch of sample 1 (view from above).

Final Report 36 June 2015
Figure 26. Arch of sample 1 (view from below).
Figure 27. Unstable arch of sample 3 (view from above).

Final Report 37 June 2015
Figure 28. Arch of sample 4 (view from above).
Figure 29. Arch of sample 4 (view from below).

Final Report 38 June 2015
5.1.1.3 Compressibility Tests The bulk density of most bulk solids varies with consolidating pressure. Consideration must be given to using the proper value for such calculations as vessel loads, vessel capacities, and feed density. The ranges of densities measured are given in Table 8. Table 8. Density ranges for test materials.
Material Measured Range, pcf Shredded Waste 1 11.2 – 27.5 Shredded Waste 3 13.6 – 35.6 Shredded Waste 4 8.5 – 27.1 5.1.1.4 Wall Friction Tests In addition to a properly sized outlet, the design of a mass flow vessel must consider hopper wall angles, materials of construction, and surface finish. The hopper walls must be steep enough and have sufficiently low friction to allow the material to flow along them. Wall friction angles were determined on the wall materials listed in Table 9. As an example of the test results, if a conical hopper with a one-foot diameter opening were lined or fabricated using polished refractory, the corresponding wall angles would be the maximum recommended for mass flow to occur. Table 9. Wall friction angles for test materials.
Material Maximum recommended mass flow wall angles1,2,3 (from vertical), continuous flow
Shredded Waste 1 None4 Shredded Waste 3 4 degrees Shredded Waste 4 None 1 – Hoppers with elongated outlets require significantly less steep angles than conical hoppers (typically 1o to 12 degrees less steep). 2 – Coupons provided by MSW Power Corp. 3 – The maximum recommended wall angle may vary, depending on outlet size. The angles specified here apply only for the outlet size stated as an example. 4 – Flow along the walls is questionable at any angle. 5.1.1.5 Permeability Test An outlet must be sized not only to prevent arching, but also to achieve the required discharge rate. Fine powders or materials containing significant fines often exhibit a rate limitation not experienced with coarse materials that readily allow air to pass through them. In addition, the gas injection area of a process vessel must be sufficiently large in order to prevent localized fluidization of the material (which could result in channeling and other non-uniform behaviors within the vessel). A permeability test was run to measure superficial gas velocity as a function of bulk density, as well as to calculate critical steady-state discharge rates. The gas permeability factor of a given bulk solid, K, is defined by Darcy’s law as follows:

Final Report 39 June 2015
𝐾𝐾 = −𝑢𝑢𝑢𝑢/(𝑑𝑑𝑑𝑑𝑑𝑑𝑑𝑑
) Where: u = superficial gas velocity through the bed of solids dp/dx = gas pressure gradient across the bed of bulk solids γ = bulk density of the bed of solids In the permeability test procedure, a constant gas pressure gradient is maintained across the bed of solids, as the bulk density is varied and the resulting superficial gas velocity is measured. The permeability test was conducted at room temperature conditions using air. From the test results, a relationship between the gas permeability factor (K) and the bulk density (γ) is obtained as follows:
𝐾𝐾 = 𝐾𝐾0(𝑢𝑢𝑢𝑢0
)−𝑎𝑎
Where: K0 = value of K at major consolidation pressure γ0 = value of γ at major consolidation pressure a = constant in gas permeation relation Bulk solids with low permeability will have low K0 values. The permeability test results are summarized in Table 10. In addition, the permeability test results can be used to calculate the critical steady solids discharge rates for a mass flow bin with a given outlet size and effective head. As an example of the test results, the critical steady solids discharge rate is tabulated below for mass flow cone with a one foot diameter outlet with a cylinder containing a five foot effective head of fully deaerated material. Table 10. Permeability test results.
Material K0, fps Critical steady solids flow rate, tph Shredded Waste 1 1.82 54 Shredded Waste 3 4.00 79 Shredded Waste 4 1.18 10 5.1.2 Char Ash Material Flow Characterization The following subsections summarize results of char ash material flow characterization. Complete data sets supporting the summation are provided in Appendix A2. 5.1.2.1 Cohesive Strength Tests Testing was performed as previously described for shredded waste. Testing indicated that the char ash is cohesive and has the ability to form a stable rathole if stored in a funnel flow bin. In addition to this “no flow” problem, funnel flow can cause erratic flow, exacerbate segregation, reduce the live capacity of the vessel, allow particle degradation in stagnant regions, and induce high loads on the structure and downstream equipment due to collapsing ratholes and eccentric
Final Report 40 June 2015
flow channels. Fine powders such as this material will flood if the rathole collapses or fresh material is added to the vessel. The minimum recommended outlet diameter to avoid a rathole in funnel flow is 2.1 ft, assuming a 2.5. ft effective head. The material should therefore be handled in a mass flow bin, which provides a first-in-first-out flow sequence, eliminates ratholes and the accompanying stagnant material, and minimizes segregation effects. One of the requirements for achieving mass flow is to size the outlet large enough to prevent arching. The minimum recommended outlet diameter to avoid a cohesive arch in a mass flow bin for continuous flow is 0.2 ft. 5.1.2.2 Compressibility Test The bulk density of most bulk solids varies with consolidating pressure. Consideration must be given to using the proper value for such calculations as vessel loads, vessel capacities, and feed density. Bulk density values measured ranged from a minimum (unconsolidated) density of 22.9 pcf to 30.9 pcf over a range of consolidating pressures. 5.1.2.3 Wall Friction Tests In addition to a properly sized outlet, the design of a mass flow vessel must consider the hopper wall angles, materials of construction, and surface finish. The hopper walls must be steep enough and have sufficiently low friction to allow the material to flow along them. It was found that within the pressures used in the test, if a mass flow vessel were lined or fabricated using polished refractory, flow of the material along the walls of the vessel would questionable at any angle. 5.1.2.4 Permeability Test An outlet must be sized not only to prevent arching, but also to achieve the required discharge rate. Fine powders or materials containing significant fines often exhibit a rate limitation not experienced with coarse materials that readily allow air to pass through them. A permeability test was run to determine critical steady-state discharge rates. As an example of the test results, if a mass flow cone with a 0.5 ft diameter outlet were used with a cylinder containing a 2.5 ft effective head of fully deaerated material, the critical discharge rate would be approximately 0.04 tons per hour. 5.2 Experimentation Paper/Cardboard Testing Initial Test Results – 2/2014-3/2014 Initial testing demonstrated that, in general, the highest producer gas energy corresponds to the case where secondary air is injected just below the pyrolysis zone and the gas temperatures are highest in the region 5 to 10 inches below the gasifier inlet. This is the result of more complete combustion of the pyrolysis vapors by oxygen, generating carbon dioxide and water, which in turn produce carbon monoxide and hydrogen through the Boudouard, water gas, and water gas shift reactions. Figure 30 shows the gasifier temperature profiles at the time of the GC measurements on 02/26/2014. The positions of secondary air injection are also shown. The (3,

Final Report 41 June 2015
3, 0) secondary air configuration gave one of the highest producer gas energies in the initial test series. The first number is the quantity of secondary air, in cfm, injected through the ring of injection ports nearest the gasifier inlet (2.5 inches); the second number corresponds to the next (second) ring of injection ports; and the last figure corresponds to the third ring (7.5 inches) The temperatures at 21.25”, near the exit of the gasifier, are 695°C (968K) and 733°C (1006K), and compare favorably to the equilibrium adiabatic temperature of 968K for the paper/cardboard waste stream. The producer gas energies for the 02/26/2014 test run ranged from 58% to 80% of the theoretical equilibrium adiabatic result. For the two test runs of 03/03/2014 and 03/06/2014, air was injected into a tube placed across the width of the gasifier through two holes of diameter 0.094 inches (2.38 mm) facing downward in the direction of the gasifier exit. Secondary air was also injected through some of the sidewall injection ports. This flow configuration allowed secondary air not only to react with the waste around the periphery of the gasifier, but also in the center of the gasifier, increasing the gasification efficiency and the producer gas energy. In the test of 03/03/2014, the secondary air injection tube was located at the third ring position (7.5 inches from the gasifier inlet), while for the tests of 03/06/2014, the tube was placed at the second ring position (5.0 inches from the gasifier inlet). The producer gas flow rate and waste flow rates were 20 cfm and 10 lb/hr, respectively for the two tests. The producer gas energies ranged from 64 to 75% of the theoretical equilibrium result.
Figure 30. Gasifier temperature profiles at time of GC readings on 2/26/2014 for paper/cardboard waste.
Test Results – 4/2014-5/2014 Testing during this timeframe was aimed largely at investigating the effects of varying waste feed rates and producer gas flow rates. The producer gas energy content typically ranged from
0
5
10
15
20
25
600 700 800 900
Dis
tanc
e fr
om G
asifi
er In
let,
inch
es
Temperature, oC
Gasifier Temperature Profiles
3, 3, 0
0, 3, 3
Secondary Air Nozzles

Final Report 42 June 2015
approximately 100 to 130 BTU/ft3. These tests often demonstrated a smaller difference in temperature between the top of the reactor and the bottom of the reactor, which lends to a temperature profile that does not promote reduction reactions. This could mean that fresh material is falling too quickly through the reactor without being converted or that there isn’t enough char left in the reactor to promote the endothermic reduction reactions. The tests also show large amounts of nitrogen in the GC analysis which could be a result of excess air passing through the reactor without the equivalent amount of waste input being added to keep it in the appropriate range. Figure 31 shows the gasifier temperature profiles at the time of the GC readings on 04/25/2014. Secondary air (0, 3, 3) was injected at the 5.0” and 7.5” gasifier locations. The temperatures at the 21.25” position were 1003°K and 1041°K, a little higher than the theoretical equilibrium adiabatic temperature of 968oK. The producer gas energies of 130 BTU/ft3 on 04/25/2014 were 78% of the theoretical equilibrium value of 167 BTU/ft3. For the months of April and May 2014, the measured producer energies ranged from 42% to 78% of the theoretical equilibrium adiabatic result.
Figure 31. Gasifier temperature profiles at time of GC readings on 4/25/2014 for paper/cardboard waste.
Test Results – 6/2014 The purpose of this set of tests was to attempt to maintain consistent solid waste flow rates while varying the producer gas flowrate and keeping the ratio of primary to secondary air consistent. This set of tests was also the last before moving towards mixed waste streams. The first set of
0
5
10
15
20
25
600 650 700 750 800 850
Dis
tanc
e fr
om G
asifi
er In
let,
inch
es
Temperature, oC
Gasifier Temperature Profiles
GC1 (0,3,3)
GC2 (0,3,3)
Secondary AirNozzles

Final Report 43 June 2015
tests demonstrated higher temperatures but lower producer gas flow energy contents compared to the earlier test runs. The second set resulted in a much more ideal temperature profile but the producer gas flow energy content was low largely due to a large amount of nitrogen. As mentioned previously, it appears that a large amount of air could potentially be passing through the reactor without enough waste being reacted to keep the nitrogen content lower. Figure 32 shows the gasifier temperature profiles at the time of the GC readings for 06/06/2014. The highest producer gas energy corresponded to a producer gas flow rate of 20 cfm and an adiabatic gas temperature of 980K (707°C), close to the theoretical value of 968K. The producer gas energies ranged from 52% to 72% of the theoretical equilibrium adiabatic result.
Figure 32. Gasifier temperature profiles at time of GC readings on 6/25/2014 for paper/cardboard waste. The diverging rectangular configuration that opens in the direction of the solids flow resulted in bulk solids mass flow. This configuration enabled uniform velocity of the moving solids across any given cross-section without any regions of stagnant flow. Thus the first objective of the test plan was met. Analysis of the test results in Tables 11 and 12 shows there is no preferred secondary air configuration that optimizes the producer gas energy. For example, the following secondary air configurations gave producer gas energies in the range 100 to 135 BTU/ft3:
• Nine air injection configurations with air injection in the two rings closest to the gasifier inlet (2.5 and 5 inches).
• Nine configurations with air injection in the lower two rings (5 and 7.5 inches). • One configuration with air injection in all three rings (2.5, 5 and 7.5 inches).
0
5
10
15
20
25
550 600 650 700 750 800
Dis
tanc
ee fr
om G
asifi
er In
let,
inch
es
Temperature, oC
Gasifier Temperature Profiles Solid Waste Mass Flow: 16 lbs/hr
14 scfm; 2.3, 2.3, 0
17 scfm; 2.8, 2.8, 0
20 scfm; 3.3, 3.3, 0
Secondary Air Nozzles
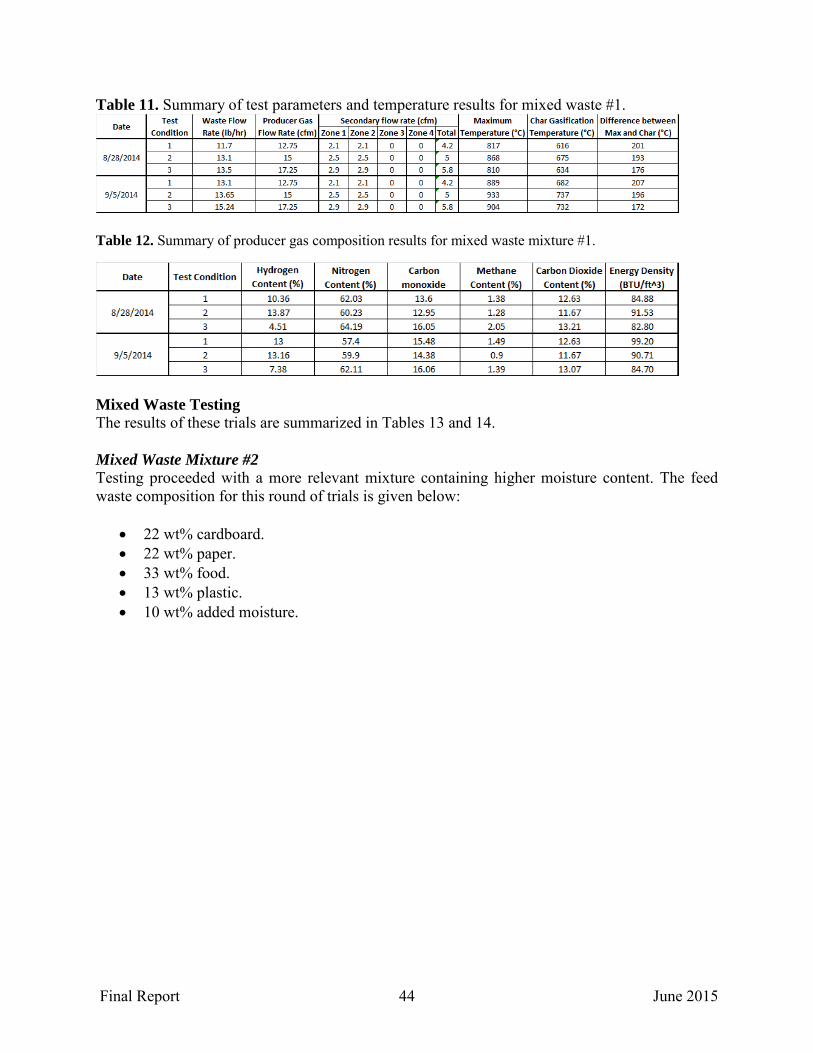
Final Report 44 June 2015
Table 11. Summary of test parameters and temperature results for mixed waste #1.
Table 12. Summary of producer gas composition results for mixed waste mixture #1.
Mixed Waste Testing The results of these trials are summarized in Tables 13 and 14. Mixed Waste Mixture #2 Testing proceeded with a more relevant mixture containing higher moisture content. The feed waste composition for this round of trials is given below:
• 22 wt% cardboard. • 22 wt% paper. • 33 wt% food. • 13 wt% plastic. • 10 wt% added moisture.
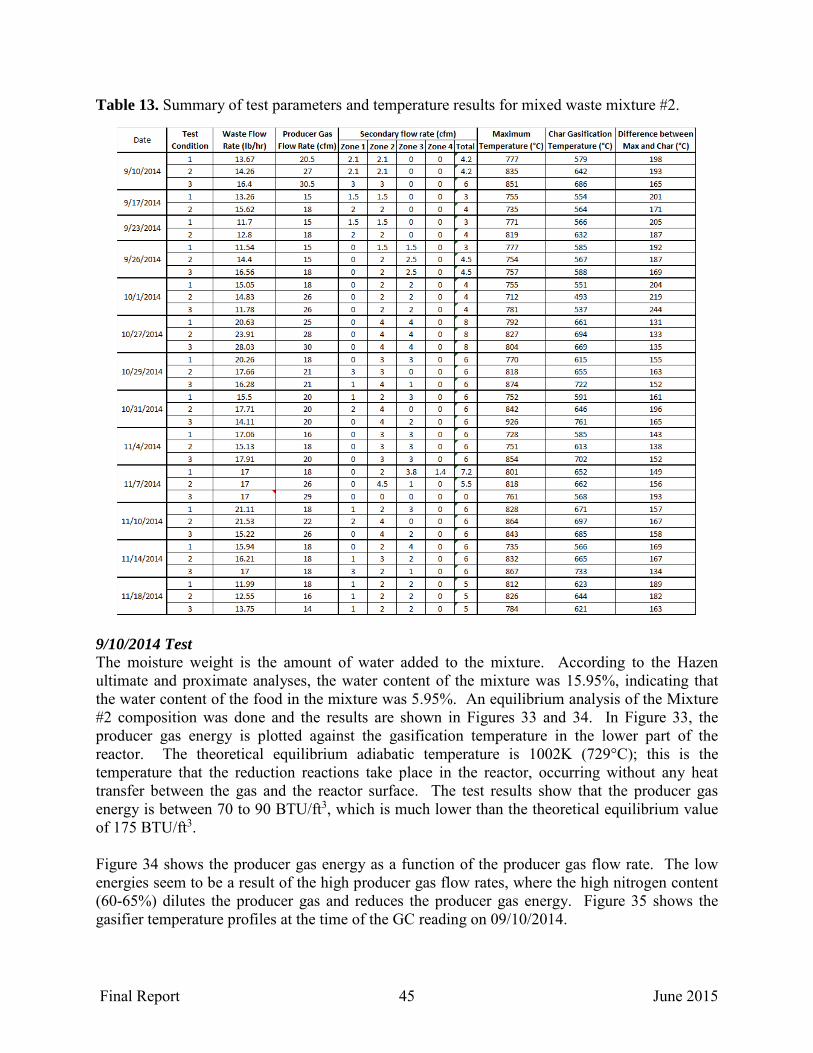
Final Report 45 June 2015
Table 13. Summary of test parameters and temperature results for mixed waste mixture #2.
9/10/2014 Test The moisture weight is the amount of water added to the mixture. According to the Hazen ultimate and proximate analyses, the water content of the mixture was 15.95%, indicating that the water content of the food in the mixture was 5.95%. An equilibrium analysis of the Mixture #2 composition was done and the results are shown in Figures 33 and 34. In Figure 33, the producer gas energy is plotted against the gasification temperature in the lower part of the reactor. The theoretical equilibrium adiabatic temperature is 1002K (729°C); this is the temperature that the reduction reactions take place in the reactor, occurring without any heat transfer between the gas and the reactor surface. The test results show that the producer gas energy is between 70 to 90 BTU/ft3, which is much lower than the theoretical equilibrium value of 175 BTU/ft3. Figure 34 shows the producer gas energy as a function of the producer gas flow rate. The low energies seem to be a result of the high producer gas flow rates, where the high nitrogen content (60-65%) dilutes the producer gas and reduces the producer gas energy. Figure 35 shows the gasifier temperature profiles at the time of the GC reading on 09/10/2014.

Final Report 46 June 2015
The results for the remainder of the tests with the mixed waste mixture #2, were generally similar to the results of the tests of 09/10/2014. The producer gas energies for the mixed waste mixtures were consistently lower than the energies for the paper/cardboard waste. Table 14. Summary of producer gas composition results for mixed waste mixture #2.
Date Test Condition Hydrogen Nitrogen monoxide Methane carbon Dioxide Energy Density
Content(%) Content (%) content(%) Content(%) Content(%) (BTU/ft"3)
1 10.65 63.65 12.9 0.81 11.99 78.22
9/10/ 2014 2 9.8 65.01 10.81 1.06 13.33 71.44
3 11.83 60.69 14.41 1.27 11.79 90.53
9/17/ 2014 1 9.95 63.63 11.73 1.41 13.28 78.01
2 7.02 66.4 9 11.13 1.54 13.83 69.20
9/ 23/ 2014 1 7.51 66.7 1 11.67 1.13 12.97 68.55
2 7.35 66.5 12.52 1.27 12.37 72.12
1 8.2 63.5·6 16.57 0.89 10.78 84.03
9/ 26/ 2014 2 6.16 65.13 15.93 1.22 11.57 79.37
3 6 65.94 14.73 0.78 12.55 71.05
1 8.78 64.17 13.02 1 13.03 75.20
10/ 1/2014 2 7.09 62.32 16.2 2.32 12.07 92.84
3 7.3 63.93 16.89 1.79 10.09 90.80
1 8.24 59.8;6 19.69 1.24 10.96 97.38
10/ 27/ 2014 2 6.93 61.&'9 18.24 1.3 11.64 89.66
3 10.45 58.&8 17.32 1.6 11.74 99.12
1 20.34 52.01 14.34 1.51 11.81 115.90
10/ 29/ 2014 2 3.61 63.8.3 16.86 1.86 13.84 81.20
3 8.91 60.27 15.8.8 1.31 13.62 87.60
1 14.41 54.2 18.24 1.67 11.49 113.61
10/ 31/2014 2 11.67 57.9 16.06 1.67 12.7 99.05
3 10 59.31 18.41 0.94 11.33 95.36
1 9.26 58.66 18.77 1.7 11.61 101.43
11/4/ 2014 2 11.9 57.68 19.02 1.33 10.07 106.11
3 3.96 62.69 19.77 1.42 12.17 87.51
1 8.22 60.01 20.28 1.21 10.28 98.95
11/7/ 2014 2 7.79 61.52 16.78 1.73 12.18 91.25
3 13.07 59.17 16.23 1.01 10.52 97.42
1 6.07 61.28 19.67 1.06 11.93 89.71
11/10/ 2014 2 9.48 60.27 17.38 1.31 11.57 93.99
3 5.96 59.9 20.12 1.77 12.25 97.34
1 6.08 58.44 22.24 2.09 11.15 107.41
11/14/ 2014 2 6.74 62.8.1 16.93 1.06 12.46 82.73
3 9.77 60.26 15.71 1.56 12.7 91.70
1 7.09 60.32 19.62 1.32 11.64 94.73
11/18/ 2014 2 11.56 58.75 16.97 1.31 11.41 98.39
3 12.33 59.63 15.33 1.2 11.51 94.23
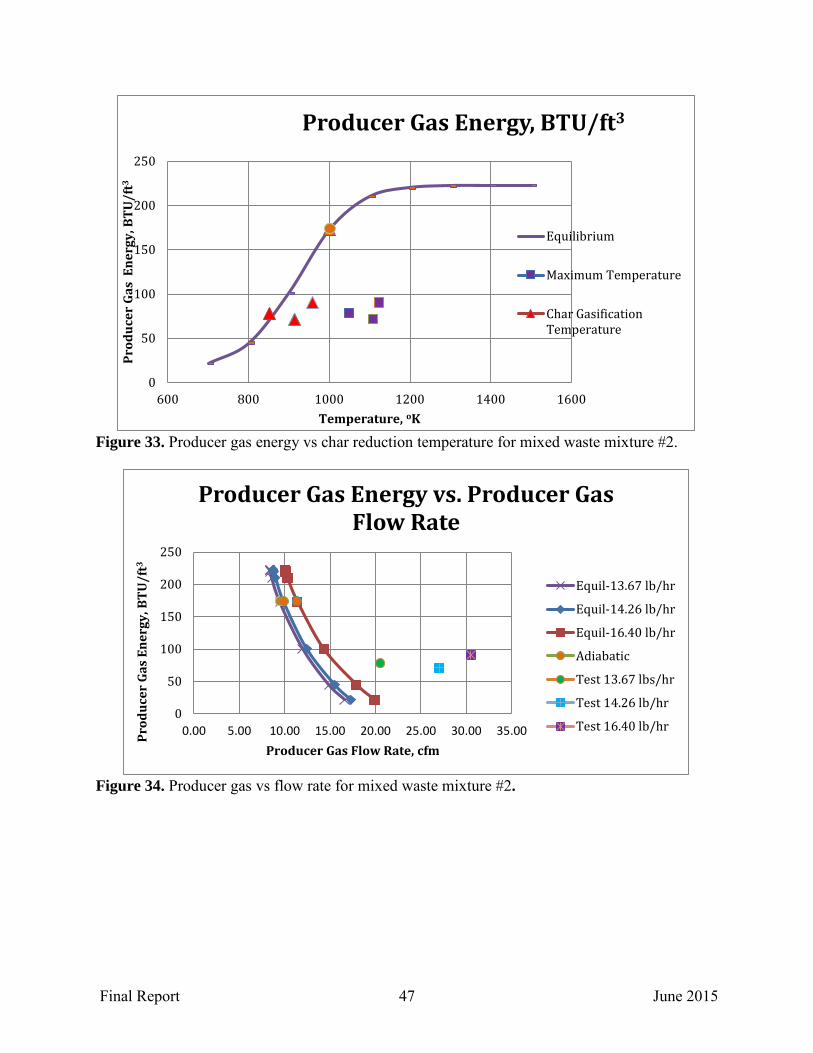
Final Report 47 June 2015
Figure 33. Producer gas energy vs char reduction temperature for mixed waste mixture #2.
Figure 34. Producer gas vs flow rate for mixed waste mixture #2.
0
50
100
150
200
250
600 800 1000 1200 1400 1600
Prod
ucer
Gas
Ene
rgy,
BTU
/ft3
Temperature, oK
Producer Gas Energy, BTU/ft3
Equilibrium
Maximum Temperature
Char GasificationTemperature
0
50
100
150
200
250
0.00 5.00 10.00 15.00 20.00 25.00 30.00 35.00Prod
ucer
Gas
Ene
rgy,
BTU
/ft3
Producer Gas Flow Rate, cfm
Producer Gas Energy vs. Producer Gas Flow Rate
Equil-13.67 lb/hr
Equil-14.26 lb/hr
Equil-16.40 lb/hr
Adiabatic
Test 13.67 lbs/hr
Test 14.26 lb/hr
Test 16.40 lb/hr
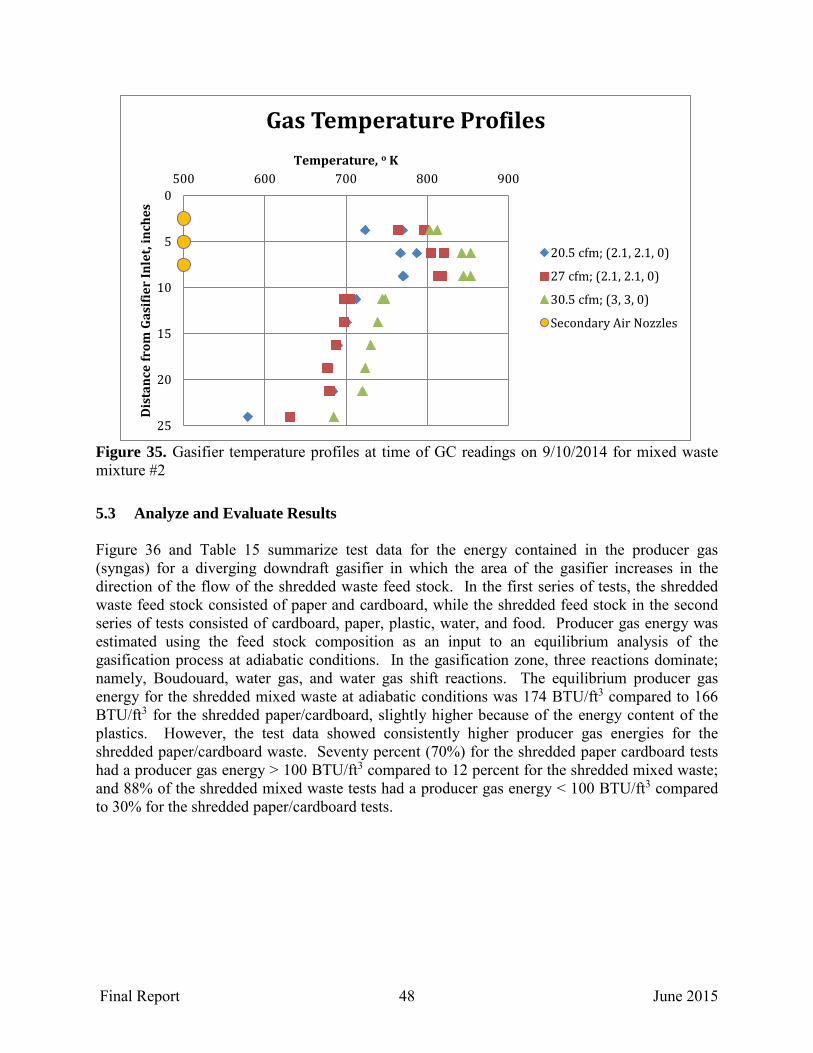
Final Report 48 June 2015
Figure 35. Gasifier temperature profiles at time of GC readings on 9/10/2014 for mixed waste mixture #2 5.3 Analyze and Evaluate Results Figure 36 and Table 15 summarize test data for the energy contained in the producer gas (syngas) for a diverging downdraft gasifier in which the area of the gasifier increases in the direction of the flow of the shredded waste feed stock. In the first series of tests, the shredded waste feed stock consisted of paper and cardboard, while the shredded feed stock in the second series of tests consisted of cardboard, paper, plastic, water, and food. Producer gas energy was estimated using the feed stock composition as an input to an equilibrium analysis of the gasification process at adiabatic conditions. In the gasification zone, three reactions dominate; namely, Boudouard, water gas, and water gas shift reactions. The equilibrium producer gas energy for the shredded mixed waste at adiabatic conditions was 174 BTU/ft3 compared to 166 BTU/ft3 for the shredded paper/cardboard, slightly higher because of the energy content of the plastics. However, the test data showed consistently higher producer gas energies for the shredded paper/cardboard waste. Seventy percent (70%) for the shredded paper cardboard tests had a producer gas energy > 100 BTU/ft3 compared to 12 percent for the shredded mixed waste; and 88% of the shredded mixed waste tests had a producer gas energy < 100 BTU/ft3 compared to 30% for the shredded paper/cardboard tests.
0
5
10
15
20
25
500 600 700 800 900
Dis
tanc
e fr
om G
asifi
er In
let,
inch
esTemperature, o K
Gas Temperature Profiles
20.5 cfm; (2.1, 2.1, 0)
27 cfm; (2.1, 2.1, 0)
30.5 cfm; (3, 3, 0)
Secondary Air Nozzles

Final Report 49 June 2015
Figure 36. Summary of test data for gasification trials using shredded paper/cardboard and mixed waste mixtures. Table 15. Summary of producer gas energy results. Producer Gas Energy, BTU/ft3 Test Series 1
Shredded Paper/Cardboard Number in Range (% Total)
Test Series 2 Shredded Mixed Waste
Number in Range (% Total) Total Test Runs 33 42 >100 23 (69.7) 5 (11.9) 100-110 7 3 110-120 6 2 120-130 4 - 130-140 6 - <100 10 (30.3) 37 (88.1) 90-100 6 20 80-90 4 10 70-80 - 7 Equilibrium Adiabatic 167 BTU/ft3 174 BTU/ft3 Secondary air is required to combust the pyrolysis gas to form CO2 and H2O, which then reacts with char in the gasification zone (below the pyrolysis zone) to form CO and H2, the primary energy constituents of the producer gas. In the diverging downdraft gasifier, the secondary air is injected in the pyrolysis zone normal to the direction of the solid waste mass flow. For high conversion efficiency, the secondary air must penetrate to the center of the gasifier, reacting with

Final Report 50 June 2015
as much of the waste in the pyrolysis zone as possible to produce an active char in the gasification zone. The test results could be attributed to the higher resistance (lower permeability) of the shredded mixed waste to secondary air flow in the pyrolysis zone as compared to the paper/cardboard shredded waste. For example, at comparable producer gas and shredded waste flow rates (20 cfm, 18 lbs/hr), the pressure drop across the reactor (top inlet – bottom outlet) for mixed shredded waste is 46.5 WC versus 6.4 WC for paper/cardboard shredded waste, a factor of 7.3 times the differential pressure, indicating higher resistance and lower permeability for the mixed shredded waste. The calculated flow resistances for the paper/cardboard and mixed waste are 366 sec/m and 2672 sec/m, respectively; the permeabilities are 2.73*10-3 m/sec and 3.74*10-4 m/sec, respectively. SolidWorks flow simulation analyses showed for the range of flow resistances used in the test program the secondary air never penetrated to the center of the gasifier. The secondary air penetrated further into the center of the gasifier for the shredded paper/cardboard waste compared to the mixed waste. To achieve high conversion efficiency, secondary air flow should react with the shredded waste throughout the cross section of the gasifier and not only near the gasifier walls. This is suggested by the two shredded paper/cardboard tests in which secondary air was not only injected around the periphery of the gasifier, but in the center of the gasifier through a single injection tube placed across the width of the gasifier. Another way to achieve high conversion efficiency is to insert crossbeams in and across the pyrolysis section of the diverging reactor that are tapered in the flow direction. The crossbeams would contain flow annuli for effective injection of the secondary air in a high pressure drop environment without causing the bulk solids to be hung up in the reactor. Construction materials for the tapered crossbeams should not be an issue because of the relatively low temperatures (about 400°F) in the pyrolysis region. Additionally, locating the annulus at the top of the reactor and at the lower temperatures decreases the concern of sagging due to the weight of material above it at a high temperature. The grate opening should be large enough to avoid blockages due to the formation of stable, cohesive arches, as well as “mechanical arches” caused by interlocking of larger particles over the grate opening. The diverging tapered gasifier design resulted in bulk solids mass flow without any regions of stagnant flow in the gasifier due to bridging or arching. This configuration enabled uniform velocity of the moving solids across any given cross-section without any regions of stagnant flow. The data also showed that there is no preferred secondary air configuration that optimized the producer gas energy, just as long as secondary air injection is within the pyrolysis zone. This results in more complete combustion of the pyrolysis vapors by oxygen, generating carbon dioxide and water, which in turn produces carbon monoxide and hydrogen through the Boudouard, water gas and water gas shift reactions.
Final Report 51 June 2015
6 CONCLUSIONS AND IMPLICATIONS FOR FUTURE RESEARCH/IMPLEMENTATION
6.1 Scale-Up of Shredded Waste Gasifier Table 16 shows a comparison of the shredded waste and pelletized waste gasifier configurations. The first column shows the various properties of the shredded waste and inverted rectangular gasifier configuration for the laboratory tests performed during this effort. The second column shows the configuration of the GEM gasifier developed by MSW Power and used at Edwards AFB and the Plymouth County Correctional Facility in Plymouth MA with waste pellets. Many of the design parameters are based on this system. The third column is the inverted rectangular configuration scaled-up to 200 lb/hr of shredded waste, the design point for the SERDP shredded waste-to-energy system. The major differences between the GEM and the shredded waste gasifier configurations are the following: • Density of the waste at the top of the gasifier. • Area of the GEM decreases towards the bottom of the gasifier while the area of the shredded
waste gasifier increases. With regards to the position, number and diameter of the secondary air nozzles, it is recommended to use three secondary air rings and place the nozzles in the same relative configuration as in smaller lab gasifier. The first ring should be about 5.4 inches from the top of the gasifier, the second ring about 10.9 inches, and the third ring about 16.4 inches. On each ring, three nozzles should be placed on each of the long sides and one nozzle on each of the short sides. In looking over the test runs, the maximum secondary air injection was 9 scfm with two rings, or about 40% of the total syngas. For 1/8” diameter nozzles, the velocity through each nozzle is 55 ft/sec. For the large gasifier, the secondary air through the wall nozzles should be about 50% of the total, or 65 scfm. For a nozzle diameter of 1/8” inch, the same number of nozzles per ring and for secondary air injection through two rings, the nozzle velocity is about 800 ft/sec, or about 14.5 times the secondary velocity of the smaller gasifier. This should promote better penetration of the secondary air into the center of the gasifier. For a high conversion efficiency, the secondary air should react with the shredded waste throughout the cross-section of the gasifier, and not only near the gasifier walls. One way to accomplish this is to insert crossbeams in and across the pyrolysis section of the diverging reactor that are tapered in the flow direction. The cross beams should be placed just above the first ring of nozzles, or about 4.5 inches from the top of the gasifier. The flow annuli on the cross beams should be placed within a region of about half the length of each cross beam, which is approximately the penetration depth of the secondary air injected through the walls of the gasifier. For the scaled up configuration, the annuli should be placed within 3.5 inches of the center of the 14” cross beam and within 5.25 inches of the center of the 21” cross beam. It is suggested that the system use 4 annuli in each cross beam with a total flow capacity of about 60-70 cfm. Rather than having a high velocity for penetration, as with the side nozzles, the annuli
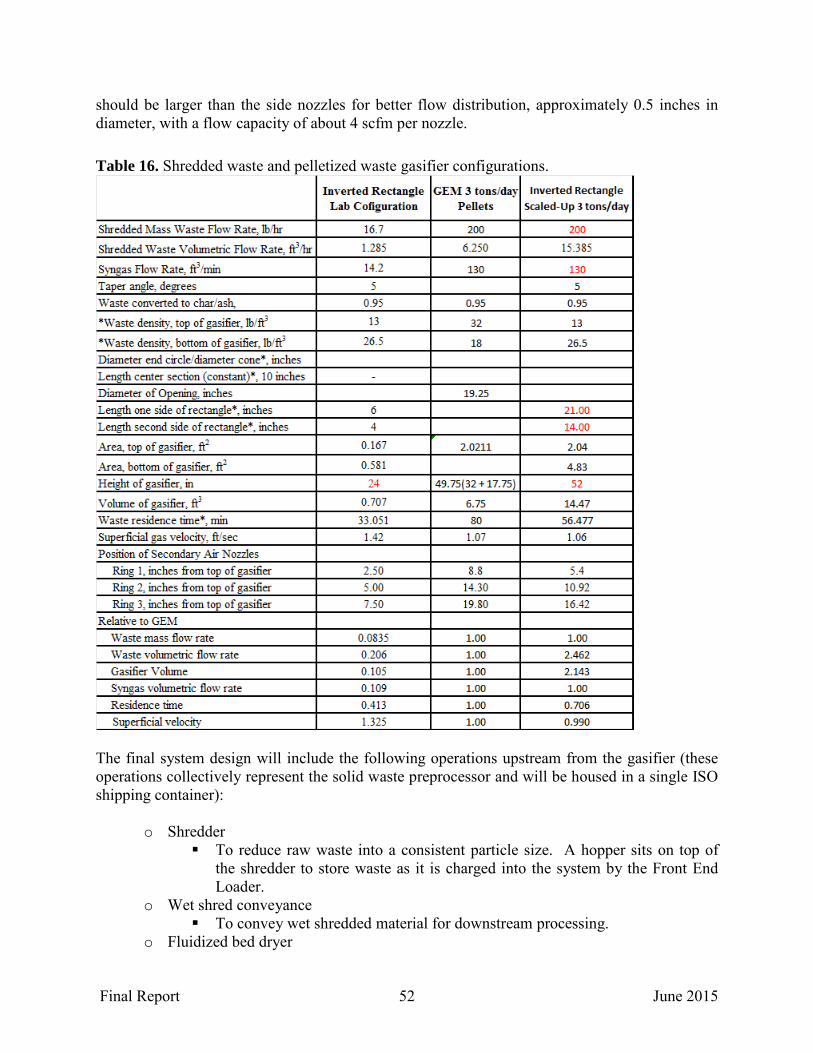
Final Report 52 June 2015
should be larger than the side nozzles for better flow distribution, approximately 0.5 inches in diameter, with a flow capacity of about 4 scfm per nozzle. Table 16. Shredded waste and pelletized waste gasifier configurations.
The final system design will include the following operations upstream from the gasifier (these operations collectively represent the solid waste preprocessor and will be housed in a single ISO shipping container):
o Shredder To reduce raw waste into a consistent particle size. A hopper sits on top of
the shredder to store waste as it is charged into the system by the Front End Loader.
o Wet shred conveyance To convey wet shredded material for downstream processing.
o Fluidized bed dryer
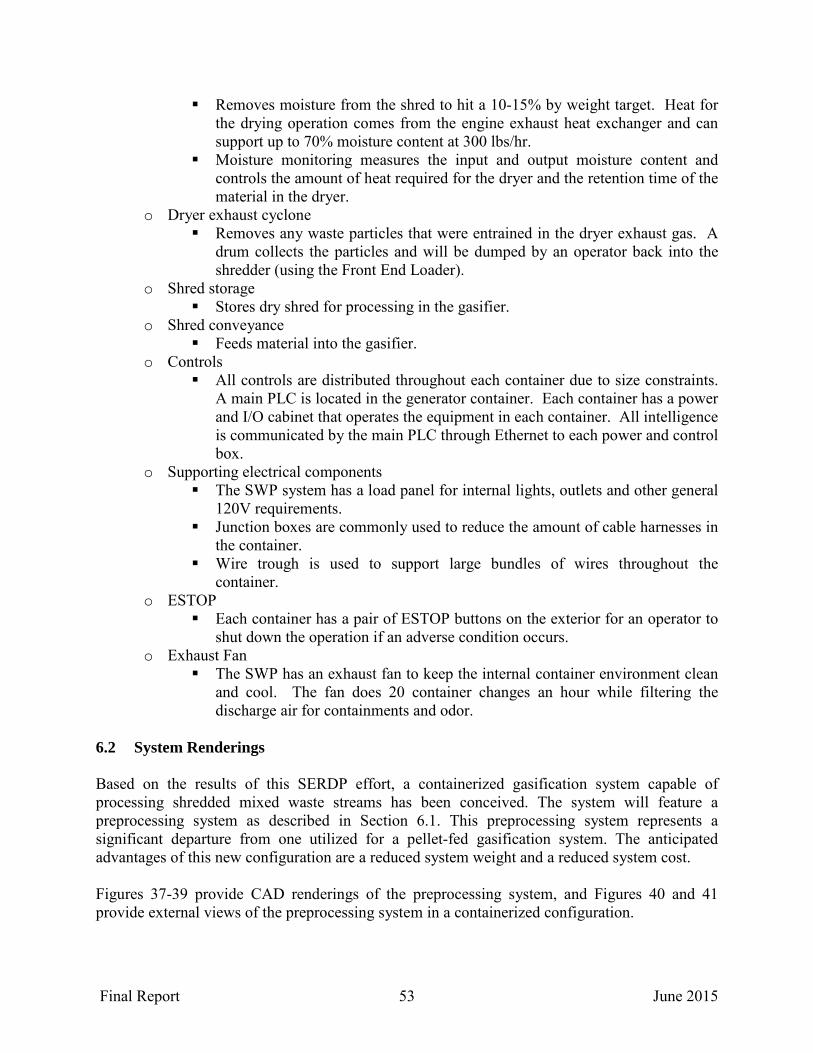
Final Report 53 June 2015
Removes moisture from the shred to hit a 10-15% by weight target. Heat for the drying operation comes from the engine exhaust heat exchanger and can support up to 70% moisture content at 300 lbs/hr.
Moisture monitoring measures the input and output moisture content and controls the amount of heat required for the dryer and the retention time of the material in the dryer.
o Dryer exhaust cyclone Removes any waste particles that were entrained in the dryer exhaust gas. A
drum collects the particles and will be dumped by an operator back into the shredder (using the Front End Loader).
o Shred storage Stores dry shred for processing in the gasifier.
o Shred conveyance Feeds material into the gasifier.
o Controls All controls are distributed throughout each container due to size constraints.
A main PLC is located in the generator container. Each container has a power and I/O cabinet that operates the equipment in each container. All intelligence is communicated by the main PLC through Ethernet to each power and control box.
o Supporting electrical components The SWP system has a load panel for internal lights, outlets and other general
120V requirements. Junction boxes are commonly used to reduce the amount of cable harnesses in
the container. Wire trough is used to support large bundles of wires throughout the
container. o ESTOP
Each container has a pair of ESTOP buttons on the exterior for an operator to shut down the operation if an adverse condition occurs.
o Exhaust Fan The SWP has an exhaust fan to keep the internal container environment clean
and cool. The fan does 20 container changes an hour while filtering the discharge air for containments and odor.
6.2 System Renderings Based on the results of this SERDP effort, a containerized gasification system capable of processing shredded mixed waste streams has been conceived. The system will feature a preprocessing system as described in Section 6.1. This preprocessing system represents a significant departure from one utilized for a pellet-fed gasification system. The anticipated advantages of this new configuration are a reduced system weight and a reduced system cost. Figures 37-39 provide CAD renderings of the preprocessing system, and Figures 40 and 41 provide external views of the preprocessing system in a containerized configuration.
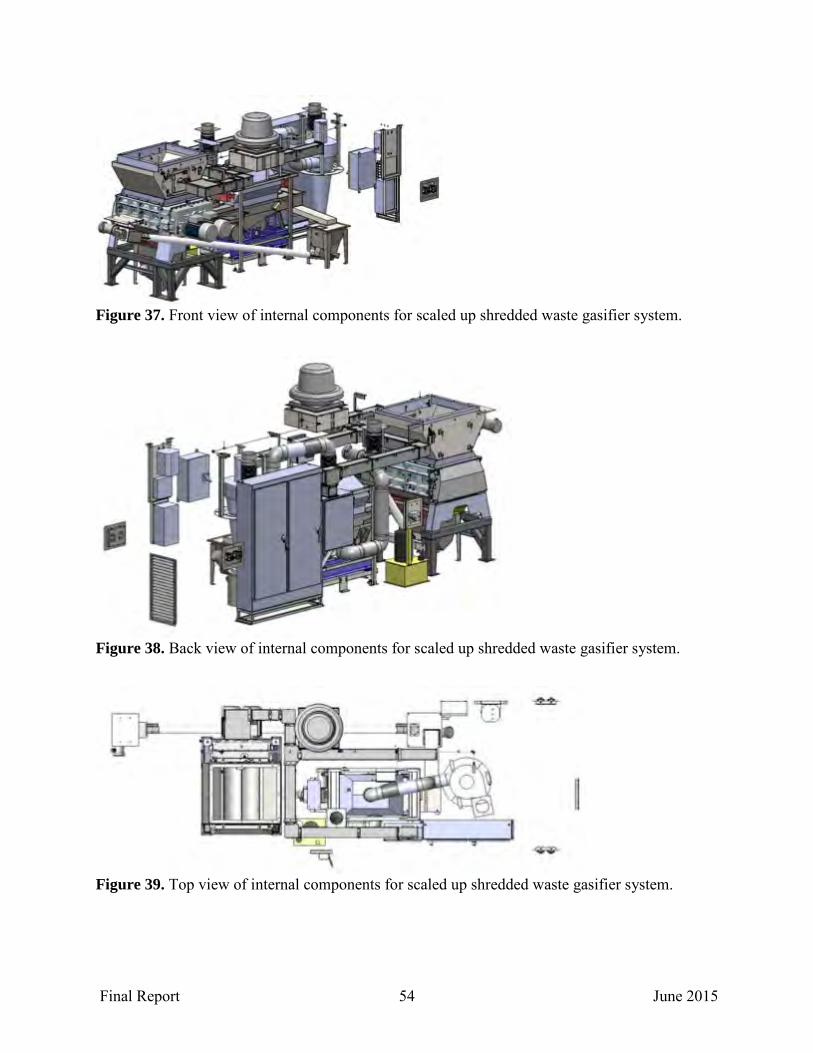
Final Report 54 June 2015
Figure 37. Front view of internal components for scaled up shredded waste gasifier system.
Figure 38. Back view of internal components for scaled up shredded waste gasifier system.
Figure 39. Top view of internal components for scaled up shredded waste gasifier system.
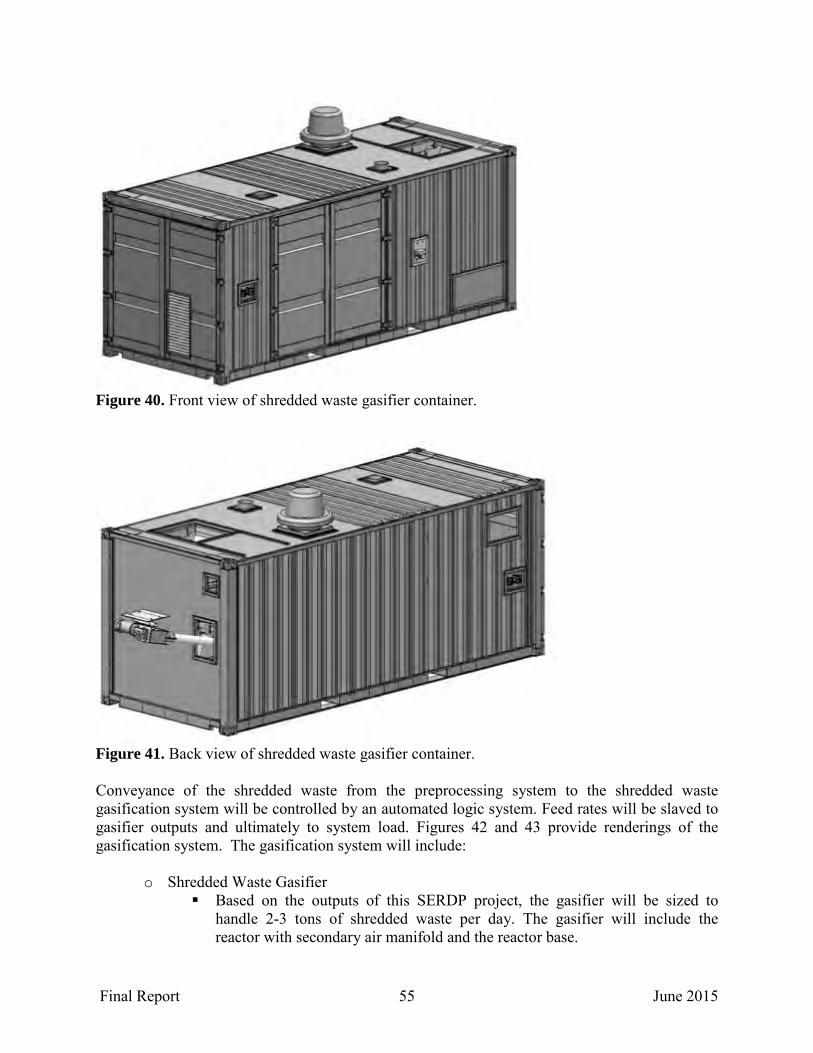
Final Report 55 June 2015
Figure 40. Front view of shredded waste gasifier container.
Figure 41. Back view of shredded waste gasifier container. Conveyance of the shredded waste from the preprocessing system to the shredded waste gasification system will be controlled by an automated logic system. Feed rates will be slaved to gasifier outputs and ultimately to system load. Figures 42 and 43 provide renderings of the gasification system. The gasification system will include:
o Shredded Waste Gasifier Based on the outputs of this SERDP project, the gasifier will be sized to
handle 2-3 tons of shredded waste per day. The gasifier will include the reactor with secondary air manifold and the reactor base.
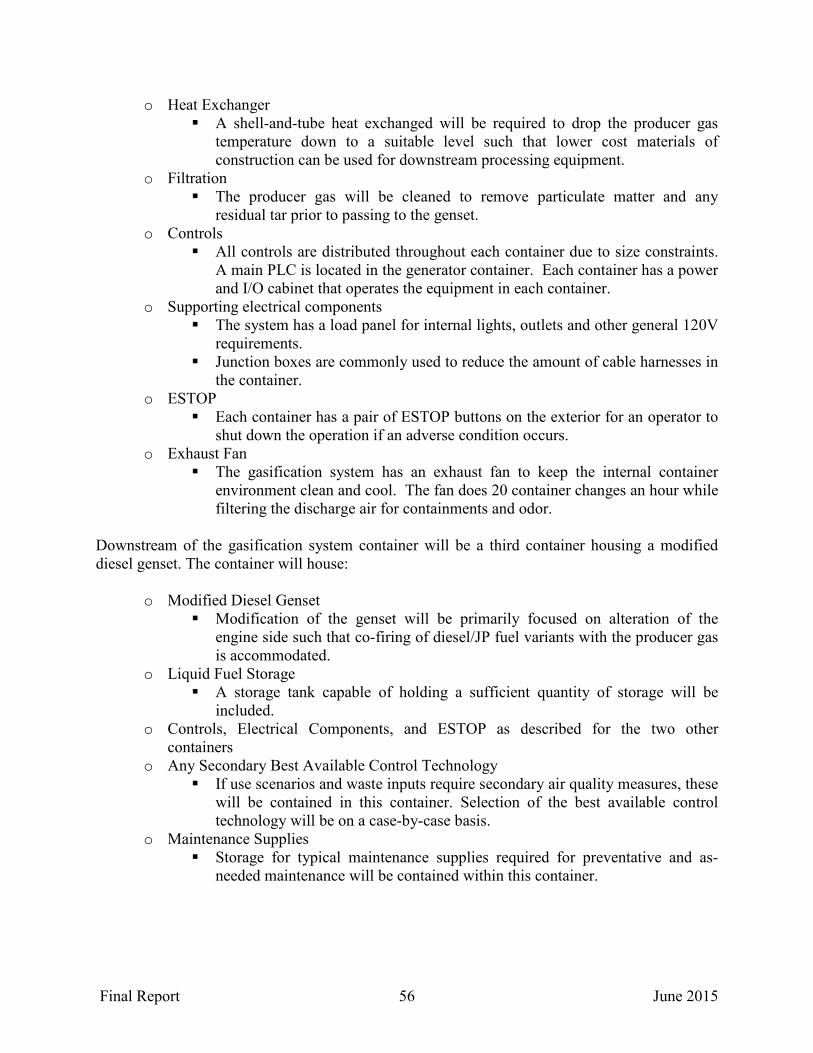
Final Report 56 June 2015
o Heat Exchanger A shell-and-tube heat exchanged will be required to drop the producer gas
temperature down to a suitable level such that lower cost materials of construction can be used for downstream processing equipment.
o Filtration The producer gas will be cleaned to remove particulate matter and any
residual tar prior to passing to the genset. o Controls
All controls are distributed throughout each container due to size constraints. A main PLC is located in the generator container. Each container has a power and I/O cabinet that operates the equipment in each container.
o Supporting electrical components The system has a load panel for internal lights, outlets and other general 120V
requirements. Junction boxes are commonly used to reduce the amount of cable harnesses in
the container. o ESTOP
Each container has a pair of ESTOP buttons on the exterior for an operator to shut down the operation if an adverse condition occurs.
o Exhaust Fan The gasification system has an exhaust fan to keep the internal container
environment clean and cool. The fan does 20 container changes an hour while filtering the discharge air for containments and odor.
Downstream of the gasification system container will be a third container housing a modified diesel genset. The container will house:
o Modified Diesel Genset Modification of the genset will be primarily focused on alteration of the
engine side such that co-firing of diesel/JP fuel variants with the producer gas is accommodated.
o Liquid Fuel Storage A storage tank capable of holding a sufficient quantity of storage will be
included. o Controls, Electrical Components, and ESTOP as described for the two other
containers o Any Secondary Best Available Control Technology
If use scenarios and waste inputs require secondary air quality measures, these will be contained in this container. Selection of the best available control technology will be on a case-by-case basis.
o Maintenance Supplies Storage for typical maintenance supplies required for preventative and as-
needed maintenance will be contained within this container.
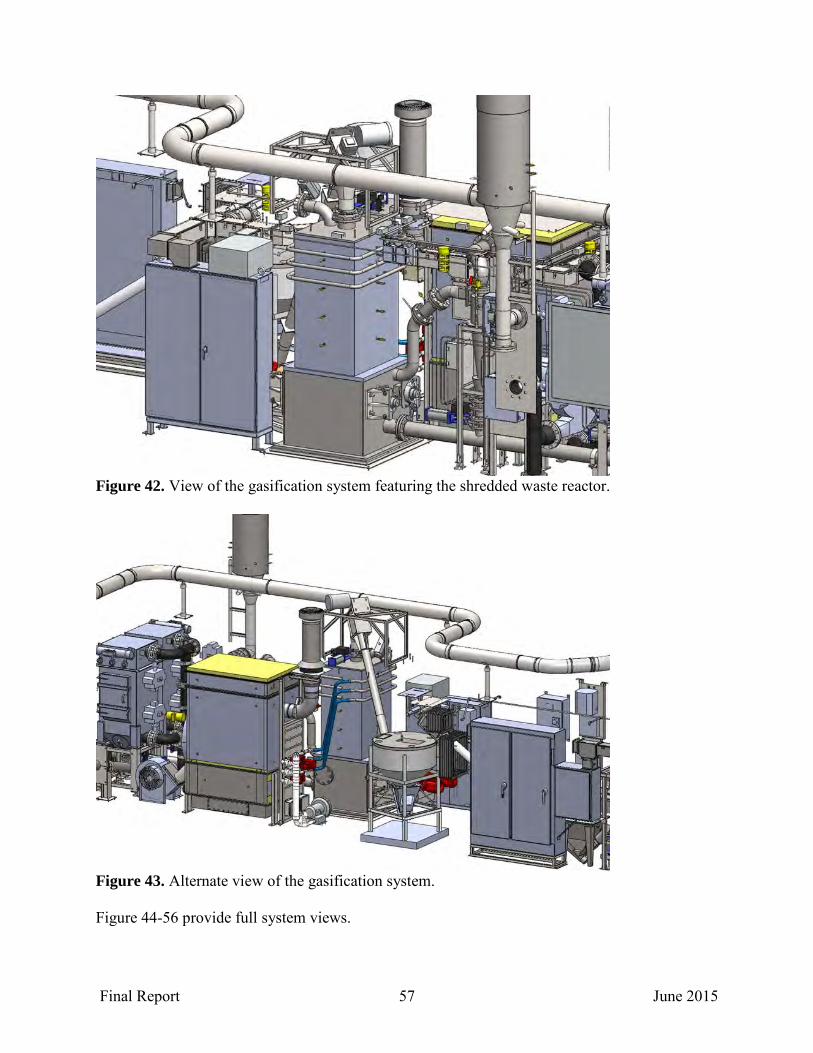
Final Report 57 June 2015
Figure 42. View of the gasification system featuring the shredded waste reactor.
Figure 43. Alternate view of the gasification system. Figure 44-56 provide full system views.
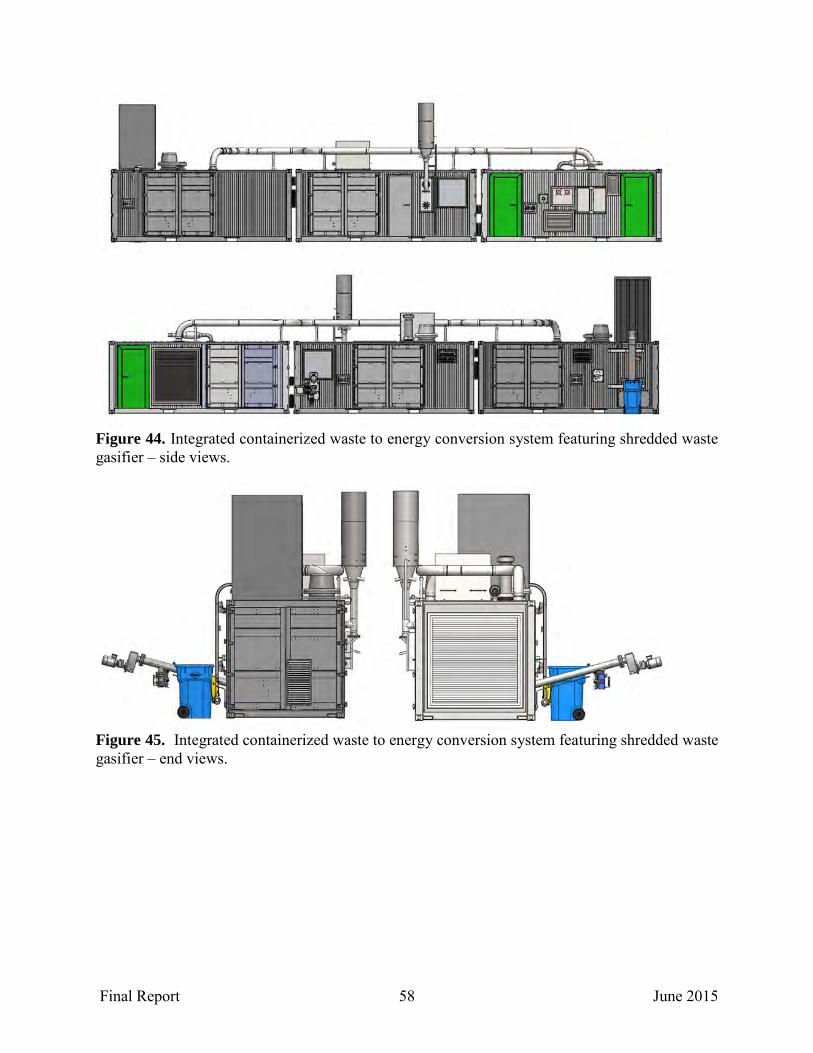
Final Report 58 June 2015
Figure 44. Integrated containerized waste to energy conversion system featuring shredded waste gasifier – side views.
Figure 45. Integrated containerized waste to energy conversion system featuring shredded waste gasifier – end views.
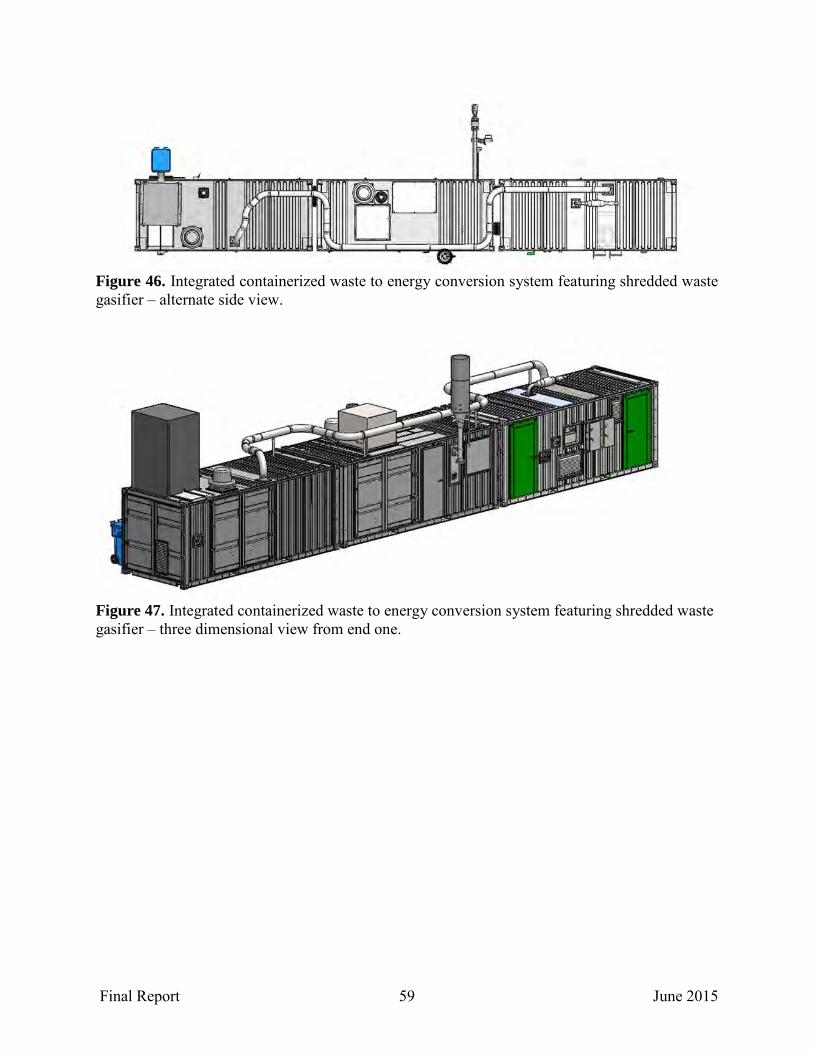
Final Report 59 June 2015
Figure 46. Integrated containerized waste to energy conversion system featuring shredded waste gasifier – alternate side view.
Figure 47. Integrated containerized waste to energy conversion system featuring shredded waste gasifier – three dimensional view from end one.

Final Report 60 June 2015
Figure 48. Integrated containerized waste to energy conversion system featuring shredded waste gasifier – three dimensional view from end two.
Figure 49. Integrated containerized waste to energy conversion system featuring shredded waste gasifier – three dimensional view from end two, alternate side.
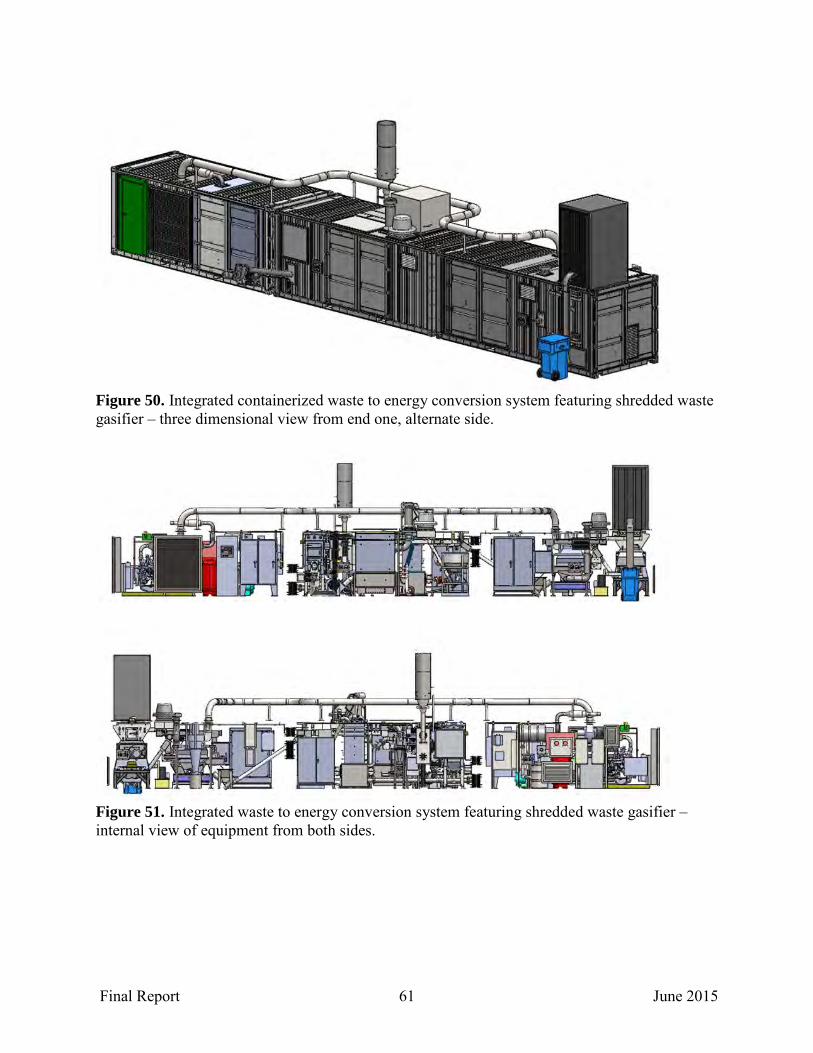
Final Report 61 June 2015
Figure 50. Integrated containerized waste to energy conversion system featuring shredded waste gasifier – three dimensional view from end one, alternate side.
Figure 51. Integrated waste to energy conversion system featuring shredded waste gasifier – internal view of equipment from both sides.
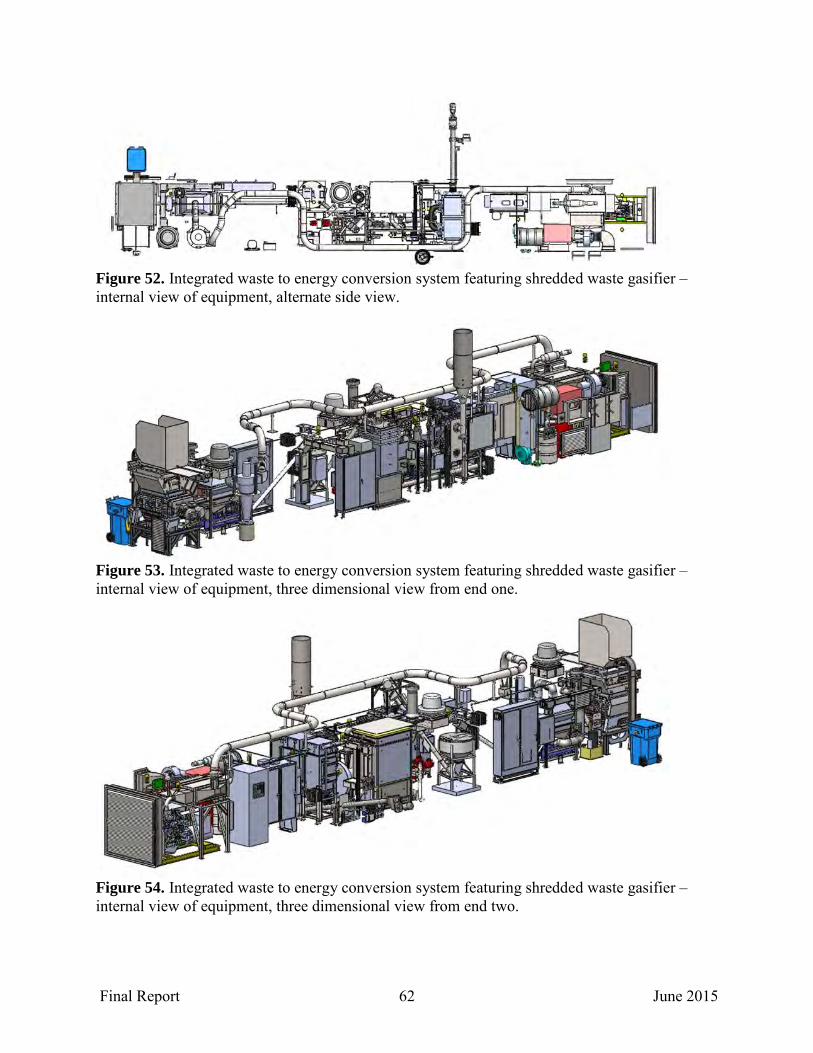
Final Report 62 June 2015
Figure 52. Integrated waste to energy conversion system featuring shredded waste gasifier – internal view of equipment, alternate side view.
Figure 53. Integrated waste to energy conversion system featuring shredded waste gasifier – internal view of equipment, three dimensional view from end one.
Figure 54. Integrated waste to energy conversion system featuring shredded waste gasifier – internal view of equipment, three dimensional view from end two.

Final Report 63 June 2015
Figure 55. Integrated waste to energy conversion system featuring shredded waste gasifier – internal view of equipment, three dimensional view from end two, other side.
Figure 56. Integrated waste to energy conversion system featuring shredded waste gasifier – internal view of equipment, three dimensional view from end one, other side.
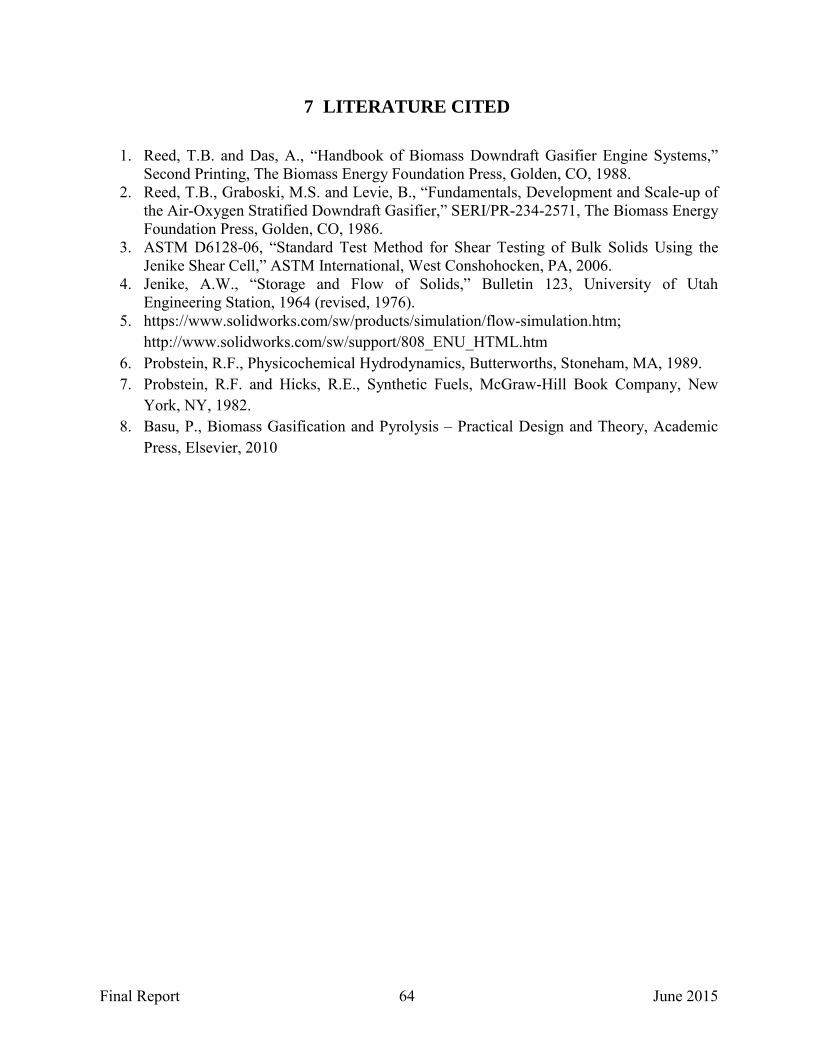
Final Report 64 June 2015
7 LITERATURE CITED
1. Reed, T.B. and Das, A., “Handbook of Biomass Downdraft Gasifier Engine Systems,” Second Printing, The Biomass Energy Foundation Press, Golden, CO, 1988.
2. Reed, T.B., Graboski, M.S. and Levie, B., “Fundamentals, Development and Scale-up of the Air-Oxygen Stratified Downdraft Gasifier,” SERI/PR-234-2571, The Biomass Energy Foundation Press, Golden, CO, 1986.
3. ASTM D6128-06, “Standard Test Method for Shear Testing of Bulk Solids Using the Jenike Shear Cell,” ASTM International, West Conshohocken, PA, 2006.
4. Jenike, A.W., “Storage and Flow of Solids,” Bulletin 123, University of Utah Engineering Station, 1964 (revised, 1976).
5. https://www.solidworks.com/sw/products/simulation/flow-simulation.htm; http://www.solidworks.com/sw/support/808_ENU_HTML.htm
6. Probstein, R.F., Physicochemical Hydrodynamics, Butterworths, Stoneham, MA, 1989. 7. Probstein, R.F. and Hicks, R.E., Synthetic Fuels, McGraw-Hill Book Company, New
York, NY, 1982. 8. Basu, P., Biomass Gasification and Pyrolysis – Practical Design and Theory, Academic
Press, Elsevier, 2010

Final Report 65 June 2015
APPENDIX A: SUPPORTING DATA

Final Report 66 June 2015
A1 Shredded Waste Material Flow Characterization Data
JENIKE& JOHANSON
SUMMARY OF TESTS PERFORMED
Thi s repor t pr esents vari ous f l ow property test results as i ndi cated f or the f o l lowi ng mater ial (s)
BULK HATERIAL HOI STURE MATERIAL ID# DESCRI PTI ON PARTICLE SIZE CONTENT
1 29 179 Shr edded Waste 1 (20mm 10%mc) 20mm (As Rec'd) As Rec'd 2 29 180 Shr edded Waste 3 (20mm 20 %mc) 20mm (As Rec'd) As Rec'd 3 29 181 Shr edded Waste 4 ( 15mm 10%mc) 15mm (As Rec'd) As Rec'd
BULK TIME TEMPERATURE SIEVE BIN BULK HOPPER CHUTE FLOW OTHER MATERIAL hr deg F ANALYSI S DHI DENSITY ANGLES ANGLES RATE
1 o. o 72 X X X X X
2 o. o 72 X X X X X
3 o. o 72 X X X X X
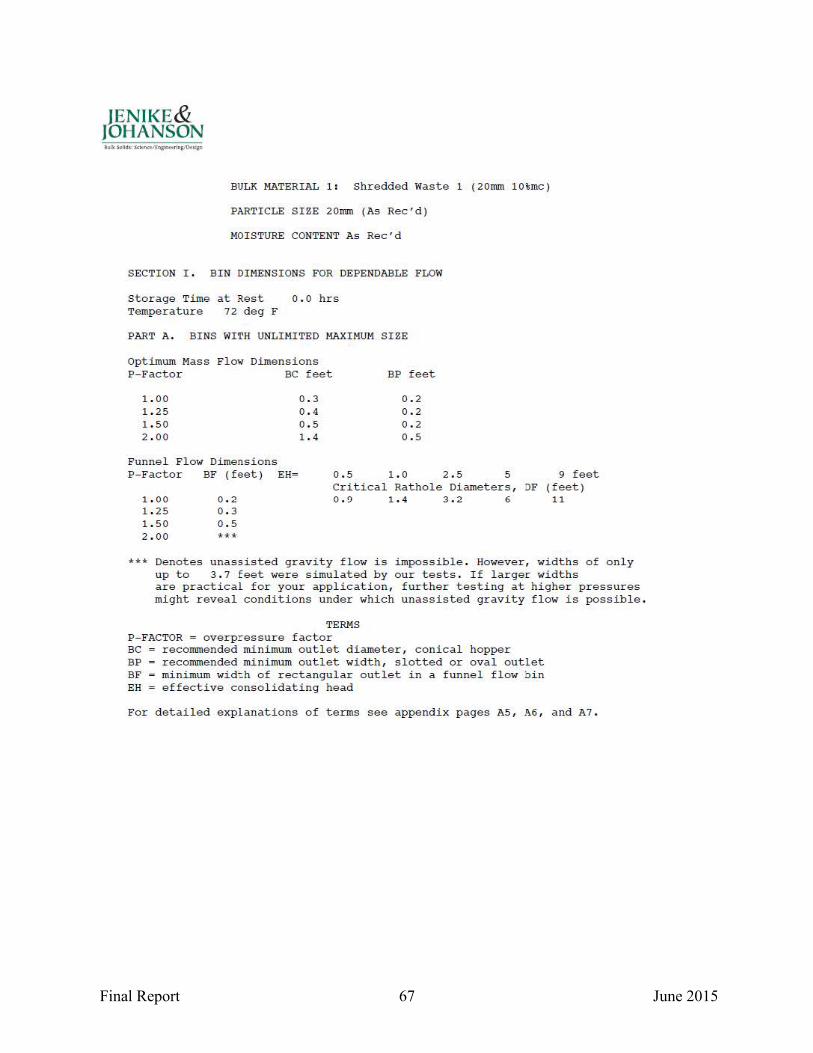
Final Report 67 June 2015
JENIKE& JOHANSON
BULK MATERI AL 1 : Shredded Waste 1 ( 20mm 10tmc)
PARTI CLE SI ZE 20mm (As Rec'd)
HO I STURE CONTENT As Rec'd
SECTION I. BI N DI MENSIONS FOR DEPENDABLE FLOW
Stor age Time at Rest o.o hrs Tempera tur e 72 deg F
PART A. BINS WITH UNLIMI TED MAXHIUM SI ZE
Optimum Mass Flow Di mensi ons P- Factor BC feet
1. 00 1. 25 1. 50 2 . 00
0 . 3 0 . 4 0 .5 1.4
BP f eet
0 . 2 0 . 2 0 . 2 0 . 5
Funne l Flow Di mensi ons P- Factor BF ( feet) EH= 0 .5 1 . 0 2 . 5 5 9 f eet
Cr itica l Rathol e Di ameters, DF ( feet ) 1. 00 0 . 2 o . o 1 . 4 3 . 2 6 11 1.25 0 . 3 1.50 0 .5 2 . 00 ***
*** Denotes unass i sted gravity f l ow i s impossible. However , wi dths of onl y up to 3 . 7 f eet were simul ated by our tests. I f larger wi dths are p r act i cal f or your application, further test ing at hi gher pr essures mi ght r eveal conditions u nder whi ch u na ssis ted g rav i ty f l ow is possibl e .
TERMS P- FACTOR = overpressur e f actor BC recommended min i mum out let diameter , conical hop per BP recommended min i mum out let width, s lotted or ov a l out let BF min i mum wid~h of r ectangul a r outl et i n a funnel f l ow bi n EH e f fec tive consol ida t i ng head
For detai led explanations o f ter ms see ap pendix pages AS, A6, and A7.

Final Report 68 June 2015
JENIKE& JOHANSON
BULK MATERIAL 1: Shredded Wast e 1 (20mm 10%mc )
PARTICLE SI ZE 20mm (As Rec'd)
MOI STURE CONTENT As Rec'd
SECTI ON I I. SOLIDS DENSI TY
TEMPERATURE 72 deg F
BULK DENSITY The b u lk densi ty, GAM}~, i s a f unction o f the ma jor consolida t i ng pr ess ure, SI GMA1, expr esse d in t e rms of e ffect ive head, EH.
EH ( f eet) 0 . 5 1. 0 2 . 5 5 . 0 10 . 0 20 . 0 40 . 0 80. 0
SIGMA1 ( psf ) 6 . 12 . 33 . 72 . 165 . 382 . 894. 2106.
GAM}!A ( pc f ) 11.7 12 . 1 13 . 1 14 . 5 16 . 5 19 .1 22 . 4 26 . 3
COMPRESSI BILITY PARAMETERS
Bul k densit y, G~~. is a f unct i on of the major cons olidat ing p r essur e Si m!A1 , as fo llows:
GAM}!A BET AM
G~~ ( SIGMA1/SIG~I + 1)
For GAMMA between 12 . 8 and 27 . 5 pcf
Mi n i mum bulk density G~~ = 11 . 2 pcf
SIG~I = 26.68 p s f
BETAM = 0 . 19459

Final Report 69 June 2015
JENIKE& JOHANSON
BULK MATERIAL 1 : Shredded Was t e 1 (20rnm 10%mc )
PARTI CLE SI ZE 20mm (As Rec'd)
MO I STURE CONTENT As Rec'd
SECTION III. MAX I MUM HOPPER ANGLES FOR MASS FLOW
WALL MATERIAL: Pol ished Ref ractory STORAGE TIME AT REST 0 . 0 hrs TEMPERATURE 72 deg F
HOPPER ANGLES FOR VARIOUS HOPPER SPANS
Dia o f Cone (feet) 0 . 94 2.00 4.00 8.00 14.93 Width of Oval ( f eet) 0 . 50 1. 07 2 .14 4.27 7.88
SI GMA (psf) 4 . 0 9 . 0 19 . 44 . 95. SI GMA1 (ps f ) 7 . 0 15 . 7 34 . 73. 149.
Wa l l Friction Angl e PHI-PRIME (deg) 38. 38. 37. 36. 33.
Hopper Angles THETA- P (deg ) 11.* 11.* 11.* 12. 16. THETA- C (deg ) 1. * 1.* 1.* 2. 5.
* Flow along wal l s is questionable.

Final Report 70 June 2015
]EN IKE& JOHANSON
BULK MATERI AL 1: Shredded Wast e 1 (20mm 10%mc)
PARTI CLE SI &E 20mm (As Rec'd)
MO I STURE CONTENT As Rec ' d
SECTION I V. CRITI CAL STEADY SOLI DS FLOW RATES I N AI R
TEMPERATURE 72 . 0 de g F
CONICAL MASS FLOio HOPPER
F l ow r a t e e xp ressed in un i t s o f tons/hr.
BC EH = 2 . 5 feet 5. 0 fee·t 10 . 0 f e e t 20 . 0 feet
0 .50 f e e t 8 . 8 7 . 9 7 . 0 6 . 3 0 . 75 f e e t 28 . 25 . 23 . 19. 1. 00 f e e t 61. 54. 4 8 . 43 . 2 . 00 feet 360 . 306 . 270 . 234. 4. 00 f e e t 1980 . 1584. 1296 . 1080 . 8 . 00 f e e t 9720 . 7560 . 594 0 . 4860 .
TRANSI T I ON MASS FLOW HOPPER
F l ow r a t e e xp ressed i n un i t s o f tons/hr per £eet l e ng th o f outl e t.
BP EH = 2 . 5 feet 5 . 0 fee·t
0 . 25 f e e t 7 . 0 6 . 4 0 .50 feet 27 . 25 . 0 . 75 feet 52. 48 . 1. 00 f e e t 82. 73 . 2. 00 feet 234. 198 . 4. 00 f e e t 612. 504. 8 . 00 feet 1530 . 1206 .
TERMS
BC d i ameter o f c i rcul a r outlet BP wi dt h of slot t e d outl et EH eff e c t i v e cons o l i dat i ng h ead
10 . 0 f e et 20 . 0 feet
5. 9 5 . 4 23 . 21. 43 . 3 9. 66 . 5 9 .
171. 1 49 . 4 1 4 . 3 42 . 936 . 774.
40 . 0 f e e t
5 . 7 18 . 37 .
198 . 936 .
4 140 .
40 . 0 feet
4 . 9 19 . 36 . 5 4 .
131. 306 . 648 .
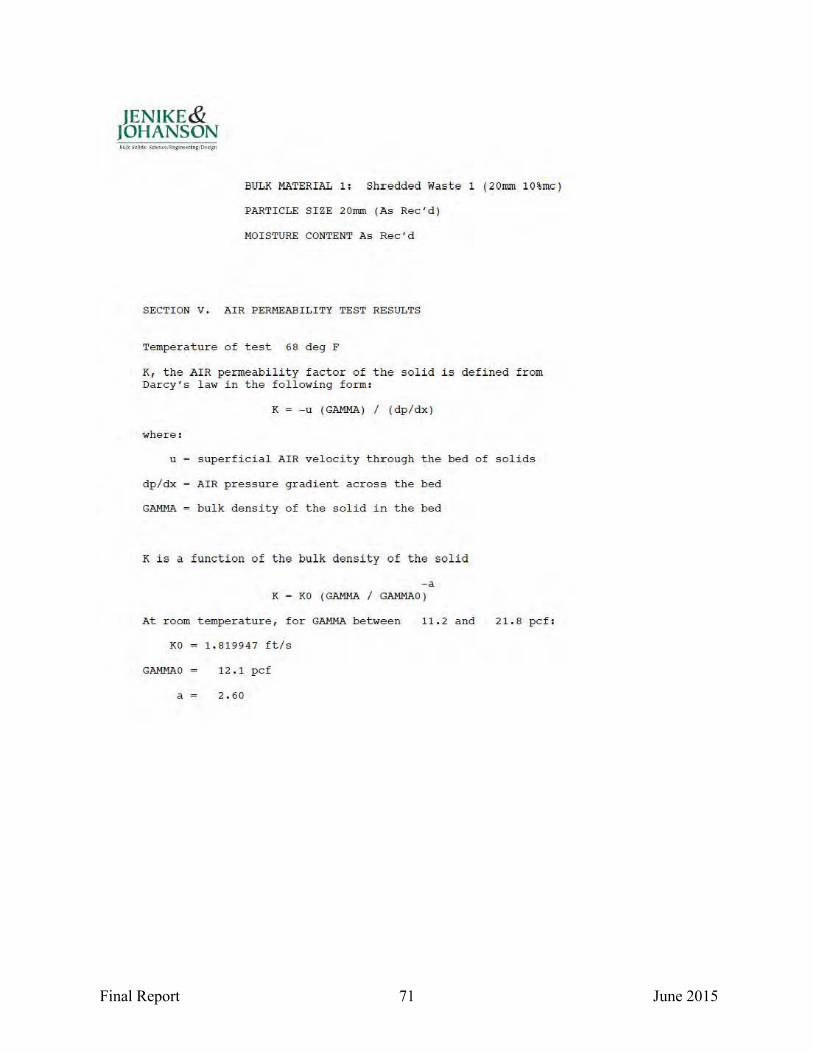
Final Report 71 June 2015
JENIKE& JOHANSON
BULK MATERIAL 1: Shredded Waste 1 ( 20mm 10%rnc)
PARTICLE SIZE 20rnrn (As Rec'd )
HOI STURE CONTENT As Rec'd
SECTION V. AIR PERMEABILITY TEST RESULTS
Temperature of t est 68 deg F
K, the AIR permeability factor of t he solid is defined f r om Dar cy's l aw in the following f or m:
K = - u ( GAMMA) I (dpldx )
where:
u = s uperf i cial AIR velocity through the bed of solids
dpldx AIR pressure gradient across the bed
GAMHA bulk density o f the solid in the bed
K is a functi on o f the bulk density of the solid
-a K = KO ( GAMMA I GAHHAO )
At room temperature , f or GAHHA between 11.2 and
KO 1 . 8 1 9947 ft l s
GAHMAO 12. 1 pc f
a = 2.60
21. 8 pcf:

Final Report 72 June 2015
JENIKE& JOHANSON
BULK MATERI AL 2 : Shredded Wast e 3 ( 20mm 20%mc)
PARTI CLE SI ZE 20mm (As Rec'd)
HO I STURE CONTENT As Rec'd
SECTION I. BI N DIMENSIONS FOR DEPENDABLE FLOW
Stor age Time at Rest o.o hrs Tempera tur e 72 deg F
PART A. BINS WITH UNLIMITED MAXHIUM SI ZE
Optimum Hass Flow Di mensi ons P- Fac tor BC feet
1. 00 1. 25 1. 50 2 . 00
0 . 3 0 . 4 0 . 4 0 . 8
BP f eet
0 . 1 0 .2 0 .2 0 . 3
Funnel Flow Di mensi ons P- Fac tor BF ( f eet) EH= o .s 1 . 0 2 . 5 5 7 f eet
Cr itica l Rathol e Di ameters, DF ( feet ) 1.00 0 . 2 1. 1 1 . 8 3 . 7 6 8 1.25 0 . 3 1. 50 0 . 5 2 . 00 ***
*** Denotes unass i sted gravit y f l ow i s impossibl e . However, wi dths of onl y u p to 3 . 0 f eet were simul ated by ou r tests. I f larger wi dths are p r actical f or your ap p l ication, f urther test ing at hi gher pr essures mi ght r eveal conditions u nd e r whi ch u na ssis ted g rav i ty f l ow is possib l e .
TERHS P- FACTOR = overpr essur e factor BC recommended min i mum out let diameter, conical hop per BP recommended min i mum out let wid th, s lotted or oval out let BF min i mum width of r ectangul a r outl et i n a f unnel f l ow bin EH e f fec tive consol ida t i ng head
For detai led explanations o f ter ms see ap pendix pages AS, A6, and A7 .
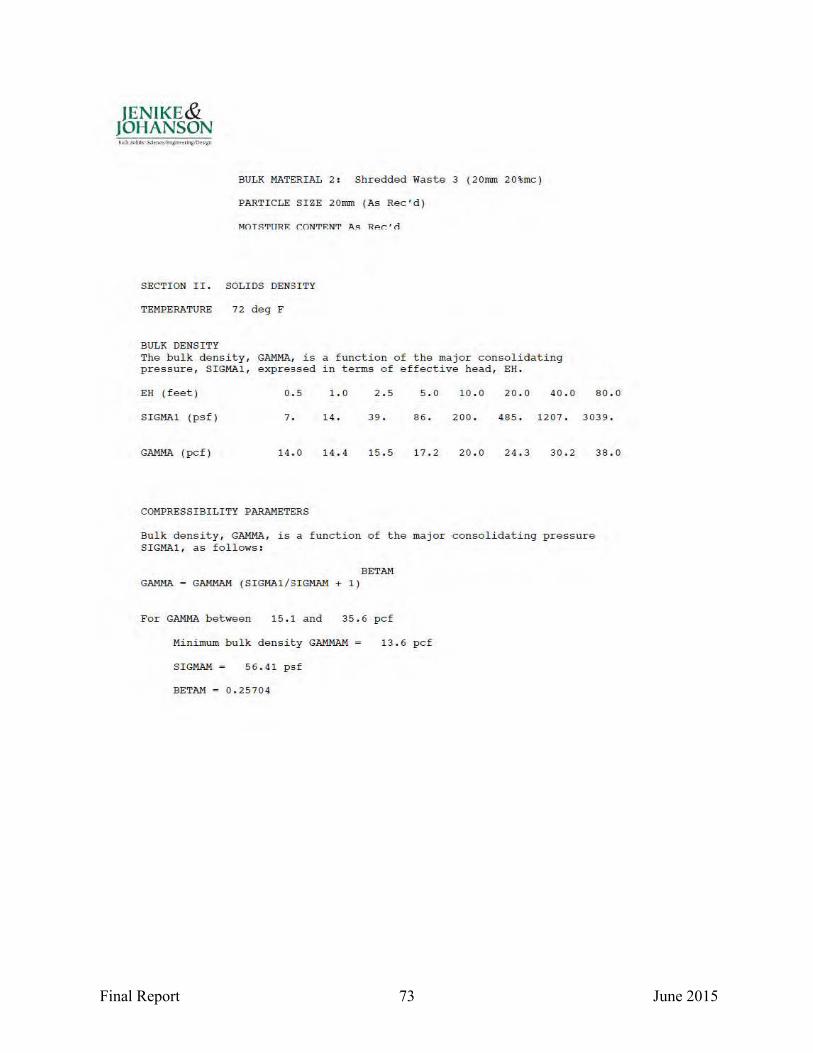
Final Report 73 June 2015
JENIKE& JOHANSON
BULK MATERI AL 2: Shredded Wast e 3 (20mm 20%mc)
PARTICLE SIZE 20mm (As Rec'd)
~IO TS'l'TJRR C.ON'l'RN'l' ..... RAr.' rl
SECTION II . SOLIDS DENSI TY
TEMPERATURE 72 deg F
BULK DENSITY The b u lk densi ty, GAM}th, is a function o f the ma jor consolidating p r essure, SI GMA1, expressed in terms of effect ive head, EH.
EH ( f eet) 0.5 1. 0 2.5 5.0 10.0 20 . 0 40 . 0 80 . 0
SIG~U\1 ( psf ) 7 . 14 . 39. 86. 200 . 485 . 1207. 3039 .
GAM}U\ ( pcf ) 14.0 14 . 4 15.5 17.2 20.0 24.3 30.2 38 . 0
COMPRESSI BILITY PARAMETERS
Bul k densit y, G~U1A, is a f u nction o f the major consolidat ing pressur e SIG~U\1 , as f o llows:
GAM}U\ BET AM
G~U1AM (S I GI1A1/SI GMAH + 1)
For GAMMA b etween 15 .1 and 35 . 6 pcf
Mi n i mum bulk density G~U1AM = 13 . 6 pcf
SIG~1 = 56.41 psf
BETAM = 0 . 25704
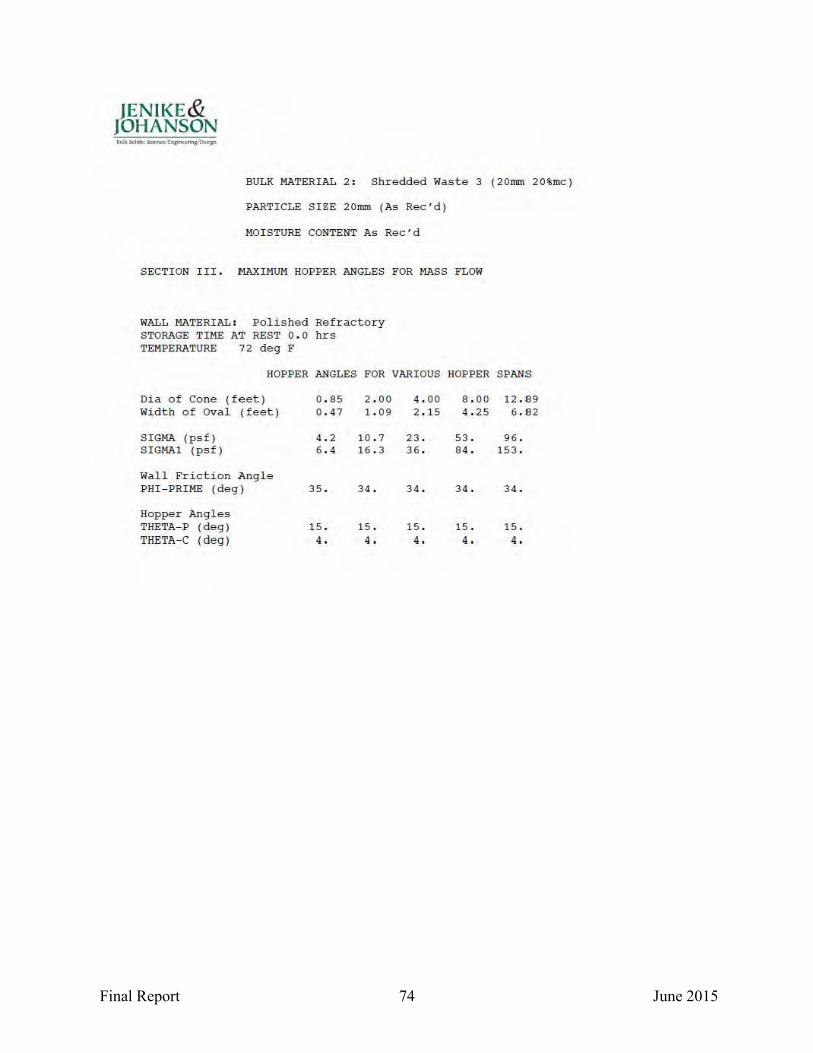
Final Report 74 June 2015
JENIKE& JOHANSON
BULK MATERIAL 2 : Shredded Waste 3 ( 20rnm 20%mc )
PARTICLE SIZE 20mm (As Rec'd)
MOI STURE CONTENT As Rec'd
SECTION III. MAXHIDM HOPPER ANGLES FOR ~lASS FLOW
WALL MATERI AL: Polished Refractory STORAGE TIME AT REST 0.0 hr s TEMPERATURE 72 deg F
HOPPER ANGLES FOR VARIOUS HOPPER SPANS
Dia o f Con e (feet) 0 . 85 2 .00 4 . 00 8 . 0 0 12.89 Width of Oval ( feet) 0 . 47 1. 09 2 .15 4.25 6 .82
s imlA ( psf ) 4 . 2 1 0 . 7 23 . 53. 96 . S IGHA1 (psf ) 6 .4 16 . 3 36 . 84 . 153 .
Wall Fr i ction Angl e PHI- PRIME (deg) 35. 34. 34 . 34 . 34.
Hopper Angles THETA- P ( d eg) 15. 15 . 15 . 15 . 15. THETA- C ( deg) 4. 4 . 4 . 4. 4 .
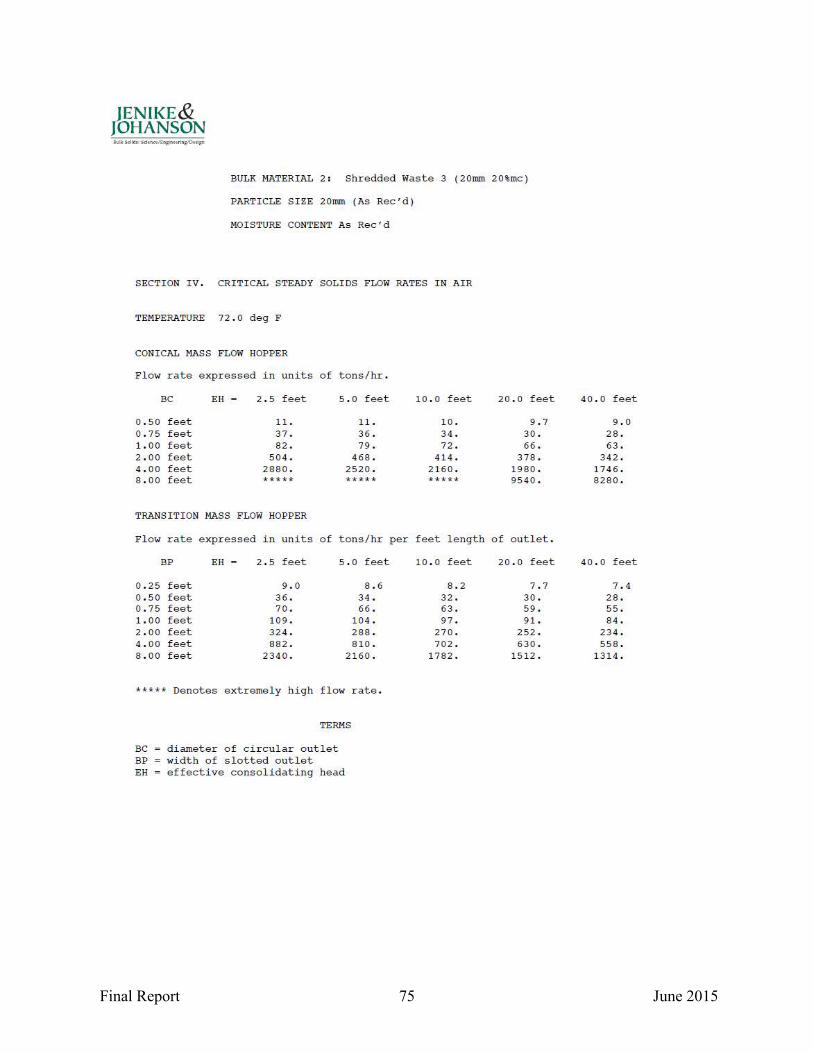
Final Report 75 June 2015
JENIKE& JOHANSON
BULK MATERI AL 2: Shredded Wast e 3 (20rnm 20%mc)
PARTI CLE S I ZE 20rnm (As Rec'd)
HO I STURE CONTENT As Rec'd
SECTION I V. CRITI CAL STEADY SOLI DS FLOW RATES I N AIR
TEMPERATURE 72 . 0 d eg F
CONICAL MASS FLOW HOPPER
Flow r a te expr e ssed in units o f tons/hr.
BC EH = 2 . 5 feet 5 . 0 feet 10 . 0 feet 20 . 0 feet
0 .50 f eet 11. 11 . 1 0 . 9 . 7 0 . 75 f eet 37 . 36 . 34 . 30 . 1. 00 f eet 82 . 79 . 72 . 66 . 2 . 00 f eet 504. 468 . 4 1 4 . 378 . 4. 00 f eet 2880 . 2520 . 2 160 . 1980 . 8 . 00 f eet *** ** ** *** * **** 95 40 .
TRANSI T I ON MASS FLOW HOPPER
Flow r a te expr e ssed in units o f tons/hr per feet l ength o f outl e t.
BP EH = 2 . 5 feet 5 . 0 feet
0 . 25 f eet 9 . 0 8 . 6 0 .50 f eet 36 . 34. 0 . 75 f eet 70 . 66 . 1. 00 f eet 109 . 104. 2 . 00 f eet 324. 288 . 4. 00 f eet 882 . 8 10 . 8 . 00 f eet 2340 . 2160 .
***** Denot es ext remely h i gh f l ow rate .
TERHS
BC d i amet er o f c irc u l a r out l et BP wi dth o f slotted o ut l e t EH effec t i ve consol ida t i ng he ad
10 . 0 feet 20 . 0 feet
8 . 2 7 . 7 32 . 30 . 63 . 5 9 . 97 . 91.
27 0 . 25 2 . 702 . 630 .
1782 . 1512 .
40 . 0 f eet
9 . 0 28 . 63 .
342 . 1746 . 8280 .
40 . 0 f eet
7 . 4 28 . 5 5 . 84 .
234 . 558 .
1314 .

Final Report 76 June 2015
JENIKE& JOHANSON
BULK MATERIAL 2: Shredded Waste 3 ( 20mm 20%mc )
PARTICLE S I ZE 20mm (As Rec'd)
HOI STURE CONTENT As Rec'd
SECTION V . AIR PERMEABILITY TEST RESULTS
Tempera ture of test 68 deg F
K, the AIR permeability f act or of t he soli d is defined £ r om Dar cy's l aw i n the following form:
K = - u ( GAMMA ) I (dpl dx )
where:
u = s uperfi cial AIR velocity through the bed of solids
dpl dx AIR pressure gradient across t he bed
GAMMA bu lk density o f the solid in the bed
K is a £uncti on o f the bulk dens ity of the solid
-a K = KO ( GAMMA I GAMMAO )
At room temper ature, f or G~~~ between 16 . 3 and
KO 4 . 002043 f tls
G~~o 14.3 p c f
a = 3 . 31
29 . 2 pc f:
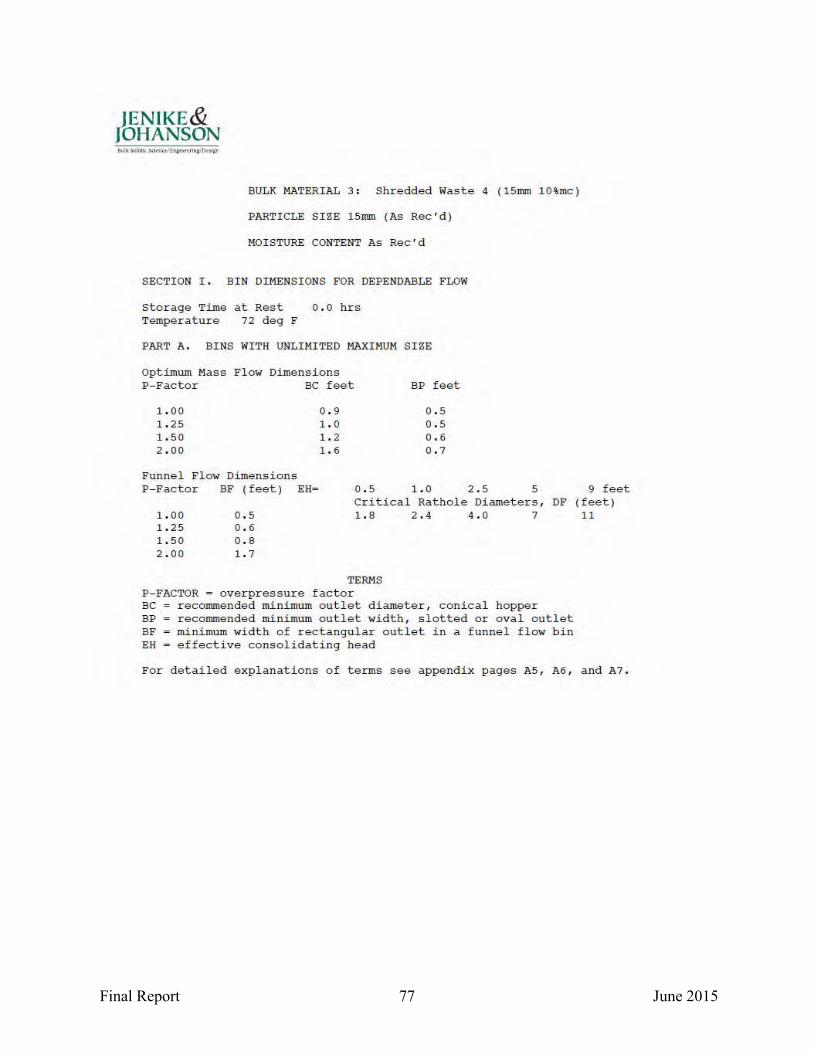
Final Report 77 June 2015
]EN IKE& JOHANSON
BULK MATERI AL 3: Shredded Waste 4 (15mm 10%mc)
PARTI CLE SI ZE 15mm (As Rec'd)
HO I STURE CONTENT As Rec'd
SECTION I. BI N DIHENSIONS FOR DEPENDABLE FLOW
Storage Time at Rest o. o hrs Temperature 72 deg F
PART A. BINS WITH UNLIMITED MAXH!UM SI ZE
Optimum Mass Fl ow Di mensi ons P- Factor BC feet
1.00 1. 25 1.50 2 . 00
Funnel Flow Di mensi ons P- Factor BF ( f eet) EH=
0 . 9 1. 0 1.2 1.6
0 .5
BP feet
0.5 0.5 0 . 6 0 . 7
1.0 2.5 5 Critica l Rathol e Di ameters, OF
1.00 0 . 5 1. 8 2.4 4.0 7 1.25 0 . 6 1.50 0 .8 2 . 00 1.7
TERMS P - FACTOR = overpressur e factor BC recommended min i mum out let diameter, conical hopper BP recommended min i mum outlet width, slotted or ova l ou t let BF min i mum wi dth of rectangular outl et i n a f unnel flow b i n EH e f fec tive consol idati ng head
9 feet (feet) 11
For detai led explanations o f terms see a ppendix pages A5, A6, and A7.
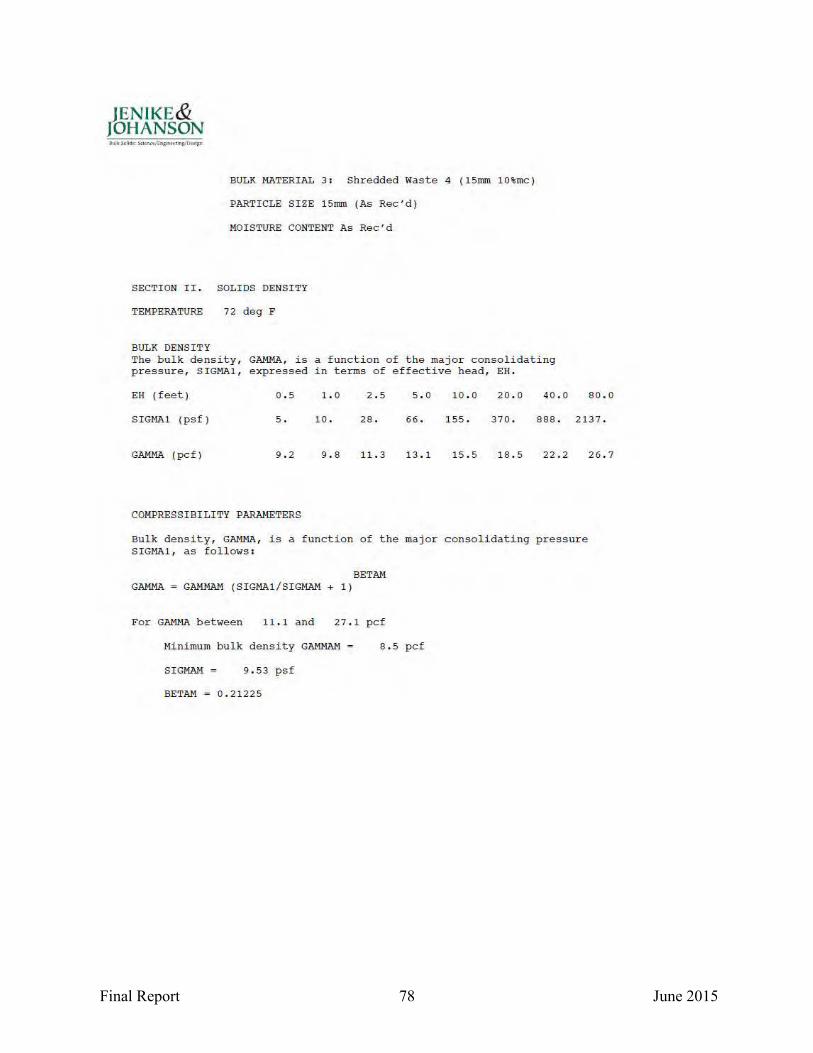
Final Report 78 June 2015
JENIKE& JOHANSON
BULK MATERIAL 3 : Shredded Waste 4 ( 15rnm 10%mc)
PARTICLE S I ZE 15rnm (As Rec'd )
MOI STURE CONTENT As Rec'd
SECTION I I . SOLIDS DENSI TY
TEMPERATURE 72 deg F
BULK DENSITY The b u lk density, GAMMA, is a f unc tion o f the ma jor consolida t ing pr essure, S I GMAl, expressed in t erms of e ffective head, EH.
EH ( f eet) 0.5 1. 0 2.5 5.0 1 0 . 0 20 . 0 40. 0 80 . 0
SIG~!A 1 ( psf ) 5 . 10 . 28. 66 . 155. 370. 888 . 2137.
GAMJo!A ( pc f l 9 . 2 9 . 8 11. 3 13.1 15 . 5 18 .5 22.2 26 . 7
COMPRESSIBI LITY PARAMETERS
Bul k densit y, GA11MA, is a function of the majo r consolidat ing p r essur e S IGMA1 , as f o llows:
GAMMA BET AM
GAMMAM ( SI GMA1 / SIGMAM + 1 )
For GAMMA between 11. 1 and 27 . 1 pcf
Mi n i mum bulk density GAMMAM = 8.5 pcf
S IGMAM = 9 .53 psf
BET~! = 0 .21225

Final Report 79 June 2015
JENIKE& JOHANSON
BULK MATERIAL 3: Shredded Wast e 4 ( 15mm 10%mc)
PARTI CLE SI ZE 15mm (As Rec'd)
HOI STURB CONTENT As Rec 'd
SECTION III. MAXHIUM HOPPER ANGLES FOR HASS FLOW
WALL MATERI AL: Polished Refractor y STORAGE THIE AT REST 0 , 0 hrs TEMPERATURE 7 2 deg F
HOPPER ANGLES FOR VARIOUS HOPPER SPANS
Dia o f Cone (feet ) Wi d t h of Oval ( f eet)
SI GMA (psf ) SI GMA1 ( psf )
Wal l Fr i c t ion Angl e PHI - PRIME (deg)
Hopper Angles THETA-P (deg ) THETA- C (d eg )
1 . 19 2 . oo 4 . oo 8 . oo 16 . 19 0 . 64 1 . 08 2 . 17 4.33 8.62
3 . 9 7 . 1 16 . 37. 95 . 7 . 0 12 . 5 28 . 65 . 147 .
4 0 . 4 0 . 39 . 37 . 34 .
10 . * 10 . * 10 . * 10 . 15 . 0 . * 0 . * 0 . * 1. 6.
* Flow alo ng wal l s i s quest ionabl e.
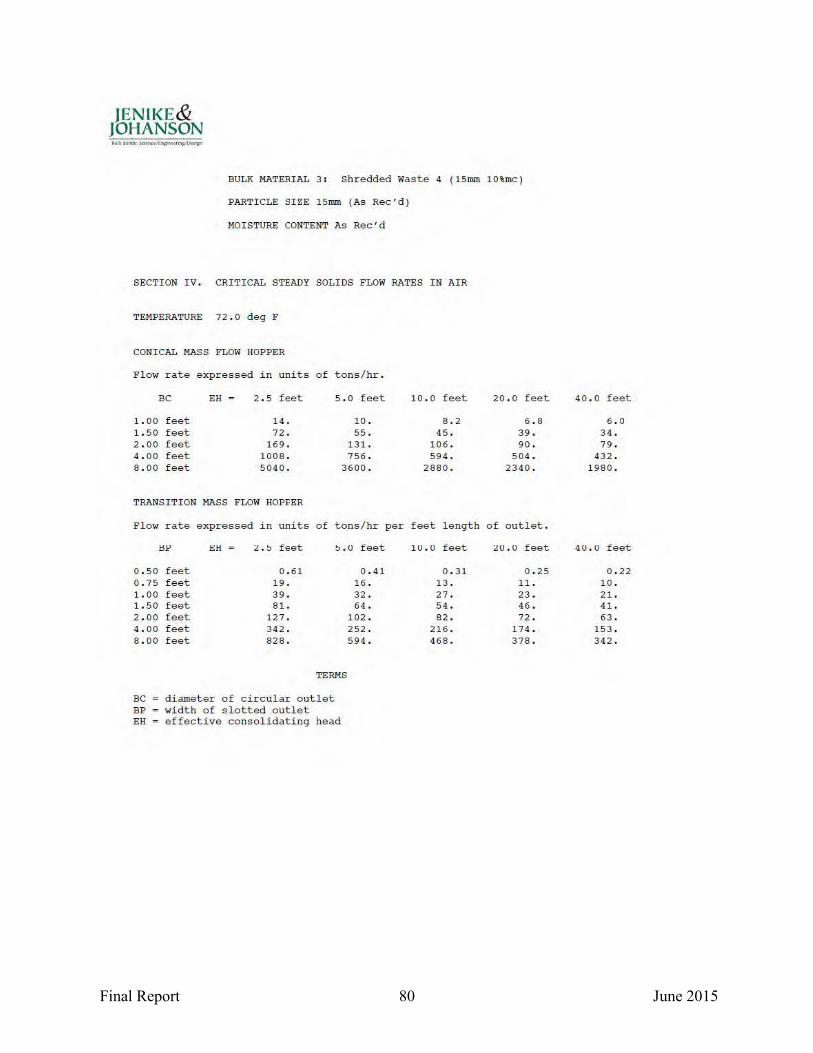
Final Report 80 June 2015
JENIKE& JOHANSON
BULK MATERI AL 3 : Shredded Wast e 4 ( 15rnm 10%mc)
PARTI CLE SIZE 15mm (As Rec'd )
MOI STURE CONTENT As Rec'd
SECTION I V. CRITI CAL STEADY SOLI DS FLOW RATES I N AIR
TEMPERATURE 72 . 0 deg F
CONICAL MASS FLOW HOPPER
Flow r a te e xpr e s sed i n units o f tons/hr .
BC EH = 2 . 5 f eet 5 . 0 f eet 10 . 0 feet 20.0 feet
1. 00 f eet 14. 10 . 8 . 2 6 . 8 1.50 f eet 72 . 55. 45 . 39 . 2 . 00 f eet 169. 131. 106 . 90 . 4. 00 f eet 1008 . 756 . 594. 504. 8 . 00 f eet 5040 . 3600 . 2880. 234 0 .
TRANSI TI ON MASS FLOW HOPFER
Flow rate e xpr e s sed in un i ts o f tons/hr per feet l ength o f outl et.
l:l!' t:H = :l.!> f eet !> . 0 f eet
0 .50 f eet 0 . 61 0 . 75 f eet 19 . 1. 00 f eet 39 . 1.50 f eet 81. 2 . 00 f eet 127 . 4 . 00 f eet 342 . 8 . 00 f eet 828 .
TERMS
BC d i amet er of c irc u l a r out l et BP wi dth o f slotted outl e t EH e f fective consol ida ting head
0 . 41 16 . 32 . 64 .
102 . 252 . 594.
10 . 0 feet :to.o feet
0 . 31 0 . 25 13 . 11 . 27. 23. 54 . 46. 82 . 72 .
2 16. 174 . 468. 378 .
40 . 0 f eet
6 . 0 34. 79 .
432 . 1980 .
4 0 . 0 f e e t
0 . 22 10 . 21. 41. 63 .
153 . 342 .
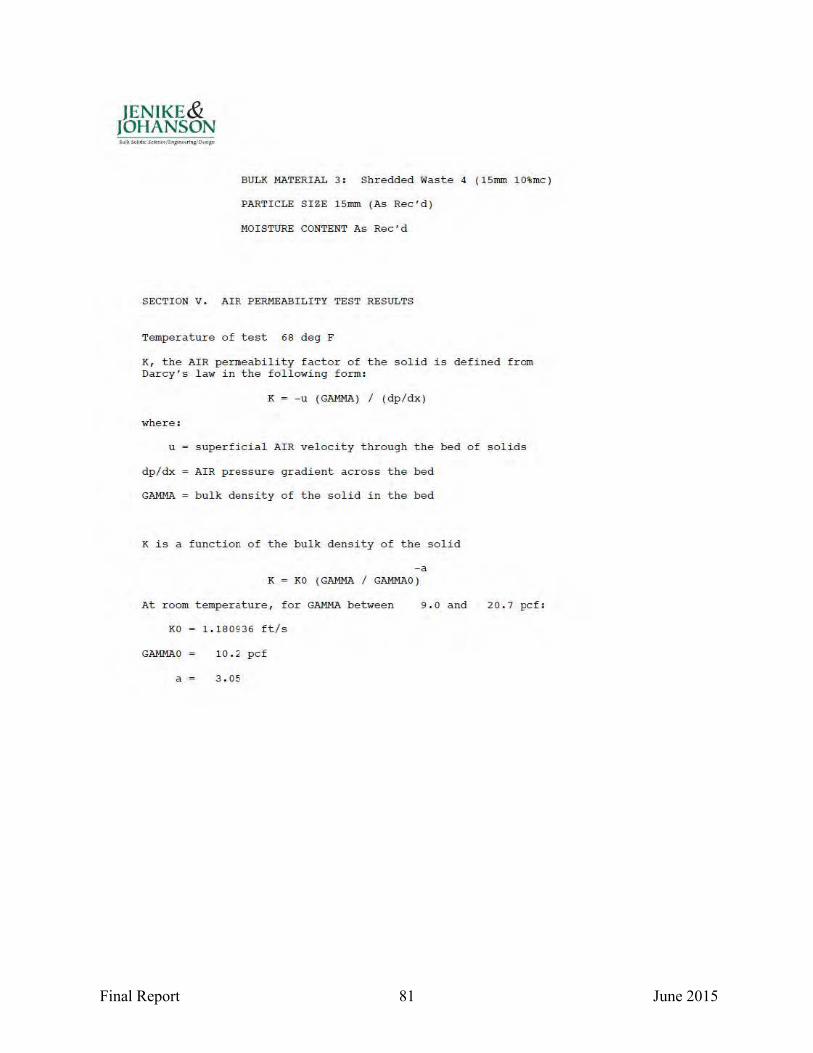
Final Report 81 June 2015
JENIKE& JOHANSON
BULK MATERIAL 3 : Shredded Waste 4 ( 15mm 10%mc)
PARTI CLE SI ZE 15mm (As Rec'd )
HO I STURE CONTENT As Rec'd
SECTION V. AI R PERMEABILITY TEST RESULTS
Temperatur e of t est 68 deg F
K, the AI R per neability f actor of t he soli d i s def i ned f r om Dar cy's l aw in the followi ng form :
K = - u ( GAMMA ) I (dpldx )
wher e:
u = s uperficial AIR vel oci ty through the bed of s olids
dpl dx AIR pressure gradient across the bed
GAMMA bulk dens i ty o f the soli d i n the bed
K i s a functi on o f the bulk density of the solid
- a K = KO ( GAMMA I GAMMAO )
At r oom temperature, f or GAMMA bet ween 9. 0 and
KO 1 . 18 0936 f t l s
GAMHAO 10 . 2 pc f
a = 3 . 05
20.7 pcf :
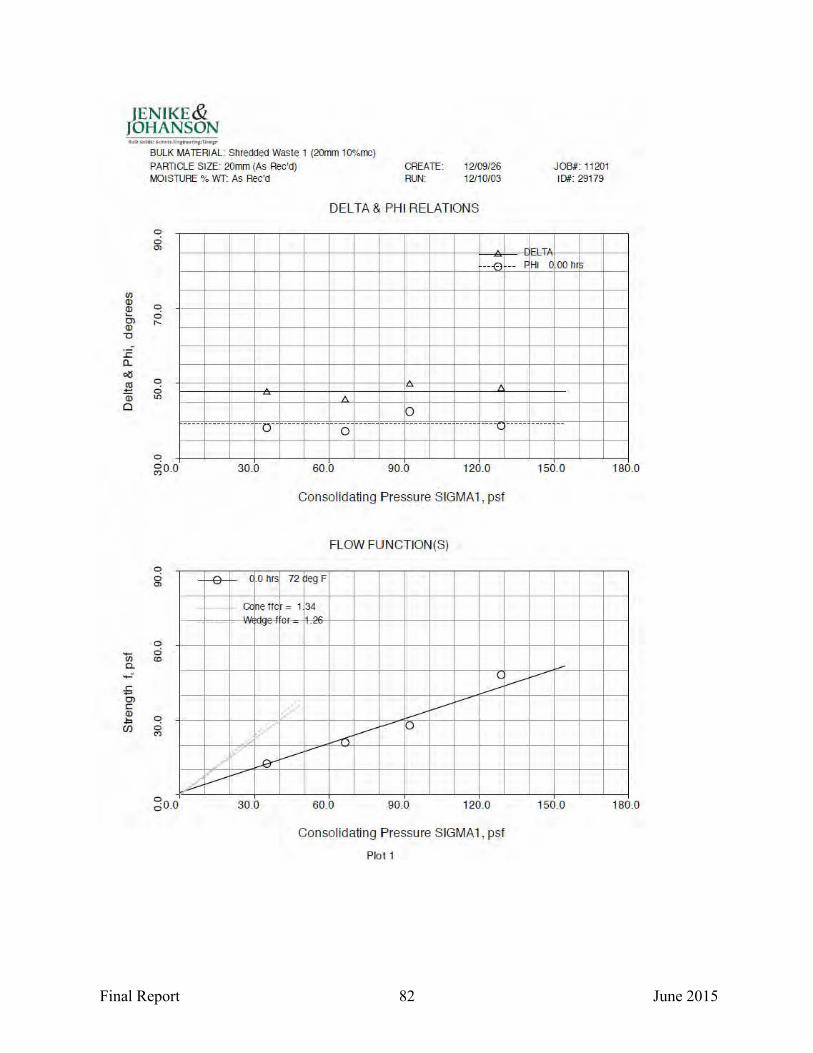
Final Report 82 June 2015
JENIKE& JOHANSON
BULK MATERIAL Shredded Waste 1 (20rrun 1 O"'orre) PARTICLE SIZE: 20mm (As Rec'd) MOISTURE % WT: As Rec'd
CREATE: 12109/26 RUN: 12110/03
DELTA & PHI RELATIONS
0 0 0>
JOB#: 11201 10#: 29179
-- -0 -- f HI C OO h
VJ
:ll 0 .... 0 ar ,... -o
:c a.. oil !!! a; 0
._ VJ c. ....:
.;;; 0> c:: (]) .=. (/)
0
g
0
go_o
0 0 en
0 0 "'
0 0 <.')
cio.o
0 ----- ----- ----- -o-- ---- ----- ---6 ----- ----- ----- ----- ----- ----c. ----- --------
30.0
( 0 hrs
- Cc ne ffc
""e-i
....e-::--~
---- 30.0
60.0 90.0 120.0
Consolidating Pressure SIGMA 1, psf
FLOW FUNCTION(S)
72 eg F
= 1 34
l. v ----v f-
---v --- 0
----r'\
v ~
60.0 90.0 120.0
Consolidating Pressure SIGMA 1, psf
Plo t 1
150.0
----
150.0
180.0
180.0
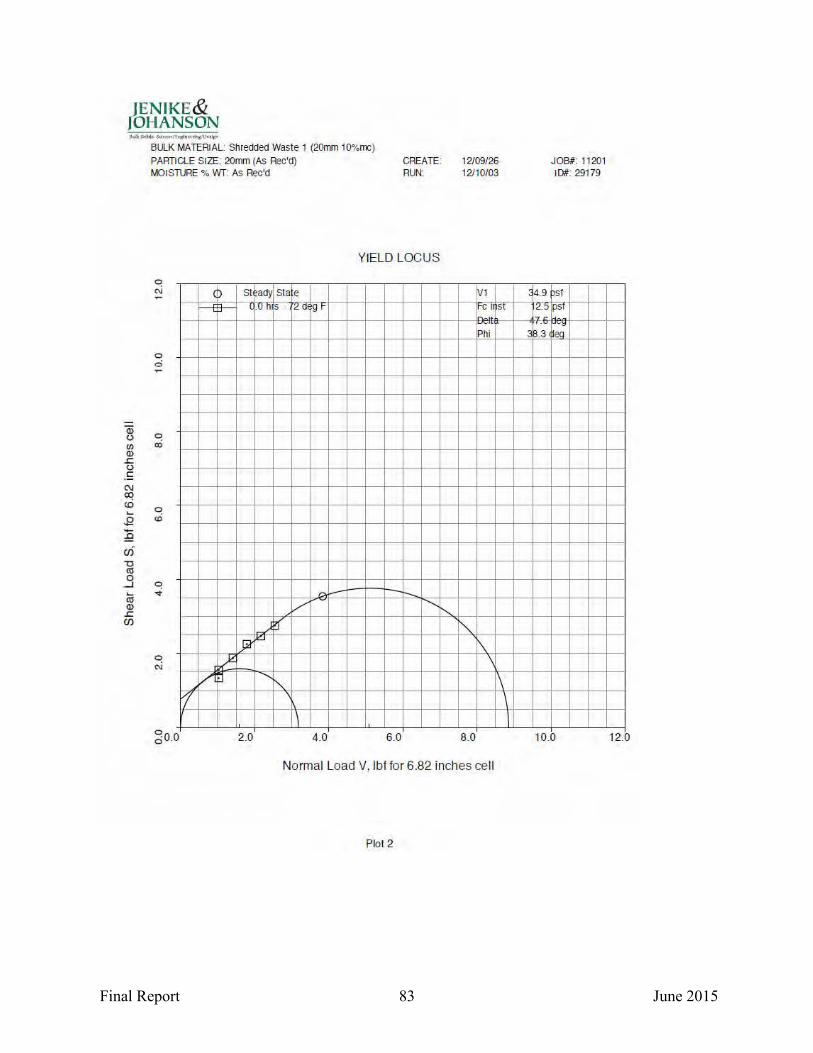
Final Report 83 June 2015
JENJKE& JOHANSON
BULK MATERIAL: Shredded Waste 1 (20mm 10%rm)
PARTICLE SIZE 20mm (As Rec'd) MOISTURE % WT: As Rec'd
CREATE: 12/09/26 RUN: 12110/03
YIELD LOCUS
a; u en (]) .!::. u .!: C\J CX)
c.ci ..... s ..... :9 en '0 ro 0
....J ..... ro (]) .!::. UJ
0 C>i
0 ci
~ Q)
0 tri
0 -.i
~ N
)
-I 3-
~ ,/I ;J
St ady stae
~ fUns [<!01
v ,/~
;a-p
""'
V1 gr- r-c J?S l
Phi
c. f.- -.. ........._
"' "' '\ \ \
1 \ 1\ I
2.0 4.0 6.0 8 .0
Normal Load V, lbffor 6.82 inches cell
Plot 2
4.9
(L>
8.3
JOB#: 11201 10#: 29179
sf psr
~;;
10.0 12.0
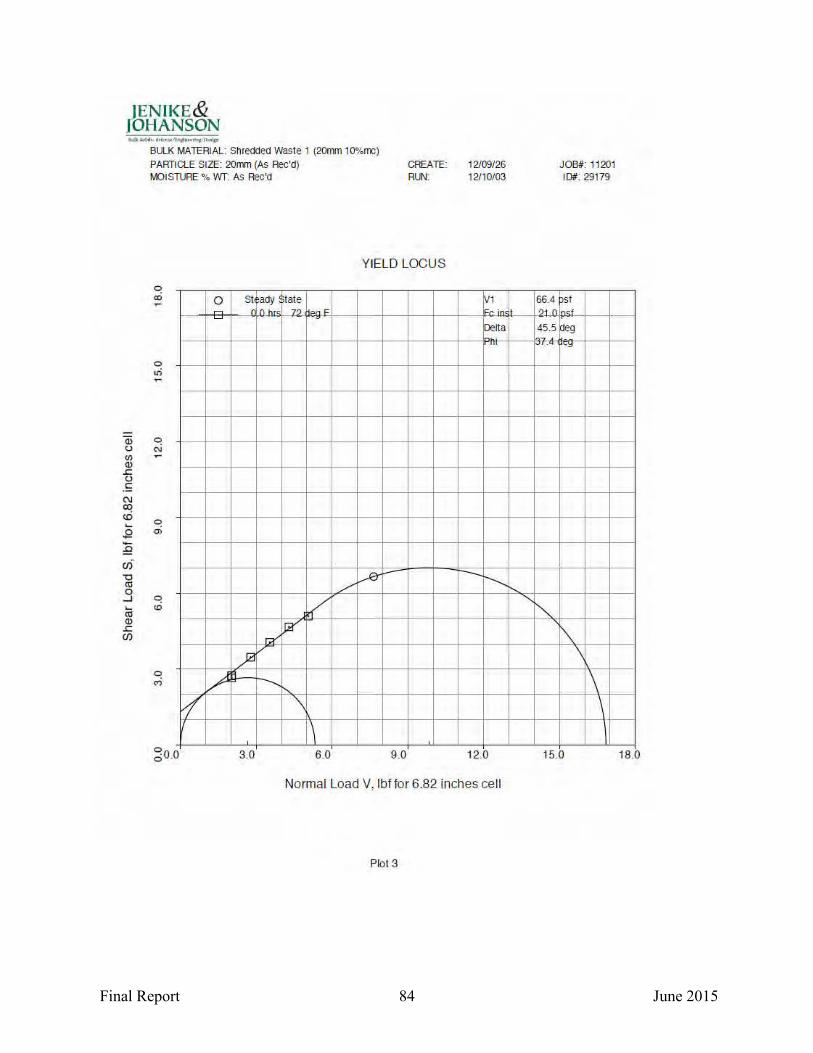
Final Report 84 June 2015
JENIKE& JOHANSON
BULK MATERIAL: Shredded Waste 1 (20mm 10%rrx:) PARTICLE SIZE: 20mm (As Rec'd) CREATE: 12/09/26 MOISTURE % Wf: As Rec'd RUN: 12110/03
Y!ELD LOCUS
I ~ St1ady tate V1
In h« 7? eg..~ H- ;n<
Delta
Qi q u C\1
en ~
Q) .!: u .s
C\J CXl (()
q '-.Q a>
;Q en -o ro 0
...J q '- 10 ro Q) .!: (j)
..---a-r- --- .............. /
/ r::Y
%'
;a v q <'l v --1 '\
\ cio.o 3.0 6 .0 90 12.0
Normal Load V, lbf for 6.82 inches cell
Plot 3
-...,
JOB#: 11201 ID#: 29179
$* ? 1. of
45.5 eg
·~~
"" "" \
\ \ \
15.0 18.0
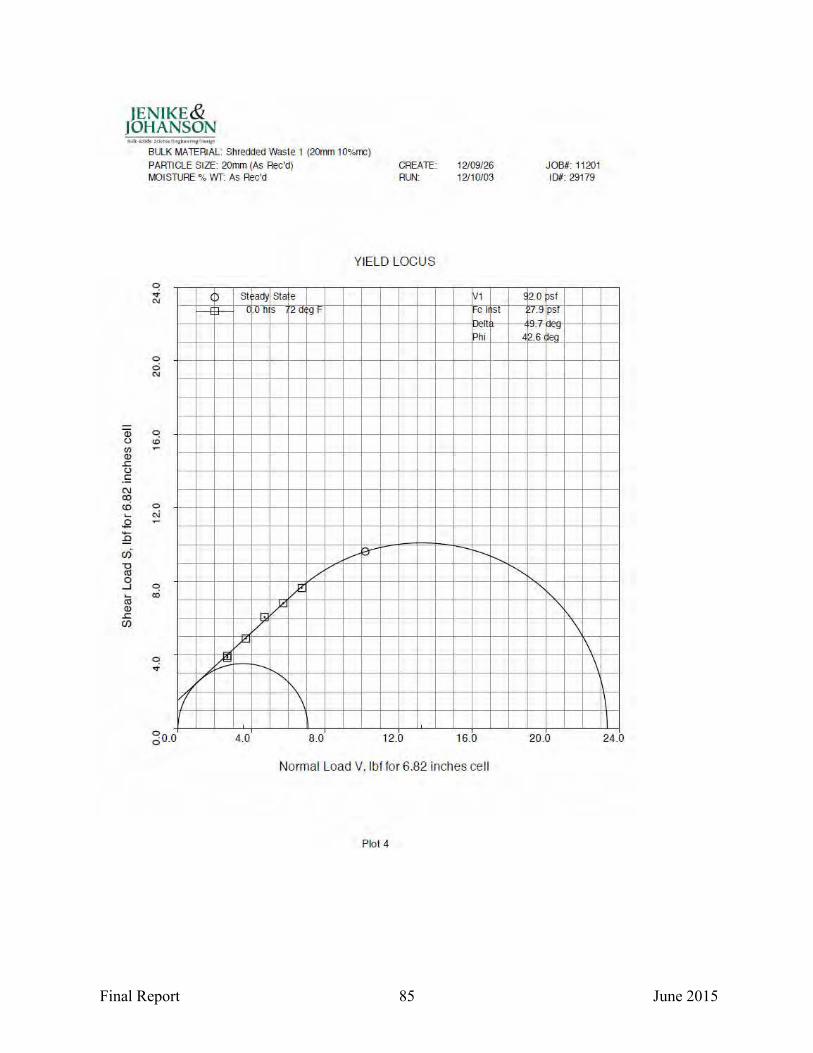
Final Report 85 June 2015
JENIKE& JOHANSON
a; u en Q) .r: u .s
C\J co (() '-.$2 ;Q en "0 ro 0
...J '-ro Q) .r: (j)
BULK MATERIAL: Shredded Waste 1 (20mm 10%rrx:) PARTICLE SIZE: 20mm (As Rec'd) CREATE: 12/09/26 MOISTURE % Wf: As Rec'd
C> v
"'
0 0 "'
0 .0
0 C\i
0 ai
0 .,f
1
)
-I 3-
~ /
St1ady stae
LfU n s r~ a'
l,-Z .., ~
v V"
r--. 1\. \
4.0
RUN: 12/10/03
Y!ELD LOCUS
V1
g r- C I ·S l
Bel Phi
v FY -' /
8.0 12.0 16.0
Normal Load V.lbf for 6.82 inches cell
Plot 4
~2. 0
f'·" 9.
4~.6
"'-...,
JOB#: 11201 ID#: 29179
sf psr
e--;
\ 1\ \
20.0 I 24.0

Final Report 86 June 2015
JENIKE& JOHANSON
BULK MATERIAL: Shredded Waste 1 (20rrun 10"/om::) PARTICLE SIZE: 20mm (As Rec'd} CREATE: 12109/26
Qi ()
en Q) .c ()
.!: C\J co cri ..... .g .... :9 CJ5 -o o:l 0
...J
ro Q) .c (/)
MOISTURE % WT: As Rec'd
0 d (')
"'! v C\J
0 cri
"'! C\J ~
0 tO
/. I
..e .....
lc::t, >~·
In
6--' /
6.0
RUN: 12110/03
YIELD LOCUS
::1• ~11
rs ~ ~ '"" I; n o
.- r- --/
/ ,...(
,,
.......
I'.
12.0 18 .0 24.0
Normal Load V, lbf for 6.82 inches cell
Plot 5
......
~ ?
a
JOB#: 11201 10#: 29179
l
·~,
\
\
30.0 36.0

Final Report 87 June 2015
JENJKE& JOHANSON
BULK MATERIAL: Shredded Waste 1 (20mm 10%mc) PARTICLE SIZE 20mm (As Rec'd) MOISTURE % WT: As Rec'd TEMPERATURE: 72 !leg F
CREATE: 12/09/26 RUN: 12110/03
BULK DENSITY VS. CONSOLIDATING PRESSURE
0 ci
"'
0
~ v
3
v
4
/ /
v
5 6 7 8 9
/v /I /
,6 /
/
2 3 4 5 6 7 8 9
V5
!?20 0 100.0 1000.0 Consolidating Pressure SIGMA 1, psf
Plot 6
JOB#: 11201 10#: 29179
lY /
2 3000.0
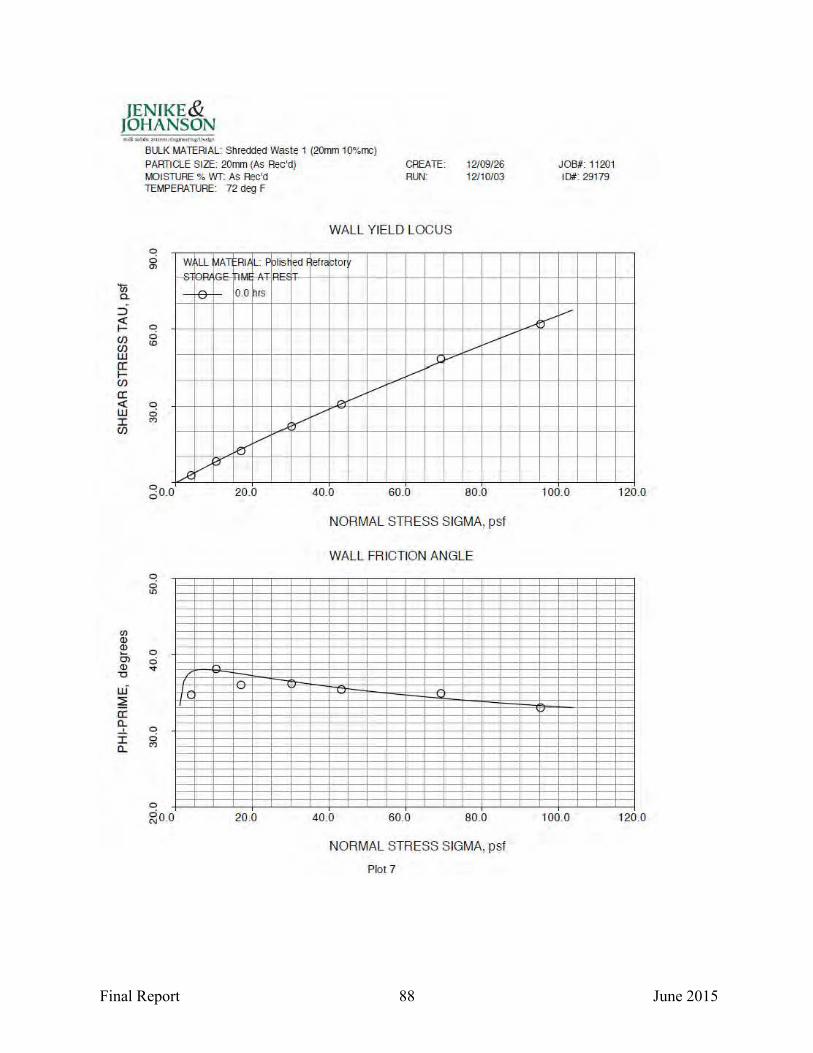
Final Report 88 June 2015
JENIKE& JOHANSON
BULK MATERIAL: Shredded Waste 1 (20mm 10%rm) PARTICLE SIZE 20mm (As Rec'di CREATE: 12109/26 MOISTURE % wr: As Rec'd TEMPERATURE: 72 deg F
0 ci "'
w LL IIIATtR!f L: F plis t
' " oT ln~o
1ii a. - -e- - 0.0 ~rs
::J <{ 1- '=! (/) 0
(/) "' w a: 1-(/)
cr: <{ 0 w ci :r: "' (/)
kr v ....€ /3
cio.o 20.0
0 g
(/) C]) C])
0 c:n 0 C]) .... "0
w ~ cr: ~ 0
:r: ci a.. "'
0
~00 20.0
ed T
>I'
RUN: 12110/03
WALL YIELD LOCUS
eire cto
v v v v v
v Do /
/
/
40.0 60.0 80.0
NORMAL STRESS SIGMA, psf
WALL FRICTION ANGLE
40.0 60.0 80.0
NORMAL STRESS SIGMA, psf
Plot 7
'1"'
JOB#: 11201 10#: 29179
-
100.0
100.0
120.0
120.0
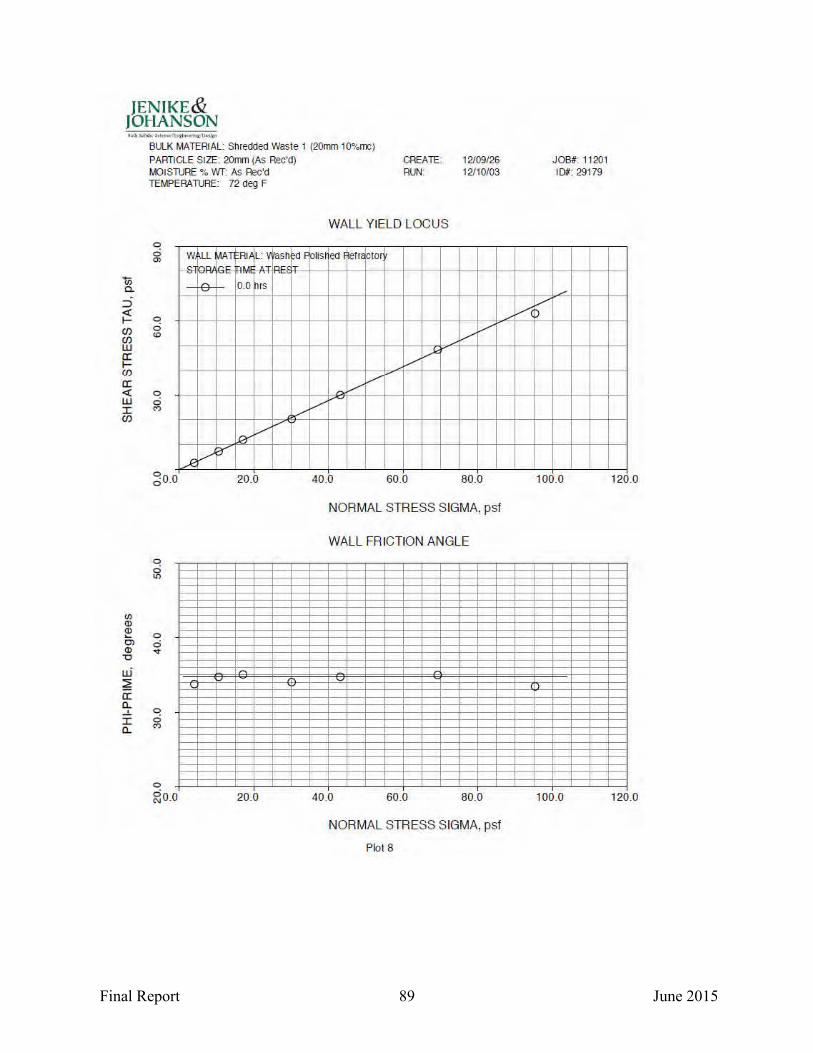
Final Report 89 June 2015
]ENIKE& JOHANSON
BULK MATERIAL: Shredded Waste 1 (20mm 10%mc) PARTICLE SIZE: 20mm (As Rec'd) CREATE: 12109/ 26 MOISTURE % wr: As Rec'd TEMPERATURE: 72 deg F
0 ci Q) WLL \1ArtRif L: V ash
~ ... • T R" ' 1ii c. - -e- - 0.0 ~rs
::::J <(
0 1-(f) ci (f) "' UJ a: 1-(f)
a: <( 0 UJ ci :r: M
(f)
v v !.«
....<:: / :Y
20.0
0 ci "'
(/) Q) Q)
0 ..... 0) ci Q) ~ -c
u.i ~ a: 9: 0
:r: ci a... M
0
~00 20.0
~d F IT
v
RUN 12110/03
WALL YIELD LOCUS
pus ed ~fr< ~tor
/ /
/ _..)<
v v ,.,
v ~
40.0 60.0 80.0
NORMAL STRESS SIGMA, psf
WALL FRICTION ANGLE
40.0 60.0 80.0
NORMAL STRESS SIGMA, psf
Plot 8
.......-( r
JOB#: 11201 10#: 29179
100.0
100.0
120.0
120.0
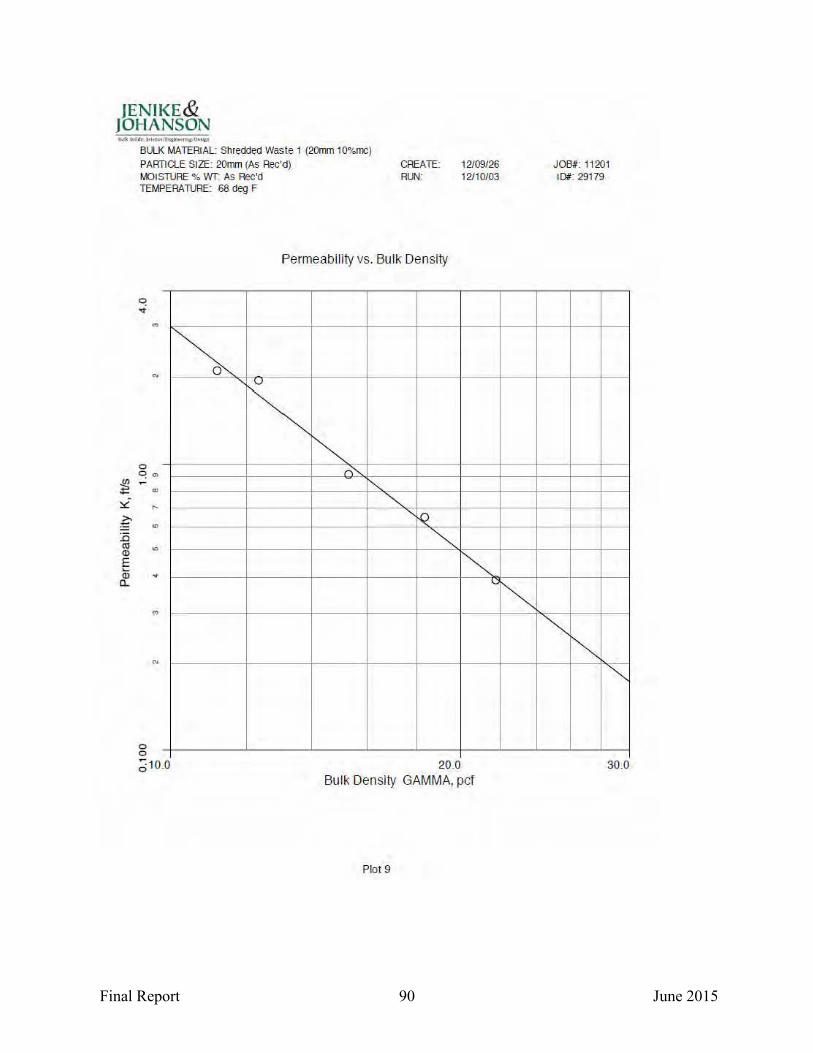
Final Report 90 June 2015
JENIKE& JOHANSON
~ '.:i g :0 (U Q)
E .... Q) a.
BULK MATERIAL: Shredded Waste 1 (20mm 10%mc)
PARTICLE SIZE: 20mm (As Rec'd) CREATE: 12/09/26 MOISlURE % Wf: As Rec'd RUN: 12/10/03 TEMPERA lURE: 68 deg F
Permeability vs. Bulk Density
.,
I~
0 ~ en ~
0 0
"'
"'
"'
"'
;j10.0
'~ ~
1""1""'
" ""' " -Q ~ ~
20.0 Bulk Density GAMMA, pet
Plot 9
\,;
~
JOB#: 11201 10#: 29179
~
"" ""' 30.0

Final Report 91 June 2015
JENIKE& JOHANSON
BULK MATERIAL: Shredded Waste 3 (20mm 20%mc) PARTICLE SIZE: 20mm (As Rec'<l) MOISTURE % Wf: As Rec'd
CREATE: 12109/ 26 RUN 12110/03
DELTA& PHI RELATIONS
0 0 "' \ oC>T'
JOB#: 11201 10#: 29180
\ -- -0 -- f HI c 00 h
\ (J) Q)
0 Q) .... 0 Ol ..... Q)
"0
\ \
1\. :2 a. o1l
~ 0
0 Q) II)
"-..... l:t.-
-...... -·-.. ----a v
0
go.o 30.0
0 0 "'
,-.. co hrs ~
- - Cc re ftc
-,-
0
"iii ci <0
c. ....:
-6 Ol c:: Q)
0 ~ (/) 0
M
_.B-
--+----........
d0 .0 30.0
- !J
A I ~
----- -·--- - --~ · · · ·- · -·-- -·--u --... . 10··· ·-----
60.0 90.0 120.0
Consolidating Pressure SIGMA 1, psf
FLOW FUNCTION(S)
72 eg F
= 1 13
lo.--- --------
..----........-c v if
---........
60.0 90.0 120 0
Consolidating Pressure SIGMA 1, psf
Plot 10
...
150.0
----
150.0
180.0
180.0
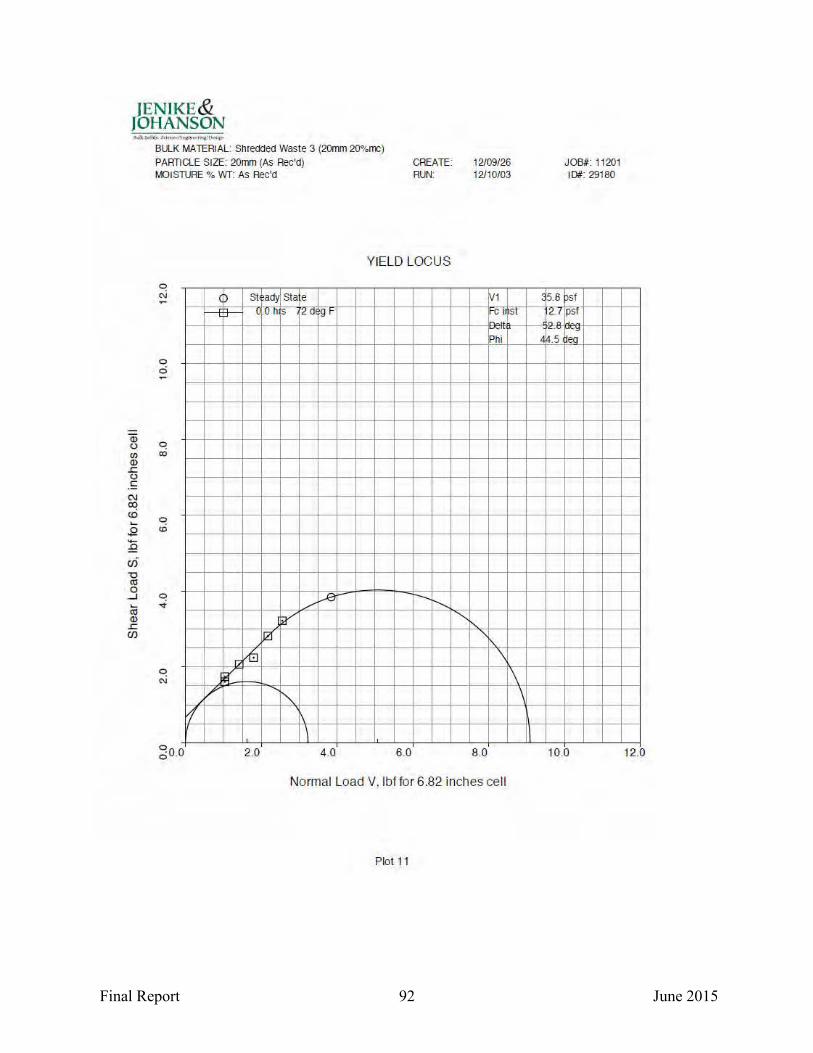
Final Report 92 June 2015
JENIKE& JOHANSON
BULK MATERIAL: Shredded Waste 3 (20mm 20%mc) PARTICLE SIZE: 20mm (As Rec'd) MOISTURE % Wf: As Rec'd
CREATE: 12109126 RUN: 12110103
YIELD LOCUS
a; u en (])
.J:: u .!: C\J co <0 ..... s £ en "0 ro 0
_J
..... ro (])
.J:: (/)
0 C>i
0 ci
q ex>
0 a;
0 -.i
D
r;;_
St ad sta e t .u n s '2 0
/
iY JZf
(8
~1 gt- 11-C I?Sl
I Phi
.....e r--.. !'-.... --....._
\ q C\l
i( 1\ v " \
f1 \
cio.o 2.0 4.0 6.0 8 .0
Normal Load V, lbf for 6.82 inches cell
Plot 11
II
~5. 6
12.1
4 .5
JOB#: 11 201 10#: 29180
sf psr
j;
10 .0 12.0

Final Report 93 June 2015
JENJKE& JOHANSON
BULK MATERIAL: Shredded Waste 3 (20111111 20%roc) PARTICLE SIZE: 20111111 (As Rec'd) MOISTURE % wr: As Rec'd
CREATE: 12/09/26 RUN: 12/10/03
YIELD LOCUS
I ~ St acty $tate V1 (l hr<l_].z_ eg~ K- ;n<
Delta
Qi q 0 N Vl ~
Cll ~ u £ C\J CX)
cri q .... Q 0)
~ en ...--e- --- -... -o tll 0
...J 0 .... cO tll
/ v
v!l Cll ~ (f) )6
v q
"' ? ....... !'-... v \
\ :;o.o 3.0 6.0 9.0 12.0
Normal Load V, lbf for 6.82 inches cell
Plot 12
~
68.6 ? 1 7
51.7
" "
JOB#: 11201 ID#: 29180
sf I not
peg ~,
1'\. \
\ \
15.0 I 18.0
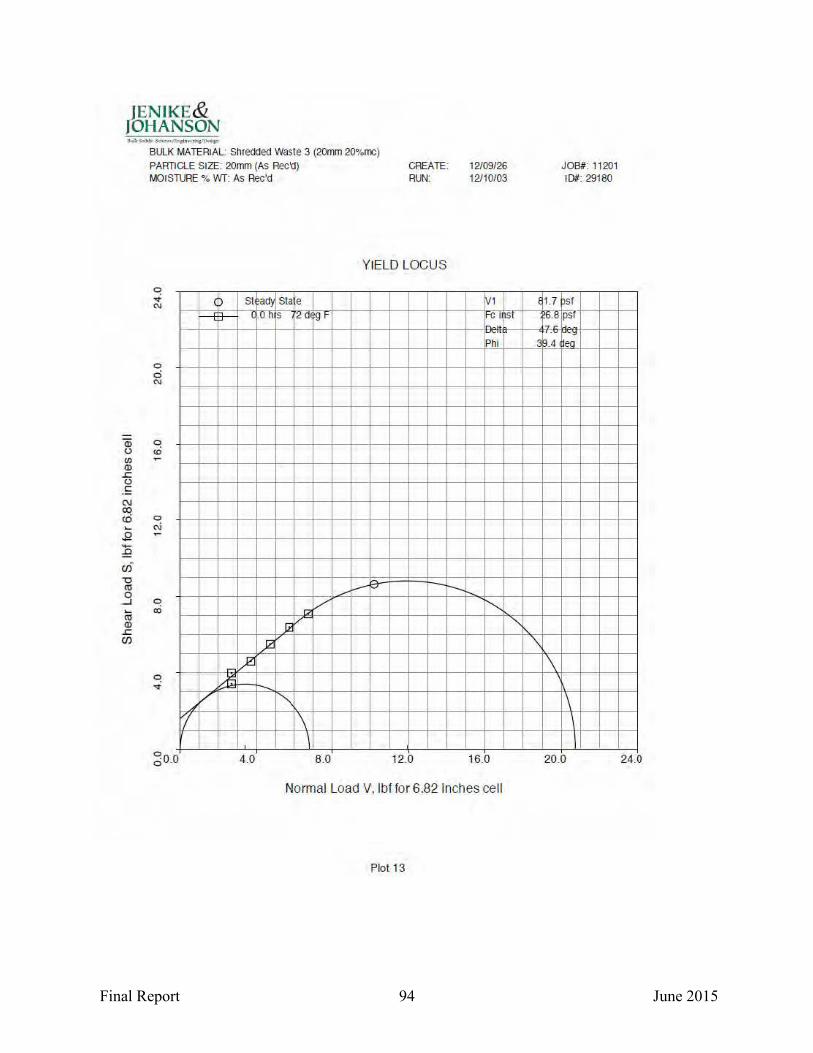
Final Report 94 June 2015
JENJKE& JOHANSON
BULK MATERIAL: Shredded Waste 3 (20mm 20%mc) PARTICLE SIZE 20mm (As Rec'd) MOISTURE % wr: As Rec'd
CREATE: 12/09/26 RUN: 12110/03
YIELD LOCUS
) St ady stae ~1 quns '2 0 gt- FC II~Sl
I
a; u (/) (]) .c u .!: C\J CX)
<0 ..... s
'+-
:9 CJ) "0 co 0
_J
..... co (]) .c (f)
0 ci (\J
0 <ri ~
0 1:\i ~
q ex>
q .,.
cio.o
)2l
l-B A5
/
1
4.0
Phi
-'=" -~--
,., / 1'---. Jl
/ "
""' \ \
8 .0 12.0 16.0
Normal Load V, lbf for 6.82 inches cell
Plot 13
1.7 ~o. B 7~
~ 9.4
'\
\
JOB#: 11201 10#: 29180
sf psr
j;
\ \ I
20.0 24.0

Final Report 95 June 2015
JENIKE& JOHANSON
BULK MATERIAL: Shredded Waste 3 (20mm 20%m::) PARnCLE SIZE: 20mm (As Aec'd) CREA ~ 12109/26
05 0 VI Q) J:: (_)
.s C\J CXl (() ..... Q
;Q ui -o Cll 0 _J ..... Cll Q) J:: C/)
MOISTURE % wr: As Rec'd
0 0 [!)
q .,. N
0 cri
q N
0 ..;
0
0 o.o
, 'I
I
.... v
l~t . "'" " r l n h r<
/ ~
I"
6.0
RUN: 12110/03
YIELD LOCUS
·~'" fp ~1 r? 1<>< I= 1~=<- ljn<
t
.AI" -....... / r-..._
,/ p
' ~ \ I 12.0 18 .0 24.0
Normal Load V, lbf for 6.82 inches cell
Plot 14
~ ~ '" d " ')
1\
JOB#: 11201 ID#: 29180
In< In<
1\ \
30.0 36.0
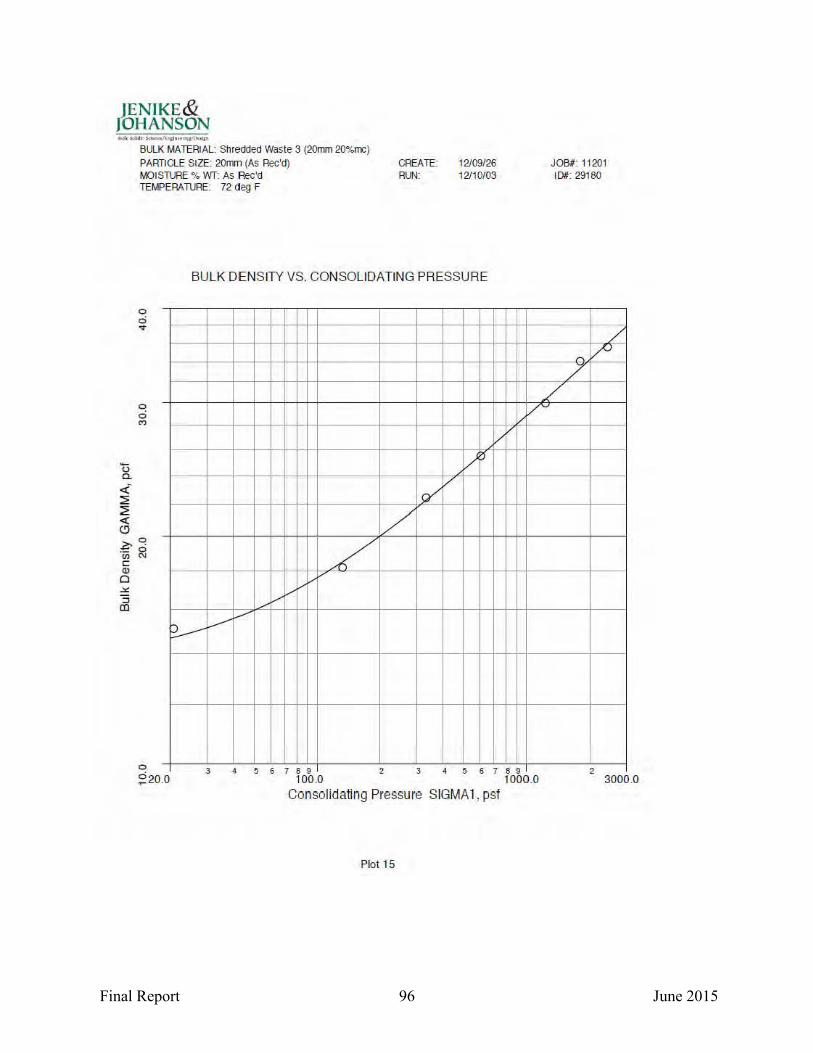
Final Report 96 June 2015
JENlKE& JOHANSON
BULK MATERIAL: Shredded Waste 3 (20mm 20%rrc) PARTICLE SIZE: 20mm (As Rec'd) MOISTURE % Wf: As Rec'd TEMPERATURE: 72 Cleg F
CREATE: 12/09/26 RUN: 12/10/03
BULK DENSITY VS. CONSOLIDATING PRESSURE
0 a. <! ~ ~ <(
<!J
0 0 v
0 0 (')
~ ci (/) C\1 c:: Q)
a ~
~
0
v v ~
3
/
/ I' /
~
/ /
/ vv
v
56 7 89 2 3 4 5 6789
JOB#: 11201 ID#: 29180
/ r"< vu
7 / v
2 ~200 100.0 1000.0 3000.0
Consolidating Pressure SIGMA 1, psf
Plot 15
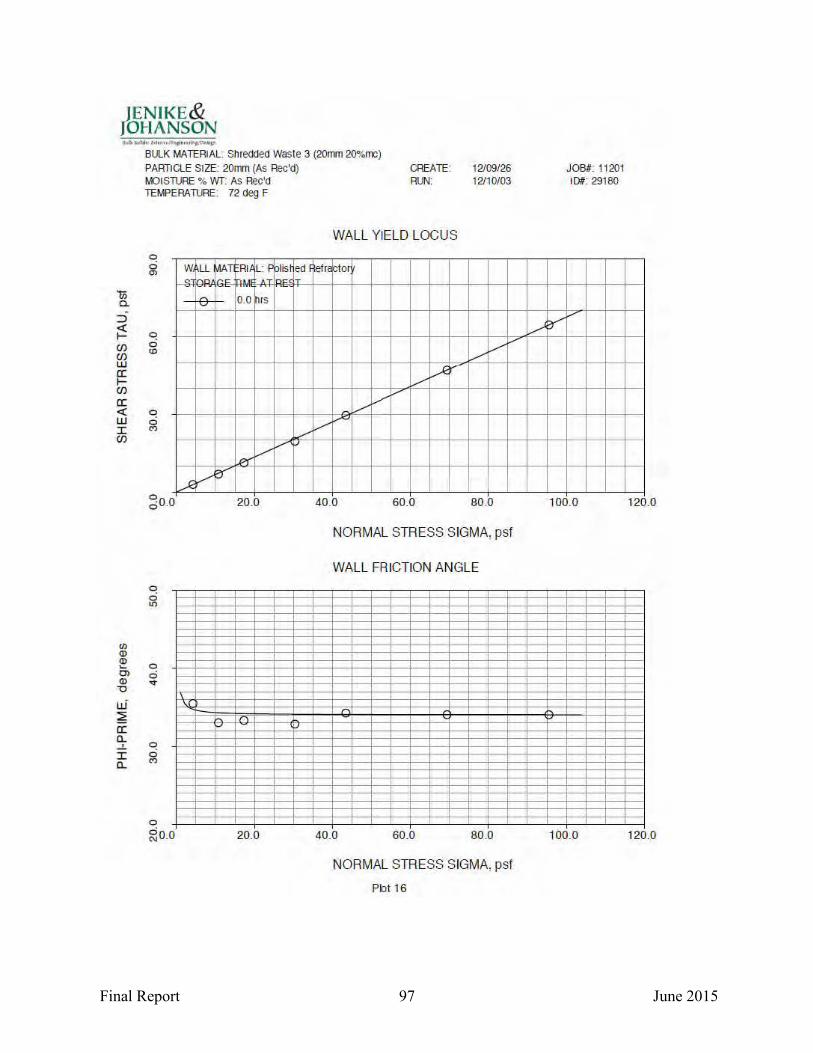
Final Report 97 June 2015
JENIKE& TO HANSON
BULK MATERIAL Shredded Waste 3 (20mm 20%m::) PARTICLE SIZE: 20mm (As Rec'd) CREATE: 12109/26
1i5 0..
::> ~ f-(f) (f) w a: f-(f)
a: ~ w I (f)
VJ Q) Q) ..... C> Q) -o i.U ~ a: ~ I a..
MOISTURE % WT: As Rec'd TEMPERATURE: 72 deg F
0 0 "'
0 0 <0
0 0 C')
0 0 0.0
0 0 ll)
0 0 ..,.
0 0 <')
0
go.o
WtLL ~ ~~n
~ ~
~ v
f,MT Rl' L: p G~ OT
0.0 hrs
R( /
~ I 20.0
20.0
lis
€
/
RUN; 12110/03
WALL YIELD LOCUS
ed Rletrc cto T
/
/ / .....
/ ....--"
,.....
/ /
/
/ _.....,
40.0 60.0 80.0
NORMAL STRESS SIGMA, psf
WALL FRICTION ANGLE
40.0 60.0 80.0
NORMAL STRESS SIGMA, psf
Plot16
/ ~
JOB#: 11201 10#: 29180
,.....
100.0
100.0
120.0
120.0

Final Report 98 June 2015
JENIKE& JOHANSON
BULK MATERIAL: Shredded Waste 3 (20mm 20%mc) PARTICLE SIZE: 20mm (As Rec'd) CREATE: 12109/ 26 MOISTURE % wr: As Rec'd TEMPERATURE: 68 deg F
0 0 N
~ 0
o "' ., "'-"' " ..
""" "'
~ ~ "' g :0 "' (U Q)
E ..... Q)
a...
0 ~ "' ~ .,
.. "'
RUN 12110/03
Permeability vs. Bulk Density
""' "'!'... ~ '~
<.>
~ ~
20.0 Bulk Density GAMMA, pcf
Prot 17
K
"'-0
JOB#: 11201 10#: 29180
"' 'r"-..n
"'-..!'... b._
30.0
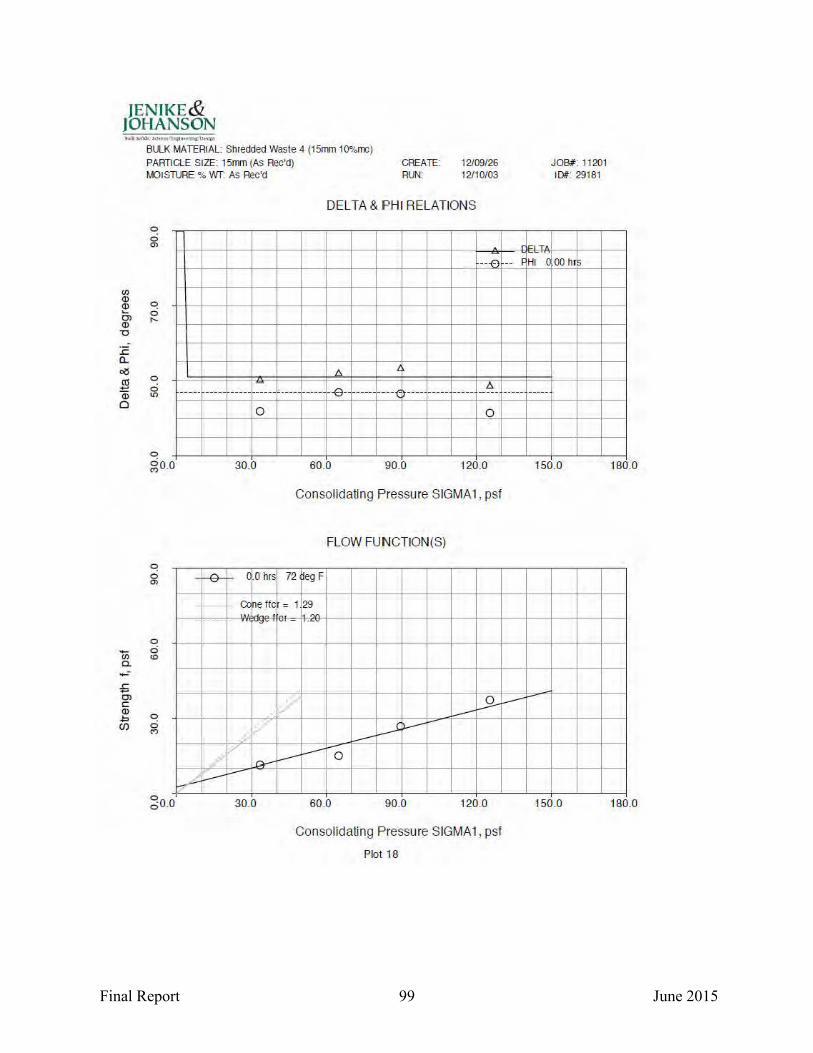
Final Report 99 June 2015
JENIKE& JOHANSON
"iii a. ---6 Ol c::: Q) ~ (f)
BULK MATERIAL: Shredded Waste 4 (15mm 10%mc) PARTICLE SIZE: 15mm (As Rec'd) MOISTURE % Wf: As Rec'd
CREATE: 12109/ 26 RUN 12110/03
DELTA & PHI RELATIONS
JOB#: 11201 10#: 29181
-- -0 -- f HI C 00 hr~
0 0 ....
0
0 II)
0
goo
0 0 Q)
0 0 <0
0 0 <')
cioo
A ----- ----- ----- ----- ---- ----- --e- ----- ----"(; ---- ----- ----- - --- ----- -----
0 0
30.0
"' { 0 hiS ~
-- C< ne ffc - --.- .,,
£),----
----f.--
---- 30.0
60.0 90.0 120.0
Consolidating Pressure SIGMA 1, psf
FLOW FUNCTION(S)
72 eg F
= 1 29
_9-~
----__.1- )..----" -~ 1--- 0
60.0 90.0 120.0
Consolidating Pressure SIGMA 1, psf
Plot 18
150.0
150.0
180.0
180.0
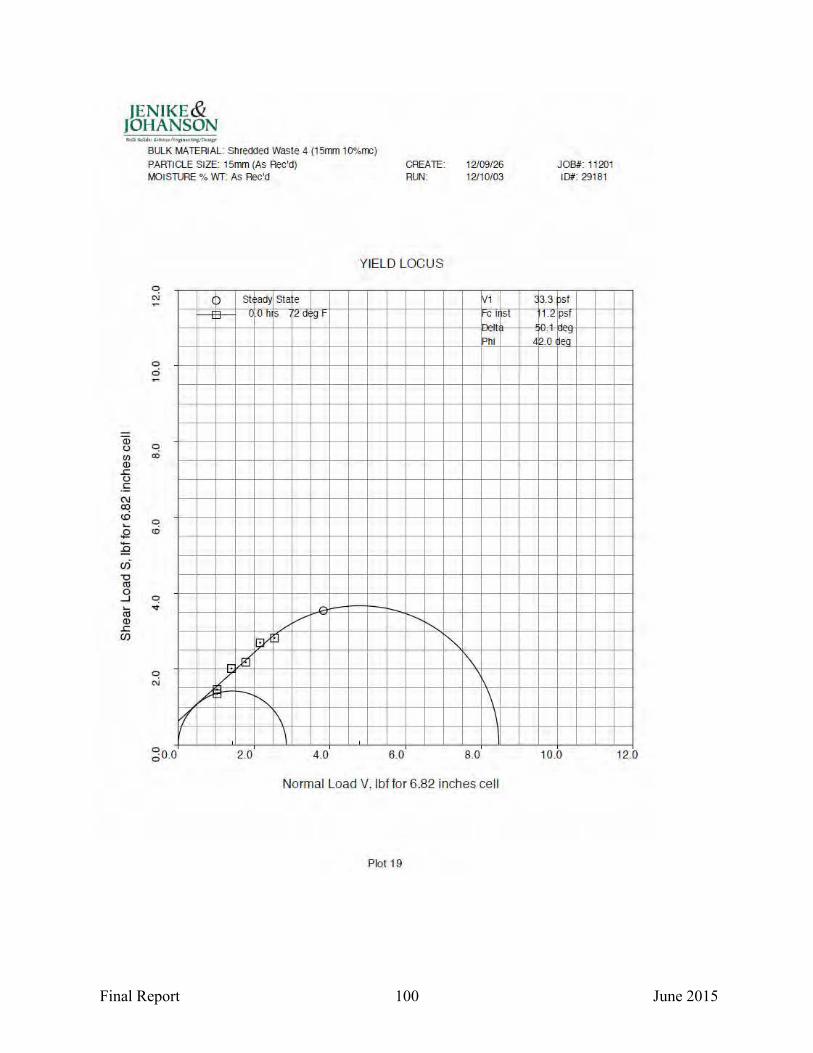
Final Report 100 June 2015
JENIKE& JOHANSON
BULK MATERIAL Shredded Waste 4 (1 5rrun 10%roc) PARTICLE SIZE: 15mm (As fle(:'d} MOISTURE % wr: As Rec'd
CREATE: 12/09/26 RUN 12/10/03
YIELD LOCUS
Qj u VJ OJ ~ u .f: C\J co <ri .... .2 ~ (f) "0 ro 0
...J
00 OJ
.r::: (/)
0 ci
0 a:i
0 a:i
'=< v
0 C\i
p
0:: v ~p
v
St ady Stale ~~ .u n s <!0 gr rG I~SI
Phi
/ ........ ~
~::I
""' .m 1\
""' \ \ \ \
2.0 4 .0 6.0 8.0
Normal Load V, lbf for 6.82 inches cell
Plot 19
3.3 11 .<!
42.0
JOB#: 11201 10#: 29181
sf psr
j;;
10.0 12.0

Final Report 101 June 2015
JENIKE& JOHANSON
BULK MATiERIAL: Shredded Waste 4 (15mm 10%mc)
PARTICLE SIZE: 15mm (As Rec'd) CREATE: 12109/26 MOISTURE % Wf: As Rec'd RUN: 12110/03
YIELD LOCUS
q co 0 St ady tate I V1
() hr< 7? eg..~ "" ·n Delta
Phi
Qi q (.) N til .-Q) r. (.)
.!: C\J co m q ..... .g m
~ (/)-
-o tU 0
...J q ..... <0 tU Q) r. (/)
/ -..... ~ / v
fi )11
q M /
/ .........
" \ cio.o 3.0 6 .0 9.0 12.0
Normal Load V, lb'f for 6.82 inches cell
Plot 20
"""
64.9 1 ~ A
51.9
" '\
JOB#: 11201 ID#: 29181
sf I not
~eg ·~,
\
\ I
15.0 18.0
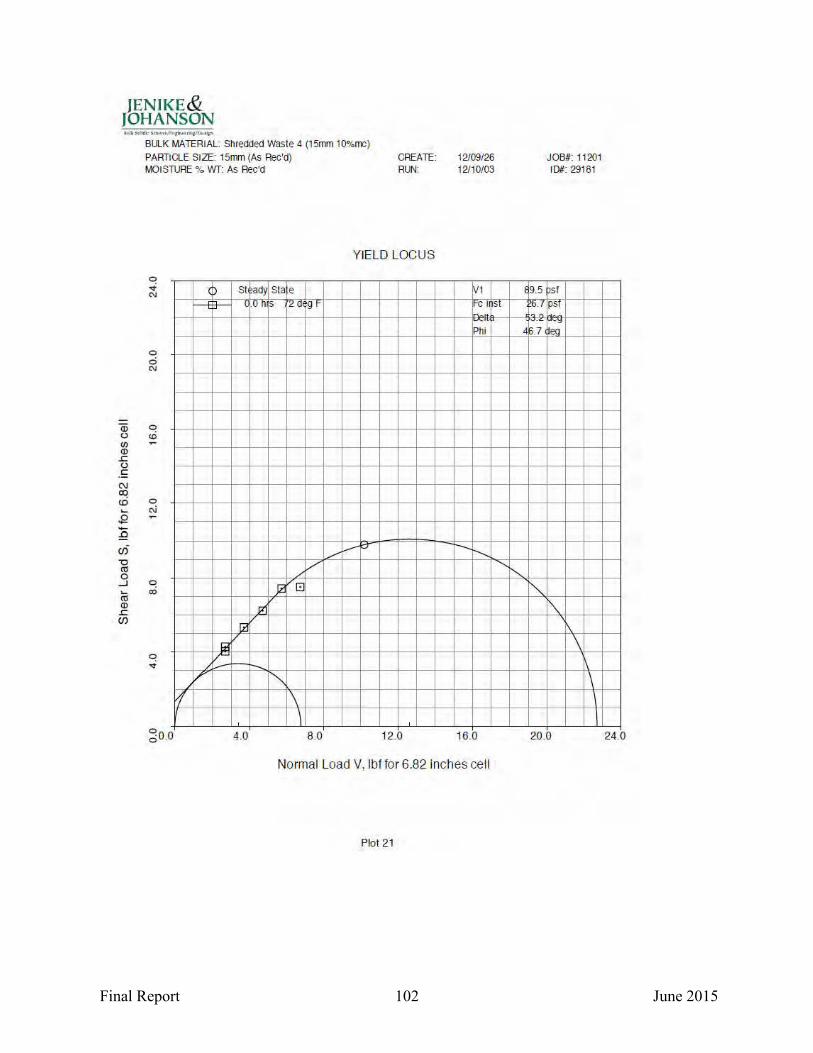
Final Report 102 June 2015
JENIKE& JOHANSON
BULK MATERIAL: Shredded Waste 4 (15mm 10%rm) PARTICLE SIZE: 15mm (As Rec'd) MOISTURE % wr: As Rec'd
CREATE: 12/09/26 RUN 12/10/03
YIELD LOCUS
p St ad) Sta e VI .u n s <!0 gr -c I~Sl
Belt
Qi u (/)
CD ~ u .!: C\J CXl cri ~
$2
~ (f) "0 <ll 0
...J ~
<ll CD
.I:: en
0 d C>J
0 ,.;
0 C\i ~
q CX>
0 -.i
1
0
Ill !:il
V"'
/'
4.0
Phi
_..... -~ ---...... / -....,
J2 ' [!:
"' \ \
8 .0 12.0 16.0
Normal Load V, lbf for 6.82 inclhes cell
Plot 21
JOB#: 11201 ID#: 29181
19.5 sf
r:>J psr
. -~
4 .7 ~ea
" ""' "' f\
\
\
20.0 24.0
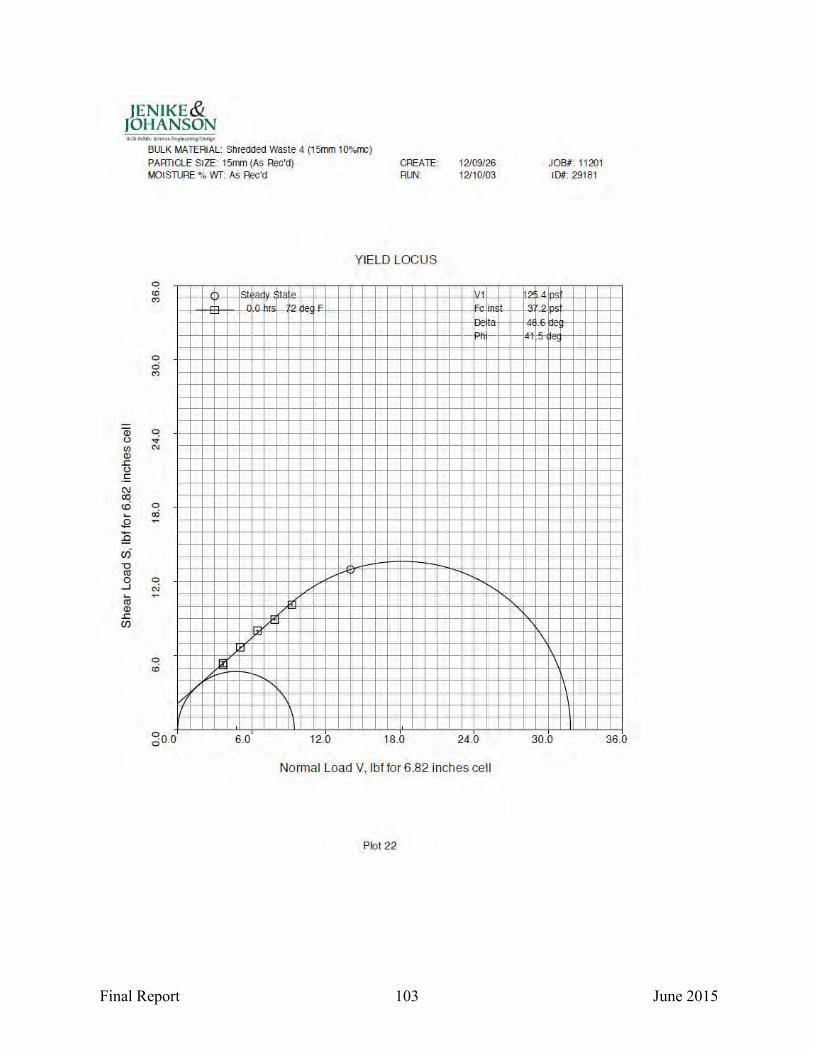
Final Report 103 June 2015
JENIKE& JOHANSON
BULK MATERIAL Shredded Waste 4 (15mm 10%rm) PARTICLE SIZE: 15mm (As Rec'd) CREATE: 12/09/26
Qi (.)
VJ (]) .t:: (.)
.£ N CXl <ri ~
.g
~ <Ji "0 <ll 0
...J
(ij (]) .t:: (/)
MOISTURE % WT: As Rec'd
0 d (')
'=! "' C\J
0 a:i ~
0 .,_; ~
0 tri
/?
~
/
lc:t, >~·
In r
),-, r-
~
r--..
6.0
RUN: 12/10/03
YIELD LOCUS
·~,. '" VI
[? ~
v r-. ......_
lri' /
II 12.0 18.0 24.0
Normal Load V, lbf for 6.82 inches cell
Plot 22
,,, .,. , ..,
\
JOB#: 11201 ID#: 29181
IM
0
r•>
\
\
30.0 36.0

Final Report 104 June 2015
JENJKE& JOHANSON
BULK MATERIAL: Shredded Waste 4 (15mm 10%rm) PARnCLE SIZE 15mm (As Rec'd) MOISTURE % wr: As Rec'd TEMPERATURE: 72 deg F
CREATE: 12/09/26 RUN: 12110/03
BU LK DENSITYVS. CONSOLIDAT ING PRESSURE
0 ci "'
JOB#: 11201 10#: 213181
IL ,4
/ /v
0 0 'U (\j
a. <( ~ ::2 <( Ci ;?;·u; c:: (])
0 .><:
~
0 ci
0 .,;
~200
v
v v
3 4
/
~ /
/
v 0
v v /
vv
5 6 1 8 9 2 3 4 5 6 7 8 9 2 100.0 1000.0 3000.0
Consolidating Pressure SIGMA 1, psf
Plot 23

Final Report 105 June 2015
JENIKE& JOHANSON
BULK MATERIAL: Shredded Waste 4 (15mm 10%rm) PARTICLE SIZE 15mm (As Rec'd) CREATE: 12/09/26 MOISTURE % WT: As Rec'd TEMPERATURE: 72 deg F
0 ci m W Ll 111ATfR1 ~ L: F plis
'~'
Vi c. - -e- - 0.0 ~rs
:::1
~ 0
(/) ci (/)
<D
w a: 1-(/)
a: <{ 0 w ci I C')
(/) ..A
~ v
.....e /~
cio.o 20.0
0 ci "'
(J) (]) (])
0 C» ci (]) ... "0
w ~ a: ~ 0
I ci a.. C')
0
~00 20.0
RUN: 12/10/03
WALL YIELD LOCUS
ed Rlefr cto
...-....-
v v v ~ /
,e / /
/
40.0 60.0 80.0
NORMAL STRESS SIGMA, psf
WALL FRICTION ANGLE
40.0 60.0 80.0
NORMAL STRESS SIGMA, psf
Plot 24
~ ,......
JOB#: 11201 10#: 29181
-
100.0
100.0
120.0
120.0
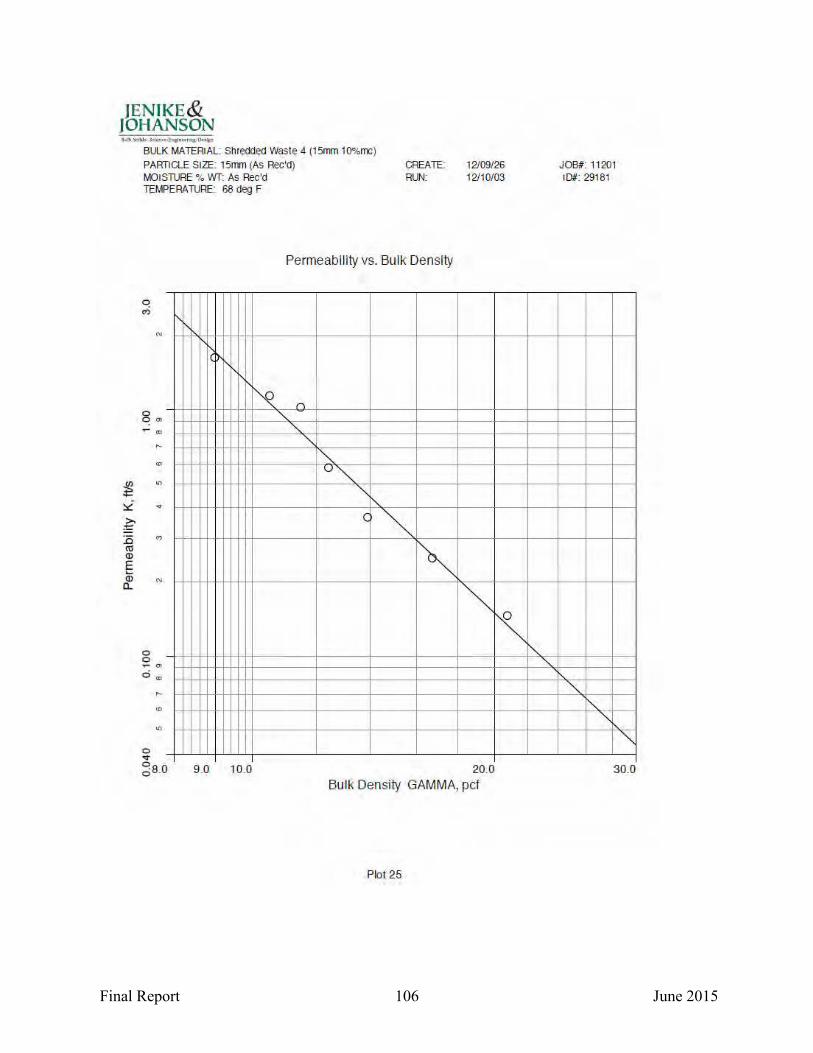
Final Report 106 June 2015
JENIKE& JOHANSON
BULK MATERIAL: Shredd~d Waste 4 (1 5mm 10%mc)
PARTICLE SIZE: 15mm (As Rec'd) CREATE: 12/09/ 26
~ '::i g :0 ro Q)
E .... Q) a.
MOISTURE % Wf: As Rec'd TEMPERATURE 68 deg F
0 0 <» ~ .,
0 0
,._
"" "'
"'
"'
~ "' d .,
0 v 6s.o
~
9.0 10.0
RUN: 12/10/03
Permeability vs. Bulk Density
_n
"-
"" "" ~ """' "" " (~
~ ~ ~
20.0 Bulk Density GAMMA, pet
Plot 25
"' "-
JOB#: 11201 ID#: 29181
""" I'-. ""
""" 30.0
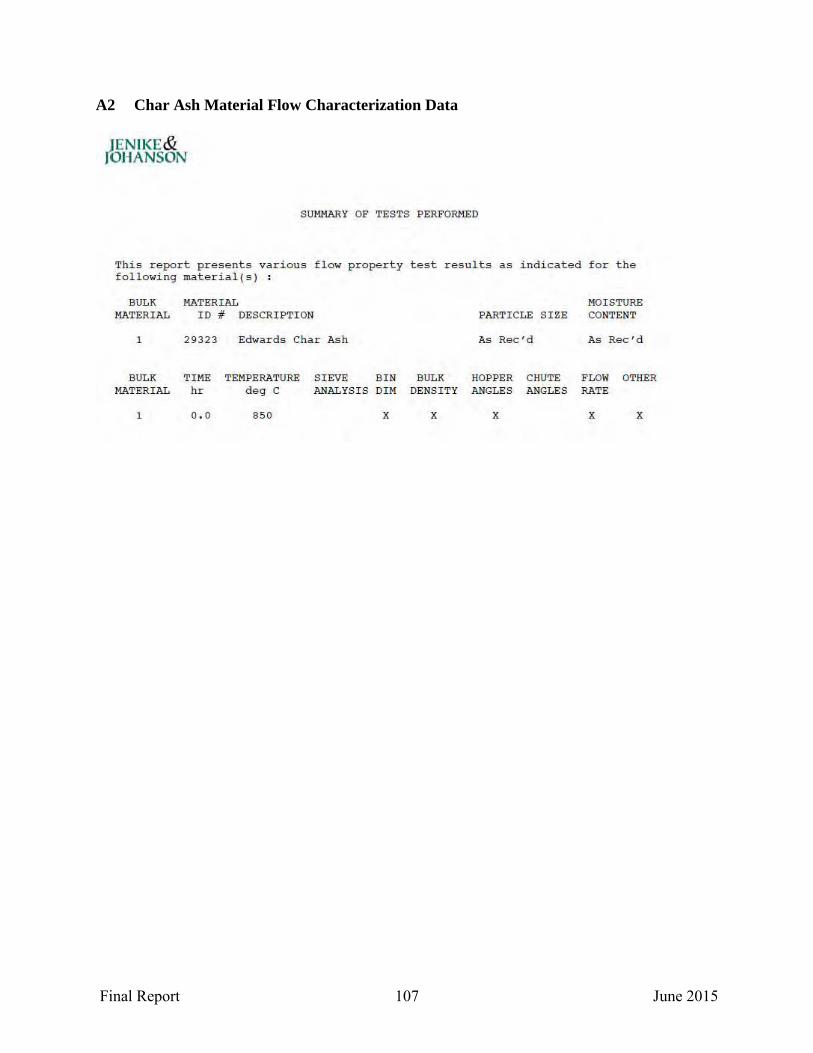
Final Report 107 June 2015
A2 Char Ash Material Flow Characterization Data
JENIKE& JOHANSON
SUMMARY OF TESTS PERFORMED
This report p r esents vari ous flow p roperty test results as i ndi cated for the f o l lowi ng mater ial (s)
BULK HATERIAL MATERIAL I D # DESCRIPTI ON
1 29323 Edwards Char Ash
BULK TI ME TEMPERATURE MATERIAL hr deg C
1 o. o 850
SIEVE BIN ANALYSI S DUI
X
HOI STURE PARTICLE SIZE CONTENT
As Rec'd As Rec'd
BULK HOPPER CHUTE DENSI TY ANGLES ANGLES
X X
FLOW OTHER RATE
X X

Final Report 108 June 2015
JENIKE& JOHANSON
BULK MATERIAL 1: Edwards Char Ash
PARTI CLE SI ZE As Rec'd
MO I STURE CONTENT As Rec'd
SECTION I. BI N DIMENSIONS FOR DEPENDABLE FLOW
Stor age Time at Rest 0 . 0 hrs Tempera tur e B50 deg C
PART A. BINS WITH UNLIMITED MAXH!UM SI ZE
Optimum Mass Flow Di mensi ons P-Factor BC feet
1. 00 1. 25 1.50 2 . 00
Funnel Flow Dimensi ons P-Factor BF ( feet) EH=
0 . 2 0 . 2 0 . 3 0 . 3
BP f eet
0 .1 0 .1 0 .1 0 .1
0 . 5 1 . 0 2 . 5 5 10 Critical Rathol e Di amet ers, OF (feet )
1.00 0 . 1 0 .7 1 . 0 2 .1 3.B 7 1.25 0 . 1 1.50 0 . 2 2 . 00 0 . 2
TERMS P-FACTOR = overpressur e f act or BC recommended min i mum out let diameter, conical hopper BP recommended min i mum out let width , s lotted or oval out let BF min i mum wi d t h of r ectangul a r outl e t i n a f unnel flow bin EH e f fective consol ida t i ng head
13 feet
10

Final Report 109 June 2015
JENIKE& JOHANSON
BULK t1ATERIAL 1: Edwar ds Char Ash
PARTICLE SIZE As Rec'd
~!OISTURE CONTENT As Rec'd
SECTION II. SOLIDS DENSITY
TEMPERATURE 22 deg C
BULK DENSITY The bulk density, G~~. is a f uncti on of the major consolida ting pressure, SI GMA1, expressed in terms of e ffec t ive head, EH.
EH (feet) 0.5 1. 0 2.5 5.0 10 . 0 20. 0 40. 0 80. 0
SIG~~1 ( psf ) 13. 26. 67. 137. 282 . 580 . 1193. 2455.
G~~ (pcf) 25. 1 25.8 26.7 27.4 28 . 2 29. 0 29.8 30 . 7
COMPRESSIBILITY P.ARAMETERS
Bul k density, G~tMA, is a function of the major consolidat ing pressur e SIG~~1, as fol l ows:
G~
BET AM G~ (SIGMA1/SIG~! + 1)
For G~ between 25.6 and 30 .9 pcf
Minimum bulk. density G~!MAM = 22 . 9 pcf
SIG~! = 1. 27 psf
BET~! = 0 .03884

Final Report 110 June 2015
}EN IKE& JOHANSON
BULK MATERI AL 1 : Edwards Char Ash
PARTI CLE SIZE As Rec'd
NOI STURE CONTENT As Rec'd
SECTION III. MAX I MUM HOPPER ANGLES FOR ~lASS FLOW
WALL MATERIAL: Pol ished Ref ractory STORAGE THlE AT REST 0 . 0 hr s TEMPERATURE 850 deg C
HOPPER ANGLES FOR VARIOUS HOPPER SPANS
Dia of Cone (feet) 1. 62 4. 00 8 . 00 16.0 0 37. 09 Wi dth of Oval ( f eet) 0 .92 2.20 4 . 30 8.52 19.63
s i mlA (psf ) 13.1 36 . 2 79. 170. 420. S I GMA1 ( psf ) 24.8 65 . 5 138. 294. 716.
Wa l l Fr i ction Angl e PHI-PRI ME (deg) 46 . 43 . 41. 39. 37.
Hopper Angles THETA- P (deg ) 8. * 9 . * 11.* 12.* 13.* THETA- C (deg) 0 . * 0 . * 1. * 2. * 2. *
* Flow along wal l s is questionable.
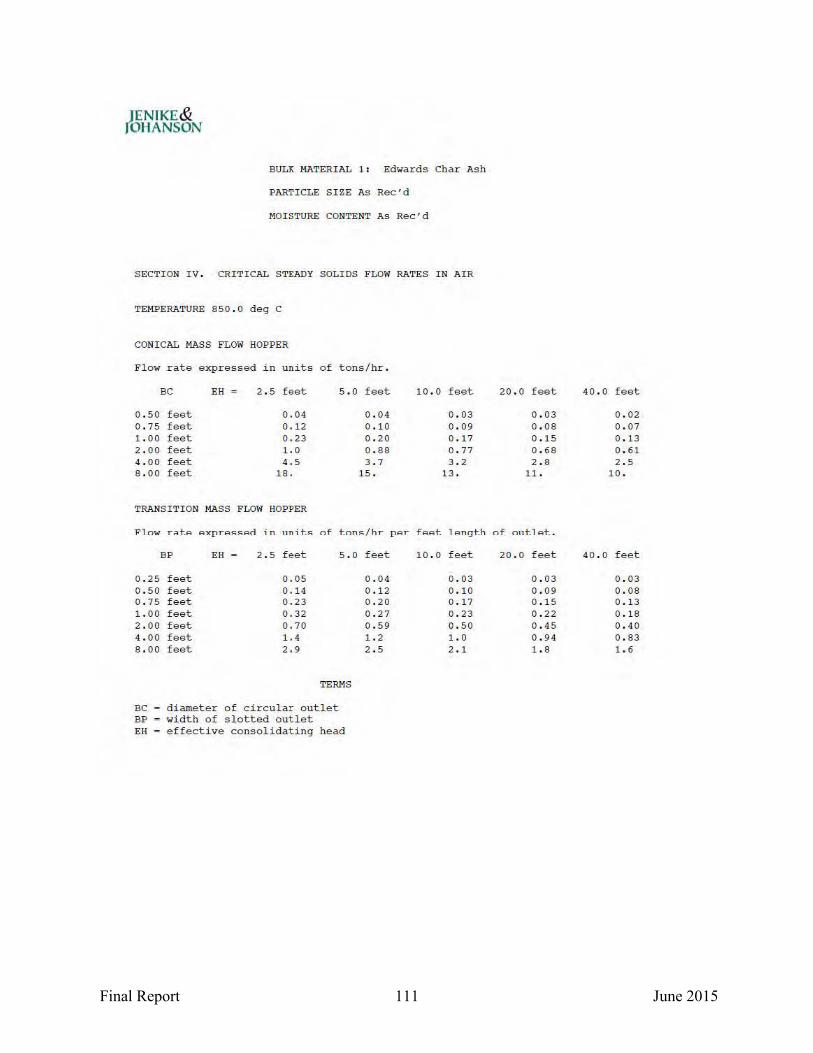
Final Report 111 June 2015
JENIKE& JOHANSON
BULK MATERIAL 1: Edwar ds Char Ash
PARTICLE SIZE As Rec'd
MOI STURE CONTENT As Rec ' d
SECTION I V, CRITICAL STEADY SOLIDS FLOW RATES IN AIR
TEMPERATURE 850 . 0 deg C
CONICAL MASS FLOio HOPPER
F l ow rate expressed in units of tons/hr.
BC EH = 2.5 feet 5.0 feet
0 .50 feet 0 . 04 0 . 04 0 . 75 feet 0 . 12 0 .10 1. 00 f eet 0 . 23 0 .20 2. 00 feet 1. 0 0 . 88 4. 00 feet 4.5 3.7 8.00 f eet 18 . 15.
TRANSITI ON MASS FLOW HOPPER
"F l ow r .::. t.A AX:prP.~~Aci i n nn i t .!=: o f t.on<;/hr pAr
BP EH = 2.5 feet 5.0
0 .25 feet 0 . 05 0 .50 feet 0 . 1 4 0 .75 feet 0 . 23 1. 00 feet 0 . 32 2. 00 feet 0 . 70 4. 00 feet 1. 4 8.00 feet 2.9
TERMS
BC d i ameter of c ircul a r outlet BP width of slotted out let EH effective consol idat ing head
feet
0 . 04 0 .12 0 .20 0 .27 0 .59 1.2 2.5
10.0 feet
0 .03 0 .09 0 .17 0 .77 3.2
13.
fAAt. 1 An<Jt.h
10 . 0 feet
0 .03 0 . 10 0 .17 0 .23 0 .50 1.0 2 . 1
20.0 feet 40.0 feet
0 . 03 0 . 02 0 . 08 0 . 07 0 . 15 0 .13 0 .68 0 . 61 2 . 8 2 . 5
11 . 10 .
of o n t .l At . •
20.0 feet 40 . 0 feet
0 . 03 0 . 03 0 .09 0.08 0 . 15 0. 13 0 . 22 0 .18 0 .45 0.40 0 . 94 0 . 83 1.8 1.6
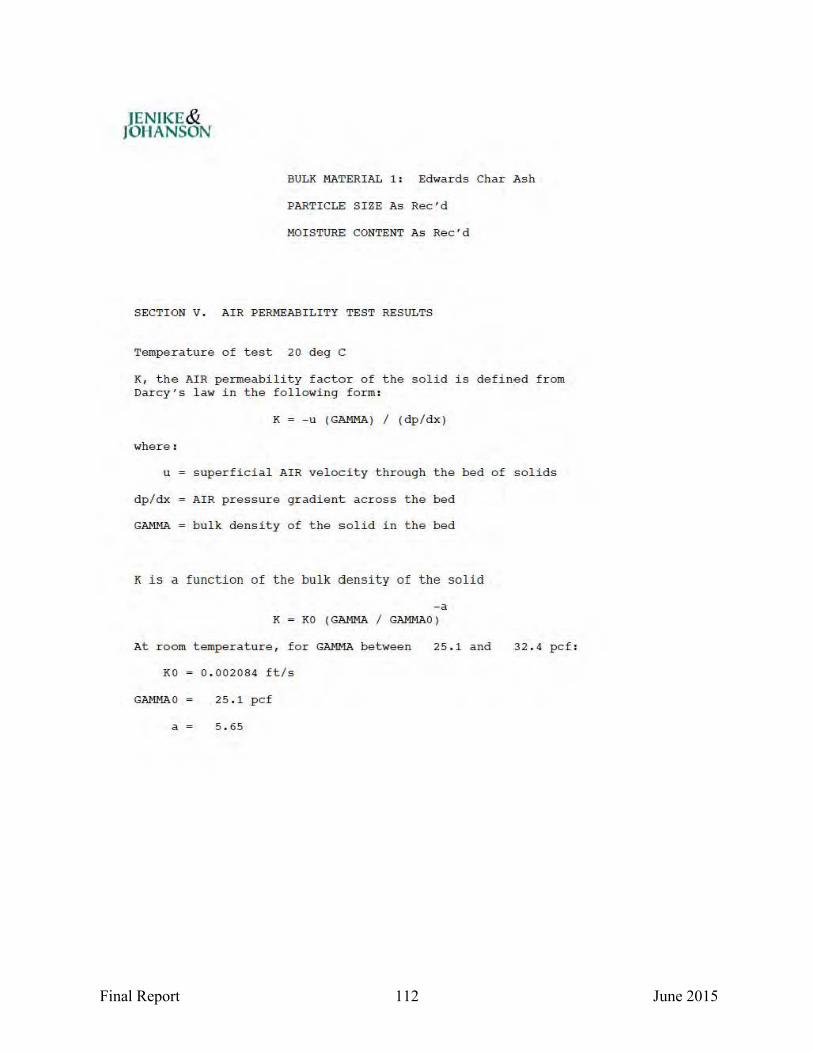
Final Report 112 June 2015
)ENIKE& JOHANSON
BULK MATERI AL 1: Edwards Char Ash
PARTI CLE S I ZE As Rec'd
MO I STURE CONTENT As Rec'd
SECTION V. AI R PERMEABILITY TEST RESULTS
Temp era t u r e of t est 20 deg C
K, t he AI R permeabi lity f ac t or of t he soli d is defi ned f r om Dar cy ' s l aw i n t he followi ng f o r m:
K = - u (GAMMA) I ( dp l dx)
wher e :
u = s uperfi cial AIR vel oci ty t hrough the bed of .solid s
dp/dx AIR p r ess ure g rad i ent acr oss the bed
GAM/o!A bu lk density o f the solid in the bed
K is ~ functi on of the bulk density of t he solid
-a K = KO (GAMMA I GAMMAO)
At r oom temper a ture , f or GA}~lA bet ween 25 . 1 and
KO 0 . 002084 f tls
GAMMAO 25 . 1 p c f
a = 5 . 65
32 . 4 pc f:

Final Report 113 June 2015
{j) a. ...:
.£; Cl c::: Q) ~ (/)
JENIKE& JOHANSON
BULK MATERIAL: Edwards Char Ash PARTICLE SIZE As Rec'd MOISTURE % WT: As Rec'd
CREATE: 12111/ 19 RUN: 12112102
0 0 m
q 0 ....
0
0 Ll)
0
go.o
0 0 ~
0 0 "'
0 0 ex>
cioo
\
1\
I<
80.0
80.0
DELTA & PHI RELATIONS
160.0 240.0 320.0
Consolidating Pressure SIGMA 1, psf
FLOW FUNCTION(S)
160.0 240.0 320.0
Consolidating Pressure SIGMA 1, psf
Plot 1
l
J OB#: 11201 ID#: 29323
400.0
400.0
480.0
480.0
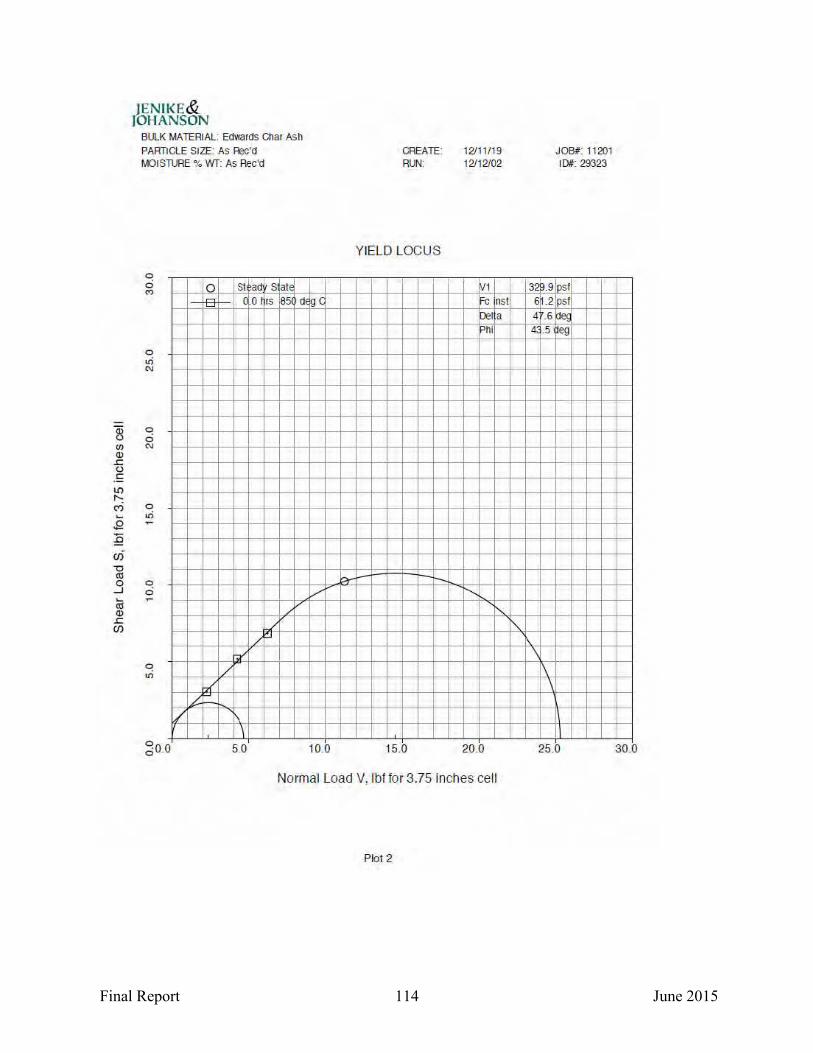
Final Report 114 June 2015
Qi u (/) (])
.£:: u .f: 1.0 1'-: C')
~
.e ;Q (f) '0 Cll 0
...J ~
Cll (])
.s:::. (/)
)ENII<E& JOHANSON
BULK MATERIAL: Edwards Char Ash PARTICLE SIZE: As R:ic'd MOISTURE % Wf: As Rec'd
0 ci (') lo St ad satE
I ~ c 0 rs 85 d g c
0 lri (\J
0 ci (\J
0 lri ~
0 ci ~
0 .,.;
0 000
L I/
b" /
~ ,___
i\
\ 5.0
/ v
/ /
"-'
10.0
CREATE: 12/11119 RUN: 12/12/02
YIELD LOCUS
V1 Fe nst
Del a Phi
::;:y -- I' ['...
15.0 20.0
Normal Load V, lbf for 3.75 inches cell
Plot 2
'\.
329.9 6 .2 4 .6 II; .5
\
1\ \
JOB#: 11201 I D#~ 29323
PSI psi
de<; eg
1 25.0 30.0
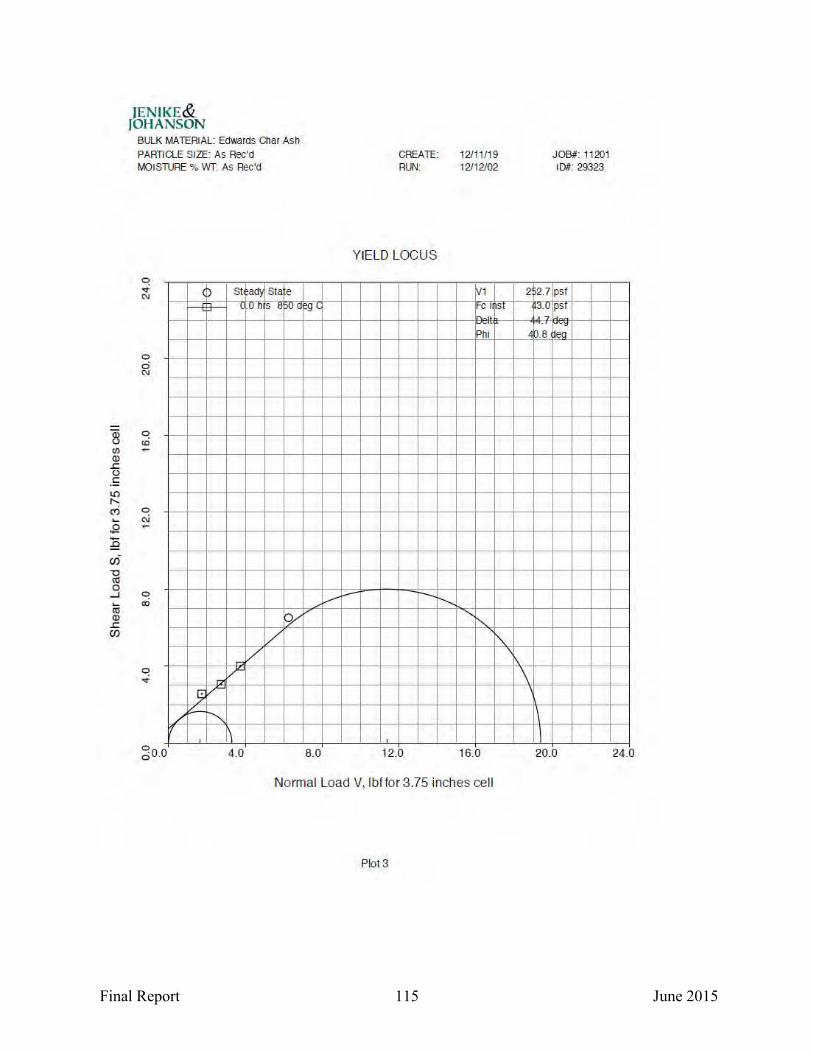
Final Report 115 June 2015
~ (/) Q) .c u .!: ll)
" co; ..... s ._ :9 (jj -o l'll 0
...J ..... l'll Q) .c (/J
JENIKE& JOHANSON
BULK MATERIAL: Edwards Char Ash PARTICLE SIZE: As Rec'd MOISTURE % Wf: As Rec'd
0 ci N
~
"' ~
0 C\i ~
~ CD
0 -i
/ ~
?---
)
,.., /
""'
St ad)o Stae ~o-n s !j pu o
fY v
v v
1\ 4.0
CREATE: 12/11/19 RUN 12/12/02
YIELD LOCUS
~l ~r Phi
v :-- r-- r-...... " !'--..
~
8.0 12.0 16.0
Normal Load V, lbffor 3.75 inches cell
Plot 3
2 2.7 l::l.U ~
0.8
\
I
JOB#: 11201 10#: 29323
psf psi
i;;
20.0 24.0

Final Report 116 June 2015
a; (.)
(JJ C]) .c (.)
.~ ll) ,.__
"' .... s ] CJ) "0 al 0
...J .... al C]) .c CIJ
JENIKE& JOHANSON
BULK MA TERJAL: Edwards Char Ash PARnCLE SIZE As Rec'd MOISTURE % wr: As Rec'd
0 C\i <P st ' ady stae
t.un s t )U C
0 6
0 a:i
0 a:i
q ....
rx /
/ 0
q C\l lv(
)P / e.-~
If
0 00.0 2.0
CREATE: 12111/19 RUN: 12112102
YIELD LOCUS
V1 gl 1-C I 51 ...
Phi
..........
" '\ \
\ \ I
4.0 6.0 8.0
Normal Load V, lbf for 3.75 inches cell
Plot4
1 9.0
Wts ~
JOB#: 11201 10#: 29323
psi pst
. · ~:.
4S.71iloo
10.0 12.0

Final Report 117 June 2015
JENIKE& JOHANSON
BULK MATERIAL: EdWards Char Ash PARTICLE SIZE: As Rec'd MOISlURE % Wf: As Rec'd TEMPERATURE: 22 deg C
CREATE: 12/11/19 RUN: 12/12/02
BULK DENSITY VS. CONSOLIDATING PRESSURE
u c. <(
0 ci v
~ 0 ~ 0 <( "' <!.)
~ ·u; c:: Q)
c ~
di
0
__;:-- ----
2
K-~ trl h h
........,
fe ~ ~ ~
3 4 56789 2 3 4 567 8 9
JOB#: 11201 ID#: 29323
cJ)- :S---~
2 g1o.o 100.0 1000.0 3000.0 Consolidating Pressure SIGMA 1, psf
Plot 5

Final Report 118 June 2015
1il 0..
=> ~ 1-(/) (/) w f!: (/)
0: ~ w :r: (/)
VJ Q) Q)
0, Q) "0
lJi ~ 0:
~ :r: 0..
JENII<E& JOHANSON
BULK MATERIAL: Edwards Char Ash PARTICLE SIZE: As Rec'd MOISTURE % WT: As Rec'd TEMPERATURE 850 deg C
0
CREATE: 12111/19 RUN 12112102
WALL YIELD LOCUS
0 0 fV \l ~JfT oF
1
1 L:l F o1'151 I I
e Rle r ctpr "' pi G l!JU TR
0 0 0 ....
0 0 0 N
.&
l!;i,.( 80.0
0 0 ....
0 0 <')
80.0
T
i-'1r
160.0 240.0 320.0
NORMAL STRESS SIGMA, psf
WALL FRICTION ANGLE
160.0 240.0 320.0
NORMAL STRESS SIGMA, psf
Plot 6
JOB#: 11201 10#: 29323
:r
400.0
400.0
480.0
480.0

Final Report 119 June 2015
JENII<E& JOHANSON
BULK MATERIAL: Edii<Uds Chai Ash PARTICLE SIZE As Aec'd MOISTURE % WT: As Rec'd TEMPERATURE: 20 deg C
CREATE: 12/11/19 RUN: 12112102
Permeability vs. Bulk Density
0 a:> 0 ~ .... 0
"'
~
~ 0
~~ 0
c~ "' = 0 (0
:0 aJ .... Q)
E "' .... Q)
a.. "'
0 0
0 0
6200
""" ""' "" f\.. ~
" ~ 0"' ~
~ ~
"' cp__
~ 0..
I~
30.0 Bulk Density GAMMA, pel
Plot 7
~
JOB#: 11201 ID#: 29323
"\,
~ ~
40.0
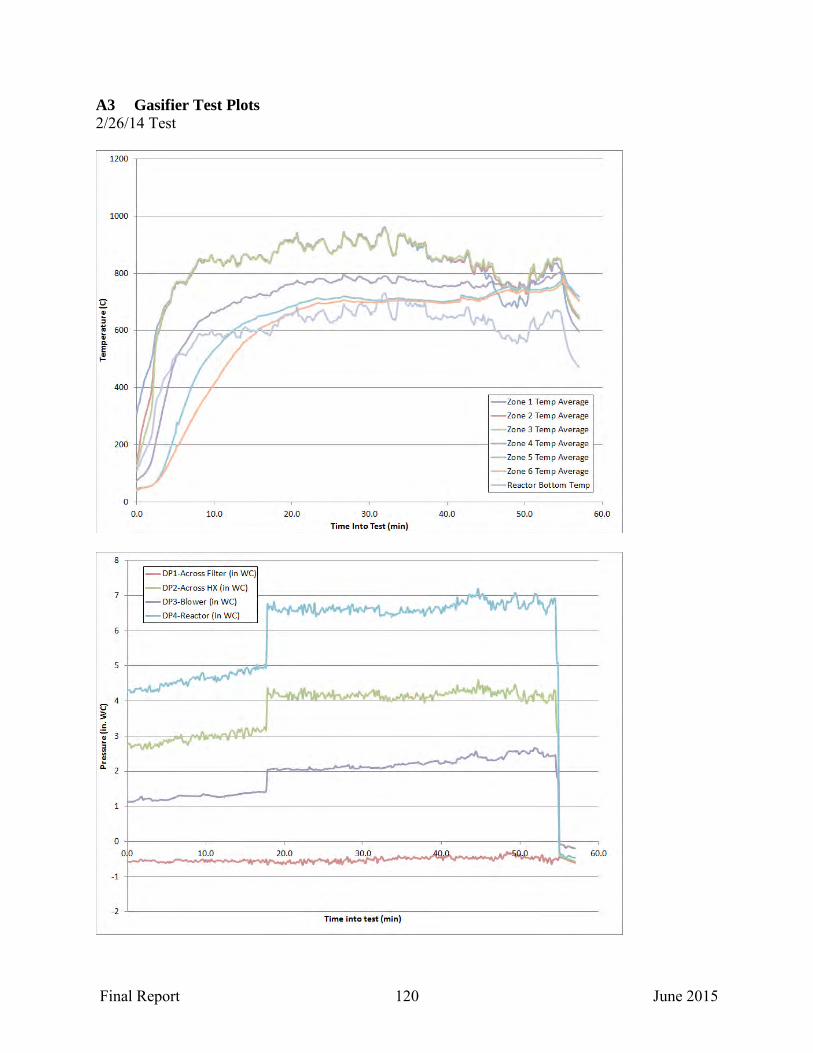
Final Report 120 June 2015
A3 Gasifier Test Plots 2/26/14 Test
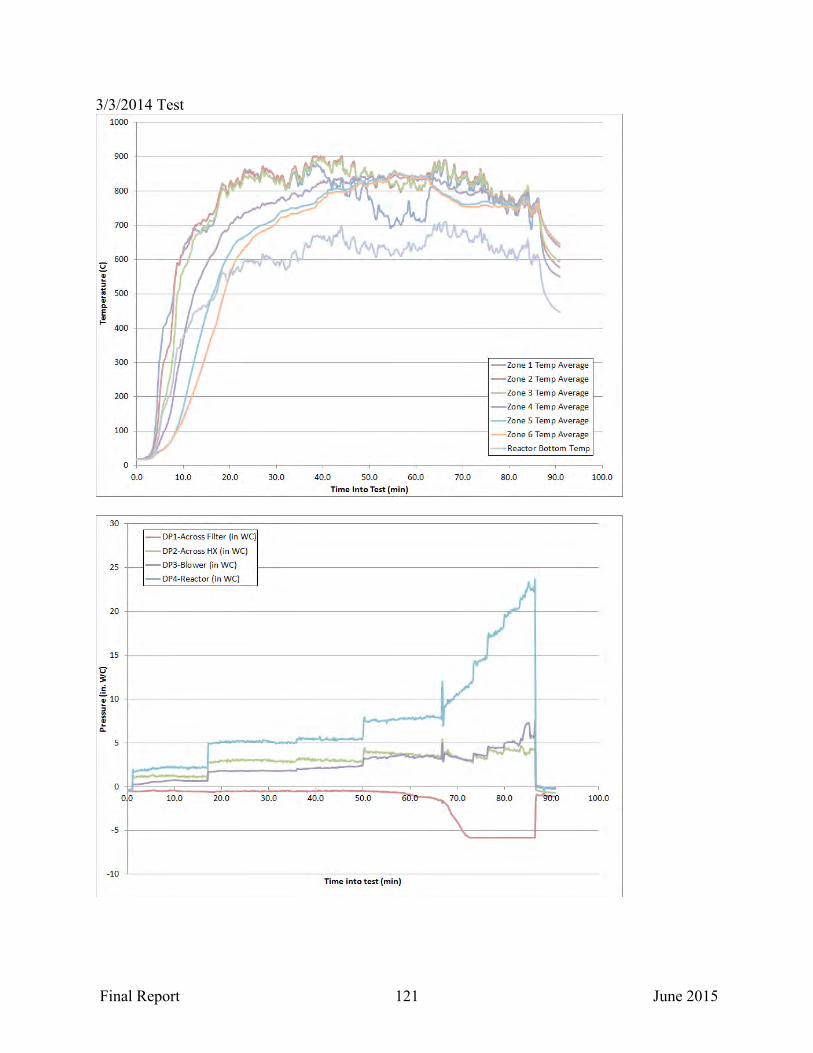
Final Report 121 June 2015
3/3/2014 Test
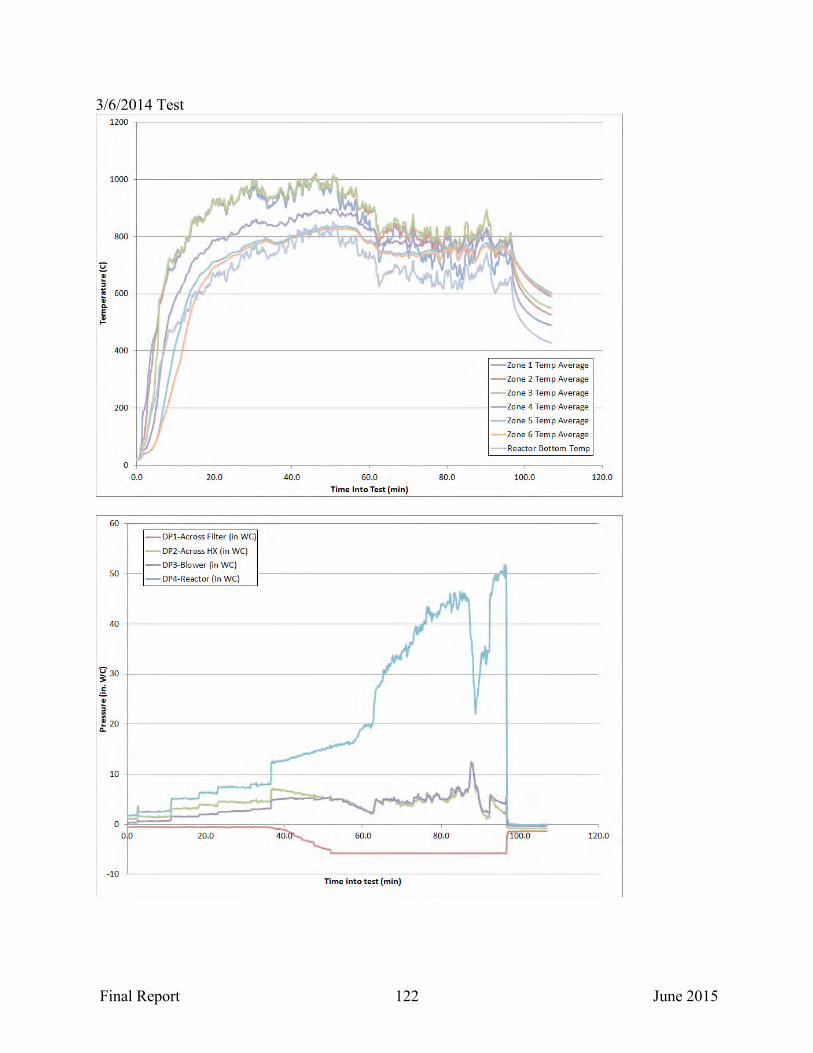
Final Report 122 June 2015
3/6/2014 Test

Final Report 123 June 2015
4/25/2014 Test

Final Report 124 June 2015
5/9/2014 Test

Final Report 125 June 2015
5/13/2014 Test
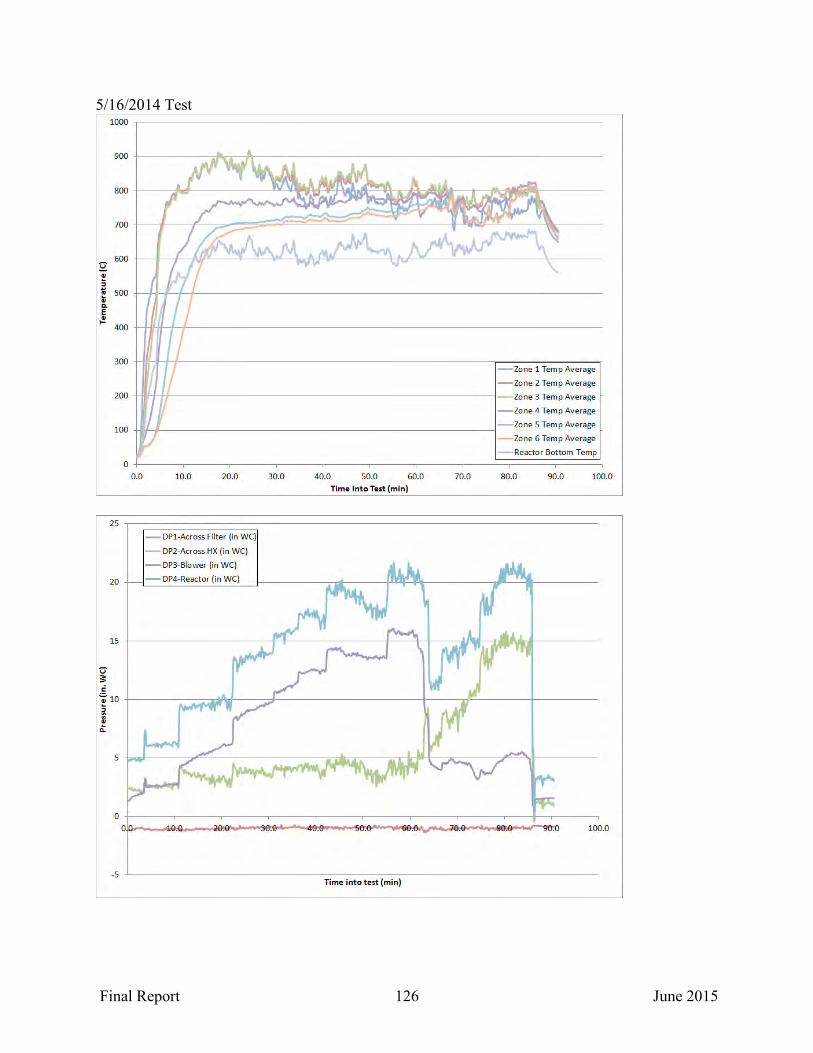
Final Report 126 June 2015
5/16/2014 Test
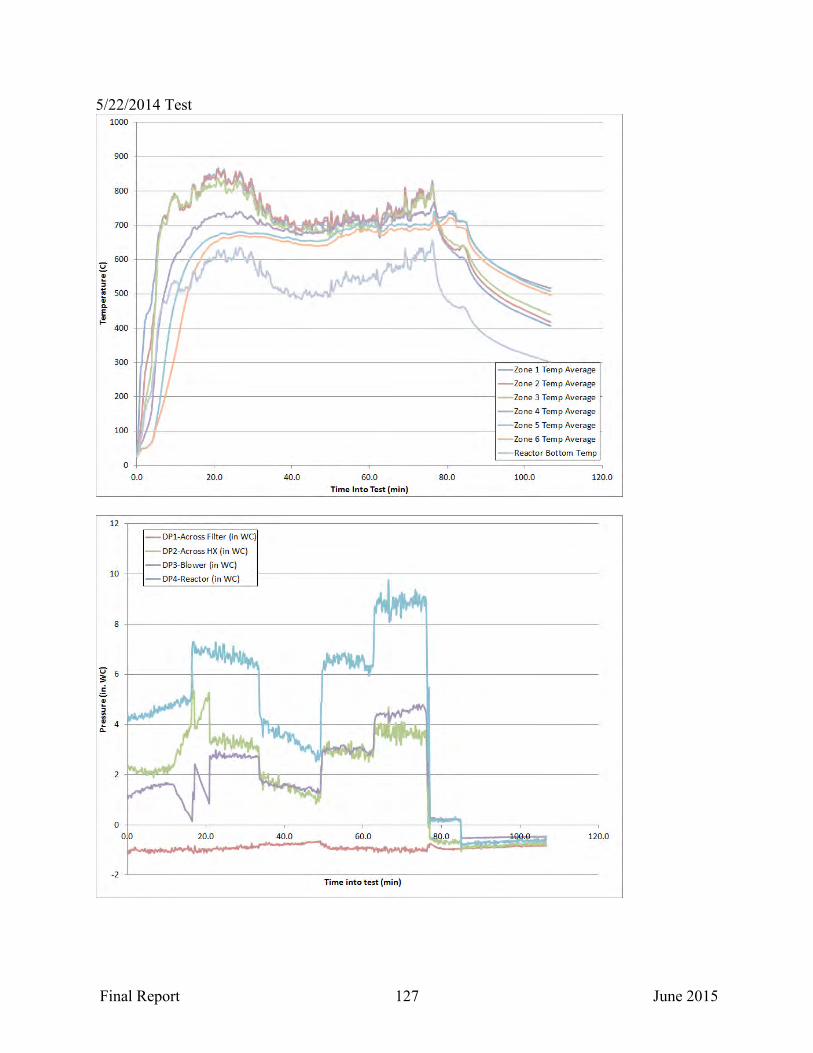
Final Report 127 June 2015
5/22/2014 Test

Final Report 128 June 2015
6/5/2014 Test
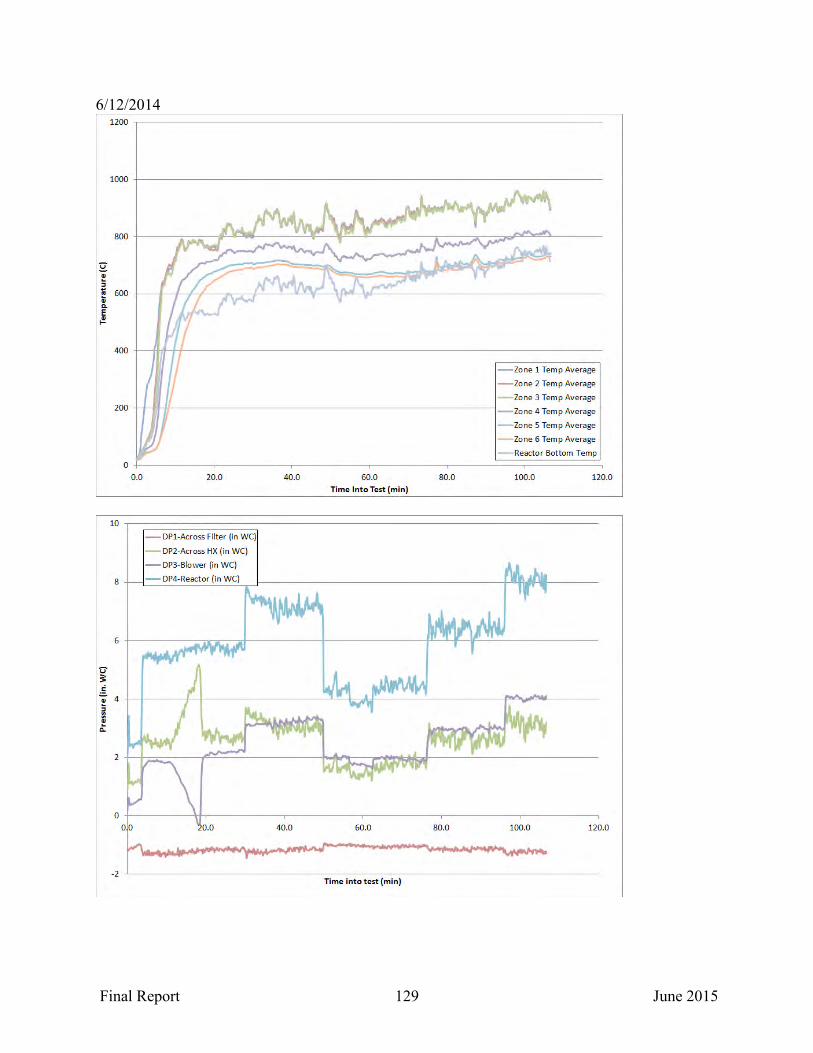
Final Report 129 June 2015
6/12/2014

Final Report 130 June 2015
8/28/2014 Test

Final Report 131 June 2015
9/5/2014 Test
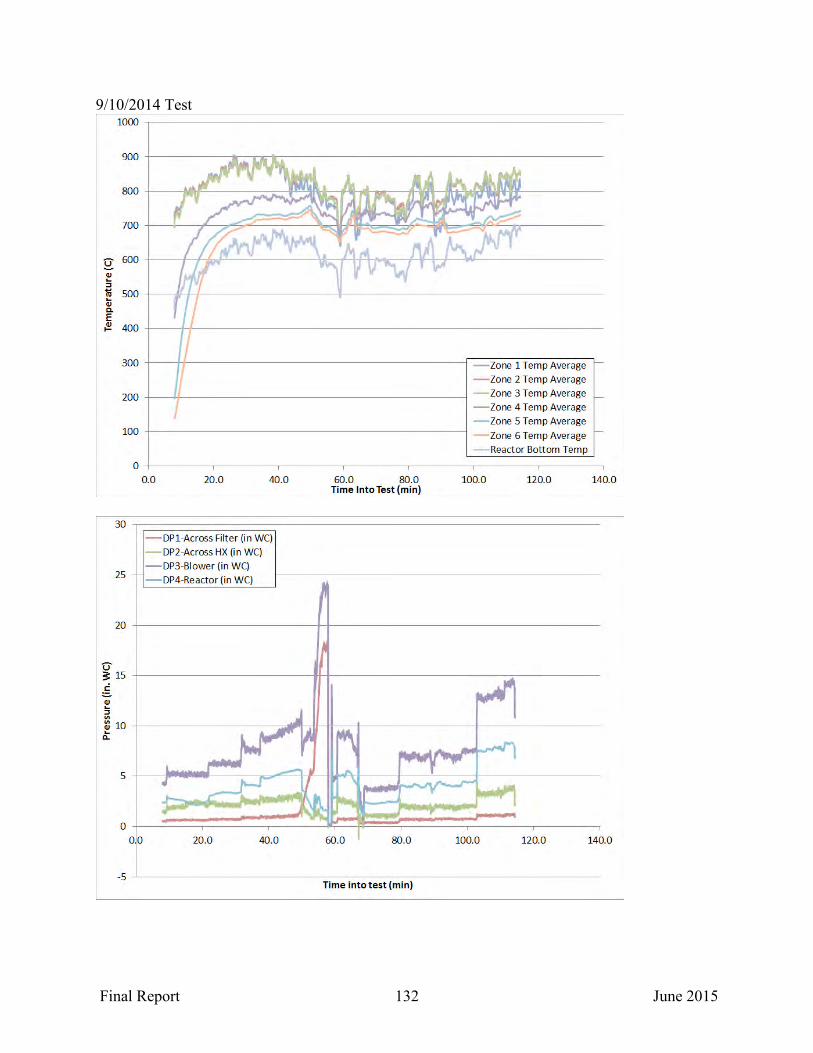
Final Report 132 June 2015
9/10/2014 Test
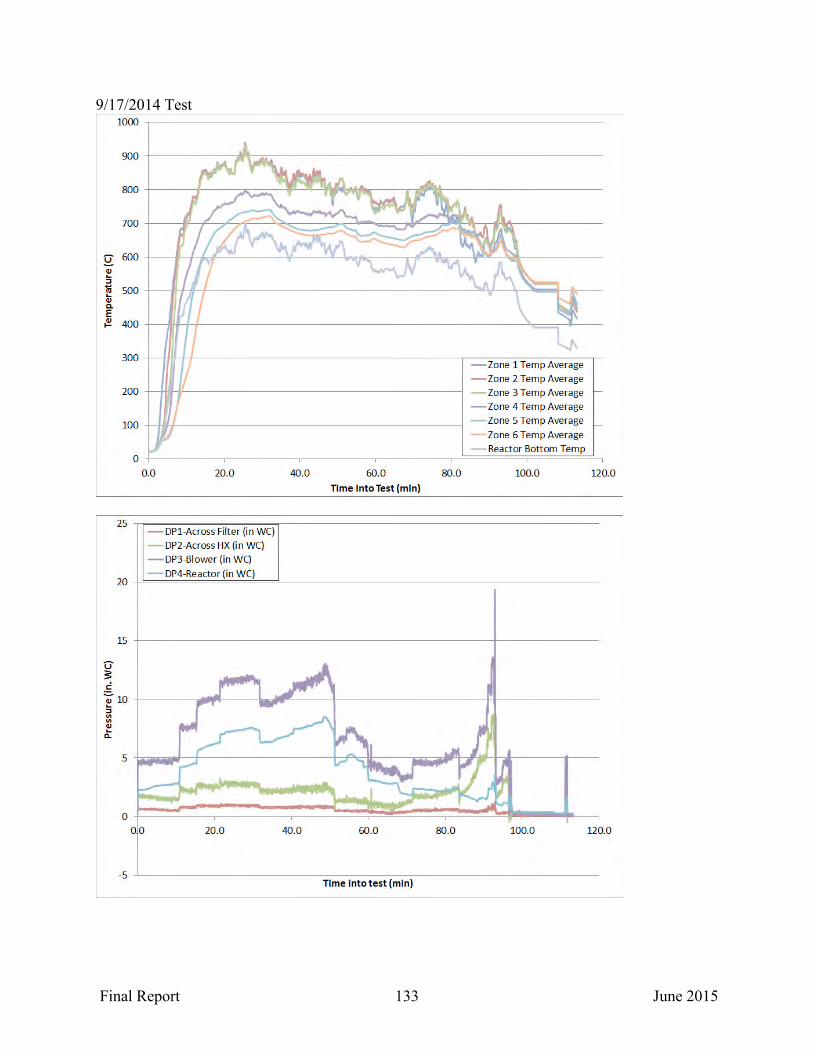
Final Report 133 June 2015
9/17/2014 Test
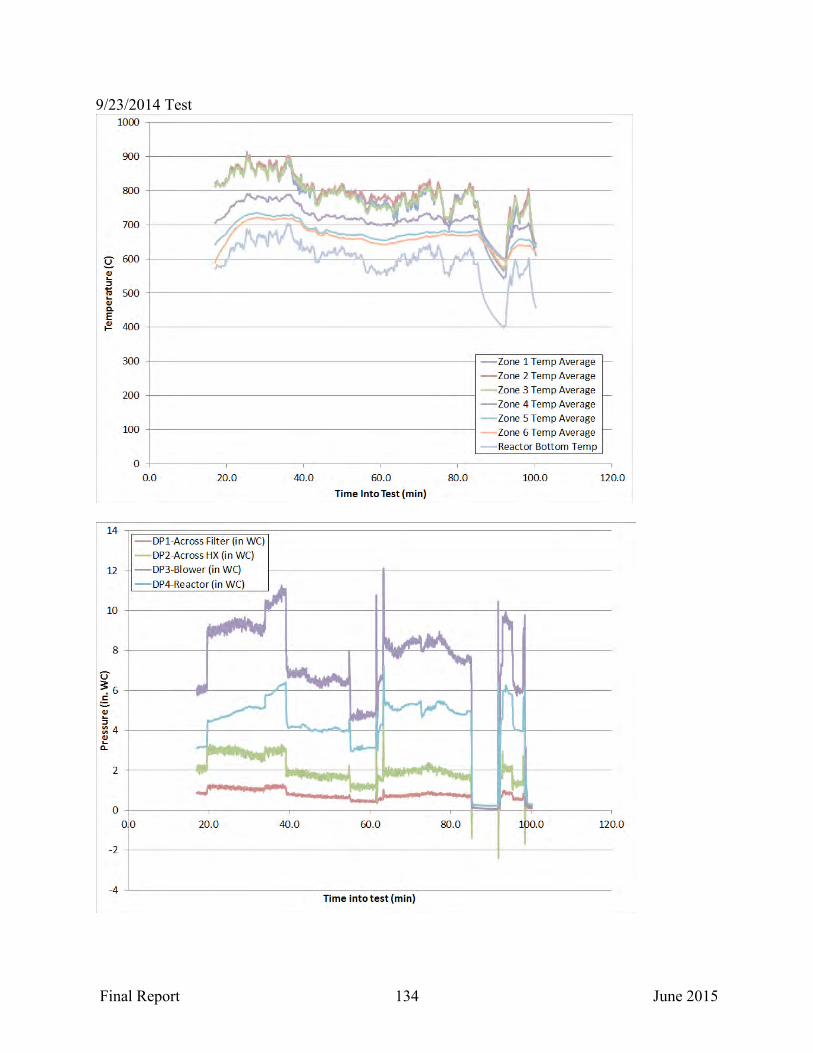
Final Report 134 June 2015
9/23/2014 Test
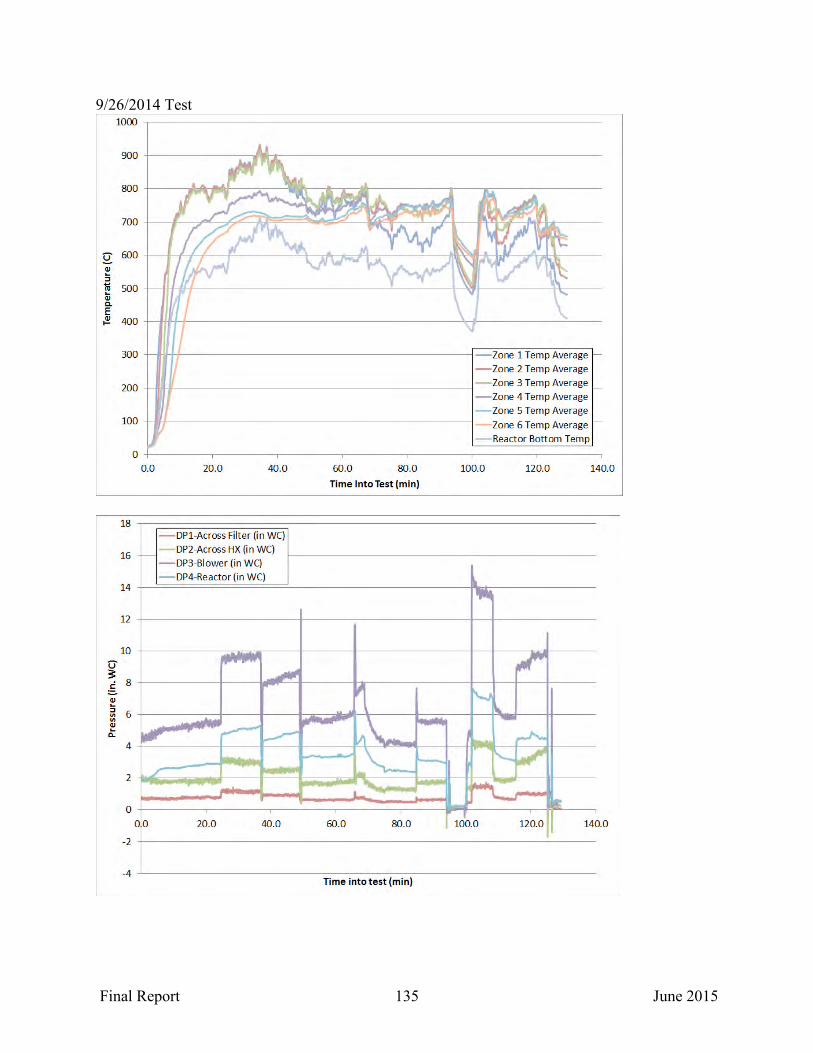
Final Report 135 June 2015
9/26/2014 Test

Final Report 136 June 2015
10/1/2014 Test

Final Report 137 June 2015
10/27/2014 Test

Final Report 138 June 2015
10/29/2014 Test

Final Report 139 June 2015
10/31/2014 Test

Final Report 140 June 2015
11/4/2014 Test
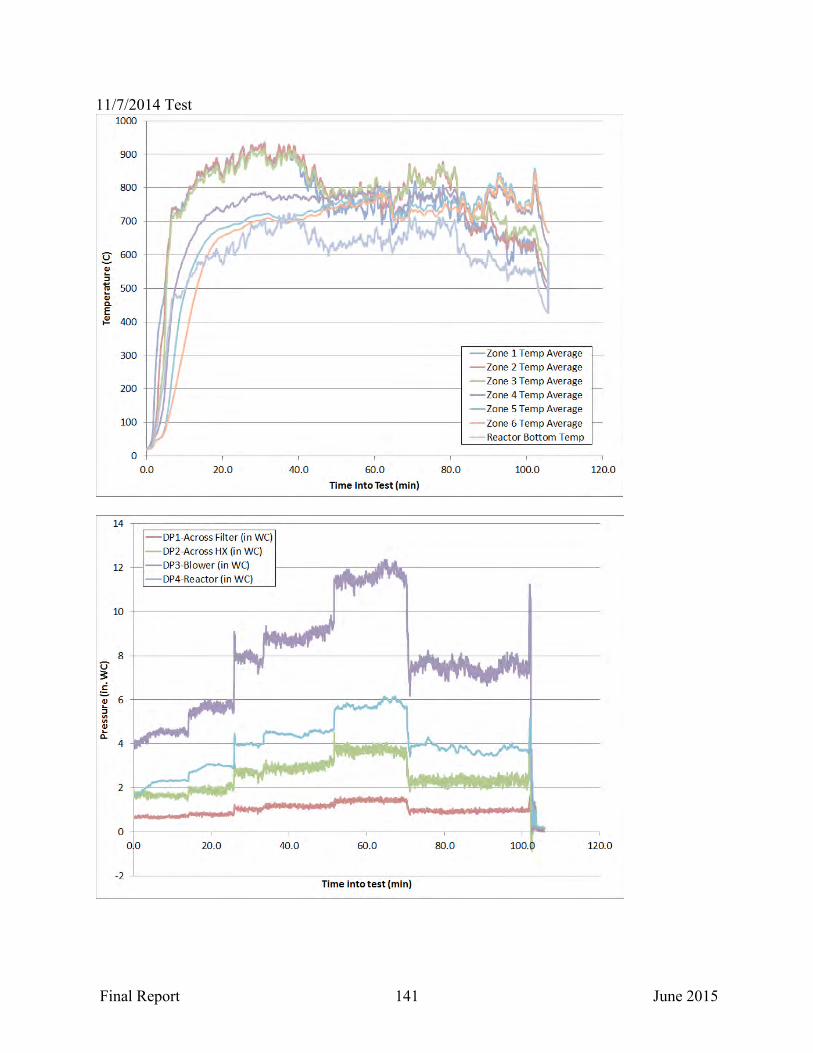
Final Report 141 June 2015
11/7/2014 Test
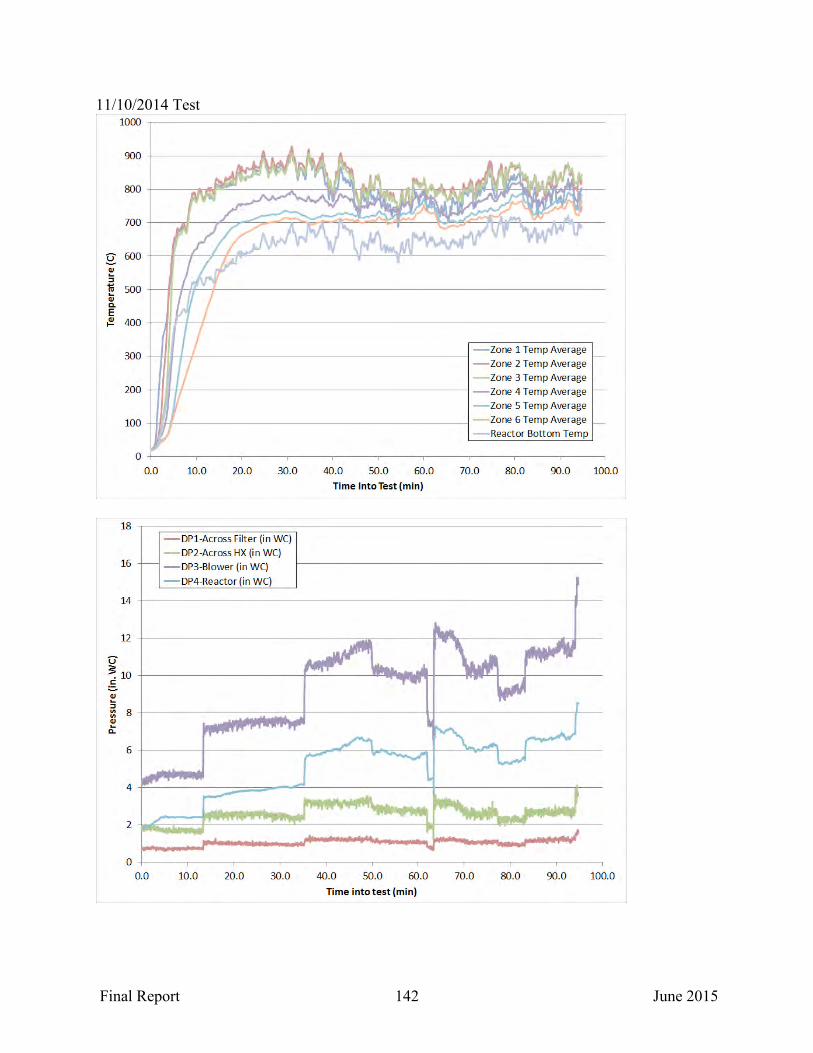
Final Report 142 June 2015
11/10/2014 Test

Final Report 143 June 2015
11/14/2014 Test
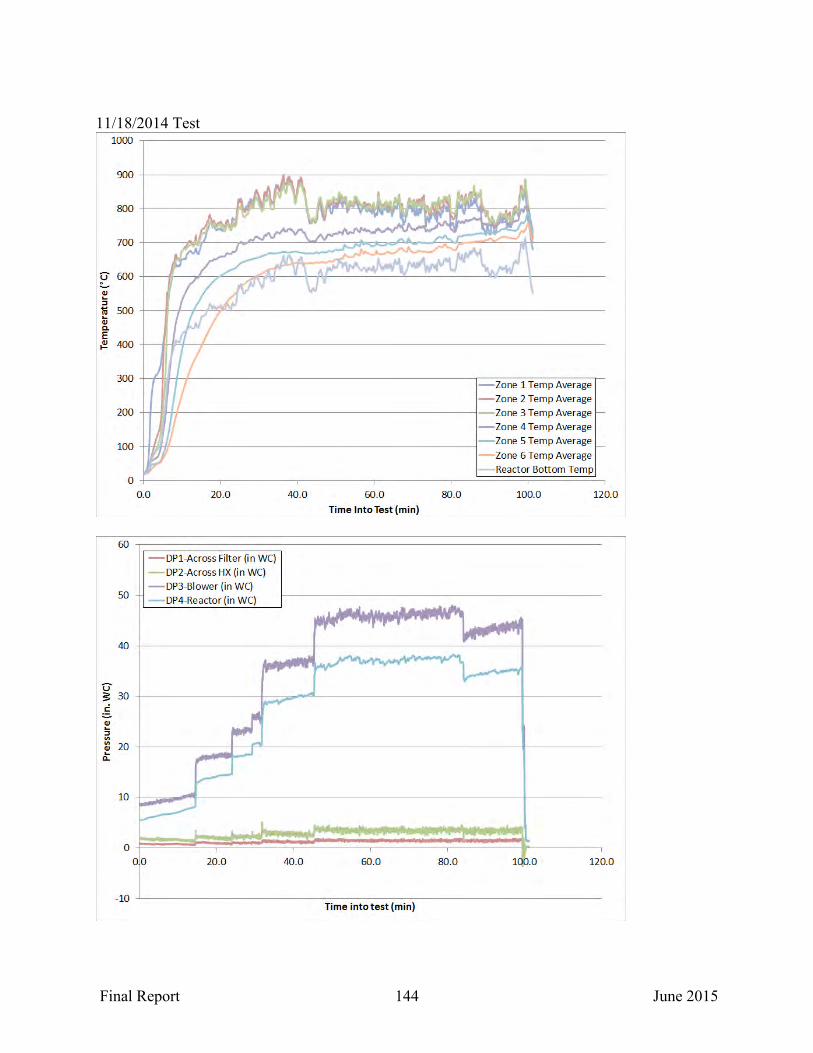
Final Report 144 June 2015
11/18/2014 Test
Final Report 145 June 2015
APPENDIX B: LIST OF SCIENTIFIC/TECHNICAL PUBLICATIONS
● Cushman, M., Sasa, L., Montella, D., Schlis, S., Reed, M., Gold, H., Young, M., Chase,
S., Pittenger, B. Shredded Waste Downdraft Gasification; AICHE Paper Number 351629, March 2014.
● Reed, M., Cushman, M., Belcher, J., Schlis, S., and Sasa, L., Shredded Waste Downdraft Gasifier for Overseas Waste to Energy Conversion; EUEC 2015, February 2015.