Embed Size (px)
Citation preview

Final Report of the APMP.M.FF-K1 KC
Final Report of the APMP Water Flow
Key Comparison (APMP.M.FF-K1 KC)
Kwang-Bock Lee1, Sejong Chun1, Yoshiya Terao2, Nguyen Hong Thai3,
Cheng Tsair Yang4, Meng Tao5, Mikhail B Gutkin6
January 17, 2011
1 KRISS, Korea (Pilot Lab.)
2 NMIJ, Japan
3 VMI, Vietnam
4 CMS, Taiwan
5 NIM, China
6 VNIIM, Russia

Abstract
The key comparison, APMP.M.FF-K1 KC, was undertaken by APMP/TCFF, the Technical
Committee for Fluid Flow (TCFF) under the Asia Pacific Metrology Programme (APMP).
One objective of the key comparison was to demonstrate the degree of equivalence
among six participating laboratories (KRISS, NMIJ, VMI, CMS, NIM and VNIIM) in water
flow rate metrology by comparing the results with the key comparison reference value
( ) determined from CCM.FF-K1 KC. The other objective of this key comparison was
to provide supporting evidence for the calibration and measurement capabilities (CMC),
which had been declared by the participating laboratories during this key comparison.
The Transfer Standard Package (TSP) was a Coriolis mass flowmeter, which had been used
in the CCM.FF-K1 KC.
Because the -factors in the APMP.M.FF-K1 KC were slightly lower than the -
factors of the CCM.FF-K1 KC due to long-term drifts of the TSP, correction value was
introduced to correct the -factors. was given by a weighted sum between two
link laboratories (NMIJ and KRISS), which participated in both the CCM.FF-K1 KC and the
APMP.M.FF-K1 KC. By this correction, the -factors were laid between 12.004 and 12.017
at either low ( = 254,000) or high ( = 561,000) flow rates.
Most of the calibration data were within expected uncertainty bounds, however,
some data showed undulations, which gave large fluctuations of the metering factor at
= 561,000. Calculation of showed that all the participating laboratories had
deviations between -0.009 and 0.007 pulses/kg from the CCM.FF-K1 at either the
low or the high flow rates. In case of calculation, all the participating laboratories
showed values less than 1, indicating that ’s of all the laboratories were equivalent with
the at both = 254,000 and 561,000. When and from two participating
laboratories were compared, all the numbers of equivalence showed values less than 1,
indicating equivalence of measuring the -factors.

List of symbols
Correction value [pulses/kg]
Difference of two K-factors between the CCM.FF-K1 KC and the APMP.M.FF-K1
KC [pulses/kg]
Number of equivalence between -th participating laboratory and the
Number of equivalence between -th and -th participating laboratories
Reynolds number
K-factor from -th participating laboratory [pulses/kg]
Corrected value of K-factor from -th participating laboratory [pulses/kg]
The K-factor measured by a link laboratory in the CCM.FF-K1 KC [pulses/kg]
The K-factor measured by a link laboratory in the APMP.M.FF-K1 KC [pulses/kg]
Mean value of [pulses/kg]
Key comparison reference value from the CCM.FF-K1 KC [pulses/kg]
Temperature [℃]
Mass flow quantity by the primary standard in the -th participating
laboratory [kg]
Expanded uncertainty of the primary standard in the -th participating
laboratory [%]
Expanded uncertainty of [pulses/kg]
Degree of equivalence between and , [pulses/kg]
Degree of equivalence between -th and -th participating laboratories,
[pulses/kg]
Output pulse by the TSP (Transfer Standard Package) [pulses]
Coverage factor with confidence level of about 95 %
Number of measurement
Standard uncertainty of , [pulses/kg]
Standard uncertainty of , [pulses/kg]
Standard uncertainty of , [pulses/kg]
Type A uncertainty of , [pulses/kg]
Type B uncertainty of , [pulses/kg]
Standard uncertainty of , [pulses/kg]
Standard uncertainty of , [pulses/kg]
Standard uncertainty of , [pulses/kg]
Standard uncertainty of [pulses/kg]
Weighting coefficient obtained from at each link laboratory

1. Introduction
The key comparison, entitled, APMP.M.FF-K1 KC, has been undertaken by APMP/TCFF,
which represents the Technical Committee for Fluid Flow (TCFF) under the Asia Pacific
Metrology Programme (APMP). KRISS was the pilot laboratory for this key comparison in
the year 2009 – 2010. One objective of the key comparison was to demonstrate the
degree of equivalence among six participating laboratories in water flow rate metrology
by comparing the results with the key comparison reference value ( ), which was
determined from the CCM.FF-K1 KC [1]. The other objective of this key comparison was
to provide supporting evidence for the calibration and measurement capabilities (CMC),
which had been declared by the laboratories participating in this key comparison.
The final report for the APMP.M.FF-K1 KC was prepared to share necessary
information among the participating laboratories and to draw concluding remarks from
the calibration results with the Coriolis mass flowmeter. The final report was written in
accordance with the Guidelines for CIPM Key Comparisons and the Guidelines on
Conducting Comparisons (APMP-G2) [2, 3].
2. Organization
The participating laboratories were KRISS (Korea), NMIJ (Japan), VMI (Vietnam),
CMS/ITRI (Chinese Taipei), NIM (China) and VNIIM (Russia), in the order of testing
schedule. At the initial phase of the key comparison, the five laboratories except VNIIM
were planning the test schedules. Later, VNIIM joined participating to this key
comparison, so that the test schedules were rearranged for all the six participating
laboratories. The finally-decided test schedules were arranged as shown in Table 1.
3. Transfer Standard
3.1. Definition of transfer standard
A Coriolis mass flowmeter (Promass 83F1H with S/N 5604D0702000, Endress+Hauser
Inc., U.S.A), which had been used as a part of the Transfer Standard Package (TSP) for
CCM.FF-K1 KC, was also used as the TSP for this key comparison. The Coriolis mass
flowmeter had a nominal diameter of 4 inches. The end connections of the flowmeter
were raised face flanges according to the ANSI 150 lb standards. The mass flowmeter
was contained in a rugged box. The total weight, including the box, was about 130 kg.
More detailed information on the TSP is described in both Figure 1 and Table 2.
Before starting the key comparison, the following information was given to the
participating laboratories for an efficient progress according to the test schedule.

- The uncertainty level of the mass flowmeter is 0.1 % with reproducibility of
0.05 %.
- The TSP should be transported between the participating laboratories with
sufficient care that the metrological characteristics of the transfer standards are
maintained as determined by the Pilot laboratory.
- All the participating laboratories should arrange and pay the expenses for
transport of the TSP with proper insurance to the next participating laboratory.
The extra expenses for local custom inspection, if applicable, should also be paid
by the participating laboratory.
- After arrival of the TSP, the participating laboratories should check the equipment
for any damages and report these to the pilot laboratory.
- The participating laboratories are responsible for transporting the TSP to the next
participating laboratory according to the circulation scheme. The shipping date
should be provided to each participating laboratory at least one week before the
end of date. Before dispatching the TSP, each participant must inform the
transport of the TSP to both the next participating and the pilot laboratories.
3.2. Calibration procedure
During the key comparison, the calibration procedure was defined as follows to
report calibration data with the same format among the participants.
1) Be sure to check flow directions, before installing the TSP in the test section.
2) Check the Reynolds number of the flows in the test section, whether the values
are either 254,000 or 561,000 based on the inner pipe diameter of 101.6 mm and
the mean flow velocity within the conduit in the test section. Note that the
above-stated Reynolds numbers are the same values as defined in the CCM.FF-K1
KC.
3) Set the low flow rate ( = 254,000) in the test section and measure metering
data from the TSP by counting pulses with an appropriate instrument. Record the
collected pulses, the collected volume or weight and the water temperature as
well during the flow metering. Repeat the measurements five times.
4) Set the high flow rate ( = 561,000) in the test section and measure the
metering data from the TSP, as described in 3).
5) Repeat the same tests described in 3) and 4) one more time. By doing this, total
number of 20 data points should be collected to complete the KC test.
6) Check whether the calibration results are recorded according to Tables 3 and 4.
3.3. Definition of -factor
The definition of -factor is as follows.
(1)
Here, is the -factor of -th participating laboratory [pulses/kg], is the counted
pulses from the TSP [pulses] and is the mass flow quantity by the primary standard
established in the -th participating laboratory [kg]. The standard uncertainty of is
defined in the following equation.
(2)
Here, is the standard uncertainty of [pulses/kg], is the type A
uncertainty of [pulses/kg], is the type B uncertainty of [pulses/kg], is
the mean value of [pulses/kg], is the number of measurements at a specified
Reynolds number (254,000 or 561,000), is the expanded uncertainty of the primary
standard established in the -th participating laboratory [%] and is the coverage factor
( = 2). The type B uncertainty introduced by the TSP was neglected for this uncertainty
analysis.
The should be converted into to conform its unit with [pulses/kg]. All
the necessary information on the -factors are specified in Table 5.
As shown in Figures 2 to 7, is distributed between 11.98 and 12.01, over the test
Reynolds numbers. The distribution is slightly lower than the -factors from the
CCM.FF-K1 KC [1].
KRISS indicated almost the same values of , regardless of the Reynolds numbers.
NMIJ and CMS, as shown in Figures 3 and 5, showed very good stability in measuring .
For the case of VNIIM, there were quite recognizable data scatterings at around 11.99
when = 561,000.
3.4. Definition of KCRV
During the APMP.M.FF-K1 KC, the long-term drift of the -factor of the TSP, which

had been served for the CCM.FF-K1 KC [1], was shown. To link the calibration data in
Table 5 with the CCM.FF-K1 KC results, correction value was calculated as shown in
Terao et al. (2010) [4].
(3)
(4)
(5)
Here, is the difference of two -factors between the CCM.FF-K1 KC and the
APMP.M.FF-K1 KC by link laboratories [pulses/kg], i.e., KRISS and NMIJ, which participated
in both key comparisons. is the weighting coefficient obtained from of
each link laboratory [4~7]. The CCM.FF-K1 KCRV and its corresponding correction value
was summarized in Table 6. The -factors of the two link laboratories were also shown
with their error bars in Figures 8 and 9.
4. Calibration Results
4.1. Comparison of -factors to the CCM.FF-K1 KCRV
The for each participating laboratory was corrected according to the following
formula to compare their results to the KCRV of the CCM.FF-K1 KC.
(6)
Here, is the corrected -factor to harmonize it with the CCM.FF-K1 KC results
[pulses/kg]. Degree of equivalence was calculated by comparing with the CCM.FF-K1
KCRV.
(7)
(8)
Here, indicates the degree of equivalence between and [pulses/kg],
is the standard uncertainty of [pulses/kg], is from the CCM.FF-K1 KCRV
[pulses/kg] and is the standard uncertainty of [pulses/kg] [1]. Number of
equivalence was calculated as follows.

(9)
Here, defines the number of equivalence. is equal to 2 with the confidence level
of about 95 %. Some of the KC results compared with were summarized in Table 7
and Figures 10 to 13.
The corrected -factor, is displayed in Figures 10 and 11. The error bars are
defined as the expanded uncertainty with confidence level of about 95 % according to
the guide to uncertainty expression [7].
(10)
Here, is the expanded uncertainty of [pulses/kg]. Note that the has
smaller error bars compared with those of participating laboratories. It is found that most
of calibration results were comparable with the .
Degree of equivalence indicated in Figures 12 and 13 explains the offset value of the
-factors of participating laboratories from the . At = 254,000, is distributed
between -0.012 and 0.015 pulses/kg. At = 561,000, is seemed to be more
dispersed between -0.020 and 0.015 pulses/kg. Calculation of showed that all the
participating laboratories had deviations between -0.009 and 0.007 pulses/kg from the
CCM.FF-K1 at the specified Reynolds numbers in Table 7. All the error bars extend
to crossing the zero line. This implies that every participating laboratory can reproduce
with relevance to the , based on the expanded uncertainty declared by each
participating laboratory.
In case of , the two -factors between and the , are thought to be
equivalent, whenever 1. This means that the error bars of for each participating
laboratory extend to crossing the zero line of . At = 254,000 in Figure 14, all the
participating laboratories show to be less than 1, which ensures the equivalence of
CMC of the primary standards established by participating laboratories. Both CMS and
VNIIM indicate the closest equivalence to the . At = 561,000 in Figure 15, all
the participating laboratories also show to be less than 1, which indicates
equivalence of to the . NIM shows the closest equivalence to the at this
. It is noticed that some laboratories show dramatic changes with different
between 254,000 and 561,000 by more than 0.5. This might be because of the
characteristics of their primary standards operating at the participating laboratories.

4.2. Comparison of -factors between two participating laboratories
To ascertain the degree and the number of equivalence with the corrected -factors
among the participating laboratories, definitions regarding measuring equivalence were
modified as follows [1, 4~7].
(11)
(12)
(13)
Here, is the difference of -factors between -th and -th participating laboratories,
is the combined uncertainty between and , is the
corresponding number of equivalence. Comparison results among the participating
laboratories were summarized in Tables 8 and 9 for = 254,000 and in Tables 10 and
11 for = 561,000. Note that all the among the participating laboratories are
less than 1.
One of the major assumptions for this KC was that the characteristics of the TSP
were constant during the KC periods. This enabled to construct the supporting evidence
that all the participating laboratories meet the equivalence of the CMC of their primary
standards.
5. Conclusions
The APMP.M.FF-K1 KC was performed by employing a Coriolis mass flow meter,
which had been a part of the transfer standard packages during the CCM.FF-K1 KC. The
TSP was circulated among the six participating laboratories. The -factor was
corrected into to link the KC results with the CCM.FF-K1 KCRV, according to the
literature [4~7]. Based on the corrected -factors, the degree of equivalence and the
number of equivalence could be calculated.
The two test Reynolds numbers of = 254,000 and 561,000, were defined by the
mean velocity and the inner diameter of the pipe flows. It was because the same
Reynolds numbers were defined in the CCM.FF-K1 KC.
values were laid between 12.004 and 12.017 pulses/kg on the two test Reynolds
number regions. Most of the calibration data were within uncertainty bounds, however,
some data showed undulations, which gave large fluctuations of the metering factor at
= 561,000. Calculation of showed that all the participating laboratories had

deviations between -0.009 and 0.007 pulses/kg from the CCM.FF-K1 at the
specified Reynolds numbers. In case of calculation, all the participating laboratories
showed values within 1, indicating that ’s of all the laboratories were equivalent with
the at both = 254,000 and 561,000.
When and from two participating laboratories were compared, all the
numbers of equivalence showed values less than 1, indicating equivalence of measuring
-factors.
References
[1] J. S. Paik, K. B. Lee, P. Lau, R. Engel, A. Loza, Y. Terao and M. Reader-Harris, 2007, “Final
report on CCM.FF-K1 for water”, Metrologia, Vol. 44, Technical Supplement, 07005
[2] Bureau International des Poids et Mesures, 2003, “Guidelines for CIPM key
comparisons”, March 1999 (Revised in October 2003) (http://www.bipm.org/en/cipm-
mra/guidelines_kcs/)
[3] Asia Pacific Metrology Programme, 2003, “APMP-G2: The Guidelines on conducting
comparisons”, March 2003 (http://www.apmpweb.org/apmp_docs.html)
[4] Y. Terao, Y. M. Choi, M. Gutkin, W. Jian, I. Shinder and C. –T. Yang, 2010, “Final report
on the APMP air speed key comparison (APMP.M.FF-K3)”, Metrologia, Vol. 47, Technical
Supplement, 07012
[5] F. Delahaye and T. J. Witt, 2002, “Linking the results of key comparison CCEM-K4 with
the 10 pF results of EUROMET Project 345”, Metrologia, vol. 39, technical supplement
01005
[6] M. Ojanen, M. Shpak, P. Kärhä, R. Leecharoen and E. Ikonen, 2009, “Uncertainty
evaluation for linking a bilateral key comparison with the corresponding CIPM key
comparison”, Metrologia, vol. 46, pp. 397 – 403
[7] C. Elster, A. G. Chunovkina and W. Wöger, 2010, “Linking of a RMO key comparison to
a related CIPM key comparison using the degrees of equivalence of the linking
laboratories”, Metrologia, vol. 47, pp. 96 – 102
[8] International Standard Organization, 2008, “Uncertainty of measurement, Part 3: Guide
to the expression of uncertainty in measurement (GUM:1995)”, ISO/IEC Guide 98-
3:2008, Geneva, Swiss

Table Captions
Table 1. Shipping addresses, contact points and testing schedule for APMP.FF-K1 KC
Table 2. The List of TSP
Table 3. Measurement points for calibration
Table 4. Calibration data format
Table 5. Calibration data for APMP.M.FF-K1 KC
Table 6. of the CCM.FF-K1 KC and the corresponding correction value
to harmonize between CCM.FF-K1 KC and APMP.M.FF-K1 KC[1]
Table 7. Corrected calibration data for APMP.M.FF-K1 KC
Table 8. Degree of equivalence on the corrected calibration data at = 254,000
Table 9. Number of equivalence on the corrected calibration data at = 254,000
Table 10. Degree of equivalence on the corrected calibration data at = 561,000
Table 11. Number of equivalence on the corrected calibration data at = 561,000
Figure Captions
Figure 1. Transfer Standard Package (TSP)
Figure 2. Calibration data at KRISS
Figure 3. Calibration data at NMIJ
Figure 4. Calibration data at VMI
Figure 5. Calibration data at CMS
Figure 6. Calibration data at NIM
Figure 7. Calibration data at VNIIM
Figure 8. -factors given by two link laboratories at = 254,000,
where is defined by Paik et al.[1]
Figure 9. -factors given by two link laboratories at = 561,000,
where is defined by Paik et al.[1]
Figure 10. Comparison of the corrected -factors at = 254,000,
where is defined by Paik et al.[1]
Figure 11. Comparison of the corrected -factors at = 561,000,
where is defined by Paik et al.[1]
Figure 12. Degree of equivalence at = 254,000,

where is defined as
Figure 13. Degree of equivalence at = 561,000,
where is defined as
Figure 14. Number of equivalence at = 254,000,
where is defined as
Figure 15. Number of equivalence at = 561,000,
where is defined as

Table 1. Shipping addresses, contact points and testing schedule for APMP.FF-K1 KC
# Country/
(Institute) Shipping Address Contact Information Schedule
1 Korea
(KRISS)
Korea Research Institute of Standards and
Science
1 Doryong-dong, Yuseong-gu,
Daejeon, 305-340, Korea
Kwang Bock LEE
Tel: +82-42-868-5316
2 Japan
(NMIJ)
National Metrology Institute of Japan
AIST North 15, 1497-1 Kashiwayama,
Teragu, Tsukuba, Ibaraki 305-4201, Japan
Yoshiya TERAO
Tel: +81-29-861-3816
06 APR 09
~ 09 MAY 09
3 Vietnam
(VMI)
Vietnam Metrology Institute
Volume and Flow Laboratory
8 Hoang Quoc, Hanoi, Vietnam
Nguyen Hong THAI
Tel: +84-4-8362-030
11 MAY 09
~ 20 JUN 09
4
Chinese
Taipei
(CMS/ITRI)
Industrial Technology Research Institute
Center of Measurement Standards
G200, CMS/ITRI, 30 Ta Shueh Road,
Hsinchu, Taiwan 300, R.O.C.
Cheng-Tsair Yang
Tel: +886-3-574-1206
Fax: +886-3-571-0335
22 JUN 09
~ 25 JUL 09
5 China
(NIM)
National Institute of Metrology
Division of Thermometry and Material
Evaluation
No.18 Beisanhuan Donglu, Beijing, 10001
3, P.R.China
Meng TAO
Tel: +86-010-64525127
27 JUL 09
~ 29 AUG 09
6 Russia
(VNIIM)
D.I. Mendeleyev Institute for Metrology
Laboratory for Fluid Flow Rate and Speed
St. Petersburg, Russia 190005 Moskovsky
prospect 19
Mikhail B. GUTKIN
Tel: +7-812-422-12-73
31 AUG 09
~ 03 OCT 09
7 Korea
(KRISS)
Korea Research Institute of Standards and
Science
1 Doryong-dong, Yuseong-gu,
Daejeon, 305-340, Korea
Kwang Bock LEE
Tel: +82-42-868-5316
05 OCT 09
~ 07 NOV 09

Table 2. The List of TSP
Item
No. Description of goods
Number of
Pieces
Weight
(kg)
Value
(US$)
Country
of origin
1 Mass Flowmeter (E+H Promass
83F1H with S/N 5604D702000) 1 set 97.0 4,500 U.S.A
Net weight
Gross weight (including the carrying case)
97.0
150.0
Table 3. Measurement points for calibration
Test flow (Reynolds No.) Data points
Low Flow (254,000) 5
20
High Flow (561,000) 5
Low Flow (254,000) 5
High Flow (561,000) 5

Table 4. Calibration data format
Run Test Meter Rd. Flowrate Reynolds -factor Avg Room
No. Flow [pulses] [℃] [㎥/h] No. [pulses/kg] [℃]
1 L
2 L
3 L
4 L
5 L
6 H
7 H
8 H
9 H
10 H
11 L
12 L
13 L
14 L
15 L
16 H
17 H
18 H
19 H
20 H

Table 5. Calibration data for APMP.M.FF-K1 KC
Submitted uncertainty
for APMP.M.FF-K1 KC = 254,000 = 561,000
NMI
[%]
[pulses/kg]
[pulses/kg]
[pulses/kg]
[pulses/kg]
KRISS 0.080 2 11.9979 0.00021 11.9976 0.00025
NMIJ 0.038 2 11.9959 0.00008 12.0027 0.00008
VMI 0.080 2 11.9986 0.00086 12.0059 0.00062
CMS 0.060 2 11.9928 0.00018 11.9994 0.00027
NIM 0.050 2 11.9973 0.00062 11.9998 0.00018
VNIIM 0.090 2 11.9917 0.00065 11.9921 0.00212
Table 6. of the CCM.FF-K1 KC and the corresponding correction value to
harmonize between CCM.FF-K1 KC and APMP.M.FF-K1 KC[1]
[pulses/kg]
[pulses/kg]
[pulses/kg]
254,000 12.0101 0.0005 0.0178
561,000 12.0123 0.0009 0.0115
Table 7. Corrected calibration data for APMP.M.FF-K1 KC
= 254,000 = 561,000
NMI
KRISS 12.0157 0.0056 0.0048 0.5799 12.0091 -0.0032 0.0049 0.3270
NMIJ 12.0137 0.0036 0.0023 0.7694 12.0142 0.0019 0.0024 0.3847
VMI 12.0164 0.0063 0.0049 0.6399 12.0174 0.0051 0.0049 0.5142
CMS 12.0106 0.0005 0.0036 0.0736 12.0109 -0.0014 0.0037 0.1944
NIM 12.0151 0.0050 0.0031 0.8090 12.0113 -0.0010 0.0031 0.1595
VNIIM 12.0095 -0.0006 0.0055 0.0551 12.0036 -0.0087 0.0059 0.7402

Table 8. Degree of equivalence on the corrected calibration data at = 254,000
NMI KRISS NMIJ VMI CMS NIM VNIIM
KRISS 0.0020 0.0053 -0.0007 0.0069 0.0051 0.0060 0.0006 0.0057 0.0062 0.0073
NMIJ -0.0020 0.0053 -0.0027 0.0054 0.0031 0.0043 -0.0014 0.0038 0.0042 0.0059
VMI 0.0007 0.0069 0.0027 0.0054 0.0057 0.0061 0.0013 0.0058 0.0069 0.0073
CMS -0.0051 0.0060 -0.0031 0.0043 -0.0057 0.0061 -0.0045 0.0047 0.0011 0.0065
NIM -0.0006 0.0057 0.0014 0.0038 -0.0013 0.0058 0.0045 0.0047 0.0056 0.0062
VNIIM -0.0062 0.0073 -0.0042 0.0059 -0.0069 0.0073 -0.0011 0.0065 -0.0056 0.0062
Table 9. Number of equivalence on the corrected calibration data at = 254,000
NMI KRISS NMIJ VMI CMS NIM VNIIM
KRISS 0.1889 0.0491 0.4219 0.0510 0.4275
NMIJ 0.1889 0.2490 0.3585 0.1870 0.3557
VMI 0.0491 0.2490 0.4732 0.1088 0.4707
CMS 0.4219 0.3585 0.4732 0.4743 0.0872
NIM 0.0510 0.1870 0.1088 0.4743 0.4505
VNIIM 0.4275 0.3557 0.4707 0.0872 0.4505

Table 10. Degree of equivalence on the corrected calibration data at = 561,000
KRISS NMIJ VMI CMS NIM VNIIM
NMI
KRISS -0.0051 0.0053 -0.0083 0.0068 -0.0018 0.0060 -0.0022 0.0057 0.0055 0.0075
NMIJ 0.0051 0.0053 -0.0032 0.0054 0.0033 0.0043 0.0029 0.0038 0.0106 0.0062
VMI 0.0083 0.0068 0.0032 0.0054 0.0065 0.0060 0.0061 0.0057 0.0137 0.0076
CMS 0.0018 0.0060 -0.0033 0.0043 -0.0065 0.0060 -0.0004 0.0047 0.0072 0.0068
NIM 0.0022 0.0057 -0.0029 0.0038 -0.0061 0.0057 0.0004 0.0047 0.0077 0.0065
VNIIM -0.0055 0.0075 -0.0106 0.0062 -0.0137 0.0076 -0.0072 0.0068 -0.0077 0.0065
Table 11. Number of equivalence on the corrected calibration data at = 561,000
NMI KRISS NMIJ VMI CMS NIM VNIIM
KRISS 0.4760 0.6044 0.1455 0.1936 0.3640
NMIJ 0.4760 0.2972 0.3882 0.3802 0.8465
VMI 0.6044 0.2972 0.5379 0.5310 0.9088
CMS 0.1455 0.3882 0.5379 0.0475 0.5294
NIM 0.1936 0.3802 0.5310 0.0475 0.5879
VNIIM 0.3640 0.8465 0.9088 0.5294 0.5879

Figure 1. Transfer Standard Package (TSP)
Transport Box: 1,360 mm (W), 760 mm (D), 550 mm (H)

Figure 2. Calibration data at KRISS
Figure 3. Calibration data at NMIJ
11.95
11.97
11.99
12.01
12.03
12.05
0 1 2 3 4 5 6 7 8 9 10
K-f
act
or
[puls
es/
kg]
number of measurement
Re = 254,000
Re = 561,000
11.95
11.97
11.99
12.01
12.03
12.05
0 1 2 3 4 5 6 7 8 9 10
K-f
act
or
[puls
es/
kg]
number of measurement
Re = 254,000
Re = 561,000

Figure 4. Calibration data at VMI
Figure 5. Calibration data at CMS
11.95
11.97
11.99
12.01
12.03
12.05
0 1 2 3 4 5 6 7 8 9 10
K-f
act
or
[puls
es/
kg]
number of measurement
Re = 254,000
Re = 561,000
11.95
11.97
11.99
12.01
12.03
12.05
0 1 2 3 4 5 6 7 8 9 10
K-f
act
or
[puls
es/
kg]
number of measurement
Re = 254,000
Re = 561,000

Figure 6. Calibration data at NIM
Figure 7. Calibration data at VNIIM
11.95
11.97
11.99
12.01
12.03
12.05
0 1 2 3 4 5 6 7 8 9 10
K-f
act
or
[puls
es/
kg]
number of measurement
Re = 254,000
Re = 561,000
11.95
11.97
11.99
12.01
12.03
12.05
0 1 2 3 4 5 6 7 8 9 10
K-f
act
or
[puls
es/
kg]
number of measurement
Re = 254,000
Re = 561,000

Figure 8. -factors given by two link laboratories at = 254,000,
where is defined by Paik et al.[1]
Figure 9. -factors given by two link laboratories at = 561,000,
where is defined by Paik et al.[1]
11.99
12.00
12.01
12.02
12.03
KRISS NMIJ KRISS NMIJ KCRV
K' i
[puls
es/
kg]
link laboratories
11.99
12.00
12.01
12.02
12.03
KRISS NMIJ KRISS NMIJ KCRV
K' i
[puls
es/
kg]
link laboratories
CCM.FF.K1-KC APMP.M.FF.K1-KC
CCM.FF.K1-KC APMP.M.FF.K1-KC
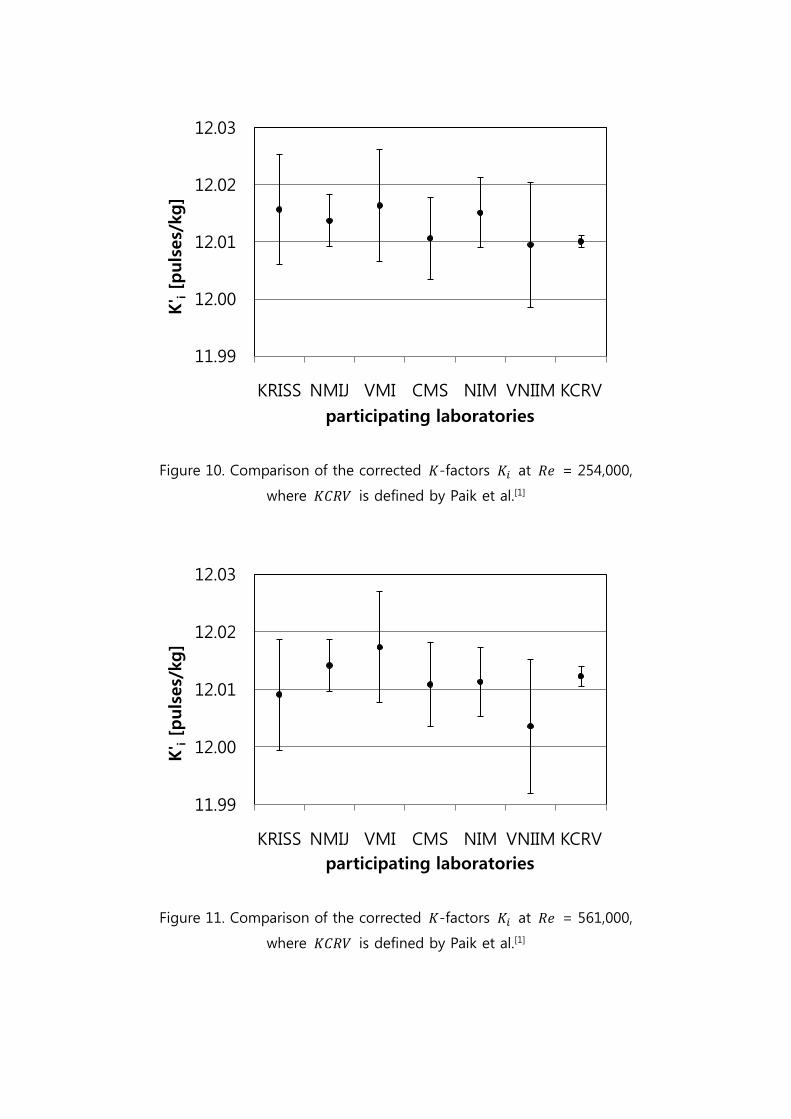
Figure 10. Comparison of the corrected -factors at = 254,000,
where is defined by Paik et al.[1]
Figure 11. Comparison of the corrected -factors at = 561,000,
where is defined by Paik et al.[1]
11.99
12.00
12.01
12.02
12.03
KRISS NMIJ VMI CMS NIM VNIIM KCRV
K' i
[puls
es/
kg]
participating laboratories
11.99
12.00
12.01
12.02
12.03
KRISS NMIJ VMI CMS NIM VNIIM KCRV
K' i
[puls
es/
kg]
participating laboratories

Figure 12. Degree of equivalence at = 254,000,
where is defined as
Figure 13. Degree of equivalence at = 561,000
where is defined as
-0.03
-0.02
-0.01
0.00
0.01
0.02
0.03
KRISS NMIJ VMI CMS NIM VNIIM
di[p
uls
es/
kg]
participating laboratories
-0.03
-0.02
-0.01
0.00
0.01
0.02
0.03
KRISS NMIJ VMI CMS NIM VNIIM
di[p
uls
es/
kg]
participating laboratories

Figure 14. Number of equivalence at = 254,000
where is defined as
Figure 15. Number of equivalence at = 561,000
where is defined as
0.00
0.50
1.00
1.50
KRISS NMIJ VMI CMS NIM VNIIM
En
i
participating laboratories
0.00
0.50
1.00
1.50
KRISS NMIJ VMI CMS NIM VNIIM
En
i
participating laboratories