Embed Size (px)
Citation preview

Mott MacDonald | Final Report on Environment and Social Management Framework (ESMF) State of Maharashtra Agri-Business and Rural Transformation (SMART) Project
408004AA01 | 00 | 02 | 27 September 2019
Mott MacDonald Ground floor, Block No 8 1/124, Shivaji Gardens, DLF-SEZ Mount Poonamallee Road Ramapuram Manapakkam Chennai 600 089 India T +91 (0)44 3054 2700 mottmac.com
Project Director, SMART Project, Pune, Maharashtra, India
Mott MacDonald Private Limited. Registered office: 101, Nomura, Hiranandani Gardens, Powai, Mumbai 400 076, Maharashtra, India. CIN U74210MH1970PTC014650
Final Report on Environment and Social Management Framework
(ESMF) (Including Chapter on Environmental Assessment
OP 4.01 in Chapter 6)
State of Maharashtra Agri-Business and Rural
Transformation (SMART) Project
30 September 2019
Pub
lic D
iscl
osur
e A
utho
rized
Pub
lic D
iscl
osur
e A
utho
rized
Pub
lic D
iscl
osur
e A
utho
rized
Pub
lic D
iscl
osur
e A
utho
rized

Mott MacDonald | Final Report on Environment and Social Management Framework (ESMF) State of Maharashtra Agri-Business and Rural Transformation (SMART) Project
408004AA01 | 00 | 02 | 27 September 2019
Contents
List of Abbreviations 13
Executive summary 20
1 Introduction 26
1.1 Project Background 26
1.1.1 Key challenges in Agriculture and Allied Activities in the State 26
1.2 Project Background 27
1.2.1 Project Development Objective (PDO) 27
1.2.2 Project Components 27
1.2.3 Project Beneficiaries 28
1.2.4 Project Coverage 28
1.2.5 Project Implementation Structure 29
1.3 Proposed Environmental and Social Management Team 32
1.3.1 Selection of Crops for intervention under the SMART Project 33
2 Approach and Methodology 35
2.1.1 Step I: Formulating strategy for conducting ESMF 36
2.1.2 Step II: Policy and regulations review 36
2.1.3 Step III: Baseline Survey 36
2.1.4 Step IV: Impact identification 37
2.1.5 Step V: Environment and Social Management Framework and Institutional Framework Preparation 37
2.1.6 Study Limitation 37
3 Review of Environment and Social Legislation and Policies 39
3.1 Applicable Environmental Rules and Regulations of Government of India 39
3.2 State Environmental Laws and Regulations 40
3.3 Relevant Central and State Government Schemes and Programs on Environment 40
3.4 Applicable social legislations 41
3.5 Relevant Central and State Government Social Schemes and Programs 42
3.6 Applicable Acts in India for protection of women’s rights 43
3.7 Government of India Schemes 44
3.8 Applicable World Bank Safeguard Policies 45
3.9 Negative List of Activities 46
4 Social and Environmental Baseline 47
4.1 Socio-economic baseline and context 47
4.1.1 Demographic Profile 47
Mott MacDonald | Final Report on Environment and Social Management Framework (ESMF) State of Maharashtra Agri-Business and Rural Transformation (SMART) Project
408004AA01 | 00 | 02 | 27 September 2019
4.1.2 Social Profile 49
4.1.3 Occupational Profile 50
4.1.4 Operational holdings 51
4.1.5 Land-Use 53
4.1.6 Agricultural Productivity of household 54
4.1.7 Challenges faced in agricultural productivity 55
4.2 Environment Baseline 58
4.2.1 Topography 58
4.2.2 Geology and Soil 58
4.2.3 Area under INDGAP 60
4.2.4 Climate and Rainfall 60
4.2.5 Agroclimatic Zone Feature 61
4.2.6 Land Utilization and Cropping Intensity 64
4.2.7 Cropping Pattern 64
4.2.8 Water Resource 65
4.2.9 Irrigation Practices 66
4.2.10 Practice of Organic / Low input Farming 68
4.2.11 Agricultural Pests in Maharashtra 69
4.2.12 Agrochemical Consumption 70
4.2.13 Fertilizer Consumption Scenario 74
4.2.14 Crop Wise Water Requirement 75
4.2.15 Crop Varieties and Yield / Productivity 75
5 Stakeholder Consultation Analysis 78
5.1 Stakeholder Identification and Profiling 78
5.2 Analysis of Stakeholder Consultation 80
5.3 Stakeholder Engagement Plan 83
5.4 Information disclosure 88
6 Potential Impact Assessment – Environment and Social 90
6.1 Objectives of ESMF 90
6.2 Social and environmental impact evaluation criteria 90
6.3 Context 90
6.4 Duration 91
6.5 Type 91
6.6 Process flow for the implementation of ESMF 98
6.7 Social Management Framework 99
6.7.1 Land Requirement 99
6.7.2 Resettlement Framework 99
6.7.3 Social Management (Resettlement and Rehabilitation) 100
6.7.4 Social Regulatory Framework 101
6.7.5 Categorization of sub-projects 101

Mott MacDonald | Final Report on Environment and Social Management Framework (ESMF) State of Maharashtra Agri-Business and Rural Transformation (SMART) Project
408004AA01 | 00 | 02 | 27 September 2019
6.7.6 Social Impact Assessment and Resettlement Action Plan 102
6.7.7 Resettlement planning 103
6.8 Mechanisms for Obtaining Land for Project Activities 106
6.8.1 Land Donation 106
6.8.2 Lease /Rent of Land Parcels 106
6.8.3 Government Land 107
6.8.4 Impact on lands involving traditional and tenurial rights: 107
6.8.5 Land Compensation and Entitlements 107
6.8.6 Entitlement Framework 109
6.9 Budget Provisions 111
6.9.1 Disclosure of Resettlement Policy and other Project Documents 111
6.9.2 Scope for Making Amendments. 112
6.9.3 Grievance redress mechanism for R&R 112
6.10 Inclusion Strategy 112
6.10.1 Potential Environmental Impact Assessment in Current Practices 113
6.10.2 Greenhouse Gas Emission Analysis 115
6.10.3 Cotton Value Chain 116
6.10.4 Turmeric Value Chain 119
6.10.5 Soybean Value Chain 121
6.10.6 Okra Value Chain 123
6.10.7 Banana Value Chain 125
6.10.8 Goat Rearing 128
6.10.9 Analysis of Greenhouse Gas Emission in relation to savings in the upgrading scenario 129
6.10.10 GHG Emission Reduction Strategy 130
6.10.11 Environmental Management Framework 130
6.10.12 Certification of INDGAP 140
6.10.13 Capacity Building plan 140
6.11 Training and Capacity Building Schedule 141
6.12 Environmental Monitoring indicators 142
6.12.1 Environment Safeguards Integration Matrix 142
6.13 Monitoring Indicators for Social Development Outcomes 144
6.14 Food Safety Strategy 145
6.15 Monitoring Plan 146
6.16 Environmental and Social Budget 147
7 Indigenous People Framework 153
7.1 Regulatory Provisions for Indigenous People 153
7.1.1 Notification 154
7.1.2 For Education, Economics and Public employment- related safeguards 154
7.1.3 Agency for monitoring safeguards 154
7.1.4 Fundamental rights (Provisions support to subprojects Indigenous People) 154
7.2 Status of Tribals in the State of Maharashtra 154

Mott MacDonald | Final Report on Environment and Social Management Framework (ESMF) State of Maharashtra Agri-Business and Rural Transformation (SMART) Project
408004AA01 | 00 | 02 | 27 September 2019
7.3 Indigenous Peoples Framework (IPF) 155
7.3.1 Free, Prior, Informed Consultation (FPIC) 156
7.4 Indigenous People Plan (or Tribal Development Plan) 156
7.5 Beneficiary Assessment 157
7.6 Inclusion Plan 157
8 Institutional and Implementation Arrangements 159
8.1 Institutional framework for E&S Management 159
8.1.1 Roles and Responsibilities 159
9 Citizen Engagement, Disclosure and Grievance Redress Mechanism 163
9.1 Citizen Engagement Approaches 163
9.1.1 Consultations 163
9.1.2 Collaboration 164
9.1.3 Collecting, Recording, and Reporting on Inputs from Citizens 164
9.2 Disclosure 164
9.3 Grievance Redress Mechanism (GRM) 165
9.3.1 Appointment of Grievance Redressal Officer 165
9.3.2 Grievance/Complaint Submission 165
9.3.3 Grievance Redressal Procedure 166
10 Women’s Participation - Constraints and Opportunities 168
10.1 Gender Analysis 168
10.2 Women in Indian Agriculture: Statistics 168
10.2.1 Issues Faced by Women in Agriculture 168
10.2.2 Gender Division of Labour 169
10.2.3 Value-chain Analysis 169
10.3 Gender Analysis of Value-chain 171
10.4 Gender Strategy 174
11 Construction Management Guideline 176
11.1 Applicable Permits 176
11.2 Environmental Management Plan 176
11.3 Environmental Clauses for Bid Document 179
11.3.1 Environmental Protection 179
11.3.2 Construction Material 179
11.4 Protection of Environmental Resources 180
11.4.1 Noise and Water Pollution 180
11.4.2 Occupational Health and Safety during Construction 181
11.4.3 Post Construction Clearance 181
12 Good Industrial Practice – Slaughter house 182
Mott MacDonald | Final Report on Environment and Social Management Framework (ESMF) State of Maharashtra Agri-Business and Rural Transformation (SMART) Project
408004AA01 | 00 | 02 | 27 September 2019
12.1 Applicable Slaughtetrhouse License Requirements 182
12.2 Pre-slaughter Handling 182
12.3 Layout Requirements 182
12.4 Slaughtering Requirements 183
12.5 Laboratory / Testing Facility 183
12.6 Effluent Treatment Plant 184
12.7 Solid Waste Management 184
12.8 Employee Health Condition 185
12.9 Exclusion of Pest 185
13 Guidelines on Clearance Procedure for Food and Agricultural Propagation Material Imports to India 187
13.1 Food Import Regulation 187
13.2 Food Import Clearance Process 187
13.3 Import of Seed / Plant Material for Sowing, Planting and Propagation 190
14 Pest Management Plan 192
14.1 Area under IPM in Maharashtra 193
14.2 Pest Management Strategy 193
14.3 Safety Parameter in Pesticide Usage 199
14.4 IPM Targets 200
15 Labour Management Framework 201
15.1 Initial Screening: Will the project require labor influx? 202
15.2 Labor Influx and Working Conditions Management Plan (LIWCMP) 203
15.2.1 Management and Monitoring 204
A. Detailed Scope of Work 208
A.1 Environmental and Social Assessment (ESA) 208
B. Checklists for Stakeholder Consultations 213
B.1 Crop-wise Checklists template for FPCs covered (for total of 35 crops) 213
B.2 Industry Checklist 216
B.3 Slaughter house checklist 217
B.4 Checklist for retailers 219
C. Detailed Legal and Policy Review 221
C.1 Applicable Environmental Rules and Regulations of Government of India 221
C.2 State Environmental Laws and Regulations 225
C.3 Relevant Central and State Government Schemes and Programs on Environment 226
C.4 Applicable Social Acts and Rules 227

Mott MacDonald | Final Report on Environment and Social Management Framework (ESMF) State of Maharashtra Agri-Business and Rural Transformation (SMART) Project
408004AA01 | 00 | 02 | 27 September 2019
C.5 Relevant Central and State Government Social Schemes and Programs 228
D. Socio-economic Profile 232
E. Gender Analysis of Value Chain 236
E.1 Gender Division of Labour for Turmeric 236
E.2 Gender Analysis of Okra Value Chain Based on Division of Labour 238
E.3 Gender Analysis of Soybean Value Chain Based on Division of Labour 240
F. Detailed Environmental Baseline 243
F.1 Topography 243
F.2 Geology and Soil Type 244
F.3 Maharashtra Land-use Plan 246
F.4 District wise irrigation 247
F.5 Biodiversity and Forest Cover 254
F.6 Wetlands 256
F.7 Crop wise Pest 258
F.8 List of Banned Pesticides in India 262
F.9 Health and Safety – Food and Beverages 264
F.10 Good Agriculture Practices 264
F.11 Commodity Wise MRL 265
F.12 Cartagena Protocol on Biosafety 265
F.13 Sheep and Goat Rearing Practices 266
F.14 Climate Change Impacts on Crops 266
G. Stakeholder Consultation Details 271
G.1 Bitter Gourd and Onion 271
G.2 Cotton 272
G.3 Wheat 273
G.4 Chilli (Green) 275
G.5 Chilli (Red) 276
G.6 Rice 277
G.7 Turmeric 278
G.8 Soybean 280
G.9 Onion 282
G.10 Potato 285
G.11 Maize 286
G.12 Jowar 287
G.13 Black Gram 288
G.14 Tomato 289
G.15 Brinjal 291
G.16 Paddy 292

Mott MacDonald | Final Report on Environment and Social Management Framework (ESMF) State of Maharashtra Agri-Business and Rural Transformation (SMART) Project
408004AA01 | 00 | 02 | 27 September 2019
G.17 Banana 293
G.18 Okra 294
G.19 Millet 295
G.20 Mango (Private Processing Unit) 296
G.21 Cashew Nut 297
G.22 Pomegranate 299
G.23 Grapes 300
G.24 Tur Dal 301
G.25 Gram 302
G.26 Sapota 304
G.27 Market / Traders / Retailers 306
G.28 Goatery / Slaughter House 311
G.29 Pesticide Residue Testing Lab 313
G.30 List of CBOs Consulted 314
G.31 List of GRCs Consulted 324
G.32 List of APMC Market Consulted 324
G.33 List of Retailers Consulted 325
G.34 List of Traders Consulted 326
G.35 List of Slaughter house Consulted 327
G.36 List of Industries Consulted 327
H. Definition of Terms Used in RAP 328
I. Social Screening Checklist 330
J. Format for Recording Consultations 333
K. Census & Socio-economic Survey Questionnaire 336
Annexure AA: Format for Census Survey 338
L. Sample MoU formats 340
Memorandum of Understanding (Land provided by Titleholder) 340
Memorandum of Understanding (Non-Titleholder) 341
M. Screening Checklist 343
N. Monitoring Format 351
N.1 Monitoring Format for CBOs 351
N.2 Monitoring Format for Slaughter Houses 352
N.3 Monitoring Format for Enterprises 352
N.4 Monitoring Format for Market 353

Mott MacDonald | Final Report on Environment and Social Management Framework (ESMF) State of Maharashtra Agri-Business and Rural Transformation (SMART) Project
408004AA01 | 00 | 02 | 27 September 2019
N.5 Construction Monitoring Format 354
O. Template for Environmental Baseline Database – Agricultural Value Chain 356
P. Template for Environmental Baseline Database – Animal Husbandry 359
Q. Maximum Residue Level Results 362
Tables
Table 1: Project Components and Sub-components 27
Table 2: Applicable Central Environment Rules and Regulations 39
Table 3: Applicable State Environment Rules and Regulations 40
Table 4: Relevant central and State Government Schemes and Programs on environment 40
Table 5: Applicable social legislations 41
Table 6: Relevant central and State Government Schemes and Programs 42
Table 7: Legal Provisions for Safeguard of Women 43
Table 8: Government of India Schemes and Programs for Welfare of Women 44
Table 9: Applicable World Bank Safeguard Policy 45
Table 10: Negative List of Activities 46
Table 11: Demographic Profile at State and National level 48
Table 12: Sample size coverage 48
Table 13: Social Profile at State and National level 49
Table 14: Caste Composition of Samples covered 50
Table 15: Economic profile at State and National levels 50
Table 16: Women workforce participation rates – time series data 51
Table 17: Percentage of Operational Holdings by size for all social groups 52
Table 18: Operational holdings and area in Maharashtra 52
Table 19: Select Land-use patterns in Maharashtra as a proportion to Geographical Area 54
Table 20: Crop / commodity production data in Maharashtra 55
Table 21: Risk matrix 57
Table 22: Soil Health Card Testing Infrastructure in Maharashtra 58
Table 23: Status of Soil Health Cards issued till July 2019 58
Table 24: Maharashtra Soil Chemical Characteristics 59
Table 25: Area under GAP in Maharashtra (in Ha) 60
Table 26: Region wise Rainfall Received (in mm) 61
Table 27: Characteristics of Agro – Climatic Zones 62
Table 28: Maharashtra Land Use Pattern 64
Table 29: Ground Water Quality Maharashtra 66
Table 30: Micro Irrigation Schemes from 2009-10 to 2018-19 67

Mott MacDonald | Final Report on Environment and Social Management Framework (ESMF) State of Maharashtra Agri-Business and Rural Transformation (SMART) Project
408004AA01 | 00 | 02 | 27 September 2019
Table 31: District Wise Area Covered under Micro Irrigation from 1986-87 to 2018-19 67
Table 32: Number of agricultural pumps installed in Maharashtra 68
Table 33: Area under Organic Certification process - Maharashtra 68
Table 34: Major Incidence of Pest / Disease - Maharashtra 70
Table 35: Use of Pesticides in Maharashtra (in MT) 70
Table 36: Advisories Given to Farmer under IPM in Maharashtra 73
Table 37: Training given to Agricultural Officer under IPM in Maharashtra 73
Table 38: Chemical Fertilizer Consumption (in lakh MT) and on per hectare basis (kg) 74
Table 39: Region-wise use of Chemical Fertilizer (in ’00 MT) 74
Table 40: Crop Area and Production in Maharashtra (2016-17) 76
Table 41: Stakeholder identification and profiling for SMART project 78
Table 42: Definition for the Quadrants 79
Table 43: Matrix assessing the various stakeholders presently involved in SMART 80
Table 44: Key Findings of Stakeholder Consultations 80
Table 45: Key issues emerging from the stakeholder analysis and suggested measures 82
Table 46: Planned stakeholder engagement activities 84
Table 47: Social Management Framework 92
Table 48: Categorization of sub-projects: Social 102
Table 49: Entitlement Matrix Error! Bookmark not defined.
Table 50: Screening of Potential Impacts Due to Agriculture and Allied Activities 112
Table 51: GHG Emission in Relation to Saving in the Upgradation Scenario 129
Table 52: Environment Management Framework 131
Table 53: Proposed arrangement for INDGAP certification 140
Table 54: Capacity Building 140
Table 55: Capacity building plan for Social Safeguard 141
Table 56: Environment Safeguard Integration Matrix 142
Table 57: Monitoring indicators for Social Development Outcomes 144
Table 58: Food Safety Strategy 146
Table 59: Environmental Monitoring Plan 146
Table 60: Tentative Social Budget and Capacity Building Timeline Gantt Chart 147
Table 61: Tentative Environment Budget and Capacity Building Timeline Gantt Chart 149
Table 62: Tribal Development Strategy during various Stages of Project Cycle 157
Table 63: Roles and Responsibilities to Implement RF at Various Levels 160
Table 64: CBO details with respect to female membership and social category 170
Table 65: Construction Stage – Environment Management Plan 177
Table 66: Space Requirement – Transportation of Animals 182
Table 67: Effluent Discharge Standards Stipulated by MOEF&CC 184
Table 68: Processing and Disposal of Slaughter House Waste 184
Table 69: Use of Pesticides (in MT) 192
Table 70: Area of cultivation of the target crops in Maharashtra under CROPSAP (area in lakh Ha) 193
Table 71: IPM Strategy for Key Pest in Major Crops of Maharashtra 194

Mott MacDonald | Final Report on Environment and Social Management Framework (ESMF) State of Maharashtra Agri-Business and Rural Transformation (SMART) Project
408004AA01 | 00 | 02 | 27 September 2019
Table 72: Overall IPM targets 200
Table 73: Initial Screening Questions 203
Table 74: Roles and responsibilities 207
Table 75: Applicable Central Rules and Regulations on Environment 221
Table 76: Applicable State Rules and Regulations of Environment 225
Table 77: Relevant central and State Government Schemes and Programs on Environment 226
Table 78: Applicable social legislations 227
Table 79: Relevant central and State Government Social Schemes and Programs 229
Table 80: Workforce Participation Rate (WPR), 2011 232
Table 81: District-wise Human Development Indicators 233
Table 82: District-wise Social Profile 233
Table 83: District-wise Demographic Profile 235
Table 84: District Wise Agricultural Statistics 248
Table 85: Crop-wise Pest 258
Table 86: Estimated Meat Production from sheep and Goat Annual 2016-17 266
Table 87: History of Natural Disaster in Maharashtra 268
Table 88: List of CBOs Consulted 314
Table 89: List of GRC Consulted 324
Table 90: List of APMC Market Consulted 324
Table 91: List of Retailer Consulted 325
Table 92: List of Traders Consulted 326
Table 93: List of Slaughter House Consulted 327
Table 94: List of Industries Consulted 327
Figures
Figure 1: Project Coverage Areas 29
Figure 2: Project Implementation Structure 31
Figure 3: Brief Approach 35
Figure 4: Operational holdings and area in Maharashtra 53
Figure 5: Time series data on average size of agricultural landholding (ha) 56
Figure 6: Vulnerability Assessment 57
Figure 7: Maharashtra Soil Moisture Map 60
Figure 8: Agro-Climatic Zone Map of Maharashtra 63
Figure 9: Area under principal crops 64
Figure 10: Crop Wise Area under Organic Farming in Maharashtra 69
Figure 11: Global Agri-commodity Category wise percent share of pesticide 71
Figure 12: National Agri-commodity Category wise percent share of pesticide 71
Figure 13: Crop wise percent Pesticide Share in Maharashtra 72

Mott MacDonald | Final Report on Environment and Social Management Framework (ESMF) State of Maharashtra Agri-Business and Rural Transformation (SMART) Project
408004AA01 | 00 | 02 | 27 September 2019
Figure 14: Agri-commodity wise consumption of chemical and bio-pesticides in Maharashtra in
MTs (2018-19) 72
Figure 15: Crop Wise Water Requirement (mm/year) 75
Figure 16: ESMF Process Flow Chart for Proposed Investments 98
Figure 17: Distribution of Scheduled Tribe Population by States 153
Figure 18: Suggested GRM 166
Figure 19: Major challenges faced by women-led CBOs 171
Figure 20: Gender division of labour for Cotton 172
Figure 21: Access and Control Over Resource- Cotton 172
Figure 22: Food Import Clearance Procedure 188
Figure 23: Gender Division 236
Figure 24: Access and Control Over Resources 237
Figure 25: Gender Analysis Okra Value Chain 238
Figure 26: Access and Control Over Resource - Soybean 239
Figure 27: Gender Analysis of SoybeanValue Chain Based on Division of Labour 240
Figure 28: Access and Control - Soybean 241
Figure 29: Map Showing Maharashtra Geomorphology 244
Figure 30: Map Showing Maharashtra Geology / Soil type 245
Figure 31: District Wise Soil Moisture Content Map of Maharashtra 246
Figure 32: Land-use Map of Maharashtra 247
Figure 33: Maharashtra Forest Cover Map 255
Figure 34: Map Showing Ecologically Hotspots in Maharashtra 256
Figure 35: Maharashtra Wetland As per MRSAC Data 257
Figure 36: List of Pesticides and its Formulations banned in India 263
Figure 37: Drought Affected Tahsils of Maharashtra 267
Figure 38: Earthquake Zones in Maharashtra 269

Mott MacDonald |
13
September 2019
List of Abbreviations
ATMA Agricultural Technology Management Agency
AP Affected People
APEDA Agricultural and Processed Food Products Export Development Authority
APMC Agricultural Produce Marketing Committee
ARAP Abbreviated Resettlement Action Plan
BDS Business Development Services
BEE Bureau of Energy Efficiency
BIS Bureau of Indian Standards
BPL Below Poverty Line
Ca Calcium
CBO Community Based Organization
CEO Chief Executive Officer
CFC Chloro-Fluoro Carbon
CH4 Methane
CIB & RC Central Insecticides Board and Registration Committee
Cl Chlorine
CLF Cluster Level Federations
CMRC Community-Managed Resource Centres
CO Carbon Monoxide
CO2 Carbon Dioxide
CPCB Central Pollution Control Board

Mott MacDonald |
14
September 2019
CRPP Climate Resilient Perspective Plan
CRZ Costal Regulation Zone
DoA Department of Agriculture
DAP Diammonium Phosphate
DDT Dichloro Diphenyl Trichloroethane
D.G Diesel Generator
DIU District Implementation Unit
DPR Detailed Project Report
EC Electrical Conductivity
EIA Environmental Impact Assessment
EHS Environment, Health and Safety
EMP Environment Management Plan
E&S Environment and Social
ESA Environment and Social Assessment
ESDD Environmental and Social due diligence
ESMF Environment and Social Management Framework
ETL Economic Threshold Level
ETP Effluent Treatment Plant
EX-ACT VC Ex Ante Carbon Balance Tool for Value Chain
Fe Iron
FAO Food and Agriculture Organization
FGD Focus Group Discussion
FPC Farmer Producer Company
FPIC Free and Prior Informed Consent
FPO Farm Producer Organisation
FSSAI Food Safety and Standards Authority of India
FYM Farm Yard Manure
GAP Good Agricultural Practices
GCA Gross Cropped Area
GHG Green House Gases
GoI Government of India
GoM Government of Maharashtra
GM Genetically Modified
GIM Green India Mission

Mott MacDonald |
15
September 2019
GIS Geographical Information System
GRC Goat Rearing Cooperatives
GRM Grievance Redress Mechanism
Ha Hectare
HACCP Hazard Analysis and Critical Control Points
HCFC Hydro Chloro Fluoro Carbon
HFC Hydro Fluoro Carbon
HIV / AIDS Human Immuno-Deficiency Virus / Acquired Immune Deficiency Syndrome
HVA
HVAC
Higher Valuechain Activity
Heating Ventilation and Air Conditioning
IDM Integrated Disease Management
IEC Information, Education and Communication
IFC International Finance Corporation
IMD Indian Meteorological Department
INM Integrated Nutrient Management
INR Indian Rupee
INPM Integrated Nutrient and Pest Management
IP
IPDP
Indigenous People
Indigenous People Development Plan
IPF Indigenous People Framework
IPP Indigenous People Plan
IPM Integrated Pest Management
IWMP Integrated Watershed Management Program
JNNSM Jawaharlal Nehru National Solar Mission
JSA Jalayukt Shivar Abhiyan
K Potassium
KCC Kisan Credit Card
KG Kilogram
LED Light Emitting Diode
LMC Land Management Committee
LPG Liquefied Petroleum Gas
LULC Land use and Land Cover Change
MACP Maharashtra Agriculture Competitiveness Project
MAP Market Access Plans
M&E Monitoring and Evaluation

Mott MacDonald |
16
September 2019
MAVIM Mahila Arthik Vikas Mahamandal
MCIC Maharashtra Climate Innovation Centre
Mg Magnesium
Mg / L Milligram per Litre
MGNREGA Mahatma Gandhi National Rural Employment Guarantee Act
MIS Management Information System
Mm Millimetres
MM Mott MacDonald
MoU Memorandum of Understanding
MPCB Maharashtra State Pollution Control Board
MRL Maximum Residue Level
MSAMB Maharashtra State Agricultural Marketing Board
MSAPCC Maharashtra State Action Plan on Climate Change
MSME Ministry of Micro, Small and Medium Enterprises
MSRLM Maharashtra State Rural Livelihood Mission
MT Metric Tonnes
MTR Mid-Term Review
MVSTF Maharashtra Village Social Transformation Foundation
MW Mega Watts
NABARD National Bank for Agriculture and Rural Development
NAPCC National Action Plan on Climate Change
NICRA National Initiative on Climate Resilient Agriculture
N2O Nitrogen Dioxide
NOx Nitrous Oxide
NOC No Objection Certificate
NMEEE National Mission for Enhanced Energy Efficiency
NMSA National Mission for Sustainable Agriculture
NPK Nitrogen, Phosphorous and Potassium
NPOP National Programme for Organic Production
NSSO National Sample Survey Organization
NTFP Non-timber Forest Product
NWM National Water Mission
OC Organic Carbon
OP Operational Policies of the World Bank
PAF Project Affected Families

Mott MacDonald |
17
September 2019
PAP Project Affected Persons
PACS Primary Agriculture Cooperative Society
PCMU Project Coordination and Management Unit
PCN Project Concept Note
PDO Project Development Objective
PESO Petroleum and Explosives Safety Organization
PIU Project Implementation Unit
PoCRA Project on Climate Resilient Agriculture
PPP Private Partnership Plans
PRI Panchayati Raj Institution
PTG Primitive Tribal Groups
PUC Pollution Under Control
PVTG Particularly Vulnerable Tribal Groups
QCI Quality Council of India
RAP Resettlement Action Plan
RF Resettlement Framework
R&R Resettlement and Rehabilitation
RPF Resettlement Policy Framework
RSC Residual Sodium Carbonate
RTFCTLARR Right to Fair Compensation and Transparency in Land Acquisition, Rehabilitation and Resettlement
SAR Sodium Adsorption Ratio
SC Scheduled Caste
SEP Stakeholder Engagement Plan
SIA Social Impact Assessment
SDP State Domestic Product
SO2 Sulphur Dioxide
SOC Soil Organic Carbon
SOM Soil Organic Matter
SHG Self Help Group
SMART State of Maharashtra Agribusiness and Rural Transformation
SMF Social Management Framework
Sq. m. Square metre
ST Scheduled Tribe
S-W South-West
tCO2Eq MT of Carbon di-oxide equivalent

Mott MacDonald |
18
September 2019
ULB Urban Local Bodies
UNDP United Nations Development Program
US$ United States Dollar
UT Union Territory
WB World Bank
WHH Women Headed Households
WHO World Health Organization
WHS Water Harvesting Structure
WPR Workforce Participation Rate
WUA Water User Association
WUE Water use Efficiency
ZBNF Zero Budget Natural Farming

Mott MacDonald |
19
September 2019

Mott MacDonald |
20
September 2019
Executive summary
The State of Maharashtra’s Agribusiness and Rural Transformation (SMART) Project is proposed for
funding by The World Bank (WB). It is aimed at extending support for the development of inclusive and
competitive value chains focusing on small and marginal farmers and Agri- entrepreneurs. The project
backed with technical inputs will also seek to increase access of farmers to new and organized markets
and improve women’s transition to higher value chain activities (HVA).
The various activities proposed in the components/ sub components of the SMART are expected to result
in social and environmental impacts. To understand these impacts (positive and negative) and to suggest
enhancement / mitigation strategy, as part of preparation of SMART, an Environment and Social
Management Framework (ESMF), was commissioned by Department of Agriculture, Government of
Maharashtra, through M/S Mott MacDonald (MM).
ESMF was based on intensive discussions with the project proponents, review of associated policies and
regulations, baseline study and stakeholder consultations to understand the social and environment
issues in the context of the proposed activities under SMART. The ESMF assessed the impacts, both
positive and negative, that the project interventions will have on the various stakeholders and social and
environmental issues, directly or indirectly.
Random sampling was followed for the baseline survey to ensure that social and environmental issues
applicable to the project are adequately captured. The survey covered stakeholders in the value-chain,
mainly producers, in different parts of the project area; 4800 households (HHs) covering 20 community-
based organizations (CBOs) in nine agro-climatic zones covering eight Agri-commodities.
The stakeholders were either involved through survey, individual interviews, or through Focussed Group
Discussions (FGDs) and village level meetings, including women, Scheduled Castes (SC), Scheduled Tribes
(ST) and Women-Headed Households (WHH).
The food safety standards were assessed through consultation with agribusiness stakeholders and line
departments. A review of reports of MRL testing was also carried out in the study. An assessment of use
of chemical and bio-pesticides, bio-fertilizer and chemical fertiliser, areas under Good Agricultural Practice
(GAP), implementation of Integrated Nutrient Management (INM) and Integrated Pest Management
(IPM) was carried out.
Based on the above assessment, required strategies, framework, guidelines and targets were developed.
This included environmental management framework for GAP certification strategy, social management
framework, indigenous people framework, citizen engagement plan, labour management framework,
grievance redress mechanism, food safety strategy, monitoring plan, guideline on clearance procedures
for food and agriproducts import into India and Pest Management Plan.
Review of Central and State Rules, Regulations, Policy and Schemes
A review of national and state level policies and regulations applicable for project implementation as it
related to environmental and social aspects and the World Bank Safeguards and Operational Policies (OPs)
was carried out. This review helped in assessing adequacy of the existing policies and regulations and
identifying gaps, for which additional measures have been included in the Environmental and Social
Management Framework (ESMF). The applicable operational policies are:

Mott MacDonald |
21
September 2019
● OP 4.01 Environmental Assessment
● OP 4.09 Pest Management
● OP 4.10 Indigenous People Development Plan
● OP 4.12 Involuntary Resettlement.
Environmental Baseline
● Maharashtra is in the North Centre of Peninsular India between 150 45’ N to 220 06’ N latitude and
720 36’E to 800 54’ E longitude and covers a geographic area of 3,07,713 sq.km.
● Topography of the State comprises of the Western Ghats along western border and the Deccan
Plateau.
● Maharashtra’s geology comprises of the deccan trap (82 percent) with remaining area under alluvial
deposit, Proterozoic rock, Gondwana system and Lameta and Bagh Beds.
● The soil types in Maharashtra are light black soil, medium black soil, deep black soil, reddish brown
soil, alluvial soil, yellowish brown soil, laterite soil and coastal saline soil. However, black soil covers
the maximum area (27 ) in Maharashtra except for Ratnagiri and parts of Chandrapur district.
● Based on rainfall, soil type and vegetation, Maharashtra is divided into nine Agro-climatic zones. North
Konkan zone (3,000 mm/year), South Konkan zone (3,000 mm/year) and the Western Ghats zone
(4000 mm per year) receive very heavy rainfall, whereas sub mountain zone (700 - 2500 mm/year),
Western Maharashtra plain zone (700 - 1200 mm/year) and Eastern Vidarbha zone (1300 to 1800
mm/year) receive moderate rainfall, and scarcity zone or Central Maharashtra plateau zone (700 - 900
mm/year) and Central Vidarbha Zone (1200 mm/year) receive comparatively less rainfall.
● Temperature in Maharashtra varies as per climatic zones: North Konkan zone (22-33 degree Celsius),
South Konkan zone (20-30 degree Celsius), Western Ghats zone (30-40 degree Celsius), Sub mountain
zone (28-35 degree Celsius), Western Maharashtra Plain zone (up to 40 degree Celsius), Eastern
Vidarbha zone (up to 37 degree Celsius), Central Maharashtra plateau zone (up to 40 degree Celsius)
and Central Vidarbha Zone ( 35-40 degree Celsius).
● Maharashtra has a total geographical area of 307.71 lakh Ha out of which the net cropped area is
169.10 lakh Ha and gross cropped area is 232.24 lakh Ha The average cropping intensity in
Maharashtra is 137.3 percent.
● As per Economic Survey of Maharashtra 2018-19, the total area under irrigation in the State is 39.50
lakh Ha which is about 17.8 percent of the total gross area under cultivation.
● The proposed Project intervention excludes area under forest in Maharashtra which is 61.36 lakh Ha,
i.e. 19.94 percent of the total area. District-wise forest distribution statistics indicate that Latur has
the least area under forest cover and Gadchiroli has the largest forest cover. The total forest cover for
India is 21.54 percent of the total area of the country as per India State of Forest Report, 2017.
● The proposed Project also excludes any intervention in any of 6 National Parks and 35 Wildlife
Sanctuaries covering an area of 15,526 sq. km (15.53 lakh Ha) which constitute 5.04 percent of the
State’s geographic area. Wetland area in Maharashtra is also excluded which is estimated to be 10.15
lakh Ha that accounts to 3.30 percent of the total geographical area of the State.
● As per Agricultural and Processed Food Products Export Development Authority (APEDA), Ministry of
Commerce and Industries, Government of India, consolidated organic agricultural statistics for the
year 2017-18 under National Programme for Organic Production (NPOP), 1.08 lakh Ha of land area is
certified as organic and additional 1.27 lakh Ha of land area is under process of conversion into organic
farming.

Mott MacDonald |
22
September 2019
● 82 percent of agricultural area in Maharashtra is rainfed. So, this makes agriculture vulnerable to the
impacts of climate change due to its high dependence on rain fed agriculture. As per climate and
agriculture report of Department of Agricultural Meteorology, Mahatma Phule Krushi Vidyapeeth,
Pune the worst affected districts in Maharashtra are Solapur, Osmanabad, Nanded, Aurangabad,
Ahmednagar, Sangli, Satara, Beed, Nashik, Buldhana, Latur, Jalna, Jalgaon and Dhule.
● As per the Economic survey of Maharashtra 2018-19, consumption of chemical pesticide in
Maharashtra varied from 13,496 MT to 15,705 MT, between 2016 to 2019. The bio-pesticides
consumption varied from 1,454 MT to 2,252 MT in the same duration. In the same period, the chemical
fertilizer consumption at 62.10 lakh MT indicates consumption of chemical fertilizer as 124.8 kg/per
Ha As per Economic Survey of Maharashtra 2017-18, the region wise consumption pattern indicates
that fertilizer consumption is maximum in Aurangabad region followed by Pune and Nashik regions.
Social baseline
Some of the key social baseline observations are as under:
1. Due to random sampling and nature of the activities, the survey found that, nearly 33 percent of the
surveyed HHs belonged to backward communities (SC, ST, Nomadic Tribes);
2. The major economic activities pursued by the surveyed HHs was agriculture based i.e., agriculture,
livestock and farm wage earning;
3. The survey that covered all categories of agriculture farmers, suggests that nearly all the HHs reported
30-50 percent of HH income from agriculture;
4. About 50 percent of the surveyed HHs were marginal (with up to 1 Ha landholding) and small (up to
2 Ha landholding) farmers;
5. Involvement of women in agriculture HVA was very poor despite significant numbers at the production
levels;
6. Lack of market access, exploitation by middleperson, shortage of working capital, lack of market
intelligence services, distance from market, Lack of infrastructure/storage facility, mismatch between
labour demand and supply (labour shortage during harvesting and other activities), lower profitability
- higher production cost, were common issues;
7. Women - CBOs i.e. CLFs and CMRCs, have limited exposure and experience in the post-harvest
management and marketing areas;
8. In the surveyed CBOs (not including Women - CBOs), the 21 percent of member were women and 20
percent of women were Board of Directors. The percent of Women Signatory/ies in the Board of
Directors was negligible at 1 percent;
9. Little or no collateral for availing credit also restricted women’s participation in post-harvest value
chains; and
10. Lack of land ownership rights restricted women’s opportunities to participate in extension trainings,
access to finance and infrastructure support.
Environmental Impacts
Screening of impacts attributed to agricultural and allied activates resulted in identifying of the following
major environmental observations and impacts:
● 55-60 percent farmers did not have soil health card, raising the chances of improper use of fertiliser;
● The agri-commodity wise MRL values in mg/kg of the samples tested by DoA, GoM (2016-17 to 2018-
Mott MacDonald |
23
September 2019
19) were compared against standards set by FSSAI Regulation, 2011. It showed excessive MRL values
in 16 agri-commodities.
● Health, safety and hygiene related impacts and contamination of soil due to improper disposal of used
and empty pesticide and agro-chemical containers;
● Noticeable impacts were attributed to unscientific disposal of solid waste generated from Food
Processing Industry, Wholesale Markets, Retail shops and Traders;
● Ground water and surface water quality was impacted due to incorrect usage of pesticides and
chemical fertilizers;
● Impact on forest land noticed due to grazing of goat and sheep in the forest area;
● Impact on farmer’s health and safety is noticed due to improper handling of pesticides and other
harmful agro- chemicals; and
● Impact on agriculture due to climate change or unsupportive environment result in loss of yield and
post-harvest losses.
Green House Gas Emission
● Greenhouse Gas Emission estimation of value chain has been conducted for six commodities namely
cotton, turmeric, soybean, okra, banana and goat using FAO’s Ex-Act value chain tool. The calculation
is based on the current and upgraded scenario wherein it has been envisioned to achieve 10 percent
efficiency in energy consumption, use of chemical fertiliser and other resource utilisation in the
upgraded scenario. The area of sowing in most of the sub-project plans remains the same as SMART
does not have direct influence at the production level.
The results of analysis of GHG emission estimation of upgraded scenario is summarised below.
● Out of the above six commodities, turmeric has highest saving of GHG emission, Cotton, Soybean, and
Banana have moderate savings and Okra has insignificant savings.
● GHG emission from goat rearing increases due to increase of number of goats from 3640 in current
scenario to 8176 in the project scenario due to GHG emission related to fodder practices and enteric
fermentation.
● GHG emission from Okra increases mainly because organic manures are increased by 10 percent and
chemical manure is reduced by 10 percent. It is evident that nitrogenous chemical manure like urea is
a sink for CO2 while there is a positive emission due to increase of organic manure.
Construction Management
All the construction work needs to be complied with environmental and social management framework
in addition to national and local regulatory and statutory requirements. A separate indicative guideline
has been prepared as part of this report for compliance to the ESMF.
Good Industrial Practices – Slaughter House
New and existing slaughter houses to be supported by SMART shall comply with Good Industrial Practices
for Slaughterhouse included in this ESMF report the guideline includes goat rearing, transportation
requirement for animals, slaughter house layout, waste management practices and Central Pollution
Control Board (CPCB) standards.

Mott MacDonald |
24
September 2019
Guidelines on Food and Agri Imports
Food and Agri imports to India are regulated by Food Safety and Standard (Import) Regulation 2017 and
Plant Quarantine (Regulation of Import to India) Order 2003 with requirements of certification process to
be complied by the importers. Chapter 12 includes guideline on food and Agri-products import to India.
Pest Management Plan
The recent data of economic survey 2018-19 of Maharashtra shows 15,705 MT of chemical fertilisers and
2,252 MT of biopesticides are used in Maharashtra. The commodity wise share of pesticides used in
Maharashtra is 30 percent in cotton, 20 percent in vegetable, 20 percent in oil seeds and 10 percent each
in fruits, cereals and pulses. This calls for implementation and enhancement of coverage of integrated
pest management and integrated nutrient management. The SMART will contribute in enhancement of
area under INM and IPM practices in State by providing for training and capacity building to CBOs.
Air Pollution in Agri-Value Chain
In the absence of knowledge on soil quality, farmers are using excessive nitrogenous fertilisers which
results in emission of oxides of nitrogen. The other sources of air pollution are burning of crops residue
and emission from processing of Agri-produce and food processing industry. This shall be mitigated by
providing training and awareness programs on technology and management measures prepared in
environmental management framework of this study.
Health and Safety
It was found during the survey that farmers were not using proper safety gears which resulted in accidents
involving farm equipment, machineries and vehicles. The other health and safety risks related to snake
and animal bites which were occurring frequently with farmers.
The health impacts associated with improper usage of chemical and pesticides without using proper safety
gears impacts health and safety of the workers. These impacts will also be mitigated by providing
awareness training and monitoring system prepared in the environmental and social management
framework report.
Environmental and Social Management Framework
Based on the outcome of survey, an appropriate Environmental and Social Management Framework
(ESMF) has been formulated that will be implemented as part of SMART. It includes identification of the
Environmental and Social (E&S) impacts resulting from the proposed project interventions, detailing of
the mitigation measures, and impact monitoring indicators (process and outcome indicators). The ESMF
describes the implementation schedule in accordance with the project cycle. The institutional framework
for E&S management has been aligned with the proposed SMART project management structure.
Identification of impacts has been done based on the selected criteria namely context, duration, and time.
For positive impacts, enhancement measures have been suggested and for negative impacts mitigation
measures are included under ESMF.
Some of the positive impacts include opportunities for increased income for producers, employment
opportunities in rural areas through Productive Partnership (PP) proposals and Market Access Plans
(MAP). By improving market linkages of farmer producers, including for women and marginal farmers,
demand and subsequent production is expected to increase leading to increased income for producers.

Mott MacDonald |
25
September 2019
The ESMF process includes screening process to ensure that project under various sub components does
not involve any land acquisition/ appropriation and physical displacement of the people. If any new land
is required, direct purchase method will be adopted. Project will ensure that any public land allotted for
any of the project activities will be encumbrance free. However, the Bank Policy on Involuntary
Resettlement (OP 4.12) may be applicable to this project, owing to small and large (in cases of slaughter
houses) civil works. In the latter case, an ‘Entitlement Matrix’ has been proposed. For civil work, the labour
management framework has been proposed.
The process flow for ESMF clearly spells out the strategy to be followed for all the proposed SMART
investments:
● Proposals with insignificant impacts will require no further action and will be cleared.
● Proposals with minor impacts will be cleared with suggestions for good practices and applicable
mitigation measures.
● Proposals with moderate impact will be cleared after suitable mitigation measures are incorporated
with compliance monitoring.
● Proposals expected to have major impacts, standalone environmental and social impact assessment
will be suggested, and the final clearance will have conditionality of following an environmental and
social management plan (ESMP).
The project does not create any barrier for participation and engagement of women, SC/ST and other
vulnerable sections or groups. However, to enhance their participation, the ESMF incorporates measures
including Information, Education and Communication (IEC) and, training and capacity building. Culturally
appropriate training modules will be developed to help these vulnerable groups to access project benefits
at par with others. ESMF also includes measures like helping these vulnerable groups to avail extension
services etc. The project will develop a database on membership and representation of women, SC/ST
and other vulnerable groups in village level institutions.
At the state level, the Implementing Agency (IA), i.e. Department of Agriculture (DoA) has established a
Project Coordination and Management Unit (PCMU). An Environmental and Social Management (ESM)
cell, is also proposed under the PCMU, which will be responsible for addressing the E&S related issues of
the project. The requisite information to ESM cell will be made available through appropriate support
from the Technical teams in the Project Implementing Units (PIUs) to make informed decisions regarding
E&S issues. The project includes training and capacity building of the officers of PIU and EIA
(Environmental Impact Assessment) on E&S management issues under the project.
Environmental and Social Budget
The environmental and social management budget for the project is estimated to be INR 48,29,20,000/-
(Rupees Forty Eight Crores Twenty Nine Lakhs and Twenty Thousand Only) including training capacity
building of CBOs, development of IEC material, environmental and social monitoring, technical services
for agencies and third-party audit.

Mott MacDonald |
26
September 2019
1 Introduction
Mott MacDonald has been commissioned by the Project Coordination and Management Unit (PCMU) to
undertake an Environment and Social Management Framework (ESMF) of the SMART to be implemented
across Maharashtra.
1.1 Project Background
Agriculture is the mainstay of the State of Maharashtra with 55 percent of its total population directly or
indirectly dependent on agriculture (Source: Task force on Agriculture development, Niti Aayog, 2015).
The State accounts for 11.81 percent of India’s Gross Cropped Area (GCA), and, agriculture and allied
activities contributes 11 percent to the State‘s income. Principal crops of the State include rice, jowar,
bajra, wheat, pulses, cotton, sugarcane and several oil seeds including groundnut, sunflower and soybean.
The state has numerous areas, under fruit cultivation with mango, banana, grapes, pomegranate orange
etc., and cashew nuts being the main horticultural crops. Major vegetables cultivated in Maharashtra are
onion, chilli, tomato, potato and flower crops like gerbera, carnations, roses, especially under protected
cultivation.
According to 2010-11 State Agriculture Census, the total farmers in the state stands at nearly 13.6 million,
of which 48.9 percent and 29.5 percent are marginal and small farmers, respectively. In other words, an
overwhelming majority (78.4 percent of the total) are small and marginal farmers. The total operational
land holding of small and marginal farmer (up to 2.0 Ha /farmer) was 8.925 million Ha or 45.2 percent of
the total land holding.
1.1.1 Key challenges in Agriculture and Allied Activities in the State
Maharashtra is one of the richest states in terms of per capita income, but its agricultural productivity is
low. This sector is plagued by lack of aggregation among farmers resulting in low economies of scale which
increase production and marketing costs, combined with involvement of many intermediaries along the
supply chain. The key challenges faced by the State are:
● Declining Gross State Value Added: The share of agriculture and allied activities sector in the total
GSVA is on the decline over the years (about 12.2 percent during 2016-17 as against 15.3 percent
during 2001-02), whereas still majority of the State’s population is dependent on agriculture and allied
sector for their livelihood.
● Shrinking average agricultural holdings: The average size of agricultural holdings has been on the
decline (from 4.28 Ha to 1.44 Ha), whereas, increase in the number of marginal and small farmers, and
their dependency on monsoon and weather are resulting in low profitability.
● Irrigation potential utilized is 26.54 lakh Ha (about 40 percent of irrigation potential created).
● Infrastructure gaps in processing, storage, transport, marketing and R&D.
● Low representation of women in higher levels of value chains such as management, marketing and
decision-making and having higher financial returns.
[Source: Project Implementation Plan]
Hence, the Government of Maharashtra conceptualized the implementation of the State of Maharashtra's
Agribusiness and Rural Transformation (SMART) Project to:
Mott MacDonald |
27
September 2019
– facilitate aggregation of farm produce through the development of community-based
organizations (CBOs)
– provide market linkage through end-to-end solutions in Public-Private Partnership (PPP) mode.
1.2 Project Background
The project intends to collaboratively formulate and implement SMART project with the assistance of the
World Bank aiming at transforming rural Maharashtra through interventions in Agriculture and Livelihood
sectors. The Government of Maharashtra intends to implement the SMART Project through revamp of
agricultural value chains, with special focus on small and marginal farmers across the State, in alignment
with Government of India’s efforts towards doubling of farmers’ income by 2022.
1.2.1 Project Development Objective (PDO)
The PDO thus includes support f o r the development of inclusive and competitive agriculture value
chains, focusing on small landholding farmers and Agri- entrepreneurs. The PDO would be achieved by
expanding access to new and organized markets for producers and enterprises with complementary
investments in technical services and risk management capabilities. It would support following
interventions
a. Enhancing Institutional Capacity for Agribusiness Reforms
b. Support Enterprise Growth and Expand Market Access
c. Building Risk Mitigation Mechanism.
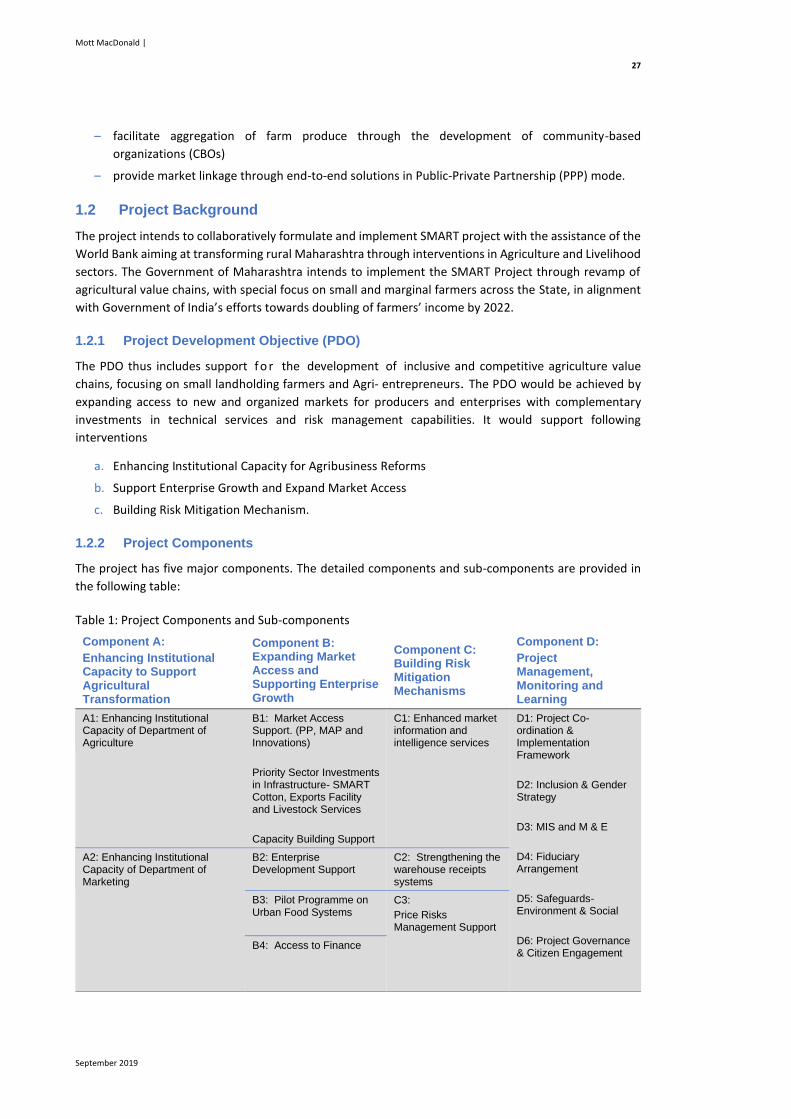
1.2.2 Project Components
The project has five major components. The detailed components and sub-components are provided in
the following table:
Table 1: Project Components and Sub-components
Component A:
Enhancing Institutional Capacity to Support Agricultural Transformation
Component B: Expanding Market Access and Supporting Enterprise Growth
Component C: Building Risk Mitigation Mechanisms
Component D:
Project Management, Monitoring and Learning
A1: Enhancing Institutional Capacity of Department of Agriculture
B1: Market Access Support. (PP, MAP and Innovations)
Priority Sector Investments in Infrastructure- SMART Cotton, Exports Facility and Livestock Services
Capacity Building Support
C1: Enhanced market information and intelligence services
D1: Project Co-ordination & Implementation Framework
D2: Inclusion & Gender Strategy
D3: MIS and M & E
D4: Fiduciary Arrangement
D5: Safeguards- Environment & Social
D6: Project Governance & Citizen Engagement
A2: Enhancing Institutional Capacity of Department of Marketing
B2: Enterprise Development Support
C2: Strengthening the warehouse receipts systems
B3: Pilot Programme on Urban Food Systems
C3:
Price Risks Management Support
B4: Access to Finance

Mott MacDonald |
28
September 2019
Component A:
Enhancing Institutional Capacity to Support Agricultural Transformation
Component B: Expanding Market Access and Supporting Enterprise Growth
Component C: Building Risk Mitigation Mechanisms
Component D:
Project Management, Monitoring and Learning
A3: Strengthening capacity for Reform Measures and Joint actions
1.2.3 Project Beneficiaries
The primary project beneficiaries are CBOs such as the Self-Help Groups (SHG), Community managed
Resource Centres (CMRC), Cluster Level Federations (CLF), Farm Producer Companies (FPC) and Primary
Agriculture Cooperative Society (PACS). The project is expected to benefit approximately 1000 CBOs of
the State through the development of Productive Partnerships (PPs), Market Access Plans (MAPs) and
Collateral Management Plans (CMPs) among private entities, MSMEs, start-ups, etc.
1.2.4 Project Coverage
The SMART Project will be implemented in the entire State of Maharashtra. The nine Agri-climatic zones
of the State are shown in the following map:

Mott MacDonald |
29
September 2019
Figure 1: Project Coverage Areas
Source: Department of Agriculture, Government of Maharashtra
1.2.5 Project Implementation Structure
The project will be implemented through Project Co-ordination and Management Unit (PCMU) and 11
Project Implementing Units (PIUs) including
• Department of Agriculture
• Department of Animal Husbandry
• Department of Cooperation and Agriculture Marketing
• Maharashtra State Agriculture Marketing Board (MSAMB)
• Maharashtra State Warehousing Corporation (MSWC)
• Maharashtra Co-operative Development Corporation (MCDC)
• Maharashtra State Cotton Growers Marketing Federation (MahaCOT)
• Maharashtra State Rural Livelihood Mission (MSRLM)
• Mahila Arthik Vikas Mahamandal (MAVIM)
• Village Social Transformation Foundation (VSTF)

Mott MacDonald |
30
September 2019
• Pune Municipal Corporation (PMC)
The project will capitalize on community-based organizations and institutions formed under the following
interventions:
● Maharashtra Agriculture Competitiveness Project (MACP) – The project objective was to increase
productivity, profitability and market access. Under the project, 412 Farmer Producer Companies (FPC)
were established
● Mahila Arthik Vikas Mahamandal (MAVIM) – over a decade of efforts has been made by MAVIM to
initiate, expand and establish the SHG movement in Maharashtra. MAVIM is working in all districts of
Maharashtra covering 11,326 villages and formed 97,301 SHGs.
● Maharashtra State Rural Livelihood Mission (MSRLM) – The project objective is to alleviate poverty
through livelihood interventions. Under the project, 3.8 lakh SHGs, 12,610 Village Organizations, 479
Cluster Level Federations (CLFs) and 7000 Micro enterprises have been formed. The project is
implemented in 34 districts, 351 blocks, 28,091 Gram-Panchayats and 42,642 villages.
● Maharashtra Village Social Transformation Foundation (VSTF) – The project mission is to transform
1000 villages in Maharashtra by enhancing development indicators of villages. It serves as a platform
to garner support of corporate sector for rural development
The SMART project implementation structure is presented in the Figure below:

Mott MacDonald |
31
September 2019
Figure 2: Project Implementation Structure
Source: Project Implementation Plan
Project Steering Committee - Chaired by Hon. Chief Secretary
Project Coordination Committee - Chaired by Secretary Agriculture
Core Project Coordination Unit (CPIU) - Head - Secretary Agriculture
Project Coordination and Management Unit (PCMU) - Project Director - Commissioner Agriculture
PIU Agriculture (Head - Director
ATMA)
PIU Animal Husbandry (Head - Commissioner
Animal Husbandry)
PIU Agri Marketing (Head - Director
Marketing)
PIU - MSRLM (Head - CEO, MSRLM)
PIUs to be located within the line
departments to ensure synergy and
coordination
PIU - MSWC (Head - MD, MSWC)
PIU - MAVIM (Head - VCMD, MAVIM)
PIU - MahaCOT (Head - MD, MahaCOT)
PIU - PMC (Head - Commissioner,
PMC)
PIU - VSTF (Head - CEO, MVSTF)
PIU MCDC (Head - MD, MCDC)
PIU MSAMB (Head - MD, MSAMB)
Regional Implementatoion Unit (RIU) (Head - Regional Joint Director of Agriculture)
District Implementation Unit (DIU) (Head - District Superintending Agriculture Officer)

Mott MacDonald |
32
September 2019
1.3 Proposed Environmental and Social Management Team
The project coordination and management unit (PCMU) will have one environmental and one social and
gender officer on full time basis. There are eight regional Joint Director of Agriculture (JDA) Offices in the
Project area and each Regional JDA office will have one Social and Environment expert. MSRLM and
MAVIM will have social experts on deputation.
Role and responsibility of Environment and Social Officers are as follows:
● To advise on activities/processes to be adopted for achieving the core social development themes i.e.
social inclusion (gender, tribal and other vulnerable groups), participation, transparency,
accountability, land management, grievance management and citizen feedback envisaged under
SMART;
● Assess and confirm requirement of EIA/ SIA (Social Impact Assessment) and EMP (Environment
Impact Plan) or resettlement plan as per the ESMF;
● Facilitate preparation of Social & Environmental Assessment Report and Management Plans and/or
framework for managing adverse social & environment impacts, risks and benefits of project
interventions;
● Ensure EMP or construction management plan forms part of the Bid document
● Establish a system to monitor environmental & social safeguards of the project including monitoring
the indicators set out in the monitoring plan;
● Facilitate and confirm overall compliance with all Government rules and regulations regarding site and
environmental clearances as well as any other environmental requirements (e.g., Location Clearance
Certificates, Consent to Establish, Consent to Operate etc.), as relevant;
● Facilitate inclusion of vulnerable and marginalized groups in the project interventions;
● To develop the capacity building manual on social issues, through experienced training agencies
(Content of the manual will include scheme cycle, outline of Social Assessment, management plans &
reporting formats, R&R policy, land acquisition/donation process and other land related matters,
identification of project affected people, social entitlement framework, risk assessment and
management skills);
● To develop the capacity of the line department officials in strategic collaborative planning,
implementation & monitoring of the activities in compliance with the Social Safeguard Policies of the
World Bank;
● To build the capacity of all stakeholders in the management of social safeguard issues. To ensure
that social issues have been adequately addressed;
● Compilation and analysis of monthly/quarterly reports on social indicators; tracking of Grievance
Redressal and Social Audit;
● Supervise and provide guidance to the site staffs to properly carry out the environmental monitoring
and assessments as per the ESMF;
● Review, monitor and evaluate the effectiveness with which the Plans are implemented, and
recommend necessary corrective actions to be taken as required;
● Consolidate monthly/ quarterly environmental & social monitoring reports;
● Channelize redressal any grievances brought about through the Grievance Redress Mechanism (GRM)
in a timely manner;
● Develop decentralized local capacity on managing social issues associated with various sub -project
cycles;

Mott MacDonald |
33
September 2019
● Co-ordinate review, support and monitor all respective social safeguard aspects of the project.
1.3.1 Selection of Crops for intervention under the SMART Project
Since specific value chains will be targeted under the Project, critical exercises were undertaken to select
the crops. The initial shortened list included 35 crops which were further scrutinized before preparing the
final list of crops. Presently, 26 crops have been selected for the project intervention and more crops are
being evaluated for further inclusion. The criteria for selection of crops was developed through extensive
discussions and inputs from stakeholders and knowledgeable informants. These criteria are as below:
● Perceived economic value of the crop to the State
● Requirement of water for cultivation of the crop
● Proportion of small and marginal farmers cultivating the crop
● Participation of women in cultivation, harvesting and post-harvest operations of the crop
● Potential of value addition in post-harvest operations (marketing, transport, processing, storage)
● Export potential of the crop or its products and by-products
● Wide-spread cultivation of the crop in the State
● Listing of crops on futures exchanges (as on March 2019)
● Inclusion of crop in the list of commodities for which Minimum Support Price (MSP) is declared by the
State or the Centre
● The level of volatility in prices of the crop (during the last six years, 2012-2018)
● Rise in demand in relation to supply (during the last six years, 2012 – 2018)
In this context, Mott MacDonald (MM) has been contracted as Consultant to carry out an Environment
and Social Assessment (ESA) to identify key environmental and social issues and challenges and risk
associated with SMART project. The detailed approach and methodology for the assignment is
presented in the next chapter.

Mott MacDonald |
34
September 2019

Mott MacDonald |
35
September 2019
2 Approach and Methodology
The approach and methodology for the project proposed by MM was finalised through a series of
interactions and meetings with PCMU and the WB. This included the meeting with the subject experts
from PCMU to gain a better understanding of the activities proposed under SMART. The strategy also
considered the review of the secondary literature related to the agriculture sector and the current status
and challenges facing the sector. The meeting at PCMU was later followed by a joint meeting of PCMU,
WB and MM at the PCMU office in Pune. The suggestions and the outcome of the meeting further guided
in finalising the approach and methodology for the study. This section presents the approach and
methodology applied to undertake the Environmental and Social Management Framework (ESMF) of the
SMART. The ESMF has been conducted in accordance with the World Bank Safeguards and Operational
Principles and Indian regulatory requirements.
The purpose of this consultancy assignment is to:
● Conduct an Environment and Social Assessment (ESA) to identify and assess potential environmental
and social impacts and risks in the implementation of the SMART project
● Based on findings of the ESA, prepare an Environment and Social Management Framework (ESMF), to
avoid, minimize and mitigate potential adverse environmental and social impacts of the project’s
proposed interventions and enhance the potential positive environmental and social impacts of the
project interventions.
Detailed Scope of Work is in Appendix A
Figure 3: Brief Approach
The detailed methodology for the assignment is as discussed in the subsequent sections.

Mott MacDonald |
36
September 2019
2.1.1 Step I: Formulating strategy for conducting ESMF
MM presented a detailed strategy for conducting the ESMF in a joint meeting organised at PCMU. In a
nutshell, the strategy revolved around identifying and understanding the key activities involved in each
segment of the SMART, from the perspective of capturing the environmental and social issues and
impacts. Stakeholder and institutional analysis formed an important part of this assessment that provided
the context to the ESA and the framework. A major part of the assessment has been guided by the
baseline study using research instruments like the sample survey and the focussed group discussions
(FGDs). These instruments were finalised with the PCMU. Analysis of the information collected has given
a shape to the understanding of the positive and adverse (social and environmental) impacts, which have
been used for developing the environmental and social management framework for the project in the
background of relevant national laws and the World Bank standards and policies.
2.1.2 Step II: Policy and regulations review
A large section of the report is based on the secondary research of nine Agri-climatic zones of
Maharashtra, which included a desk review of the existing Acts, Regulations and Policy and Programs,
Economic and Agriculture Surveys, at the country level, which will have applicability to the project. The
section also aimed at highlighting, the compatibility of the existing Acts and Regulations to address the
possible impacts from the project. Further, analysis of the applicability of the various World Bank
Safeguards and Operational Policies (OPs) to be triggered were also analysed. This was followed by
suitability of the various Indian Acts and Regulations in addressing the triggered World Bank Safeguards
and OPs. The emerging gap analysis was used to interlink the impacts identified through the baseline and
stakeholder analysis and identifying suitable mitigation measures. This analysis primarily reviewed the
legal, regulatory and policy instruments related to various activities pertaining to the components to be
taken under SMART.
2.1.3 Step III: Baseline Survey
The baseline survey comprised collection of data from secondary and primary sources. For the social
assessment secondary data on demographic, social and economic profile of the population has been
compiled from census 2011, planning commission and human development reports and presented
subsequently in the report. The environment assessment involved secondary data collection on
topography, geology and soil, climate and rainfall, bio-diversity and forest, land use pattern, water
resources and quality, wetland, agricultural pests and crop diseases, irrigation, energy and food safety.
1.3.1.1 Primary data collection
For collection of primary data, stakeholder consultations have been carried out. Stakeholder consultations
were distributed among the consultant and project team for coverage in the respective zones. The
checklists used for stakeholder consultations are in Appendix B. A social baseline assessment is primarily
based on data received through six Productive Partnership (PP) plans covering 4811 households (22133
farmers) from nine districts and covering eight commodities.
1.3.1.2 Data collection methodology
The data collection was carried out to ensure representation of the nine Agro-climatic zones of the State.
In each zone, 2 to 3 districts were represented for coverage wherein the Agriculture Department and
officials from Agricultural Technology Management Agency (ATMA) were contacted to identify major
crops and FPCs for coverage in this assignment. Care was taken to ensure that crops for which
interventions were planned under the Project were covered during the field visits. The overall sampling
covered is 170 stakeholders among FPCs and MAVIM and MSRLM CBOs, APMC retailers and traders, goat
Mott MacDonald |
37
September 2019
rearing cooperatives, slaughter houses, private buyers and Bank officials. The stakeholder consultations
covered 16 districts representing 24 commodities. The social assessment for eight commodities was
carried out using questionnaires and focus group discussions.
2.1.4 Step IV: Impact identification
Based on the primary review, stakeholder analysis and secondary literature review, the impacts were
categorised under the social and environmental heads. An attempt has also been made to identify the
impacts and classify them into positive and negative impacts. For the purpose of categorisation of the
impacts a simple methodology has been used, which also captures the stage at which the impacts are
likely to emerge during the project implementation. The impact identification has also tried to capture
the following:
● Identify and prepare an inventory of possible direct and indirect
– positive impacts that could be enhanced/ upscaled/ replicated further and
– negative impacts and options for appropriate mitigation measures
● Suggest cost effective alternative approaches (wherever possible), such as use of environment-friendly
materials, to prevent negative impacts and suggest ways to enhance the participation of women, SC
and STs in project implementation. While taking the impact identification measures forward, attempts
have been made to explore measures to enhance the participation of tribal and other vulnerable
sections and ensure that they access project benefits at par with others.
Additionally, the ESMF include:
● Strategies to help tribal, women and other vulnerable sections of the CBOs, who are actively involved
in decision making so that they access project benefits at par with others.
● Measures required to support potential land losers (irrespective of their ownership of land), highlight
their social economic profile, defining arrangement for alternate livelihood for the project affected
people in the form of a resettlement action plan (RAP), if required in the case of land acquisition; etc.
While the national laws and regulations cover significant requirements, there is need for extra caution,
on the part of the project implementing agency (PCMU and PIUs), which have been suitably addressed in
the mitigation matrix.
2.1.5 Step V: Environment and Social Management Framework and Institutional
Framework Preparation
The environmental and social management framework has been developed for:
● Identifying institutional roles/responsibility for implementation, and its monitoring mechanism
● Developing project screening and exclusion criteria
● Integrating environmental and social management consideration at the various levels and stages of
project implementation
● Developing external monitoring mechanism within the project for addressing the environmental and
social impacts during the life cycle of the project
2.1.6 Study Limitation
● The coverage of CBOs, crops and stakeholders was limited to their availability during the primary data
collection process through field visits.

Mott MacDonald |
38
September 2019
The detailed findings and analysis from the assessments carried out are presented in the subsequent
sections of this report.

Mott MacDonald |
39
September 2019
3 Review of Environment and Social
Legislation and Policies
In this section, the Consultants have reviewed relevant legislations of Government of India (GOI), local
regulations of Government of Maharashtra, National and State Government schemes and policies of the
World Bank to ascertain their compliance in the Project.
3.1 Applicable Environmental Rules and Regulations of Government of India
The list of central government regulations with respect to environment and its applicability is as indicated
in the table below.
Table 2: Applicable Central Environment Rules and Regulations
S. No Name of relevant Act / Rule Project Applicability
1 Environmental Protection Act (EPA) 1986
Applicable.
Since food processing industries are involved, operation of diesel generators in market, warehouse and cold storage involves air emission or water discharge, so this will attract EPA, 1986.
2 Water (Prevention and Control of Pollution) Act, 1974 and Amended 1988
Applicable
Since the project involves support of establishments like food processing industries, cold storage, slaughter house which discharge water and wastewater. These will require permission under Water Act, 1974.
3 Air (Prevention and Control of Pollution) Act, 1981
Applicable
Since the project involves support of establishments like food processing industries, cold storage, slaughter house which result in air emission. These will require permission under Air Act, 1981
4 Hazardous and Other Waste (Management Handling and transboundary moment) Rules, 2016
The Act is applicable since there will be use of Agro-chemical and fertilizers in the agricultural and other allied activities in the project area and the unused chemical and their containers and packages shall be disposed as per the provisions of this act.
5 Solid Waste Management Rules, 2016
Applicable since the investment includes setting up of warehouse, markets, cold storages, processing facilities and retails and hence the municipal waste generated from these facilities shall be handled as per SWM rules and any new construction activity shall comply with SWM Rules. The bidding contract with the corporates shall include adherence to provisions of these Rules.
6 Insecticide Act 1968 and Rules 1971
Applicable and the Farmers must source insecticides only from licensed suppliers. Farmers shall be trained on Personal Protective Equipment (PPE) to be used while handling insecticides and mode for disposal of unused insecticides and its containers.
7 Fertilizer Control Order 1985 Applicable since the project will not support procurement of fertilizer from unauthorized vendors to be used for farming.
8 Food Safety and Standards (Food Products Standards and Food Additives) Act 2006 and Rules, 2011 and subsequent amendment
Applicable since the investment will facilitate enhancement in agriculture-based commodities, processing and grading facilities, infrastructures such as market, warehouse, retail etc. Which will develop agri-business and agricultural productivity.
9 Prevention of Cruelty to Animals (Slaughter House) Rules, 2001
Applicable since the project intervention includes slaughter houses, and backyard poultry, the Rule will be applicable, and guidelines of the rule shall be complied.

Mott MacDonald |
40
September 2019
S. No Name of relevant Act / Rule Project Applicability
10 The Seeds Act, 1966 Applicable since the project will support only procurement of certified seeds and truthfully levelled seeds. The Act will be also applicable in case where mass procurement and distribution of seed is done through Producer Groups
Source: MM secondary review
3.2 State Environmental Laws and Regulations
The list of state regulations with respect to environment and its applicability is as indicated in the table
below.
Table 3: Applicable State Environment Rules and Regulations
S. No Name of relevant Act / Rule Project Applicability
1 Maharashtra Water Policy 2003 The Policy guidelines shall be followed by promoting water conservation measures in the agriculture value chain
2 Maharashtra Management of Irrigation System by Farmers Act 2005 and Rules thereunder
The guidelines of the Act shall be followed by promoting water conservation measures during farming and efficient use of irrigation water.
3 Maharashtra Water Resource Regulatory Authority Act 2005
The guidelines of the Act on sustainable and efficient use of water shall be followed by promoting efficient and sustainable use of water during farming as well as in the value chain.
4 Maharashtra Ground Water (Development and Management) Rules
The Project shall ensure that the Act is complied with and necessary permission / approvals are obtained by the Project beneficiaries
5 Maharashtra Biological Diversity Rules, 2008
The Project shall ensure that the Act is complied with and necessary permission / approvals are obtained by the Project beneficiaries
6 Maharashtra Felling of Trees (Regulation) Act, 1964
The provision of the Act shall be complied in case felling of trees are required for any proposed expansion of warehouse or market or FPOs / FPCs.
7 Maharashtra Agricultural Produce Marketing (Development and Regulation) Act, 1963
The provisions of the Act shall be complied as the intervention includes Markets.
8 Maharashtra Air (Prevention and Control of Pollution) Rules, 1983
The Rule shall be applicable since any expansion or modification which is likely to add emission to air environment shall require prior consent from the MPCB.
9 Maharashtra Water (Prevention and Control of Pollution) Rules, 1983
The Rule shall be applicable since any expansion or modification which is likely to add wastewater into the environment shall require prior consent from the MPCB
10 Maharashtra Pollution Control Board on Poultry and Cattle (Goat) Sheds
The Project intervention includes slaughter houses and hence the guidelines of the circular shall be complied by the slaughterhouse proposed to be benefited by the Project.
Source: MM secondary review
3.3 Relevant Central and State Government Schemes and Programs on
Environment
Centre and the State Governments have been implementing several schemes / programmes under Central
Schemes, Centrally Sponsored Schemes and State Schemes, that are relevant to the project and can be
leveraged in SMART project. Some of these schemes and their salient features are discussed below:
Table 4: Relevant central and State Government Schemes and Programs on environment
Name of scheme / program Key features
Pradhan Mantri Krishi Sinchayee Yojana
The scheme provides for expansion of cultivable area under assured irrigation, increase water use efficiency and adoption of precision irrigation.
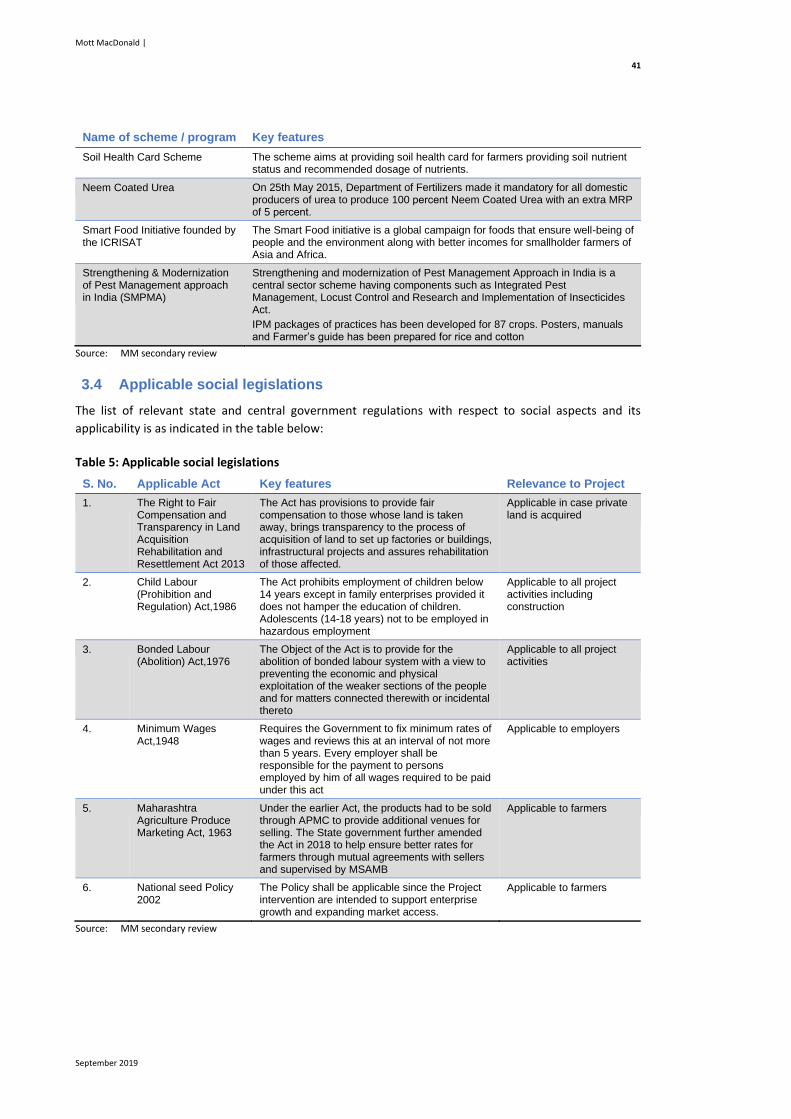
Mott MacDonald |
41
September 2019
Name of scheme / program Key features
Soil Health Card Scheme The scheme aims at providing soil health card for farmers providing soil nutrient status and recommended dosage of nutrients.
Neem Coated Urea On 25th May 2015, Department of Fertilizers made it mandatory for all domestic producers of urea to produce 100 percent Neem Coated Urea with an extra MRP of 5 percent.
Smart Food Initiative founded by the ICRISAT
The Smart Food initiative is a global campaign for foods that ensure well-being of people and the environment along with better incomes for smallholder farmers of Asia and Africa.
Strengthening & Modernization of Pest Management approach in India (SMPMA)
Strengthening and modernization of Pest Management Approach in India is a central sector scheme having components such as Integrated Pest Management, Locust Control and Research and Implementation of Insecticides Act.
IPM packages of practices has been developed for 87 crops. Posters, manuals and Farmer’s guide has been prepared for rice and cotton
Source: MM secondary review
3.4 Applicable social legislations
The list of relevant state and central government regulations with respect to social aspects and its
applicability is as indicated in the table below:
Table 5: Applicable social legislations
S. No. Applicable Act Key features Relevance to Project
1. The Right to Fair Compensation and Transparency in Land Acquisition Rehabilitation and Resettlement Act 2013
The Act has provisions to provide fair compensation to those whose land is taken away, brings transparency to the process of acquisition of land to set up factories or buildings, infrastructural projects and assures rehabilitation of those affected.
Applicable in case private land is acquired
2. Child Labour (Prohibition and Regulation) Act,1986
The Act prohibits employment of children below 14 years except in family enterprises provided it does not hamper the education of children. Adolescents (14-18 years) not to be employed in hazardous employment
Applicable to all project activities including construction
3. Bonded Labour (Abolition) Act,1976
The Object of the Act is to provide for the abolition of bonded labour system with a view to preventing the economic and physical exploitation of the weaker sections of the people and for matters connected therewith or incidental thereto
Applicable to all project activities
4. Minimum Wages Act,1948
Requires the Government to fix minimum rates of wages and reviews this at an interval of not more than 5 years. Every employer shall be responsible for the payment to persons employed by him of all wages required to be paid under this act
Applicable to employers
5. Maharashtra Agriculture Produce Marketing Act, 1963
Under the earlier Act, the products had to be sold through APMC to provide additional venues for selling. The State government further amended the Act in 2018 to help ensure better rates for farmers through mutual agreements with sellers and supervised by MSAMB
Applicable to farmers
6. National seed Policy 2002
The Policy shall be applicable since the Project intervention are intended to support enterprise growth and expanding market access.
Applicable to farmers
Source: MM secondary review

Mott MacDonald |
42
September 2019
3.5 Relevant Central and State Government Social Schemes and Programs
A list of relevant social welfare schemes and their salient features are discussed below.
Table 6: Relevant central and State Government Schemes and Programs
S. No. Name of scheme / program Key features
1 National Policy for Farmers 2007 Policy includes strategy of doubling farmers’ income by 2022 with special focus on efficient irrigation system, quality seed, soil health, food chain value addition, crop insurance and ancillary activities.
2 Pradhan Mantri Fasal Bima Yojana
Scheme provides for reducing farmer distress by providing crop insurance for food crops, oil seeds and annual commercial and horticulture crops in the event of failure of any notified crop because of natural calamities, pests and diseases
3 Paramparagat Krishi Vikas Yojana
The scheme targets to form 10,000 clusters of 20 Ha each and bring nearly two lakh hectares of agriculture area under organic farming by 2017-18
4 National Mission on Agricultural Extension and Technology under ATMA
Agricultural Technology Management Agency (ATMA) set up at district level is responsible to ensure delivery of extension services to farmers and looking after implementation of the scheme. The purpose of this mission is to reform and strengthen the agricultural extension to enable delivery of appropriate technology and improved agronomic practices to the farmers. It includes sub-missions on Agriculture Extension, Seed and Planting Material, Agricultural Mechanisation and Plant Protection.
5 e-National Agriculture Market
(e-NAM)
e-NAM is a pan India electronic trading portal developed under the National Agriculture Market scheme. States are required to carry out pre-requisite reforms to enable a single license to be valid across the state, single point levy of market fee and provision for electronic auction as a mode of price discovery
6 Integrated Scheme for Agriculture Marketing (ISAM)
The scheme provides for promotion of Agri-marketing through creation of marketing and agribusiness infrastructure including storage.
7 Mission for Integrated Development
of Horticulture (MIDH)
MIDH is a centrally sponsored scheme for the holistic growth of horticulture sector covering fruits, vegetables, root and tuber crop, mushroom, spices, flowers, aromatic plants, coconuts, cocoa and bamboo by research, technology promotion, extension, post harvesting management, processing and marketing.
8 Agri Udaan scheme The Central Government has launched Agri Udaan Food and Agribusiness Accelerator 2.0 to promote innovation and entrepreneurship in agriculture. Accelerators are 4 – 8 months program aiming at scaling up innovative start-ups with a working prototype and initial market traction. This is done through education, mentorship, and financing. Start-ups enter accelerators for a fixed-period of time, and as part of a cohort. The cohort is shortlisted by evaluation panel comprising of industry veterans, business experts, R&D scientists. Four distinct factors that make accelerators unique are fixed term, cohort based, mentorship driven, and they culminate into demo day.
9 Minimum Support Price Scheme To make the agricultural activity viable as well as to protect the farmers’ economy from natural calamities and low prices offered by traders, Government of India declares Minimum Support Prices (MSP) for selected crops. Under the scheme, procurement in the State is undertaken by Maharashtra State Co-operative Marketing Federation, Maharashtra State Co-operative Tribal Development Corporation, National Agricultural Co-operative Marketing Federation and Maharashtra State Co-operative Cotton Growers Federation
10 Sub-mission on seed and planting material
The scheme is being implemented in the State from 2014-15 through Maharashtra State Seeds Corporation, to get the quality/certified seeds at affordable prices and increase production. Under the scheme, 50 percent assistance is provided for cereal crops and 60 percent assistance is provided for pulses & oilseeds crop for one-acre area per farmer for distribution of certified seeds.
Source: MM secondary review

Mott MacDonald |
43
September 2019
3.6 Applicable Acts in India for protection of women’s rights
The legal provisions to uphold the rights of women as mandated by the constitution of India is discussed
under this section. The main applicable Acts that have special provisions for the safeguarding of women’s
interests have been presented in table below:
Table 7: Legal Provisions for Safeguard of Women
S. No. Applicable Act Key features Relevance to Project
1. Maternity Benefit (Amendment) Act,2017
● Twenty-six weeks of paid maternity leave for mothers; for adoptive mothers 12 weeks of maternity leave from date of adoption
● The enabling provision to ‘work from home’ can be exercised after expiry of 26 weeks leave
● The Act has mandated creche facilities for all establishments employing 50 or more employees; the women employee should be permitted to visit the facility, four times during the day
● The amendment makes it compulsory for the employers to educate women about the maternity benefits at the time of appointment
Applicable to staff working and institutions established under project
2. The Sexual Harassment of Women at Workplace (Prevention, Prohibition and Redressal) Act
● This Act defines sexual harassment at the workplace and creates a mechanism for redress of complaints and applicable to public, private, organized and unorganized sectors.
● The employer is expected to constitute an internal complaint committee with 10 or more employees at every workplace
● The enquiry process under the Act should be confidential and breach of this confidentiality could be penalized for Rs.5000
● The act requires the employer to educate and sensitize employees and develop related policies
● Non-compliance of the provisions of the Act is punishable up to Rs. 50,000
● The district officer is required to constitute a district-wise complaint committee; the committee will complete the inquiry within a time of 90 days
● The internal complaint committee have the power of civil courts for gathering evidence
Applicable to the proposed project interventions in work places such as CBOs, warehouses, food processing industries, retails, construction sites, farming etc. where women will be employed
3. Government Resolution of 1992, Revenue and Forest Department, Amendment to Maharashtra Revenue Act, 1966
● The resolution, popularly known as Laxmi Mukti (emancipation of wealth of women) gives the right to women to register their names along with men on the property ownership 7/12 record subject to the conditions:
● ‘owner’ must be the legally wedded husband of the woman who will be a co-owner
● the wife be legally wedded to the owner of the land who is her husband
Applicable to all beneficiaries under the project
4. Equal Remuneration Act,1976
It is the duty of an employer to pay equal remuneration to men and women workers for same work or work of a similar nature.
Women engaged for project supported activities should be paid on par with men
Source: MM secondary review

Mott MacDonald |
44
September 2019
The remaining list of legislations and programs as outlined above are in Appendix C.
3.7 Government of India Schemes
A compilation of various central government schemes implemented by the respective departments on
empowerment, social security, skill development, income generation, agriculture is provided in the
following:
Table 8: Government of India Schemes and Programs for Welfare of Women
S. No. Department / Ministry
Schemes / programs
1. Women and Child Development
Pradhan Mantri Mahila Shakti Kendra for empowerment of rural women
National Creche scheme with day care facilities to children aged six months to six years for employed women
Rastriya Mahila Kosh (RMK) for providing micro credit to women for income generation
Working women’s hostels
One stop centres and Women Helpline for facilitating access to services on medical aid, police, legal and psychosocial counselling and temporary support service for women affected by violence
Gender Budgeting for strengthening institutional mechanisms and training stakeholders on mainstream gender concerns
2. Agriculture Agricultural Technology Management Agency (ATMA) aims at operationalizing extension reforms for farmers; gender budgeting enunciates that at least 30 percent of the resources are utilized for women farmers
3. Rural Development National Rural Livelihood Mission (NRLM) – program covers empowering women through Self Help Group (SHG) development across the country. The scheme aided by World Bank provides access to loans for women at lower interest rates
Deen Dayal Upadhyaya Grameen Kaushalya Yojana (DDU-GKY) – a part of NRLM, the scheme caters youth who are in 15-35 age group to enhance employability through skill training
4. Ministry of Tribal Affairs
● Institutional Support for Development and Marketing of
Tribal Products / Produce – the activities to be carried out
under the scheme are marketing support, supply chain
infrastructure development and research and development
on promoting innovations and technologies. The scheme
involves networking with the Department of Agriculture. The
State departments who would implement the program are
State Tribal Development Cooperative Corporation, State
Forest Development Corporation and Minor Forest Produce
(trading and development) federations
● Revision of Minimum Support Price (MSP) for Minor Forest
Produce (MFP) - At the State level, Tribal Development

Mott MacDonald |
45
September 2019
S. No. Department / Ministry
Schemes / programs
Department, Government of Maharashtra is implementing
the program
● Introduction of new MFP items into the Centrally Sponsored
Scheme titled, ‘Mechanism for Marketing of Minor Forest
Produce (MFP) through Minimum Support Price (MSP) and
development of Value Chain of MFP’ – linkage with existing
warehouses is the key focus of the program; the
Maharashtra State Cooperative Tribal Development
Corporation (Nasik) and forest department are involved in
implementation of the program
5. Ministry of Minority Affairs
Nai Roshni – providing knowledge, tools and techniques for interacting with government systems, banks and other institutions
Source: MM secondary review
3.8 Applicable World Bank Safeguard Policies
The Project has been reviewed with respect to the World Bank’s operational policies to help assess the
possible environmental risks and impacts associated with development intervention proposed for
agriculture and animal husbandry. WB safeguards help in defining measures and the processes to
effectively manage risks and enhance positive impacts. The process of applying safeguard policies can be
an important opportunity for stakeholders’ engagement, enhancing the quality of project proposals and
increasing ownership. WB’s operational policies applicable to the Project are as indicated in the table
below.
Table 9: Applicable World Bank Safeguard Policy
Policy Applicability
OP 4.01 – Environmental Assessment
Applicable
EIA and EMP is required prior to construction of facilities. Construction Management Guideline has been prepared as part of the report which includes EMP to be complied by the Contractor responsible for construction activity.
OP 4.03 – Performance Standards for Private Sector Activities
Not Applicable
No activity in this project is designed, constructed, operated and/or owned by private entity hence the private entity is not responsible for identifying and assessing the environmental risks in this project.
OP 4.04 – Natural Habitat
Not Applicable
The Project is not investing in any activity that will result in degradation or conversion of critical habitat and not investing in activities inside protected areas. Further the Project is not supporting any activity that deals with produce sourced from forest.
OP 4.09 – Pest Management
Applicable
The project will not support use of pesticides banned by the WHO and Indian regulations. A Pest Management Plan has been developed and included in the report.
OP 4.10 – Indigenous People Development Plan
Applicable
Due Diligence as per ESMF and world bank policy needs to be conducted to avoid impact on indigenous people in 13 districts notified as tribal districts by the government

Mott MacDonald |
46
September 2019
Policy Applicability
OP 4.12 – Involuntary Resettlement
Applicable
Due diligence as per ESMF and world bank policy needs to be conducted to avoid any impact related to involuntary resettlement before taking possession of land or assets whether it is government or private in nature.
This is also irrespective of whether the possession is taken on lease, temporary, permanent or complete acquisition.
Source: MM Analysis
3.9 Negative List of Activities
Based on the review of relevant regulations of GOI, GOM and policies of World Bank, a list of negative
activities that will not be supported under SMART Project is indicated below.
Table 10: Negative List of Activities
Intervention Stage Activities Not to be Supported
Primary Production ● Use of pesticides banned by GOI, pesticides listed in Class Ia, Ib, Class II WHO.
● Use of pesticides from sources not licensed for the same.
● Use of uncertified seeds or non-Truthfully Labelled seeds.
● Burning of crop residue
● Use of high energy consuming processing equipment like polluting DG sets, outdated tractors, outdated harvesters, outdated reefer van etc.
Back yard poultry and rearing of Goat and Sheep
● Open grazing of Goat or Chicken Birds in the forest areas is prohibited completely.
● Allowing non- vaccinated animals or diseased /ill animals to enter and range freely in the forest areas.
Market / Retail / Slaughter House
● Activities involving unsanitary disposal of solid waste generated in the market.
● Markets without proper drainage facility.
● Operating Slaughter house without abattoir waste and ETP facility.
Forest Protection
● Diversion of Forest Land to the purpose of the project is completely prohibited.
● Extraction, transportation, processing and sale of forest produces, or any commodity selected under SMART and produced in forest land shall be completely prohibited.
Others ● Release of genetically altered organisms into the natural environment,
● Radioactive products
● Tobacco, unmanufactured or manufactured
● Tobacco processing machinery
Source: MM Analysis

Mott MacDonald |
47
September 2019
4 Social and Environmental Baseline
Agriculture and allied activities sector contribute to overall growth by generating requisite inputs. The
share of this sector in the total Gross State Value Added (GSVA) is declining over the period resulting in
cascading impact on other sectors like Agri-processing industries, trade, hotels and restaurants. Although
the State is one of the most industrialised states in the country, agriculture and allied activities sector is
still predominant in the State with economy thus being primarily agrarian, and about 55 percent of the
population relying for livelihood. Dependency on weather conditions, increasing number of marginal and
small farmers and reduction in the area of operational holdings, high expenses leading to non-profitability
and market uncertainty continues to be the prime concerns plaguing the sector in the State.
This section profiles the socio-economic and environmental baseline within which the SMART is to be
implemented. The baseline captures key trends and implications of social indicators in the context of the
agricultural sector in transition. These indicators and implications need to be seen in the context of:
● Inherent limitation of sampling and the sample size, which though statistically significant, is limited to
nine districts, and partially dependent on secondary data;
● Increasing commodity prices during the survey creating a possible bias in the feedback received from
stakeholders. The baseline has been divided into social and environmental sections. While some of
the issues have specifically been covered under the separate sections, other issues may have
implications for both the social and environmental baseline.
4.1 Socio-economic baseline and context
This section discusses the socio-economic baseline that is currently prevailing across state’s agro-pastoral
landscapes. The issues discussed are based on analysis of the secondary data in addition to the household
data and village-level information for all the 382 villages (52 talukas) as well as anecdotal evidence and
primary consultations with key stakeholders within the institutional set-up and the CBO structure. All the
social implications for the SMART are discussed wherever relevant.
4.1.1 Demographic Profile
The parameters covered under demographic profile were, total population disaggregated into urban-
rural, males-females, average household sizes, population density and growth in population. The data
reveals that the State contributes, 9.28 percent of the total national population with an average
household size of 4.6 against the national average of 4.9. The rural population is pre-dominant (69
percent) over urban population at the national level but in Maharashtra, rural population, is
comparatively lower at 55 percent.
Male population is slightly higher than female population. The population density is lower in Maharashtra
at 365 persons per sq.km as compared to the national average of 382 persons per sq.km. and within
Maharashtra, it is the lowest in rural areas.
The demographic data, comparing Maharashtra with National level across key indicators is presented in
the table below:

Mott MacDonald |
48
September 2019
Table 11: Demographic Profile at State and National level
S. No. Indicators India Maharashtra Rural Maharashtra
1. Population (in crores) 121.08 11.2 6.15
2. Average household size 4.9 4.6 4.5
3. Urban population (in crores / percent to total population)
37.7 (31 percent)
5.08 (45 percent)
5.08 (45 percent)
4. Rural population (in crores / percent to total population)
83.3 (69 percent)
6.15 (55 percent)
6.15 (55 percent)
5. Percent of males to total population 51.47 51.83 51.23
6. Percent of females to total population 48.53 48.17 48.76
7. Population density (persons / sq.km) 382 365 211*
8. Decadal growth (in percent) 17.64 16.0 10.36 percent
9. Transgender Population in numbers 487,803 40,891 Not available
Source: Primary Census Abstract, 2011; NSS Report No.554, Employment and Unemployment Situation in India 2011-12 * Note: Data available in 31 out of 33 districts only
Among the districts in Maharashtra, major contributors to population are the districts of Thane (9.84
percent), Pune (8.39 percent) and Mumbai suburban (8.33 percent).
The population density is highest in Mumbai suburban (20,980 persons per sq.km), Mumbai (19,652
persons per sq.km) and Thane (1157 persons per sq.km). The district with lower density Chandrapur (193
persons per sq.km).
Regarding rural and urban population distribution, it is noteworthy that the rural population is highest in
the districts of Gadchiroli (88.9 percent), Sindhudurg (87.4 percent) and Hingoli (84.2 percent). Since the
project focus will be on the rural population, the district-wise data on all the above parameters including
rural population as provided in Appendix D could be utilized to prioritize the focus areas for intervention.
1.3.1.3 Relevant social baseline primary data
The total population covered by the household survey of 4811 households is 22133. The representatives
of the households that were engaged for the study were heads of households in 29 percent, and more
than 70 percent women in most of the cases. The highest proportion of female respondents were
observed in the Hingoli district (6188 respondents), followed by Satara (4489) and Yavatmal (3544). In
terms of the characteristics of households, among the 4426 households surveyed, the average household
size is 4.6, which is close to national average size of 4.45. Majority (65-70 percent) of the members from
each household were in the productive age group of 20-60 years. Women-headed households (WHH), a
key indicator of vulnerability, constituted 7 percent of the sample size. The detailed sample size coverage
is as follows:
Table 12: Sample size coverage
District Number of Villages Number of Farmers
Male Female
Hingoli 60 46 6188
Hingoli
25 401 137 Parbhani
Nanded
Sangli 37 629 4489

Mott MacDonald |
49
September 2019
District Number of Villages Number of Farmers
Male Female
Satara
Yavatmal 20 0 3544
Latur 154 3356 663
Ahmednagar 59 1191 568
Aurangabad 27 815 106
Total 382 6438 15695
Source: Productive Partnership data of the field survey
4.1.2 Social Profile
Parameters covered under social profile are sex ratio, literacy rates and composition of SC and ST
population in the total population. It is alarming that the State has a lower sex ratio (number of females
per thousand males’) of 929 against the national average of 943.
Literacy rates are far higher at 82.30 percent against the national literacy rate of 63.06 percent; similar is
the case of female literacy rate wherein it is 75.9 percent in Maharashtra and 55.97 percent in India. The
female literacy levels are comparatively lower to male literacy rate of 88.4 percent at the State level and
lower in rural areas.
While SC population is lower in the state than at national level, ST population is slightly higher than at the
national level, especially in rural areas. A comparative presentation of the state profile across selected
indicators is presented in the following table:
Table 13: Social Profile at State and National level
S. No Indicator India Maharashtra Rural Maharashtra
1. Sex ratio 962 929 959
2. Literacy rate ( percent to total population) 63.06 82.30 77.00
3. Literacy rate among female population ( percent to total female population)
55.97 75.90 64.80
4. Literacy rate among male population ( percent to total male population)
69.76 88.40 85.15
5. SC population (in percent to total population) 16.63 11.81 12.17
6. ST population (in percent to total population) 8.61 9.35 14.63
Source: Primary Census Abstract, 2011
Within the districts, those with lower sex ratio are Mumbai (832), Mumbai suburban (860) and Thane
(886); and districts with higher sex ratio are Ratnagiri (1122), Sindhudurg (1036) and Gondia (999).
Literacy rates are highest in the districts of Mumbai suburban (89.91 percent), Mumbai (89.2 percent) and
Nagpur (88.39 percent). Female literacy rates are the lowest in the districts of Nandurbar (56.47 percent),
Jalna (60.95 percent) and Parbhani (63.63 percent)
SC population composition in total population is higher in rural Maharashtra and highest in the districts
of Akola (20.07 percent), Washim (19.17 percent) and Nanded (19.07 percent).
ST population composition in total population is highest in the districts of Nandurbar (69.28 percent),
Gadhchiroli (38.71 percent), Dhule (31.56 percent) and Nashik (25.62 percent). The detailed district-wise
findings are in Appendix D.

Mott MacDonald |
50
September 2019
1.3.1.4 Relevant social baseline primary data
The primary survey findings on related parameters are presented in the following. The table below
illustrates the caste profile of the study sample and indicates that most of the households are from the
General Castes.
Table 14: Caste Composition of Samples covered
Caste Number of Households Proportion in the Sample
General/Others 2358 49 percent
Other Backward Castes 836 17 percent
Scheduled Castes 922 19 percent
Scheduled Tribes 296 6 percent
Nomadic Tribe (primitive tribal) 397 8 percent
Source: Productive Partnership data of the field survey
4.1.3 Occupational Profile
As per the Maharashtra Human Development Report, 2012, the State has fared consistently well in terms
of economic growth. The State has the largest per capita net (PCN) and State Domestic Product (SDP) in
the country. The growth in the State has been urban centric and non-agricultural, having visible pockets
of urban affluence with shades of poverty and a continuing inflow of migrants. The primary sector has
continued to be the major source of livelihood in terms of employment despite its falling share in output,
while the secondary and tertiary sectors have shown uneven growth performances. Weakness of the state
has been uneven distribution of gains from economic growth with inter-district disparities in growth
performances.
This becomes evident in assessment of parameters of workforce participation rate (WPR), main and male
workers among working population, workforce in primary sector and population below poverty line in
rural and urban areas. Overall, data shows that WPR is higher at 43.99 as compared to the national WPR
of 39.8. Main workers constitute persons who have worked for six months or more during the last one
year preceding the date of enumeration in any economically productive activity. It is noteworthy, that
main workers comprise 89.8 percent of the working population and males constitute 56 percent of the
working population.
Cultivators / farmers and agricultural labourers have been combined, as workers in primary sector for this
analysis. Thus, primary sector workers constitute more than 60 percent of the workforce in all the districts
except in urban districts such as Mumbai, Mumbai suburban, Nagpur, Thane and Pune.
The population below poverty line is lower (17.35 percent) as against the national data of 21.92 percent.
It is noteworthy that the BPL population in urban areas is much lower at 9.12 percent than that of rural
population at 24.22 percent. A comparative profile of the state compared against national level is
presented in table below:
Table 15: Economic profile at State and National levels
S. No. Indicators India Maharashtra
1. Workforce participation rate ( percent to total population) 39.8 43.99
2. Main Workers to total population ( percent to total working population) 75.2 89.8
3. Male Workers to total population ( percent to total working population) 68.9 56
4 Female Workers to total population ( percent to total working population)
25.6 34.1

Mott MacDonald |
51
September 2019
S. No. Indicators India Maharashtra
5. Workforce in primary sector ( percent to total working population) 54.6 52.7
6. Work participation rate among transgenders 34 38
7. Population below poverty line ( percent to total population) 21.92 17.35
8. Rural Population below poverty line ( percent to total population) 25.7 24.22
9. Urban Population below poverty line ( percent to total population) 13.7 9.12
Source: Primary Census Abstract, 2011, Planning Commission 2011-12 and Maharashtra Human Development Report 2012
Lower worker participation rates were observed in Mumbai suburban (39.92), Nagpur (40.15) and
Mumbai (39.63); higher WPR were observed in Gadchiroli (54.45), Gondiya (50.31) and Bhandara (49.76).
The detailed district-wise data are presented in Appendix D.
It is discouraging to note that female workforce participation rate in rural Maharashtra which was higher
until 2001 has declined in the 2011 census data. The distribution of female WPR until 2001 is presented
below:
Table 16: Women workforce participation rates – time series data
Years India Maharashtra
1961 31.39 46.74
1971 13.26 24.39
1981 23.18 40.85
1991 26.67 46.05
2001 24.8 42.52
Source http://www.indusedu.org/pdfs/IJRMEC/IJRMEC_908_30489.pdf
1.3.1.5 Poverty levels
Poverty levels have been assessed based on composition of people living below the poverty line (BPL).
The Planning Commission of India has estimated the percent of BPL population in 2011-12 at the national
level is 21.9 percent. The corresponding estimate for Maharashtra is 17.4 percent which is marginally
lower but there is a huge disparity in terms of poverty in rural areas and poverty among urban and rural
population. This is also affirmed by the census 2011 secondary data enlisted.
From the primary survey it is observed that among the marginal farmers ST and women households
covered had BPL ration card. Similarly, the households with BPL ration cards were higher among small
farmers too. Households with monthly income lower than INR 5000 were observed among small and
marginal farmers only; similarly, households with monthly incomes between INR 5000 – 10000 were
prevalent among small, marginal and semi-medium farmers only.
4.1.4 Operational holdings
The analysis of the socio-economic baseline has attempted to understand the significance of influence of
landholdings and landownership on several aspects of the agriculture sector, such as agriculture-based
income, participation, ownership of land among women etc. The respondents /households have been
categorized as per the agricultural census and is based on just the operational land holding size:
• Marginal farmers with less than 1 Ha of land

Mott MacDonald |
52
September 2019
• Small farmers with 1 to 2 Ha of land
• Semi-medium farmers with 2 to 4 Ha of land
• Medium farmers with 4 to 10 Ha of land
• Large farmers with over 10 Ha of land
1.3.1.6 Size of Landholding
The data from agricultural census 2015-16 reveals that in a total of 146 million operational holdings in the
country, the third highest number of operational holders belonged to Maharashtra at 14.71 million. The
landholding pattern in Maharashtra shows that more than half (51.39 percent) of the farmers have
marginal landholdings, followed by 29.33 percent of the farmers with small landholdings and 14.39
percent and 4.47 percent with semi-medium and medium landholdings respectively. Only 0.41 percent of
the farmers have large landholdings. The same pattern of landholdings can be observed at the national
level too. The detailed findings are in table below:
Table 17: Percentage of Operational Holdings by size for all social groups
S. No. Size India Maharashtra
1. Marginal (below 1.00 Ha) 68.52 51.39
2. Small (1.00 - 2.00 Ha) 17.69 29.33
3. Semi-medium (2.00 – 4.00 Ha) 9.45 14.39
4. Medium (4.00 – 10 Ha) 3.76 4.47
5. Large (10.00 Ha and above) 0.57 0.41
Source: Agricultural census, 2015 – 16
Though the data for the sample size is not available, however, as per the economic census (2015-16),
number of operational holdings and area of operational holdings in the state was reported at 1.53 crore
and 2.05 crore Ha as against 0.50 crores and 2.12 crore Ha respectively, as compared to the first
Agriculture Census (1970-71). Over this period, the average size of holding decreased from 4.28 Ha to 1.34
Ha The operational holdings and area of operational holdings in the State as per the Agriculture Census
2015-16 is given in table below. The average size of holding for SC and ST was 1.24 Ha and 1.76 Ha
respectively. The share of female operational holders was 14.07 percent with 1.22 Ha of average size of
holding:
Table 18: Operational holdings and area in Maharashtra
Size lass (ha) No. of operational holdings ('000) Area of operational holdings ('000 Ha)
2010-11 2015-16* 2010-11 2015-16*
Marginal (up to 1.0) 6,709 7,816 3,186 3,449
Small (1.0 - 2.0) 4,052 4,339 5,739 5,771
Semi-Medium (2.0 - 4.0) 2,159 2,327 5,765 6,025
Medium (4.0 - 10.0) 711 734 3,993 4,099
Large (10.0 and above) 68 69 1,084 1,162
Total 13,699 15,285 19,767 20,506
Source: Commissionerate of Agriculture, GoM * Provisional
The time series data on number of operational holdings and area of operational holding for the state is
given in figures below:

Mott MacDonald |
53
September 2019
Figure 4: Operational holdings and area in Maharashtra
Source: Commissionerate of Agriculture, GoM * Provisional
1.3.1.7 Relevant social baseline primary data
It should be noted that this analysis also considers
landless households (15 percent), and details of
women with legal land ownership (9 percent). For
the sake of simplicity and convenience, the analysis
has included marginal and small farmers together.
The figure below provides an illustrative break-up of
the proportion of each of these categories in the
sample and indicates that most of the respondent
households (50 percent) comprise of marginal and
small farmers owning up to two hectares of land or
less:
Profile of the Agricultural Farmers
More than 95 percent farmers are involved in
agricultural activities, with nearly 50 percent farmers from the marginal farmers, with up to 1 Ha of land.
The numbers for the disadvantaged groups in the study area were 19 percent (SC) and 6 percent (ST).
The study also covered nomadic tribes (primitive tribal groups), which constituted around 8 percent.
4.1.5 Land-Use
Land-use has important implications for agriculture development within India and state where traditional
“crop-livestock mixed farming” is sustained with local inputs. The anthropogenic pressures on land-use in
the state, in terms of its rate and intensity are evident in the changing patterns provided in table below
especially for forest land as well as net sown area.
50%28%
5%17%
C la s s i f i ca t io n o f fa rm ers b a s ed o n la n d h o ld in g f ro m p r im a ry s u rv ey
Small & Medium Medium Big landless
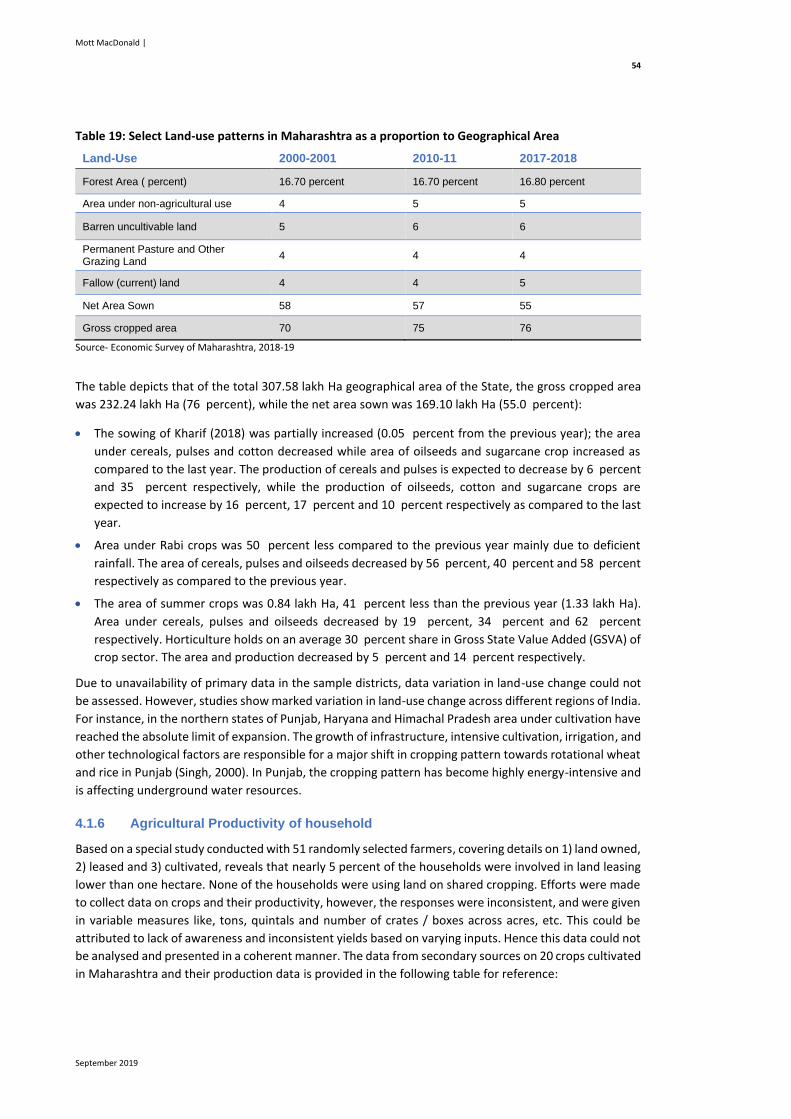
Mott MacDonald |
54
September 2019
Table 19: Select Land-use patterns in Maharashtra as a proportion to Geographical Area
Land-Use 2000-2001 2010-11 2017-2018
Forest Area ( percent) 16.70 percent 16.70 percent 16.80 percent
Area under non-agricultural use 4 5 5
Barren uncultivable land 5 6 6
Permanent Pasture and Other Grazing Land
4 4 4
Fallow (current) land 4 4 5
Net Area Sown 58 57 55
Gross cropped area 70 75 76
Source- Economic Survey of Maharashtra, 2018-19
The table depicts that of the total 307.58 lakh Ha geographical area of the State, the gross cropped area
was 232.24 lakh Ha (76 percent), while the net area sown was 169.10 lakh Ha (55.0 percent):
• The sowing of Kharif (2018) was partially increased (0.05 percent from the previous year); the area
under cereals, pulses and cotton decreased while area of oilseeds and sugarcane crop increased as
compared to the last year. The production of cereals and pulses is expected to decrease by 6 percent
and 35 percent respectively, while the production of oilseeds, cotton and sugarcane crops are
expected to increase by 16 percent, 17 percent and 10 percent respectively as compared to the last
year.
• Area under Rabi crops was 50 percent less compared to the previous year mainly due to deficient
rainfall. The area of cereals, pulses and oilseeds decreased by 56 percent, 40 percent and 58 percent
respectively as compared to the previous year.
• The area of summer crops was 0.84 lakh Ha, 41 percent less than the previous year (1.33 lakh Ha).
Area under cereals, pulses and oilseeds decreased by 19 percent, 34 percent and 62 percent
respectively. Horticulture holds on an average 30 percent share in Gross State Value Added (GSVA) of
crop sector. The area and production decreased by 5 percent and 14 percent respectively.
Due to unavailability of primary data in the sample districts, data variation in land-use change could not
be assessed. However, studies show marked variation in land-use change across different regions of India.
For instance, in the northern states of Punjab, Haryana and Himachal Pradesh area under cultivation have
reached the absolute limit of expansion. The growth of infrastructure, intensive cultivation, irrigation, and
other technological factors are responsible for a major shift in cropping pattern towards rotational wheat
and rice in Punjab (Singh, 2000). In Punjab, the cropping pattern has become highly energy-intensive and
is affecting underground water resources.
4.1.6 Agricultural Productivity of household
Based on a special study conducted with 51 randomly selected farmers, covering details on 1) land owned,
2) leased and 3) cultivated, reveals that nearly 5 percent of the households were involved in land leasing
lower than one hectare. None of the households were using land on shared cropping. Efforts were made
to collect data on crops and their productivity, however, the responses were inconsistent, and were given
in variable measures like, tons, quintals and number of crates / boxes across acres, etc. This could be
attributed to lack of awareness and inconsistent yields based on varying inputs. Hence this data could not
be analysed and presented in a coherent manner. The data from secondary sources on 20 crops cultivated
in Maharashtra and their production data is provided in the following table for reference:

Mott MacDonald |
55
September 2019
Table 20: Crop / commodity production data in Maharashtra
Crop / commodity
Area in (‘000 Ha)
Production (‘000 MT)
Year Farmers sale price (avg.)
Consumers purchase price or Retailer's sale price (avg.)
Bajra 1,035 1,126 2010-11 Rs.15.2 per kg Rs. 21.22 per kg
Banana 82 3600 2011-12 Rs.439.8 per quintal
Cashew 184.20 224.64 2012-13 Rs. 46,550 per quintal
Rs.578.71 per kg
Cotton 41.46 74 lakh bales (yield 303 kg / Ha)
2012-13 Rs.45 per kg Rs.61.62 per kg
Flower - marigold 18.90 104.00 - - -
Goat 3531 (‘000 numbers)
273 (goat milk)
2010-11 - -
Chickpea (bengal-gram)
1,423 1,300 2010-11 - -
Grapes 86.0 774.0 2010-11 Rs.43 per kg Rs.65.17 per kg
Guava 37 322 2011-12 Rs. 13.4 per kg Rs. 22.10 per kg
Sorghum (Jowar) 4.05 2.67 2011-12 Rs.15.2 per kg Rs.21.22 per kg
Maize 868 2,518 2010-11 Rs.13.1 per kg Rs.19.82 per kg
Mango 482 503 2011-12 Rs. 5500 per quintal (alphonso)
Rs. 82.46 per kg
Mosambi 99.00 245.00 2012-13 Rs.16.3 per kg Rs.27.34 per kg
Onion 415.00 4905.00 2010-11 Rs.24.50 per kg Rs. 39.53 per kg
Orange 133 443 2012 Rs.19.2 per kg Rs. 32.16 per kg
Paddy (rice) 1,518 2,688 2010-11 Rs.1688.83 per quintal
Pomegranate 82.00 492.0 2010-11 Rs.45 per kg Rs.68.01 per kg
Red chillies 34604 ha 71749 tons 2010-11 Rs.39.5 per kg Rs. 60.21 per kg
Soybean 3010 3969 2011 Rs. 1,871 per quintal
Tomato 52.00 738.00 2010-11 Rs.8.5 per kg Rs. 16.29 per kg
Pigeon pea (Tur) 1,301 976 2010-11 Rs. 41.1 per kg Rs. 56.66 per kg
Turmeric 13,876 ha 66,791 tons 2010-11 Rs.58.5 per kg Rs. 86.52 per kg
Source: Departments of Agriculture, Animal Husbandry, Economics and Statistics, National Horticulture Board, Indian Horticulture Database, Spices Board
4.1.7 Challenges faced in agricultural productivity
Most of the states’ population is dependent on agriculture and allied sector for their livelihood, despite
declining share in the total GSVA (about 12.2 percent during 2016-17 as against 15.3 percent during
2001-02. Reduction in average size of agricultural holdings (from 4.28 Ha to 1.44 Ha), and increase number
of marginal and small farmers, and their dependency on monsoon and weather, are some of the key
reasons put forward for low profitability - a major concern for the State.

Mott MacDonald |
56
September 2019
Figure 5: Time series data on average size of agricultural landholding (ha)
Source: Vision 2030, Planning Department, Government of Maharashtra
Even though, the share of the allied activities in the agriculture and allied sector is comparatively less, its
contribution to rural livelihood is high. The increasing consumption of fruits and vegetables, milk and milk
products, poultry, meat and fish due to economic prosperity and consequent changing lifestyle indicates
substantial potential for growth and should be tapped to for enhancing farmer’s income.
The state’s agricultural sector is dominated by small and marginal farmers, any commodity downturn
significantly impacts them. Further, as agriculture in the State is diversified and relatively integrated with
the global value chains, international prices of commodities like Soybean, Cotton, Sugar (covering 44
percent of the State’s cropped area) strongly influence domestic prices. Commodities with little footprint
outside the country are influenced by in-country trade policies. For instance, over the years, the prices of
Pulses (which cover about 20 percent of the total cropped area in the State) while influenced by domestic
consumption, were affected by the inconsistent trade policies of the Central Government. Thus, periodic
farm distress in sectors linked to domestic and global markets is expected. With broad shifts in the global
prices in commodities such as Pulses, Soybean, Sugar and Milk there are instances of farmers not even
being able to cover their cost of production.
Women farmers face several additional barriers to the transition to high value agriculture and
agribusiness. While ever more numbers of women are joining agriculture, they are less able to transition
than men, and, further, their ownership of agricultural assets has stagnated. Unlike men who in addition
to production, also serve as actors in the upper levels of the value chains, including intermediaries or
village-level traders and processors, wholesalers, retailers, or exporters, women are left out and generally
concentrated at the lower levels of the value chains. This division of labour is mostly a reflection of social
and cultural ethos of the Indian society that discourages women to travel by themselves or even own
agricultural land. An important effect of this is that it curtails access of women to resources and services,
including credit, training, extension, inputs, and trade and marketing networks.
Women do not have collateral to avail loan or opportunities to participate in extension training because
selection of candidates is often based on ownership of land titles or other formal records. Moreover, there
are fewer or no women service providers in extension, credit, input supply, trade or marketing. Despite
the crucial role that women play in harvesting and post-harvest management activities, there is little or
no training in quality control, hygiene, sanitation, and higher - value addition areas targeted at women.
4.28
3.11
2.211.66 1.44
0
1
2
3
4
5
1965 1970 1975 1980 1985 1990 1995 2000 2005 2010 2015
Lan
d s
ize
(Ha)
Year
Avg size of Agriculture land holding (Ha)

Mott MacDonald |
57
September 2019
1.3.1.8 Relevant social baseline primary data
The table below indicates the risks faced by different categories of farmers. Analysis for eight commodities
(turmeric, gram, soybean, tur, chilli, ladyfinger (okra), and goat), is at Appendix E.
From the findings, the vulnerable group in terms of access to storage, lack of forward linkages, market
intelligence, infrastructure is the SC and ST population as they have little / no access to such facilities. The
other most vulnerable group are women headed households among the small and marginal farmers who
lack access to credit facilities as well:
Table 21: Risk matrix
Main challenges
Risk categorisation (Marginal farmers)
Risk categorisation (Small farmers)
SC ST OBC Others WHH SC ST OBC Others WHH
Poor Farm Productivity and Traditional Farming Techniques
H S M M S H H M M S
Lack of storage facility S S H H S H H M M S
Lack of forward linkages (lack of knowledge and access to formalised markets)
S S H H S S S M M S
Lack of market intelligence services for agri. Commodities
S S H H S S S H H S
Lack of infrastructure (primary processing units)
S S H H S S S H H S
Inadequate bank finance due to small landholdings
H H M M S H H M M S
Shortage of labour for farm operations
L L M M L L L H H L
Source: Productive Partnership Data compiled during the Field Survey S=Substantial, H= High, M= Moderate, L=Low
The table below indicates vulnerability of farmers based on their social categories and land holdings. A
small and marginal farmer from the SC/ST category is at Substantial risk, whereas, small and marginal
farmer from the general and OBC category is at high risk.
Figure 6: Vulnerability Assessment
Lan
d C
ate
gory
Marginal / Small / WHH HIGH SUBSTANTIAL
Big Farmer LOW MODERATE
General / OBC SC/ST
Social Category
Source: Productive Partnership Data compiled during the Field Survey

Mott MacDonald | Final Report on Environment and Social Management Framework (ESMF) State of Maharashtra Agri-Business and Rural Transformation (SMART) Project
408004AA01 | 00 | 02 | 27 September 2019
58
4.2 Environment Baseline
This section presents the existing environmental status of the project area based on review of primary
data, stakeholder consultation and secondary information / data specific to the project collected from the
respective departments, literature / journals review and websites.
4.2.1 Topography
Maharashtra is in the north centre of Peninsular India and is spread over a geographic area of 3,07,713
sq.km. The state is located between 150 45’ N to 220 06’ N latitude and 720 36’E to 800 54’ E longitude1.
Maharashtra topography comprises of Western Ghats or Sahyadri hill and Deccan Plateau. Detailed review
of topography is presented in Appendix F.
4.2.2 Geology and Soil
Maharashtra’s geology comprises of Deccan trap, alluvial deposit, Proterozoic rock, Gondwana system
and Lameta and Bagh Beds. Detailed review of geology is presented in Appendix F.
1.3.1.9 Soil
The nutrition management of soil is done though testing of soil and issuing soil health cards to the farmers.
The soil health card testing infrastructure available in State is given in the table below:
Table 22: Soil Health Card Testing Infrastructure in Maharashtra
Item Quantity
● No of government laboratories 31
● Registered laboratories with agriculture department 234
● Total laboratories 255
● Capacity of testing of soil samples by 255 laboratories 22.50 lakhs soil samples per year
Source: Department of Agriculture, Government of Maharashtra, 2019
The status of the soil health cards issued in the State is given below:
Table 23: Status of Soil Health Cards issued till July 2019
Item Quantity
Soil Health card issued in 2015-16 and 2016-17 (First cycle) ● No of cards issued 131.45 lakhs
● No of soil samples tested – 27.22 lakhs
Soil Health card issued in 2017-18 and 2018-19 (Second cycle) ● No of cards issued 130.35 lakhs
● No of soil samples tested 27.94 lakhs
Target of issue of soil health card in year 2019-20 2.08 lakhs samples
Soil samples already taken till July 2019 1.82 lakhs samples (88 percent)
Soil samples already tested till July 2019 1.10 lakhs (32 percent)
No of soil health card already issued by July 2019 00.66 lakhs
Source: Department of Agriculture, Government of Maharashtra, 2019
1 Dr Shelar S K and Dr Madhuri S K; Conservation Strategies of Biodiversity in Maharashtra, India, International Journal of Applied Research 2016;
2(4); 713 -716

Mott MacDonald | Final Report on Environment and Social Management Framework (ESMF) State of Maharashtra Agri-Business and Rural Transformation (SMART) Project
408004AA01 | 00 | 02 | 27 September 2019
59
Soil type in Maharashtra is predominantly black cotton soil. The chemical characteristics of major soil type
in Maharashtra are as indicated in the table below.
Table 24: Maharashtra Soil Chemical Characteristics
Parameters Laterite Soil Medium Black Soil Coastal Saline Soil
pH 5.8 – 6.4 6.9 – 7.2 7.3 – 8.4
EC dS m-1 0.06 – 0.08 0.11 – 0.14 3.0 – 4.2
Organic Carbon percent 0.51 – 1.8 0.46 – 1.29 0.2 – 0.78
Organic Matter percent 0.87 – 3.10 0.79 – 2.22 0.34 – 1.34
CEC C mole (P+) kg-1 28.4 – 31.69 34.4 – 40.86 41.4 – 49.4
Av. Nitrogen kgha-1 273.5 - 311.4 247.8 - 259.4 302.3 - 312.4
Av. P2O5 kgha-1 9.0 – 9.8 15.6 – 18.4 16.5 – 23.4
Av. K2O kgha-1 229.8 - 249.3 260.4 - 282.5 972.0 - 982.6
Zn mg kg-1 2.90 - 3.60 2.40 - 3.51 3.10 - 3.25
Cu mg kg-1 3.20 - 4.46 2.91 - 3.56 3.80 - 5.87
Mn mg kg-1 32.6 - 47.9 25.1 - 31.6 22.6 - 29.1
Fe mg kg-1 48.3 - 49.4 21.4 - 25.8 23.8 - 29.2
Source: Distribution of nutrients in Different soil types in Maharashtra, International Journal of Chemical studies, IJCS 2018 pp 275 - 279
1.3.1.10 Soil Moisture
The soil moisture map of Maharashtra as on June 2017 is indicated in the Figure below. The map indicates
that during summer almost 75 percent of the state has very dry to dry soil moisture.

Mott MacDonald | Final Report on Environment and Social Management Framework (ESMF) State of Maharashtra Agri-Business and Rural Transformation (SMART) Project
408004AA01 | 00 | 02 | 27 September 2019
60
Figure 7: Maharashtra Soil Moisture Map
Source: AAPAH Innovations
Soil moisture in the month of August 2017 is indicated in Appendix F.
4.2.3 Area under INDGAP
GAP is a certification of good agricultural practices by Quality Council of India (QCI). The
commodity wise area under GAP in Maharashtra is given below.
Table 25: Area under GAP in Maharashtra (in Ha)
S. No. Commodity Area in Ha
1 Grape 40,000
2 Mango 8,000
3 Pomegranate 2,500
4 Vegetables 18,000
Source: APEDA – grapenet, mangonet, pomonet, vegetablenet, 2019
4.2.4 Climate and Rainfall
Maharashtra has typical monsoon climate, with hot, rainy and cold weather seasons. Dew, frost, hail could
also occur sometimes due to the seasonal weather. Summers are in the months of March, April and May
and temperature ranges between 22 0C to 39 0C. Winter prevails from November to February and the

Mott MacDonald | Final Report on Environment and Social Management Framework (ESMF) State of Maharashtra Agri-Business and Rural Transformation (SMART) Project
408004AA01 | 00 | 02 | 27 September 2019
61
temperature varies from 12 0C to 34 0C. Winters are cool and dry with clear sky, gentle breeze and pleasant
weather.
Rainfall in Maharashtra differs from one region to another. Thane, Raigad, Ratnagiri and Sindhudurg
districts receive heavy rains at an average of 2000 mm annually. But the districts of Nasik, Pune,
Ahmednagar, Dhule, Jalgaon, Satara, Sangli, Solapur and parts of Kolhapur get less than 50 mm of rainfall.
Rainfall particularly concentrates on the Konkan and Sahyadrian Maharashtra regions. Central
Maharashtra receives less rainfall. However, under the influence of the Bay of Bengal, eastern Vidarbha
receives good rainfall in July, August and September months.
Large variation in the quantity of rainfall can be observed within different parts of the state. The total
rainfall in the state during the year 2018 was 73.6 percent of the normal. Out of the 355 talukas excluding
Mumbai city and Mumbai suburbs districts in the state, nine talukas received scanty rainfall, 183 talukas
(51.5 percent) received deficient rainfall, 138 talukas received normal rainfall and 25 talukas received
excess rainfall2. Region wise actual rainfall received are as indicated in the table below:
Table 26: Region wise Rainfall Received (in mm)
Rainfall During Konkan Nashik Pune Aurangabad Amravati Nagpur Maharashtra
June Normal 660.2 127.7 166.0 145.8 154.1 187.5 223.3
2017 788.3 138.4 167.9 171.5 138.1 118.5 219.1 (98.1)
2018 903.4 119.4 146.2 170.8 169.3 189.8 237.9 (106.5)
July Normal 1164.7 235.5 330.6 201.2 261.0 412.3 402.6
2017 1096.1 219.6 266.7 73.8 147.1 274.4 288.9 (71.8)
2018 1264.2 156.7 311.8 109.1 227.5 387.8 342.6 (85.1)
August Normal 757.1 189.0 216.7 197.3 210.0 352.4 303.3
2017 769.8 163.8 136.7 212.1 124.7 227.2 235.2 (77.5)
2018 567.2 145.5 187.0 184.9 186.1 268.3 231.4 (76.3)
September Normal 379.0 158.6 158.2 176.9 166.7 209.5 202.1
2017 511.6 123.2 205.4 131.4 102.3 125.7 180.4 (89.3)
2018 117.5 32.6 54.8 23.7 49.9 102.2 57.0 (28.2)
October Normal 115.4 50.8 91.6 58.6 46.1 53.5 67.4
2017 151.8 88.8 114.9 80.8 50.1 45.6 86.5 (128.3)
2018 45.1 3.5 30.5 6.0 0.0 0.0 12.8 (19.0)
June to October
Normal 3076.4 761.6 963.1 779.8 837.9 1,215.2 1,198.7
2017 3317.6 733.8 891.6 669.6 562.3 791.4 1,010.1 (84.3)
2018 2897.4 457.7 730.3 494.5 632.8 948.1 881.7 (73.6)
Source: Economic Survey of Maharashtra 2018-19
4.2.5 Agroclimatic Zone Feature
Maharashtra can be divided in to nine agro-climatic zones based on rainfall, soil type and vegetation.
These are namely:
1. North Konkan Costal Zone
2. South Konkan Costal Zone
3. Western Ghat Zone
4. Sub-mountain Zone
2 Economic Survey of Maharashtra Report 2018-19

Mott MacDonald | Final Report on Environment and Social Management Framework (ESMF) State of Maharashtra Agri-Business and Rural Transformation (SMART) Project
408004AA01 | 00 | 02 | 27 September 2019
62
5. Western Maharashtra Plain Zone
6. Scarcity Zone / Western Drought Prone Area
7. Central Maharashtra Plateau Zone / Central Plateau Assured Rainfall
8. Central Vidarbha Zone / Central Vidarbha Moderate Rainfall
9. Eastern Vidarbha Zone / Eastern Vidarbha high Rainfall.
Characteristics of these agroclimatic zones are indicated in the table below:
Table 27: Characteristics of Agro – Climatic Zones
S. No. Zone District Characteristics
1 North Konkan Costal Zone
Thane and Raigad
Very high rainfall, more than 3,000 mm/year.
High humidity in rainy season. Temperature range between 22 – 330C. Coarse alluvial non-lateritic soil poor in Phosphorous and Potassium. Rice is the major crop and some vegetable and pulses. It has small forest cover.
2 South Konkan Costal Zone
Ratnagiri and Sindhudurg
Very high rainfall, more than 3,000 mm/year. Precipitation dictated by S-W monsoon from June to September. Temperature ranges from 20 -30 degree Celsius. May is the hottest month. Coastal alluvial lateritic soil rich in Nitrogen and Potassium and poor in Phosphorous. Rice is the major crop along with fruits especially mango.
3 Western Ghat Zone
Kolhapur, Satara, Pune, Ahmednagar, Nashik, Sindhudurg
Very narrow strip of highlands extending from North to South along the crest of Sahyadri mountain range. Altitude varies from 1000 to 2000 AMSL. Very heavy rainfall in some areas in excess of 4000 mm/year. Daily temperature ranges from 30 to 40 degree Celsius. Lateritic reddish-brown soil low in Phosphorous and Potassium. About 25 percent of area is under forest. Rice, sorghum, groundnut and fruit trees are important crops.
4 Sub-mountain Zone
Nashik, Pune, Satara, Sangli, Kolhapur
Narrow strip of lower elevation located in the eastern side of the Sahayadari range. Rainfall ranges from 700 to 2500 mm/year dictated by the S-W monsoon. Day temperature varies from 28 to 35 degree Celsius. Soil are reddish-brown to black, rich in Nitrogen and poor in Phosphorous. Important crops are Kharif cereals, groundnut, sugarcane, vegetable, chillies and fruit trees.
5 Western Maharashtra Plain Zone
Dhule, Ahmednagar, Sangli, Nashik, Pune, Satara, Kolhapur
Mostly plain strip. Rainfall varies from 700 to 1200 mm/year well distributed during the S-W monsoon. Maximum temperature reaches 400C during summer. Soil is generally light black with fare level of NPK, well drained and suited for irrigation. Major crops are sorghum, millet, groundnut, wheat and sugarcane.
6 Scarcity Zone / Western Drought Prone Area
Dhule, Nashik, Aurangabad, Ahmednagar, Pune, Satara, Solapur and Sangli.
Characterised by low and unpredictable rainfall of 500 to 700 mm/year in 40 – 45 days. Common dry spell will last for 2 to 10 weeks. Delayed onset and early cessation of S-W monsoon are very common. Summer temperature reaches above 42 0C. Soil types are medium black vertisoils, coarse, shallow, poor in Nitrogen and Phosphorous. Common crops are millet sorghum, groundnut and pulses and the yields are very low.
7 Central Maharashtra Plateau Zone / Central Plateau Assured Rainfall
Aurangabad, Jalna, Beed Osmanabad, Parbhani, Nanded, Buldhana, Akola, Amravati, Jalgaon, Dhule and Solapur
Large plateau covering the central part of the state. Well distributed rainfall ranging from 700 to 900 mm/year dictated by S-W monsoon. Summer temperature will reach about 40 0C. Soil are Vertisoils and entisoils varying from medium black to reddish brown. Sorghum is the most important crop, but cotton, oilseed, millet, groundnut, pulses and sugarcane occupy significant area.
8 Central Vidarbha Zone / Central Vidarbha Moderate Rainfall
Wardha, Nagpur, Yavatmal, Chandrapur, Aurangabad,
Rainfall of 1200 mm/year well distributed within the S-W monsoon months. Maximum temperature of 35 – 40-degree Celsius in summer. Humidity of about 75 percent in rainy season. Soil are black derived from basalt rock, medium to heavy texture and generally fertile. Cropping pattern involve cotton, sorghum, pulses, wheat and oilseed.

Mott MacDonald | Final Report on Environment and Social Management Framework (ESMF) State of Maharashtra Agri-Business and Rural Transformation (SMART) Project
408004AA01 | 00 | 02 | 27 September 2019
63
S. No. Zone District Characteristics
Jalna, Parbhani, Nanded
9 Eastern Vidarbha Zone / Eastern Vidarbha high Rainfall
Bhandara, Gadchiroli, Chandrapur, Nagpur and Gondiya
Soil derived from parent material of mixed origin are reddish brown. Almost 50 percent of the area under forest cover. Rainfall vary from 1300 to 1800 mm / year and well distributed in the monsoon months. Humidity is about 75 percent in the rainy season. Rice, pulses, sorghum and oilseed are important crops.
Source: Report on Maharashtra Water Sector Improvement Project, Proposal for Agricultural Support Services, Department of Agriculture, Maharashtra State
The Agro-climatic zone map of Maharashtra is shown below:
Figure 8: Agro-Climatic Zone Map of Maharashtra
Source: Department of Agriculture, Government of Maharashtra

Mott MacDonald | Final Report on Environment and Social Management Framework (ESMF) State of Maharashtra Agri-Business and Rural Transformation (SMART) Project
408004AA01 | 00 | 02 | 27 September 2019
64
4.2.6 Land Utilization and Cropping Intensity
The land use statistics as per the Economic statistics of Maharashtra 2018-19 is as indicated in the table
below:
Table 28: Maharashtra Land Use Pattern
Land Use Area in lakh Ha Percentage
Total geographical area 307.58
Gross cropped area 232.24
Net area sown 169.10 55.0 percent
Forest 17.0 percent
Land not available for cultivation 11.0 percent
Other uncultivated land 8.0 percent
Fallow Land in Maharashtra 9.0 percent
Cropping intensity of Maharashtra 137.3 percent
Source: Economic Survey of Maharashtra 2017-18
As per the land utilization statistics for the year 2016-17 out of the total 307.58 lakh Ha geographical area,
the gross cropped area was 232.24 lakh Ha while the net sown area was 169.10 lakh Ha Area under
principal crops in the year 2018-19 (tentative) as per economic survey of Maharashtra report 2018-19 are
as indicated in the Figure below:
Figure 9: Area under principal crops
Source: Economic Survey of Maharashtra 2017-18
4.2.7 Cropping Pattern
Kharif season sowing in the year 2018 was complete in 151.03 lakh Ha which was 0.05 percent more than
the previous year. The area under cereals, pulses and cotton decreased while area of oilseeds and
sugarcane crop increased as compared to the last year. The production of cereals and pulses is expected
1553
295504
816
1210
412
4043
196
4254
698.73 682.86
0
500
1000
1500
2000
2500
3000
3500
4000
4500
Are
a in
'00
0 h
a
Agri - Commodity

Mott MacDonald | Final Report on Environment and Social Management Framework (ESMF) State of Maharashtra Agri-Business and Rural Transformation (SMART) Project
408004AA01 | 00 | 02 | 27 September 2019
65
to decrease by 6 percent to 35 percent respectively while the production of oilseeds, cotton and
sugarcane crop is expected to increase by 16 percent, 17 percent and 10 percent respectively as compared
to the last year.
Area under Rabi crops is 50 percent less compared to the previous year mainly due to deficient rainfall in
September and October 2018. The area of cereals, pulses and oilseeds decreased by 56 percent, 40
percent and 58 percent respectively as compared to the previous year.
During 2018-19, the area of summer crops is 0.84 lakh Ha which is 41 percent less than the previous year
(1.33 lakh Ha). Area under cereals, pulses and oilseeds decreased by 19 percent, 34 percent and 62
percent respectively.
The district-wise cropping intensity is indicated in Appendix F.
4.2.8 Water Resource
The average water availability in Maharashtra is 163.82 km3. According to inter-state water tribunal
awards, the allocated quantity of water to the state is 125.94 km3. Almost 55 percent of the dependable
yield is available from the four river basins namely Krishna, Godavari, Tapi and Narmada east of Western
Ghats - these four river basins comprise 92 percent of the cultivatable land and more than 60 percent of
the rural population. Balance 45 percent of the state’s water resource are contributed by West Flowing
Rivers which are mainly monsoon specific rivers emanating from the Ghats and draining into the Arabian
sea and are not utilized due to geographical constraints.
All surface water management related activities are managed by Maharashtra Water Resource
Department. Until June 2016 the department has been successful in creating an irrigation potential of
49.57 lakh Ha and a storage capacity of 33,385 Million cubic meter3. It has also constructed 77 hydropower
projects with an installed capacity of 3,682 MW.
Ground Water Year Book of Maharashtra and Dadra and Nagar Haveli report 2016-17 by the Central
Ground Water Board presents the ground water level in different parts of the state. The study shows that
water level less than two meter below ground level (mbgl) been observed in 7 percent of wells covering
about 23,302 sq. km. area (23.30 lakh Ha). Water level in this range is observed in major parts of Raigad,
Pune, Nashik, Thane, Kolhapur, Sindhudurg, Amravati, Nagpur, Bhandara and Gondia districts and as
isolated patches in parts of most of the districts.
About 36 percent of wells shows water level between 2 to 5 m bgl covering about 1,09,633 sq. km. area
(109.63 lakh Ha). Water level in this range is observed in most parts of Satara, Sangli, Kolhapur, Pune,
Raigad, Thane, Nashik, Nandurbar, Yavatmal, Chandrapur, Gadchiroli, Gondia, Bhandara, Nagpur and
Wardha districts and as isolated patches in parts of all districts.
About 42 percent of wells show water level between 5 and 10 m bgl covering about 1,32,612 sq. km. area
(132.6 lakh Ha). Water level in this range are observed in major parts of Solapur, Osmanabad, Latur,
Parbharni, Beed, Ahmednagar, Aurangabad, Jalna, Jalgaon, Nashik, Dhule, Buldhana, Washim, Akola,
Nanded, Yavatmal, Wardha and Nagpur districts. Small isolated patches showing this range of water level
been observed in almost all the districts.
Deeper ground water level, ranging from 10 to 20 m bgl, is observed as isolated patches, mostly in
northern parts of Maharashtra in the Tapi and Purna River basins in Jalgaon, Buldhana, Akola, Amravati,
Nashik, Nandurbar, Dhule, and major parts of Ahmednagar, Aurangabad, Jalna, Latur, Nanded, Parbhani,
3 Water Resource Department, Government of Maharashtra, India accessed on 21.04.2019.

Mott MacDonald | Final Report on Environment and Social Management Framework (ESMF) State of Maharashtra Agri-Business and Rural Transformation (SMART) Project
408004AA01 | 00 | 02 | 27 September 2019
66
Hingoli, Beed, Ratnagiri, Sindhudurg and districts. About 14 percent of the wells fall in this category
covering about 39,251 sq. km. area (39.25 lakh Ha).
Groundwater level pertaining to more than 20 m bgl, covering about 2,215 sq. km. area (2.22 lakh Ha)
was observed in parts of Jalgaon, Akola, Buldhana Amravati and Nashik, Osmanabad and Latur districts.
1.3.1.11 Ground Water Quality
Minimum, maximum and the average values of the chemical parameters analysed in the 1078 ground
water samples collected from wells representing shallow aquifer are summarized in the following table:
Table 29: Ground Water Quality Maharashtra
S. No. Parameters Minimum Maximum Average
1 pH 6.6 8.8 7.80
2 EC µS/cm @ 25°C 40.0 9301 953
3 TDS (mg/L) 21 4933 495
4 TH (mg/L) 20 3600 360
5 Ca++ (mg/L) 2 701 76
6 Mg++ (mg/L) 1.2 482 41
7 Na+ (mg/L) 1 222 58
8 K+ (mg/L) 0 86 6.65
9 CO3-- (mg/L) 0 36 1.37
10 HCO3- (mg/L) 12 744 242
11 Cl- (mg/L) 7 1872 138
12 NO3- (mg/L) 1 64 27
13 SO4-- (mg/L) 0 1482 101
14 F- (mg/L) 0 1.9 0.31
Source: Central Ground Water Board
The quality of irrigation water depends primarily on the presence of dissolved salts and their
concentrations. The Electrical Conductivity (EC), Sodium Absorption Ratio (SAR) and Residual Sodium
Carbonate (RSC) are the most important quality criteria, which influence the water quality and its
suitability for irrigation. The amounts of dissolved ions in water is best represented by the parameter
electrical conductivity. Maximum number of samples fall under the category of medium and high salinity
water while nearly 9.37 percent of samples fall under low salinity water and 4.55 percent of samples in
very high salinity water. This shows that the ground water in the pre-monsoon season from shallow
aquifers in the State should be used for irrigation with proper soil and crop management practices. Further
the Sodium Adsorption Ratio (SAR) and Residual Sodium Carbonates were also calculated, and the results
indicates that ground water quality of Maharashtra is suitable for irrigation purpose.
4.2.9 Irrigation Practices
As per economic survey of Maharashtra 2018-19, the irrigated area in the command area under the
jurisdiction of Water Resource Department, is 39.50 lakhs Ha in 2017-18.
Area under irrigation in the state is 17.8 percent of the total gross area under cultivation. Out of which
55 percent is irrigated by wells and 45 percent by surface irrigation. The year – wise data on micro-
irrigation scheme is in table below:

Mott MacDonald | Final Report on Environment and Social Management Framework (ESMF) State of Maharashtra Agri-Business and Rural Transformation (SMART) Project
408004AA01 | 00 | 02 | 27 September 2019
67
Table 30: Micro Irrigation Schemes from 2009-10 to 2018-19
S. No. Year Expenditure (Rs. Lakh) (Area Lakh Ha) Beneficiary No.
1 2009-10 132.26 1.19 131,133
2 2010-11 505.06 2.15 227,556
3 2011-12 705.34 2.86 295,018
4 2012-13 516.48 1.42 165,866
5 2013-14 188.31 0.74 80,740
6 2014-15 688.41 2.14 252,676
7 2015-16 445.98 1.36 146,142
8 2016-17 584.00 1.91 209,987
9 2017-18 687.70 2.09 264,180
10 2018-19 357.60 1.12 154,542
Total 4811.14 16.98 1,927,840
Source : Economic Survey of Maharashtra 2018-19
Districtwide area covered under Micro Irrigation from 1986-87 to 2018-19 (Area in Hectare) is in table
below:
Table 31: District Wise Area Covered under Micro Irrigation from 1986-87 to 2018-19
S. No. District
1986-87 to 2018-19
Drip Sprinkler Total
1 Thane 5,567 129 5,697
2 Palghar 325 16 342
3 Raigad 1,681 47 1,727
4 Ratnagiri 3,984 84 4,067
5 Sindhudurg 2,418 44 2,462
Konkan Division 13,975 319 14,294
6 Nashik 139,418 14,873 154,291
7 Dhule 70,608 3,340 73,948
8 Nandurbar 27,436 1,451 28,887
9 Jalgaon 295,735 11,405 307,140
10 A.nagar 116,267 33,190 149,457
Nashik Division 649,464 64,258 713,723
11 Pune 85,045 7,019 92,064
13 Solapur 172,768 8,565 181,333
12 Sangli 78,810 19,617 98,427
14 Satara 35,859 14,522 50,381
15 Kolhapur 17,548 2,104 19,652
Pune Division 390,030 51,826 441,856
16 A.bad 105,900 14,938 120,838
17 Jalana 84,088 25,206 109,294
18 Beed 48,154 17,483 65,637
e Latur 40,269 46,625 86,894
20 O.bad 44,317 18,268 62,585

Mott MacDonald | Final Report on Environment and Social Management Framework (ESMF) State of Maharashtra Agri-Business and Rural Transformation (SMART) Project
408004AA01 | 00 | 02 | 27 September 2019
68
S. No. District
1986-87 to 2018-19
Drip Sprinkler Total
21 Nanded 55,930 40,592 96,522
22 Parbhani 49,675 15,775 65,450
23 Hingoli 20,461 27,674 48,135
Aurangabad 448,794 206,561 655,354
24 Buldhana 82,319 83,894 166,213
25 Akola 21,171 40,569 61,740
26 Washim 8,630 43,802 52,432
27 Amrawati 61,842 61,443 123,285
28 Yeotmal 21,611 68,264 89,875
Amaravati Division 195,574 297,971 493,545
29 Wardha 12,212 39,344 51,556
30 Nagpur 14,400 15,763 30,163
32 Bhandara 1,441 1,905 3,346
31 Chandrapur 2,941 10,614 13,555
33 Gondia 1,215 1,391 2,606
e Gadchiroli 99 698 797
Nagpur Division 32,308 69,715 102,023
State total 1,730,144 690651 2,420,795
1.3.1.12 Electrification of Agricultural Pumps
The pumps installed in Maharashtra for irrigation purposes are given in the table below:
Table 32: Number of agricultural pumps installed in Maharashtra
Number of Agricultural Pumps installed (in Lakhs)
2015-16 2016-17 2017-18 2018-19
38.82 39.67 40.82 42.02
Source: Economic Survey of India, 2016 to 2019
4.2.10 Practice of Organic / Low input Farming
Organic products are grown under a system of agriculture without the use of chemical fertilizers and
pesticides following environmentally and socially responsible approach. Organic farming can be achieved
by enriching soil by natural means like mulching, crop rotation and using organic fertilizers, management
of soil temperature, conservation of soil and rainwater, integration of animal husbandry by products such
as use of cow dung, renewable energy etc.
Agricultural and Processed Food Products Export Development Authority (APEDA) provides consolidated
organic agricultural statistics, for the year 2017-18 under National Programme for Organic Production
(NPOP). As per the statistics the area under Organic Certification process during the last five years
(cultivated and wild harvest both) in the state of Maharashtra are as indicated in the following table:
Table 33: Area under Organic Certification process - Maharashtra
Year 2013-14 2014-15 2015-16 2016-17 2017-18
Area in ha 87,941.66 217,649.19 266,299.239 292,391.781 304,074.81

Mott MacDonald | Final Report on Environment and Social Management Framework (ESMF) State of Maharashtra Agri-Business and Rural Transformation (SMART) Project
408004AA01 | 00 | 02 | 27 September 2019
69
Source: APEDA
As per the statistics, out of 304,074.81 Ha area under certification in Maharashtra, 235,690.55 Ha is under
cultivated area. Out of this cultivated area, 108,029.96 Ha is organic area and remaining 127,660.592 Ha
is conversion area4.
National Programme on Organic Production (NPOP) defined the regulatory mechanism for organic
produce in the country and is regulated under two different Acts for export and import market. USDA has
also accepted the conformity assessment system of NPOP. Due to this, the products certified by any Indian
accredited certification agency under NPOP can be exported to Europe, Sweden and USA without the
requirement of re-certification.
Figure 10: Crop Wise Area under Organic Farming in Maharashtra
Source: http://niti.gov.in/writereaddata/files/Maharashtra_Report_0.pdf; accessed on 2.5.2019
Agencies like ECOCERT, NOKA, CONTROL UNION are engaged in certification of organic farming in the
state5.
Ministry of Agriculture, Cooperation and Farmers Welfare, Department of Agriculture, Cooperation and
Farmers Welfare is implementing Integrated Nutrient Management (INM) and Organic Farming
component under National Mission for Sustainable Agriculture.
4.2.11 Agricultural Pests in Maharashtra
The total number of pests attacking major crops has increased significantly from 1940s. For instance, the
number of pests which are harmful for crops such as rice has increased from 10 numbers to 17 numbers
4 https://apeda.gov.in/apedawebsite/organic/data.htm#Summary_Statistics, accessed on 7.03.2019
5

Mott MacDonald | Final Report on Environment and Social Management Framework (ESMF) State of Maharashtra Agri-Business and Rural Transformation (SMART) Project
408004AA01 | 00 | 02 | 27 September 2019
70
whereas for wheat have increased from 2 numbers to 19 numbers. The increased damage to crops from
pests and subsequent losses poses a serious threat to food security. Major Incidence of pest / disease in
Maharashtra are as indicated in the table below:
Table 34: Major Incidence of Pest / Disease - Maharashtra
Districts Name of Crop Pest / Disease Intensity
Latur, Osmanabad, Solapur Pomegranate Oily Spot Moderate
Jalgaon Banana Sigatoka Moderate
Wardha Citrus Gimmosis Moderate
Nagpur, Wardha, Chandrapur Citrus Gimmosis Moderate
Nagpur, Katol, Saoner, Umred, Dhiwapur
Soybean Tobacco Caterpillar Moderate – Sever
Wardha, Nagpur Gram Helicoverpa Low - Moderate
Washim, Katol Saoner, Umred, Dhiwapur, Wardha, Chandrapur, Neemtala, Balar
Soybean Spodoptera, Hairy caterpillar, Green semi looper
Above ETL, Moderate to Severe
Nagpur, Bhandara Chandrapur Rice Army worm Moderate
Washim, Nagpur, Katol, Saone, Umred, Dhiwapur, Wardha, Chandrapur, Neemtala, Balar
Soybean Spodoptera, Hairy caterpillar and Green Semi Looper
Above ETL, Moderate to Severe
Source: Directorate of Plant Protection Quarantine and Storage, Department of Agriculture, Cooperation and Farmers Welfare, Ministry of Agriculture and Farmer Welfare, GoI, 2017
Details on crop wise pest details are indicated in Appendix F.
4.2.12 Agrochemical Consumption
Insecticides, fungicides and herbicides are commonly used pesticides. India is the fourth largest global
producer of agrochemicals after the US, Japan and China. This segment generated a value of USD 4.4
billion in FY15 and is expected to grow at 7.5 percent per annum to reach USD 6.3 billion by FY20.
Approximately 50 percent of the demand comes from domestic consumers and the rest from exports.
During the same period, domestic demand is expected to grow at 6.5 percent per annum and exports at
9 percent per annum6.
Per hectare consumption of pesticides was highest in Punjab (0.74 kg), followed by Haryana (0.62 kg) and
Maharashtra (0.57 kg).
Bio-pesticide have the potential to control crop losses and reduce negative environmental externalities.
Bio-pesticides constitutes around 3 percent of pesticide market in India. So far only 14 biopesticides have
been registered under the Insecticides Act 1968 in India. Consumption of bio-pesticides has increased
from 219 MT in 1996-97 to 683 MT in 2000-01 and further to around 5635 MT in 2015-167.
Consumption of chemical and bio-pesticides in the state of Maharashtra are as indicated in the following
table:
Table 35: Use of Pesticides in Maharashtra (in MT)
Year Chemical Pesticides Bio-pesticides
2015-16 11,665 1,173
2016-17 13,496 1,454
6 Next Generation Indian Agriculture – Role of Crop Protection Solutions; A Report on Indian Agrochemical Industry July 2016
7 Subhash SP, Prem Chand, Pavithra S, Balaji SJ and Suresh Pal, Pesticide Use in Indian Agriculture: Trend, Market Structure and Policy Issues.ICRA

Mott MacDonald | Final Report on Environment and Social Management Framework (ESMF) State of Maharashtra Agri-Business and Rural Transformation (SMART) Project
408004AA01 | 00 | 02 | 27 September 2019
71
Year Chemical Pesticides Bio-pesticides
2017-18 15,568 1,271
2018-19 15,705 2,252
Source: Economic Survey of Maharashtra 2017-18
Regarding the global pesticide share across agricultural crops, vegetable accounts 20 percent and cotton
account for 19 percent followed by soybean, maize and cereals. Figure below indicates crop wise pesticide
share in India.
Figure 11: Global Agri-commodity Category wise percent share of pesticide
Source: Institute of Agri Business Management, Bikaner, 2015
The national share of pesticide uses 45 percent in cotton, 22 percent in rice followed by vegetable, pulses,
and wheat.
Figure 12: National Agri-commodity Category wise percent share of pesticide
Source: Institute of Agri Business Management, Bikaner, 2015
Cotton19%
Rice6%
Soyabean10%
Maize11%
Cereals14%
Fruit and Vegitables20%
others20%
Cotton45%
Rice22%
Wheat4%
Pulses4%
Vegitables9%
Plantation 7%
Others9%
Cotton Rice Wheat Pulses Vegitables Plantation Others

Mott MacDonald | Final Report on Environment and Social Management Framework (ESMF) State of Maharashtra Agri-Business and Rural Transformation (SMART) Project
408004AA01 | 00 | 02 | 27 September 2019
72
The pesticide shares in Maharashtra have 30 percent in cotton, 20 percent each in vegetable and oil seeds
followed by fruits, pulses and cereals each 10 percent.
Figure 13: Crop wise percent Pesticide Share in Maharashtra
Source: Department of Agriculture, Maharashtra Year 2019
Agro-commodity wise consumption share of bio-pesticide and chemical pesticides used in Maharashtra
is given in the following:
Figure 14: Agri-commodity wise consumption of chemical and bio-pesticides in Maharashtra in MTs
(2018-19)
Fruits10%
Cereals10%
Pulses10%
Vegitables20%
Oil Seeds20%

Mott MacDonald | Final Report on Environment and Social Management Framework (ESMF) State of Maharashtra Agri-Business and Rural Transformation (SMART) Project
408004AA01 | 00 | 02 | 27 September 2019
73
Detailed List of banned pesticides in India is presented in Appendix F.
1.3.1.13 Advisories Given to Farmers under Integrated Pest Management (IPM)
The details of advisories given to farmers under IPM in Maharashtra is provided in table below:
Table 36: Advisories Given to Farmer under IPM in Maharashtra
S.
No.
Year Area
Covered
(Lakh Ha)
Online Agro-advisories
provided by Agricultural
Universities
Agro-advisories
provided through SMS
1 2018-19 127 13,055 602.15
2 2019-20 (Progress
till 19 July 2019)
88.84 29,846 7.78
Source: Department of Agriculture, Government of Maharashtra, 2019
1.3.1.14 Training given to agricultural officers in IPM
The training given to the officers under IPM are given in table below:
Table 37: Training given to Agricultural Officer under IPM in Maharashtra
S.
No. Year
Officer trained by
Agricultural
Universities
Officer trained by National Institute of
Plant Health Management, Hyderabad
Total Officers
trained
1 2017-18 1854 75 1929
2 2018-19 11882 89 11971
Source: Department of Agriculture, Government of Maharashtra, 2019
1766.81 25.61 3727.74 2860.39 16.451.93 3297.11
79.99 73.81 374.91 603.91 25.09 1 5.47
0%
10%
20%
30%
40%
50%
60%
70%
80%
90%
100%
Cereals Vegetables Pulses Oil Seeds Fruit Crops Cash Crops Fiber Crops
per
cen
tC
on
sum
pto
n
Name of the Agri-Commodities
Bio-Pesticide
Consumption (MT)
Chemical Pesticide
Consumption (MT)

Mott MacDonald | Final Report on Environment and Social Management Framework (ESMF) State of Maharashtra Agri-Business and Rural Transformation (SMART) Project
408004AA01 | 00 | 02 | 27 September 2019
74
4.2.13 Fertilizer Consumption Scenario
Fertilizers are natural and artificial substances containing the chemical element that improve growth and
productiveness of plant. Fertilizer enhance the natural fertility of the soil or replace the chemical element
taken from soil by previous crops.
The type of fertilizer used in India are Straight nitrogenous fertilizers such as Ammonium Sulphate,
Calcium Ammonium Nitrate, Ammonium Chloride and Urea, Straight phosphatic fertilizers such as single
super phosphate and triple super phosphate and NP / NPK complex Fertilizers such as urea, ammonium
phosphate, ammonium phosphate Sulphate, Diammonium phosphate (DAP), Mono ammonium
phosphate (MAP), Nitro phosphate, Nitro phosphate with potash, NP / NPKs
In Maharashtra more than 50 percent of soil is deficient in zinc and deficiency of iron and manganese is
also apparent in many districts. Maharashtra ranks third with a share of 11 percent in all India
consumption of fertilizers. Per hectare consumption of Maharashtra is 124.8 kg in 2018-19.
Chemical fertilizer consumption in Maharashtra is as indicated in the table below:
Table 38: Chemical Fertilizer Consumption (in lakh MT) and on per hectare basis (kg)
Year Total Consumption (in lakh MT) Per hectare consumption (kg)
2015-16 59.63 122.5
2016-17 61.74 126.1
2017-18 61.69 124.0
2018-19 62.10 124.8
Source: Economic Survey of Maharashtra 2018-19
As per Economic survey of Maharashtra 2018-19, the region wise usage of nitrogenous, phosphatic and
potassic chemical fertilizers for the year 2017-18 and anticipated use in the year 2018-19 are as indicated
in the table below.
Table 39: Region-wise use of Chemical Fertilizer (in ’00 MT)
Chemical fertilizers Year Konkan Nashik Pune Aurangabad Amravati Nagpur
Nitrogenous 2017-18 366 3762 3,739 3,814 1,649 1,765
Phosphatic 71 2,084 1,823 2,602 1,265 959
Potassic 56 1,786 1,480 1,286 566 362
Total 493 7,632 7,042 7,702 3,481 3,086
Nitrogenous 2018-19 556 3,864 4,381 4,532 1,587 1,420
Phosphatic 235 2,030 2,397 3,042 1,254 809
Potassic 268 1,882 2,283 1,957 631 443
Total 1,059 7,776 9,061 9,531 3,472 2,672
Source: Economic survey of Maharashtra 2018-19
The above data shows that fertilizer consumption is higher in Aurangabad, Pune and Nashik regions of
Maharashtra.
Utilization of fertilizer nutrients by crops vary from 30 – 50 percent in case of Nitrogen, 15 – 20 percent
in case of phosphorous and less than 5 percent in case of micronutrients. Fertilizers are mostly used for

Mott MacDonald | Final Report on Environment and Social Management Framework (ESMF) State of Maharashtra Agri-Business and Rural Transformation (SMART) Project
408004AA01 | 00 | 02 | 27 September 2019
75
crops such as cotton, sugarcane, banana, tomato, chilly and onion. However, 70 percent fertilizer is
applied for cotton and very less quantity for pulses and oil seeds8.
Studies have shown that soil which receives plant nutrients only through chemical fertilizers showed a
decline in productivity, despite being supplied by enough nutrients through fertilizers. The decline of
productivity is attributed to deficiency in secondary and micronutrients. The physical condition of soil
deteriorates due to long-term use of chemical fertilizers especially the nitrogenous ones. Further, excess
use of nitrogenous fertilizers leads to ground water and environmental pollution apart from destroying
the ozone layer through N2O production.
4.2.14 Crop Wise Water Requirement
Roots take water from the soil. This water dissolved with nutrients from the soil is transported to the plant
for use. Water is thereafter released into the atmosphere by the plants through the process of
transpiration. The water needs of a crop is usually expressed in mm/day, mm/month or mm/season.
Irrigated water can be stored in the soil around the root zone and can be gradually utilized by the plant.
Water requirement of some of the major crops grown in Maharashtra are as indicated below:
Figure 15: Crop Wise Water Requirement (mm/year)
Source: Water productivity mapping of major Indian crops by NABARD; Note: For orange and pomegranate its mm /year, 2018
4.2.15 Crop Varieties and Yield / Productivity
As per water productivity mapping of major Indian crops by NABARD, the yield of some crop varieties are
as follows:
8 Comprehensive District Agricultural Plan 2012-17, Department of Agriculture and allied Departments. Government of Maharashtra.
1500
450 495
150250
750
2000
500 500
1100
200
0
500
1000
1500
2000
2500
WA
TER
REQ
UIR
EMEN
T IN
MM
/ YE
AR
AGRI COMMODITY
Water Requirement mm/season

Mott MacDonald | Final Report on Environment and Social Management Framework (ESMF) State of Maharashtra Agri-Business and Rural Transformation (SMART) Project
408004AA01 | 00 | 02 | 27 September 2019
76
• Rice – 3.6 MT / Ha World average is 4.5 MT/ Ha Total land area under rice cultivation in Maharashtra
is 14.1 lakh Ha and production is 17.47 lakh MT
• Wheat – 3.1 MT / Ha World average is 3.31 MT/ Ha Maharashtra productivity is low at 1.7 MT / Ha
• Maize – 3.04 MT / Ha Total land under Maize cultivation in Maharashtra is 6 lakh Ha Maharashtra
maize productivity is low at 2.74 MT / Ha
• Chickpea / Gram – 0.9 MT / Ha Total land under gram cultivation in Maharashtra is 13.1 lakh Ha and
the yield is 0.89 MT / Ha
• Red Gram – 0.66 MT / Ha Total land under red gram cultivation in Maharashtra is 11.6 lakh Ha and the
yield is 0.79 MT / Ha
• Groundnut – 1.3 MT / Ha Total land under groundnut cultivation in Maharashtra is 2.6 lakh Ha and the
yield is 1.15 MT / Ha
• Cotton – 0.542 MT lint / Ha Which is lower than the world average of 0.784 MT Lint / Ha Total land
under Cotton production in Maharashtra is 35.4 Lakh Ha
• Potato – 15.32 MT / Ha
As per Department of Horticulture report 2017, Maharashtra holds the second position amongst major
fruit producing states in the country with 11.2 percent share (103.78 Lakh M.T). The state holds 6th
position in terms of vegetable production with 5.9 percent share (10.36 Lakh M.T).
As per Horticulture Statistics at a Glance 2017, yield of horticulture produce in the State is as shown in
table below.
Table 40: Crop Area and Production in Maharashtra (2016-17)
S. No. Crop Area (lakh Ha) Production (in ‘000 M.T) Yield MT/Ha
1 Pomegranate 1.37 1578 11.54
2 Sapota 0.18 156 12.84
3 Beans 0.05 45 9.27
4 Bottle Guard 0.02 36 -
5 Cabbage 0.09 189 21.22
6 Cucumber 0.05 62 -
7 Chillies (dry) 0.17 35.9 2.08
8 Okra 0.14 148 10.26
9 Onion 4.72 6773 14.36
10 Potato 0.23 541 23.71
11 Tomato 0.44 957 21.93
12 Watermelon 0.06 176 -
13 Mandarin 1.08 985 9.16
14 Sweet Lime 0.55 657 -
15 Grapes 1.04 2138 20.56
16 Mango 1.57 515 3.28

Mott MacDonald | Final Report on Environment and Social Management Framework (ESMF) State of Maharashtra Agri-Business and Rural Transformation (SMART) Project
408004AA01 | 00 | 02 | 27 September 2019
77

Mott MacDonald | Final Report on Environment and Social Management Framework (ESMF) State of Maharashtra Agri-Business and Rural Transformation (SMART) Project
408004AA01 | 00 | 02 | 27 September 2019
78
5 Stakeholder Consultation Analysis
The stakeholder analysis process for the ESMF of the proposed project aims to identify and classify project
stakeholders that include beneficiaries and any individual or group who is potentially affected by a
project/ activity or can themselves affect or influence a project/ activity.
This section assesses outcome of the stakeholder consultations and their responses in the context of
SMART. This includes perceptions and concerns raised by individuals and groups on the prevailing status
of the agriculture sector in the state and any expectations that they may have from the proposed activities
under the project.
Focused Group Discussions and semi-structured interviews were conducted in order to involve all the
stakeholders in the agriculture value chain. To get a representative sample, each commodity identified
under SMART was studied to identify the agroclimatic zone which best represent the commodity value
chain. Once the commodity and corresponding agroclimatic zone were finalized, the selection of CBO for
a commodity was done on a random basis. During the stakeholder consultation with the CBOs,
corresponding value chain linkages were identified such as Market, Retailers, Traders, Food Processing
Industries. To the extent possible the linkages were also consulted, and their feedback were noted, to
cover a representative sample across the entire value chain. During the stakeholder consultation process,
small and marginal farmers were also interviewed to get their specific issues and feedbacks. The key inputs
that have been used to develop this analysis are:
• Results of 20 CBOs, covering eight commodities and 22,133 farmers.
5.1 Stakeholder Identification and Profiling
Stakeholder identification and profiling is essential to develop an engagement strategy and information
disclosure process that is tailored to the needs of different stakeholder groups as well as to prioritise the
available project resources. The table below illustrates the spectrum of stakeholders that were engaged
with as part of ESMF:
Table 41: Stakeholder identification and profiling for SMART project
Particular State District Block/Cluster Village
State level
Department of Agriculture/ATMA
Agri Marketing
Animal Husbandry
Maharashtra State Rural Livelihood
Mission (MSRLM).
Mahila Arthik Vikas Mahamandal
(MAVIM)
Corporate Engagement through Village
Social Transformation Foundation
(VSTF)
Agriculture value-chain players
Farmers

Mott MacDonald | Final Report on Environment and Social Management Framework (ESMF) State of Maharashtra Agri-Business and Rural Transformation (SMART) Project
408004AA01 | 00 | 02 | 27 September 2019
79
Particular State District Block/Cluster Village
Aggregators
Commission Agents
Traders
Retailers
Market
Institution Level
CLFs
CMRCs
FPOs
FPCs
PACS
SHGs/Farmer Groups
Primary Producers
General
SC/ ST
Women / WHH
Sheep & Goat rearing farmers
The stakeholder profile varies not only owing to the socio-economic conditions, but also because of their
vulnerabilities. The expectations and the impact of these stakeholders on the project will therefore signify
variations depending on their abilities to participate and benefit from the project activities. It is therefore
important that the stakeholder profile is captured, and SMART appreciates the existing variations. It
should be noted that the identification and management of stakeholders is an iterative process requiring
change and regular review.
The following tables puts across the outcomes of the stakeholder analysis in a better perspective, as well
as help in making informed decisions on the projects.
Table 42: Definition for the Quadrants
Quadrant What they mean
High Influence
and High
Importance
These stakeholders are important to the implementation of the project and can affect the
project outcomes. They may be a source of catalysing the project as well as pose significant
risk if their interests do not converge with the project. These stakeholders would need to be
engaged in an appropriate and positive manner.
Low Influence
and High
Importance
These stakeholders are important to the implementation of the project but may have limited
influence on project outcomes. Their capacities and involvement in the project would have to
be suitably enhanced. Lack of their participation and involvement in the project may pose a
risk to the success of the project.
High Influence
and Low
Importance
Stakeholders in this quadrant would require limited consultation. They are unlikely to be
affected by the projects activities or outcomes but may have the potential to impact project
outcomes. Therefore, the actions of such stakeholders would need careful monitoring and will
have to be backed with appropriate actions under the project.
Low Influence
and Low
importance
These stakeholders will need to be consulted but may not know how the issue affects them.
People very low on the influence scale may need methods and attention.
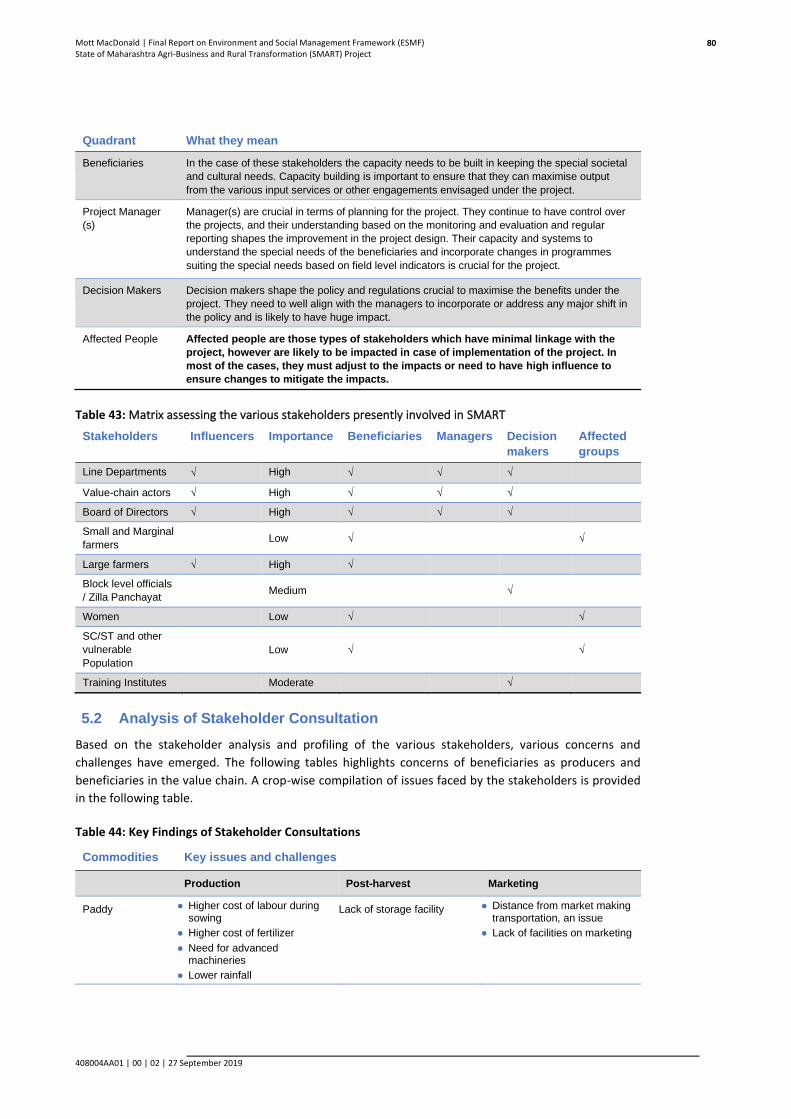
Mott MacDonald | Final Report on Environment and Social Management Framework (ESMF) State of Maharashtra Agri-Business and Rural Transformation (SMART) Project
408004AA01 | 00 | 02 | 27 September 2019
80
Quadrant What they mean
Beneficiaries In the case of these stakeholders the capacity needs to be built in keeping the special societal
and cultural needs. Capacity building is important to ensure that they can maximise output
from the various input services or other engagements envisaged under the project.
Project Manager
(s)
Manager(s) are crucial in terms of planning for the project. They continue to have control over
the projects, and their understanding based on the monitoring and evaluation and regular
reporting shapes the improvement in the project design. Their capacity and systems to
understand the special needs of the beneficiaries and incorporate changes in programmes
suiting the special needs based on field level indicators is crucial for the project.
Decision Makers Decision makers shape the policy and regulations crucial to maximise the benefits under the
project. They need to well align with the managers to incorporate or address any major shift in
the policy and is likely to have huge impact.
Affected People Affected people are those types of stakeholders which have minimal linkage with the
project, however are likely to be impacted in case of implementation of the project. In
most of the cases, they must adjust to the impacts or need to have high influence to
ensure changes to mitigate the impacts.
Table 43: Matrix assessing the various stakeholders presently involved in SMART
Stakeholders Influencers Importance Beneficiaries Managers Decision
makers
Affected
groups
Line Departments √ High √ √ √
Value-chain actors √ High √ √ √
Board of Directors √ High √ √ √
Small and Marginal
farmers Low √ √
Large farmers √ High √
Block level officials
/ Zilla Panchayat Medium √
Women Low √ √
SC/ST and other
vulnerable
Population
Low √ √
Training Institutes Moderate √
5.2 Analysis of Stakeholder Consultation
Based on the stakeholder analysis and profiling of the various stakeholders, various concerns and
challenges have emerged. The following tables highlights concerns of beneficiaries as producers and
beneficiaries in the value chain. A crop-wise compilation of issues faced by the stakeholders is provided
in the following table.
Table 44: Key Findings of Stakeholder Consultations
Commodities Key issues and challenges
Production Post-harvest Marketing
Paddy ● Higher cost of labour during sowing
● Higher cost of fertilizer
● Need for advanced machineries
● Lower rainfall
Lack of storage facility ● Distance from market making transportation, an issue
● Lack of facilities on marketing
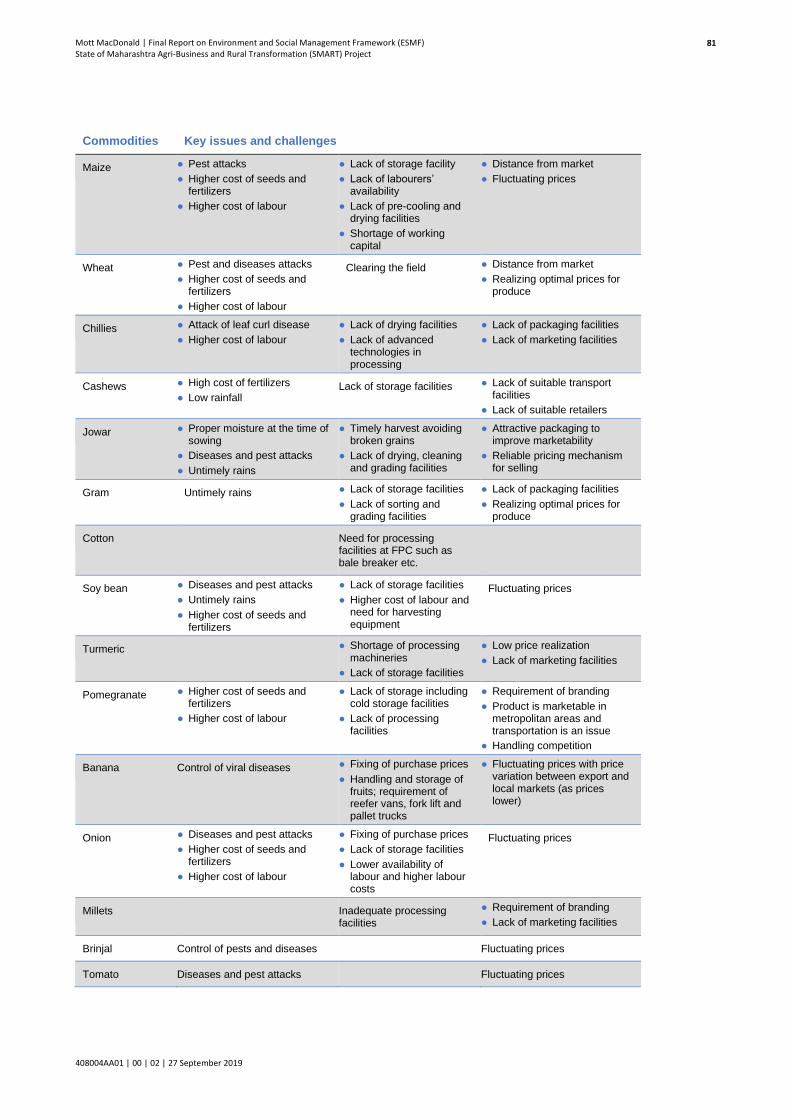
Mott MacDonald | Final Report on Environment and Social Management Framework (ESMF) State of Maharashtra Agri-Business and Rural Transformation (SMART) Project
408004AA01 | 00 | 02 | 27 September 2019
81
Commodities Key issues and challenges
Maize ● Pest attacks
● Higher cost of seeds and fertilizers
● Higher cost of labour
● Lack of storage facility
● Lack of labourers’ availability
● Lack of pre-cooling and drying facilities
● Shortage of working capital
● Distance from market
● Fluctuating prices
Wheat ● Pest and diseases attacks
● Higher cost of seeds and fertilizers
● Higher cost of labour
Clearing the field ● Distance from market
● Realizing optimal prices for produce
Chillies ● Attack of leaf curl disease
● Higher cost of labour
● Lack of drying facilities
● Lack of advanced technologies in processing
● Lack of packaging facilities
● Lack of marketing facilities
Cashews ● High cost of fertilizers
● Low rainfall Lack of storage facilities ● Lack of suitable transport
facilities
● Lack of suitable retailers
Jowar ● Proper moisture at the time of sowing
● Diseases and pest attacks
● Untimely rains
● Timely harvest avoiding broken grains
● Lack of drying, cleaning and grading facilities
● Attractive packaging to improve marketability
● Reliable pricing mechanism for selling
Gram Untimely rains ● Lack of storage facilities
● Lack of sorting and grading facilities
● Lack of packaging facilities
● Realizing optimal prices for produce
Cotton Need for processing facilities at FPC such as bale breaker etc.
Soy bean ● Diseases and pest attacks
● Untimely rains
● Higher cost of seeds and fertilizers
● Lack of storage facilities
● Higher cost of labour and need for harvesting equipment
Fluctuating prices
Turmeric ● Shortage of processing machineries
● Lack of storage facilities
● Low price realization
● Lack of marketing facilities
Pomegranate ● Higher cost of seeds and fertilizers
● Higher cost of labour
● Lack of storage including cold storage facilities
● Lack of processing facilities
● Requirement of branding
● Product is marketable in metropolitan areas and transportation is an issue
● Handling competition
Banana Control of viral diseases ● Fixing of purchase prices
● Handling and storage of fruits; requirement of reefer vans, fork lift and pallet trucks
● Fluctuating prices with price variation between export and local markets (as prices lower)
Onion ● Diseases and pest attacks
● Higher cost of seeds and fertilizers
● Higher cost of labour
● Fixing of purchase prices
● Lack of storage facilities
● Lower availability of labour and higher labour costs
Fluctuating prices
Millets Inadequate processing facilities
● Requirement of branding
● Lack of marketing facilities
Brinjal Control of pests and diseases Fluctuating prices
Tomato Diseases and pest attacks Fluctuating prices
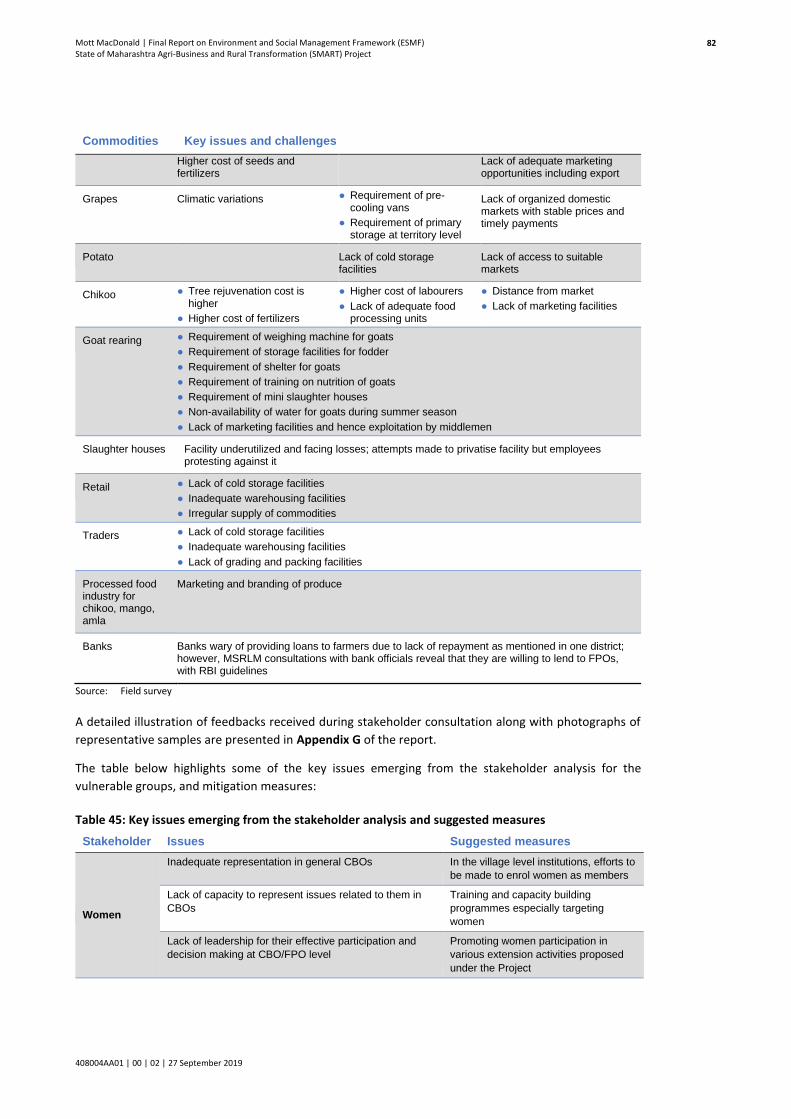
Mott MacDonald | Final Report on Environment and Social Management Framework (ESMF) State of Maharashtra Agri-Business and Rural Transformation (SMART) Project
408004AA01 | 00 | 02 | 27 September 2019
82
Commodities Key issues and challenges
Higher cost of seeds and fertilizers
Lack of adequate marketing opportunities including export
Grapes Climatic variations ● Requirement of pre-cooling vans
● Requirement of primary storage at territory level
Lack of organized domestic markets with stable prices and timely payments
Potato Lack of cold storage facilities
Lack of access to suitable markets
Chikoo ● Tree rejuvenation cost is higher
● Higher cost of fertilizers
● Higher cost of labourers
● Lack of adequate food processing units
● Distance from market
● Lack of marketing facilities
Goat rearing ● Requirement of weighing machine for goats
● Requirement of storage facilities for fodder
● Requirement of shelter for goats
● Requirement of training on nutrition of goats
● Requirement of mini slaughter houses
● Non-availability of water for goats during summer season
● Lack of marketing facilities and hence exploitation by middlemen
Slaughter houses Facility underutilized and facing losses; attempts made to privatise facility but employees protesting against it
Retail ● Lack of cold storage facilities
● Inadequate warehousing facilities
● Irregular supply of commodities
Traders ● Lack of cold storage facilities
● Inadequate warehousing facilities
● Lack of grading and packing facilities
Processed food industry for chikoo, mango, amla
Marketing and branding of produce
Banks Banks wary of providing loans to farmers due to lack of repayment as mentioned in one district; however, MSRLM consultations with bank officials reveal that they are willing to lend to FPOs, with RBI guidelines
Source: Field survey
A detailed illustration of feedbacks received during stakeholder consultation along with photographs of
representative samples are presented in Appendix G of the report.
The table below highlights some of the key issues emerging from the stakeholder analysis for the
vulnerable groups, and mitigation measures:
Table 45: Key issues emerging from the stakeholder analysis and suggested measures
Stakeholder Issues Suggested measures
Women
Inadequate representation in general CBOs In the village level institutions, efforts to
be made to enrol women as members
Lack of capacity to represent issues related to them in
CBOs
Training and capacity building
programmes especially targeting
women
Lack of leadership for their effective participation and
decision making at CBO/FPO level
Promoting women participation in
various extension activities proposed
under the Project
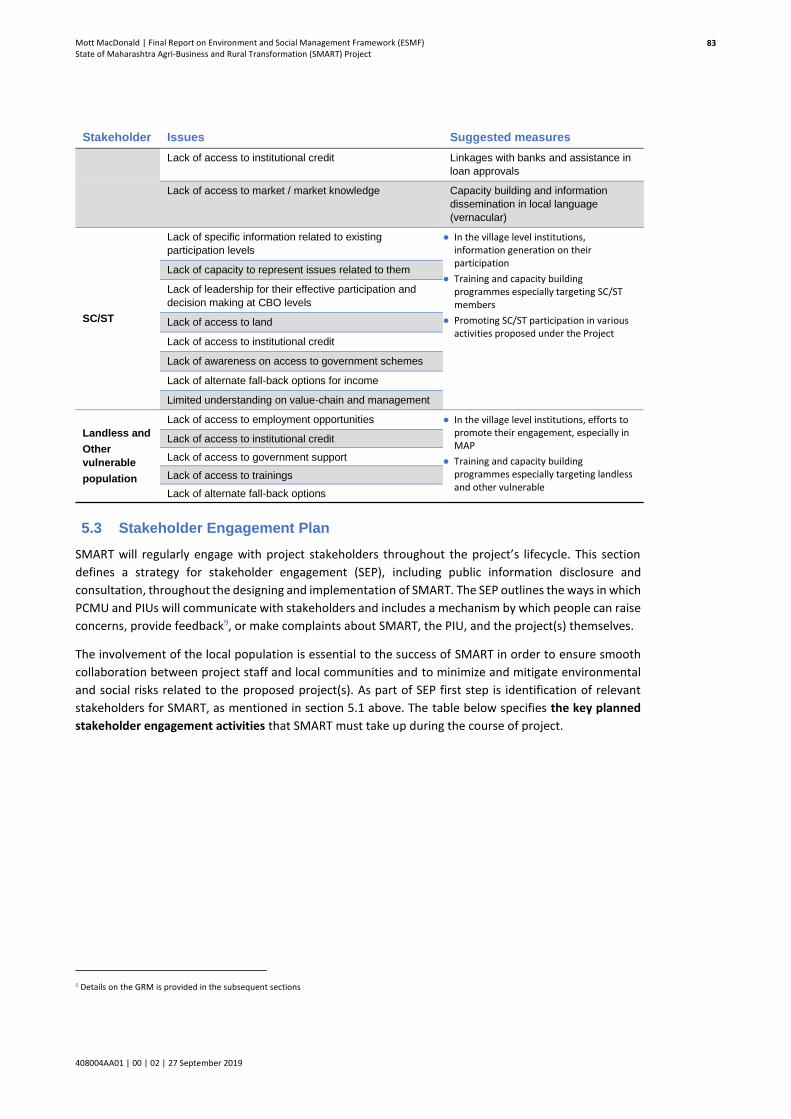
Mott MacDonald | Final Report on Environment and Social Management Framework (ESMF) State of Maharashtra Agri-Business and Rural Transformation (SMART) Project
408004AA01 | 00 | 02 | 27 September 2019
83
Stakeholder Issues Suggested measures
Lack of access to institutional credit Linkages with banks and assistance in
loan approvals
Lack of access to market / market knowledge Capacity building and information
dissemination in local language
(vernacular)
SC/ST
Lack of specific information related to existing
participation levels
● In the village level institutions, information generation on their participation
● Training and capacity building programmes especially targeting SC/ST members
● Promoting SC/ST participation in various activities proposed under the Project
Lack of capacity to represent issues related to them
Lack of leadership for their effective participation and
decision making at CBO levels
Lack of access to land
Lack of access to institutional credit
Lack of awareness on access to government schemes
Lack of alternate fall-back options for income
Limited understanding on value-chain and management
Landless and
Other
vulnerable
population
Lack of access to employment opportunities ● In the village level institutions, efforts to promote their engagement, especially in MAP
● Training and capacity building programmes especially targeting landless and other vulnerable
Lack of access to institutional credit
Lack of access to government support
Lack of access to trainings
Lack of alternate fall-back options
5.3 Stakeholder Engagement Plan
SMART will regularly engage with project stakeholders throughout the project’s lifecycle. This section
defines a strategy for stakeholder engagement (SEP), including public information disclosure and
consultation, throughout the designing and implementation of SMART. The SEP outlines the ways in which
PCMU and PIUs will communicate with stakeholders and includes a mechanism by which people can raise
concerns, provide feedback9, or make complaints about SMART, the PIU, and the project(s) themselves.
The involvement of the local population is essential to the success of SMART in order to ensure smooth
collaboration between project staff and local communities and to minimize and mitigate environmental
and social risks related to the proposed project(s). As part of SEP first step is identification of relevant
stakeholders for SMART, as mentioned in section 5.1 above. The table below specifies the key planned
stakeholder engagement activities that SMART must take up during the course of project.
9 Details on the GRM is provided in the subsequent sections

Mott MacDonald | Final Report on Environment and Social Management Framework (ESMF) State of Maharashtra Agri-Business and Rural Transformation (SMART) Project
408004AA01 | 00 | 02 | 27 September 2019
84
Table 46: Planned stakeholder engagement activities
Stage Target stakeholders Topic (s) of engagement Method(s) used Location / frequency Responsibilities
STA
GE
1:
PR
OJE
CT
PR
EPA
RA
TIO
N (P
RO
JEC
T D
ESIG
N, S
CO
PIN
G, R
ESET
TLEM
ENT
PLA
NN
ING
, ESM
F/R
PF/
SEP
DIS
CLO
SUR
E)
Project Affected People:
● People potentially affected by land acquisition
● People residing in project area
● Vulnerable households
● ESMF, ESMP, RPF, SEP, RAP (if prepared) disclosures
● Land acquisition process
● Assistance in gathering official documents for authorized land uses
● Compensation rates, methodology
● Compensation packages
● Project scope and rationale
● Project E&S principles
● Resettlement and livelihood restoration options
● Grievance mechanism process
● Public meetings, separate meetings for women and vulnerable
● Face-to-face meetings
● Mass/social media communication (as needed- content to be in local language)
● Disclosure of written information: brochures, posters, flyers, website Information boards or desks - In Talathi office / CBOs (in local language)
● Grievance mechanism
● SMART monthly newsletter (if available)
● In project collector's office, Tehsildar’s office and Panchayat Bhawan (village) for disclosure of Drafts ESMF, RPF, SEP, RAP (if triggered)
● In Talathi / Tehsildar’s office at beginning of construction that would affect the area
● Continuous communication through mass/social media and routine interactions
● Throughout RAP development as needed
● PCMU team
● PIU / Specialists responsible for land acquisition
● RAP consultant
Other Interested Parties (External)
● Collector, Tehsildar, Talathi in districts / block
● Representatives in villages
● ESMF, ESMP, RPF, SEP, RAP disclosures
● Land acquisition process
● Identification of land plots and uses
● Resettlement and livelihood restoration options (if needed)
● Project scope, rationale and E&S principles
● Grievance mechanism process
● Face-to-face meetings
● Joint public/community meetings with PAPs
● Throughout RAP development as needed
● Project launch meetings at the block level (tehsildar’s office)
● Quarterly meetings in affected villages and Tehsil / Block
● Disclosure meetings in Panchayat and Block
● PCMU E&S Team & management
● PIU
● Specialists responsible for land acquisition
● RAP consultant
Other Interested Parties (External)
● Press and media
● NGOs
● ESMF, ESMP, RPF, SEP, RAP disclosures
● Grievance mechanism
● Public meetings, trainings/workshops (separate meetings specifically for women and vulnerable as needed)
● Mass/social media communication
● Project launch meetings in Block
● PCMU
● PCMU E&S team

Mott MacDonald | Final Report on Environment and Social Management Framework (ESMF) State of Maharashtra Agri-Business and Rural Transformation (SMART) Project
408004AA01 | 00 | 02 | 27 September 2019
85
Stage Target stakeholders Topic (s) of engagement Method(s) used Location / frequency Responsibilities
● Private players
● Workers' organizations
● Training institutions
● Line Government Departments
● Project scope, rationale and E&S principles
● Disclosure of written information: Brochures, posters, flyers, website
● Information boards or desks in Panchayat
● Grievance mechanism
● Notice board for employment recruitment, in case of civil works
● Meetings in affected villages and blocks, as needed
● Communication through mass/social media (as needed)
● Information desks with brochures/posters in affected villages (continuous)
● PIU coordinator / Social Specialist
Other Interested Parties (External)
● Other Government Departments from which permissions/clearances are required;
● Other project developers, donors
● Legal compliance issues
● Project information scope and rationale and E&S principles
● Coordination activities
● Land acquisition process
● Grievance mechanism process
● ESMF/ESMP/RPF/SEP disclosures
● Face-to-face meetings
● Invitations to public / community meetings
● Submission of required reports
● Disclosure meetings
● Reports as required
● PCMU
● PCMU E&S team
● PIU Coordinator / social specialist
Other Interested Parties (Internal)
● Other block / tehsil staff
● Supervision Consultants
● Supervision contractors, sub-contractors, service providers, suppliers, and their workers
● Project information: scope and rationale and E&S principles
● Training ESMF/ESMP requirements and other management plans
● Grievance mechanism process
● E&S requirements
● Feedback on consultant/ contractor reports
● Face-to-face meetings
● Trainings/workshops
● Invitations to public/community meetings
As needed ● PCMU
● PCMU E&S team
● PIU coordinator / social specialist

Mott MacDonald | Final Report on Environment and Social Management Framework (ESMF) State of Maharashtra Agri-Business and Rural Transformation (SMART) Project
408004AA01 | 00 | 02 | 27 September 2019
86
Stage Target stakeholders Topic (s) of engagement Method(s) used Location / frequency Responsibilities
STA
GE
2: C
ON
STR
UC
TIO
N A
ND
MO
BIL
IZA
TIO
N A
CTI
VIT
IEs
Project Affected People
● People potentially affected by land acquisition
● People residing in project area
● Vulnerable households
● Grievance mechanism
● Health and safety impacts (EMF, community H&S, community concerns)
● Employment opportunities
● Project status
● Public meetings, open houses, trainings/workshops
● Separate meetings as needed for women and vulnerable
● Individual outreach to PAPs as needed
● Disclosure of written information: brochures, posters, flyers, website Information boards in Panchayats
● Notice board(s) at construction sites (in local language)
● Grievance mechanism
● SMART monthly newsletter, if available
● Quarterly meetings during construction seasons
● Communication through mass/social media as needed
● Notice boards updated weekly
● Routine interactions
● Brochures in local offices
● PCMU
● Management team
● PCMU E&S staff
● Supervision and RAP consultants
● Contractor/sub-contractors
Other Interested Parties (External)
● Governmental committees for land use and compensation
● Talathi and representatives in villages
● Project scope, rationale and E&S principles
● Grievance mechanism
● Project status
● World Bank compensation requirements
● Face-to-face meetings
● Joint public/community meetings with PAPs
As needed (monthly during construction season)
● PCMU management
● PCMU E&S staff
● PIU coordinator / social specialist
● Supervision and RAP consultants
● Contractor/sub-contractors
Other Interested Parties (External)
● Press and media
● NGOs
● Businesses and business organizations
● Workers' organizations
● Training Institutions
● State departments
● General public, tourists, jobseekers
● Project information - scope and rationale and E&S principles
● Project status
● Health and safety impacts
● Employment opportunities
● Environmental concerns
● Grievance mechanism process
● Public meetings, open houses, trainings/workshops
● Disclosure of written information: brochures, posters, flyers, website, Information boards in block / Panchayat
● Notice board(s) at construction sites
● Grievance mechanism
Same as for PAPs ● PCMU management
● PCMU E&S staff
● PIU coordinator / social specialist

Mott MacDonald | Final Report on Environment and Social Management Framework (ESMF) State of Maharashtra Agri-Business and Rural Transformation (SMART) Project
408004AA01 | 00 | 02 | 27 September 2019
87
Stage Target stakeholders Topic (s) of engagement Method(s) used Location / frequency Responsibilities
Other Interested Parties (Internal)
● Other district / block / village staff
● Supervision Consultants
● Contractor, sub-contractors, service providers, suppliers and their workers
● Project information: scope and rationale and E&S principles
● Training on ESMF/ESMP requirements and other sub-management plans
● Worker grievance mechanism
● Face-to-face meetings
● Trainings/workshops
● Invitations to public/community meetings
Daily, as needed ● PCMU management
● PCMU E&S staff
● PIU
STA
GE
3: O
PER
ATI
ON
AN
D M
AIN
TEN
AN
CE
Project Affected People:
● People residing in project area
● Vulnerable households
● Satisfaction with engagement activities and GRM
● Grievance mechanism process
● Damage claim process
● Outreach to individual PAPs
● SMART / PIU website
● Grievance mechanism
● SMART newsletter
● Outreach as needed
● Meetings in affected villages / CBOs (as needed/requested)
● Monthly (newsletter)
● PCMU management
● PCMU E&S team
Other Interested Parties (External)
● Press and media
● NGOs
● Businesses and business organizations
● Workers' organizations
● Training institutions
● Local Government Departments
● General public, tourists
● Grievance mechanism process
● Issues of concern
● Status and compliance reports
● Grievance mechanism
● SMART website
● Face-to-face meetings
● Submission of reports as required
As needed ● PCMU management
● PCMU E&S team

Mott MacDonald | Final Report on Environment and Social Management Framework (ESMF) State of Maharashtra Agri-Business and Rural Transformation (SMART) Project
408004AA01 | 00 | 02 | 27 September 2019
88
5.4 Information disclosure
The SMART website will be used to disclose project documents, including those on environmental and
social performance. This will begin with disclosure of this draft SEP and the draft ESMF and RPF. Besides
the draft disclosure documents (and the final documents in future), project brochures and updates will
be posted. An easy-to-understand guide to the terminology used in the environmental and social reports
or documents will also be posted on the website. In addition, the site will provide details about the
Grievance Redress Mechanism and contact details for the Grievance Redress Officers at the project and
district / block levels. PCMU will update and maintain the website regularly, at least quarterly.

Mott MacDonald | Final Report on Environment and Social Management Framework (ESMF) State of Maharashtra Agri-Business and Rural Transformation (SMART) Project
408004AA01 | 00 | 02 | 27 September 2019
89

Mott MacDonald | Final Report on Environment and Social Management Framework (ESMF) State of Maharashtra Agri-Business and Rural Transformation (SMART) Project
408004AA01 | 00 | 02 | 27 September 2019
90
6 Potential Impact Assessment –
Environment and Social
The Environmental and Social Management Framework (ESMF) prepared for SMART shall help in
screening, assessment, management of environmental and social issues of the project at an early stage in
project planning and integrate appropriate measures during the subproject design, implementation and
operation. The framework will help provide specific guidance on the policies and procedures to be
followed for environmental and social assessment along with roles and responsibilities of the
implementing agencies.
6.1 Objectives of ESMF
The main objectives of the ESMF for SMART are to:
• Avoid any direct, indirect, potentially adverse and irreversible environmental and social impacts / risks
of projects that it lends to;
• Minimize or mitigate adverse environmental and social impacts / risks;
• Ensure that environmental and social management plans meet the relevant requirements of
regulations of GoM, and environmental and social safeguard requirements of The World Bank;
• Guide PCMU, and other stakeholders in preparing subprojects and / or activities for appraisal and in
monitoring, reporting, and undertaking corrective actions, if any;
• Ensure that effective mechanisms are in place for safeguard compliance during project
implementation, and to undertake corrective actions, if required; and
• Develop institutional capacity of stakeholder institutions on safeguard compliance, etc.
6.2 Social and environmental impact evaluation criteria
For the purpose of evaluating the impacts on various social aspects, the criterion has been developed
based on understanding of the project and certain assumptions which were considered relevant in
categorising the impacts. However, it is to be appreciated that the diversity of the impacts for the
proposed activities under the SMART may at times be difficult to categorise; it is assumed that a rational
attempt can be made towards categorising the impacts through the below mentioned significance
criterion. Despite that, as the social and environmental impacts in some cases are interspersed, separate
methods have been considered to categorise the impacts. The detail of the criterion that has been used
to evaluate impacts on various social aspects is as following:
6.3 Context
The context refers to spatial or geographical extent of impact due to proposed project. The study proposes
following classification of impacts:
• Local (low spread), when an impact is restricted within 500m of the project site;
• Medium (medium spread) when an impact is spread from 500m to 3km of the project site; and
• Regional (high spread) when impact is spread beyond 3km of the project site.

Mott MacDonald | Final Report on Environment and Social Management Framework (ESMF) State of Maharashtra Agri-Business and Rural Transformation (SMART) Project
408004AA01 | 00 | 02 | 27 September 2019
91
6.4 Duration
The duration of impact considers whether the impact would be short-term, medium-term or long-term
and has been assessed based on the time taken to recover back to its pre-project state. For the proposed
project, impacts were classified based on their existence in temporal scale as follows:
• Short term (low duration) when impacting for a duration of six months; this will result in the recovery
of the effected component within a year
• Medium (medium duration) when impacting between six months and two years; this will result in the
recovery of the effected component within 1 to 3 years
• Long term (high duration) when impacting beyond two years; and will result in recovery of prevailing
conditions beyond 3 years.
6.5 Type
The type of impact refers to whether the effect is considered beneficial or adverse. Beneficial impacts
would improve resource conditions. Adverse impacts would deplete or negatively alter resources.
To help understand, environmental and social issues associated with SMART, the PCMU undertook a study
in nine agro-climatic zones, as well as, analysed data of 20 CBOs, covering eight commodities. Further,
data from secondary sources was studied and analysed, and accordingly, an Environmental and Social
Management Framework (ESMF) has been prepared, that ensures compliance of all project activities with
the environmental regulations of GoM and the safeguard policies of the World Bank. The framework
(ESMF) follows the Environment and Social regulations of Government of Maharashtra and the safeguard
policies of the World Bank. The table below presents the Social Management Framework for sub
components proposed under SMART, based on the above criteria.

92
[Title]
Table 47: Social Management Framework
Project Component /
Sub-component
Anticipated social impact Impact
categorization
Measures incorporated in
project design
Mitigation measures suggested Implementation
schedule
Responsible
Component A: Enhancing Institutional Capacity to Support Agricultural Transformation
● Institutionalisation
● Enhanced mechanism to promote sector by complying with the States’ and Bank’s policies
● Streamlined M&E will result in easy analysis of project impacts
● Sharing of international good practices and regular capacity building through emplaned capacity building institutions
● Positive
● Long term
● Project commits to comply with the strategy document to build capacities and necessary skill-sets.
● Project commits to comply with the State’s and Bank’s safeguard policies
● To appoint safeguard specialist for the entire period of project.
Planning and
Implementation
PCMU
Component B: Expanding Market Access and Supporting Enterprise Growth
Market Access Support. (PP, MAP and Innovations)
Priority Sector Investments in Infrastructure- SMART Cotton, Exports Facility and Livestock Services
Capacity Building Support Sub-
Land requirement for any of the commodity could affect the livelihood of the land users.
● Minor
● Local
● Short term/ Long term
The project does not involve any land acquisition and Physical displacement for any community. Where public land is involved, the project will get the land encumbrance free. If, however, any land is required, it would be procured through direct purchase
● The project will not finance any PP that entails land acquisition.
● The project will not finance any direct purchase of land.
● The PIU through the CBO must provide evidence that any land required and available with it, is free of any encumbrances.
● In case there is direct purchase of land by CBO, such sale deed will be based on prevailing market rates and verifiable.
● The SPCMU as a part of monitoring will ensure that the land being made available for the sub project implementation is encumbrance free.
● In case of civil works, labour management plan will be prepared and followed as per the Bank requirements.
● Planning and Implementation phase
PCMU , PIU & Regional team
Component B: Expanding Market Access and
Increased income opportunity for CBO producers will also encourage more people to join
● Moderate
● Positive
An increase in the linkages to the organised markets will
● Producers could be provided guidance on how to invest in activities resulting
Implementation PCMU / PIU /Regional team

93
[Title]
Project Component /
Sub-component
Anticipated social impact Impact
categorization
Measures incorporated in
project design
Mitigation measures suggested Implementation
schedule
Responsible
Supporting Enterprise Growth
CBOs; improved income source Increasing the opportunities for market linkages and income sources by networking / linkages with existing and new markets through Private Players
● Long Term increase the income of the producers.
in increase in income and avail services like insurance etc.
● The SC/ST and HHs and other vulnerable population could be identified for specific training related to forming saving groups. The usage of the income earned from project to further strengthen resource base as well as to be diversify the income source could be taken up.
Component B: Expanding Market Access and Supporting Enterprise Growth
Increased Women empowerment
● Major
● Positive
● Long Term
● Regional
● To ensure that women participation is increased under the project, following measures could be taken for the enhancement of the impact:
● Number of women accessing project services and benefits would be recorded with the objective that this upward trend through the project implementation.
● Women’s active participation in CBOs and in boards to be monitored. Issues seen as constraints and obstacles to be removed by the PIU through consultations with them and other CBO members.
● Participation of women in training programmes to be ensured through appropriate design, location and timing choices to suit their requirements
● The training and IEC programmes to focus on the latest market trends to meet the market demand, using local language and technology widely understood, so that they make informed choices.
● Planning and Implementation phase
PCMU / PIU /Regional team

94
[Title]
Project Component /
Sub-component
Anticipated social impact Impact
categorization
Measures incorporated in
project design
Mitigation measures suggested Implementation
schedule
Responsible
● Proposed training programmes to include gender sensitisation of producers and board members to reduce incidence of discrimination and harassment that women face while participating.
● The training programmes to include information and details on ensuring fair and transparent community procurement, payment process and maintenance of infrastructure created.
● Equal access to women and other poor /vulnerable groups to avail of employment opportunities generated through PP, MAP and Enterprise.
● Guidelines to address the social component (including Gender) will be developed in course of the project implementation based on the lessons learnt
Component B: Expanding Market Access and Supporting Enterprise Growth
Increased Empowerment and reduction in vulnerability of the small & marginal farmers, esp. SC/ST & WHH HHs with increased income opportunities through engagement project activities for livelihood development.
● Minor
● Positive
● Regional
● Long Term
The project design provides for inclusion and equal opportunities for small & marginal farmers including SC/ST & women headed households
● To ensure that vulnerable have equal access to project benefits under the project, following measures are suggested:
● Customised training programmes will be organised to help SC/ST, & vulnerable farmers. Others to avail benefits under the project.
● Ensure adequate representation of SC/ST participants in all the training batches.
● Number of SC/ST HHs and other vulnerable population accessing project services and benefits be recorded with the objective that this participation level should show an
● Planning and Implementation phase
PCMU / PIU /Regional team

95
[Title]
Project Component /
Sub-component
Anticipated social impact Impact
categorization
Measures incorporated in
project design
Mitigation measures suggested Implementation
schedule
Responsible
upward trend through the project implementation.
● The project will develop a database on the membership and representation of women, SC / ST and other vulnerable groups in the CBOs.
● The project will monitor the participation of SC/ST HHs and other vulnerable population participation in CBOs and boards.
● Specific IEC will be planned and implemented to raise the general awareness on agriculture and allied sector and improved practices.
● The training programmes to include information and details on ensuring fair and transparent village level procurement and payment process.
Component B: Expanding Market Access and Supporting Enterprise Growth
Reduced migration in communities where lack of supplemental income sources during non-agricultural seasons forces households to migrate for work.
● Minor
● Positive
● Long term
● Regional and Local
Established linkages to organised markets
● To maximise this impact following action could be taken:
● Database of migratory farmers (seasonal) with reasons
● Awareness programmes for market linkages or bank linkage programme either directly or through coverage under existing scheme.
● Induction training programme for the new CBO members
● In a sample village, where migration is routine, track through focussed socioeconomic surveys the impact of the programme, with reduced migration as one indicator.
● Planning and Implementation phase
PCMU / PIU /Regional team

96
[Title]
Project Component /
Sub-component
Anticipated social impact Impact
categorization
Measures incorporated in
project design
Mitigation measures suggested Implementation
schedule
Responsible
Component B: Expanding Market Access and Supporting Enterprise Growth
Mismatch between the resource availability and the type of produce, could add pressure on the resources available with landless, marginal and small farmers.
● Moderate
● Negative
● Regional
● Long term
● Demand supply analysis ● The CBO in their proposal should have measure they will adopt to ensure that their proposed activities have taken into consideration existing resources constraints.
● CBOs / farmers to be made aware of good post-harvest management practices.
● IEC will include focus on the most effective and affordable post-harvest practices
● Improved awareness on safe & cost-effective storage management practices
Planning and Implementation
PCMU / PIU /Regional team
Component B: Expanding Market Access and Supporting Enterprise Growth
Increased debt of CBOs / farmers due to poor / inadequate repaying capacity
● Major
● Negative
● Short term
● Regional
Linkages with the Banks (financial institutions)
● Gender sensitive training of the FIs
● Training of the CBOs on terms of payments / loans
● Specific training for women-led CBOs
● Planning and Implementation phase
PCMU / PIU /Regional team
Component C – Building Risk Mitigation Mechanism
Incorrect information can increase distress and burden of the farmers
● Major
● Negative
● Long term
● Regional
Marketing intelligence cell for wider information dissemination among CBOs / farmers
● Information is shared with small & marginal and other vulnerable farmers, including women-led CBOs
● Content / input data validation mechanism
● Capacity building on usage and application.
● Sharing of the analysis with concerned stakeholders.
● Planning and Implementation phase
PCMU / PIU /Regional team
Component C – Building Risk Mitigation Mechanism
Land requirement for warehouse could affect livelihood, housing, access to livelihood / housing
● Minor
● Local
● Short term/ Long term
● The project does not involve any land acquisition and Physical displacement for any community for construction / renovation of warehouses.
● The project will not finance any warehouse that entails land acquisition.
● The project will not finance any direct purchase of land.
● Planning and Implementation phase
PCMU / PIU /Regional team

97
[Title]
Project Component /
Sub-component
Anticipated social impact Impact
categorization
Measures incorporated in
project design
Mitigation measures suggested Implementation
schedule
Responsible
● In most cases, the refurbishment would take place on the existing land.
● Where public /private land is involved, the project will get the land encumbrance free.
● If, however, any land is required, it would be procured through direct purchase.
● The PIU through the CBO must provide evidence that any land required and available with it, is free of any encumbrances.
● In case there is direct purchase of land by CBO, such sale deed will be based on prevailing market rates and verifiable.
● The PCMU as a part of monitoring will ensure that the land being made available for the warehouse construction / refurbishment is encumbrance free.
● In case of civil works, labour management plan will be prepared and followed as per the Bank requirements. Labour Management Framework is detailed in Chapter 15 of this report
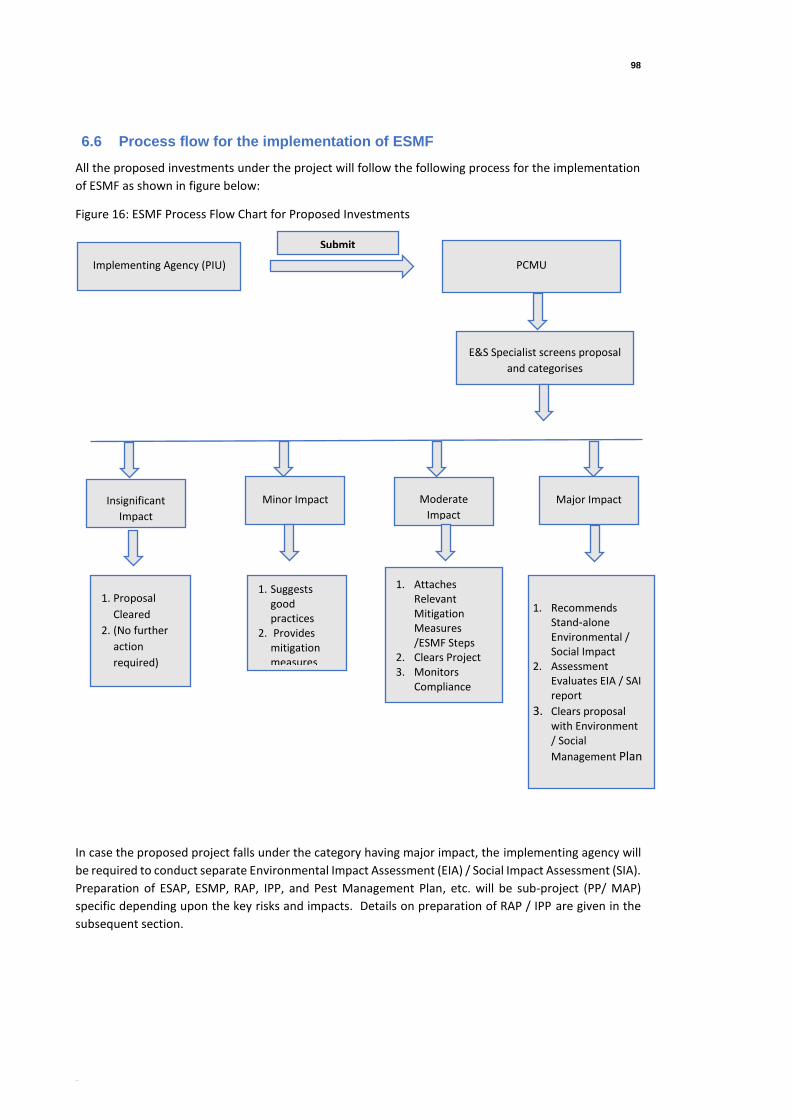
98
[Title]
6.6 Process flow for the implementation of ESMF
All the proposed investments under the project will follow the following process for the implementation
of ESMF as shown in figure below:
Figure 16: ESMF Process Flow Chart for Proposed Investments
In case the proposed project falls under the category having major impact, the implementing agency will
be required to conduct separate Environmental Impact Assessment (EIA) / Social Impact Assessment (SIA).
Preparation of ESAP, ESMP, RAP, IPP, and Pest Management Plan, etc. will be sub-project (PP/ MAP)
specific depending upon the key risks and impacts. Details on preparation of RAP / IPP are given in the
subsequent section.
Implementing Agency (PIU) PCMU
Submit
E&S Specialist screens proposal
and categorises
Insignificant
Impact
Minor Impact Moderate
Impact
Major Impact
1. Proposal
Cleared
2. (No further
action
required)
1. Suggests good practices
2. Provides mitigation measures
1. Attaches Relevant Mitigation Measures /ESMF Steps
2. Clears Project 3. Monitors
Compliance
1. Recommends Stand‐alone Environmental / Social Impact
2. Assessment Evaluates EIA / SAI report
3. Clears proposal with Environment / Social
Management Plan

99
[Title]
6.7 Social Management Framework
The social management framework (SMF) is a road map to be adopted by the Project for incorporation of
social development principles into the main project planning, execution and operation. It details the
methodology for activities to be carried out under the project and its components. The SMF incorporates
key issues pertaining to the screening criteria, gender equity, tribal development, capacity building and
monitoring and evaluation.
The SMF would guide the SMART project in undertaking impact assessments and preparing management
plans for works under the project while ensuring sensitivity to social and cultural concerns. The SMF shall
facilitate implementation of SMART activities in compliance with social development principles of the
World Bank.
The SMF shall facilitate the project implementing agencies / departments in identifying sites with no
potential adverse social impacts for undertaking activities where land is required and identifying training
needs and master trainers for capacity building on social development. The officials of implementing
agencies / departments will be provided training on SMF implementation to facilitate achieving social
development outcomes of SMART.
The SMF should be discussed with the concerned stakeholder’s and details (summary, and /or full
document) should be disclosed (in local languages) at project’s website, implementing agencies’ (PIU)
website and appropriate locations at the field level (CBO offices, Gram Panchayat office, etc.). The
definition of terms to be used in the RAP is presented in Appendix H.
6.7.1 Land Requirement
Land requirement is one amongst the guiding principles of social assessment envisaged under SMART as
for a particular sub-project implementation it entails number of safeguards issues with respect to
resettlement and rehabilitation. As reported by the SMART PCMU, the project is intended to undertake
sub-project activities only on the land resource already available with Government departments /agencies
or are within the existing Right of Way (RoW) or made available through community contributions
/voluntary land donation. As a matter of principle, activities that require land acquisition will not be taken
up under SMART (except voluntary land donation for community assets through appropriate processes).
This Chapter discusses mechanisms and processes for obtaining land, if required and entitlements for
project affected families.
6.7.2 Resettlement Framework
The civil work under the project could involve construction of warehouses / aggregation units, cold-
storage units, renovation / construction of slaughter houses, and cattle sheds, etc. The extent of
resettlement is expected to be minimal. Though minimal, the mitigation of the social and resettlement
impacts in the project requires a framework for addressing the impacts in the individual project phases
related to resettlement. This Resettlement Framework (RF), which consists of resettlement planning and
entitlement provisions, has been worked out based on assessment of the current conditions in the project
districts. This RF outlines the principles and approaches to be followed in minimizing and mitigating the
adverse social and economic impacts due to the project (details on entitlement matrix in the section
below).
1.3.1.15 Purpose of Resettlement Policy Framework
Resettlement Policy Framework (RPF) has been formulated based on the applicable and relevant laws
relating to the project and based on the Bank OP 4.12 on involuntary resettlement. The objective of RPF

100
[Title]
is to avoid if possible, if not minimize impacts and finally mitigate the adverse social impacts on the
population affected by the planning, design and implementation of the project. The framework
emphasizes that the involuntary resettlement will be avoided and minimized by exploring different design
options, if feasible. In other words, exploring various options and considering the best option which has
minimum or no impact.
The nature and magnitude of social impact will be assessed through social impact assessments. A
Resettlement Action Plan (RAP) or Abbreviated Resettlement Action Plan (ARAP), as applicable will be
prepared in compliance with the Social Safeguards provided in the ESMF and implemented to mitigate
the adverse impacts to assist the affected people and to enable them to improve their living standards.
The measures available in the RAP /ARAP shall be implemented prior to the commencement of civil works.
All the Bank-approved social safeguard documents (RAP, ARAP, IPDP, etc.) will be disclosed 120 days prior
to the start of the construction.
The broad categories of economic and social adverse impacts that would be mitigated are:
• Loss of land and assets
• Loss of shelter or homestead lands
• Loss of income or means of livelihood
• Loss of access to productive resources, shelter/residences
• Loss of collective impacts on groups such as loss of community assets, common property resources
and others.
6.7.3 Social Management (Resettlement and Rehabilitation)
The principal objectives of this R&R Policy are to:
• Minimize displacement and to identify the non-displacing or least-displacing alternatives
• Explore different alternatives /options to avoid physical displacement and involuntary relocations
(such as alternative sites, wherever possible etc.)
• Plan the Resettlement and Rehabilitation of Project Affected Families (PAFs), including special needs
of vulnerable sections;
• Compensate and assistance to the Project Affected People (PAPs) irrespective of their legal rights, in
maintaining /restoring their former living standards, income earning capacity, and production levels.
• Carry out detailed planning along with implementation arrangements, in case PAPs lose land
/structures and or displaced and or economically affected adversely
• Facilitate harmonious relationship between the Implementing Authority (Acquiring Body) and PAFs
through cooperation and regular interaction;
• Ensure that the affected persons are meaningfully consulted and provided opportunities to participate
in the planning and implementation stages of the resettlement program in order to suitably
accommodate their inputs and make this policy more participatory in nature and broad based in its
scope.
1.3.1.16 Resettlement and Rehabilitation Principles
• The Resettlement and Rehabilitation policy is based on the principle that the affected persons are not
worse-off on account of the project than they were before. This approach to frame the R&R Policy
ensures greater acceptability of the project to the people and is expected to facilitate its effective
implementation.

101
[Title]
• PAP /PAF will be categorized as titleholders and non-titleholders. The vulnerable sections among each
of the above categories will receive additional support.
• The negative impact on persons affected by the project would be avoided or minimized.
• Where the negative impacts are unavoidable, the project-affected persons will be assisted in regaining
their standard of living. Vulnerable Groups will be identified and assisted to improve their standard of
living.
• All information related to resettlement preparation and implementation will be disclosed to all
concerned (in a language /format understood by the affected), and people’s participation will be
ensured in planning and implementing the project.
• The PAPs will receive compensation for lost assets at replacement cost and the compensation will be
available prior to the taking over of assets.
• Broad entitlement framework of different categories of PAP has been assessed and is given in the
entitlement matrix. PAFs will be surveyed / enumerated as of the cut – off date. Provisions will be kept
in the budget for those who were not present at the time of enumeration. However, anyone moving
into the project area after the cut-off date will not be entitled to assistance.
• Appropriate grievance Redressal mechanism will be established at the district level to ensure speedy
resolution of disputes.
• All consultations with PAPs shall be documented. Consultations will continue during the
implementation of resettlement and rehabilitation works.
6.7.4 Social Regulatory Framework
The Subprojects that would be financed under SMART needs to be consistent and complied with and meet
the requirements of the following applicable acts, notifications, and policies. The compensation and
assistance provided to the project affected will be based on the applicable acts, legislations, regulations
besides the Operational Policies of the World Bank.
National and State
• The Right to Fair Compensation and Transparency in Land Acquisition, Rehabilitation and
Resettlement Act 2013.
• Right to Information Act, 2005
• The Right to Fair Compensation and Transparency in Land Acquisition, Rehabilitation and
Resettlement (Maharashtra), Rules, 2014
Operational Policies of the World Bank
• OP/BP 4.10 Indigenous People
• OP/BP 4.12 Involuntary Resettlement
6.7.5 Categorization of sub-projects
During the screening process, the social risks will be assessed through the screening formats submitted
by the borrower along with the loan application. Screening formats are given in Appendix I. Based on the
screening, the social category of the project is determined and necessary SIA and related RAP/ ARAP as
applicable shall be prepared. Based on the magnitude of impact to the Project Affected Persons (PAPs)
through screening of projects, projects have been categorized as either Sa, Sb or Sc outlined in Table
below:

102
[Title]
Table 48: Categorization of sub-projects: Social
Category Description Type of project
Level of issues Management measures
Sa Significant adverse
impacts expected
Social Impact Assessment
(SIA) and RAP
● If it involves acquisition of private land or permanent loss of private assets and livelihood
● If it involves physical displacement of 200 and more PAPs are affected.
Sb
Moderate adverse
social impacts
expected
SIA and Abbreviated RAP ● If the affected people are not physically displaced and less than 10 present of their productive is lost;
● If fewer than 200 people are displaced
Sc
No social issues
expected hence,
Socially benign
Social Screening Report ● No private land acquisition or no impacts to PAPs
● Construction stage impacts on assets near right of way
The social categorization will be done based on the social screening information provided by the CBOs/
field staff. However, based on the outcome of social impact assessment, the category will be revisited at
the time of appraisal of each subproject.
6.7.6 Social Impact Assessment and Resettlement Action Plan
A social impact assessment will be undertaken for all projects with high to moderate social impacts to
assess the potential social impacts of the proposed projects. Based on the outcome of such assessment
the corresponding mitigation instrument -- Abbreviated Resettlement Action Plan (ARAP) will be prepared
for Sb Category Projects and Full Resettlement Action Plan (FRAP) will be prepared for Sa category
projects. SIA process includes undertaking of the following steps:
– consultations with the stakeholders
– census survey of PAPs
– socio-economic surveys of the Project Affected Persons
– focus group discussion with specific interest groups
In case the baseline socio-economic survey data is more than two (2) years old at the time of
implementation of the project, the key socio-economic data will be updated.
Contents of the Resettlement Action Plan (RAP) shall include the following as a basic minimum:
● Executive Summary
● Project description
● Objectives and Study Methodology
● Socio-Economic Profile of the project area
● Regulatory Policies with respect to Social Safeguards
● Proposed Improvements under the project
● Options considered for minimizing adverse impacts
● Assessment of Project impacts
● Baselines Socio Economic Survey
● Public Consultation & Disclosure and Plan
● Nature and magnitude of impacts
● Type of impacts

103
[Title]
● Compensation and R&R assistance
● Livelihood Restoration and Income Generation Plan
● Gender Dimensions and Action Plan
● Grievance Redress Mechanism
● Implementation Schedule and Budget
● Institutional Arrangements
● Implementation Arrangements
● Monitoring and Evaluation
1.3.1.17 Abbreviated Resettlement Action Plans (ARAPs)
ARAP will be prepared where impacts on the entire displaced population are minor and less than 200
persons are affected; an ARAP would be prepared covering the following minimum elements:
● A census survey of displaced persons and valuation of assets
● Description of compensation and other resettlement assistance to be provided
● Consultations with displaced people about acceptable alternatives
● Institutional responsibility for implementation and procedures for grievance redress
● Arrangements for monitoring and implementation
● A timetable and budget.
The SIA/RAP will be disclosed followed by a consultation and the suggestions, comments of the
stakeholders will be incorporated in the RAP. The final RAP will be disclosed on the websites of the
implementing agencies and related CBOs. The Hindi / vernacular version of full report will also be
disclosed in the project sites.
6.7.7 Resettlement planning
The various tasks related to resettlement planning are specified below:
1.3.1.18 Dissemination of selected sites:
Salient features of the finalized sites /locations will be displayed at the notice boards of the District
Panchayat and the concerned Gram Panchayat. This shall include (a) map of the district / block showing
the sites to be covered; and (b) list of villages to be benefited.
1.3.1.19 Selection of sites
The selection of sites for new construction /upgradation shall be based on consultation with the
concerned CBOs /stakeholders, and community that may be directly or indirectly affected. The following
criteria shall be adopted as pre-requisites for taking up sites by the State Governments:
• The proposed investment /alignment involves little or no loss of land or structures, and the remaining
land and /or structures remain viable for continued use;
• In the event of impacts not being avoidable, there is a scope for obliterating, reducing, and /or
supporting losses through one or more of the following mechanisms10:
10 Sites where no scope exists for addressing the social impacts through any of the mechanisms shall not be taken up
for SMART during that particular year. Such sites will be taken up after these issues are resolved by the community and there is a demand for the construction to the PCMU

104
[Title]
i. Design modifications by reduction of the land width, alignment shifts, modifications in cross-
sections etc., to the extent required from safety considerations,
ii. Voluntary land donation by the land owner through a written Memorandum of Understanding
/Affidavit and/ or land acquisition through LA Act /or direct purchase, and,
iii. Civil society support mechanism (PRI /Community) to the vulnerable affected persons.
1.3.1.20 Dissemination of Project Information
After selection of sites and prior to finalization of the type of investments, a brochure providing an
overview of the project in the state will be available for distribution in each of the Gram Panchayat
/concerned PIU along the proposed site. The dissemination of information shall
– sensitize the communities on the project related issues
– demonstrate the expectations of the project from the communities, including mechanisms for
beneficiary role, if any.
1.3.1.21 Consultations with the Affected Persons
Within a week of selection of sites, the concerned PIU / Gram Panchayat (GP) shall organise a meeting
involving the affected persons to communicate how the concerns of the communities have / have not
been incorporated into the project design. The affected persons would be consulted at least twice: once
while planning and then to explain the contents of plans when these are finalised (the structure and
format for recording the consultation sessions are presented in Appendix J). In addition, consultation
would take place throughout the implementation of the Resettlement Action Plan. The methods of
consultation would include group consultations with male as well female affected persons, individual
consultations with PAFs, community leaders, elected representatives of Panchayat /Local Bodies and
other stakeholders who may be deemed suitable for consultation. Details will also be published in the
press and electronic media. The following information pertaining to the project design will be highlighted
and disseminated:
• Specifications, project costs and construction schedule,
• Likely issues due to project activities,
• Land width required and available,
• Design modifications incorporating comments and suggestions of communities
• Procedure to be adopted for accretion of land / assets (MoU /Affidavit),
• Entitlement provisions for vulnerable groups,
• Disbursal Procedures to Entitled Persons,
• Safety and health concerns during construction works, and
• Inputs required by the local community as construction labour, temporary use of land for diversions
etc.
1.3.1.22 Profile of Affected Persons
In order to carry out resettlement planning, implementation and monitoring, it is important to collect
baseline socio-economic data of PAPs. For this purpose, census and socio-economic surveys shall be
conducted using questionnaire prepared by the Detail Project Report consultant (Appendix K). It gives a
questionnaire for census survey of PAP. As far as possible, these surveys shall be completed prior to the
issuance of Notification under section 3 of the Land Acquisition Act, 2013 to ensure better quality &

105
[Title]
authenticity of data. Broad information that would be collected during these surveys relate to details of
family members, religion, caste, sources of income, occupation, land holdings, ownership and type of
structures, other property and assets owned, livestock size, details of losses of assets to the project, etc.
These surveys shall be designed to ensure that only genuine persons are classified as project affected and
the scope for frauds /misrepresentations and opportunistic attempts to seek assistance is negated. The
extent of impact on Common Property Resources shall also be covered during these surveys. In addition,
individuals and group consultations would be carried out to understand the needs and concerns of PAPs
about various issues such as compensation, assistance, resettlement options, alternative options, value
addition to the project etc.
The census shall enable the identification of vulnerable PAPs, and families that would be suitably
identified as titleholders and non-titleholders. The socio-economic conditions of PAP and type and extent
of impact would be worked out in order to prepare the Resettlement Action Plan. The RAP would broadly
include project description, methodology adopted, minimization of adverse impacts, impact assessment,
socio-economic profile of the area, R&R Policy provisions, legal framework and land required for various
purposes of the project, consultations during the implementation, institutional arrangements,
implementation schedule, estimated budget for RAP as well as monitoring and evaluation arrangements,
disclosure etc.
1.3.1.23 Identification of vulnerable PAPs
The project provides for targeted support / assistance to the vulnerable groups. The vulnerability shall be
assessed by the PCMU based on the census of the affected persons. The following categories of Project
Affected Persons shall be entitled for support as vulnerable groups:
• BPL households (with a valid proof), as per the State poverty line for rural areas;
• BPL households without a proof of the same and belonging to the following social categories:
– Women headed households with women as sole earner
– Scheduled Caste/Scheduled Tribe and
– Physically Challenged person, and is subject to any of the following impacts;
○ Loses more than 10 percent of the total land holding11;
○ Loses shelter; and
○ Loses source of livelihood.
1.3.1.24 Integrating R&R issues in Detailed Project Report (DPR)
To ensure that the designs for the project are sensitive to social issues and have incorporated the social
considerations, the following information shall be documented as part of the DPR prior to submission for
approval:
• Proceedings of the formal consultation (meeting) with the communities,
• Census questionnaires of the PAPs, and
• List of Entitled Persons who will be eligible for support.
11 The total land holding includes any other land parcels owned elsewhere by the PAP

106
[Title]
1.3.1.25 Dissemination of process of land transfer
The process to be adopted for land transfer will include dissemination of project details such as details of
the sites, cost, likely construction schedule, list of PAPs along with entitlements and entitled persons shall
be disseminated. The information would be disseminated through posters, pamphlets displayed at the
Gram Panchayat office or other prominent places such as school, shop, Chaupal, primary health centre
etc.
6.8 Mechanisms for Obtaining Land for Project Activities
6.8.1 Land Donation
In districts where land donation is the approach for land availability, the following procedure and
principles shall be applied.
Due diligence shall be carried out to ascertain category of the land, name of the actual land owner as per
land records, obtain proof of the ownership and ensure that land donated for the project is not more than
10 percent of total land owned by the donor or the residual land is viable. The process and screening
mechanism for the same have been detailed out in section on SMF.
• A Civil Society support mechanism (PRI /Community /CBO /FPO) will assist the affected households in
transferring land and ensuring that entitlements are received as agreed during the process.
• The willingness of the land owner for transfer of land through donation shall be assessed during
consultations and if required, supports through PRI and community shall be taken to explain the
advantages and disadvantages of the proposed project intervention, particularly among women and
other vulnerable population.
• The land donation process will be adopted as per the procedures laid down in the R&R Policy of the
State. The steps to be followed for land donation process shall be:
i. Disseminate the important project information to the community;
ii. Conduct transect walk along with the representatives from the community, revenue department,
CBOs /FPOs to identify the locations requiring additional land, land owners, assets likely to be
impacted;
iii. Conduct survey of the affected households identified during transect walk using the format
provided at Appendix K
iv. Conduct consultation with the affected households and explain the land donation procedure;
v. Execute Memorandum of Understanding (MoU) with the affected households as per the format
provided in Appendix L
vi. Ensure that commencement of civil works in the donated land starts only after the MoU is signed
and registration is complete
vii. Maintain records on land donation including the agreement with donors.
viii. Ensure no coercion to elicit land donation and the District team / PIU will be responsible to verify
and ensure that there is no force donation.
6.8.2 Lease /Rent of Land Parcels
In case, there is a requirement of land /property /building to be taken on lease /rental basis, a rental deed
shall be executed on a stamp paper between land owner and concerned stakeholder as per the
specifications of the Maharashtra state land rules.

107
[Title]
6.8.3 Government Land
The procedure for inter departmental transfer of land should be followed through the concerned PIUs.
The land alienation proposal will be initiated by the Deputy Commissioner based on the land requisition
proposal. A certificate from the circle officer of the concerned revenue circle with details of the land (Patta
no. etc.) should be obtained along with the proposal for all the sub-projects submitted under SMART by
the PIUs /DIUs. A due diligence exercise shall be carried out to ascertain presence of any squatter or
encroacher in the required land area for each sub-project site initiation of activity. The process for
obtaining government land shall be as follows:
• Screening of the land ownership status: The PIU /DIU shall undertake a screening exercise to confirm
the land ownership and utilisation status (refer screening checklist for land utilisation).
• Certification of Land ownership documents from the office of the respective divisional Sub-registrar
of lands and Map of the land.
• Confirmation of encumbrance free status of the land as part of the check list.
• In case of involuntary displacement due to the project, the census survey of affected households shall
be carried out (refer Appendix K).
• In case of any involuntary resettlement due to the proposed project, assistance shall be provided as
per the entitlement matrix.
6.8.4 Impact on lands involving traditional and tenurial rights:
The legal provisions at the State level pertaining to the transfer of lands will be followed. The process of
land transfer shall consider the existing customary rights of the tribal community on various categories of
land. It shall be the responsibility of the PCMU PIU /DIU along with the village level Panchayat members
to assess the impact on loss of livelihood and extent of dependence of local community on these lands
through consultations.
1.3.1.26 Impacts on Tribal and necessary framework:
The guiding principles enshrined in the constitution of independent India as also various plans and policies
safeguard the interests of scheduled tribes. The GoI has, from time to time, issued instructions to the
State governments and enacted enabling legislations and amendments to relevant existing laws. These
efforts have been made to help the state governments to sensitively deal with ST populations and the
problems they are faced on account of development projects. Also, the State governments have been
encouraged to pass suitable legislations, wherever possible, to help make necessary legal and
administrative arrangements to help the STs in specific situations. There are enough provisions and scope
already, in the existing laws to meet the objectives of Environment and Social Management Framework
regarding the Scheduled Tribes. However, in order to tie these in with the SMART activities at different
project stages, Resettlement Planning exclusive to the tribal community is to be developed. The
Resettlement Plan for Tribes must be developed to ensure that there is enough planning and
implementation that safeguard the interests of the tribes. This shall take care of the customary systems
of decision making and participation in project planning and implementation. This Resettlement Plan of
the Tribal community will be applicable in areas inhabited by Scheduled Tribes.
6.8.5 Land Compensation and Entitlements
Wherever Land Acquisition is involved in the projects, compensation for the land and related R&R to the
PAPs will be made as per the provisions of the Right to fair Compensation and Transparency in Land
Acquisition, Rehabilitation and Resettlement Act, 2013 (RFCTLARR 2013). The District Administration /
concerned authorities will carry out private land acquisition and R&R implementation based on the

108
[Title]
provisions of RFCTLARR Act, 2013. The project affected assigned land owners will be treated like the
project affected land-owners, as per the state’s policy on land acquisition.
The need for resettlement and rehabilitation arises when the land which is acquired or alienated or
transferred results in involuntary displacement and/or loss of livelihood, sources of income and access to
common properties/resources on which people depend for economic, social and cultural needs
irrespective of their legal status. Though the squatters and encroachers are not entitled to legal
compensation for land that they have occupied, this policy will provide for resettlement and rehabilitation
of such persons with the aim of improving their standard of living. This policy will also be applicable to
those landowners from whom land would be acquired. In case of those affected families living in the lands
reserved under Development Plans with or without approval of construction of structures will also be
assisted for resettlement and rehabilitation as per the Entitlement Framework in this RF.
1.3.1.27 Use of Government Lands
Very often, the lands belonging to other land-owning departments are required to be used for various
facilities to be proposed. Generally, necessary permissions and approvals for land alienation take a long
time. In case of all Government lands, obtaining “‘Enter only upon Permission” from land owning agencies
or other authorities concerned, prior to contract award is a pre-requisite and the land alienation or
conditions for the same must be completed as soon as possible and prior to commencement of
construction in those respective facilities / sites.
The entitlement for different categories of impacts is explained in the following entitlement matrix. The
principles of the entitlement matrix are in accordance with the RFCTLARR, 2013 and the Safeguards on
Involuntary Resettlement (OP 4.12) and Indigenous People (OP 4.10) of World Bank. An entitlement
matrix provides the entitlements for different impact categories in the following order. Definition forming
the basis for entitlement matrix is placed at Appendix H.
Impact to title holders which covers:
• Loss of Land
• Loss of Residential Structures
• Loss of commercial structures
• Impact to tenants and leaseholders a. residential b. commercial
• Impacts to non-title holders
• Residential squatters
• Commercial squatters
• Encroachers
• Impacts to trees, plants and standing crops
• Loss of Livelihoods
• Employers in shops, agricultural labourer’s, sharecroppers etc.,
• Impacts to Vulnerable Households
• Impacts to Community Assets
• Temporary impacts
• Unidentified impacts

109
[Title]
1.3.1.28 Entitlement for Project Affected Persons (PAPs)
The entitlement for different categories of impacts is explained in the following entitlement matrix. The
principles of the entitlement matrix are in accordance with the RTFCTLARR, and World Bank’s Operational
Policy (OP) 4.12 on Land Acquisition. The entitlement matrix presents the entitlements for different
impact categories in the following order:
• Impact to title holders which covers
i. Loss of Land
ii. Loss of Residential Structures
iii. Loss of commercial structures
iv. Impact to tenants and leaseholders
v. Residential
vi. Commercial
vii. Impacts to trees, plants and standing crops
viii. Impacts to non-title holders
ix. Loss of Livelihoods (Permanent loss and Temporary disruption to income)
x. Employers in shops, agricultural labourer, sharecroppers etc.,
xi. Impacts to Vulnerable Households
xii. Impacts to Community Assets
xiii. Unidentified impacts
6.8.6 Entitlement Framework
The RPF and the EM developed for SMART is based on the World Bank’s Policy on Involuntary
Resettlement OP/BP 4.12. The entitlement matrix (Refer Table 49) presents the parameters for
resettlement benefits, based on potential losses to squatters and encroachers. The entitlements may be
enhanced, if required, to reflect the subproject status during project implementation. Table 49:
Entitlement Matrix
Type of Loss Nature of lost
property Entitled Person Entitlement provisions
Loss of
Government
Land
Agricultural and
homestead Land Encroachers 60 days advance notice to shift from encroached land.
Squatters 60 days advance notice to shift from occupied land.
Loss of residential
structure Residential
structure Tenants displaced 60 days advance notice to shift from Occupied structure.
Replacement value of the structure and other assets (or part of
the structure and other assets, if remainder is viable)
constructed by the tenant.
Right to salvage materials (of the portion constructed by
tenants) from structure and other assets.
Squatters displaced 60 days advance notice to shift from Occupied structure.
Replacement cost of structure constructed by the squatter.
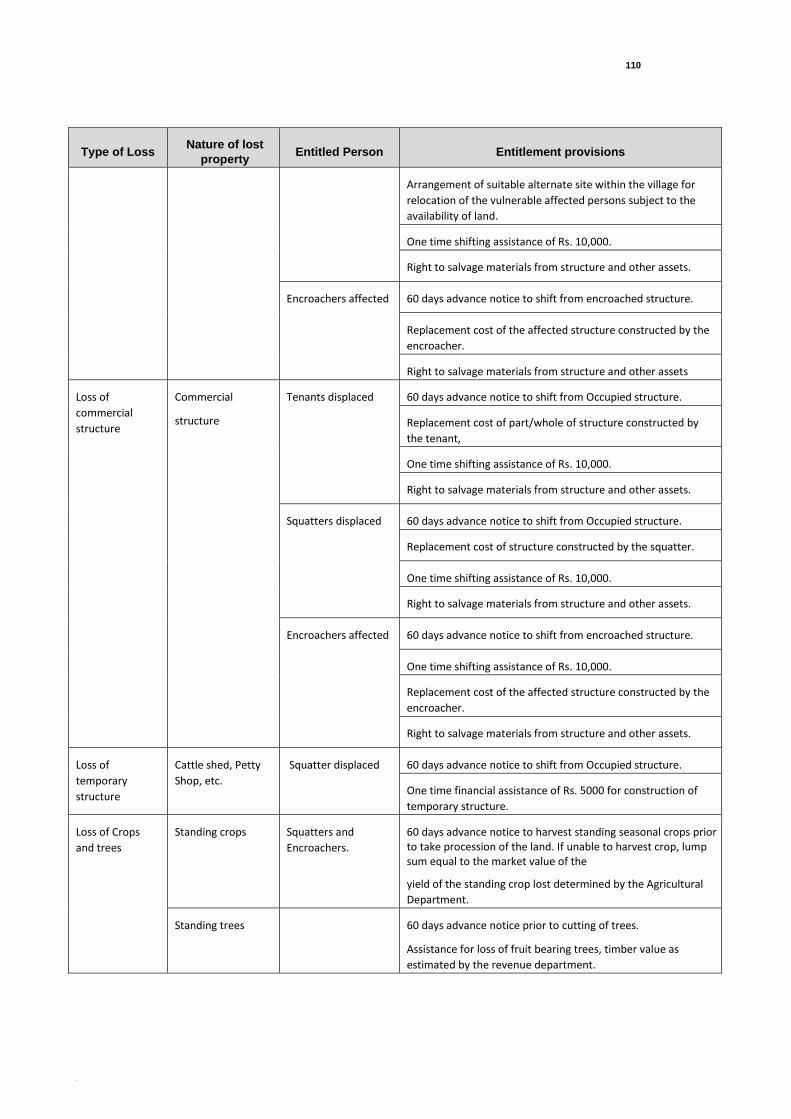
110
[Title]
Type of Loss Nature of lost
property Entitled Person Entitlement provisions
Arrangement of suitable alternate site within the village for
relocation of the vulnerable affected persons subject to the
availability of land.
One time shifting assistance of Rs. 10,000.
Right to salvage materials from structure and other assets.
Encroachers affected 60 days advance notice to shift from encroached structure.
Replacement cost of the affected structure constructed by the
encroacher.
Right to salvage materials from structure and other assets
Loss of
commercial
structure
Commercial
structure
Tenants displaced 60 days advance notice to shift from Occupied structure.
Replacement cost of part/whole of structure constructed by
the tenant,
One time shifting assistance of Rs. 10,000.
Right to salvage materials from structure and other assets.
Squatters displaced 60 days advance notice to shift from Occupied structure.
Replacement cost of structure constructed by the squatter.
One time shifting assistance of Rs. 10,000.
Right to salvage materials from structure and other assets.
Encroachers affected 60 days advance notice to shift from encroached structure.
One time shifting assistance of Rs. 10,000.
Replacement cost of the affected structure constructed by the
encroacher.
Right to salvage materials from structure and other assets.
Loss of
temporary
structure
Cattle shed, Petty
Shop, etc. Squatter displaced 60 days advance notice to shift from Occupied structure.
One time financial assistance of Rs. 5000 for construction of
temporary structure.
Loss of Crops
and trees Standing crops Squatters and
Encroachers. 60 days advance notice to harvest standing seasonal crops prior to take procession of the land. If unable to harvest crop, lump sum equal to the market value of the
yield of the standing crop lost determined by the Agricultural
Department.
Standing trees 60 days advance notice prior to cutting of trees.
Assistance for loss of fruit bearing trees, timber value as
estimated by the revenue department.

111
[Title]
Type of Loss Nature of lost
property Entitled Person Entitlement provisions
Impacts on
vulnerable
Households
All impacts Major12 impacted
Vulnerable
households13
One time lump sum assistance of Rs. 10,000 to vulnerable
households. This will be paid in addition to other assistances.
Provision of skill development trainings based on their
eligibility.
Engagement in the project activities based on the eligibility
criteria of the project.
Impact to SC and
ST in Scheduled
area
Schedule Caste /
Scheduled Tribe All SC / ST displaced
households Additional assistance to SC/ST households from scheduled areas will receive onetime payment of Rs.
10,000 if they have to relocate due to the project
Temporary loss of
land Land temporarily
required for
subproject
construction
activities
Affected Household
Assistance for assets lost at replacement value.
Restoration of land to previous or better quality.
Loss of
common
resources
Common
properties like
pond, well, etc.
Community Replacement value excluding depreciation of the affected
community facilities
Any other loss
not identified - - Unanticipated impacts to be documented and mitigated based
on the principles of the Resettlement Policy Framework.
Note: Cost of the structures shall be estimated as per the current year’s Schedule of Rates of PWD, Building, Government of
Maharashtra.
6.8.7 Monitoring
Regular monitoring of land requirement and adverse impact on social or IR will be undertaken by the
independent M& E agency hired by SMART. A quarterly M & E Report shall be submitted to the World
Bank by the SMART PCMU. Social Specialist, PCMU will take corrective actions, if necessary, based on
the findings of the external monitoring reports.
6.9 Budget Provisions
The Resettlement Action Plan will include an itemized budget and an implementation schedule. Suitable
provisions will be made in the Project budget for these purposes.
6.9.1 Disclosure of Resettlement Policy and other Project Documents
The Resettlement and Rehabilitation Policy, Resettlement Action Plan and other project related document
/ relevant information shall be translated in local language and notified through the State Government
/PCMU. The list of eligible people for benefit and disbursement of benefits shall be separately disclosed
12 Major impacts are defined as involving affected people being physically displaced from housing and/or having 10% or more of
their productive, income generating assets lost.
13 The group of people considered “vulnerable” comprise – (i) those who are BPL card holders issued by GoM), (ii) those who belong
to SC or ST communities, (iii) women headed households, (iv) elderly (female above 58 years and male above 60 years), (v) differently
abled persons and (vi) landless.
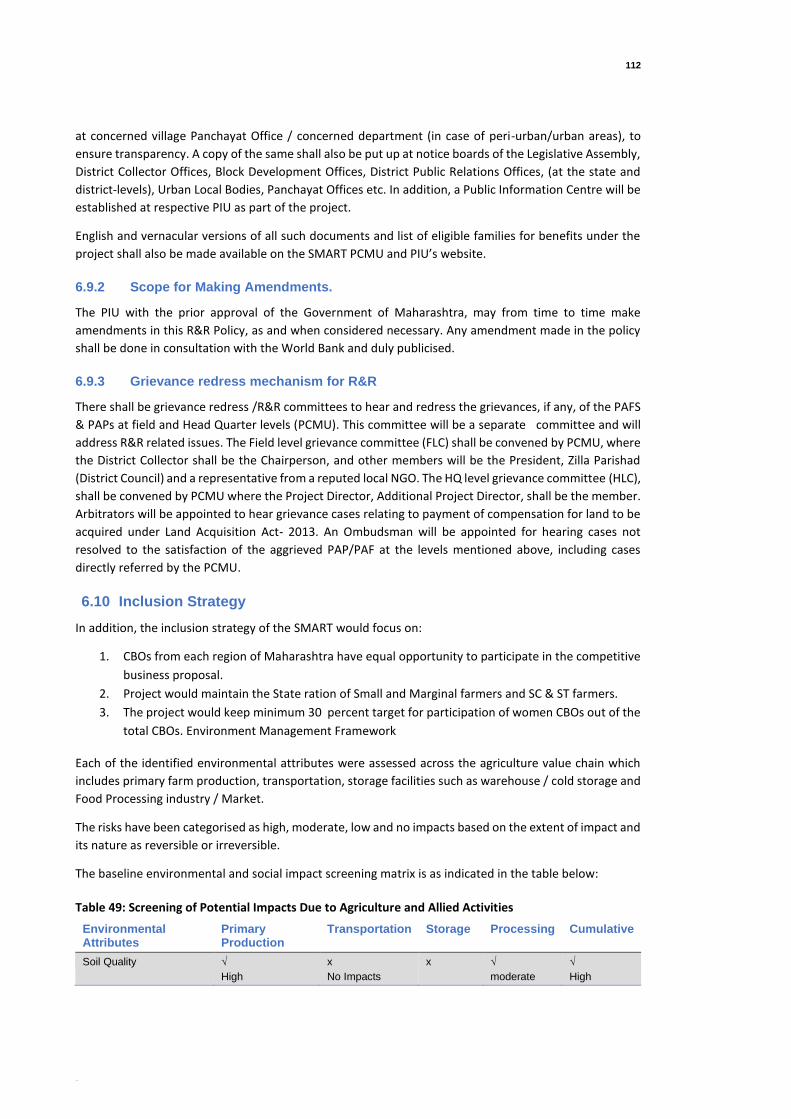
112
[Title]
at concerned village Panchayat Office / concerned department (in case of peri-urban/urban areas), to
ensure transparency. A copy of the same shall also be put up at notice boards of the Legislative Assembly,
District Collector Offices, Block Development Offices, District Public Relations Offices, (at the state and
district-levels), Urban Local Bodies, Panchayat Offices etc. In addition, a Public Information Centre will be
established at respective PIU as part of the project.
English and vernacular versions of all such documents and list of eligible families for benefits under the
project shall also be made available on the SMART PCMU and PIU’s website.
6.9.2 Scope for Making Amendments.
The PIU with the prior approval of the Government of Maharashtra, may from time to time make
amendments in this R&R Policy, as and when considered necessary. Any amendment made in the policy
shall be done in consultation with the World Bank and duly publicised.
6.9.3 Grievance redress mechanism for R&R
There shall be grievance redress /R&R committees to hear and redress the grievances, if any, of the PAFS
& PAPs at field and Head Quarter levels (PCMU). This committee will be a separate committee and will
address R&R related issues. The Field level grievance committee (FLC) shall be convened by PCMU, where
the District Collector shall be the Chairperson, and other members will be the President, Zilla Parishad
(District Council) and a representative from a reputed local NGO. The HQ level grievance committee (HLC),
shall be convened by PCMU where the Project Director, Additional Project Director, shall be the member.
Arbitrators will be appointed to hear grievance cases relating to payment of compensation for land to be
acquired under Land Acquisition Act- 2013. An Ombudsman will be appointed for hearing cases not
resolved to the satisfaction of the aggrieved PAP/PAF at the levels mentioned above, including cases
directly referred by the PCMU.
6.10 Inclusion Strategy
In addition, the inclusion strategy of the SMART would focus on:
1. CBOs from each region of Maharashtra have equal opportunity to participate in the competitive
business proposal.
2. Project would maintain the State ration of Small and Marginal farmers and SC & ST farmers.
3. The project would keep minimum 30 percent target for participation of women CBOs out of the
total CBOs. Environment Management Framework
Each of the identified environmental attributes were assessed across the agriculture value chain which
includes primary farm production, transportation, storage facilities such as warehouse / cold storage and
Food Processing industry / Market.
The risks have been categorised as high, moderate, low and no impacts based on the extent of impact and
its nature as reversible or irreversible.
The baseline environmental and social impact screening matrix is as indicated in the table below:
Table 49: Screening of Potential Impacts Due to Agriculture and Allied Activities
Environmental Attributes
Primary Production
Transportation Storage Processing Cumulative
Soil Quality √
High
x
No Impacts
x √
moderate
√
High

113
[Title]
Environmental Attributes
Primary Production
Transportation Storage Processing Cumulative
No Impacts
Water Quality √
High
x
No Impacts
x
No Impacts
√
high
√
High
Air Quality √
moderate
√
High
√
Low
√
moderate
√
Moderate
Noise Quality √
Low
√
Low
x
No Impacts
√
moderate
√
Moderate
Bio diversity and Natural Habitat
√
Moderate
x
No Impacts
x
No Impacts
x
No Impacts
√
Moderate
Farmer Health and Safety √
Moderate
√
Low
√
Low
√
Low
√
Low
Consumer Health and Safety
√
No impacts
x
No Impacts
√
Low
√
Low
√
Low
Cultural Heritage x
No Impacts
x
No Impacts
x
No Impacts
x
No Impacts
x
No Impacts
Source: MM Analysis
Each of the impacts identified during the screening stage are discussed in brief in the impact assessment
section.
6.10.1 Potential Environmental Impact Assessment in Current Practices
6.10.1.1 Soil Quality Impact
Environmental impacts on soil quality identified during the study are as follows:
● Survey reveals that only 45 – 50 percent farmers were having soil health cards. In the absence of
knowledge on soil health, there is possibility that farmers intent to use excessive fertilizers. This can
result in negative impact on soil quality.
● About 80 – 85 percent of farmers surveyed had indicated that they had received training on usage of
pesticides. However, since not all farmers were trained, there is a possibility of contamination of soil
and farm products due to pesticides and agrochemical residues.
● 40 percent farmers have indicated that they were aware of biofertilizers and biopesticides. The use of
chemical pesticides and agrochemicals prevails especially in horticulture and cotton farming segments.
Farmers have indicated that the price of bio pesticides and fertilizers are high and hence they can’t
afford to use them.
6.10.1.2 Solid Waste generation and Land Pollution
Environmental impacts on land use due to solid waste generation identified during the study are as
follows:
● Food processing industry generates solid waste in the form of vegetable and fruit waste such as seeds,
skin etc and related. It was informed during the survey by two food processing industries out of two
industries sampled that organic fraction is mostly composted. However, no proper mechanism for
waste collection and scientific processing exist.

114
[Title]
● Nine fruit and vegetable markets were surveyed and seven out of nine were observed to have no
proper mechanism of solid waste collection, segregation and scientific processing.
● Empty containers of chemical fertilizers, pesticides and other agrochemicals are hazardous, and the
farmers are not fully aware of the impact. Farmers has responded that they just throw away the
containers.
● Solid waste will be generated during the civil construction activities for any proposed expansion of
CBOs / Warehouses / Cold storages during the project implementation stage.
6.10.1.3 Potential Water Quality Impacts
Environmental impacts on the water quality identified during the study are as follows:
● Ground water and surface water quality can be impacted if the fertilizers and pesticides are not used
in correct dosage and at proper time and specified mode of application. Since there is no infrastructure
intervention, regulation and monitoring of excess utilisation of fertilisers so there are chances of
contamination
● Effluent is also generated from food processing industry in the form of effluent due to cleaning of raw
materials, washing of utensils and boiler blow down if applicable. Two food processing industries
were consulted. Both the industries have responded that the effluent generated is treated along
with sewage in septic tank.
6.10.1.4 Air Quality Impacts
Environmental impact on air quality identified during the study are as follows:
● In the absence of knowledge on soil quality, there are chances of excessive fertilizer usage by farmers.
This can result in emission of N2O from agriculture fields with high amount of nitrogenous fertilizers.
● Burning of crop residue can result in emission of harmful pollutants such as CO2, NOx, SO2, CO, CH4 to
atmosphere resulting in deterioration of air quality.
● Air quality is impacted due to emission of NOx and particulate matter from vehicles used for
transportation of farm produce.
● Air Emission from food processing industry due to burning of fuel in boiler, operation of D.G sets or
usage of fuel for other processes.
● Methane is emitted due to microbial fermentation of feed in the digestive track of goat and sheep,
cows and buffaloes.
● Air quality is also impacted due to usage of construction machineries during construction of new
warehouse / cold storage/ expansion activities.
6.10.1.5 Noise quality impacts
Impact on noise quality identified during the study are as follows:
● Noise quality impact during construction stage of warehouse or other facilities due to operation of
machineries.
● Noise pollution due to operation of D.G sets from warehouse, markets and retails.
● Noise pollution due to operation of equipment in the food processing industries.
6.10.1.6 Impact on Ecological and Living Organisms
Impact on biodiversity and natural habitat identified during the study are as follows:

115
[Title]
● Chemical pesticides if not proven for the target pest can be harmful to other organism dwelling in the
farm lands.
● Chemical fertilizers and pesticides if used just prior to sudden rain fall can result in run-off causing
impact on the aquatic ecosystem.
● The survey indicates that farmers are made aware of the integrated pest management system and
usage of biological measures of pest control. Farmers are using biopesticides such as neem oil, sticky
traps to control pest and use big red ants to control seed borer attack. However, the survey also
indicates use of chemical pesticides by farmers and names of some of the pesticide revelled to have
been in use are Phorate, Zineb, Malathion, Confidor, Karate, Kocide, DDT, Monocrotophos,
carbofurans, ridomil, blue copper Z-78, Dithane M-45. Out of these Phorate, DDT and Monocrotophos
are classified as class I insecticide by WHO.
● During the survey it was also revealed that goat and sheep rearing farmers do take their livestock to
forest for grazing.
6.10.1.7 Potential Health and Safety Impacts on Farmers
Impact on farmers health and safety identified during the study are as follows:
● Safety issued due to injury caused to the farmers and agricultural labours due to usage of farm
machineries, hand tools, and other sources such as snake bites, insects bites, falls etc.
● Health impacts due to usage of chemical pesticides and fertilizers without adequate personal
protection equipment as indicated for their safe usage.
● Health and safety impacts were also identified for labourers involved in food processing industry,
warehouse, cold storage, market due to inadequate usage of personal protection equipment.
6.10.1.8 Health and Safety of Consumers
Impact on the consumer health identified during the study are as follows:
● Consumer health is impacted due to residue of pesticide and agrochemical left in the food grains
beyond the Maximum Residue Level (MRL). Neither the CBOs nor the markets and processing units
surveyed were having facility for testing of MRL.
● Stakeholder survey with Pune Residue Testing laboratory revealed that there are only two government
pesticide testing laboratories in Maharashtra, and they detect only the presence of pesticide and not
its quantity and further testing is done only for organic commodities and not for regular commodities.
● Processed food can also include additives more than the permitted limits that can impact the health
of the consumers and there is no regular monitoring or testing of the additives.
6.10.2 Greenhouse Gas Emission Analysis
In response to terms of reference, greenhouse gas emission analysis has been conducted for six agreed
commodities. These commodities include Cotton, Turmeric, Soybean, Okra, Banana and Goat Rearing.
SMART has prepared detailed project report for these commodities and GHG emission estimation has
been done using Ex-ACT Value Chain tool developed by Food and Agriculture Organisation of the United
Nations. The methodology and tool used is explained below.

116
[Title]
6.10.2.1 EX-ACT VC tool
EX-ACT VC is a tool derived from EX-ACT (EX-Ante Carbon-balance Tool), developed by FAO in 2009. EX-
ACT VC is processing and transportation framework of 8 Excel modules that provides appraisal of crop and
livestock-based value chain in developing countries on GHGs emissions.
The EX-ACT VC aims at helping designing performance and identify areas to improve the value chain
performance. The methodology provides here an environmental carbon-balance appraisal of the value
chain impact, in terms of climate mitigation, adaptation and value chain resilience:
● The impact on climate mitigation is reflected through quantitative indicators, derived directly from
the EX-ACT tool. These indicators are used to obtain and analyse the mitigation impacts in terms of
tCO2-e of the project. The carbon footprint of the product is calculated for the whole value chain and
at different stages, aiming at analysing the environmental performance of the chain. The equivalent
economic return is also determined and could be an important aspect to be considered when
attempting, for example, accessing payments for environmental services.
● Value chain resilience is assessed using simple quantitative and qualitative indicators. Adaptation
indicators measure the reduction of vulnerability of people, livelihoods and ecosystems to Climate
Change.
The carbon-balance is defined as the net balance from all GHGs expressed in carbon dioxide (CO2)
equivalents that is emitted or sequestered due to project implementation as compared to a business-as-
usual scenario.
EX-ACT is a land-based accounting system, estimating carbon (C) stock changes (i.e. emissions or sinks of
CO2) as well as GHG emissions per unit of land, expressed in equivalent MT of CO2 per hectare per year.
The tool helps project designers to estimate and prioritize project activities with high benefits in economic
and climate change mitigation terms. The amount of GHG mitigation may also be used as part of economic
analysis as well as for the application for funding additional project components.
EX-ACT has been developed using mostly the Intergovernmental Panel on Climate Change 2006 Guidelines
for National Greenhouse Gas Inventories (IPCC, 2006) that furnishes EX-ACT with recognized default
values for emission factors and carbon values, the so-called Tier 1 level of precision. Besides, EX-ACT is
based upon chapter 8 of the Fourth Assessment Report from working group III of the IPCC (Smith, et al.,
2007) for specific mitigation options not covered in the IPCC (2006).
The GHG analysis is explained in summarising the project boundary of each commodity, assumptions of
interventions, results.
6.10.3 Cotton Value Chain
Item Description Other Assumption
Project Budget USD 291,571
Duration of project 7 years from 2019
Area of cultivation 9,000 Ha in current scenario
9,000 Ha in upgrading scenario
Water saving will be result from
measure of soil moisture
conservation by promotion, training
and capacity building. It is
envisaged that 10 percent of water
would be saved in the upgrading
scenario.
Water Consumption at Farm level
16 m3/year in current scenario
14.4 m3/ year in upgrading scenario
Water saving will be result from
measure of soil moisture

117
[Title]
Item Description Other Assumption
conservation by promotion, training
and capacity building.
Fertiliser use
Urea 200 kg/ha/year in current scenario
180 kg/ha/year in upgrading
scenario
Promotion of INM and organic
fertilisers. SMART has envisioned
achievement of input reduction by
10 percent through imparting
training on INM, precision farming
practices, etc..
Diammonium Phosphate
125 kg/ha/year in current scenario
112.5 kg/ha/year in upgrading
scenario
Promotion of INM and organic
fertilisers. SMART has envisioned of
input reduction by 10 percent.
Muriate of Potash (MOP)
100 kg/ha/year in current scenario
90 kg/ha/year in upgrading scenario
Promotion of INM and organic
fertilisers. SMART has envisioned of
input reduction by 10 percent.
Single superphosphate (SSP)
200 kg/ha/year in current scenario
180 kg/ha/year in upgrading
scenario
Promotion of INM and organic
fertilisers. SMART has envisioned of
input reduction by 10 percent.
NPK
200 kg/ha/year in current scenario
180 kg/ha/year in upgrading
scenario
Promotion of INM and organic
fertilisers. SMART has envisioned of
input reduction by 10 percent.
Pesticides
Herbicides (kg of active ingredient
per year)
9947.5 kg/year in current scenario
8952.75 kg/year in upgraded
scenario
Promotion of precision farming
practices and training can capacity
building. SMART has envisioned of
input reduction by 10 percent.
Insecticides (kg of active ingredient
per year)
500 kg/year in current scenario
450 kg/year kg/year in upgrading
scenario
Promotion of precision farming
practices and training can capacity
building. SMART has envisioned of
input reduction by 10 percent.
Fungicides (kg of active ingredient
per year)
Nil
Energy consumption at Processing
level
Energy Consumption for processing
per MT of production
373 kWh per MT of production
current scenario
335.7 in upgrading scenario
The project will promote energy
efficient equipment, machineries
and vehicles. SMART has
envisioned of improvement of
efficiency by 10 percent.
Energy Consumption at Storage Nil
Consumable input in units per MT of
processed production
Transportation
Farm to Processing/ Storage
distance in Kms
20 km No improvement in losses during
transportation is envisioned
Storage to Wholesale distance in
Kms
600 km No improvement in losses during
transportation is envisioned
6.10.3.1 Results
Climate Mitigation dimension of the Value Chain Current Upgrading Balance
GHG impact (tCO2-e per year) 2,156,869 1,978,593 -178,276

118
[Title]
Climate Mitigation dimension of the Value Chain Current Upgrading Balance
GHG impact (tCO2-e per year per hectare) 239.7 219.8 -19.8
Carbon footprint of production (tCO2-e per tonne of product) 266.1 199.7 -66.4
e2-e [emitted (+) / reduced or avoided (-)] -178,276
Annual tCO2-e from renewable energy 0
Equivalent project cost per tonne of CO2-e reduced or avoided (in US$
on 20 years) 0
Equivalent value of mitigation impact per year (US$ 30/tCO2-e) 5,348,289
Equivalent value of mitigation impact per year per Ha (US$ 30/tCO2-e
per year per Ha) 594
Carbon footprint at the different levels of the Cotton Value Chain are given below.
Carbon footprint at the different levels of the Value Chain
tCO2-e per tonne of product Balance
Current Upgrading
PRODUCTION 266.11 199.70 -66.42
PROCESSING 0.38 0.34 -0.04
TRANSPORT 0.11 0.11 0.00
TOTAL 266.61 200.15 -66.46
Cotton : Over all GHG emission in current scenario
and upgraded Scenario
Cotton : Production level GHG emission in
current scenario and upgraded Scenario

119
[Title]
Cotton : Processing level GHG emission in current
scenario and upgraded Scenario
Cotton : Transportation level GHG emission in
current scenario and upgraded Scenario
6.10.4 Turmeric Value Chain
Item Description Other Assumption
Project Budget USD 786,429
Duration of project 5 years from 2019
Area of cultivation 280 Ha in current scenario
280 Ha in upgrading scenario
The area of the project will remain
same in the upgraded scenario as
there is no addition of area
envisaged to increase the
productivity.
Water Consumption at Farm level 12000 cubic meter in current
scenario
10800 cubic meter in upgraded
scenario
Water saving will be result from
measure of soil moisture
conservation by promotion, training
and capacity building.
Energy Consumption at production
level (Consumption of Diesel)
3410 m3/year in current scenario
3069 m3/ year in upgrading scenario
The project will promote energy
efficient equipment, machineries
and vehicles. SMART has
envisioned of improvement of
energy efficiency by 10 percent.
Fertiliser use
Urea 122.4 kg/ha/year in current scenario
110.16 kg/ha/year in upgrading
scenario
Promotion of INM and organic
fertilisers. SMART has envisioned of
input reduction by 10 percent.
Compost
12,000 kg/ha/year in current
scenario
13,600 kg/ha/year in upgrading
scenario
Promotion of INM and organic
fertilisers. SMART has envisioned of
input reduction by 10 percent.
Muriate of Potash (MOP)
302 kg/ha/year in current scenario
272.16 kg/ha/year in upgrading
scenario
Promotion of INM and organic
fertilisers. SMART has envisioned of
input reduction by 10 percent.
Single superphosphate (SSP)
48 kg/ha/year in current scenario
43.2 kg/ha/year in upgrading
scenario
Promotion of INM and organic
fertilisers. SMART has envisioned of
input reduction by 10 percent.
Pesticides
Herbicides (kg of active ingredient
per year)
Nil
Insecticides (kg of active ingredient
per year)
2.652 in current scenario
2.386 in upgraded scenario
Promotion of precision farming
practices and training and capacity
building.
Fungicides (kg of active ingredient
per year)
3.72 in current scenario
3.35 in upgrading scenario
Promotion of precision farming
practices and training and capacity
building.
Energy consumption at
Processing level
Energy Consumption for processing
per MT of production
10094 cubic meter in current
scenario
9084 cubic meter in upgrading
scenario
The project will promote energy
efficient equipment, machineries
and vehicles. SMART has
envisioned of improvement of
energy efficiency by 10 percent.
Energy Consumption at Storage Nil

120
[Title]
Item Description Other Assumption
Consumable input in units per MT of
processed production
10 units per MT of processed
production
10 units per MT of processed
production
Transportation
Farm to aggregator distance in Kms 2.5 km No improvement in losses during
transportation is envisioned
Aggregator to processing and
storage location
0 km No improvement in losses during
transportation is envisioned
Processing and storage location to
Retailer
20 Km No improvement in losses during
transportation is envisioned
6.10.4.1 Results
Climate Mitigation dimension of the Value Chain Current Upgrading Balance
GHG impact (tCO2-e per year)
560,584,672 513,429,588
-
47,155,08
4
GHG impact (tCO2-e per year per hectare) 1,001,044.1 916,838.5 -84,205.5
Carbon footprint of production (tCO2-e per tonne of product) 13.0 11.8 -1.3
eCO2-e [emitted (+) / reduced or avoided (-)]
-47,155,084
Annual tCO2-e from renewable energy
0
Equivalent project cost per tonne of CO2-e reduced or avoided (in
US$ on 20 years)
1
Equivalent value of mitigation impact per year (US$ 30/tCO2-e)
899,876
Equivalent value of mitigation impact per year per Ha (US$ 30/tCO2-
e per year per Ha)
1,607
Carbon footprint at the different levels of the Turmeric Value Chain are given below.
Carbon footprint at the different levels of the Value Chain
tCO2-e per tonne of product Balance
Current Upgrading
PRODUCTION 13.02 11.76 -1.26
PROCESSING 1,308,512.59 1,177,661.34 -130,851.26
TRANSPORT 0.01 0.01 0.00
Total 1,308,525.62 1,177,673.10 -130,852.52
Turmeric : Over all GHG emission in current
scenario and upgraded Scenario
Turmeric : Production level GHG emission in
current scenario and upgraded Scenario

121
[Title]
Turmeric : Processing level GHG emission in
current scenario and upgraded Scenario
Turmeric : Transportation level GHG emission in
current scenario and upgraded Scenario
6.10.5 Soybean Value Chain
Item Description Other Assumption
Project Budget USD 1,763,871
Duration of project 5 years from 2019
Area of cultivation 20,000 Ha in current scenario
20,000 Ha in upgrading scenario
Addition of area envisaged to
increase the productivity
Yield 2 MT per ha
Percentage waste
20 percent in Current scenario
18 percent in upgrading scenario
Water Consumption at Farm level 4,000 cubic meter in current
scenario
3,600 cubic meter in upgraded
scenario
Water saving will be result from
measure of soil moisture
conservation by promotion, training
and capacity building. It is
envisaged that 10 percent will be
saved.
Energy Consumption at production
level (Consumption of Diesel)
2,00,000 m3/year in current scenario
1,80,000 m3/ year in upgrading
scenario
The project will promote energy
efficient equipment, machineries
and vehicles. SMART has
envisioned of improvement of
energy efficiency by 10 percent.
Fertiliser use
Baramati 16 137.5 kg/ha/year in current scenario
123.75 kg/ha/year in upgrading
scenario
Promotion of INM and organic
fertilisers. SMART has envisioned of
input reduction by 10 percent.
Compost
Nil kg/ha/year in current scenario
27.5 kg/ha/year in upgrading
scenario
Promotion of INM and organic
fertilisers. SMART has envisioned of
input reduction by 10 percent.
DAP
302 kg/ha/year in current scenario
272.16 kg/ha/year in upgrading
scenario
Promotion of INM and organic
fertilisers. SMART has envisioned of
input reduction by 10 percent.
Pesticides
Herbicides (kg of active ingredient
per year)
Nil

122
[Title]
Item Description Other Assumption
Insecticides (kg of active ingredient
per year)
1.45 in current scenario
1.3 in upgraded scenario
Promotion of precision farming
practices and training and capacity
building. SMART has envisioned of
input reduction by 10 percent.
Fungicides (kg of active ingredient
per year)
Nil
Energy consumption at
Processing level
Energy Consumption for processing
per MT of production
11,660 kWh in current scenario
10,494 cubic meter in upgrading
scenario
The project will promote energy
efficient equipment, machineries
and vehicles. SMART has
envisioned of improvement of
energy efficiency by 10 percent.
Energy Consumption at Storage Nil
Consumable input in units per MT of
processed production
4,00,000 jute bags in current
scenario
4,00,000 unit of jute bags in
upgrading scenario
No change in upgrading scenario
Transportation
Farm to Aggregator 10 km No improvement in losses during
transportation is envisioned
Aggregators to processing and
storage location
25 km No improvement in losses during
transportation is envisioned
Processing and storage location to
Retailer
10 Km No improvement in losses during
transportation is envisioned
6.10.5.1 Results
Climate Mitigation dimension of the Value Chain Current Upgrading Balance
GHG impact (tCO2-e per year) 516,958 463,941 -53,017
GHG impact (tCO2-e per year per hectare) 12.9 11.6 -1.3
Carbon footprint of production (tCO2-e per tonne of product) 30.2 26.6 -3.6
eCO2-e [emitted (+) / reduced or avoided (-)]
-53,017
Annual tCO2-e from renewable energy
0
Equivalent project cost per tonne of CO2-e reduced or avoided (in US$
on 20 years)
8
Equivalent value of mitigation impact per year (US$ 30/tCO2-e)
318,472
Equivalent value of mitigation impact per year per Ha (US$ 30/tCO2-e
per year per Ha)
8
Carbon footprint at the different levels of the Soybean Value Chain are given below.
Carbon footprint at the different levels of the Value Chain
tCO2-e per tonne of product Balance
Current Upgrading
PRODUCTION 30.21 26.62 -3.58
PROCESSING 6.64 6.04 -0.59
TRANSPORT 0.01 0.01 0.00
Total 36.85 32.68 -4.18

123
[Title]
Soybean : Over all GHG emission in current
scenario and upgraded Scenario
Soybean : Production level GHG emission in
current scenario and upgraded Scenario
Soybean : Processing level GHG emission in
current scenario and upgraded Scenario
Soybean : Transportation level GHG emission in
current scenario and upgraded Scenario
6.10.6 Okra Value Chain
Item Description Other Assumption
Project Budget USD 574,286
Duration of project 5 years from 2019
Area of cultivation 20 Ha in current scenario
20 Ha in upgrading scenario
The area of the project will remain
same in the upgraded scenario as
there is no promotion for area
increase.
Yield 12 MT per ha
Percentage waste
17 percent in Current scenario
16 percent in upgrading scenario
The yield will not be changed in the
upgraded scenario but there will be
saving in wastage and it is
envisioned the waste will be
reduced by 10 percent.
Water Consumption at Farm level 11,400,000 cubic meter in current
scenario
10,260,000 cubic meter in upgraded
scenario
Water saving will be result from
measure of soil moisture
conservation by promotion, training
and capacity building. It is
envisaged that 10 percent will be
saved.
Energy Consumption at production
level (Consumption of Diesel)
Nil
Fertiliser use

124
[Title]
Item Description Other Assumption
NPK 250 kg/ha/year in current scenario
225 kg/ha/year in upgrading
scenario
Promotion of INM and organic
fertilisers. SMART has envisioned of
input reduction by 10 percent.
Compost
7,500 kg/ha/year in current scenario
8,250 kg/ha/year in upgrading
scenario
Promotion of INM and organic
fertilisers. SMART has envisioned of
input reduction by 10 percent.
SSP
250 kg/ha/year in current scenario
225 kg/ha/year in upgrading
scenario
Promotion of INM and organic
fertilisers. SMART has envisioned of
input reduction by 10 percent.
Pesticides
Herbicides (kg of active ingredient
per year)
Nil
Insecticides (kg of active ingredient
per year)
1.85 in current scenario
1.67 in upgraded scenario
Promotion of precision farming
practices and training and capacity
building will result 10 percent
benefit.
Fungicides (kg of active ingredient
per year)
1.25 in current scenario
1.12 in upgraded scenario
Energy consumption at
Processing level
Energy Consumption for processing
per MT of production
Nil
Energy Consumption at Storage 24,000 kWh per day in current
scenario
21,600 kWh per day in upgrading
scenario
The project will promote energy
efficient equipment, machineries
and vehicles. SMART has
envisioned improvement of
achievement of efficiency by 10
percent.
Consumable input in units per MT of
processed production
12,000 plastic carats of 20 kg each
in current scenario
Same in upgraded scenario.
No change in upgrading scenario
Transportation
Farm to Collector 5 km No improvement in losses during
transportation is envisioned
Collectors to processing and storage
location
382 km No improvement in losses during
transportation is envisioned
Processing and storage location to
Retailer
1941 Km No improvement in losses during
transportation is envisioned
6.10.6.1 Results
Climate Mitigation dimension of the Value Chain Current Upgrading Balance
GHG impact (tCO2-e per year) 701 648 -53
GHG impact (tCO2-e per year per hectare) 35.0 32.4 -2.6
Carbon footprint of production (tCO2-e per tonne of product) 3.2 2.9 -0.3
tCO2-e [emitted (+) / reduced or avoided (-)]
-53
Annual tCO2-e from renewable energy
0

125
[Title]
Climate Mitigation dimension of the Value Chain Current Upgrading Balance
Equivalent project cost per tonne of CO2-e reduced or avoided (in US$
on 20 years)
0
Equivalent value of mitigation impact per year (US$ 30/tCO2-e)
0
Equivalent value of mitigation impact per year per Ha (US$ 30/tCO2-e
per year per Ha)
-2
Carbon footprint at the different levels of the Okra Value Chain are given below.
Carbon footprint at the different levels of the Value Chain
tCO2-e per tonne of product Balance
Current Upgrading
PRODUCTION 3.22 2.91 -0.30
PROCESSING 0.00 0.00 0.00
TRANSPORT 1.42 1.39 -0.03
Total 4.63 4.30 -0.33
Okra : Over all GHG emission in current scenario
and upgraded Scenario
Okra : Production level GHG emission in current
scenario and upgraded Scenario
Okra: No Change. Processing level GHG emission
in current scenario and upgraded Scenario
Okra : Transportation level GHG emission in
current scenario and upgraded Scenario
6.10.7 Banana Value Chain
Item Description Other Assumption
Project Budget USD 2,048,143
Duration of project 5 years from 2019

126
[Title]
Item Description Other Assumption
Area of cultivation 833 Ha in current scenario
833 Ha in upgrading scenario
The area of the project will remain
same in the upgraded scenario as
there is no promotion for area
increase.
Yield 23 MT per ha
Percentage waste
17 percent in Current scenario
15 percent in upgrading scenario
Water Consumption at Farm level 9,996 cubic meter in current
scenario
8,996 cubic meter in upgraded
scenario
Water saving will be result from
measure of soil moisture
conservation by promotion, training
and capacity building. It is
envisaged that 10 percent will be
saved.
Energy Consumption at production
level (Consumption of Diesel)
Nil
Fertiliser use
Urea 1,078 kg/ha/year in current scenario
970 kg/ha/year in upgrading
scenario
Promotion of INM and organic
fertilisers. SMART has envisioned of
input reduction by 10 percent.
Compost Nil kg/ha/year in current scenario
1,000 kg/ha/year in upgrading
scenario
Promotion of INM and organic
fertilisers. SMART has envisioned of
input reduction by 10 percent.
SSP 1,786 kg/ha/year in current scenario
1,607 kg/ha/year in upgrading
scenario
Promotion of INM and organic
fertilisers. SMART has envisioned of
input reduction by 10 percent.
MoP 1,286 kg/ha/year in current scenario
1,157 kg/ha/year in upgrading
scenario
Promotion of INM and organic
fertilisers. SMART has envisioned of
input reduction by 10 percent.
Pesticides
Herbicides (kg of active ingredient
per year)
Nil
Insecticides (kg of active ingredient
per year)
0.471 in current scenario
0.424 in upgraded scenario
Promotion of precision farming
practices and training and capacity
building will result 10 percent
benefit.
Fungicides (kg of active ingredient
per year)
Nil
Energy consumption at
Processing level
Energy Consumption for processing
per MT of production
Nil
Energy Consumption at Storage 212,962 kWh per day in current
scenario
191,665 kWh per day in upgrading
scenario
Promotion of energy efficient
equipment and energy efficient
refrigeration.
Consumable input in units per MT of
processed production
191,590 plastic bags in current
scenario
95,795 unit of plastic bags in
upgrading scenario
The reusable plastic bags will be
promoted which can be used for
three times in upgrading scenario. It
is envisioned the 50 percent saving
will happen in the plastic bags.
Transportation

127
[Title]
Item Description Other Assumption
Farm to Aggregator 50 km No improvement in losses during
transportation is envisioned
Aggregator to processing and
storage location
400 km No improvement in losses during
transportation is envisioned
Processing and storage location to
Retailer. In this case banana is
exported to Dubai from Mumbai
airport.
2000 Km No improvement in losses during
transportation is envisioned
6.10.7.1 Results
Climate Mitigation dimension of the Value Chain Current Upgrading Balance
GHG impact (tCO2-e per year) 36,765 34,128 -2,637
GHG impact (tCO2-e per year per hectare) 44.1 41.0 -3.2
Carbon footprint of production (tCO2-e per tonne of product) 1.6 1.5 -0.1
Annual tCO2-e [emitted (+) / reduced or avoided (-)] -2,637
Carbon footprint at the different levels of the Banana Value Chain are given below.
Carbon footprint at the different levels of the Value Chain
tCO2-e per tonne of product Balance
Current Upgrading
PRODUCTION 1.62 1.41 -0.14
PROCESSING 0.00 0.00 0.00
TRANSPORT 1.47 1.44 -0.03
Total 3.09 2.93 -0.17
Banana : Over all GHG emission in current
scenario and upgraded Scenario
Banana: Production level GHG emission in current
scenario and upgraded Scenario
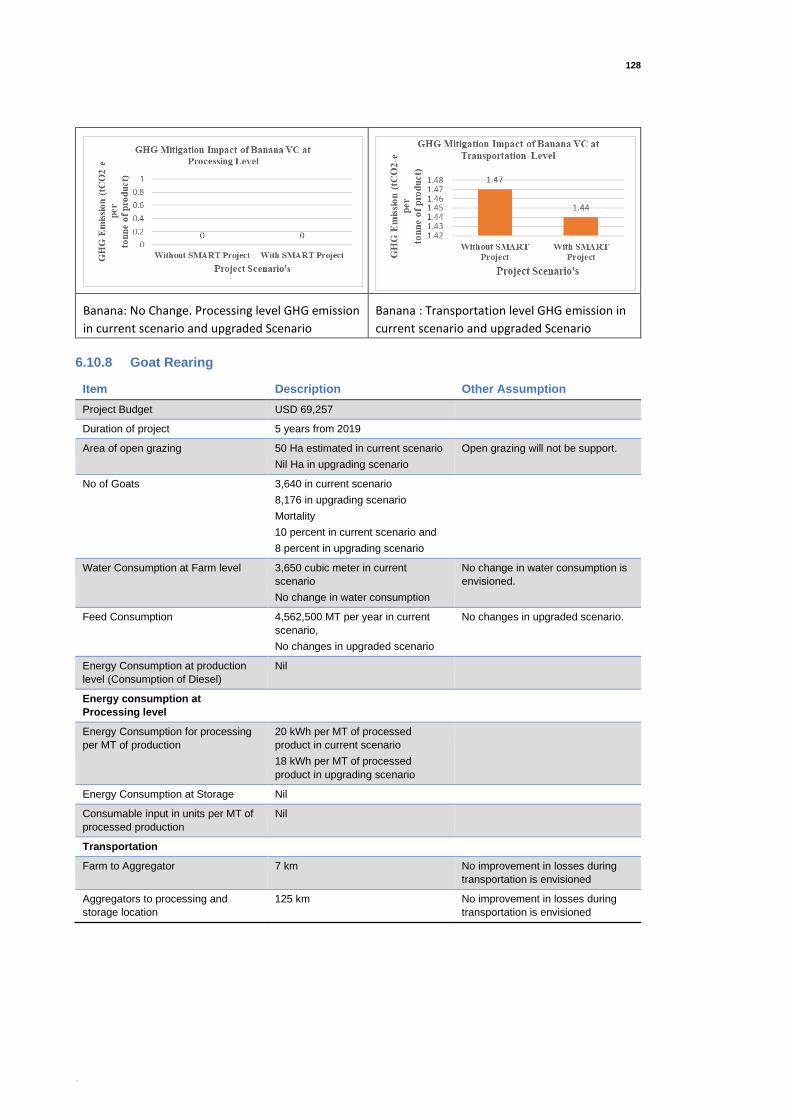
128
[Title]
Banana: No Change. Processing level GHG emission
in current scenario and upgraded Scenario
Banana : Transportation level GHG emission in
current scenario and upgraded Scenario
6.10.8 Goat Rearing
Item Description Other Assumption
Project Budget USD 69,257
Duration of project 5 years from 2019
Area of open grazing 50 Ha estimated in current scenario
Nil Ha in upgrading scenario
Open grazing will not be support.
No of Goats 3,640 in current scenario
8,176 in upgrading scenario
Mortality
10 percent in current scenario and
8 percent in upgrading scenario
Water Consumption at Farm level 3,650 cubic meter in current
scenario
No change in water consumption
No change in water consumption is
envisioned.
Feed Consumption 4,562,500 MT per year in current
scenario,
No changes in upgraded scenario
No changes in upgraded scenario.
Energy Consumption at production
level (Consumption of Diesel)
Nil
Energy consumption at
Processing level
Energy Consumption for processing
per MT of production
20 kWh per MT of processed
product in current scenario
18 kWh per MT of processed
product in upgrading scenario
Energy Consumption at Storage Nil
Consumable input in units per MT of
processed production
Nil
Transportation
Farm to Aggregator 7 km No improvement in losses during
transportation is envisioned
Aggregators to processing and
storage location
125 km No improvement in losses during
transportation is envisioned

129
[Title]
6.10.8.1 Results
Climate Mitigation dimension of the Value Chain Current Upgrading Balance
GHG impact (tCO2-e per year) 1,059 1,924 865
GHG impact (tCO2-e per year per hectare) 21.2 38.5 17.3
Carbon footprint of production (tCO2-e per tonne of product) 0.0 0.0 0.0
Annual tCO2-e [emitted (+) / reduced or avoided (-)]
865
Source: Goat Rearing GHG Emission
6.10.9 Analysis of Greenhouse Gas Emission in relation to savings in the upgrading
scenario
Table 50: GHG Emission in Relation to Saving in the Upgradation Scenario
Commodity Value Chain
Climate Mitigation dimension of the Value Chain- GHG impact (tCO2-e per year)
Carbon footprint at the different levels of the Value Chain- (tCO2-e per tonne of product)
Current Upgrading Production Processing Transportation
Current Upgrading Current Upgrading Current Upgrading
Cotton 21,56,869 19,78,593 266.1 199.70 0.38 0.34 0.11 0.11
Turmeric 5605,84,672 5134,29,588 13.02 11.76 1308512.59 1177661.
34
0.01 0.01
Soybean 5,16,958 4,63,941 30.21 26.62 6.64 6.04 0.01 0.01
Okra 35 32.4 3.22 2.91 0.00 0.00 1.42 1.39
Banana 36,765 34,128 1.62 1.48 0.00 0.00 1.47 1.44
Goat Rearing
1,059 1,924
Source: Mott MacDonald Analysis
● Out of the above six commodities, turmeric has highest saving of GHG emission, cotton has
moderate saving in unit area, while Cotton, Soybean, and Banana has moderate saving and Okra has
insignificant savings.

130
[Title]
● GHG emission from goat rearing increases due to increase of number of goats from 3640 in current
scenario to 8176 in the project scenario due to GHG emission related to fodder practices and enteric
fermentation.
● GHG emission from Okra increases mainly because organic manures are increased by 10 percent and
chemical manure is reduced by 10 percent. It is evident that nitrogenous chemical manure like urea
is a sink for CO2 while there is a positive emission due to increase of organic manure.
6.10.10 GHG Emission Reduction Strategy
● Promotion of implementation of INM, IPM and utilisation of soil health card for adequacy of moisture
content and nutrient management of soil;
● Implement water efficiency management measures to reduce water in irrigation through use of
sprinkler irrigation, conservation of water and recycling of water from ETP, rainwater harvesting etc;
● Bring improvement in equipment, machineries for energy efficiency and replace these with efficient
3-5 star rated machineries and equipment;
● Promotion of solar and renewable energy in SMART and discourage use of polluting fuel in agriculture;
and
● Measures should be adopted to post harvest losses in storage, transportation and processing.
6.10.11 Environmental Management Framework
Environmental Management framework includes mitigation measures for impacts identified in each of
the environmental aspects as discussed in the above section. The framework also indicates the value chain
where the impact has been identified and it suggest the stages at which the mitigation measure needs to
be adopted and the party responsible to undertake the mitigation measure.
Environmental Management Framework (EMF) is as indicated in the table below:

131
[Title]
Table 51: Environment Management Framework
Project Interventions
Environmental Aspect
Environmental Impacts Value Chain Mitigation Measures Monitoring Responsibility
Monitoring Frequency
Production of Agri-commodity by CBOs
Soil Quality Survey reveals that only 45
– 50 percent farmers are
having soil health cards. In
the absence of knowledge
on soil health, there is
possibility that the farmers
intent to use excessive
fertilizers. This can result in
negative impact on soil
quality.
Primary Production
● IEC material in the form of handbook and brochures shall be prepared and distributed to farmers on importance of having knowledge of soil health and correct usage of fertilizers as per the soil type and crop requirement.
● Government of India’s scheme on soil health card shall be leveraged and the project shall ensure that all the farmers of CBOs supported by SMART shall have soil health card
SMART / PIU ● Annual by SMART
● Monthly by PIU
Production of Agri-commodity by CBOs
About 80 – 85 percent of
farmers surveyed had
indicated that they have
received training on usage
of pesticides. However,
since not all farmers are
trained, there is a possibility
of contamination of soil due
to pesticides and
agrochemicals.
Primary Production
● Farmers shall be trained via Focused Group Discussion and training programmes on correct dosage, safety precautions, mode of application and timing for pesticides and other agrochemicals.
SMART / PIU ● Annual by SMART
● Monthly by PIU
Production of Agri-commodity by CBOs
40 percent farmers have
indicated that they are
aware of biofertilizers and
biopesticides. The use of
chemical pesticides and
Primary Production
● Farmers shall be trained via FGD and training Programmes on use of bio pesticides and bio fertilizers and its benefits.
● Policy level reforms are required to incentivise production of bio fertilizers and bio pesticides manufacturing units so that they are available to farmers easily at subsidized price.
SMART / PIU ● Annual by SMART
● Monthly by PIU

132
[Title]
Project Interventions
Environmental Aspect
Environmental Impacts Value Chain Mitigation Measures Monitoring Responsibility
Monitoring Frequency
agrochemicals prevails
especially in horticulture
and cotton farming
segments. Farmers have
indicated that the price of
bio pesticides and bio-
fertilizers are high and
hence they can’t afford to
use them
Processing of agri-commodity by enterprises
Solid Waste Generation and Land-use impacts
Food processing industry
generate solid waste in the
form of vegetable and fruit
waste such as seeds, skin
etc and related. It was
informed during the survey
that organic fraction is
mostly composted.
However, no proper
mechanism for waste
collection and scientific
processing exist.
Food Processing Industry
● Food Processing industry supported by the Project shall have valid consent from the Maharashtra state Pollution Control Board (MPCB).
● Installation of compost plant with support of SMART. The operation and maintenance shall be done by Food Processing Industry or private operators
● Solid waste generated shall be segregated at source and organic fraction shall be collected and composted either at individual level or at group level and other inorganic fraction shall be disposed as per the regulations based on the type of waste generated.
SMART to support village level processing industry and private operators of compost plant with grants and subsidies
PIU
● Half Yearly by SMART
● Monthly by PIU
Markets Markets surveyed were
also observed to have no
proper mechanism of solid
waste collection,
segregation and scientific
processing.
Market ● Installation of compost plant with support of SMART. The operation and maintenance shall be done by market operator or private operators
● Solid waste generated shall be segregated at source and organic fraction shall be collected and composted either at individual level or at group level and other inorganic fraction shall be
SMART to support village Markets and private operators of compost plant with grants and subsidies
PIU
● Half Yearly by SMART
● Monthly by PIU

133
[Title]
Project Interventions
Environmental Aspect
Environmental Impacts Value Chain Mitigation Measures Monitoring Responsibility
Monitoring Frequency
disposed as per the regulations based on the type of waste generated.
Slaughterhouse (Expansion and waste management)
Solid waste will be
generated due to operation
of slaughter house if there
are no proper mechanism
for waste collection,
segregation and scientific
disposal
Slaughter house
● Slaughter house to be supported by the Project shall have a valid consent from MPCB and license from FSSAI for operating the plant.
● Slaughter houses to be supported by the Project shall comply with the Good Industrial Practice for slaughter house as indicated in the report.
SMART PIU/ Slaughter house operators
● Half Yearly by SMART
● Monthly by PIU
Production of Agri-commodity by CBOs
Empty containers of
chemical fertilizers,
pesticides and other
agrochemicals are
hazardous, and the farmers
are not fully aware of the
impacts. Farmers have
responded that they just
openly dispose of the
containers.
Primary Production
● IEC material on mode of disposal of empty containers of pesticides and other agrochemicals shall be prepared and distributed to farmers.
● Empty containers shall be washed, and the washed water shall be used for dilution of same grade of pesticides and the washed empty containers shall be punctured or rendered unusable for any other purpose
● Manufacturer and suppliers should be made responsible for providing mechanism to collect the empty containers back under Extended Producer Responsibility
SMART / PIU ● Annual by SMART
● Monthly by PIU
Expansion of Agri-infrastructure viz, warehouse
Solid waste generation would be there during any civil construction activities for any proposed expansion of processing related infrastructure/ CBOs / Warehouses / Cold storages during the project implementation stage
CBOs / Warehouse / Retail
● Solid waste generated during the construction stage shall be managed as per the EMP indicated in the Construction Management Guideline included in the report
● Contractor and its employers
● PIU
● SMART
● Continuous
● Intermittent by PIU
● Quarterly by SMART
Production of Agri-commodity by CBOs
Water Quality Impact
Ground water and surface water quality can be impacted if the fertilizers and pesticides are not
Primary Production
● Farmers shall be trained via Focused Group Discussion and training programmes on correct dosage, safety precautions, mode of application
SMART / PIU ● Annual by SMART

134
[Title]
Project Interventions
Environmental Aspect
Environmental Impacts Value Chain Mitigation Measures Monitoring Responsibility
Monitoring Frequency
used in correct dosage and at proper time and mode of application. Since not all farmers have responded to obtain adequate training, there are chances of contamination
and timing for pesticides and other agrochemicals.
● Monthly by PIU
Production of Agri-commodity by CBOs
Goat and sheep shelter were not adequately clean, hygienic and drained and hence there are chances of surface water contamination
Back Yard Farming
Farmers shall be trained via FGD regarding hygienic practices and drainage requirement in goat and sheep shelter and IEC material related to this shall be distributed to farmers.
SMART / PIU ● Annual by SMART
● Monthly by PIU
Processing of agri-commodity by enterprises
Effluent is also generated from food processing industry in the form of effluent due to cleaning of raw materials, washing of utensils and boiler blow down if applicable. Food processing industries have responded that the effluent generated is treated along with sewage in septic tank
Food Processing Industry
Project shall support only those Food Processing Units that are having license from FSSAI and consent under Water Act from MPCB.
Effluent generated shall be treated and shall be monitored as per the requirements stipulated in the consent order
SMART / PIU to review compliance and Food Processing Industry to have license and consent to establish and operate.
● Half Yearly by SMART
● Monthly by PIU
Slaughterhouse (Expansion and waste management)
Effluent generation from slaughter houses if not treated properly in ETP can result in contamination of ground and surface water quality
Slaughter House
● Slaughter house to be supported by the Project shall have a valid license from FSSAI and Consent under Water Act from MPCB.
● Effluent generated shall be treated in ETP
● Good industrial practice as indicated in the report shall be complied by the Slaughter houses
SMART / PIU to monitor compliance and Slaughter House Operator to comply with requirements
● Half Yearly by SMART
● Monthly by PIU
Expansion of Agri-infrastructure viz, warehouse
Construction activity during expansion of CBOs / Warehouses / cold storages can also result in generation of waste water in the form of sewage from labour camps and run-off from construction site
CBOs / Warehouse / Retail
● Waste water generated during the construction stage shall be managed as per the EMP indicated in the Construction Management Guideline included in the report
● Contractor
● PIU
● SMART
● Continuous
● Intermittent by PIU
● Quarterly by SMART
Production of Agri-commodity by CBOs
Air Quality Impacts In the absence of knowledge on soil quality, there are chances of excessive fertilizer usage by
Primary Production
Farmers shall be trained via IEC material and FGD on correct usage of fertilizer based on soil health and crop requirement.
SMART / PIU ● Annual by SMART

135
[Title]
Project Interventions
Environmental Aspect
Environmental Impacts Value Chain Mitigation Measures Monitoring Responsibility
Monitoring Frequency
farmers. This can result in emission of N2O from heavily fertilized agriculture fields
Organic manure shall be used in combination of chemical fertilizers.
● Monthly by PIU
Production of Agri-commodity by CBOs
Burning of crop residue can result in emission of harmful pollutants such as CO2, NOx, SO2, CO, CH4 to atmosphere resulting in deterioration of air quality
Primary Production
CBOs to be supported by the Project shall ensure to reduce crop residue burning by 20 – 30 percent every 2 years.
Alternative use of crop residue shall be identified and IEC material for the same shall be prepared by SMART and distributed to farmers
SMART / PIU
CBOs to ensure compliance
● Annual by SMART
● Monthly by PIU
Transportation of Agri-commodity
Air quality is impacted due to emission of NOx and particulate matter from vehicles used for transportation of farm produce
Transportation The Project shall support only Bharath Stage IV and above compliant vehicles with valid PUC certificate to be used for transportation of farm produce
SMART / PIU ● Annual by SMART
● Monthly by PIU
Processing of agri-commodity by enterprises
Air Emission from food processing industry due to burning of fuel in boiler, operation of D.G sets or usage of fuel for other processes
Food Processing Industry
Food Processing Industry that shall use D.G set and boilers supported by the Project must have a valid consent from the MPCB under Air Act.
Ambient air quality shall be monitored by the industry and shall comply with National Ambient Air Quality Standard. Stack emission shall also be monitored and shall comply with emission levels stipulated by MPCB.
SMART / PIU to monitor compliance
● Half Yearly by SMART
● Monthly by PIU
Production of Agri-commodity by CBOs
Methane is emitted due to microbial fermentation of feed in the digestive track of goat and sheep
Backyard Farm ● IEC material shall be distributed to farmers undertaking back yard farming regarding approach to minimise impact on environment due to goat and sheep rearing.
● Promote usage of improved cattle feed which reduce emission to the environment
● Cattle breeds selected shall have better climate adaptability.
● Selection of feed additives that will inhibit the microorganism that produce methane in the rumen and subsequently reduce methane emission. Some of the feed supplements are tannins, seaweeds, fats and oils etc.
SMART / PIU ● Annual by SMART
● Monthly by PIU

136
[Title]
Project Interventions
Environmental Aspect
Environmental Impacts Value Chain Mitigation Measures Monitoring Responsibility
Monitoring Frequency
Expansion of Agri-infrastructure viz, warehouse
Air quality is also impacted due to usage of construction machineries during construction of new warehouse / cold storage/ expansion activities
CBOs / Warehouse / Retail
● Emission during the construction stage shall be managed as per the EMP indicated in the Construction Management Guideline included in the report
Contractor and its employers
● Continuous
● Intermittent by PIU
● Quarterly by SMART
Expansion of Agri-infrastructure viz, warehouse
Noise Quality Impacts
Noise quality impact during construction stage of warehouse or other facilities due to operation of machineries
CBOs / Warehouse / Retail
● Noise level during the construction stage shall be managed as per the EMP indicated in the Construction Management Guideline included in the report
Contractor and its employers
● Continuous
● Intermittent by PIU
● Quarterly by SMART
Markets Noise pollution due to operation of D.G sets from warehouse, markets and retails
CBOs / Warehouse / Retail
Facilities supported by the Project if having a D.G set shall have proper acoustic enclosure to minimize noise impact
SMART / PIU to monitor compliance and Operator of the CBOs / Market to ensure compliance
● Half Yearly by SMART
● Monthly by PIU
Processing of agri-commodity by enterprises
Noise pollution due to operation of equipment in the food processing industries
Food Processing Industry
Food Processing industry to be supported by the project shall have consent from MPCB and measures as stipulated in the consent for noise level control shall be complied
SMART / PIU to monitor compliance and Operator of the Industry to ensure compliance
● Half Yearly by SMART
● Monthly by PIU
Production of Agri-commodity by CBOs
Bio diversity and Natural Habitat
Chemical pesticides if not proven for the target pest can be harmful to other organism dwelling in the farm lands
Primary Production
● Farmers shall be trained via FGD and training module on IPM practices and Pesticide use shall be allowed only as the last resort if the damage is likely to attain Economic Threshold Level (ETL).
● CBOs to be supported by the Project shall ensure procurement of pesticides if required as per IPM from licensed suppliers.
SMART / PIU ● Annual by SMART
● Monthly by PIU
Production of Agri-commodity by CBOs
Chemical fertilizers and pesticides if used just prior to sudden rain fall can result in run-off causing impact on the aquatic ecosystem
Primary Production
● IEC material shall be prepared on correct usage of pesticides and other agrochemicals and shall be distributed among farmers to create awareness
SMART / PIU ● Annual by SMART
● Monthly by PIU

137
[Title]
Project Interventions
Environmental Aspect
Environmental Impacts Value Chain Mitigation Measures Monitoring Responsibility
Monitoring Frequency
Production of Agri-commodity by CBOs
Impact due to open grazing of goat and sheep in forest land
Back yard Poultry
● Back yard farming CBOs of Poultry to be supported by the Project should ensure shelter feeding of goat and sheep.
● Forest grazing will not be supported by the project.
SMART / PIU ● Annual by SMART
● Monthly by PIU
Production of Agri-commodity by CBOs
Impacts of banned pesticides
Impact due to use of banned pesticides as per Indian Regulation and WHO guideline
Primary Production
● Training of farmers of CBO supported by SMART and staffs and officers of PIU and PCMU.
● IEC material shall be prepared indicating the list of banned pesticides as per WHO and Indian regulation and shall be distributed among farmers to create awareness.
SMART / PIU ● Annual by SMART
● Monthly by PIU
Production of Agri-commodity by CBOs
Farmers Health and Safety
Health hazard due to farm machineries, hand tools and other sources such as snake bites, animal bites, fall, heat stroke etc
Primary Producers
● Farmers shall be well trained via distribution of IEC material.
● Adequate personal protection equipment shall be used while farming.
SMART / PIU ● Annual by SMART
● Monthly by PIU
Production of Agri-commodity by CBOs
Health Hazard due to Pesticides and other agrochemicals without adequate personal protection equipment
Primary Producers
● Farmers shall be trained on the dosage, mode of application, mixing techniques and spraying methods of pesticides with usage of proper personal protection equipment like mask, aprons, gloves etc.
SMART / PIU ● Annual by SMART
● Monthly by PIU
Production of Agri-commodity by CBOs
Consumers Health and Safety
Impact due to pesticides and other agrochemical residue left in the food beyond the MRL level
Primary Producers
● CBOs to be supported by the Project to ensure MRL level as per FSSAI guideline for in their farm produce
● Food safety testing facility for MRL levels shall be provided at regional level.
SMART / PIU ● Annual by SMART
● Monthly by PIU
Production of Agri-commodity by CBOs
Impact due to vaccination, hormones and artificial insemination
Primary Producers
● Farmers shall be sensitized via training and workshops regarding the ill-effect of hormone injection.
● Practice of injection of hormones must be avoided.
SMART / PIU ● Annual by SMART
● Monthly by PIU

138
[Title]
Project Interventions
Environmental Aspect
Environmental Impacts Value Chain Mitigation Measures Monitoring Responsibility
Monitoring Frequency
● Farmers shall be trained on hygienic milking practices
● Indigenous species should be promoted for artificial insemination and shall be done in consultation with a technician
Slaughterhouse (Expansion and waste management)
Unhygienic practices in poor slaughter houses
Slaughter house
● Slaughter houses must have a valid license to operate.
● Consent shall be obtained from State Pollution Control Board for operating the slaughter house.
● Slaughter house to be supported by the project to ensure compliance with Good Industrial Practice for slaughter house included in the report.
SMART / PIU to provide training and monitor implementation
● Half Yearly by SMART
● Monthly by PIU
Processing of agri-commodity by enterprises
Energy Conservation
There is scope for improvement on usage of energy conservation measures in the agriculture value chain
Primary producers, FPOs/FPCs, Market / traders / retailers.
CBOs / Markets / other facilities supported under the Project shall ensure adopting the following:
● Energy efficient measures such as usage of LED lighting shall be encouraged.
● Building designs shall be such as to utilize maximum daylight rather than relying on artificial light.
● Retails shall adopt high efficiency HVAC system which has potential for energy saving.
● Refrigeration system used in retail and cold storages shall be of 3 - 5 energy star rating.
● Food processing industries shall adopt technologies such as solar dryers as measure for energy conservation.
SMART / PIU ● Half Yearly by SMART
● Monthly by PIU
Production of Agri-commodity by CBOs
Climate Change Impacts
Impact on agriculture due to climate change such as yield loss, loss of crop due increased temperature
Complete value
● IEC material should be distributed among farmers and FGD must be conducted to train farmers to change farming practices to conserve soil moisture, organic matter and nutrients such as use mulch stubble and straw, crop rotation, use lower plant density, change timing of farm operations and advance sowing dates to offset moisture stress during warm period.
SMART / PIU to provide training and assistance
● Annual by SMART
● Monthly by PIU

139
[Title]
Project Interventions
Environmental Aspect
Environmental Impacts Value Chain Mitigation Measures Monitoring Responsibility
Monitoring Frequency
● CBOs to be supported by the Project shall ensure procurement of certified seeds and purchase of pesticides from licensed suppliers.
● Reducing post harvesting food loss by improved storage and handling mechanism.
Production of Agri-commodity by CBOs
Impact of agriculture on climate change
Complete value
● Adopting improved cropland management practices such as INM to reduce emission from soil.
● Backyard farming CBOs supported by the project shall ensure adopting Improving livestock feeding practices by using specific agents or dietary additives, improvement in forage quality and quantity which can increase efficiency.
● Improving soil and water management by increasing soil availability in the root zone and improving soil organic matter.
SMART / PIU to provide training and assistance
● Annual by SMART
● Monthly by PIU

140
[Title]
6.10.12 Certification of INDGAP
To enable farm produce to be internationally competitive, innovative farming practices incorporating the
concept of globally accepted Good Agricultural Practices (GAP) within the framework of commercial
agricultural production for long term improvement and sustainability is essential. GAP in addition to
improving the yield and quality of the products, also has environmental and social dimensions.
Implementation of GAP would promote optimum utilization of water resources such as pesticides,
fertilizers, water and eco-friendly agriculture. Its social dimension would be to protect the agricultural
workers’ health from improper use of chemicals and pesticides. It is a particularly opportune time to
promote GAP when second generation of reforms in agriculture which would have a Critical impact on
Indian agriculture, are planned by the Indian Government.
The Indian Good Agricultural Practices (INDGAP) considers not only the quality and quantity of the produce
obtained from a unit area but it also takes care of integrating preharvest practices like soil & water
management, nutrient management and pest management, harvesting, post-harvest handling and other
logistics. It is therefore necessary to have a comprehensive view while defining control and compliance
systems for different farm produce covering horticulture, floriculture, food grains, etc. The areas where
appropriate control measures need to be strengthened are farms producing raw material such as food
grains, fresh fruits and vegetables, floriculture, etc. to ensure sustained supply of produce of the desirable
quality.
With the opening of the world market, there is a flow of trade in these agricultural products. It is,
therefore, necessary to define certain minimum standards with a well-defined certification and
accreditation mechanism for the implementation of INDGAP to facilitate national and international trade
in farm produce. Implementation of INDGAP is voluntary and non-discriminatory to the growers.
The certification of INDGAP involves verification system by the Quality Council of India (QCI) or agency
authorised by QCI. The verification system includes criteria includes critical point and major point. The
Critical Points and Compliance Criteria required to be followed by the grower or a grower group as well as
by the certification bodies for verification purposes. Criteria marked as Major are those, which are
recommended for implementation and are advisory in nature.
The proposed arrangement for the certification of INDGAP is given below:
Table 52: Proposed arrangement for INDGAP certification
Agency Role
● SMART SMART shall support CBOs to obtain the INDGAP certification with finance and management system support
● CBOs CBOs to obtain and comply with verification process of INDGAP certification.
6.10.13 Capacity Building plan
As indicated in the table above, the indicative capacity building plan for the project to mitigate the risks
identified are presented in the following:
Table 53: Capacity Building
Identified gaps Measures Responsibility
Expertise-
Absence of environmental and social specialists in PIUs
Environmental Specialists Recruitment at PCMU level and respective PIU level
Social specialist Recruitment at PCMU level and respective PIU level
Environmental and social capacity
Training on
● Environmental safeguards
Training of PCMU staffs
Training of PIU staffs

141
[Title]
Identified gaps Measures Responsibility
● Social safeguards
● Pest management plan
● Gender Sensitisation
● Good industrial practices for slaughter house
● Construction Management
Awareness ● Preparation and development of IEC material;
● Community and media campaigning
SMART to develop IEC material for campaigning
Organise stakeholder’s awareness programs
Table 54: Capacity building plan for Social Safeguard
Workshops/ Training
Level Description Year Responsibility
Social Management Framework
State Training of PCMU & PIU staff on social assessment, land resettlement, labor management framework indigenous people plan, citizen engagement, grievance Redressal, inclusion strategy)
1 & 3 PCMU/State Social Safeguard Specialist
Social Management Framework
Regional Training of PIU regional and DIU staff on social assessment, land resettlement, labour management framework indigenous people plan, citizen engagement, grievance Redressal, inclusion strategy)
1 & 3 PCMU/State Social Safeguard Specialist/Regional Social Safeguard Specialist
Social Management Framework
District Training of CBOs on land resettlement, labour management framework indigenous people plan, citizen engagement, grievance Redressal, inclusion strategy
1,2,3,4,
PCMU/State Social Safeguard Specialist/Regional Implementation Unit/ Regional Social Safeguard Specialist
6.11 Training and Capacity Building Schedule
Training and capacity building schedule are as indicated in the table below:
Sr No. Proposed Activity Year for Training Responsibility
Component B: Supporting Enterprise Growth and Expanding Market Access Subcomponent 4- Technical
Trainings and Extension activities for value chain development by PIUs in catchment areas of PPs & MAPs
1. B.1: Weekly training to Farmers through the
Farmer Field Schools under Subcomponent
4.1. PIU, Agriculture; Value Chain Development
Schools - Field Crops
01st-04th Year PIU-Agriculture
2. B.1: Training on GAP / Organic, Traceability
and Food Safety Under Subcomponent 4.2.
Value Chain Development Schools -
Horticulture
01st-04th Year PIU-
Agriculture/Horticulture
3. B.1: Training on Market Led Crops Demos for
GAP Certifications, Organic Certifications,
Traceability
01st-04th Year PIU- Agriculture/
Horticulture
4. B.1: Training to Farmers through the Farmer
Field Schools under Subcomponent 4.2 Value
Chain Development Schools – Horticulture
01st-04th Year PIU- Agriculture/
Horticulture
5. B.1: Training on Quarantine Pest Free Cluster
Development Program under Subcomponent
4.2 Value Chain Development Schools –
Horticulture
02nd-04th Year PIU- Agriculture/
Horticulture
6. B.1: Training on Good Animal Husbandry
Training for Farmers under Subcomponent 4.3
PIU AHD for Small Ruminants & Backyard
Poultry
01st-05th Year PIU- Animal Husbandry

142
[Title]
Sr No. Proposed Activity Year for Training Responsibility
7. B.1: Training of Community Cadre
(Krishisakhi, Pashusakhi, Community
Agriculture Manager, Community Livestock
Manager) on GAP, Food Safety and
Traceability under Cost of Training for Bridging
Technical Support for CLFs & CMRCs
02nd-04th Year PIU- Agriculture/
Animal Husbandry
8. B3: Urban Food Pilot. Awareness Campaigns &
Training by PMC to goat farmers on GHP and
butcher & enterprises on quality certification,
GMP, HACCP, FSMS, ISO 22000, SPS
01st-04th Year PIU- Animal Husbandry
9. Hiring of the 08 Nos. of Environmental
Safeguard Officers at the Regional (JDA) Level
-
10. Publication of IEC Material
11. Video Film/Documentary on Best Practices
12. Midterm and End-term Audits
13. Software, Equipment’s, Database, etc.
6.12 Environmental Monitoring indicators
The Project Development Objective (PDO) of SMART is to support the development of inclusive and
competitive agriculture value chains, focusing on small holder farmers & Agri-entrepreneurs in
Maharashtra. Environmental Safeguard of SMART assesses the possible environmental risks and the
impacts (positive or negative) associated with the developmental interventions. The ESMF suggested by
SMART would define measures and processes during the project design and implementation to effectively
manage risks and enhance positive impacts.
For integration of environment safeguards along the selected agriculture value chains, project will strive
to achieve 15-20 percent resource use efficiency (reduce, reuse and recycle) from the baseline scenario.
The environment safeguards inclusive approach will focus on adoption of precision farming practices for
the use of Agri-inputs, safe disposal of pesticide containers, adoption of renewable energy (solar, biogas),
waste reduction and its conversion into value added products, foster food safety aspects through
GAP/MRL compliance, reduction of GHG emission’s across the selected Agri-value chains, creation of
sustainable agriculture jobs and mainstreaming of environmental considerations into the State’s
agricultural policies.
The component and activity wise Environment Safeguards Integration Plan could be suggested as below:
6.12.1 Environment Safeguards Integration Matrix
Table 55: Environment Safeguard Integration Matrix
Component Activity Environment Safeguards Integration
Output Indicator Outcome
A. Enhancing Institutional Capacity for Agribusiness Reforms.
A.1 Support for research and technical assistance to GOM on agriculture reform program
Training of staff of the State Line Departments (All PIUs) on MRL/GAP/Sustainable agriculture/Waste management/ Renewable energy
Agency wise
# staff trained
Agency wise Increase in awareness among staff of State Line Departments on MRL/GAP/Sustainable agriculture/ waste management/ renewable energy
A.2 Establishing Agribusiness Stewardship
Integration of Environmental Stewardship for CBOs under ASCs, Food
# of CBOs linked with Environmental Stewardship under ASCs
No of PPs & MAPs of the CBOs linked with Environmental Stewardship under ASCs, Food safety,

143
[Title]
Component Activity Environment Safeguards Integration
Output Indicator Outcome
Councils (ASCs)
safety, worker’s safety and community safety.
worker’s safety and community safety.
B: Supporting Enterprise Growth and Expanding Market Access
B. 1 Market Access Support. (PP, MAP and Innovations
Capability Building of the CBOs (FPCs, CLFs, CMRCs and PACS) under PP, MAP and CMA on Climate Resilient Agriculture Technologies through the third part agencies, viz., NIASM, Baramati (TBD), Vanamati and Ramati (TBD).
Certification Requirement like GAP, HACCP
Number of Demonstrations on Climate Resilient Agriculture Technologies provided to the CBOs
No. of CBOs adopting the Climate Resilient Agriculture Technologies;
Area of CBO certified under GAP
Slaughter house certified as HACCP.
Provision of the Implements/technologies to CBOs for the bringing New/Additional Area in Hectares under Climate Resilient Agriculture
Nos of the Implements / technologies supplied to the CBOs for the bringing New/Additional Area in Hectares under Climate Resilient Agriculture
New/Additional Area in Hectares brought Under Climate Resilient Agriculture using the Implements
Promotion of Climate Resilient Fodder Production
No of Climate Resilient Fodder Production units demonstrated/established to the CBOs
No of Climate Resilient Fodder Production developed and used by the CBOs
Promotion of Renewable Energy (Solar) /Energy Efficiency for the Warehouses
Support for adoption of Renewable Energy (Solar) /Energy Efficiency technologies provided to the CBOs
No of Renewable Energy (Solar) /Energy Efficiency technologies deployed/ used by the CBOs
B. 2. Support Enterprise Development
Setting up of Agri-waste management units for Production and Processing
Nos. of trainings conducted for the CBOs in waste to wealth conversion technologies and establishment of Composting Units/Related Technologies
No of Composting units developed and used by the CBOs
Development of Green/Sustainable Jobs
Nos. of trainings conducted for the CBOs in Sustainable Agricultural Practices (GAP/IPM/INM)
Nos. of Green/Sustainable Jobs created through the project's CBOs
B.3 Access to Finance
Training and Capacity building for formulating viable bank proposals for accessing finance for Sustainable Agriculture
# of CBOs trained on accessing finance for adoption of Sustainable Agriculture
Increase in the capacity of CBOs on accessing finance for Sustainable Agriculture
B.4 Urban Food Pilot
Training and Capacity building of CBOs on GAP & its Certification and MRL Compliance
# of CBOs trained on GAP & its Certification and MRL Compliance
No. of farmers reached with GAP certification and training on safe food
C. Building Risk Mitigation and Management
C. 1 Enhanced market information and intelligence services
Dissemination of information to CBOs on Climate Resilient Technologies (mobile SMS) for Agriculture and Livestock Value Chains
# of CBOs received the information on Climate Resilient Technologies
Increased access of CBOs to information on Climate Resilient Technologies
C. 2 Strengthening the warehouse receipts systems (Needs to be
Promotion of Renewable Energy/Energy Efficiency for the Warehouses
# of Warehouses deploying the Renewable (Solar) Energy /Energy Efficiency
Number of Warehouses using the Renewable (Solar) Energy/ Energy Efficiency

144
[Title]
Component Activity Environment Safeguards Integration
Output Indicator Outcome
Linked to Renewable (Solar) Energy
C3. Price Risk Management
None None None
D. Project Management Monitoring and Learning
Project Management
Staffing requirement;
Environmental Capacity of Staffs;
Promotion of Environmental Stewardship for the SMART Project’s Management- HR Policy favouring use of Car Pooling of Staff, Use of Reusable Products, whenever feasible, conducting review meeting through Video Conferencing Platforms, etc.
Nos. of Training’s conducted for the SMART’s PCMU team and related stakeholders on adoption of the Environmental Stewardship under SMART
Nos. of SMART’s PCMU staff or CBOs showcasing Environmental Stewardship
GHG Foot print of the Agri- Value chain commodities
No of Agri-commodities Value chains evaluated for GHG Emission Reductions
No of Agri-commodities Value chains with reduced GHG Emissions
MIS and M&E Publication of IEC material on Sustainable Agricultural Practices and Climate Resilience Building Measures
No. of beneficiaries/CBOs receiving IEC Material through the SMART project
No. of beneficiaries/CBOs using the IEC Material supplied by the SMART project for improving the sustainable agricultural production systems.
Promotion of real time monitoring of the SMART project’s interventions using mobile, tablet devices
No. of beneficiaries/CBOs trained in Promotion of real time monitoring of the SMART project’s interventions
No. of beneficiaries /CBOs reporting progress using Smart Mobile Phones/ Tablets / Geotagged Photographs
Source: Mott MacDonald Analysis
Implementation Responsibility: Implementation of Environment Safeguards Integration Matrix along the
SMART’s project cycle will be the collective responsibility of all the project stakeholders. The SMART PCMU
will be responsible for coordination and monitoring of the Environment Management Plan across PIUs and
DIUs.
6.13 Monitoring Indicators for Social Development Outcomes
Monitoring indicators have been developed for each of the components encompassing core indicators on
equity in participation and benefits to women, marginalised community groups and small-scale players in
the value chain. A baseline (pre -project status) scenario for each indicator shall be developed under the
Project. These indicators shall be monitored internally as well as externally on a periodic basis and
reviewed by the SMU.
Table 56: Monitoring indicators for Social Development Outcomes
Project Component Indicator
A. Enhancing Institutional Capacity to support agricultural Transformation
● Number of female officials of partnering agencies trained
● Number of SC and ST officials of partnering agencies trained
● Number of investment policy dialogue organised between SC and ST entrepreneurs and groups and private investors

145
[Title]
Project Component Indicator
● Number of investment policy dialogue organised between economically weaker entrepreneurs and groups and private investors
● Increase in volume of business due to increased investments in the concerned value chain activities
B: Expanding Market Access and Supporting Enterprise Growth
● Number of small and marginal farmers, ST/SC included in identified production clusters, FPCs
● No. of women farmers included in production clusters, FPCs
● Involvement of small, marginal, ST/SC and women farmers in management of FPCs
● No. of training organized on skill up-gradation on use of new technology
● No. of ST/SC, women labourers participated in the training
● Number of women entrepreneurs facilitated
● Number of entrepreneurs belonging to ST/SC category facilitated
● Number of entrepreneurs belonging to economically weaker sections facilitated
● Number of ST and SC entrepreneurs provided exposure trips
● Number of female entrepreneurs provided exposure trips
● Impact on price of the commodities due to storage facility
● Trade mark obtained by female, SC, ST entrepreneurs and groups and increase in volume of business
● Involvement of small and marginal farmers in market management/decision making bodies
● Involvement of women in market management/decision making bodies
● Involvement of ST and SC in market management/decision making bodies
● Increase in investments in activities of ST/SC, small, women entrepreneurs
● Increase in flow of agricultural commodities of the ST/SC, women farmers to markets
● production clusters
● Number of small and marginal, ST/SC farmers using climate resilient Package of Practices.
● Number of small and marginal, ST/SC farmers benefitted due to increase in value of the farm produces
● Engagement of women labourers in construction works
● Increase in number of bank account holders among small and marginal/women and ST/SC farmers
● Proportion of farmer members (small and marginal, women, ST/SC) –with formal sources of credit vis-à-vis informal sources
● Credit flow to the small/ women, ST/SC entrepreneurs
C: Building Risk Mitigation Mechanisms
● Local wages/person days generated in the markets for loading and unloading of commodities
● Percentage of increase in profit margin of the farmers due to new price discovery system
● Increase in volume of business due to modernisation and up-gradation of markets
● Price realized by farmers for the relevant commodity
● Number of small and marginal farmers, ST/SC and women farmers using warehouses
● Number of negotiable warehouse receipts issued to small and marginal farmers, ST/SC and women farmers
6.14 Food Safety Strategy
The findings of food safety assessment are given below.
● Based on MRL testing data sourced from Maharashtra Agricultural Department, 16 commodities have
been found to be above the MRL.
● Lack of formal education on food safety
● Lack of awareness towards GAP (Good Agricultural Practices), Food safety practices
● Lack of enough resources to make farmers aware of food safety.
● Lack of government laboratories to test all the required parameters.
● Poor knowledge of personal hygiene.
● A weak policy & regulatory framework
● Inadequate enforcement of existing standards
● Predominance of small farms.
Food Safety Strategy developed for the Project is as indicated below.

146
[Title]
Table 57: Food Safety Strategy
Strategy Recommended Action
Avoiding chemical residue in Agriculture Produce
Training on INM and IPM practices to be delivered to the members of the CBOs to be supported by the Project.
CBOs to be supported by the Project should ensure that the pesticide residue in their produce is below MRL level set by FSSAI.
The buyers and enterprises shall monitor the MRL level and submit copy of the test report to SMART.
Avoiding antibiotics and steroid in Goat and chicken meat.
The Enterprise or buyers will conduct sampling for testing of MRL of antibiotics and steroids by a third party or independent laboratories certified by FSSAI. Regular test report will be submitted by the buyers to SMART.
Comply with CODEX standard developed by Food and Agricultural Organization for fruits, vegetables, cereals and pulses
IEC material on CODEX for commodity selected by the Project should be developed and distributed to CBOs to be supported by SMART. The IEC material on CODEX shall include the following for the selected agri-commodity.
● Provisions concerning quality or essential composition and quality factors
● Contaminants permissible such as heavy metals and pesticide residue
● Hygiene practices and testing parameters
● Packing requirements
● Labelling requirements
● Method of analysis and sampling
Risk communication and health promotion / education in support of foodborne disease prevention
● Advocate and ensure that the result of scientific assessment is communicated among stakeholders to be supported
● Use research to inform policy formulation and proceed with expanding export abilities and improvement of the status of national product in the local market.
● Empower women through food safety education
Source: MM Analysis
6.15 Monitoring Plan
Based on the monitoring requirement identified during review of stakeholder consultation, key issues and
action points identified in the ESMF, a monitoring plan has been prepared as indicated below.
Table 58: Environmental Monitoring Plan
Environmental Aspects
Performance indicator Monitoring parameters
Frequency Responsibility
Soil quality impact due to excessive use of fertilizers
100 percent farmers of the CBOs supported by SMART are having soil health card within 2 years of implementation.
Farmers of the CBOs supported by SMART having soil health card.
PCMU to monitor quarterly and PIU to monitor monthly.
SMART PCMU and PIU
Prohibiting banned pesticides
Maximum Residue Level of Pesticides in the Farm Produce as per FSSAI standards.
Concentration and presence of Pesticides in the farm produce at CBO level
Laboratory testing of farm produce for presence of banned pesticides, maximum residue level of pesticides.
Continuous monitoring by CBOs prior to entry of farm produce in the CBOs; monthly monitoring by PIUs and Quarterly monitoring by PCMU.
CBO, SMART PCMU, PIU and Enterprises or buyers
Energy conservation measures
Use of solar power in CBOs/FPOs/FPCs.
• Energy rating of equipment and machineries.
• PIU to monitor monthly and PCMU to monitor semi-annually.
SMART PCMU and PIU
Emission of Ozone depleting substances
Cold storages and retails adopting HCFC and HFC instead of CFC as per Ozone Depleting Substance (Regulation and Control) Rule, 2014.
Parameters of HCFC and HFC
PCMU to monitor quarterly and PIU to monitor monthly.
SMART PCMU and PIU

147
[Title]
6.16 Environmental and Social Budget
Social management budget of INR 4,73,00,000 /- including training capacity building of CBOs,
development of IEC material and third party audits.
Table 59: Tentative Social Budget and Capacity Building Timeline Gantt Chart
Workshops/ training No of
participants
Unit
Cost
Total Cost in
INR
Social Management Framework at state level 50*2=100 2,000 2,00000
Social Management Framework at Regional level 250*2=500 2000 1000,000
Social Management Framework at district level 1000 CBO * 5
BoD=5000
1500
75,00,000
IEC 25,00000
Human Resource: 8 Social Development Experts will be hired by
Agriculture PIU at divisional level. One Expert @ 50,000@ month
Resource
3,36,00,000
Midterm and End term audit 25,00000
Total 4,73,00,000

148
[Title]
Capacity Building Timeline Gantt Chart for Social and Gender Inclusion
S. No Legend Workshops / Training Level Responsibility Year 1 Year 2 Year 3 Year 4 Year 5 Year 6 Year 7
1
Social Management Framework (Social assessment, land resettlement, labor management framework, indigenous people, citizen engagement, grievance Redressal, inclusion strategy)
State PCMU
2 Social Management Framework Regional PCMU/RIU
3 Social Management Framework District PCMU/RIU/ DIU

149
[Title]
Environmental management budget of INR 43,56,20,000/- has been estimated for training, capacity
building and environmental management and monitoring.
Table 60: Tentative Environment Budget and Capacity Building Timeline Gantt Chart
Sr
No.
Proposed Activity Unit Type Unit Cost
(INR)
Total
Units
Total Cost
(INR)
Component B: Supporting Enterprise Growth and Expanding Market Access Subcomponent 4- Technical
Trainings and Extension activities for value chain development by PIUs in catchment areas of PPs & MAPs
1. B.1: Weekly training to Farmers through the
Farmer Field Schools under Subcomponent 4.1.
PIU, Agriculture; Value Chain Development
Schools - Field Crops
Numbers 32,000 2,400 7,68,00,000/-
2. B.1: Training on GAP / Organic, Traceability and
Food Safety Under Subcomponent 4.2. Value
Chain Development Schools - Horticulture
Numbers 2,000 25,000 5,00,00,000/-
3. B.1: Training on Market Led Crops Demos for
GAP Certifications, Organic Certifications,
Traceability
Numbers 8,000 12,500 10,00,00,000/-
4. B.1: Training to Farmers through the Farmer
Field Schools under Subcomponent 4.2 Value
Chain Development Schools – Horticulture
Numbers 32,000 1,000 3,20,00,000/-
5. B.1: Training on Quarantine Pest Free Cluster
Development Program under Subcomponent 4.2
Value Chain Development Schools – Horticulture
Numbers 1,00,00,000 5 5,00,00,000/-
6. B.1: Training on Good Animal Husbandry
Training for Farmers under Subcomponent 4.3
PIU AHD for Small Ruminants & Backyard
Poultry
Numbers 1000 20,000 2,00,00,000/-
7. B.1: Training of Community Cadre
(Krishisakhi, Pashusakhi, Community Agriculture
Manager, Community Livestock Manager) on
GAP, Food Safety and Traceability under Cost of
Training for Bridging Technical Support for CLFs
& CMRCs
Numbers 6,000 10,000 6,00,00,000/-
8. B3: Urban Food Pilot. Awareness Campaigns &
Training by PMC to goat farmers on GHP and
butcher & enterprises on quality certification,
GMP, HACCP, FSMS, ISO 22000, SPS
Lump sum 70,00,000/-
Subtotal 39,58,00,000/-
Component D: Project Management, Monitoring and Learning
9. Hiring of the 08 Nos. of Environmental
Safeguard Officers at the Regional (JDA) Level
Months 50,000 * 8
Regional
Officers at
JDA Level
84 3,36,00,000/-
10. Publication of IEC Material Numbers 200 1600 3,20,000/-
11. Video Film/Documentary on Best Practices Lump sum 19,00,000/-
12. Midterm and End-term Audits 10,00,000 2 20,00,000/-
13. Software, Equipment’s, Database, etc. Lump sum 20,00,000/-
Subtotal 3,98,20,000/-
Total Cost 43,56,20,000/-

150
[Title]
Capacity Building Timeline Gantt Chart for Environmental Safeguards
Component Legend Task Sub Component Responsibility
Ye
ar 1
Ye
ar 2
Ye
ar 3
Ye
ar 4
Ye
ar 5
Ye
ar 6
Ye
ar 7
Component B: Supporting
Enterprise Growth and Expanding
Market Access
Weekly training to farmers through the farmer field school
B1: Market Access Support. (PP, MAP and Innovations) Value Chain Development Schools - Field Crops
PIU Agriculture
Training on GAP / Organic, Traceability and Food Safety
B1: Market Access Support. (PP, MAP and Innovations) Value Chain Development Schools - Horticulture
PIU- Agriculture/ Horticulture
Training on Market Led Crops Demos for GAP Certifications, Organic Certifications, Traceability
PIU- Agriculture/ Horticulture
Training to Farmers through the Farmer Field Schools
PIU- Agriculture/ Horticulture
Training on Quarantine Pest Free Cluster Development Program
PIU- Agriculture/ Horticulture

151
[Title]
Component Legend Task Sub Component Responsibility
Ye
ar 1
Ye
ar 2
Ye
ar 3
Ye
ar 4
Ye
ar 5
Ye
ar 6
Ye
ar 7
Training on Good Animal Husbandry Practices
B1: Market Access Support. (PP, MAP and Innovations) Value Chain Development Schools - Livestock (Ruminants & Backyard Poultry)
PIU- Animal Husbandry
Training of Community Cadre (Krishisakhi, Pashusakhi, Community Agriculture Manager, Community Livestock Manager) on GAP, Food Safety and Traceability under Cost of Training for Bridging Technical Support for CLFs & CMRCs
B: Capacity Building of the CBOs
PIU- Agriculture/ Animal Husbandry
Urban Food Pilot. Awareness Campaigns & Training by PMC to goat farmers on GHP and butcher & enterprises on quality certification, GMP, HACCP, FSMS, ISO 22000, SPS
B3: Urban Food Pilot PIU- Animal Husbandry

152
[Title]
Component Legend Task Sub Component Responsibility
Ye
ar 1
Ye
ar 2
Ye
ar 3
Ye
ar 4
Ye
ar 5
Ye
ar 6
Ye
ar 7
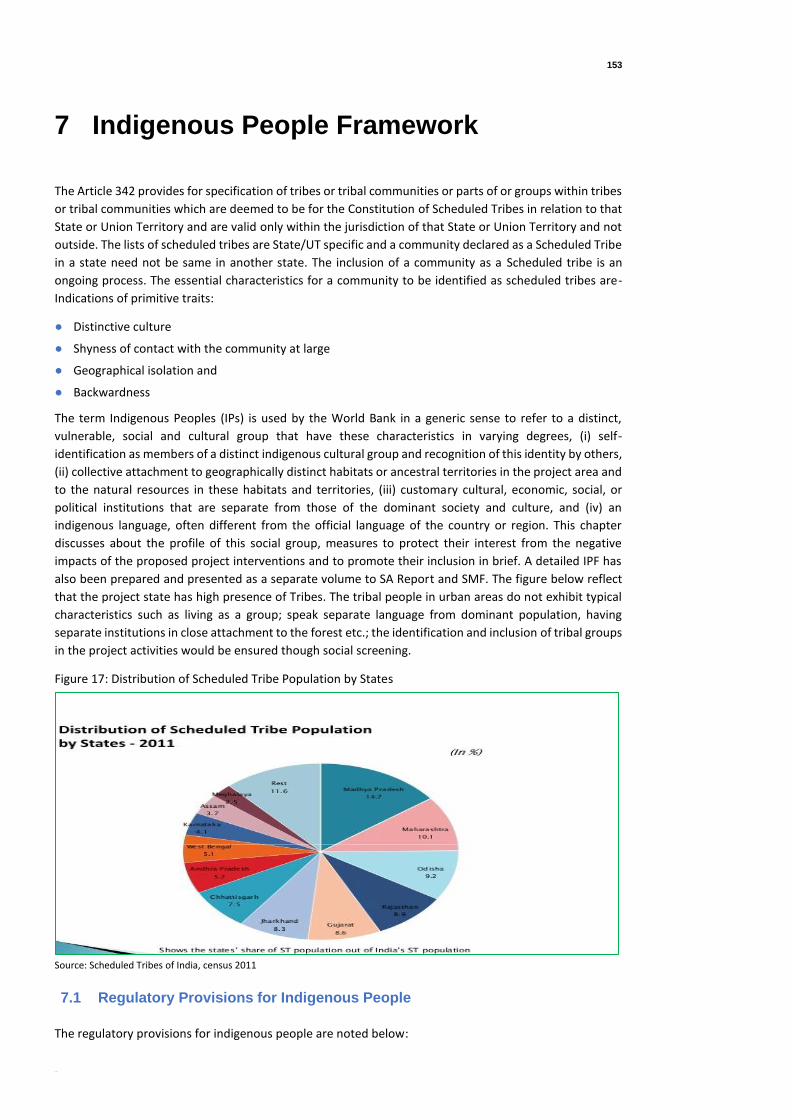
153
[Title]
7 Indigenous People Framework
The Article 342 provides for specification of tribes or tribal communities or parts of or groups within tribes
or tribal communities which are deemed to be for the Constitution of Scheduled Tribes in relation to that
State or Union Territory and are valid only within the jurisdiction of that State or Union Territory and not
outside. The lists of scheduled tribes are State/UT specific and a community declared as a Scheduled Tribe
in a state need not be same in another state. The inclusion of a community as a Scheduled tribe is an
ongoing process. The essential characteristics for a community to be identified as scheduled tribes are-
Indications of primitive traits:
● Distinctive culture
● Shyness of contact with the community at large
● Geographical isolation and
● Backwardness
The term Indigenous Peoples (IPs) is used by the World Bank in a generic sense to refer to a distinct,
vulnerable, social and cultural group that have these characteristics in varying degrees, (i) self-
identification as members of a distinct indigenous cultural group and recognition of this identity by others,
(ii) collective attachment to geographically distinct habitats or ancestral territories in the project area and
to the natural resources in these habitats and territories, (iii) customary cultural, economic, social, or
political institutions that are separate from those of the dominant society and culture, and (iv) an
indigenous language, often different from the official language of the country or region. This chapter
discusses about the profile of this social group, measures to protect their interest from the negative
impacts of the proposed project interventions and to promote their inclusion in brief. A detailed IPF has
also been prepared and presented as a separate volume to SA Report and SMF. The figure below reflect
that the project state has high presence of Tribes. The tribal people in urban areas do not exhibit typical
characteristics such as living as a group; speak separate language from dominant population, having
separate institutions in close attachment to the forest etc.; the identification and inclusion of tribal groups
in the project activities would be ensured though social screening.
Figure 17: Distribution of Scheduled Tribe Population by States
Source: Scheduled Tribes of India, census 2011
7.1 Regulatory Provisions for Indigenous People
The regulatory provisions for indigenous people are noted below:

154
[Title]
7.1.1 Notification
● Article (preamble) 342- Declaration for Indigenous People
● Article 366- Define Indigenous People
7.1.2 For Education, Economics and Public employment- related safeguards
● Article15-Prohibition of discrimination on grounds of religion, race, sex, caste or place of birth.
● Article16- Equality of opportunity in matter of public employment.
● Article 19-Protection of certain rights regarding freedom of speech etc.
● Article 46-Protection of Education and Economic interest of Scheduled castes, Indigenous people and
other weaker sections.
● Article 335-Claims of Scheduled Castes and Indigenous People to services and posts
7.1.3 Agency for monitoring safeguards
● Article 338A- national commission for Indigenous people.
7.1.4 Fundamental rights (Provisions support to subprojects Indigenous People)
● Article 23- Prohibition of traffic in human beings and forced labour
● Article 24- Prohibition of employment of children in Labour work, factories etc.
● Article 38-State to secure a social order for the promotion of welfare of the people.
● Article 39A-Equal justice and free legal aid
The above provisions will be helpful in project areas to protect the fundamental rights and safeguard the
Indigenous People. In addition to the above, OP/BP-4.10 of World Bank policy contributes to the Bank's
mission of poverty reduction and sustainable development by ensuring that the development process fully
respects the dignity, human rights, economies and cultures of Indigenous Peoples.
7.2 Status of Tribals in the State of Maharashtra
Maharashtra accounts for 10.1 percent of the Scheduled Tribe population of India and is the second
largest in tribal population in the country. Maharashtra has 47 tribes including three particularly
vulnerable tribal group. The major tribal groups in Maharashtra are Bhil, Gond, Koli Mahadev, Warli,
Kokana, Thakur and Andh.
In the sample districts, it was found that tribal people are involved in agriculture and horticulture, fisheries,
livestock rearing. Seasonal livelihood is prevalent in these districts. Among the communities consulted, it
was found that special attention needs to be given to the tribal community, who are dependent on natural
resources for the purpose of drinking water and water usage for domestic purpose – such as cooking,
cleaning, bathing, rituals, ceremonies, cultivation of vegetables, staple crops, fodder and other traditional
activities and dependence on forests for NTFP collection, processing and sale. Further, tribal people
belonging to the Primitive Tribal Groups (PTGs), and those living in difficult terrains, e.g. hill tops, etc. are
highly dependent on forests for NTFP, with marginal or no landholding, practicing primitive or subsistence-
based agriculture, etc. needs special attention.
Further within State, there may districts with high tribal population. Although the proposed project will
have positive social impacts owing to benefits such as, improved agricultural produce; better market
linkages, better storage facility, and livelihood development, however, to ensure project interventions
does not adversely affect the tribal community, especially PTGs, PIUs/DIUs, would ensure that all the sub-
projects are selected after undertaking Social Screening, and following key steps:
– ensuring participation throughout the project cycle
– sharing of information on identified commodities

155
[Title]
– plan for implementation of identified works
– Livelihood activities, etc.
7.3 Indigenous Peoples Framework (IPF)
A project proposed for World Bank financing that affects IPs requires: (a) screening to identify whether
Indigenous Peoples are present in, or have collective attachment to, the project area; (b) a social
assessment to establish baseline situation; (c) a process of free, prior, and informed consultation with the
affected IPs’ communities at each stage of the project, and particularly during project preparation, to fully
identify their views and ascertain their broad community support for the project; (d) the preparation of
an Indigenous Peoples Plan (IPP) or an Indigenous Peoples Planning Framework (IPPF); and (e) disclosure
of the draft IPPF.
As SMART will be implemented in rural and selected peri-urban areas of Maharashtra, where Scheduled
tribes constitute around 10 percent of the total population, an IPF is required to be prepared and
implemented. Hence, as part of ESMF, an Indigenous Peoples Development Framework (IPDF) has been
prepared in line with the World Bank safeguard Policy. The IPF aims at effectively promoting Indigenous
People’s (IPs) participation throughout the project cycle. The general objective of the IPF is the inclusion
of the IP communities in the project in order to achieve the highest possible positive impact of the
interventions to improve their quality of life, through strengthening their organization, self-management,
and capacity of their members. The specific objectives of the IPF are to ensure that:
● Project engages in free, prior and informed consultation with tribal people
● IPs have access to project activities and its benefits
● Works and services under the project do not inadvertently induce inequality by limiting project
benefits to the elite elements of the community
● The project conducts Free Prior and Informed Consultation and takes their consent, through a
consultation process appropriate to the local cultural context and local decision-making processes
and
● Establish appropriate information, communication, and diversity-training strategies with the
different IPs and communities in all stages of the project. All this will be ensured through the
following steps:
– Screening through survey to identify whether Indigenous People are present in or have collective
attachment to the project area. Specifically, the project would first ascertain whether the affected
persons meet the following four characteristics of Indigenous Peoples as specified in WB OP 4.10
○ Self-identification as members of a distinct indigenous cultural group and recognition of this
identity by others;
○ Collective attachment to geographically distinct habitats or ancestral territories in the project
area and to the natural resources in these habitats and territories
○ Customary cultural, economic, social, or political institutions that are separate from those of
the dominant society and culture; and
○ An indigenous language, often different from the official language of the country or region
– If the assessment indicates presence of such groups in the project area then a subproject specific
IPP would be prepared, and will be followed by the below mentioned steps:
○ Undertake social assessment in project areas as per parameters suggested in bank policy
○ A process of free, prior and informed consent with the affected Indigenous Peoples'
communities at each stage of the project and particularly during project preparation to fully
identify their views and ascertain their broad community support for the project.
○ Preparation of an Indigenous People Plan (IPP)
○ Disclosure of draft Indigenous People Plan
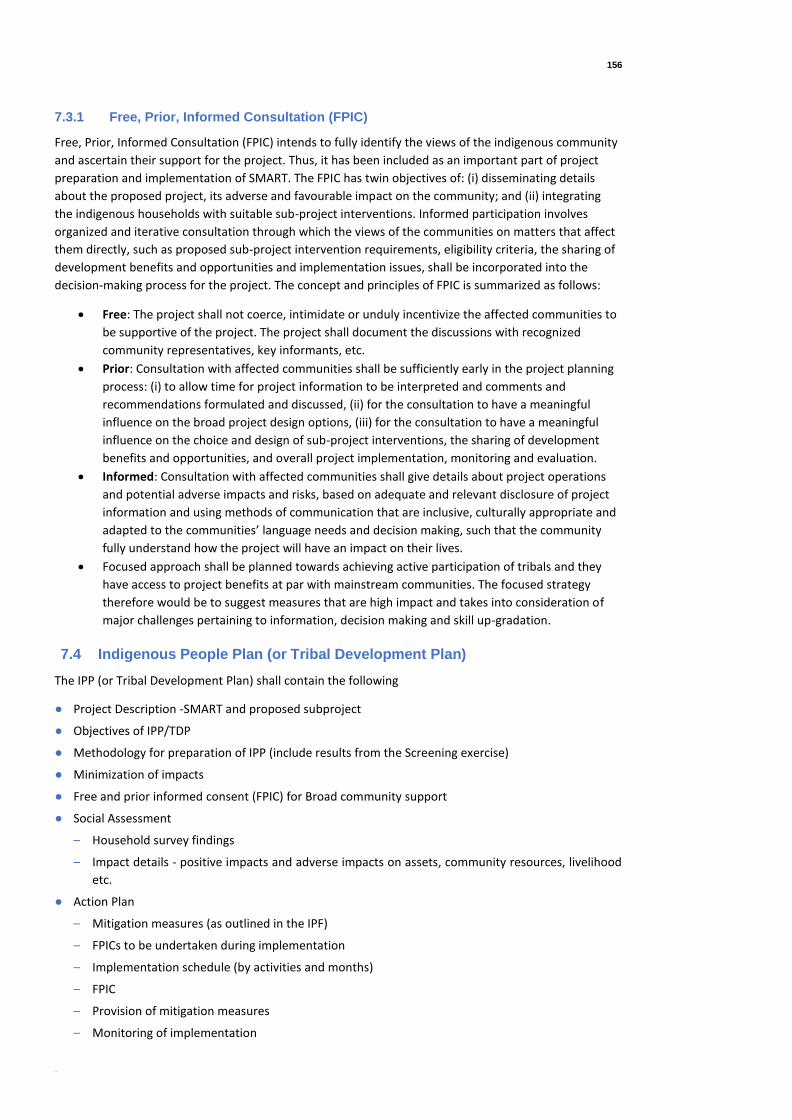
156
[Title]
7.3.1 Free, Prior, Informed Consultation (FPIC)
Free, Prior, Informed Consultation (FPIC) intends to fully identify the views of the indigenous community
and ascertain their support for the project. Thus, it has been included as an important part of project
preparation and implementation of SMART. The FPIC has twin objectives of: (i) disseminating details
about the proposed project, its adverse and favourable impact on the community; and (ii) integrating
the indigenous households with suitable sub-project interventions. Informed participation involves
organized and iterative consultation through which the views of the communities on matters that affect
them directly, such as proposed sub-project intervention requirements, eligibility criteria, the sharing of
development benefits and opportunities and implementation issues, shall be incorporated into the
decision-making process for the project. The concept and principles of FPIC is summarized as follows:
• Free: The project shall not coerce, intimidate or unduly incentivize the affected communities to
be supportive of the project. The project shall document the discussions with recognized
community representatives, key informants, etc.
• Prior: Consultation with affected communities shall be sufficiently early in the project planning
process: (i) to allow time for project information to be interpreted and comments and
recommendations formulated and discussed, (ii) for the consultation to have a meaningful
influence on the broad project design options, (iii) for the consultation to have a meaningful
influence on the choice and design of sub-project interventions, the sharing of development
benefits and opportunities, and overall project implementation, monitoring and evaluation.
• Informed: Consultation with affected communities shall give details about project operations
and potential adverse impacts and risks, based on adequate and relevant disclosure of project
information and using methods of communication that are inclusive, culturally appropriate and
adapted to the communities’ language needs and decision making, such that the community
fully understand how the project will have an impact on their lives.
• Focused approach shall be planned towards achieving active participation of tribals and they
have access to project benefits at par with mainstream communities. The focused strategy
therefore would be to suggest measures that are high impact and takes into consideration of
major challenges pertaining to information, decision making and skill up-gradation.
7.4 Indigenous People Plan (or Tribal Development Plan)
The IPP (or Tribal Development Plan) shall contain the following
● Project Description -SMART and proposed subproject
● Objectives of IPP/TDP
● Methodology for preparation of IPP (include results from the Screening exercise)
● Minimization of impacts
● Free and prior informed consent (FPIC) for Broad community support
● Social Assessment
– Household survey findings
– Impact details - positive impacts and adverse impacts on assets, community resources, livelihood
etc.
● Action Plan
– Mitigation measures (as outlined in the IPF)
– FPICs to be undertaken during implementation
– Implementation schedule (by activities and months)
– FPIC
– Provision of mitigation measures
– Monitoring of implementation
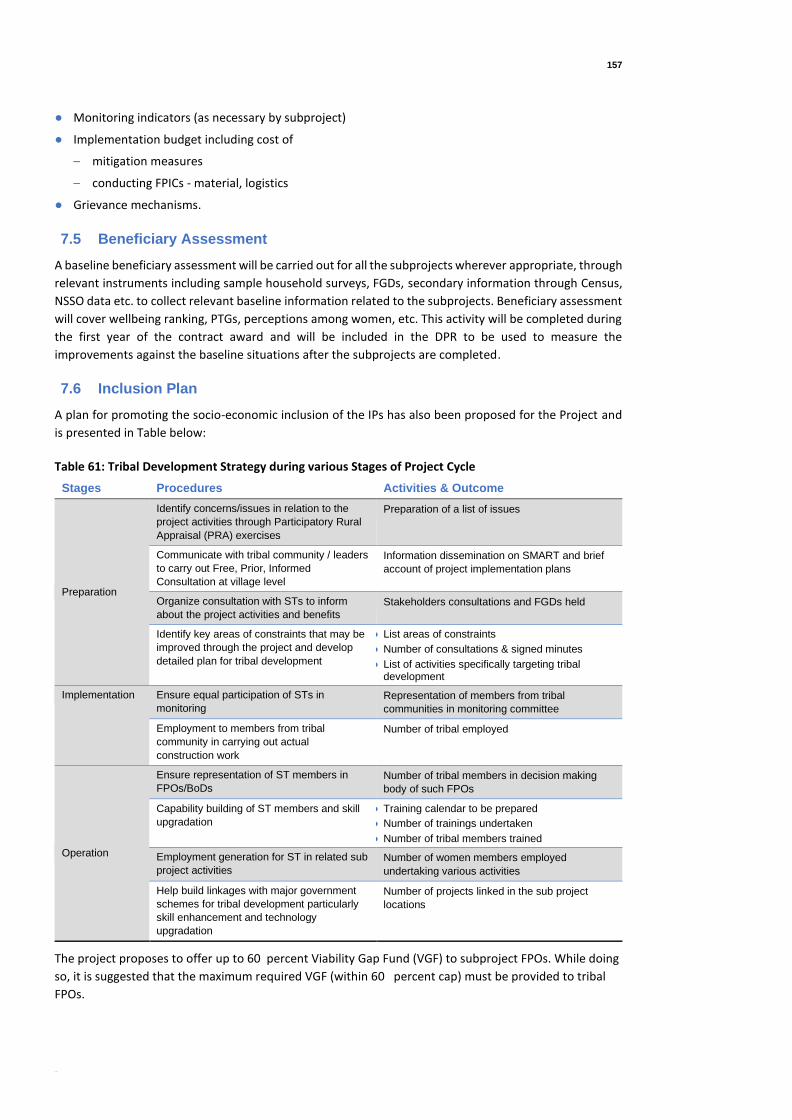
157
[Title]
● Monitoring indicators (as necessary by subproject)
● Implementation budget including cost of
– mitigation measures
– conducting FPICs - material, logistics
● Grievance mechanisms.
7.5 Beneficiary Assessment
A baseline beneficiary assessment will be carried out for all the subprojects wherever appropriate, through
relevant instruments including sample household surveys, FGDs, secondary information through Census,
NSSO data etc. to collect relevant baseline information related to the subprojects. Beneficiary assessment
will cover wellbeing ranking, PTGs, perceptions among women, etc. This activity will be completed during
the first year of the contract award and will be included in the DPR to be used to measure the
improvements against the baseline situations after the subprojects are completed.
7.6 Inclusion Plan
A plan for promoting the socio-economic inclusion of the IPs has also been proposed for the Project and
is presented in Table below:
Table 61: Tribal Development Strategy during various Stages of Project Cycle
Stages Procedures Activities & Outcome
Preparation
Identify concerns/issues in relation to the
project activities through Participatory Rural
Appraisal (PRA) exercises
• Preparation of a list of issues
Communicate with tribal community / leaders
to carry out Free, Prior, Informed
Consultation at village level
• Information dissemination on SMART and brief
account of project implementation plans
Organize consultation with STs to inform
about the project activities and benefits
• Stakeholders consultations and FGDs held
Identify key areas of constraints that may be
improved through the project and develop
detailed plan for tribal development
● List areas of constraints
● Number of consultations & signed minutes
● List of activities specifically targeting tribal development
Implementation Ensure equal participation of STs in
monitoring
• Representation of members from tribal
communities in monitoring committee
Employment to members from tribal
community in carrying out actual
construction work
• Number of tribal employed
Operation
Ensure representation of ST members in
FPOs/BoDs
• Number of tribal members in decision making
body of such FPOs
Capability building of ST members and skill
upgradation
● Training calendar to be prepared
● Number of trainings undertaken
● Number of tribal members trained
Employment generation for ST in related sub
project activities
• Number of women members employed
undertaking various activities
Help build linkages with major government
schemes for tribal development particularly
skill enhancement and technology
upgradation
• Number of projects linked in the sub project
locations
The project proposes to offer up to 60 percent Viability Gap Fund (VGF) to subproject FPOs. While doing
so, it is suggested that the maximum required VGF (within 60 percent cap) must be provided to tribal
FPOs.

158
[Title]

159
[Title]
8 Institutional and Implementation
Arrangements
8.1 Institutional framework for E&S Management
Department of Agriculture (DoA) is responsible for the technical aspects and overall execution of the
Project. DoA as project implementation agency will arrange to provide technical support for the
institutional framework proposed for E&S management under SMART. The E&S management cell, within
PCMU will be responsible for screening of project proposals for impact categorisation, planning for
mitigation measures and monitoring. Also, each PIU will have an E&S cell consisting of either E&S
specialists or specialists from within the PIUs existing structure that will assist the requirements of the E&S
cell of the implementing agency. At each RIU level, there will be one Environmental nd Social Specialist for
Monitoring E&S safeguards.
8.1.1 Roles and Responsibilities
The arrangements for reviewing and monitoring the project from the perspective of Environment and Social
Management will form a part of the overall arrangements for project management and implementation for
SMART. This is briefly described below:
Level 1: Project Steering Committee At this level, E&S performance under the project may be reviewed on a six monthly or annual basis where strategic E&S issues faced by SMART may be taken up for discussions and decisions taken regarding appropriate policy and coordination support as may be required.
Level 2: Project Coordination and Management Unit (PCMU) At the second level, Environment and Social Management issues related to the project may be discussed and monitored at a regular frequency, say monthly or bi-monthly by a body of managers and technical experts who are involved in the implementation of the project. This body may be expected to regularly review performance on agreed E&S indicators, including an annual review.
Level 3: Environmental and Social Management Cell At the third level, the responsibility for E&S management may be entrusted to a cell that could form part of the Unit responsible for the management and implementation. This Unit, which would be required to have managers and technical specialists with appropriate knowledge in relation to the different sub components, is expected to take forward the planning and implementation of each specific sub component proposed under SMART. Through the ESM cell, the Project proponents (specifically the implementation and Coordination cell) would need to be responsible for:
• Screening of sub-projects
• Reviewing sub-projects in reference to agreed E&S indicators
• Environment and social management framework applicability for the sub-project in terms of identified
environmental and social risks, possible mitigation and enhancement measures
• Responsible for monitoring and approving all land acquisition activities. Details of actions in case of
land acquisition is specified below.
i. Liaison with respective PIU to facilitate PAP access and take advantage of services and programs
already in place

160
[Title]
ii. Evolve mechanisms for coordinating the delivery of the compensation and assistance to entitled
persons
iii. Review and provide social development perspectives and inputs to on-going project design and
implementation by working closely with project planners, contractors, and construction
supervision consultants
iv. Oversee a grievance redress process, and actively monitor RAP implementation
v. Undertake regular but sample-based monitoring of ESMF implementation under SMART and for
this purpose may undertake specialized assessments, studies or depute additional staff, as needed.
In addition to the above, any Third-Party monitoring and during different stages of the project, e.g.
Mid Term Review (MTR), would include tracking the monitoring indicators and evaluating the
performance of ESMF implementation.
• Site visit and analysis, especially in cases of land acquisition
• Responding to queries raised on environmental and social issues.
• Acting as single point information system for all information required in the context of the ESMF of the
project.
• Ensuring that sub-project level ES management plans (ESMP) are in accordance with ESMF
• Monitoring and generating evaluation reports on the performance of the project in reference to agreed
E&S indicators;
• Organising training for the concerned human resources in PIUs on project ESMF process requirements
• Organising mid-term and end of project evaluation studies and any specific studies to be done by PCMU
and PIUs relating to ESMF activities.
• Providing technical and quality review of the proposal submitted by various PIUs.
In case of land acquisition, the social specialist, will ensure that the civil works will be initiated only after
the required Right of Way (RoW) or land width is free from any encroachments and the PCMU/PIU has the
physical possession of the land. Before the start of civil works the compensation must be disbursed to the
land owners in districts / project locations, where it is decided to acquire the land through payment and
the MoUs/Affidavits should be in place in the DPRs in districts where land is arranged through donation
for works reacted to infrastructure development. During implementation, consultations with the
communities shall be undertaken by the PCMU/PIU for providing information on the progress of the
project work. In case, the Land Management Committee14 has not been either established or is inactive,
the Department of Agriculture through a competent authority / committee shall issue Government Order
/Notification for its formation at the village level. The table below describes roles & responsibilities in case
of land acquisition.
Table 62: Roles and Responsibilities to Implement RF at Various Levels
Levels Roles and responsibilities
Project Director
Department of
Agriculture, GoM
Overall responsible for supervision of SMF, including RF and IPF.
Additional Project
Director Department
of Agriculture, GoM
● Supervising / handling of land transfer related matters
● Ensuring preparation of land acquisition plan and requisitions
● Facilitating and supervising disbursement of compensation and R&R as per RTFCTLARR Act prior to initiation of civil works
● Verify ownership of impacted land parcel through proof of ownership during census survey
14 Members of Land Management Committee consist of all members of Gram Panchayat, Lekhpal of Gram Sabha as Secretary,
Pradhan and Up- Pradhan of Gram Panchayat will be the Chairman and Vice Chairman of LMC

161
[Title]
Levels Roles and responsibilities
● Supervise process of land transfer and redressal of grievances
● Supervise identification & finalisation of impacts and PAPs through social screening and assessing extent of impacts through Census Surveys (Vulnerable PAPs and Entitled Persons)
● Verification of vulnerability of PAPs based on the criteria adopted
● Supervise & coordinate with line Department for finalization of entitlements and schedule for enrolments
● Ensuring disbursal procedures for entitlements as per schedule
● Verify submission of Gift Deed/Affidavit/MoU from landowners
● Coordinate redressal of additional unforeseen impacts during construction
Social Safeguards
Specialist, PCMU,
Department of
Agriculture
● Ensure dissemination of information to community/PAPs as proposed in the RF
● Coordinate with agencies for ensuring implementation of social development issues of RF
● Coordinate between PIUs for finalization of entitlements and enrolment procedures
● Coordinate with DPR consultants, coordinator & social specialist, PIU, PRI/ ULBs and local stakeholders for application of the ESMF/ RF
● Coordinate assessment of people affected by the project; assess vulnerability and entitlement issues and coordination of R&R implementation
● Ensuring compliance of safeguards in the PPP and MAP
● Review of RAP and its implementation
● Monitor physical investments under the project for fulfilment of R&R issues in coordination with the PIU coordinators
● Report progress on implementation of safeguards
● Review SIA of Projects at various stages of the implementation and update the same as per the prevailing conditions at that time
● Proper application of social screening procedures for the selection of PPP & MAP
● Review LA and RAP Reports
● Maintain training calendar and co-ordinate with various stakeholders related to capacity building
● Ensuring incorporation of social issues in DPR prior to approval
● Supervising the RF tasks during implementation & its progress in coordination with PRI
● Collect data pertaining to the evaluation and monitoring indicators
Coordinator, Project
Implementing Unit
(PIU)
● Ensuring disclosure of final sites by Zila Panchayat and Gram Panchayat at Panchayat Office and make sure that copies of finalized sites are made available to the community
● Coordinate and oversees land availability for taking up proposed investments as per the RF provisions.
● Dissemination of Project Information at various stages of project as envisaged in the RF
● Documentation and disclosure of community consultations outputs in coordination with PRI (Sarpanch or other members)
● Coordinate with AE/JE along with Talathi and PRI to identify locations for land width accretion and ownership including the customary rights in tribal areas
● Identification of impacts and PAPs through social screening and assessing extent of impacts
● Supervising the RF tasks during implementation and its progress in coordination with PRI
● Collect data pertaining to the evaluation and monitoring indicators
● Ensuring incorporation of social issues in DPR prior to approval.
Social Specialist,
PIU/RIU
● Proper application of social screening procedures for the selection of PPP and MAP
● Verify social impacts prior to initiation of civil works
● Ensure implementation of RAP and disbursement of entitlements with support of CBOs
● Ensure consultation and participation of Scheduled Tribes, scheduled Castes, in a cultural and gender sensitive manner throughout the project cycle.
● Coordinate between PCMU, PRI / CBO and the aggrieved for time bound release of entitlements as per RF
● Supervise RAP implementation
● Ensure implementation of Indigenous Peoples Framework.
● Ensure that the GRC is convened regularly
● Compliance of actual works with contract conditions and quality assurance procedures as well as agreed social management measures
● Sensitizing and capacity building of the PIU/DIU/CBO, the PRI representatives towards implementation of the ESMF/ RF provisions.
District Level (ZP
Chairman /
President)
● Display of final set of sites at the Zila and Gram Panchayat Office
● Ensure establishment of Land Management Committee for grievance redressal at village level through PIU/DIU
Village Level ● Dissemination of project information as per the RF in village in coordination with the PCMU/PIU

162
[Title]
Levels Roles and responsibilities
– Village Council / Gram Panchayat
(Sarpanch and other
Panchayat Members)
● Finalization of sites along with PIU and Revenue Department through process of community planning
● Ensure the finalization of sites as per the RF guidelines
● Organize Consultation involving community and PAPs to disclose screening output
● Encourage community/PAPs to voluntarily donate assets especially land
● Undertake Census Survey to assess the extent of impacts along with the PIA
● Identification of vulnerable PAPs and their verification as per the eligibility criteria
● Ensure finalization of procedure for land transfer and disbursal of entitlements
● Responsible to collect Gift Deed/Affidavit/MoU from landowners and subsequent submission to PIA
● Make sure that contractor holds consultation with community prior to mobilization of machinery
● Supervising the RF tasks during implementation and its progress in coordination with PIA.
163
[Title]
9 Citizen Engagement, Disclosure and
Grievance Redress Mechanism
9.1 Citizen Engagement Approaches
This section describes citizen engagement approaches that the project can adopt during
implementation:
9.1.1 Consultations
Meaningful consultations contribute to improved design, implementation, and sustainability of project’s
interventions. The objectives of citizen consultations for SMART will include receiving input for improved
decision-making about the design and implementation arrangements, which can contribute to improved
project results and sustainability. Stakeholder consultations will be done during the entire project cycle,
i.e., preparation, implementation and post implementation. During the preparatory stages, consultations
need to be carried out with line departments, officials at the regional and district levels and local
communities (members of the value-chain) as part of the project in order to gather their views on the
proposed project.
Consultation with Tribals (IPs) – The PCMU and project counterparts (PIUs) will ensure that in case of
tribal involvement, Indigenous Peoples Plan will be prepared in consultation with the affected IP groups.
Prior consultation will be held, and no objection will be obtained from the IPs, if they are affected by land
acquisition15. The mitigation measures and strategies will be presented to them by the PCMU/PIU at
various places, which will be easily approachable to them. Inputs from the IPs through consultation will be
considered in subproject design and the final plan. The PCMU/PIU will be involved in implementing the
IPP/RAP, as the case may be, and resolution of any dispute arising out of the implementation process.
Consultations and information disclosure will be undertaken to ensure that needs, priorities and
preferences of IPs are adequately dealt with. The strategy of consultation, therefore, would be to promote
participation of the IPs, initiating and identifying people’s need, priorities and preferences through
participatory approaches. Consultations will be held to:
● Create awareness
● Bring various stakeholders on a common platform
● Seek information
● Pass on information
● Capacity building
The key stakeholders to be consulted during sub-project preparation and implementation includes:
● All CBOs / FPOs, including women led CBOs and vulnerable households
● Stakeholders in the value chain
● Host populations in project sites (if any)
● Elected representatives, community leaders/ Indigenous leaders
● Local government and relevant government agency representatives
● Project staff
15 In case of land acquisition, RAP/ARAP will be prepared in compliance with the OP4.12

164
[Title]
9.1.2 Collaboration
Collaboration with citizens in decision-making processes and events results in more responsive decisions
to citizens’ needs and improves the sustainability of project outcomes through increased ownership by
citizens. SMART can opt for any of the following mechanisms for collaboration:
● Citizen/CBOs membership in decision-making bodies
● Participatory planning and budgeting
● Formation of social audit committees.
9.1.3 Collecting, Recording, and Reporting on Inputs from Citizens
Citizen feedback can be collected periodically on various dimensions of project interventions, such as
effectiveness, inclusiveness, quality, delivery time, transaction costs, and targeting, as well as on resource
utilization or engagement processes. Tools include satisfaction surveys, focus group discussions, hotlines,
community scorecards, citizen report cards, or SMS/online feedback. Following tools are suggested:
● Beneficiary Satisfaction Surveys: Under the project, PCMU can conduct beneficiary satisfaction survey
with various stakeholders such as CBOs (farmers), consumers, operators of collection centres,
storages, PIU and DIU staffs, at the start, mid-point and close of project. The information received will
support the Project to
– measure the level of beneficiary satisfaction about the services received through PP, MAP,
including gender aspects and
– Receive feedback from CBOs/FPOs about the effectiveness and efficiency of the Project
interventions.
● Project dissemination workshops and Focus Group Discussions (FGD): The Project can:
– hold regular workshops / FGDs at field levels before launching activities under PPP and MAP to
allow stakeholders, media, and public representatives of opportunity to interact with the Project
officials and other relevant personnel
– implement the SMF to ensure access and rights of all persons in accessing the facilities under the
Project
– ensure all official public documents and the Project website include contact information for
conveying any issue on the Project activities.
● SMART Web Portal – An exclusive web portal to disseminate information about the project can be
created. The web portal can include details about project components, sub-components, activities,
implementing arrangements, locations, services offered, physical and financial progress, safeguard
mechanisms, reports and documents. The project can have online provision and toll-free number
where citizens could provide their feedback and register grievances.
● Installation of Feedback-boxes at District Implementing Units –The box to be placed at visible and
accessible locations and citizens be provided with the option of providing feedback with or without
disclosing their identity.
9.2 Disclosure
The IPP/ RAP prepared in consultation with affected people (IPs, vulnerable and others) will be translated
into local language or any other medium which will be understood by the affected and made available to
them before implementation with the assistance of PCMU/PIU. The PCMU will ensure that adequate funds
will be made available for consultation and facilitation. Indigenous Peoples may be particularly vulnerable
when project activities include:
● Commercial development of the cultural resources and knowledge of Indigenous Peoples
● Physical displacement from traditional or customary lands
165
[Title]
● Commercial development of natural resources within customary lands under use that that would
impact the livelihoods or the cultural, ceremonial, or spiritual uses that define the identity and
community of IPs.
In deciding whether to proceed with a project involving such project activities, the PCMU/PIU will seek the
consent of affected communities. The IPP or RAP will further be disclosed in the website of PCMU/PIU and
WB, including in the local language.
9.3 Grievance Redress Mechanism (GRM)
The PCMU will establish a mechanism to receive and facilitate resolution of the affected people’s
concerns, complaints, and grievances. The WB procedures require SMART PCMU to establish a project
specific Grievance Redress Mechanism (GRM) having suitable grievance redress procedure to receive and
facilitate resolution of affected peoples’ concerns, complaints, and grievances about the social and
environmental performance at CBO level for PP/MAP. For this project, PCMU would ensure that a
Centralized Control and Monitoring System (CCMS) is established at the Department level that will provide
the adequate platform for the GR and will be streamlined to address issues of all the relevant stakeholders
of the project like CBOs, local community, contractors, and other members in the value chain. This system
will ensure that all the grievance of the stakeholders, including IP community, is addressed in a time bound
and effective manner. At each level of the project, there will be a designated representative, to look at the
grievance raised at the workplace and ensure timely mitigation measure for the same. There will also be
a provision of continuous monitoring of the system to track the issues and the solution. Monitoring the
system will be beneficial in the trend analysis of the issues and the effectiveness of the system to resolve
the same
In cases of tribal / Indigenous peoples, wherever relevant and wherever traditional mechanisms are
prevalent, the GRM will be customized to the needs of IPs and other vulnerable community people and to
address the needs of IPs and vulnerable community communities. All such complaints will be discussed in
the specific IP community or locality where the subproject (PP or MAP) is implemented using the existing
practiced traditional conflict resolution procedures. In addition, wherever IPs, primitive indigenous groups
and vulnerable community people are in large numbers, there will be a small ethnic and vulnerable
community representative in the grievance committees. For addressing grievances arising under SMART,
following grievance redressal mechanism is proposed:
9.3.1 Appointment of Grievance Redressal Officer
● The PCMU under SMART shall nominate an officer as ‘Grievance Redressal Officer’ (GRO) to deal with
all matters relating to public grievances/ complaints. At the PIU/ Regional / District level an official will
be designated to serve the role of GRO.
● The list of GROs must be displayed at all levels. Every office should display at a prominent place/ notice
board the name of GRO with location, contact numbers/ mailing IDs and address along with the specific
visiting hours for hearing / receiving the grievance/complaints of the public.
9.3.2 Grievance/Complaint Submission
● While complaint is made, it can either be made orally or in writing or in person giving details of:
– The name of the individual or organization, postal address, email and/or telephone number (if any)
of the complainant.
– A brief description of the matter which is the source of the grievance, including copies of any
relevant and supporting documents.
– Relief sought
● Grievances may also be submitted in the Complaint Box kept at reception of every office. The
Complaint Box should be opened on daily basis by the GRO. Complaint can also be sent by post.
166
[Title]
● A complaint made through electronic means (e-mail, fax) should also be accepted and
acknowledgment should be sent using any of the communication means. The complaints may also be
sent to the e- mail address of the GRO of PCMU, SMART i.e., or may be submitted at webpage.
● In case the complainant is not satisfied with the response at a certain level, he/ she will be free to
approach the next level.
9.3.3 Grievance Redressal Procedure
● Every application/complaint received should be tagged with a specific reference number (the project
can set-up online GRM/mobile-enabled). The grievance system should be continuous and regularly
monitored by the PCMU staff.
● Every application or petition should be acknowledged through standard acknowledgement slips or a
copy of the receipt which should be dispatched to the complainant within 3 days of receipt of
complaint or handed over to person at the time of receipt for complaints submitted in person.
● Every application should carry such a slip for future reference indicating the name, designation and
telephone number of the official who is processing the case. The time frame in which a reply will be
sent should also be indicated (the ideal time suggested is 7 days).
● The complainant should be quickly informed of the action taken by way of redressal within proposed
response time suggested at each level.
● A record of all complaints received, and action taken till disposal should be maintained at each level
(complaint registers and /or online).
● A reply to any grievance must cover all points raised and not address the grievance partially. If there is
any follow- up action, it must be pursued.
● No grievance is to be rejected without having been independently examined. At a minimum, this
means that an officer superior, to the one who delayed taking the original decision or took the original
decision that is cause for grievance, should examine the case as well as the reply, intended to be sent
to the complainant. If a complaint is rejected, the reasons for such rejection must be made explicit and
should be intimated to the complainant with in the time frame.
● The Complaints related to PCMU will be dealt directly by the GRO of the PCMU and redressal will be
done as per fixed time frame. The decision of the PCMU will be final and will be abided. However, in
all cases, complainant will be free to exercise his/her rights to approach judicial system.
● Grievance redressal mechanisms will consider the vulnerability of gender, SC/ST and other vulnerable
populations. A suggested approach for grievance redressal mechanism is being presented in figure
below:
Figure 18: Suggested GRM

167
[Title]
BoD (CBO)
Sub-project Manager
for each
PPP and MAP
Director, Private
Partners
Superintendent
Head, DIU
Joint Director,
Regional level
PIU
Project Coordination and Management Unit (PCMU)
5 days
5 days
5 days
10
days
Complaint Redress Point Response Time
Complaints at village level
7 days

168
[Title]
10 Women’s Participation - Constraints and
Opportunities
10.1 Gender Analysis
Women make essential contributions to agriculture in developing countries, but their role differ
significantly by region and is changing rapidly in some areas. On an average, 43 percent of women’s labour
is involved in agriculture in the world16. It varies by country, region, crop, social group, production cycle
and ethnic group. Women farmers produce more than half of the food in the world and particularly 80
percent in Africa and 60 percent in Asia. Only 5 percent of the women access agriculture extension
resources, and 2 percent have the land title (Patta) in the world. Women comprise 50 percent of
agriculture labour force in Eastern Asia & Sub-Sahara Africa and 20 percent in Latin America17. In
developing countries in Africa, Asia and the Pacific, women typically work 12 to 13 hours per week more
than men; yet, women's contributions are often 'invisible' and unpaid18.
10.2 Women in Indian Agriculture: Statistics
Participation of both men and women in agriculture has declined, but the rate of decline has been faster
among men than it has among women. Decline among women has been specifically in relation to their
roles as cultivators; however, their numbers as agricultural labourers has increased.
The Agriculture Census (2010-11) shows that out of an estimated 118.7 million cultivators, 30.3 percent
were females. Similarly, out of an estimated 144.3 million agricultural labourers, 42.6 percent were
females. However, only 12.8 percent of the operational holdings were owned by women, which reflect
the gender disparity in ownership of landholdings in agriculture. Moreover, there is concentration of
operational holdings (25.7 per cent) by women in the marginal and small holdings categories. Women's
participation rate in the agricultural sectors is about 47 percent in tea plantations, 46.84 percent in cotton
cultivation, 45.43 percent in growing oil seeds and 39.13 percent in vegetable production.19 While these
crops require labour-intensive work, the work is considered quite unskilled.
10.2.1 Issues Faced by Women in Agriculture
• Access to land and credit: The challenges are huge for smallholder women farmers because they face
higher entry barriers than men in modern value chains. For instance, women have the least access to
and control of productive resources such as land, capital and agricultural services like credit and
training that are necessary for increasing yields and moving from subsistence to market oriented
production. As per Census Agricultural Census (2015-16), out of a total 146 million operational
holdings, the percentage share of female operational holders is only 13.87 percent.
• Land ownership opportunities also have a critical impact on human development with freedom from
violence. According to a 2005 study of marital violence and property ownership, 49 percent of property
less women experience physical violence and 84 percent experienced psychological abuse. Ownership
rights saw a drastic decrease in violence. Among women who owned both land and house there was
only 7 percent physical violence and 16 percent psychological abuse.20
• Access to agricultural inputs: Likewise, the distribution and access to agricultural of inputs (seeds,
fertilizers, pesticides) and human capital favours men and the differences in rights and responsibilities
16 FAO Report 1984
17 Value Chain Analysis with gender focus-CGIAR 2013/14 18 The cost of the gender gap in agricultural productivity ,UN Women/World Bank 2015 19 2009.Centre for Trade and Development and Heinrich Boell Foundation. “EU FTA and the Likely Impact on Indian Women Executive Summary." 20 Pradeep Panda and Bina Agarwal. "Marital Violence, Human Development and Women’s Property Status in India."

169
[Title]
within the household bring about inefficient resource allocation and constrain women’s ability to
respond to price incentives.
• Access to technology: Mechanization of agriculture has resulted in confinement of women in low
paying traditional works. Further, most farm machinery is difficult for women to operate and are not
women friendly.
• Access to education, training and extension services: Access to education, agricultural training and
extension services for women has been predominantly low as compared to men.
• Managing different roles: In addition to intensive work on the farm all day, women are also expected
to fulfil domestic obligations like cooking, child rearing, water collection, fuel wood gathering,
household maintenance, etc.
• Wage: Despite more work for longer hours when compared to male farmers, women farmers have
lower wage rates and at times remain unpaid.
• Marketing: Small and marginal farmers in India lack adequate access to marketing facilities due to lack
of basic infrastructure like market yards, roads and transportation, and storage including freezers and
presence of middleperson. Additional constraints for women include seclusion, lack of literacy,
knowledge and information. Further, women have no representation in agricultural marketing
committees and other similar bodies.
Furthermore, women’s engagement in agricultural production and marketing activities does not
necessarily translate into increased incomes for them or improved decision making regarding the use of
the income generated from agricultural activities (Dolan and Sorby 2003; FAO 2011). Women constitute
only 20-30 percent of agricultural wage workers in modern agricultural value chains yet these chains
usually offer wage and self-employment with better pay and working conditions than traditional
agriculture (FAO, ILO and IUF, 2007).
• Decision making: Traditionally women are not involved in the decision making of land, selection of
crop, selection of inputs (seeds, fertilizers & pesticides), credit, extension and market. Decisions are
dominated by men in all activities.
• Violence: Violence and sexual harassment at workplace is a major issue faced by women agricultural
labours and cultivators in India which mostly goes unreported.
• Health and Occupational Hazards: Women face health hazards in the cultivation of many crops and
plantations due to lack of training, lack of protective gears and long working hours. Lack of nutritional
security further perpetuates health issues.
10.2.2 Gender Division of Labour
The typical work of the female agricultural labourer or cultivator is sowing, transplanting, fertilizer
application, weeding and harvesting, which often fit well within the framework of domestic life and child-
rearing. In all activities there is an average gender wage disparity, with women earning only 70 percent
of men's wage21.Additionally; many women participate in agricultural work as unpaid subsistence labour.
Women contribute significantly in the production stage of value chain and in post-harvest operations like
cleaning, sorting, grading and packaging but they are nearly invisible in the marketing stage of value chain.
10.2.3 Value-chain Analysis
The section is based on primary data analysis of two categories of women namely in male led CBOs and
female-led CBOs, as shown in table below:
21 http://www.in.boell.org/downloads/Summary_agr.pdf

170
[Title]
Table 63: CBO details with respect to female membership and social category
Type of
CBO
perce
nt of
CBO
Female
membership
in the CBOs
Women
headed
households
Women
board of
director in
the CBO
Women
signatory
in the
board of
directors
SC
members
ST
members
Women
CBOs
25
percent
100 percent 9 percent 100 percent 100 percent 10 percent 8 percent
General
CBOs
75
percen
t
21 percent 4 percent 20 percent 1 percent 4 percent 1 percent
Source: Field survey
The table shows increase in the percentage of women, in the women CBOs, economically active in
agricultural sector either as self-employed or as agriculture wage workers or unremunerated family
workers.
Several reasons are attributing to this trend, the most critical is levels of increasing poverty among rural
community, which have forced women to work as agricultural labourers to supplement the family’s
income; women also work as unremunerated workers in family fields. Another reason is shift of men to
casual work and to urban areas, because of agrarian distress. Large number of males are shifting from
agriculture to casual work.
According to a 2013 report published in The Hindu, between 2001 and 2011, a total of 7.7 million farmers
left agriculture. With rising shift of men from farm to non-farm activities, women are forced to work in
agricultural and allied activities, however, their contribution goes unnoticed and unaccounted.
Mechanization of agriculture being another reason, wherein, due to increased mechanization of
agriculture, men have moved to other non-farm activities, while women have been confined to traditional
roles, such as: winnowing, harvesting, sowing seeds and rearing livestock.
Despite globalisation, upward mobility of women for employment is still restricted and is further
constrained by gender wage differentials. As per reports, about 33.7 percent of rural males migrate for
reasons of employment and better economic opportunities. However, in the case of females, it is as low
as 3.6 percent for rural females.
As per the stakeholder consultation and primary survey, it is found that the challenges are huge for women
to the transition to high value agriculture (HVA) and agribusiness. Unlike men, women have the least
access to and control of productive resources such as land, capital and agricultural services like credit and
training. Likewise, the distribution of physical (land, agricultural equipment, and livestock) and human
capital favours men and the differences in rights and responsibilities within the household bring about
inefficient resource allocation and constrain women’s ability to respond to price incentives. For instance,
women have the least access to and control of productive resources such as land, capital and agricultural
services like credit and training that are necessary for increasing yields and moving from subsistence to
market oriented production. Likewise, the distribution of physical (land, agricultural equipment, and
livestock) and human capital favours men and the differences in rights and responsibilities within the
household bring about inefficient resource allocation and constrain women’s ability to respond to price
incentives.
The primary results show that the challenges are even higher in case of women only CBOs, wherein
majority of women are found to be concentrated in the lower end of the chain and perform unskilled
manual labour in high value agricultural value chains, lack access to organised markets, lack of
infrastructure, exploitation by the middle-men, etc. are some of the common issues that women producer
groups face. Poor financial portfolio, lack of technical expertise and experience in post-harvest
management and marketing, adversely affects their prospects of bank loans. Further, women headed
households are identified among the vulnerable group that would require special attention during the
project implementation. A Gender Action Plan (GAP) has been prepared under the project to provided

171
[Title]
special assistance and allowance to women beneficiaries to ensure their increased participation. The
Figure 19 below depicts key challenges faced by women-led CBOs.
Figure 19: Major challenges faced by women-led CBOs
Source: Field survey
10.3 Gender Analysis of Value-chain
Attempt has been made to bridge the afore-mentioned gaps and come up with interventions that are
tailored to the needs of smallholder women farmers, with a view to improving their access to and
participation in markets for high value agricultural commodities as well as gains from such value chains.
Cotton and okra value chains have been presented in this section as a case study, though, the analysis is
true for most of the commodities. The focus is on women as one of the categories of gender because
women and men are likely to be involved at different stages of the chain. Yet, those stages of the chain
where women are involved are often less visible but may constitute critical links at which changes and/or
upgrading should occur in order to bring about development of the chain. The figure below shows gender
Division of labour and access and control over resources:
Women play a critical role in cotton cultivation. The analysis helps build an understanding of the gender
division of roles and responsibilities in the farm, participating in decision-making and access to productive
resources. The analysis includes building an understanding of current farm practices, the labour burden,
and access to ecosystem support in the form of trainings, finance, extension services and government
schemes. The analysis examines both the economic contributions of women cultivators on the farm and
the various barriers that limit their role in cultivation.
Lack of Market Intellige
nce
Lack of Infrastruc
ture/ storage
Lack of access to organised market
Lack of experience on post harvest
management
Low equity base
Lack of market exposur
e
Exploitation by
middle persion
Distance from market
Fair price
for the produc
e
Access to state warehouse on
subsidized rate

172
[Title]
Figure 20: Gender division of labour for Cotton
Source: Field survey
Figure 21: Access and Control Over Resource- Cotton
Access Control and Decision Making
● Land
● Inputs (seed, fertilizer, pesticide)
● Credit
● Implements
● Extension Services
● Technology
● Warehouse
● Market
● Market Intelligence Services
● Land
● Inputs (seed, fertilizer)
● Credit (only farm owner)
● Implements (limited access due to lack of women friendly equipment)
● Extension (limited to farm owner only)
● Technology (only farm owner)
● Warehouse (only farm owner)
● Market (Negligible access)
● Market Intelligence services Negligible access
● Land
● Inputs
● Credit
● Implements
● Market
● Training
● Income
Source: Field survey
The results show that women are concentrated in the lower end of the chain and perform unskilled manual
labour in high value agricultural value chains. Women are generally segregated in certain nodes of the
chain that require relatively unskilled labour, are routine and require keenness and patience. This reflects
cultural stereotypes on gender roles and abilities. For instance, women working in cotton value-chain are
involved in sowing, stubble picking, fertilizer application and cotton picking. These activities require less
physical energy but are time consuming, tedious and low paying. Men, on the other hand, are involved in
carrying, manure and other inputs and land preparation, spraying which though are labour intensive, but
are paying.
Value chain
Land preparation
Production
Post Harvest
Marketing
Ploughing-100 percent
Harrowing-100 percent
Uprooting of cotton-100 percent
Fertilizer application-10 percent
Pesticide spraying-100 percent
Transportation100 percent
Harvesting-5 percent
Transportation (100 percent)
100 percent
Stubble picking-100 percent
Sowing-100 percent
Weeding-100 percent
Fertilizer application-90 percent
Harvesting-95 percent
Water supply for spraying-100 percent
Home Storage (100 percent)
Marketing (nil)

173
[Title]
At the household level, women tend to be fully involved in the production and more women than men
manage cotton (cent percentage women participation for storage at home), but they rely on their spouses
for capital and more men than women in male headed households tend to be involved in decision making
on where and when to sell final produce.
The results from other commodity “Okra” indicate that in male headed households, men decide on the
sale of okra of premium quality that goes to the export market while joint decision making is prevalent
when the okra is of inferior grade. The okra of low quality is usually sold by women to consumers or small
traders and the proceeds are generally low, hence the women tend to have control of the income.
Likewise, joint decision making on how to use proceeds from any commodity (this pattern is common)
appears to be common in households headed by men, and fewer women than men control proceeds in
such households. Consequently, the results suggest that interventions geared towards enhancing the
participation of women in the different stages of value chain at the household level will differ for the
different categories of women and will depend on the degree of commercial orientation of the produce.
For instance, women in female headed households, who are in most cases widowed, automatically assume
the role of the household head and hence have access to and control of productive resources. This group
of women can make decisions regarding production, marketing and use of the proceeds from avocado.
Besides, this category of women is eligible to become a member of the avocado farmers group since they
can assume ownership of the trees after the death of the husband. As such, integrating widowed women
into the agricultural commodity markets, especially in the male dominated enterprises may only require
alleviating constraints that limit their participation in such markets, such as financial constraints and
inadequate access to market information, among other constraints, to make informed decisions.
The findings also suggest that more female than male producers tend to sell their produce to middleman/
brokers despite the low returns obtained from this category of buyer, suggesting that women are not
necessarily chain owners. Similarly, more women in female headed households are found to sell their
produce to brokers because middlemen offer instant payments in addition to meeting the cost of
transportation, harvesting and grading. Furthermore, rejection rates are seen to be lower when the
produce is purchased by middlemen than by the exporter, because brokers have several market options
including traders and processors. Women in female headed households appear to be liquidity constrained,
which affects the products quality. Exporters unlike brokers only cater for transportation of the produce
to designated collection points, yet women in female headed households lack the cash to hire transport
or labour to move the produce to the required collection points. This explains why the women prefer
buyers like brokers who buy at the farm gate and do not select the produce. The women, however, seem
to operate in a vicious cycle of limited capital and low productivity because of reliance on brokers.
Therefore, strategies that aim at alleviating financial constraints such as linking this category of women to
financial service providers is likely to facilitate their integration into the value chain.
On the other hand, women in male headed households (women in the general CBOs) whose husbands
engage in other more lucrative activities may require a different approach to integrate them into the key
stages of the value chain, particularly with regards to participation in export marketing and decision
making on how to use proceeds from the produce. Under this circumstance, the women in most cases
participate in providing labour or tending to the crop and only make decisions on marketing of the produce
(such as okra) of inferior quality. Because men make decisions involving sales of okra of premium quality,
women are left to collect the rejected pieces, which they sell to retailers in the nearby markets. Therefore,
this category of women will need a multifaceted approach to integrate them into the export end of the
value chain since they have limited control of the resources and skills required to produce good quality
product. Likewise, these women are of major interest, particularly in the export chain, because the men
by virtue of their gender, attend training on certification standards, including good agricultural practices,
yet the women are the main managers of the crops.
The gender analysis of Okra, Turmeric and Soybean is presented in Appendix E.
Based on the above, the following is suggested:

174
[Title]
● Analysing complex social issues surrounding intra-household resource allocation and gender relations
for each commodity, while preparing PP and MAP
● Endorsement of PP and MAP by farmers
● Gender sensitization and gender analysis workshop to CBO directors/members
● Capacity building on certification standards, esp. for women CBOs
● Enhancement in marketing skills for women CBOs
● Women friendly equipment/implements
● Adequate financial support to women CBOs
● Training on post-harvest management practices like Food safety and personal hygiene, quality
parameter, storage
● Training on better agricultural practices
● Enabling environment to women staff of CBOs including establishment of internal Sexual Redressal
committee at CBO level
Based on the above analysis, the gender strategy drafted for the project is presented in the following.
10.4 Gender Strategy
The significant aspect of the strategic approach for the SMART Project must be to increase women’s
participation in the higher levels of identified agri-value chains through inclusion in every component.
Hence the following targets are suggested for inclusion:
● As indicated in the inclusion plan earlier, the project could commit to a target of minimum 30 percent
all-women CBOs out of total CBOs formed
● Project could ensure minimum 20 percent women membership (shareholders) and 20 percent women
on the board of directors across all FPOs selected to participate in the project by the end of the
respective sub-project period
The gender interventions and actions in the Project would focus on three major areas:
1. Specific activities to achieve the strategic target
2. Gender Mainstreaming in the Project
3. Ensuring enabling environment for women at workplace.
The detailing of activities and budget must be mentioned in the Gender Strategy.

175
[Title]

176
[Title]
11 Construction Management Guideline
Construction related environmental impacts are anticipated during the expansion of existing warehouses
/ cold storage or setting up of new warehouses / Retail outlets by CBOs during the Project implementation
as per requirements indicated in Component 1 and Component 2 of the SMART project. Construction
management guideline will be applicable in case of any construction activity to be undertaken by the
Project and shall be complied by the construction contractor hired under the SMART project.
11.1 Applicable Permits
● Environmental clearance under Environmental Protection Act 1986 as per Environmental Impact
Assessment (EIA) Notification 2006 in case the built-up area exceeds 20,000 sq. m.
● Forest Clearances under Forest (Conservation) Act 1980 in case the construction activities include
forest land.
● Costal Regulation Zone (CRZ) clearance under the CRZ notification 2011 and its amendments if the
construction activity includes CRZ area.
● Consent to Establish under Water Act 1974 and Air Act 1981 for construction of warehouse/ retail
outlets/ cold storages.
● No Objection Certificate (NOC) from Pollution Control Board for operating D.G set during
construction if any
● Layout plan approval from Concerned Local Authority for Local Bye Law Compliance.
● Building plan approval / construction commencement certificate from Concerned Local Authority.
● Approval for Usage of water from Water Resource Department or Central Ground Water Authority in
case of Bore well usage.
● Permission for usage of Power from State Electricity Board / Power Distribution Company for power
requirement during construction.
● Permission for storage of diesel for operating D.G set from Petroleum and Explosives Safety
Organisation (PESO).
● In case of inevitable circumstances if felling of trees cannot be avoided, then permission shall be
obtained from Concerned Forest Department prior to felling of trees.
● Pollution Under Control (PUC) certificate for all construction vehicles and equipment used for the
construction activity.
● Registration under Building and Construction Workers (Regulation of Employment and Condition of
Service) Act 1996
11.2 Environmental Management Plan
Environmental Management Plan (EMP) to be complied by the Contractor during the construction stage
is as indicated in the table below.
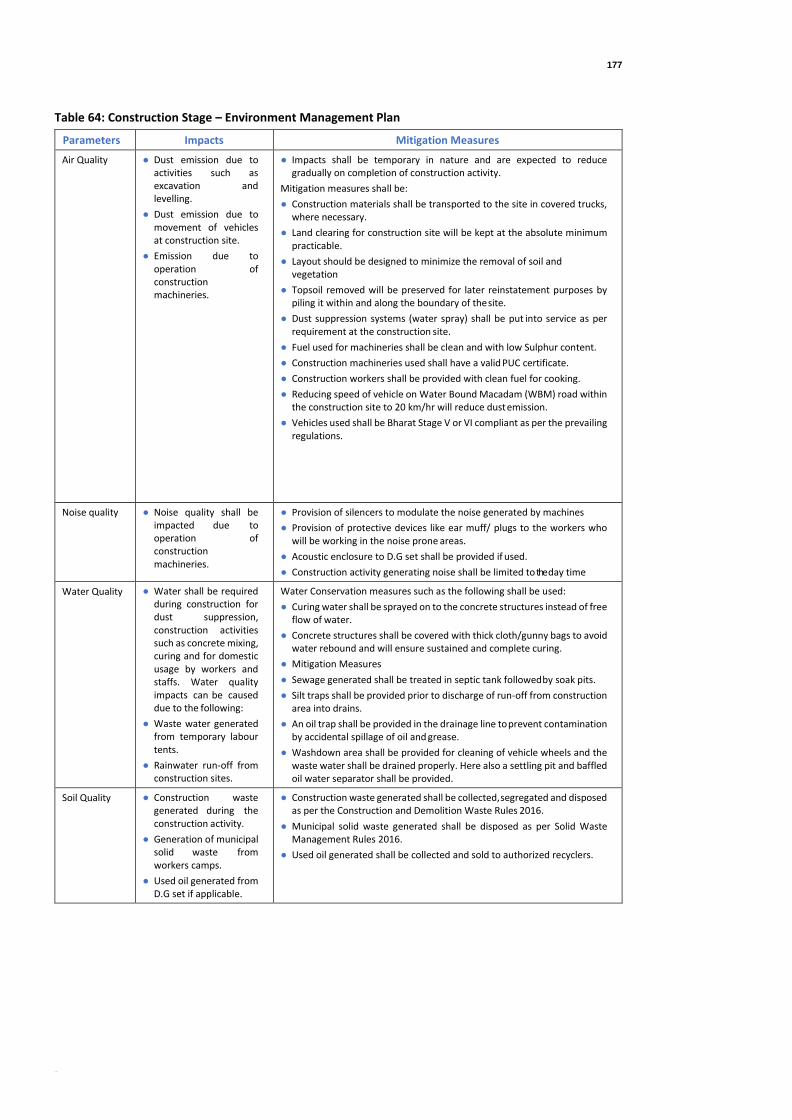
177
[Title]
Table 64: Construction Stage – Environment Management Plan
Parameters Impacts Mitigation Measures
Air Quality ● Dust emission due to activities such as excavation and levelling.
● Dust emission due to movement of vehicles at construction site.
● Emission due to operation of construction machineries.
● Impacts shall be temporary in nature and are expected to reduce gradually on completion of construction activity.
Mitigation measures shall be:
● Construction materials shall be transported to the site in covered trucks, where necessary.
● Land clearing for construction site will be kept at the absolute minimum practicable.
● Layout should be designed to minimize the removal of soil and vegetation
● Topsoil removed will be preserved for later reinstatement purposes by piling it within and along the boundary of the site.
● Dust suppression systems (water spray) shall be put into service as per requirement at the construction site.
● Fuel used for machineries shall be clean and with low Sulphur content.
● Construction machineries used shall have a valid PUC certificate.
● Construction workers shall be provided with clean fuel for cooking.
● Reducing speed of vehicle on Water Bound Macadam (WBM) road within the construction site to 20 km/hr will reduce dust emission.
● Vehicles used shall be Bharat Stage V or VI compliant as per the prevailing regulations.
Noise quality ● Noise quality shall be impacted due to operation of construction machineries.
● Provision of silencers to modulate the noise generated by machines
● Provision of protective devices like ear muff/ plugs to the workers who will be working in the noise prone areas.
● Acoustic enclosure to D.G set shall be provided if used.
● Construction activity generating noise shall be limited to the day time
Water Quality ● Water shall be required during construction for dust suppression, construction activities such as concrete mixing, curing and for domestic usage by workers and staffs. Water quality impacts can be caused due to the following:
● Waste water generated from temporary labour tents.
● Rainwater run-off from construction sites.
Water Conservation measures such as the following shall be used:
● Curing water shall be sprayed on to the concrete structures instead of free flow of water.
● Concrete structures shall be covered with thick cloth/gunny bags to avoid water rebound and will ensure sustained and complete curing.
● Mitigation Measures
● Sewage generated shall be treated in septic tank followed by soak pits.
● Silt traps shall be provided prior to discharge of run-off from construction area into drains.
● An oil trap shall be provided in the drainage line to prevent contamination by accidental spillage of oil and grease.
● Washdown area shall be provided for cleaning of vehicle wheels and the waste water shall be drained properly. Here also a settling pit and baffled oil water separator shall be provided.
Soil Quality ● Construction waste generated during the construction activity.
● Generation of municipal solid waste from workers camps.
● Used oil generated from D.G set if applicable.
● Construction waste generated shall be collected, segregated and disposed as per the Construction and Demolition Waste Rules 2016.
● Municipal solid waste generated shall be disposed as per Solid Waste Management Rules 2016.
● Used oil generated shall be collected and sold to authorized recyclers.

178
[Title]
Occupational Health and Safety
Contractor shall maintain a safe, healthy and hygienic work environment during the construction stage and shall comply with the IFC General EHS Guideline, April 2007. Some of the general measures to be adopted are as follows:
● Workers at site shall be provided with clean drinking water as per BIS specification (IS 10500-2004).
● Adequate drainage and waste disposal sites shall be provided at site.
● Proper drainage shall be maintained around the sites to avoid water logging leading to various disease.
● Adequate sanitation and waste disposal facility shall be provided at construction camps by means of septic tank, soakage pits etc.
● Safety of workers undertaking various operations during construction will be ensured by providing appropriate Personnel Protective Equipment (PPEs) such as helmets, masks, safety goggles, safety belts, ear plugs etc.
● At every work place, a readily available first aid unit including an adequate supply of dressing materials, a mode of transport (ambulance), nursing staff and an attending doctor will be provided.
● Measures shall be taken to prevent breeding of mosquitoes at site.
● The Contractor will organize awareness program on Human Immunodeficiency Virus (HIV), Acquired immunodeficiency syndrome (AIDS) and Sexually Transmitted Diseases (STDs) for workers on periodic basis.
● Contractor shall comply with all the precautions as required for the safety of the workmen as per the International Labour Organization (ILO) Convention.
● Contractor shall comply with all regulations regarding safe scaffolding, ladders, working platforms, gangway, stairwells, excavations, trenches & safe means of entry & egress.
● Minimize significant hazards, where elimination & isolation are both impractical.
● Maintaining accident register at site to record and document occupational accidents, diseases and incidents, causes of the event along with corrective measures taken.
● Emergence prevention, preparedness and response arrangements shall be prepared for the site
● No child labour shall be utilized in the project.
● The following Act shall be complied regarding manpower:
● Minimum Wages Act, 1948
● Contract Labour (Regulation & Abolition) Act1970
● Inter-State Migrant Workmen (Regulation of Employment & Conditions of Services) Act, 1979
● The Building and other Construction Workers (Regulation and Employment of Service) Act, 1996
● The Building and other Construction Workers Welfare Cess Act, 1996
Design Elements for energy efficiency
General measures that shall be adopted in the design for energy efficient and sustainable design of building for Warehouse, Cold Storages, etc. by Retailers / CBOs are as follows:
● Building design shall utilize maximum natural daylight and rely minimum on artificial lighting.
● Use low energy Light Emitting Diode (LED) lighting system to reduce their energy usage.
● Waste management based on the concept of reduce, reuse and recycle shall be adopted to promote waste avoidance ahead of recycling and disposal.
● Electrical / electronic equipment used in the facility shall be of 3 star and above rating.
● Warehouse and Retails shall utilize solar energy for internal and external lighting to the extent possible.
● Construction material to the extent possible shall be sourced locally to reduce carbon foot print.
● Building material to the extent possible considering the design requirement shall utilize recyclable material such as fly ash bricks.
● Refrigerator trucks shall be energy efficient and Bharat Stage VI and above compliant as per the prevailing norms.
● Cold Storages and Retails shall use refrigerants that are environment friendly and non-ozone depleting and adhere to Ozone Depleting Substances (Regulation and Control) Rules, 2000 and its amendments.
● HVAC (Heat Ventilation and Air Conditioning) system used shall be energy efficient.

179
[Title]
Labour Camp and working condition
● The contractor will provide safe working condition for the workers;
● Contractor will maintain register of attendance of workers, register of grievance, accident recording system;
● Contractor will provide safe and hygienic condition in the labour camp;
● Separate toilet for women and men worker will be provided;
● Required personal protective equipment will be provided by the contractor;
● Safe drinking water supply will be provided in the labour camp;
● Clean eating area will be provided at the construction site and labour camp;
● First aid box will be provided at the construction camp and labour camp;
● Creche will be provided in the labour camp for the kid of labours
● Proper ventilated shed for living rooms will be provided in the labour camp;
● All labour shall be provided with Cots for sleeping;
● Necessary training will be provided to all workers prior to start of the work;
● The labour camp will be set up at sufficient distance from community; and
● Contractor will ensure that no conflict between labours and local community arise. This will be ensured by provided separate electricity connection, water supply and other dedicated facility to the labour
camp which does not hamper the requirement of the local community.
Source: MM Analysis
11.3 Environmental Clauses for Bid Document
Environmental clauses to be included in the bid document are delineated in the subsequent subsections.
11.3.1 Environmental Protection
● Contractor shall be responsible for implementation of Environmental Management Plan (EMP) in
addition to adhering to all environmental provisions in applicable specification for the work as part of
good engineering practices.
● All works undertaken towards protection of environmental resources as part of the EMP and as part of
good engineering practices while adhering to relevant specifications will be deemed to be incidental to
works being carried out and no separate payment will be made unless otherwise specified explicitly.
The cost towards environmental management as per EMP unless otherwise provided as a separate
head, will be deemed to be part of Bill of Quantity of the project. The Scope of Work (SoW) of the
Contractor towards implementation of environmental provision shall be as follows:
● Abide by all existing environmental regulation and requirements of the Government of India and State
Government of Maharashtra during implementation.
● Comply with all mitigation measure and monitoring requirements set out in the EMP.
● Submission of methodology stating how EMP will be complied including method and schedule of
monitoring.
● Monitoring of project environmental performance and periodic submission of monitoring report.
● Compliance with all measures required for construction activities in sensitive areas (if any), including
protected areas, in line with the regulatory requirements adopted by MoEF & CC, GoI.
● Compliance of all safety rules at work, and provision of adequate health and safety measures such as
water, food, sanitation, personal protective equipment, workers insurance, and medical facilities.
11.3.2 Construction Material
● The Contractor should procure construction materials from the licensed/ authorized agents/ dealers.
Procurement of materials from the unauthorized sources shall be considered as illegal and appropriate
measures shall be taken.
● Quarrying, if required in the project will be only from approved quarries and no new quarries will be
opened for the project. Any deviation from the provisions will be immediately notified and approval of
the Engineer must be sought.
● The Contractor shall maintain all borrow sites, stockpiles, and spoil disposal areas to assure the stability
and safety of the works and that any adjacent feature is not endangered, and to assure free and

180
[Title]
efficient natural and artificial drainage, and to prevent erosion. Stockpiling of materials (topsoil, fill
material, gravel and other construction materials) shall not be allowed during rainy season unless
covered by a suitable material. Storage on private property will be allowed if written permission is
obtained from the owner or authorized lessee.
● Construction and Demolition waste shall be handled as per the provisions laid down in the C&D Waste
Management Rules 2016.
11.4 Protection of Environmental Resources
● The Contractor shall ensure that construction activities do not result in any contamination of land or
water by polluting substances.
● Unless otherwise provided in the specifications, the Contractor shall ensure that no trees or shrubs or
waterside vegetation are felled or harmed except those required to be cleared for execution of the
works. The Contractor shall protect trees and vegetation from damage to the satisfaction of the
Engineer (Line Department).
● The Contractor shall not use or permit the use of wood as a fuel for the execution of any part of the
works and to the extent practicable, shall ensure that fuels other than wood are used for cooking and
heating in all camps and living accommodations. Any wood so used must be harvested legally, and the
Contractor shall provide the Engineer with copies of the relevant permits, if required.
● The Contractor shall take all precautions necessary to ensure that vegetation existing adjacent to the
project site is not affected by fires arising from the execution of the contract. Should a fire occur in the
natural vegetation or plantation adjacent to the project site for any reason, the Contractor shall
immediately suppress the same. Areas of forest, shrub, or plantation damaged by fire considered by the
Engineer to have been initiated by the Contractor’s staff or laborers shall be replanted or otherwise
restored.
● The Contractor shall confine operations to the dry season, use silt traps and dispose spoils/ debris in
locations approved by the Engineer that will not promote instability and result in destruction of
property, vegetation, irrigation and water supply. Disposal near wetlands/ beels, protected areas, and
other areas that will cause inconvenience or deprive residents of their livelihood shall not be allowed.
Acidic and saline spoils shall not be allowed into agricultural land.
● The Contractor shall consult with residents and local government before locating project offices, sheds,
and construction plant. The work camps shall not be located near settlements, near drinking water
supply intakes, protected areas, or wildlife habitats.
● The Contractor shall maintain ecological balance by preventing felling of trees, water pollution and
defacing of natural landscape. The Contractor shall, so conduct his cleaning operations, as to prevent
any avoidable destruction, scarring or defacing of natural surroundings. In respect of ecological
balance, the Contractor shall observe the following instructions.
● In the conduct of cleaning activities and operation of equipment, the Contractor shall utilize such
practicable methods and devices as reasonably available to control, prevent and otherwise minimize
air/water/noise pollution.
11.4.1 Noise and Water Pollution
● All works shall be carried out without unreasonable noise and air pollution. Subject and without
prejudice to any other provision of the Contract and the law of the land and its obligation as applicable,
the Contractor shall take all precautions outlined in the EMP to avoid the air and noise pollution.
● The Contractor shall monitor the environmental parameters periodically as specified in the monitoring
plan and report to the Engineer.
● The Contractor shall indemnify and keep indemnified the Employer from and against any liability for
damages because of noise or other disturbance created while carrying out the work, and from and

181
[Title]
against all claims, demands, proceedings, damages, costs, charges, and expenses, whatsoever, in
regard or in relation to such liability.
11.4.2 Occupational Health and Safety during Construction
The Contractor shall, in accordance with the safety and health provisions specified in the EMP, provide
workers with a safe and healthy working environment, in the work areas, through application of
preventive and protective measures consistent with international good practice, as reflected in
internationally recognized standards such as IFC EHS guidelines.
11.4.3 Post Construction Clearance
On completion of work, wherever applicable, the Contractor shall clear away and remove from the sites all
constructional plant, surplus materials, rubbish, scaffoldings and temporary works of every kind and leave
the whole of the site and works in a clean condition to the satisfaction of the Engineer.
Construction camp sites post construction shall be cleared as specified in the EMP and handed over to
the Owner. It will be ensured by the contractor that the site handed over is in line with the conditions of
temporary acquisition signed by both parties.

182
[Title]
12 Good Industrial Practice – Slaughter
house
The existing or the new Slaughter house's which is planned to be supported by SMART Project shall comply
with Good Industrial Practices as indicated in the subsequent subsections.
12.1 Applicable Slaughterhouse License Requirements
● FSSAI License for slaughterhouse under the Food Safety (License and Registration of food Business)
Regulation 2011.
● Consent to Establish and Consent to Operate under Air Act, 1981 and Water Act, 1974 prior to
construction and operation respectively.
● Permission for usage of Water from Water Resource Department or Ground Water Authority in case
of ground water usage.
● Permission for usage of electricity from State Electricity Board
● Layout plan approval from Concerned Local Authority.
● Layout plan approval under Factory Act, 1948 and License under Factory Act prior to operation.
12.2 Pre-slaughter Handling
● Healthy animals free from diseases should be transported to the slaughter house.
● The transported animals should be in groups of preferably same sex and age to avoid belligerence due
to their social behaviour.
● The vehicles should be thoroughly disinfected with a suitable disinfectant before loading the animals.
Thereafter clean sand layer of about 6 cm should be provided to prevent injuries to the animals
● Enough space shall be provided to animals while transporting. BIS specification for space in
transportation vehicle for sheep and goat are as indicated below:
Table 65: Space Requirement – Transportation of Animals
Approximate Weight of Animal in kg Space requirement in sq. m
Up to 20 0.16 – 0.17
20 – 35 0.18 – 0.19
26 – 29 0.22 – 0.23
30 – 39 0.25 – 0.27
More than 40 0.29 – 0.32
Source: BIS Specification, APEDA Executive Manual Series Volume 2
Vehicles carrying animals for slaughtering into the black zone shall be disinfected to prevent bacterial
contamination in the slaughter house.
12.3 Layout Requirements
● Layout must have built-in biosecurity with two zones clearly demarcated as black zone and white zone
and there should be no cross movement of animals.
● Animals should be registered and tagged in the unloading area and there after kept in covered resting
pen. The detailed examination of the diseased animals should be done in the isolation pen.
● Plant should have lairage, race, abattoir hall, slaughter lines, chillers, deboning and packing area,
freezing and cold storage.

183
[Title]
● Mechanism for identification and traceability should be adopted to be enforced at various stages with
assignment of the batch number.
12.4 Slaughtering Requirements
● Animals to be slaughtered shall be kept in pen for 24 hr with adequate water and shade to alleviate
the stress during transport and for ante-mortem examination by qualified veterinarian and suspected
animals shall be kept in isolation pens.
● Space for resting shall be 0.8 sq. m per goat.
● The slaughtering of animals should not be done in the sight of slaughtered animals.
● It should be done by Halal method with Islamic Shariyat in case producing halal meat with a sharp knife
which should cut carotid vein, carotid artery, trachea and oesophagus in one incision. It should not cut
the spinal cord.
● The carcass after slaughtering is hanged to bleed for 5-6 minutes and then dressing is done on the
slaughter line. It should not be done on the floor.
● The hide is pulled by the de-hider and hide is then pushed through the chute at a place for keeping the
hides. Thereafter the carcass be split in two and eviscerated.
● Floor of the abattoir should be hard, impervious and anti-slippery to check contamination. Internal
walls should be impervious and glazed to a height of 2 m in case of sheep and goat.
● Facility shall have provision for cold and hot potable water in sufficient quantity for washing of
carcasses.
● There should be efficient drainage and disposal of edible and non-edible offal.
● The blood should be collected in an under-drainage facility/tank.
● After the carcasses have been inspected and passed, they are washed with hot water and sanitized
with 20 PPM of Chlorine.
● Adequate facilities are provided for cleanliness of food contact surfaces namely floor, wall, knives,
hooks, plastic crates, equipment and table tops. The abattoir and deboning area are cleansed and
washed with detergents and hot potable water (65°C).
● Continuous and thorough washing is always carried out in the slaughtering area.
● Any carcass/part of carcass rejected is immediately passed onto the Rendering plant through a separate
chute.
● Suitable and separate space is provided for the storage of skin and hides.
● A Constant hot water supply (82°C) should be ensured in both the Deboning and Slaughter hall.
● Samples shall be taken randomly daily from different tables and meat cuts for the microbiological
examination.
● Proper cuts should be packaged in cartons which has labels indicating the product, date of
manufacturing, shelf life, brand name, etc to provide the consumer the information about the
contents. Thereafter, the packed cartons are passed through the metal detector before freezing the
meat either in plate freezer/blast freezer.
12.5 Laboratory / Testing Facility
In-house microbiological laboratory with sterilization room, media preparation room, incubation room,
laminar flow and washing room must be provided to do the microbiological examination of meat, water,
air and personnel working in the plant.

184
[Title]
12.6 Effluent Treatment Plant
Effluent generated in the slaughter house shall be treated in Effluent Treatment Plant (ETP). ETP shall be
based on suitable biological treatment based of the characteristics of the effluent generated. Usually the
effluent from slaughter house has high organic and nitrogen load and extended aeration is effective
option. Treated effluent shall be disinfected prior to discharge.
Best Available Technology has been recommended by CPCB vide Comprehensive Industrial Document for
slaughter house dated Oct 2017 which includes:
● Primary treatment with screens, dissolved air flotation, oil and grease traps, primary settling and
coagulation.
● Secondary biological treatment with up flow Anaerobic Sludge Blanket / Rotating Biological Contactor
/ Activated Sludge Process followed by secondary settling.
● Tertiary treatment using pressure sand filter, activated carbon filter and final disinfection with ozone
● Sludge generated shall be handled using anaerobic digester.
Treated effluent shall comply with discharge standards stipulated by MoEF & CC vide Notification dated
28th Oct 2016 as indicated in the table below:
Table 66: Effluent Discharge Standards Stipulated by MOEF&CC
Parameter Standard
pH 6.5 – 8.5
Biochemical Oxygen Demand (BOD) [3 days at 270 C] 30 mg/l
Chemical Oxygen Demand (COD) 250 mg/l
Suspended Solids 50 mg/l
Oil and Grease 10 mg/l
Source: CPCB, Effluent Discharge Standard Slaughterhouse, 28.10.2016
12.7 Solid Waste Management
Central Pollution Control Board recommends best practicable method for processing and disposal of
different waste from slaughter houses as indicated in the table below.
Table 67: Processing and Disposal of Slaughter House Waste
Type of Waste
Constituents of the
waste
Category of
Slaughter house
Method
Type 1 Vegetable matter such as rumen, stomach and intestinal content, dung and agricultural residue
Large Bio-methanation
Medium Bio-methanation or composting
Small Bio-methanation or composting
Type 2 Animal matter such as inedible, offal tissue, meat, trimmings, waste and condemned meat and bones
Large Rendering
Medium Rendering or composting with type 1 waste
Small Composting with type 1 waste or burial as per provisional measures.
Source: CPCB, Characterization, Waste Management Practice and Best Available Pollution Control Technologies in Slaughterhouse, 23.10.2017

185
[Title]
12.8 Employee Health Condition
● Employees should have good health and shall be properly attired with aprons, head wears, mouth
mask, hand gloves and clean gum boots. A changing room should be provided for workers.
● Separate changing room and clean toilets with sanitation facility shall be provided for male and female
employees.
● Facilities such as lockers, canteen, prayer room, first aid room shall be provided.
● Entire facility shall be well lit by natural and artificial lighting and the bulbs shall be covered to avoid
contamination of meat in case of breakage.
● Health of the workers should be thoroughly checked every 6 months on routine basis and record shall
be maintained for the medical check-up of each worker who handles meat. The plant shall be equipped
with first aid facility.
● Employees should be inoculated against enteric disease like cholera, typhoid and tuberculosis once in
a year and record shall be maintained.
12.9 Exclusion of Pest
● Slaughter house and its surroundings shall be insect and pest free.
● Different pest control measures shall be adopted such as rat traps in switch room, air curtains shall be
placed at each entry point of the utility building.
● Automatic closing windows (chutes) are provided in the slaughter hall to deliver the rejected carcasses
for rendering. Chutes are also provided in the bone room. This prevents the entry of birds and other
flying objects to enter in the deboning /slaughter hall.
● Nuvan, an insecticide shall be regularly sprayed throughout the utility building.
● Regular cleaning of toilets and using of naphthalene balls in it prevents the entry of flies and mosquitos
into the plant.

186
[Title]

187
[Title]
13 Guidelines on Clearance Procedure for
Food and Agricultural Propagation Material
Imports to India
13.1 Food Import Regulation
Food Imports into India are regulated by a separate import regulation by Food Safety and Standard
Authority of India (FSSAI) called the Food Safety and Standard (Import) Regulation 2017 notified on 9th
March 2017. The regulation provides detailed procedure and guidelines to regulate food imports to India.
The procedure includes the following:
● Licensing of Food Importers
● Clearance process of Imported food
● Import clearance for specific purpose
● Storage and sampling of imported foods
● Laboratory analysis of samples of imported articles of food
● Prohibition and Restriction on Import of articles of food
● Officers of Food Authority and their powers and Duties
● Disposal of rejected food consignment and food samples
● Treatment of unclear and unclaimed articles of food
13.2 Food Import Clearance Process
FSSAI has its own Food Import Clearance System (FICS) which is an online system integrated with the
customs ICE – Gate (Indian Custom Electronic Commerce Gateway) under Single Window Interface for
Facilitating Trade (SWIFT). Customs department implement Risk Management System (RMS) under SWIFT
in consultation with other Participating Government Agency (PGA) including FSSAI.
● After referring the application by Customs in FICS, initial scrutiny is done by FSSAI
● Initials scrutiny will be based on the review of documents
● After initial scrutiny and deposition of fee, visual inspection is done by FSSAI on physical condition,
packing and labeling of the food item.
● On satisfactory visual inspection report samples are drawn for laboratory analysis.
● NOC / NCR is issued based on the test results to take further necessary action regarding release /
further disposal of import consignment.
● In case rejection, if the importer is not satisfied with the order passed by the Review Officer, then he
can challenge the said decision before the CEO, FSSAI whose decision thereon will be final.
Food Import Clearance steps are as indicated in the figure below:

188
[Title]
Figure 22: Food Import Clearance Procedure
Source: Manual for Food Imports, FSSAI, 8.11.2017

189
[Title]
Some of the Key highlights of the FSSAI Import Regulation 2017 are as indicated below:
● No person can import any article of food without import license from the Central Licensing Authority
in accordance with the provisions of Food Safety and Standard (Licensing and Registration of Food
Business) Regulation, 2011.
● Food Importer shall register himself with the Directorate General of Foreign Trade and possess valid
import and export code.
● No article of food shall be cleared from the customs unless it has a valid shelf life of not less than 60
percent at the time of import.
● Relaxation has been provided for labelling and packaging for pre-packed foods including multi piece
packaging, whole sale packages, primary foods like food grain, pulses, dry fruits etc. imported in
packages, primary food like food grain, pulses, dry fruits etc. imported in loose in bulk.
● Provision has been made for Provisional NOC in Form 12/13 for imported items having very short shelf
life and require special storage such as fruits and vegetables, processed cheese and frozen food items
etc. to allow them to be move consignment to respective warehouse, however release to market will
be allowed only after issuance of NOC by FSSAI.
● For combined cargo of pulses and other cereals and oils, the analysis report of the sample drawn at
the first port of discharge shall also remain valid at other port of discharge provided the Authorized
Officer reseals the remaining cargo at the first port of discharge.
● For import of high prices liquor, miniature sample of 100 ml can be taken for laboratory analysis
subjected to condition that imported consignment is accompanied with Certificate of Analysis by
export country.
● In case of consignment of food import consisting of more than one product, food products may be
considered for clearance separately based on its compliance to the Import. Food for personal use will
require a declaration in Form 7 of FSSAI Import Regulation 2017.
● Food imported by diplomatic mission shall be dealt in accordance to Vienna Convention on Consular
Relation, 1963.
● Import of Food for Quality Assurance, Research and Development purpose shall require an
undertaking in Form 9 to the regulation by importer stating that it is for testing and R&D and not for
market release.
● Food imported for the purpose of exhibition and testing shall require an undertaking in Form 10 of the
FSSAI Import regulation 2017 before Customs Authority.
● Import of Food for sports events will be subjected to furnishing of undertaking in Form 11 of the
regulation by the food importer.
● Import of food consignment meant for 100 percent export or re-export would require a declaration
by the importer that it’s for 100 percent export and no part thereof shall be supplied for domestic
consumption.
● High risk items for which 100 percent sampling is done are meat and meat products, fish and fish
products, egg and egg products, milk powder, condensed milk, milk cereal base weaning foods, Infant
milk food, infant formulae, fat in any form except edible vegetable fat and cocoa butter equivalent or
substitutes.
● Animal quarantine and Plant Quarantine department under the Ministry of Agriculture also take
sample separately in case of certain food items marked by customs for their NOC. The analysis done
by FSSAI for food items are different parameters and NOC by FSSAI does not mean the same is cleared
by Plant / Animal quarantine and vice-versa.
190
[Title]
● FSSAI handles food import consignments in 6 ports viz. Chennai, Mumbai, Kolkata, Delhi, Kochi and
Tuticorin. For testing of food import consignment there are 142 National Accreditation Board for
Testing and Calibration Laboratories (NABL) accredited laboratories notified by FSSAI throughout the
Country. Mumbai and its suburbs have 12 labs attached to FICS. FSSAI has also notified 16 referral
labs other than the 142 for re-testing of appeal samples of the importers.
13.3 Import of Seed / Plant Material for Sowing, Planting and Propagation
● Importer needs to apply for permit for import of seed / plant material for sowing, planting and
propagating at least seven days in advance to the permit from Issuing Authority notified under Plant
Quarantine (Regulation of Import to India) Order 2003.
● All the consignment of seed and plants for propagation shall be imported only through seaport, airport
and land frontier Stations listed in Schedule I to the Act.
● List of commodities for which import permit shall be granted are listed in Schedule V, VI and XII of the
Order.
● Importer shall apply for permit along with demand draft, catalogue/invoice and registration certificate
issued by National Seed Corporation or Director of Horticulture / Agriculture.
● Import permit shall be valid for a period of 6 months and shall be valid for multiple port access and
multiple part shipment provided the exporter, importer and country of origin are the same for the
entire consignment.
● Import permit are non-transferable and no permit will be issued for landed consignments.
● Pest Risk Analysis is mandatory for import of new commodities into India. Hence, for import of new
commodities the importer should apply for Pest Risk Analysis Request Form to the Plant Protection
Adviser to the Govt. of India.
● The Director, National Bureau of Plant Genetic Resources (NBPGR) is authorised to issue permits of PQ
Order, 2003 for import of germplasm / Research and breeding material for public / private sector in
the country including institutions and organisations of Indian Council of Agricultural Research (ICAR),
State Agricultural Universities (SAU) and International Crop Research Institute for Semi-Arid Tropics
(ICRISAT).
● The importer or his agent shall apply for import of Live Insects, algae, mushroom, bio control agents
and Microbial cultures intended for agricultural use, to the Plant Protection Advisor (PPA),
Government of India.
● Permit for import of soil, earth, clay, peat and sphagnum moss and similar material for any
microbiological, soil-mechanics, or mineralogical investigations and peat for horticultural purposes
shall be applied to the Plant Protection Advisor (PPA), Government of India.
● In the event of live insect infestation is noticed, the importer or his agent shall arrange for
fumigation of consignments by an approved pest control operator at his own cost under the
supervision of Plant Quarantine (PQ) officer.
● The importer or his agent shall arrange for inspection/sampling of the consignment on the scheduled
date & time at the prescribed place by the nominated plant quarantine officer as per the quarantine
order issued. Sampling of seed for propagation shall be in accordance with the International Seed
Testing Association (ISTA) Rules, 1976 and of cereals, pulses, oil seeds, dry fruits etc., and for
consumption plant materials as per Bureau of Indian Standards ((method of sampling for smaller size
food grain IS: 2814/1978 and (method of sampling for bigger size food grain) IS: 3714/1978)).

191
[Title]
● Any person desiring to import or manufacture any insecticide may apply to the Registration Committee
for the registration of such insecticide and there shall be separate application for each such insecticide
Under Insecticides Act, 1968 and Rules, 1971.

192
[Title]
14 Pest Management Plan
Insecticides, fungicides and herbicides are the commonly used agrochemicals. India is the fourth largest
global producer of agrochemicals after the US, Japan and China. This segment generated a value of USD
4.4 billion in FY15 and is expected to grow at 7.5 percent per annum to reach USD 6.3 billion by FY20.
Approximately 50 percent of the demand comes from domestic consumers and the rest from exports.
During the same period, domestic demand is expected to grow at 6.5 percent per annum and exports at
9 percent per annum22.
Per hectare consumption of pesticides was highest in Punjab (0.74 kg), followed by Haryana (0.62 kg) and
Maharashtra (0.57 kg).
Bio-pesticide have the potential to control crop losses and reduce negative environmental externalities.
Bio-pesticides constitutes around 3 percent of pesticide market in India. So far only 14 biopesticides have
been registered under the Insecticides Act, 1968 in India. Consumption of bio-pesticides has increased
from 219 MT in 1996-97 to 683 MT in 2000-01 and further to around 5635 MT in 2015-1623.
Consumption of chemical and bio-pesticides in the state of Maharashtra are as indicated in the table
below.
Table 68: Use of Pesticides (in MT)
Year Chemical Pesticides Bio-Pesticides
2015-16 11,665 1173
2016-17 13,496 1454
2017-18 15,568 1271
2018-19 15,705 2252
Source: Economic Survey of Maharashtra 2017-18
Regarding the pesticide share across agricultural crops, cotton account for 30 percent followed by rice
chillies/vegetables/fruits, plantations, cereals/millets/oil seeds, sugarcane and other. Figure below
indicates crop wise pesticide share in India.
Pest Management Plan shall be adopted by members of the CBOs to be supported under SMART. Pest
control materials should be selected and applied in a manner that minimizes risk to human health,
beneficial and non-target organism and the environment.
Fertilizers are natural and artificial substance containing the chemical element that improve growth and
productiveness of plant. Fertilizer enhance the natural fertility of the soil or replace the chemical element
taken from soil by previous crops.
The type of fertilizer used in India are Straight nitrogenous fertilizers such as Ammonium Sulphate,
Calcium Ammonium Nitrate, Ammonium Chloride and Urea, Straight phosphatic fertilizers such as single
super phosphate and triple super phosphate and NP / NPK complex Fertilizers such as urea, ammonium
22 Next Generation Indian Agriculture – Role of Crop Protection Solutions; A Report on Indian Agrochemical Industry July 2016
23 Subhash SP, Prem Chand, Pavithra S, Balaji SJ and Suresh Pal, Pesticide Use in Indian Agriculture: Trend, Market Structure and Policy Issues.ICRA

193
[Title]
phosphate, ammonium phosphate Sulphate, Diammonium phosphate (DAP), Mono ammonium
phosphate (MAP), Nitro phosphate, Nitro phosphate with potash, NP / NPKs
In Maharashtra more than 50 percent of soil is deficient in zinc and deficiency of iron and manganese is
also apparent in many districts. Maharashtra ranks third with a share of 11 percent in all India
consumption of fertilizers. Per hectare consumption of fertilizers in Maharashtra is 126 kg as on 2012-13.
14.1 Area under IPM in Maharashtra
Crop Pest Surveillance and Advisory Project (CROPSAP) was implemented with the funding through RKVY
of Central Government till 2012 followed by Government of Maharashtra from 2013. Main objective was
to implement scientific pest surveillance approach for pest management and creating mass awareness
among field functionaries and farmers on IPM. Under this program nearly 44,000 villages across 348
talukas of 34 districts from among eight agricultural divisions of Maharashtra were covered. The area
under each crop fluctuates with seasons with soybean among kharif crops and chickpea of Rabi showing
marked increase in area under cultivation during 2014-15. As per the 2014-15 statistics, area under each
target crop covered are as indicated below.
Table 69: Area of cultivation of the target crops in Maharashtra under CROPSAP (area in lakh Ha)
Crop 2009-10 2010-11 2011-12 2012-13 2013-14 2014-15
Soybean 30.19 27.29 30.10 30.64 35.20 36.40
Cotton 33.92 39.42 41.67 41.87 41.60 41.90
Rice 14.50 14.86 15.16 15.28 15.68 15.08
Pigeon pea 10.93 13.02 12.33 12.14 11.41 12.10
Chickpea 12.91 14.38 10.75 11.35 18.20 14.27
TOTAL 102.45 108.97 110.01 111.28 122.09 119.75
14.2 Pest Management Strategy
Pest management strategy is based on the principle of managing the pest rather than eradicating them.
Pesticides shall be used only as the last resort if the damage reaches Economic Threshold Level. Only
permitted pesticides as per Indian regulation and WHO recommendations shall be used. The available
techniques for controlling pests are categorized in the increasing order of their complexity as follows:
Cultural practices: Use of resistant variety, crop rotation, crop refuse destruction, Tillage of soil, variation
in the time of planting and harvesting, pruning or thinning and proper spacing, judicious and balanced use
of fertilizers, crop sanitation, water management, planting of trap crops.
Mechanical Method: Hand destruction, exclusion by barrier, use of traps
Physical Method: Application of heat by hot water treatment, exposing of infested grain to sun, super
heating of empty go-down at 500 C to kill hibernating stored grain pest. Manipulation of moisture and
light traps.
Biological Method: Protection and encouragement of natural enemies, Introduction, artificial increase
and colonization of specific parasitoids and predators. Propagation and dissemination of specific bacterial,
viral, fungal and protozoan disease.
Genetic Methods: Use of sterile male technique
Regulatory methods: Plant quarantine which includes both foreign and domestic quarantine.

194
[Title]
Chemical Methods: Use of attractants, repellants, growth inhibitors and use of insecticides.
IPM Strategy for Key Pest in Major Crops in Maharashtra are as indicate in the table below:
Table 70: IPM Strategy for Key Pest in Major Crops of Maharashtra
Name of Crop
Name of Pest IPM Measure Responsible organisation / PIU
Cotton Boll worm/ Helicoverpa / Sucking pest
● Use certified seeds
● Resistant variety such as Eknath, Purnima, Y -1, Malgari, Khandwa–2, Badnawar–1, G-cot –12, Jaydhar, NHH–1, NHH– 44, AKO–81, LRK 516
● Cultural Practices such as summer deep ploughing to expose insect, pathogen and nematode population.
● Sowing time up to June 30th and avoid late sowing.
● Biological Control such as Seed treatment Trichoderma spp. @ 4 g / kg. or Captan 3 g / kg of seed or carbendazim 2 g / kg seed.
● Seed treatment with imidachloprid 70 WS * @ 5 g / kg of seed in case of non – hybrid variety and 10 g / kg in case of hybrid or hiomethoxam 5 g / kg seed or carbosulfan 25 DS @ 50 gms / kg of seeds for early sucking pests.
● Avoid overuse of Nitrogen fertilizer as crop becomes more susceptible to pest and diseases
● Handpicking and destruction of various insects’ stages affected parts and flower. Clipping of terminal shoots on 90 – 110 days depending on cultivars.
● Use traps such as pheromone traps, sticky trap.
● Ensure regular surveillance to detect Economic Threshold level.
● If pest population attains ETL then select effective pesticide with recommended dosage and correct spray technology.
● Allow grazing by animals after harvest or use crop residue as farm yard manure or sell to paper industry.
● Avoid stacking of cotton stalk near fields and destroy the opened bolls if any on plants before stacking.
● Crushing of cotton seed to be complete by April end.
● Department of Agriculture will implement the Pest Management Plan.
●
● Monitoring – Semi-annually by PCMU/RIU/DIU
Rice Yellow Stem borer ● Resistant varieties Ratna, Sasyasree, Vikas, HKR 46, NDGR 21, Pantdhan 6, VLK 39, Prahlad, Birsadhan 201, Bhudeb Ainesh, Matangini, Radha, Sudha, Amulya, Bhagirathi, Jogan, Mandira, Nalini, Sabita, VL16 and VL 206.
● Clipping the tips of seedlings before transplanting greatly reduces the carryover of eggs from the seedbed to the transplanted fields.
● Rice varieties with short stature and shorter growth duration periods suffer less damage than long growth duration varieties.
● Rice – rice with shorter growth duration varieties suffer less damage than long duration varieties.
● Community-wide destruction of diapausing larvae (in stubble) through tillage after harvest, followed by flooding, reduces stem borer populations resulting in low incidence in the next crop.
● Planting or seeding times may be delayed avoiding the peak emergence of moths from the diapausing populations.
● Department of Agriculture will implement the Pest Management Plan.
●
●
●
●
● Monitoring – Semi-annually by PCMU/RIU/DIU
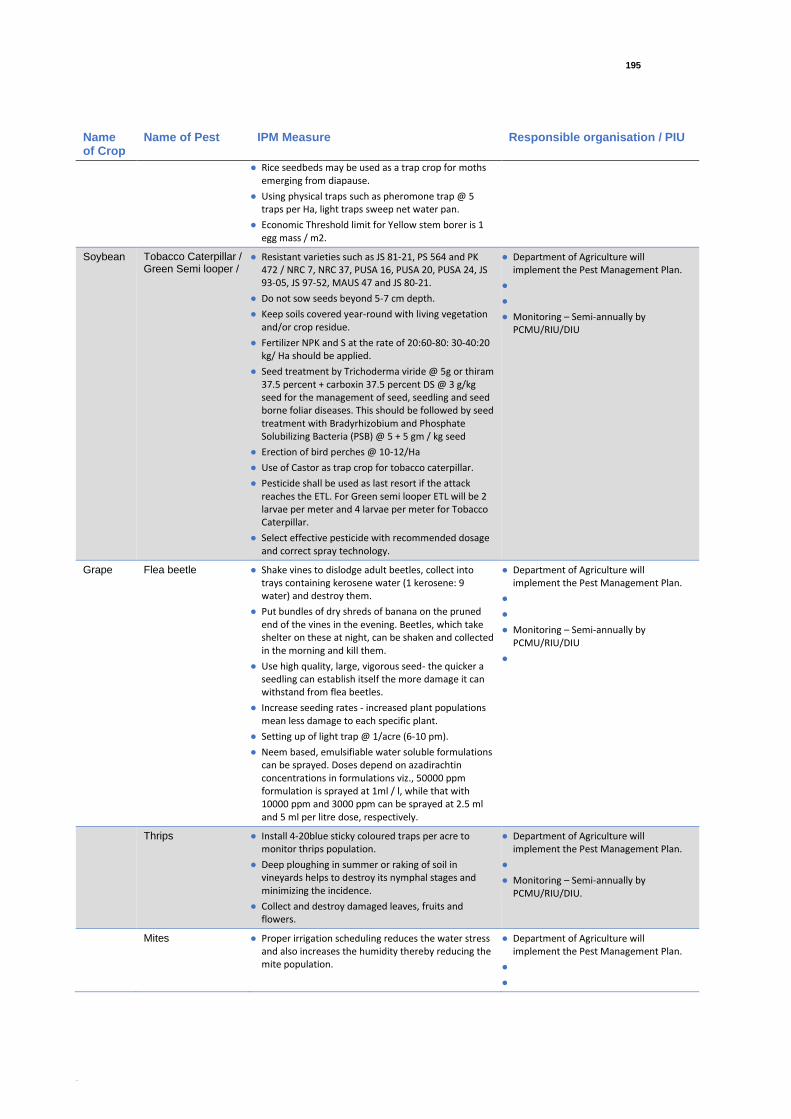
195
[Title]
Name of Crop
Name of Pest IPM Measure Responsible organisation / PIU
● Rice seedbeds may be used as a trap crop for moths emerging from diapause.
● Using physical traps such as pheromone trap @ 5 traps per Ha, light traps sweep net water pan.
● Economic Threshold limit for Yellow stem borer is 1 egg mass / m2.
Soybean Tobacco Caterpillar / Green Semi looper /
● Resistant varieties such as JS 81-21, PS 564 and PK 472 / NRC 7, NRC 37, PUSA 16, PUSA 20, PUSA 24, JS 93-05, JS 97-52, MAUS 47 and JS 80-21.
● Do not sow seeds beyond 5-7 cm depth.
● Keep soils covered year-round with living vegetation and/or crop residue.
● Fertilizer NPK and S at the rate of 20:60-80: 30-40:20 kg/ Ha should be applied.
● Seed treatment by Trichoderma viride @ 5g or thiram 37.5 percent + carboxin 37.5 percent DS @ 3 g/kg seed for the management of seed, seedling and seed borne foliar diseases. This should be followed by seed treatment with Bradyrhizobium and Phosphate Solubilizing Bacteria (PSB) @ 5 + 5 gm / kg seed
● Erection of bird perches @ 10-12/Ha
● Use of Castor as trap crop for tobacco caterpillar.
● Pesticide shall be used as last resort if the attack reaches the ETL. For Green semi looper ETL will be 2 larvae per meter and 4 larvae per meter for Tobacco Caterpillar.
● Select effective pesticide with recommended dosage and correct spray technology.
● Department of Agriculture will implement the Pest Management Plan.
●
●
● Monitoring – Semi-annually by PCMU/RIU/DIU
Grape Flea beetle ● Shake vines to dislodge adult beetles, collect into trays containing kerosene water (1 kerosene: 9 water) and destroy them.
● Put bundles of dry shreds of banana on the pruned end of the vines in the evening. Beetles, which take shelter on these at night, can be shaken and collected in the morning and kill them.
● Use high quality, large, vigorous seed- the quicker a seedling can establish itself the more damage it can withstand from flea beetles.
● Increase seeding rates - increased plant populations mean less damage to each specific plant.
● Setting up of light trap @ 1/acre (6-10 pm).
● Neem based, emulsifiable water soluble formulations can be sprayed. Doses depend on azadirachtin concentrations in formulations viz., 50000 ppm formulation is sprayed at 1ml / l, while that with 10000 ppm and 3000 ppm can be sprayed at 2.5 ml and 5 ml per litre dose, respectively.
● Department of Agriculture will implement the Pest Management Plan.
●
●
● Monitoring – Semi-annually by PCMU/RIU/DIU
●
Thrips ● Install 4-20blue sticky coloured traps per acre to monitor thrips population.
● Deep ploughing in summer or raking of soil in vineyards helps to destroy its nymphal stages and minimizing the incidence.
● Collect and destroy damaged leaves, fruits and flowers.
● Department of Agriculture will implement the Pest Management Plan.
●
● Monitoring – Semi-annually by PCMU/RIU/DIU.
Mites ● Proper irrigation scheduling reduces the water stress and also increases the humidity thereby reducing the mite population.
● Department of Agriculture will implement the Pest Management Plan.
●
●

196
[Title]
Name of Crop
Name of Pest IPM Measure Responsible organisation / PIU
● Several predatory insects and spiders feed on mites but the most efficient natural predators of mite pests are predatory mites
● Monitoring – Semi-annually by PCMU/RIU/DIU.
Pomegranate
Stem Borer / White fly / thrips
● Pheromone traps for Spodoptera litura @ 4-5/acre field must be installed.
● Set up yellow pan water/sticky traps 15 cm above the canopy for monitoring aphid, whitefly and blue sticky trap for thrips @ 4-5 traps/acre.
● Set up light traps @ 1 trap/acre 15 cm above the crop canopy for monitoring and mass trapping of nocturnal insects. Light traps with exit option for natural enemies of smaller size should be installed and operated from 6 pm to 10 pm.
● Add organic matter in the form of farm yard manure (FYM), vermicompost, crop residue which enhance below ground biodiversity of beneficial microbes and insects.
● Application of Trichoderma harzianum/viride and Pseudomonas fluorescens for treatment of seeds/seedlings/ planting materials in the nurseries and field.
● Raise the flowering plants / compatible cash crops along the orchard border by arranging shorter plants towards main crop and taller plants towards the border to attract natural enemies as well as to avoid immigrating pest population
● Pits of 1meter cube are dug in square system during summer season and kept open for controlling soil borne pests.
● Collect and destroy disease infected and insect infested plant parts. Collect and destroy eggs and early stage larvae.
● Department of Agriculture will implement the Pest Management Plan.
●
●
●
●
● Monitoring – Semi-annually by PCMU/RIU/DIU.
Post-Harvest measures
● Fruits can be stored at 5°C with 90-95 percent relative humidity for 2 months.
● In case of storage beyond two months, temperature should be maintained at 10°C to avoid chilling injury.
● Pomegranates are very susceptible to water loss resulting in shrivelling of the skins. Storing fruit in plastic liners and waxing can reduce water loss, especially under conditions of lower relative humidity.
● Department of Agriculture will implement the Pest Management Plan.
●
●
●
● Monitoring – Semi-annually by PCMU/RIU/DIU.
Citrus Aphids / Mites / Thrips
● Monitor the field situation of the orchard at least once a week (soil, water, plants, pests, natural enemies, weather factors etc.)
● Do not plant or irrigate the field after ploughing, at least for 2-3 weeks, to allow desiccation of weed’s bulbs and/or rhizomes of perennial weeds
● Pheromone traps for fruit sucking moth, leaf miner, citrus butterfly, stem borer @ 4-5/acre must be installed.
● Set up yellow water pan/sticky traps for monitoring aphid, black fly and blue water pan/sticky traps for thrips @ 4-5 traps/acre at the height of mid canopy.
● Set up light traps @ 1 trap/acre at the height of mid canopy for monitoring and mass trapping insects.
● Deep summer ploughing of fields to control nematodes and soil borne diseases.
● Nitrogen is applied in the form of FYM and oil cakes each at 25 percent and the remaining 50 percent
● Department of Agriculture will implement the Pest Management Plan.
●
●
●
●
●
●
● Monitoring – Semi-annually by PCMU/RIU/DIU.

197
[Title]
Name of Crop
Name of Pest IPM Measure Responsible organisation / PIU
with chemical fertilizers, while, P2O5 in the form of super phosphate and K2O in the form of muricate of potash.
● The most important natural enemies of citrus mite are a predacious mite Euseius hibisci and the predators Agistemus sp. and Amblylseisus hibisci.
Onion Thrips ● Before sowing, soil testing should be done to find out the soil fertility status. Nutrient should be provided as per soil test recommendations.
● Add well rotten FYM @ 10 t/acre or vermicompost @ 4 t/acre. Incorporate FYM at the time of field preparation at 2 to 3 weeks before transplanting.
● Use resistant/tolerant varieties
● Practice field sanitation
● Plant the new crop in upwind direction of already planted crop which help in escaping infestation from old planting to some extent in the initial stages.
● Use of reflective plastic silver colour and aluminium painted black mulches repel the thrips (seed crop).
● Use of sprinkler irrigation reduces thrips population considerably compared to drip and surface irrigation.
● Plant two rows of maize or inner row of wheat and outer row of maize surrounding the onion plots as barrier crop.
● Conserve the predators such as coccinellids, lacewings, spiders, wasps etc. for controlling thrips
● Department of Agriculture Department will implement the Pest Management Plan.
●
●
●
●
●
● Monitoring – Semi-annually by PCMU/RIU/DIU.
Post-Harvest Measures
● Onions are ready to harvest when the tops start to turn yellow and die.
● Bulbs intended for storage need to be cured (dry out) in a dark, dry place at 30-45 C and 60-75 percent RH for 1-4 days, until the necks turn brown.
● Department of Agriculture Department will implement the Pest Management Plan.
● Monitoring – Semi-annually by PCMU/RIU/DIU.
Tomato Spodoptera and Helicoverpa
● Pheromone traps for two insects viz., Helicoverpa armigera and Spodoptera litura @ 2/fixed field must be installed.
● Use light traps and sticky trap as indicated in other Crop IPM.
● Deep summer ploughing of fields to control nematodes and exposes dormant stages (pupa and larva) of Helicoverpa and Spodoptera and subsequently reduces their initial population build up.
● Cover the beds with polythene sheet of 45-gauge (0.45 mm) thickness for three weeks before sowing for soil solarization which will help in reducing the soil-borne pests including weeds.
● Ecological engineering of tomato with raising African marigold nursery 15 days prior to tomato nursery serves as a trap crop for oviposition females of Helicoverpa.
● Apply neem cake @ 100 kg/acre.
● Before sowing, soil testing should be done to find out the soil fertility status. Nutrients should be provided as per soil test recommendations. Generally, tomato needs 40: 24: 24 kg N: P: K/acre-for varieties and 60: 36: 36 kg N: P: K/acre-for hybrids.
● Department of Agriculture Department will implement the Pest Management Plan.
●
●
●
●
● Monitoring – Semi-annually by PCMU/RIU/DIU.
Turmeric Shoot borer ● Use pheromone trap, blue pan water / sticky trap and light traps as described above
● Resistant Varieties - Dindigam, Ca-68, Mannuthy local
● Department of Agriculture Department will implement the Pest Management Plan.

198
[Title]
Name of Crop
Name of Pest IPM Measure Responsible organisation / PIU
● Turmeric needs very heavy manuring during the four months period after planting. Crop requires 120 Kg N, 50 Kg P2O5 and 80 Kg K2O per acre in organic and inorganic forms.
● Use 10 t/ acre Farmyard manure or 4 t / acre vermicompost at the time of field preparation.
● Apply castor or neem cake @ 200 Kg/ acre
● Mulching with green Lantana camara and Vitex negundo leaves @ 2 t/acre at 40 and 90 days after planting.
● Release of Trichogramma chilonis @ 40,000/acre
● Spray neem oil (0.5 percent) at fortnightly intervals.
●
●
●
● Monitoring – Semi-annually by PCMU/RIU/DIU.
Leaf spot ● Pluck and remove the infested leaf and uproot the infested plants and destroy them.
● Use proper green mulching to reduce soil splashes.
● Use of plant extracts such as garlic extracts is effective against foliar pathogens.
● Department of Agriculture Department will implement the Pest Management Plan.
●
● Monitoring – Semi-annually by PCMU/RIU/DIU.
Nematodes ● Uproot and destroy the infested plants.
● Treat infested rhizomes with hot water (50 OC) for 10 minutes, using nematode free seed rhizomes and solarizing turmeric beds for 40 days.
● Deep ploughing or solarized beds of infested fields during summer.
● Spray of an extract of asafoetida, turmeric and water pathogens including nematodes.
● An extract of asafoetida, turmeric and water is effective against several plant pathogens including nematodes.
● Application of neem (Azaradirachta indica) seed cake 100 Kg/acre before planting.
● Pochonia chlamydosporia, a nematode biocontrol agent can be incorporated in turmeric beds (20 g/bed at 106 cfu/g) at the time of sowing
● Department of Agriculture Department will implement the Pest Management Plan.
●
●
●
● Monitoring – Semi-annually by PCMU/RIU/DIU.
Chilli Viral Disease and Chilli leaf curl complex
● Resistant variety Pusa Sadabahar, Arka Harita, Arka Meghana, Arka Sweta, Hisar Shakti, Hisar Vijay, Pant C-1
● Apply neem cake @ 100 kg/acre at the time of transplanting for reducing nematodes and borer damage.
● Department of Agriculture Department will implement the Pest Management Plan.
●
● Monitoring – Semi-annually by PCMU/RIU/DIU.
Post-Harvest Storage
● Peppers can be stored at 10 °C with 85-90 percent RH.
● Chillies can be damaged when stored below 10 °C.
● Sensitivity to cold varies with the cultivar; ripe fruit is less sensitive than green fruit. When stored above 13 °C, chillies are subject to accelerated ripening and bacterial soft rot infection.
● Where no cold storage facilities are available, fruit should be sorted, packed, and marketed within 24 hours of harvest
● Department of Agriculture Department will implement the Pest Management Plan.
●
●
● Monitoring – Semi-annually by PCMU/RIU/DIU.
Black and Green Gram
Hairy Caterpillar ● Apply well decomposed FYM @ 4 t/acre or vermicompost @ 2 t/acre treated with Trichoderma 2-3weeks before sowing
● Select healthy, certified, and weed seed free seeds.
● Seed treatment should be done with, Trichoderma spp. (8-10 g/Kg seed) and Rhizobium spp., AMF/PSB cultures each @ 30 g/Kg seed.
● Department of Agriculture Department will implement the Pest Management Plan.
●
●
●

199
[Title]
Name of Crop
Name of Pest IPM Measure Responsible organisation / PIU
● Fertilizers should be applied on soil test basis, recommended to apply 10 to 12 Kg N, 20 to 30 Kg P2O5 and 12 to 18 Kg, K2O per acre as basal dose.
● Sulphur and zinc deficiency areas apply sulphur @ 10-12 Kg/acre and zinc sulphate @ 10 Kg/acre in soil at the time of sowing.
● Dig the trenches of 1-inch depth between the fields & dust the trenches to kill the larvae in pits.
● Irrigate once to avoid prolonged mid-season drought to prevent pre- harvest infestation
●
● Monitoring – Semi-annually by PCMU/RIU/DIU.
Source: National Centre for Integrated Pest Management, IPM Packages
14.3 Safety Parameter in Pesticide Usage
• Farmers shall be well trained on the mode of pesticide application, quantity to be applied and
personnel protection equipment to be used while their application.
• Strictly comply with the manufacturer’s direction on maximum recommended dosage as well as
published report on using the reduced rate of pesticide application without loss of effect and apply
minimum effective dose. Pesticide application equipment shall be calibrated and maintained in
accordance with manufacturer’s recommendation and only registered equipment shall be used.
• Pesticide used must have negligible adverse impact on human health and must be proven to be
effective against the target species of pest. It should have minimal effect on nontarget species and the
natural environment.
• Pesticide used must have been demonstrated to be safe for inhabitants, domestic animal and
personnel using the same. Its usage shall be considered considering the need to prevent the
development of resistance in pest.
• Application of pesticide shall be considered considering the field observations and weather condition.
• Avoid usage of pesticide that fall under WHO recommended classification of pesticide Hazard Class I a
and I b. If no practical alternative is available then pesticide usage shall be done in accordance with
National Laws by the certified personnel.
• Avoid the use of pesticides listed in Annexes A and B of the Stockholm Convention, except under the
conditions noted in the convention and those subject to international bans or phaseouts.
• Avoid usage of pesticides and formulations that are banned to be used in India.
• Avoid usage of pesticides that have been historically linked to localized environmental problems and
threat.
• Use of pesticides that are approved by WHO i.e., class IV.
• Pesticides used must be manufactured under license, registered and approved by appropriate
authority and in accordance with FAO’s International Code of conduct on distribution and use of
pesticides. Pesticides shall be labelled as per the FAO’s latest guideline on Good Labelling Practices for
pesticides.
● Accidental spillage of pesticide during usage, transfer, mixing and storage can result in contamination
of soil, ground water and surface water. The following measures are recommended for safe handling
and management of pesticides:
i. Pesticides shall be stored in original package and shall be stored in cool dry frost-free and well
aerated location that can be locked and properly identified with signs and accessible to authorized
person and stored out of reach of children and away from food items.
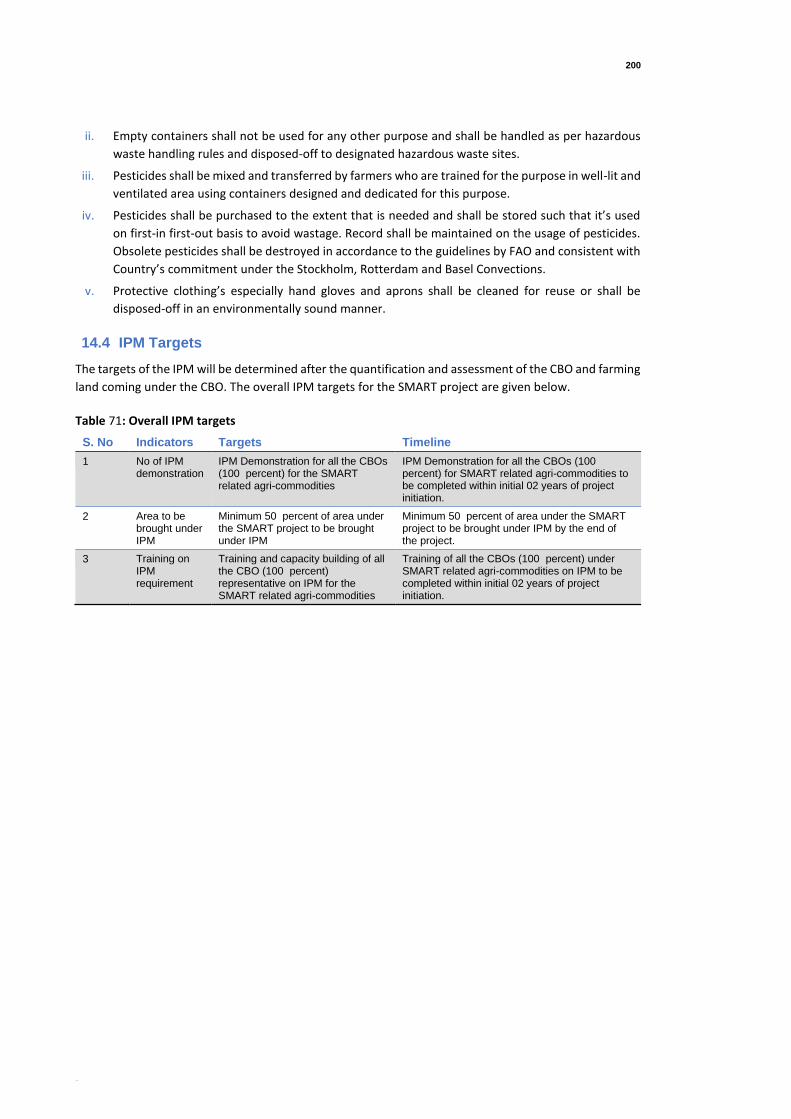
200
[Title]
ii. Empty containers shall not be used for any other purpose and shall be handled as per hazardous
waste handling rules and disposed-off to designated hazardous waste sites.
iii. Pesticides shall be mixed and transferred by farmers who are trained for the purpose in well-lit and
ventilated area using containers designed and dedicated for this purpose.
iv. Pesticides shall be purchased to the extent that is needed and shall be stored such that it’s used
on first-in first-out basis to avoid wastage. Record shall be maintained on the usage of pesticides.
Obsolete pesticides shall be destroyed in accordance to the guidelines by FAO and consistent with
Country’s commitment under the Stockholm, Rotterdam and Basel Convections.
v. Protective clothing’s especially hand gloves and aprons shall be cleaned for reuse or shall be
disposed-off in an environmentally sound manner.
14.4 IPM Targets
The targets of the IPM will be determined after the quantification and assessment of the CBO and farming
land coming under the CBO. The overall IPM targets for the SMART project are given below.
Table 71: Overall IPM targets
S. No Indicators Targets Timeline
1 No of IPM demonstration
IPM Demonstration for all the CBOs (100 percent) for the SMART related agri-commodities
IPM Demonstration for all the CBOs (100 percent) for SMART related agri-commodities to be completed within initial 02 years of project initiation.
2 Area to be brought under IPM
Minimum 50 percent of area under the SMART project to be brought under IPM
Minimum 50 percent of area under the SMART project to be brought under IPM by the end of the project.
3 Training on IPM requirement
Training and capacity building of all the CBO (100 percent) representative on IPM for the SMART related agri-commodities
Training of all the CBOs (100 percent) under SMART related agri-commodities on IPM to be completed within initial 02 years of project initiation.

201
[Title]
15 Labour Management Framework
Many of the sub-projects under SMART envisage undertaking civil works, for which labor force and
associated goods and services will be required. Though the works may not be extensive, however,
situations where the labor may not be fully supplied locally for several reasons, among them worker
unavailability and lack of skills and capacity, cannot be ruled out. In such cases, the labor force (total or
partial) may be from outside the sub-project area. In some cases, this influx may be compounded by an
influx of other people (“followers”) who may follow the incoming workforce with the aim of selling goods
and services, or in pursuit of jobs or business opportunities. The rapid migration to and settlement of
workers and followers in the project area is labor influx. This labor influx if not managed adequately can
lead to adverse social impacts and enhance vulnerabilities in the local communities, especially if the
communities are rural, remote, or small. Some of the potential adverse impacts are summarized below:
● Social conflict: Conflicts may arise between the local community and the construction workers, which
may be related to religious, cultural, or ethnic differences, or based on competition for local resources.
Tensions may also arise between different groups within the labor force, and pre-existing conflicts in
the local community may be exacerbated. Ethnic and regional conflicts may be aggravated if workers
from one group are moving into the territory of the other.
● Increased risk of illicit behavior and crime: Influx of workers and service providers into communities
may increase the rate of crimes and/or a perception of insecurity by the local community. Such illicit
behavior or crimes can include theft, physical assaults, substance abuse, prostitution, and human
trafficking. Local law enforcement may not be sufficiently equipped to deal with the temporary
increase in local population.
● Influx of additional population (“followers”): In case of projects with large footprint and/or a longer
timeframe, people can migrate to the project area in addition to the labor force, thereby exacerbating
the problems of labor influx. These can be people who expect to get a job with the project, family
members of workers, as well as traders, suppliers, and other service providers (including sex workers),
particularly in areas where the local capacity to provide goods and services is limited.
● Impacts on community dynamics: Depending on the number of incoming workers and their
engagement with the host community, the composition of the local community, and with it the
community dynamics, may change significantly. Pre-existing social conflict may intensify as a result of
such changes.
● Increased burden on and competition for public service provision: The presence of construction
workers and service providers (and in some cases family members of either or both) can generate
additional demand for the provision of public services, such as water, electricity, medical services,
transport, education, and social services. This is particularly the case when the influx of workers is not
accommodated by additional or separate supply systems.
● Increased risk of communicable diseases and burden on local health services: The influx of people
may bring communicable diseases to the project area, including sexually transmitted diseases (STDs),
or the incoming workers may be exposed to diseases to which they have low resistance. This can result
in an additional burden on local health resources. Workers with health concerns relating to substance
abuse, mental issues or STDs may not wish to visit the project’s medical facility and instead go
anonymously to local medical providers, thereby placing further stress on local resources. Local health
and rescue facilities may also be overwhelmed and/or ill equipped to address the industrial accidents
that can occur in a large construction site.

202
[Title]
● Gender-based violence: Construction workers are predominantly younger males. Those who are away
from home on the construction job are typically separated from their family and act outside their
normal sphere of social control. This can lead to inappropriate and criminal behavior, such as sexual
harassment of women and girls, exploitative sexual relations, and illicit sexual relations with minors24
from the local community. A large influx of male labor may also lead to an increase in exploitative
sexual relationships and human trafficking whereby women and girls are forced into sex work.
● Child labor and school dropout. Increased opportunities for the host community to sell goods and
services to the incoming workers can lead to child labor to produce and deliver these goods and
services, which in turn can lead to enhanced school dropout.
● Local inflation of prices: A significant increase in demand for goods and services due to labor influx
may lead to local price hikes and/or crowding out of community consumers.
● Increase in traffic and related accidents: Delivery of supplies for construction workers and the
transportation of workers can lead to an increase in traffic, rise in accidents, as well as additional
burden on the transportation infrastructure.
These adverse impacts may be amplified due to low capacity of the contractor to manage and absorb the
incoming labor force, specifically when civil works are carried out in, or near, vulnerable communities and
in other high-risk situations. While many of these potential impacts will be identified during initial
screening for the preparation of sub-projects, they may only become fully known once the decision on
sourcing the required labor force is made. Thus, it is important to develop Site-Specific Measures, and
subsequent Labor and Working Conditions Management Plan (LWCMP) before the contractor starts work
and update them as necessary to reflect project developments. Table 73 indicates screening questions
that are to be assessed at the time of initial screening of sub-projects to assess labor influx. The district /
regional teams will facilitate this.
Though, temporary labor influx may have adverse impacts on the host community, it is important to
recognize that appropriately managed labor influx can provide potential benefits for the community.
These benefits are typically related to economic opportunities through employment and/or training by
the project, or through selling goods and services. Other benefits include the provision of local
infrastructure (e.g., access roads, power or water connection) which may be developed for the project
and which serves the community beyond the project duration.
15.1 Initial Screening: Will the project require labor influx?
During initial screening, the project will get details on the key screening questions set out in Table below.
If the answer to any of the screening questions is yes, it is suggested that the project will conduct detailed
screening and assessment to understand the potential significance and likelihood of potential impacts.
Depending on the stage of project preparation and the timing of selection of the contractor, answers to
some of the screening questions may not be available.
24 The Bank defines a minor as an individual below the age of 18 years.

203
[Title]
Table 72: Initial Screening Questions
Key Screening questions Aspects to Consider
1. Will the project
potentially involve an influx of
workers to the project location,
and will the influx be
considered significant for the
local community?
● How many workers will be needed for the sub-project/ activity, with what skill set, and for what period?
● Can the project hire workers from the local workforce?
● What is the size and skill level of the existing local workforce?
● If the skill level of the local workforce does not match the needs of the project, can they be trained within a reasonable timeframe to meet project requirements?
● How will the workers be accommodated? Will they commute or reside on site? If so, what size of camp will be required?
● Is the project likely to hire more male workers from outside?
2. Is the sub-project /
activity located in a rural or
remote area?
● What is the size of local population in the sub-project area?
● What proportion of the local population live below poverty line?
● Is the sub-project located / being carried out in an area that is not usually frequented by outsiders?
● What is the frequency and extent of contact between the local community and outsiders?
● Are there socially / culturally sensitive community / conditions that need to be considered?
3. Based on the socio-
economic, cultural, religious
and demographic qualities of
the local community and the
incoming workers, is there a
possibility that their presence
or interaction with the local
community could create
adverse impacts?
● Is it likely that the incoming workers and the local community come from a shared socio-economic, cultural, religious or demographic background?
● Are local communities poorer than incoming workers? Will incoming workers have enough disposable cash to purchase alcohol, drugs, solicit commercial sex?
● What is the level of existing resources, and will the incoming workers use or create competition for these resources?
● What is the expected duration of the incoming workers’ presence in the community?
● Given the characteristics of the local community, are there any specific adverse impacts that may be anticipated?
15.2 Labor Influx and Working Conditions Management Plan (LIWCMP)
SMART will undertake civil works for the construction of facilities such as warehouses, slaughter houses,
processing units, cold storage and so on, which may involve different sizes of contracts and workers. Since
quality is key to the project, assuring skilled labor to deliver state-of-the-art facilities is critical. SMART
through its teams at the district and regional levels, will ensure that the contractor/sub-contractor
conforms to the provisions of the LIWCMP for the mitigation measures designed to avoid or reduce
undesired labor influx impacts during the construction activities. Based on this, the Contractor(s) / sub-
contractor(s) must develop the mitigation measures and provide appropriate roles and responsibilities to
implement them. The contractor must:
● Ensure implementation relevant Labor laws relating to their welfare (as per the National Legislation
and ILO core convention on labor Standards applicable to India), wages, basic amenities at work place,
overtime, insurance etc.
● Avoid or reduce instances of negative impacts on the community and maintain constructive
relationships between local communities and workers’ camps;
● Establish standards on worker welfare and living conditions at the camps that provide a healthy, safe,
and comfortable environment.
This Labor Influx and Working Conditions Management Plan should be implemented in conjunction with the project’s social management plans (SMPs) of the sub-projects.
204
[Title]
15.2.1 Management and Monitoring
The summary of the potential impacts related to camp activities, mitigation and management measures to avoid or reduce these impacts, and the monitoring required to determine the performance of these measures are discussed below. The Contractor shall develop a Contractor Plan to take mitigation measures described below:
15.2.1.1 Maintaining Community Relations
1. Unauthorized movements of construction workers (during and after working hours) could result in
trespassing and create amongst residents a sense of their privacy being invaded. This may result in
increasing incidents of crime and or violence and threats to the safety of community members. The
disparity of income levels and potential availability of illegal substances, illicit or culturally
inappropriate lifestyle choices can also cause increased tension between local communities and the
workers at camps. Contractor shall enforce a 'closed' camp policy. Workers will be strictly prohibited
from leaving camps for nonwork related activities and interacting with the local community unless
agreed by Company.
2. Contractor/sub-contractor, as appropriate, shall provide adequate recreation facilities for workers to
reduce incentive for leaving camps during leisure time. Contractor/sub-contractor shall limit workers’
interaction with the community when outside the camp, for example, by organizing transport directly
to and from the worksite.
3. If community members or local businesses express grievances in relation to camp related
activities/operations, the contractor shall immediately respond to the grievance requiring camp
related activities/operations to be amended to address community grievances.
15.2.1.2 Discipline in the Camp
4. The workers shall abide by camp rules which includes a disciplinary process. Contractor/sub-
contractor shall ensure adherence to the code of conduct by the workers in the camp.
5. The Project shall, be cognizant of the environment in which it works and shall, where practicable,
respect local cultural events such as religious events, funerals and the like.
6. The contractor/sub-contractor shall provide briefing to all migrated workers on camp rules, behavior
between fellow workers and the community; procedures for dealing with camp related complaints,
and a community relations orientation. The objective of this orientation will be to increase awareness
about the local area and cultural sensitivities.
7. Potential interaction between workers, persons engaged in illicit activities and the community
increases the risk of spreading communicable diseases, particularly in more remote communities. The
Contractor shall comply with the minimum health requirements for project execution within camps
and to outside communities.
8. Provide guidance / training on the detrimental effects of the abuse of alcohol and drugs and other
potentially harmful substances and the risk and concerns relating to HIV/AIDS and of other health risk-
related activities to workers.
9. Ensure that the workers have access to adequate preventive measures such as contraception
(condoms in particular) and mosquito nets, if needed.
15.2.1.3 Community Resources
1. Any infrastructure, services or resources used by camps that result in reductions or shortage for the
local community will have a negative impact. Contractor/sub-contractor shall utilize these resources
for camp use in a manner that minimizes impacts on local supply and use.

205
[Title]
2. Increased demand for food and other provisions may deplete natural resources e.g., firewood, timber,
game, fisheries, etc. potentially causing shortages of supply in the local community, and/or increasing
the price of goods, affecting affordability for local communities. The contractor shall as far as possible
not purchase products in the local community unless through formal contracts.
15.2.1.4 Camp Location
1. Setting up of camps may result in displacement of residents, loss of productive lands and the resources
upon these lands. Camps may also restrict or impede access to areas for the local community. Potential
camp locations will be selected in consultation with the affected communities.
2. Construction camps may result in a noticeable increase in traffic, noise, air emissions and light
intrusion which could negatively affect the lifestyle of nearby communities and pose a potential safety
issue. The Project shall refer to those Environmental Management Plan's (EMP) that include
mitigation/avoidance measures that relate to the local community,
15.2.1.5 In-migration
3. There is a strong likelihood of in-migration into areas around the construction camps. The Contractor
shall enforce a ‘closed’ camp policy. Existing communities may also relocate to be closer to the camps.
In-migration can result in disputes and sometimes violence between the new settlers and the resident
community. Migrants moving into existing settlements may increase demand and inflate prices for
housing, goods and services and increased pressure on infrastructure, services, and resources.
4. To address the above, each contractor / sub-contractor will develop a worker registration system that
will enable SMART to keep track of all workers on each site and to identify the organization (CBO/ PIU)
for whom they directly work.
15.2.1.6 Worker Welfare, Living Conditions and Non-discrimination
1. The contractor / sub-contractor must ensure that all workers on site are provided with information on
their terms and conditions, including hours, wages, breaks and holidays, discipline, and termination
procedures in a language they understand, and that all workers on site understand how to access an
easily-accessible, confidential process for making complaints about their employment. In addition, all
contractor(s)/sub-contractor(s) must regularly conduct awareness sessions on GBV, especially with
female co-workers.
a. This will require establishing a coherent and integrated grievance mechanism for all workers
engaged in the SMART project.
b. In addition, there should be adequate provision/mechanisms for reporting cases of sexual
harassment and abuse, with a time frame within these are addressed and resolved. This can be
tied the internal complaints committee set up within the project.
2. Each contractor/sub-contractor should develop a register for all their workers. This register should
contain data such as: name, age, sex, hours worked, wages, payments (including overtime payments)
made and any deductions made from their wages. The register should be in line with national
requirements on registration of workers.
3. Each contractor/sub-contractor should specify the minimum age for employment or engagement in
connection with the project, which will be the age of 14.
a. A child over the minimum age and under the age of 18 will not be employed or engaged in
connection with the project in a manner that is likely to be hazardous25 or interfere with the child’s
25 Work considered hazardous for children is work that, by its nature or the circumstances in which it is carried out, is likely to jeopardize the health, safety, or morals of children. Examples of hazardous work activities prohibited for children include work: (a) with exposure to physical, psychological

206
[Title]
education or be harmful to the child’s health or physical, mental, spiritual, moral or social
development.
4. Construction workers living in camps may encounter stresses and discomforts that negatively impact
their health and welfare. These may be caused by poor living conditions (accommodation, ablution
and sanitary, health, recreation catering and laundry). Contractor shall comply with minimum
standards for camp buildings, facilities, and services. This will include but are not limited to: i) provision
of minimum amounts of space required for each worker; ii) provision of sanitary (separate toilets for
men and women); iii) laundry and cooking facilities and potable water; iv) creche facility for small
children of working women; v) provision of first aid and medical facilities; vi) adequate cleanliness and
hygiene in the accommodation. There will be no discrimination in facilities based on worker's race,
gender or nationality.
5. Emergency plans on health and fire safety are prepared for minimizing the accidental and intended
critical situations, including a plan for fire safety, including training of workers, periodic testing and
monitoring of fire safety equipment and periodic drills. Depending on the local context, additional
emergency plans are prepared as needed to handle specific occurrences (earthquakes, floods,
cyclones, etc.)
6. Cultural issues (nationality, religion, discrimination, and harassment, etc.): Contractor may provide
prayer rooms and other facilities, as necessary and to the extent practicable, to satisfy the religious
needs and customs of its workforce.
7. Contractor’s personnel shall not engage in any discrimination or harassing behavior. Contractor shall
establish an Equal Opportunity Policy to promote non-discrimination in accordance with labor
legislations.
8. Contractor shall implement a worker grievance procedure to address grievances between the workers.
9. Camp rules in relation to alcohol consumption and drug prohibition will be complied with. Contractor
shall provide recreational facilities where practicable. In addition, Contractor will provide counselling
for all workers, with no discrimination by race, sex or religion.
10. Each contractor/sub-contractor will maintain a register on accidental incidents and actions taken to
avoid similar situations.
15.2.1.7 Security of the Camp
1. The security measures will control camps to avoid intrusions from outside community. Contractor shall
include security measures to be provided at the camps which may include fencing, locks, alarms, pass
card systems, badge and pass system, access points, safe transport of personnel as appropriate.
2. Decommissioning of camps has several potential impacts. Local employment and provision of local
goods and services at camps will no longer be required; Locals employed and previously
accommodated in camps will no longer have access to services and benefits available at camps (e.g.
health services, recreation facilities); and Infrastructure which provides benefits to communities may
no longer be maintained (e.g. roads) and may be decommissioned and removed or reinstated (e.g.
access tracks). Contractor is to follow a proper retrenchment procedure and where community
requests, some infrastructure and services may be retained at the discretion of Company. Where
practicable, Contractor will return camp areas to former landforms.
or sexual abuse; (b) underground, underwater, working at heights or in confined spaces; (c) with dangerous machinery, equipment or tools, or involving handling or transport of heavy loads; (d) in unhealthy environments exposing children to hazardous substances, agents, or processes, or to temperatures, noise or vibration damaging to health; or (e) under difficult conditions such as work for long hours, during the night or in confinement on the premises of the employer.

207
[Title]
15.2.1.8 Roles and Responsibilities
Role of Contractor / sub-contractor
1. The Contractor shall ensure sufficient resources are allocated on a regular basis to meet the
requirements of this Plan. The Contractor Plan shall describe the roles and responsibilities of the
personnel and ensure that they are communicated properly to all concerned.
2. Training and Awareness Generation: Contractor shall ensure that all personnel responsible for the
execution of the tasks and requirements contained within this Plan are competent based on their
education, training and experience. The Contractor Plan shall describe the training and awareness
requirements necessary for its effective implementation. The contractor shall also consult with the
communities to help build economic and social capacity that benefits communities.
Role of SMART
With regards to this LWCMP, SMART will be responsible for the key management activities including:
● Development of bidding conditions regarding workers’ accommodation conditions;
● Professional training of its representatives on site;
● Monitoring, evaluations, and audit;
● Management cooperation in case of incidents (including registration and communication of events);
● Monitoring of corrective operations.
Specifically, within the SMART the following roles and responsibilities will apply:
Table 73: Roles and responsibilities
Role Responsibilities
Project Director Approves the Labor and Working Conditions Management Plan
Site coordinator /
Manager /PIU/RIU/DIU
● Assures implementation of LWCMP, including for Contractor implementation
● Develops, monitors, and revises LWCMP, as and when required, in consultation with the PCMU and Bank
● Assures availability of this Plan to PIU/CBO members and contractor / sub-contractor
● Periodical inspections / audits of contractors /sub-contractor’s performance and prepares regular report that includes details about workers lives conditions and any incidents (especially regarding incidents of GBV/SEA)
● Reports all risks, lack of conformities and incidents
● Periodically verifications of accommodation conditions
● Collect data from settlements
● Collaborate with local authorities

208
[Title]
A. Detailed Scope of Work
The scope of work as defined in the Terms of Reference is as delineated below:
A.1 Environmental and Social Assessment (ESA)
The consultant(s) will conduct an environment and social assessment to identify key environmental and
social issues, challenges and risks about the proposed project activities and locations. This assessment will
be undertaken in nine Agro-Climatic Zones of Maharashtra under the SMART Project. The ESA shall be
prepared after conducting field visits/Field survey to a sample of proposed sites and a thorough review of
literature and collection of secondary data. Moreover, during field visits, stakeholders and beneficiaries
will be consulted in every location to understand their needs and concerns and how the project can
address these better. The ESA will include:
A.1.1 Environmental and Social Baseline(s)
Consultants will prepare baseline of the key environmental and social parameters, including but not
limited to usage of agrochemicals, practice of organic / low input farming, irrigation practices, food safety,
health, hygiene, use of solar energy in agro-processing industries, presence of indigenous people (STs),
socio-economic status of direct project beneficiaries at the community level, land holding pattern, etc.
Consultants should propose additional parameters, as may be required. While secondary data will be
collected for baselines, wherever necessary; limited primary data collection may be undertaken.
Keeping in view the scope of the given study and its related timeline, viz., 03 Months; representative 100
number of samples of different abovementioned indicators should be selected from the 09 Agro-Climatic
Zones of Maharashtra.
The agency will do 50 samples in 05 agro-climatic zones (Eastern Vidarbha Zone, Central Vidarbha Zone,
Central Maharashtra Plateau Zone, North Konkan Coastal Zone and South Konkan Coastal Zone) while
project staff will collect data for 50 samples in remaining 04 agro-climatic zones (Western Ghat Zone, Sub-
Montane Zone, Western Maharashtra Plain Zone and Scarcity Zone) and from the proposals received for
productive partnerships, market access plans and collateral management agencies. The Agency will do
analysis for all the 100 samples.
The sites selected for developing baselines should represent all nine agro-climatic zones of Maharashtra
and cover all stakeholders such as Community Based Organizations (FPCs, CLFs, PACS, CMRCs)26, SC and
ST population with adequate gender representation (women).
A.1.2 Social Assessment:
Social Assessment of rural households should be done to assess the patterns of asset ownership,
livelihoods, access of excluded groups to goods and services, etc. to identify and suggest interventions to
increase ownership of the SMART project interventions. Social development outcomes of the assessment
exercise should focus on poverty reduction, equity and inclusion, strengthening of social capital and social
cohesion, and promotion of accountable and transparent governance, as well as suggest measures to
mitigate adverse impacts anticipated from project activities.
26 FPC- Farmer Producer Company, CLF- Cluster Level Federation, PACS- Primary Agricultural Credit Society, CMRCs- Community-managed Resource
Centers

209
[Title]
A.1.2.1 Review of the Legal and Policy Environment:
With respect to the proposed project interventions, the consultants will review the existing legal and
policy environment of Government of India27 and Govt. of Maharashtra28 in relation to their applicability
to the proposed project interventions, investments and compliance. The Consultants will also review the
applicability of the World Bank’s Environment and Social Safeguards Policies (OP 4.01 - Environmental
Assessment, OP4.03 - Performance Standards for Private Sector Activities, OP4.04 – Natural Habitats, OP
4.09- Pest Management, OP 4.10 - Indigenous Peoples and OP 4.12 - Involuntary Resettlement, etc.).
Identify which of the environmental and social laws are applicable to the project along with the World
Bank’s safeguards policies29 triggered by the project and provide adequate justification as well as ensure
that mitigation measures and actions are included in the ESMF to meet the requirements of the triggered
policies.
A.1.2.2 Analysis of GHG Footprint and Climate Risks of Select Value Chains
Based on the agreed sample value chains, the consultants will estimate the current GHG emissions and
climate footprint of the selected value chains and suggest measures to lower it along the same. The
resultant carbon estimate findings would be crucial and act as one of the key bases to estimate State-wide
Overall GHG Footprint and Climate Risks of the SMART project.
A.1.2.3 Stakeholder Consultations:
The consultants will carry out detailed and in-depth consultations with all the stakeholder (direct
community level beneficiaries, men and women farmers, CBOs, agri-business enterprises of varying sizes,
consumers, State Government Departments, etc.) and prepare stakeholder feedback report with names
of participants, photographs and short videos. These consultations will cover key challenges and issues
faced by these entities and possible solutions and recommendations suggested by the stakeholders.
A.1.2.4 Assess Food Safety Standards:
Based on a Consultative dialogue with the food industries and consumers, consultants will assess key
issues and gaps in existing capacities for improving the adoption of food safety standards in the
agribusiness sector. This should include a comparison with the India Gap Standards and Maximum Reside
Level (MRL). The Consultant/s will identify and list the commodities for which food safety standards are
available and those commodities that are traded but do not currently have any standards30.
A.1.2.5 Identify Environmental Impacts and Risks
Based on historical trends and field-based observations, stakeholder consultations and overall findings of
the ESA, consultants will identify potential and likely environmental adverse risks and impacts of the
proposed project activities (for devising mitigation measures). Both short-term and long-term as well as
direct and indirect impacts and risks needs to be identified.
27 http://www.envfor.nic.in/legis/legis.html
28 http://www.landsofmaharashtra.com/landrelatedlaws.html
29 https://www.worldbank.org/en/projects-operations/environmental-and-social-policies
30 https://www.ifc.org/wps/wcm/connect/c7bfaf0048855482b314f36a6515bb18/Final percent2B- percent2BFood percent2Band percent2BBeverage percent2BProcessing.pdf?MOD=AJPERES

210
[Title]
A.1.2.6 Assess capacity of proposed PMU to respond to identified environmental and social risks
and impacts
The consultants will assess the adequacy of the proposed PMU and other institutional arrangements for
implementation of the SMART project in addressing identified environmental and social risks and impacts
and suggest measures to strengthen such capacity.
A.1.3 Environmental and Social Management Framework (ESMF)
Based on the findings of the ESA, the consultant/s will develop an ESMF that lists all identified potential
impacts and risks and proposed mitigation actions, along with a monitoring framework for each risk and
action. It will include, among others:
● Impacts and Mitigation Action: Based on the identified impacts and risks, develop implementable and
practical mitigation actions to address/reduce/reverse adverse environmental and social impacts
against each of the identified (in the ESA) adverse environmental impacts and risks. Mitigation
measures could be at the level of policy, mainstreamed into project design, capacity development
and/or implemented as stand-alone;
● Measures for Enhancing Positive Environmental and Social Outcomes: Suggest appropriate measures
to enhance positive environmental and social impacts, such as, arising from the use of improved
production processes that reduces use of water, electricity and other natural resources, improve
ventilation of the production unit to ensure that employees work in safe ambient temperatures, use
of easily degradable packaging materials, on the environment side; and ways to include more female
beneficiaries at the higher end of the value chain and to involve members from marginalized sections
on the social side;
● Negative List: A negative list of activities having significant, long-term and irreversible adverse impacts
will be prepared that will not be supported through project investments;
● Specific Strategies and Plans: The consultants will develop the following project specific strategies and
plans – Gender Strategy, Planning Framework, Stakeholder Engagement Plan, Pest Management Plan
and Food Safety Strategy. Based on the ESA, additional strategies may need to be developed. Additional
strategies, such as, health, hygiene and safety management plan, periodic and regular cleaning
protocol for production and aggregation units, system for periodic third-party inspection and
certification of participating units, self-declaration protocols etc., may be prepared, as required based
on the findings of the ESA;
● Implementation Arrangements for ESMF: Suggest, in proportion to the identified risks and impacts,
institutional and implementation mechanisms, including the requirement of qualified staff(s) with
clear roles and responsibilities for implementing the proposed mitigation actions at all stages of the
project, including measures for integration in designing of sub-projects;
● Monitoring Plan: Provide a list of measurable indicators for monitoring the performance of agreed
mitigation actions during project implementation, including the methods of measuring, frequency and
responsibility of reporting;
● Capacity Enhancement: Suggest measures, including trainings, for strengthening the Project
Management capacity to implement, monitor, document and report on the various provisions of the
ESMF;
● Clauses for Inclusion in Bid Documents: The ESMF should be able to provide a list of potential clauses
related to food processing units that shall be integrated/incorporated into the bidding/contract
documents and/or loan appraisal documents of financial institutions participating in this project, as
may be required based on the size and nature of civil contracts;

211
[Title]
● National and International Good Practices: Prepare a list of international good practices and
sustainability initiatives developed, adopted and practiced by private sector related to contract
farming, Farmer Producer Organizations/Companies, upgradation and upkeep of the food processing
units; and
● Specific Studies: Based on the findings of the ESA and the coverage of ESMF, suggest a list of specific
studies that shall be taken up under the project for increasing the understanding of the issues and/or
for developing strategies to address challenging issues related to the project’s policy, regulatory and
operational aspects; and
● Budget for ESMF: Based on the suggested mitigation actions, staff and human resource requirements,
monitoring and capacity building needs, the consultants will propose a financial budget for
implementing the ESMF.

212
[Title]

213
[Title]
B. Checklists for Stakeholder Consultations
B.1 Crop-wise Checklists template for FPCs covered (for total of 35 crops)
FPCs Checklist template
Name of the Interviewer: Name of the interviewee:
Date of interview: Place of interview:
S. No Questions Response
1 Name of the FPC
2 Address of the FPC
3 No of Shareholders / members of FPC
4 Name of the Promoter(s)/Partner(s)
5 Address of the FPC
6 Contact No of FPC Telephone No.: Mobile No.:
7 e-mail Id of FPC
8 Date of establishment of FPC
9 What is the storage facility of the FPC
10 What is the existing processing infrastructure available in the FPC?
11 What is the processing capacity of each infrastructure?
12 What are the user charge rates?
13 What is the capacity utilization of the processing equipment - average how many hours in day / month / year
14 What is the major source of livelihood of the villagers? (farming, government jobs, business etc)
15 What is the area under cultivation for the crop?
16 What is the Average landholding size of the farmer cultivating the crop?
17 What is the Average annual production of the crop per hectare?
18 Total no. of farmers belonging to the FPC:
19 Out of the total no. of farmers, how many are having farming equipment such as tractors / threshers?
20 What is the type of soil used for cultivation of the crop?
21 What is the water quality required for cultivation of the crop?
22 What is the source of water for cultivation?
23 How much Area is covered under irrigation?
24 What is the irrigation type e.g. canal irrigation / Drip irrigation? Drip Irrigation percent: Canal Irrigation percent:
Other method percent:
25 How much is the water requirement per hectare for cultivation of the crop. Please collect information is different variety required different quantity of water per hectare
26 Are any water conservation measures adopted by the farmers during cultivation of the crop?
27 What are the sources for purchase of seed?
28 What are the variety of the crop is cultivated?
29 Any climate resistant variety available / promoted?

214
[Title]
FPCs Checklist template
30 What is the rate at which seeds / nursery are available?
31 What are the fertilizers used for cultivation of the crop?
32 How much is the quantity of the fertilizer used per hectare?
33 What is the rate at which fertilizer is available to farmers?
34 Are farmers aware of the quantity and quality of fertilizers to be used?
35 How much quantity of fertilizer is used per hectare?
36 What are the problems faced regarding fertilizers?
37 What are the pests that attack cultivation of the crop?
38 Are Farmers aware of biological trap control for pests?
39 What are the pesticides used for controlling pest in cultivation of the crop?
40 What is the quantity of pesticide used per hectare?
41 What is the rate at which pesticide is available to farmers?
42 Are farmers aware of the health impacts of pesticides?
43 Do farmers get training and awareness regarding use of pesticides?
44 How is the left-over pesticides and its empty containers handled?
45 What are the diseases commonly seen in the crop in the region?
46 History of crop cultivation loss due to disease if yes provide details.
47 Are there Agrochemicals such as fungicides / insecticides used in cultivation of the crop?
48 What are the agrochemicals used for cultivation of the crop?
49 How much is the quantity of agrochemicals used by the farmers?
50 What is the rate at which the agrochemicals are available to the farmer?
51 Are there proper demonstration or training for use of agrochemicals in the farm?
52 How is the leftover Agri-chemicals / pesticides after use handled / utilized or disposed?
53 How are the containers of Agri-chemicals / pesticides disposed?
54 Is solar energy used in the crop production by farmers? If yes how many farmers have?
55 Is solar energy used in the FPC? If yes for what purpose and its capacity?
56 Are there any organic farming adopted by the farmers for cultivation of this crop?
57 Is there any farm residue / Agri-waste left in the field after harvest?
58 How is the farm residue / Agri-waste handled by the farmers?
59 How many farmers adopt organic farming technique?
60 Are there any inter-cropping practice followed by farmers?
61 What are the short duration crops grown?
62 What is the quality standard specification of the crop that you prefer?
63 Whether the Quality of produce fulfil the market demand / Industry demand?
64 Details of the existing Market linkages Name of the buyer:Quantity of crop
supplied:
65 How much is the time required till harvest after planting?
66 What is the prevailing price of the crop, given to farmers?
67 What is the prevailing price of the intercrop?
68 What is the good agricultural practice for the crop
69 No of beneficiaries of Kisan Credit Card (KCC)?
70 How many use Crop insurance in the cluster?
71 How many use soil health cards?

215
[Title]
FPCs Checklist template
72 What are the factors which influence the quality of the crop?
73 What is the farm advisory services given to farmers? Such as SMS service for meteorological data or awareness creation etc.
74 Are Training provided to farmers?
75 Are Female farmers engaged in cultivation of this crop?
76 How many SC farmers are engaged in production of this crop?
77 How many ST farmers are engaged in production of this crop?
78 How is the work divided among male and female farmers during cultivation?
79 What are the challenges faced by the FPCs? Production: Post-Harvest:
Marketing:
80 What is the post harvesting facilities required by the FPC including primary processing, Storage and Logistics?
81 What measures shall be adopted to enhance the performance of FPCs
82 Is there any Grievance Redress Mechanism, available?
83 In case of any grievance where do you file complaint?
84 How much time does it take to resolve the issue?
85 Where compliant can be filed by hard copy/Mobile/online?
86 Are there any Natural disasters such as drought / flood etc that affect agriculture is the last 10 years?
Other common questions
Quantity Disposal method
Impact perceived
Mitigation measures
Residual Material
Residual Agricultural Farm Produce
Pesticide
List the Fertiliser
Problem faced
Pesticide
List the Pesticide
Health Impact
Awareness and training
Efficiency
Problem faced
Fertiliser
List the fertilisers
awareness of quantity and Quality
efficiency
Problem faced
Water
Source of water
Manure
Availability of manure
Quantity of manure
Social and Gender Qualitative assessment
Quantitative Assessment
Women participation
List the Activity

216
[Title]
Quantity Disposal method
Impact perceived
Mitigation measures
Income and payment compared to male
Bargain rights
Male female ratio
List the farm produce which is produced by women mainly
List the activity which are mainly done by women
List the reason why is women preferred
List the reason why is women not preferred
What could be the measure to include women
Indigenous People
What is the forest produces used
What are the special produces
Income sources
Medical dependence
Medicinal dependence
Livelihood dependence
Forest land dependence
Cultural activity linked with Agricultural Produces/ Forest Produces
B.2 Industry Checklist
Name of the Interviewer: Name of the interviewee:
Date of interview: Place of interview:
S. No. Description Response
1 Name of the Industry
2 Who is the Owner or Partners of the industry
3 What is the Address of the industry
4 What are the Contact details of the industry Telephone: Mobile:
e-mail id:
5 Total area of the industry
6 What is the type of Industry? (small, medium, large, start-up)
7 What are the raw materials used in the industry?
8 What is the capacity of the industry?
9 What is the capacity utilization at which the company is currently operating?
10 How does the farm produce reach the industry?
11 Are there any quality checks done before accepting the farm produce?
12 What is the raw material specification that you adopt?
13 If yes, how is the rejected material handled?
14 How is the price for the farm produce given to farmers?

217
[Title]
Name of the Interviewer: Name of the interviewee:
15 What is the mechanism adopted for cleaning, sorting and grading of raw material?
16 How much is the storage capacity of the raw material
17 Do you use any preservatives for the raw material during storage
18 Do you have facility to monitor the refrigeration and cooling system
19 Do you have enclosure technique to minimize damage to raw material
20 How much is the power consumption?
21 What is the source of power?
22 Do you have back-up power?
23 How much is the water consumption?
24 What is the source of water?
25 How much is the effluent generation?
26 What is the capacity of the Effluent Treatment Plant (ETP)?
27 What is the capacity of the Sewage Treatment Plant (STP)?
28 Does the industry have measures for air emission control (bag filters, cyclone, ESP scrubbers etc.)
29 What is the solid waste generated from the plant?
30 How is the solid waste managed
31 Do you adopt resource conservation measures such as water conservation, energy conservation, by product recovery and reuse
32 What are the odour management measures?
33 What are the food quality standards adopted by the Industry?
34 Where is the market for your product?
35 Does the industry have women employees?
36 Does the industry have SC employees?
37 Does the industry have ST employees?
38 Are there separate toilet facilities available for male and female employees
39 Is there creche facility for female employees?
40 What are the problems being faced in warehouse for farm produce
41 Is there any Grievance Redress Mechanism, available?
42 In case of any grievance where do you file complaint?
43 How much time does it take to resolve the issue?
44 Where compliant can be filed by hard copy/Mobile/online?
B.3 Slaughter house checklist
Name of the Interviewer: Name of the interviewee:
Date of interview: Place of interview:
S. No. Description Response

218
[Title]
Name of the Interviewer: Name of the interviewee:
1 Name of the Slaughter house
2 Who is the Owner or Partners of the slaughter house?
3 What is the Address of the slaughter house
4 What are the Contact details of the slaughter house Telephone: Mobile:
e-mail id:
5 Total area of the slaughter house
6 What is the type of slaughter house? (small, medium, large, start-up)
7 What is the capacity of the slaughter house?
8 What is the capacity utilization at which the company is currently operating?
9 How does the goat reach the slaughter house?
10 Does the slaughter house have license for slaughtering goat?
11 Does the slaughter house have Consent from the pollution control board?
12 Are there any quality checks done before accepting the goat?
13 What is the specification that you adopt?
14 If yes, how is the rejected goat handled?
15 How is the price for the goat given to farmers?
16 What are the steps adopted in the slaughter house?
17 Do the slaughter house has modern method of handling goat?
18 How much is the storage capacity of the goat?
19 At what price is the meat sold?
20 Where is the meat kept in the slaughter house?
21 Do you use any preservatives for the goat meat?
22 How much preservatives are used?
23 Do you have facility to monitor the refrigeration and cooling system?
24 How much is the power consumption?
25 What is the source of power?
26 Do you have back-up power?
27 How much is the water consumption?
28 What is the source of water?
29 How much is the effluent generation?
30 What is the capacity of the Effluent Treatment Plant (ETP)?
31 What is the capacity of the Sewage Treatment Plant (STP)?
32 Does the industry have measures for air emission control (bag filters, cyclone, ESP scrubbers etc)
33 What is the solid waste generated from slaughter house?
34 How is the solid waste managed?
35 Do you adopt resource conservation measures such as water conservation, energy conservation, by product recovery and reuse?
36 What are the odour management measures?
37 What are the food quality standards adopted by the Industry?
38 Where is the market for your meat?
39 How is the meat transported?
40 Other than meat what are the other things that are sold from the slaughter house?
41 What is the rate at which other material are sold?
Do you do any traceability study

219
[Title]
Name of the Interviewer: Name of the interviewee:
42 Does the industry have women employees?
43 Does the industry have SC employees?
44 Does the industry have ST employees?
45 Are there separate toilet facilities available for male and female employees
46 Is there creche facility for female employees?
47 What are the problems being faced by the slaughter house?
48 What are the measures that can be taken for improvement of the sector?
49 Is there any Grievance Redress Mechanism available?
50 In case of any grievance where do you file complaint?
51 How much time does it take to resolve the issue?
52 Where compliant can be filed by hard copy/Mobile/online?
B.4 Checklist for retailers
Name of the Interviewer: Name of the interviewee:
Date of interview: Place of interview:
S. No. Questions Response
1 Name of the Retailer
2 What is the type of Retailer (Corporate /SME/ Start-up)?
3 Name of the Promoter / Partners
4 Address of the Retailer
5 Contact No. Telephone: Mobile:
6 E-mail ID
7 When was the Retail Set-up?
8 What are the commodities handled in the Retail Shop?
9 What is the total land holding of the Retail shop?
10 What is the Landownership status of the market place (RMC, P&RD, ULB or private?
11 What is the Rate of lease money for land and where its deposited?
12 Are there mechanism for dissemination of price in the Market?
13 What is the quantity of commodity required by the retailer?
14 Is the desired quantity or the demand met by the retailer?
15 What is the Average distance between the CBO/Market/Farmer from the retailer?
16 How are the commodities transported to the retailer?
17 How much is the storage space available with the retailer?
18 Does the retailer have cold storage facility?
19 Retailer has how many collection centres?
20 Does the retailer have any contract signed with the supplier?
21 How are the commodities transported to the Consumers?
22 What are the quality standards set for the commodity by the retailer?
23 Are there any quality checks done by the retailer before accepting the commodity?

220
[Title]
Name of the Interviewer: Name of the interviewee:
24 How is the rejected material handled by the retailer?
25 Are there any processing and packaging facility with the retailer?
26 Are there any use of preservatives during storage of commodity?
27 What are the preservatives used?
28 How much quantity of preservatives are used?
29 Does the retailer have power connectivity?
30 How much is the power requirement?
31 Does the Retailer has weighing facility?
32 How is the waste managed by the retailer?
33 How many workers are there with the retailer?
34 Are there any female workers?
35 Are there any SC/ST workers?
36 If there is any increase/decrease of charge, is it based on Government schedule or as per the lessee's assessment?
37 How the price of commodities fixed (auction or negotiation)?
38 How is the price disclosure system in the market (price display)?
39 Are there any D.G set used by the retailer?
40 Are the D.G sets noise compliant and has stack attached
41 How many woman sellers approach retailer?
42 How many SC sellers are approach retailer?
43 How many SC sellers approach retailer?
44 Are there any plans for increasing the capacity?
45 Does the expansion plan require additional land for expansion?
46 Does additional land requirement involve acquisition of private land?
47 Are there any Food quality standards being complied by the Retailer?
48 Do the Retailer has FSSAI license?
49 What are the issues being faced the retailer? Transportation: Storage:
50 Do you face any challenges that are particularly due to climate change? For example, damage to commodity due to increased temperatures.
51 Is there any Grievance Redress Mechanism available?
52 In case of any grievance where do you file complaint?
53 How much time does it take to resolve the issue?
54 Where compliant can be filed by hard copy/Mobile/online?

221
[Title]
C. Detailed Legal and Policy Review
C.1 Applicable Environmental Rules and Regulations of Government of India
The list of central government regulations with respect to environment and its applicability is as indicated
in the table below.
Table 74: Applicable Central Rules and Regulations on Environment
S. No.
Relevant Act / Rule
Key features Project Applicability
1 Environmental Protection Act (EPA), 1986
EPA Act, 1986 is an umbrella Act that authorizes the central government to take measures to protect and improve the environmental quality and preventing controlling and abating environmental pollution.
The Act provides central government the power to give direction of closure, prohibition or regulation of an industry.
Environmental Impact Assessment (EIA) has been made mandatory as per the notification under the Act for projects listed in schedule to the notification.
The Environmental Protection Rules lay down procedure for setting up standard of emission or discharge environmental pollutants and hazardous substance management.
The Act will be applicable to the project since the investment is likely to facilitate enhancement in the capacity of existing Food Processing Industry and Slaughter houses and is likely to facilitate setting up of warehouses and retails outlets by leading Corporates.
It is necessary that the bidding contract with these corporates include clauses to adhere to the provisions of the EPA Act and requirement of obtaining Environmental Clearance or Costal Regulation Zone Clearances.
2 Water Act 1974 and Amended 1988
The Act provides for the prevention and control of water pollution and maintaining and restoring the wholesomeness of water in the country.
Section 25 of the Act stipulates that no person shall establish or take steps to establish industry, operation or process or any treatment and disposal system which is likely to discharge sewage or trade effluent into a stream or well or sewer or land without prior consent from the Concerned State Pollution Control Board (SPCB)
The Act will be applicable since the investment is likely to facilitate enhancement in capacity of food processing industry or slaughter houses or setting -up of new retail outlets by leading corporates.
It is necessary that the bidding contract with these corporates includes clauses to adhere to the provisions of Water Act and requirement of obtaining Consent under Section 25 of the Act.
3 Air Act 1981 The Act provides for the prevention, control and abatement of air pollution for the establishment. Section 21 of the Act stipulates that no person shall without prior consent of the SPCB establish or operate any industry in air pollution control area. And no person operating an industrial plant in air pollution control area shall discharge or cause or permit to discharge the emission of any air pollutants in excess of the standard laid down by the state board.
The Act will be applicable since the investment is likely to facilitate enhancement in capacity of food processing industry or slaughter houses or setting up of new retail outlets by leading corporates.
It is necessary that the bidding contract with these corporates includes clauses to adhere to the provisions of Air Act and requirement of obtaining Consent under Section 21 of the Act. Operation of D.G set will also require NOC from Maharashtra SPCB.
4 Forest Conservation Act 1980
The Forest Conservation Act 1980 was enacted to conserve the Country’s forest and it strictly restricts and regulates the de-reservation of forest or use of forest land for non-forest purpose without prior approval of Central Government. The Act has laid
The Consultants understands that the project does not involve any acquisition or diversion of forest land. But, in case of expansion of any existing infrastructure or Agri food industries that required forest land may attract diversion of forest and hence

222
[Title]
S. No.
Relevant Act / Rule
Key features Project Applicability
down the pre-requisites for the diversion of forest land for non-forest purpose.
the Act will be applicable. However, the chances are rare.
5 The National Green Tribunal Act, 2010
The National Green Tribunal Act 2010 led to the establishment of National Green Tribunal for effective and expeditious disposal of cases relating to environmental protection and conservation of forests and other natural resources including enforcement of any legal right relating to environment and giving relief and compensation for damages to person and property and for matters connected therewith or incidental thereto.
The Act may be applicable with respected to area where developmental activities of the project may cause any damage to the environment and property.
6 Disaster Management Act 2005
The Disaster Management Act, 2005 has been enacted as the central Act to deal with the management of disaster.
The Consultants note that districts of Raigad, Ratnagiri and Satara are the districts that lie in seismic zone IV, western and north western district lie in zone III and central eastern district lie in Zone II. In accordance of the seismicity of the area any construction activity / intervention shall be conducted and accordingly the bidding contract shall be framed.
6 Energy Conservation Act 2001
The Energy Conservation Act, 2001 requires large energy consumers to adhere to energy consumption norms, new building to follow the energy conservation and building code and appliances to meet energy performance standard and to display energy consumption labels.
The Consultants note that the project involve investment in energy efficient equipment and energy conservation measures in the agriculture value chain.
7 The Biological Diversity Act 2002
The Biological Diversity Act 2002 is the Act to preserve the biological diversity of India and provides for suitable mechanism for equitable sharing of benefits arising out of the use of traditional biological resources and knowledge.
The Consultants note that the project does not involve use of biological resources or associated knowledge for commercial or research purpose and sharing of benefits out of it. However, the Act can be used as guideline to prevent planning of project components near ecologically sensitive areas including National Parks and Sanctuaries.
8 Prevention of Food Adulteration Act 1954
The Prevention of Food Adulterations Act 1954 make provision for prevention of adulteration of Food and prevents import, manufacture sale or distribution of adulterated and misbranded food. It regulates use of colour, preservatives and other ingredients that are injurious to health and prescribes standards and prohibits misbranded foods. Central Government has established laboratories at Kolkata, Ghaziabad, Mysore and Pune for analysis of samples and fixation of standard and quality control parameter for food article.
The Act is applicable since the investment is likely to facilitate enhancement of capacity of food processing, cleaning, grading, marketing of agriculture commodities.
The relevant provisions of the Act shall be included in the bidding documents with the Corporates.
9 Hazardous and Other Waste (Management Handling and transboundary moment) Rules
The Rule ensures resource recovery and disposal of hazardous waste in an environmentally sound manner. The Rule includes waste management hierarchy in the sequence of priority of prevention, minimization, reuse, recycling, recovery, co-processing and safe disposal of hazardous waste.
The Act is applicable since there will be use of agro-chemical and fertilizers in the agricultural and other allied activities in the project area and unused chemical and their containers and packages shall be disposed as per the provisions of this act.
10 Solid Waste Management Rules, 2016 and Construction
These Rules shall be applicable to every Urban Local Body, Outgrowth in urban agglomerations, census towns in notified area. As per the provision of the SWM rules waste shall be segregated at source in
The SWM and CDW Rules shall be applicable since the investment facilitates setting up of warehouse, markets, cold storages, processing facilities and retails and hence the municipal waste generated

223
[Title]
S. No.
Relevant Act / Rule
Key features Project Applicability
and Demolition Waste Management Rules, 2016
three bins, construction and demolition waste shall be handled separately as per CDW Rules and horticulture waste and garden waste generated shall be stored separately. No waste generated shall be thrown, burned or buried on streets, open public space or in drain or water bodies.
from these facilities shall be handled as per SWM rules and any new construction activity shall comply with CDW Rules.
The bidding contract with the corporates shall include adherence to provisions of these Rules.
11 Insecticide Act 1968 and Rules 1971
The Insecticide Act 1968 and Rules 1971 regulate the import, manufacture, sale, transport, distribution and use of insecticides with a view to prevent risk to the human beings or animals. Insecticide is defined as substance including fungicides and weedicides as central government may notify. The Act mandates registration of insecticide, license to manufacturers, packaging and labelling. The Act also has guidelines stipulated for protective clothing of persons handling insecticides. Disposal of used packages, surplus material and washing of insecticides are also included in the Act.
The SMART Project does not include procurement, stocking or sale of insecticides. However, in case of any emergency outbreak of any disease, the Act shall be applicable. In case of usage the farmers shall be trained for the safe usage of insecticides and disposal of its container and packaging material in safe manner.
12 Fertilizer Control Order 1985
The Fertilizer control Order 1985 administered by the Department of Agriculture Cooperation, GOI has been issued under the Essential Commodities Act 1955. The Order lay down as to what substance qualify for use as fertilizer in the soil, product-wise specification, methods of sampling and analysis of fertilizer, procedure for obtaining license / registration as manufacturers / dealers in fertilizers and condition to be fulfilled for traders thereof.
The Fertilizer Control Order shall be applicable since the project will not support procurement of fertilizer from unauthorized vendors to be used for farming.
13 Food Safety and Standards (Food Products Standards and Food Additives) Act 2006 and Rules, 2011 and subsequent amendment
The FSSAI consolidates laws relating to food and lays down scientific standard for articles of food. It regulates their manufacturing storage, distribution, sale and import to ensure availability of safe and wholesome food for human consumption. It’s a single reference point for all matters related to food safety and standard, regulation and enforcement.
The Act provides for regulation of food import in the country, provision for food recall, surveillance, new enforcement structure, envisages large network of food labs, new justice dispensing system for fast track disposal of cases, harmonization of domestic standard with international food standard, covers health food supplements, nutraceuticals, Issuing license within time frame, compensation to victims, reward to informers, registration for small vendors and central licensing from Authority.
The Act shall be applicable since the investment will facilitate enhancement in agriculture-based commodities, processing and grading facilities, infrastructures such as market, warehouse, retail etc which will develop agri-business and agricultural productivity.
14 Fruit Products Order (FPO), 1955
Fruit and Vegetable Processing sector is regulated by the Fruit Products Order 1955, which is administered by the Ministry of Food Processing Industries, GOI.
The main objective is to lay down quality standard to manufacture fruit and vegetable products maintaining sanitary and hygienic conditions in the premises.
It is mandatory for all manufactures of fruit and vegetable products including some
The proposed investment will result in interventions in the agriculture sector to enhance infrastructure facilities like warehouse, market, retails where hygienic conditions needs to be maintained as per the standards specified by FSSAI. Further the intervention is also proposed in CBOs / FPCs where the guidelines of the order needs to be complied.
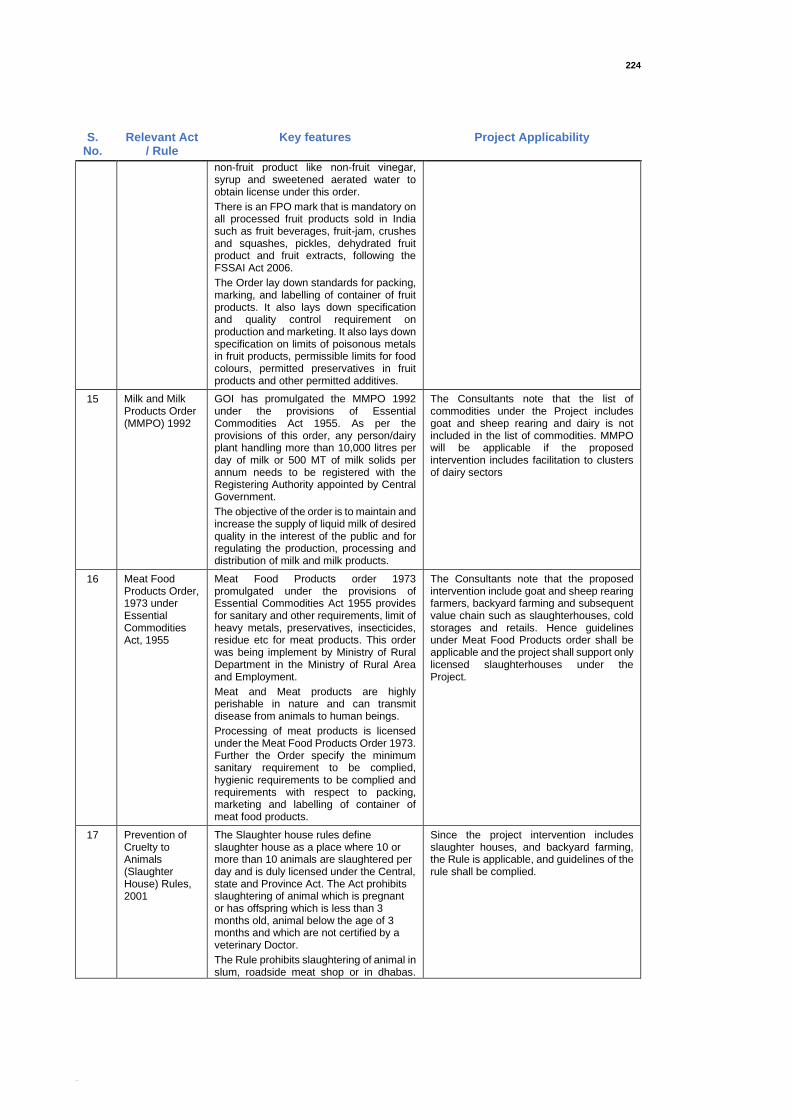
224
[Title]
S. No.
Relevant Act / Rule
Key features Project Applicability
non-fruit product like non-fruit vinegar, syrup and sweetened aerated water to obtain license under this order.
There is an FPO mark that is mandatory on all processed fruit products sold in India such as fruit beverages, fruit-jam, crushes and squashes, pickles, dehydrated fruit product and fruit extracts, following the FSSAI Act 2006.
The Order lay down standards for packing, marking, and labelling of container of fruit products. It also lays down specification and quality control requirement on production and marketing. It also lays down specification on limits of poisonous metals in fruit products, permissible limits for food colours, permitted preservatives in fruit products and other permitted additives.
15 Milk and Milk Products Order (MMPO) 1992
GOI has promulgated the MMPO 1992 under the provisions of Essential Commodities Act 1955. As per the provisions of this order, any person/dairy plant handling more than 10,000 litres per day of milk or 500 MT of milk solids per annum needs to be registered with the Registering Authority appointed by Central Government.
The objective of the order is to maintain and increase the supply of liquid milk of desired quality in the interest of the public and for regulating the production, processing and distribution of milk and milk products.
The Consultants note that the list of commodities under the Project includes goat and sheep rearing and dairy is not included in the list of commodities. MMPO will be applicable if the proposed intervention includes facilitation to clusters of dairy sectors
16 Meat Food Products Order, 1973 under Essential Commodities Act, 1955
Meat Food Products order 1973 promulgated under the provisions of Essential Commodities Act 1955 provides for sanitary and other requirements, limit of heavy metals, preservatives, insecticides, residue etc for meat products. This order was being implement by Ministry of Rural Department in the Ministry of Rural Area and Employment.
Meat and Meat products are highly perishable in nature and can transmit disease from animals to human beings.
Processing of meat products is licensed under the Meat Food Products Order 1973. Further the Order specify the minimum sanitary requirement to be complied, hygienic requirements to be complied and requirements with respect to packing, marketing and labelling of container of meat food products.
The Consultants note that the proposed intervention include goat and sheep rearing farmers, backyard farming and subsequent value chain such as slaughterhouses, cold storages and retails. Hence guidelines under Meat Food Products order shall be applicable and the project shall support only licensed slaughterhouses under the Project.
17 Prevention of Cruelty to Animals (Slaughter House) Rules, 2001
The Slaughter house rules define slaughter house as a place where 10 or more than 10 animals are slaughtered per day and is duly licensed under the Central, state and Province Act. The Act prohibits slaughtering of animal which is pregnant or has offspring which is less than 3 months old, animal below the age of 3 months and which are not certified by a veterinary Doctor.
The Rule prohibits slaughtering of animal in slum, roadside meat shop or in dhabas.
Since the project intervention includes slaughter houses, and backyard farming, the Rule is applicable, and guidelines of the rule shall be complied.

225
[Title]
S. No.
Relevant Act / Rule
Key features Project Applicability
The Rule also stipulates the requirements of slaughter houses.
The Rule on prevention of cruelty to animals stipulates penalty for any sort of cruelty on animal, control and supervision for experimenting on animal.
18 Forest Right Act - 2006, The Scheduled Tribe and Other Traditional Forest Dwellers (Recognition of Forest Right) Act, 2006
This s Act recognize and vests forest right in the forest dwelling schedule tribes and other traditional forest dwellers for collection of minor forest produce access to grazing grounds and water bodies and traditional areas of use of Nomadic or pastoral communities
The Act shall be applicable since the Project intervention related activities such as infrastructure development and cluster-based organization coming in Tribal Districts shall be as per the preview of this Act.
19 The Plastic Waste Management Rules, 2016
The Rule has been enforced for effective management of plastic waste and give thrust on plastic waste minimization, segregation at source, recycling, involving waste pickers, recyclers and waste processors in collection of plastic waste fraction either from household or any other sources of its generation and adopts polluter pay principle for sustainable waste management.
The guidelines of the Rule shall be complied during the construction and implementation stage of the Project.
Source: MM Secondary review
C.2 State Environmental Laws and Regulations
The list of state regulations with respect to environment and its applicability is indicated in table below.
Table 75: Applicable State Rules and Regulations of Environment
S. No
Name of relevant Act / Rule
Key features Project Applicability
1 Maharashtra Water Policy 2003
Creating incentives for efficient and productive water use and empowering local farmer institutions known as Water User Association.
The Policy guidelines shall be followed by promoting water conservation measures in the agriculture value chain.
2 Maharashtra Management of Irrigation System by Farmers Act 2005 and Rules thereunder
To involve farmers in various aspects of management of irrigation system. Create Water User Association for equitable distribution of water, maintain irrigation system, efficient usage of water for optimal agricultural production, protect environment and ensure ecological balance.
The guidelines of the Act shall be followed by promoting water conservation measures during farming and efficient use of irrigation water.
3 Maharashtra Water Resource Regulatory Authority Act 2005
To provide for establishment of MWRRA to regulate water resource within the State, facilitate and ensure judicious, equitable and sustainable management, allocation and utilization of water resource and fix rates for use of water for agriculture, industry, drinking and other purposes
The guidelines of the Act on sustainable and efficient use of water shall be followed by promoting efficient and sustainable use of water during farming as well as in the value chain.
4 Maharashtra Ground Water (Development and Management) Rules
The Rule is in the draft stage. The rules have made a provision that will require farmers in the notified ground water stressed area to seek permission before sowing water intensive crop. Also provides to seek permission before sinking any new well.
The Project shall ensure that the Act is complied with and necessary permission / approvals are obtained by the Project beneficiaries.

226
[Title]
S. No
Name of relevant Act / Rule
Key features Project Applicability
5 Maharashtra Biological Diversity Rules, 2008
The Act provides for conservation of biological diversity, sustainable use of biological resources and equitable sharing of benefits arising out of the use of biological resources. The Act requires approval for commercial utilization or bio-survey and bio-utilization of any biological resource by resident Indian National or from Industries registered in India which have at least 51 percent share capital of Indian citizens.
The Project shall ensure that the Act is complied with and necessary permission / approvals are obtained by the Project beneficiaries.
6 Maharashtra Felling of Trees (Regulation) Act, 1964
The Act provides regulation on felling of certain trees in the state of Maharashtra for the purpose of preservation thereof and for protection of the soil against erosion and to provide for matters connected therewith. The Act stipulates requirement of permission from Tree officer of the State government prior to felling of tree.
The provision of the Act shall be complied in case felling of trees are required for any proposed expansion of warehouse or market or FPOs / FPCs.
7 Maharashtra Air (Prevention and Control of Pollution) Rules, 1983
The Maharashtra state has formulated Rules under the Air Act 1981 in consultation with the state board for prevention and control of Air Pollution.
The Rule shall be applicable since any expansion or modification which is likely to add emission to air environment shall require prior consent from the MSPCB.
8 Maharashtra Water (Prevention and Control of Pollution) Rules, 1983
The Maharashtra state has formulated rules under the Water Act 1974 in consultation with the state board for prevention and control of water pollution.
The Rule shall be applicable since any expansion or modification which is likely to add emission to air environment shall require prior consent from the MSPCB.
9 Maharashtra Pollution Control Board on Poultry and Cattle (Goat) Sheds
The Circular provides categorization of animals in terms of its weight, classification of slaughter houses, type of solid waste and recommended methods of disposal and capacity of biogas plant.
The Project intervention includes slaughter houses and hence the guidelines of the circular shall be complied by the slaughterhouse proposed to be benefited by the Project.
Source: MM Secondary review
C.3 Relevant Central and State Government Schemes and Programs on
Environment
Centre and the State Governments have been implementing several schemes / programmes under Central
Schemes, Centrally Sponsored Schemes and State Schemes, that are relevant to the project. Some of these
schemes and their salient features are discussed below:
Table 76: Relevant central and State Government Schemes and Programs on Environment
Name of scheme / program
Key features
Neem Coated Urea ● Neem coating leads to more gradual release of urea helping plants gain more nutrients and resulting in higher yield.
● Neem-coating will help check heavily subsidized urea’s pilferage to chemical industry and other uses such as making of adulterated milk.
● On 25th May 2015, Department of Fertilizers made it mandatory for all domestic producers of urea to produce 100 percent Neem Coated Urea with an extra MRP of 5 percent.
● Entire quantity of indigenously produced urea and imported urea is being neem coated from 1st September and 1st December 2015 respectively.

227
[Title]
Name of scheme / program
Key features
Smart Food Initiative founded by the ICRISAT
The Smart Food initiative is founded by the International Crop Research Institute for Semi-Arid Tropics (ICRISAT) with the aim to build food system where food is high in nutrition, good for planet and good for the smallholder Farmer. Millets including sorghum are the foods in focus. The goal is to accelerate and popularise investment and support for the research and development of value chain of millet.
It is a global campaign for foods that ensure well-being of people and the environment along with better incomes for smallholder farmers of Asia and Africa.
Strengthening & Modernization of Pest Management approach in India (SMPMA)
Strengthening and modernization of Pest Management Approach in India is a central sector scheme having components such as Integrated Pest Management, Locust Control and Research and Implementation of Insecticides Act.
IPM packages of practice has been developed for 87 crops, Posters, manuals and Farmer’s guide has been prepared for rice and cotton
Source: MM Secondary review
C.4 Applicable Social Acts and Rules
Table 77: Applicable social legislations
S. No.
Applicable Act Key features Relevance to Project
1. Agricultural Produce (Grading and Marking) Act, 1937
The Agriculture Produce (Grading and Marketing) Act 1937 was enacted to provide for rating and marking of the products taken from agriculture including other products.
The Act provides for fixing grade designation to indicate quality, defining quality indicated to every grade, specify grade designated marks, authorising person or body to prescribe mark, specifying condition for manner of marking, penalty for an authorised marking with grade designated mark, penalty for counterfeiting grade designated mark and penalty for selling miss-graded articles.
The Act will be applicable since the investment includes intervention to enhance agricultural value chain.
2. National seed Policy 2002
National Seed Policy has been launched to provide for intellectual protection of new varieties, creation of new infrastructure facilities along with strengthening of existing facilities, use of biotechnology, import policy to make best planting material available in the world to Indian farmers after meeting quality standard, long term policy for export of seeds, promotion of domestic seed variety
The Policy shall be applicable since the Project intervention are intended to support enterprise growth and expanding market access.
3. The Seeds Act, 1966
The Seed Act, 1966 provides legal framework around seed certification and make good quality seed available to cultivators. It covers seed of food crop, oil crop, cotton seed, seeds of cattle fodder and all type of vegetative propagative material.
The Act shall be applicable since the seed production at village or cluster level that will supply seed to all members farmers of the producer group. The Act will be also applicable in case where mass procurement and distribution of seed is done through Producer Groups.
The SMART project will support only truthfully labelled seeds or certified seeds.
4. Rural Producers Companies Act, 2002
The concept of Producer Companies was introduced in 2002 by incorporating a new Part IXA in to the Companies Act 1956 with the aim to frame legislation that would enable incorporation of cooperatives as
The Act shall be applicable as the Project intervention will facilitate expansion or enhancement of Agri-enterprise and Agri-production

228
[Title]
S. No.
Applicable Act Key features Relevance to Project
companies and conversion of existing cooperatives into companies and ensure unique elements of cooperative business with a regulatory framework like that of companies.
Producer Companies perform activities such as production, harvesting, processing, procurement, grading, pooling, handling, marketing, selling, export of primary produce of the members or import goods or services for their benefit.
common facilitation centre and Producer Farmer Group
5. Agricultural Produce (Grading and Marking) Act, 1937
The Agriculture Produce (Grading and Marketing) Act 1937 was enacted to provide for rating and marking of the products taken from agriculture including other products.
The Act provides for fixing grade designation to indicate quality, defining quality indicated to every grade, specify grade designated marks, authorising person or body to prescribe mark, specifying condition for manner of marking, penalty for an authorised marking with grade designated mark, penalty for counterfeiting grade designated mark and penalty for selling miss-graded articles.
The Act will be applicable since the investment includes intervention to enhance agricultural value chain.
6 APMC Act 2003 and its amendments
APMC Act empowers state government to notify the commodities and designate market and market areas where the regulated trade takes place.
The Act also provides for the formation of Agriculture Produce Market Committees that are responsible for the operation of the market
The Act shall not be applicable since the project interventions at market level.
7 Producer Company registered under the Companies Act, 2013
A producer company is basically a body corporate registered as producer company under Company Act 2013. Only persons engaged in an activity connected with, or related to, primary produce can participate in the ownership. The members are necessary to be primary producers. Termed as “Companies with Limited Liability” and the liability of the members will be limited to the amount, if any, unpaid on the shares. Name of the company shall end with producer company limited and shall be treated as a private limited company for application of law and administration of the Company.
The Act shall be applicable since the intervention will result in expansion and technical enhancement of producer companies.
8 Maharashtra Agricultural Produce Marketing (Development and Regulation) Act, 1963
The Act regulate the marketing of agriculture and pisciculture produce in Market area. The Act provides for establishment of Market Committees in the State. These Market Committees are engaged in development of market yards for the benefit of agriculturists and the buyers.
The provisions of the Act shall not be complied as the intervention includes Markets.
Source: MM Secondary review
C.5 Relevant Central and State Government Social Schemes and Programs
Some of these schemes and their salient features are discussed below:
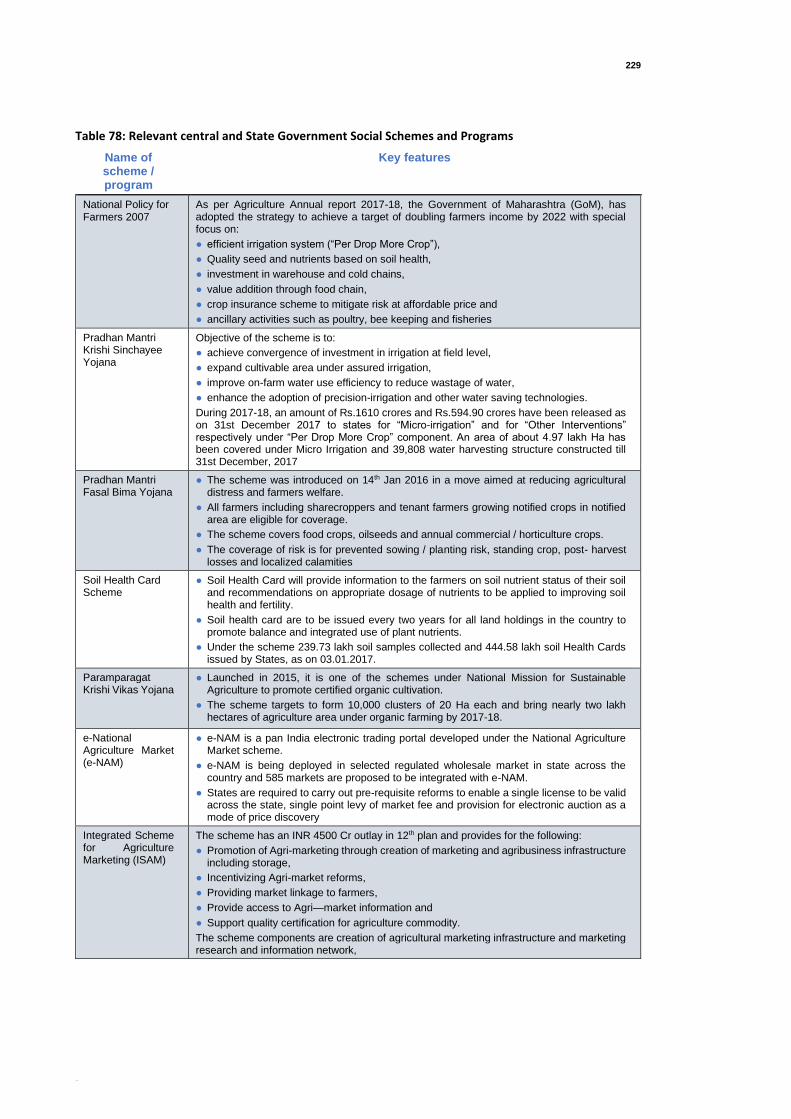
229
[Title]
Table 78: Relevant central and State Government Social Schemes and Programs
Name of scheme / program
Key features
National Policy for Farmers 2007
As per Agriculture Annual report 2017-18, the Government of Maharashtra (GoM), has adopted the strategy to achieve a target of doubling farmers income by 2022 with special focus on:
● efficient irrigation system (“Per Drop More Crop”),
● Quality seed and nutrients based on soil health,
● investment in warehouse and cold chains,
● value addition through food chain,
● crop insurance scheme to mitigate risk at affordable price and
● ancillary activities such as poultry, bee keeping and fisheries
Pradhan Mantri Krishi Sinchayee Yojana
Objective of the scheme is to:
● achieve convergence of investment in irrigation at field level,
● expand cultivable area under assured irrigation,
● improve on-farm water use efficiency to reduce wastage of water,
● enhance the adoption of precision-irrigation and other water saving technologies.
During 2017-18, an amount of Rs.1610 crores and Rs.594.90 crores have been released as on 31st December 2017 to states for “Micro-irrigation” and for “Other Interventions” respectively under “Per Drop More Crop” component. An area of about 4.97 lakh Ha has been covered under Micro Irrigation and 39,808 water harvesting structure constructed till 31st December, 2017
Pradhan Mantri Fasal Bima Yojana
● The scheme was introduced on 14th Jan 2016 in a move aimed at reducing agricultural distress and farmers welfare.
● All farmers including sharecroppers and tenant farmers growing notified crops in notified area are eligible for coverage.
● The scheme covers food crops, oilseeds and annual commercial / horticulture crops.
● The coverage of risk is for prevented sowing / planting risk, standing crop, post- harvest losses and localized calamities
Soil Health Card Scheme
● Soil Health Card will provide information to the farmers on soil nutrient status of their soil and recommendations on appropriate dosage of nutrients to be applied to improving soil health and fertility.
● Soil health card are to be issued every two years for all land holdings in the country to promote balance and integrated use of plant nutrients.
● Under the scheme 239.73 lakh soil samples collected and 444.58 lakh soil Health Cards issued by States, as on 03.01.2017.
Paramparagat Krishi Vikas Yojana
● Launched in 2015, it is one of the schemes under National Mission for Sustainable Agriculture to promote certified organic cultivation.
● The scheme targets to form 10,000 clusters of 20 Ha each and bring nearly two lakh hectares of agriculture area under organic farming by 2017-18.
e-National Agriculture Market (e-NAM)
● e-NAM is a pan India electronic trading portal developed under the National Agriculture Market scheme.
● e-NAM is being deployed in selected regulated wholesale market in state across the country and 585 markets are proposed to be integrated with e-NAM.
● States are required to carry out pre-requisite reforms to enable a single license to be valid across the state, single point levy of market fee and provision for electronic auction as a mode of price discovery
Integrated Scheme for Agriculture Marketing (ISAM)
The scheme has an INR 4500 Cr outlay in 12th plan and provides for the following:
● Promotion of Agri-marketing through creation of marketing and agribusiness infrastructure including storage,
● Incentivizing Agri-market reforms,
● Providing market linkage to farmers,
● Provide access to Agri—market information and
● Support quality certification for agriculture commodity.
The scheme components are creation of agricultural marketing infrastructure and marketing research and information network,

230
[Title]
Name of scheme / program
Key features
Mission for Integrated Development of Horticulture (MIDH)
MIDH is a centrally sponsored scheme for the holistic growth of horticulture sector covering fruits vegetables, root and tuber crop, mushroom, spices, flowers, aromatic plants, coconuts, cocoa and bamboo. Main objective of the mission is to:
● Promote holistic growth of horticulture sector which shall include research, technology promotion, extension, post harvesting management, processing and marketing;
● Encourage farmers to form groups such as FPOs, FPC;
● Enhance horticulture production, augment farmers, income and strengthen nutritional security;
● Improve productivity by way of quality germplasm, planting material and water use efficiency through Micro Irrigation; and
● Support skill development and create employment generation opportunities for rural youth in horticulture and post-harvest management, especially in the cold chain sector.
National Mission on Agricultural Extension and Technology under ATMA
The implementation of National Mission of Agriculture Extension and Technology (NMAET) started in 1.4.2014. The scheme promotes decentralized farmer-driven and farmer-accountable extension system through an institutional arrangement for technology dissemination in the form of an Agricultural Technology Management Agency (ATMA) at district level. Under the scheme grants-in-aid is released to states governments with an objective to support their efforts of revitalization of the extension system and making available the latest agricultural technologies in different thematic areas to increase agricultural production through extension activities viz. Farmers Training, Demonstrations, Exposure Visits, Kisan Mela, Mobilization of Farmers Groups and Setting up of Farm Schools. Through these activities, latest agriculture technologies are disseminated to farmers of the country.
An autonomous institution viz. Agricultural Technology Management Agency (ATMA) set up at district level is responsible to ensure delivery of extension services to farmers. ATMA Governing Board is the apex body of ATMA which provides overall policy direction. ATMA Management Committee is the executive body looking after implementation of the scheme. District Farmers Advisory Committee is a body to provide farmers’ feedback for district level planning and implementation. ATMA is the district level nodal agency responsible for overall management of agriculture extension system within the district, including preparation of Strategic Research and Extension Plan (SREP).
Agri Udaan scheme
The Central Government has launched Agri Udaan Food and Agribusiness Accelerator 2.0 to promote innovation and entrepreneurship in agriculture. Accelerators are 4 – 8 months program aiming at scaling up innovative start-ups with a working prototype and initial market traction. This is done through education, mentorship, and financing. Start-ups enter accelerators for a fixed-period of time, and as part of a cohort. The cohort is shortlisted by evaluation panel comprising of industry veterans, business experts, R&D scientists. Four distinct factors that make accelerators unique are fixed term, cohort based, mentorship driven, and they culminate into demo day.

231
[Title]

232
[Title]
D. Socio-economic Profile
Table 79: Workforce Participation Rate (WPR), 2011
S. No. District Total
Workers Total WPR Main WPR Male WPR
Female WPR
WPR in Primary Sector
1. Ahmednagar 2,204,590 48.53 44.89 55.50 41.10 71.91
2. Akola 768,154 42.35 38.1 55.81 28.11 67.46
3. Amravati 1,236,322 42.80 36.75 56.56 28.33 70.11
4. Aurangabad 1,575,079 42.55 39.08 52.79 31.47 60.39
5. Bhandara 597,305 49.76 34.48 56.98 42.41 72.88
6. Beed 1,255,548 48.57 44.67 53.95 42.70 78.04
7. Buldana 1,219,641 47.16 42.82 54.88 38.89 81.06
8. Chandrpur 1,058,172 48.00 36.49 57.71 37.91 65.67
9. Dhule 9,36,370 45.66 40.27 54.12 36.71 71.41
10. Gadchiroli 5,84,237 54.45 36.62 59.73 49.08 80.99
11. Gondiya 6,65,419 50.31 32.81 57.92 42.71 70.32
12. Hingoli 5,69,182 48.34 43.69 54.58 41.73 82.24
13. Jalgaon 18,63,571 44.06 38.86 54.00 33.31 70.91
14. Jalna 8,44,492 47.52 43.11 53.88 40.72 77.34
15. Kolhapur 17,04,054 43.96 38.92 56.81 30.54 54.39
16. Latur 10,46,857 42.66 39.29 52.63 31.91 71.48
17. Mumbai 12,84,396 41.63 39.2 60.61 18.8 0.92
18. Mumbai suburban
37,35,021 39.92 37.58 58.5 18.3 0.98
19. Nagpur 18,68,560 40.15 35.56 55.94 23.55 33.73
20. Nanded 14,93,953 44.45 39.2 53.48 34.86 72.31
21. Nandurbar 7,92,065 48.05 40.3 53.16 42.84 82.04
22. Nashik 27,63,328 45.25 41.31 55.31 34.48 61.44
23. Osmanabad 773,916 46.69 42.34 54.99 37.70 77.12
24. Parbhani 8,22,797 44.81 41.20 53.18 35.98 74.49
25. Pune 40,48,993 42.94 39.78 57.06 27.50 32.14
26. Raigarh 10,72,969 40.73 32.60 56.08 24.74 37.11
27. Ratnagiri 7,14,076 44.21 34.36 53.47 35.96 63.02
28. Sangli 12,15,104 43.06 38.09 55.74 29.93 63.47
29. Satara 13,54,947 45.11 39.43 55.92 34.17 65.18
30. Sindhudurg 3,47,178 40.86 26.66 55.03 27.18 59.52
31. Solapur 18,98,395 43.97 40.84 54.17 33.09 62.98
32. Thane 44,92,767 40.62 35.54 57.34 21.74 17.09
33. Wardha 6,08,235 46.76 40.72 58.70 34.14 68.25
34. Washim 5,69,792 47.60 42.00 54.87 39.77 83.5
35. Yavatmal 13,55,999 48.91 43.11 57.43 39.97 79.14
Source: Primary Census Abstract, 2011

233
[Title]
Table 80: District-wise Human Development Indicators
S. No. District Human Development Index (HDI)
1. Nandurbar 0.604
2. Gadchiroli 0.608
3. Washim 0.646
4. Hingoli 0.648
5. Osmanabad 0.649
6. Nanded 0.657
7. Jalna 0.663
8. Latur 0.663
9. Dhule 0.671
10. Beed 0.678
11. Parbhani 0.683
12. Buldana 0.684
13. Yavatmal 0.700
14. Gondiya 0.701
15. Amravati 0.701
16. Bhandara 0.718
17. Chandrapur 0.718
18. Ahmednagar 0.720
19. Akola 0.722
20. Wardha 0.723
21. Jalgaon 0.723
22. Aurangabad 0.727
23. Solapur 0.728
24. Ratnagiri 0.732
25. Satara 0.742
26. Sangli 0.742
27. Nashik 0.746
28. Sindhudurg 0.753
29. Raigarh 0.759
30. Kolhapur 0.770
31. Nagpur 0.786
32. Thane 0.800
33. Pune 0.814
34. Mumbai 0.841
Source: Maharashtra Human Development Report, 2011
Table 81: District-wise Social Profile
S. No.
District
Female ( percent to
total population
)
Sex ratio
Literacy
rate ( percent to
total population
)
Literacy rate
female ( percent to
total female
population)
Literacy rate male ( percent to total male
population)
SC population ( percent to total
population)
ST population ( percent to total
population)
1. Ahmdnagr 48.4 939 79.05 70.89 86.82 12.63 8.33
2. Akola 48.6 946 88.05 83.54 92.34 20.07 5.53
3. Amravati 48.7 951 87.4 83.1 91.46 17.5 14.0

234
[Title]
S. No.
District
Female ( percent to
total population
)
Sex ratio
Literacy
rate ( percent to
total population
)
Literacy rate
female ( percent to
total female
population)
Literacy rate male ( percent to total male
population)
SC population ( percent to total
population)
ST population ( percent to total
population)
4. Aurangabad
48.0 923 79.02 70.08 87.37 14.57 3.87
5. Bhandara 49.5 982 83.76 77.08 90.35 16.69 8.6
6. Beed 47.8 916 76.99 85.55 67.82 13.6 1.3
7. Buldana 48.3 934 83.4 75.84 90.54 18.2 5.2
8. Chandrpur 49.0 961 80.01 72.97 86.79 15.8 17.67
9. Dhule 48.6 946 72.8 65.77 79.5 6.22 31.56
10. Gadchiroli 49.5 982 74.36 66.27 82.31 11.25 38.71
11. Gondiya 49.9 999 84.95 77.89 92.04 13.31 16.2
12. Hingoli 48.5 942 78.17 68.95 86.94 15.51 9.51
13. Jalgaon 48.0 925 78.2 70.56 85,36 9.2 14.29
14. Jalna 48.4 937 71.52 60.95 81.53 13.9 2.16
15. Kolhapur 48.9 957 81.51 74.22 88.57 13.01 12.8
16. Latur 48.1 928 77.26 69.63 84.39 19.6 2.34
17. Mumbai 45.4 832 89.21 86.5 91.5 7.1 5.5
18. Mumbai suburban
46.2 860 89.91 86.4 92.9 6.2 1.1
19. Nagpur 48.8 951 88.39 84.51 92.09 18.65 9.4
20. Nanded 48.5 943 75.45 66.15 84.27 19.05 8.38
21. Nandurbar 49.5 978 64.38 56.47 72.17 2.91 69.28
22. Nashik 48.3 934 82.31 76.08 88.17 9.08 25.62
23. Osmanabad
48.0 924 78.44 70.51 85.84 16 2.17
24. Parbhani 48.6 947 73.34 63.63 82.64 13.47 2.21
25. Pune 47.8 915 86.15 81.05 90.84 12.52 3.7
26. Raigarh 48.9 959 83.14 76.92 89.13 5.12 11.58
27. Ratnagiri 47.1 1122
82.18 74.50 90.90 4.15 1.26
28. Sangli 49.1 966 81.48 74.59 88.22 12.51 0.65
29. Satara 49.7 988 82.87 76.31 89.42 10.76 0.99
30. Sindhudur 50.9 1036
85.56 79.81 91.58 6.54 0.82
31. Solapur 48.4 938 77.02 68.55 85.03 15.05 1.8
32. Thane 46.9 886 84.53 79.77 88.72 6.6 13.95
33. Wardha 48.6 946 86.99 81.81 91.92 14.5 11.5
34. Washim 48.2 930 83.25 75.48 90.55 19.17 6.72
35. Yavatmal 48.8 952 82.82 75.93 89.41 11.8 18.5
Source: Primary Census Abstract, 2011

235
[Title]
Table 82: District-wise Demographic Profile
S. No.
District Total
Population (in crores)
percent to State
population
Population density
(persons / sq.km)
Household size
Rural population
Urban population
percent of urban
population
percent of rural
population
1. Ahmdnagr 45,43,159 4.04 266 4.9 36,30,542 9,12,617 20.08 79.91
2. Akola 18,13,906 1.61 320 4.6 10,94,165 719,741 39.67 60.32
3. Amravati 28,88,445 2.57 237 4.4 18,51,158 1,037,287 35.91 64.08
4. Aurangabad 37,01,282 3.29 365 4.9 20,81,112 1,620,170 43.77 56.22
5. Bhandara 12,00,334 1.07 294 4.3 9,66,503 2,33,831 19.48 80.52
6. Beed 25,85,049 2.30 242 4.8 20,70,751 5.14,298 19.89 80.10
7. Buldana 25,86,258 2.3 268 4.6 20,37,398 5,48,860 21.22 78.78
8. Chandrpur 22,04,307 1.96 193 4.1 14,28,929 7,75,378 35.18 64.82
9. Dhule 20,50,862 1.83 285 4.9 14,79,826 5,71,036 27.84 72.16
10. Gadchiroli 10,72,942 0.95 74 4.2 9,54,909 1,18,033 11.0 88.9
11. Gondiya 13,22,507 1.18 253 4.5 10,96,577 2,25,930 17.08 82.92
12. Hingoli 1,177,345 1.05 244 5.1 9,98,612 1,78,733 15.18 84.82
13. Jalgaon 42,29,917 3.76 360 4.7 28,87,206 13,42,711 31.74 68.25
14. Jalna 19,59,046 1.74 255 5.0 15,81,617 3,77,429 19.3 80.7
15. Kolhapur 38,76,001 3.45 504 4.6 26,45,992 12,30,009 31.73 68,27
16. Latur 24,54,196 2.18 343 5.1 18,29,216 6,24,980 24.5 74.5
17. Mumbai 30,85,411 2.75 19,652 4.6 - 30,85,411 100 -
18. Mumbai suburban
93,56,962 8.33 20,980 4.4 - 93,56,962 100 -
19. Nagpur 46,53,570 4.14 470 4.4 14,74,811 31,78,749 68.31 31.69
20. Nanded 33,61,292 2.99 319 5.0 24,47,394 9,13,898 27.2 72.8
21. Nandurbar 16,48,295 1.47 277 4.9 13,72,821 275,474 16.71 83.29
22. Nashik 61,07,187 5.43 393 4.9 35,09,814 25,97,373 42.5 57.5
23. Osmanabad 16,57,576 1.48 219 4.7 13,76,519 2,81,057 17.0 83.0
24. Parbhani 18,36,086 1.63 295 5.1 12,66,280 5,69,806 31.03 68.97
25. Pune 94,29408 8.39 603 4.4 36,78,226 57,51,182 39.0 60.99
26. Raigarh 26,34,200 2.34 368 4.3 16,64,005 9,70,195 36.83 63.17
27. Ratnagiri 16,15,069 1.44 197 4.1 13,51,346 2,63,723 16.33 83.67
28. Sangli 28,22,143 2.51 329 4.7 21,02,786 7,19,357 25.49 74.51
29. Satara 30,03,741 2.67 287 4.6 24,33,363 5,70,378 18.99 81.01
30. Sindhudur 8,49,651 0.76 163 4.0 7,42,645 1,07,006 12.59 87.41
31. Solapur 43,17,756 3.84 290 4.9 29,18,665 13,99,091 32.40 67.60
32. Thane 1,10,60,148 9.84 1157 4.4 25,45,470 85,14,678 76.99 23.01
33. Wardha 13,00,774 1.16 206 4.2 8,77,474 4,23,300 32.5 67.5
34. Washim 11,97,160 1.07 244 4.6 9,85,747 2,11,413 17.7 82.3
35. Yavatmal 27,72,348 2.47 204 4.3 21,74,195 5,98,153 21.58 78.42
Source: Primary Census Abstract, 2011

236
[Title]
E. Gender Analysis of Value Chain
E.1 Gender Division of Labour for Turmeric
Figure 23: Gender Division
Value chain
Land preparation
Production
Primary processing
Secondary processing
Marketing
Ploughing-100 percent
Harrowing-100 percent
Bed preparation-100 percent
Earthing up=100 percent
Fertilizer application-10 percent
Pesticide spraying-100 percent
Irrigation--100 percent
Harvesting-10 percent
Boiling-60 percent
Grinding-50 percent
Packaging-10 percent
90 percent
--
Sowing-100 percent
Weeding-100 percent
Fertilizer application-90 percent
Harvesting-90 percent
Boiling-40 percent
Drying-100 percent
Grinding-50 percent
Packaging--90 percent
10 percent

237
[Title]
E.1.1 Access and Control Over Resources
Figure 24: Access and Control Over Resources
•Land
•Inputs(seed, fertilizer, pesticide)
•Credit
•Implements
•Extension
•Technology
•Warehouse
•Market
•Market intelligence service
•Land
•Inputs
•Credit(only farm owner)
•Implements-Limited ( Lack of women friendly equipments)
•Extension(only farm owner)/Training
•Technology(Only farm owner)
•Market- Nigligible access
•Market- Nigligible access
•Land
•Inputs
•Credit
•Implements
•Market
•Training
•Income
Access Control
Limited
participation is
seed selection

238
[Title]
E.2 Gender Analysis of Okra Value Chain Based on Division of Labour
Figure 25: Gender Analysis Okra Value Chain
Value chain
Land preparation
Production
Primary processing
Marketing
Ploughing-100 percent
Harrowing-100 percent
Bed preparation-100 percent
Fertilizer application-10 percent
Pesticide spraying-100 percent
Irrigation--100 percent
Transportation100 percent
Harvesting-10 percent
Weighing/loading/unloading-100
percent
Domestic-100 percent-APMC,
Retailing-20 percent
Export-100 percent
--
Sowing-100 percent
Weeding-100 percent
Fertilizer application-90 percent
Harvesting-90 percent
Grading & Packing-100 percent
Retailing-80 percent

239
[Title]
E.2.1 Access and Control Over Resource
Figure 26: Access and Control Over Resource - Soybean
•Land
•Inputs(seed, fertilizer, pesticide)
•Credit
•Implements
•Extension
•Technology
•Warehouse
•Market
•Land
•Inputs
•Credit(only farm owner)
•Implements-Limited ( Lack of women friendly equipments)
•Extension(only farm owner)/Training
•Technology(Only farm owner)
•Warehouse
•Market- Nigligible access
•Market intelligence Nigligible access
•Land
•Inputs
•Credit
•Implements
•Market
•Training
•Income
Access Control/Decision making
Limited
participation in
seed selection

240
[Title]
E.3 Gender Analysis of Soybean Value Chain Based on Division of Labour
Figure 27: Gender Analysis of Soybean Value Chain Based on Division of Labour
Value Chain
Land preparation
Production
Post-harvest
Marketing
Ploughing-100 percent
Harrowing-100 percent
Sowing-10 percent machine
Fertilizer application-10 percent
Pesticide spraying-100 percent
Irrigation-60 percent
Threshing-20 percent
100 percent
--Sowing-90 percent
Weeding-100 percent
Fertilizer application-90 percent
Irrigation-40 percent
Harvesting-100 percent
Drying-100 percent
Threshing-80 percent
---

241
[Title]
E.3.1 Access and Control
Figure 28: Access and Control - Soybean
•Land
•Inputs(seed, fertilizer, pesticide)
•Credit
•Implements
•Extension
•Technology
•Warehouse
•Market
•Land
•Inputs
•Credit(only farm owner)
•Implements-Limited ( Lack of women friendly equipments)
•Extension(only farm owner)/Training
•Technology(Only farm owner)
•Warehouse (only farm)
•Market- Nigligible access
•Market intelligence -Nigligible
•Land
•Inputs
•Credit
•Implements
•Market
•Training
•Income
Access Control

242
[Title]

243
[Title]
F. Detailed Environmental Baseline
F.1 Topography
Maharashtra is in the north centre of Peninsular India and is spread over a geographic area of 3,07,713
sq.km. The state is located between 150 45’ N to 220 06’ N latitude and 720 36’E to 800 54’ E longitude31.
Maharashtra topography comprises of the
Western Ghat or the Sahyadri hills and the deccan
plateau. The Sahyadri range forms the backbone of
Maharashtra and is a very important part of
physiology of the state as it blocks the monsoon
bearing winds and causes rainfall in the eastern
part. The ranges from the most important
drainage basin of the river system of western and
central India. The altitude of the ranges is higher in
the northern part of the state namely
Mahabaleshwar at 1438 m.
The main hills and ranges of the region include
Satpura ranges, Tamhini Varandha and
Sawantwadi Ghats which are the divisions of the
Western Ghats.
The Konkan region is situated between the Arabian
sea and the Sahyadri range and is mainly low-lying area. The region is very unruly, steep at some places
and valley in some places.
The main rivers of the state are river Krishna, Bhima, Godavari, Tapi, Purna and the Wardha
Deccan Plateau covers most of the peninsular part of India and is boarded by the Western Ghats and the
Eastern Ghats in the west and the east respectively. Major cities of Maharashtra in the Deccan region
are Pune Nagpur and Solapur. Most of the northern part of the Deccan is in Maharashtra. The rocks in
the region are mainly basalt and granite. The altitude of the plateau ranges between 450 – 750m.
The topographic map of Maharashtra is as indicated in the Figure below.
31 Dr Shelar S K and Dr Madhuri S K; Conservation Strategies of Biodiversity in Maharashtra, India, International Journal of Applied Research 2016;
2(4); 713 -716
Sahyadri Ranges Maharashtra Maharashtra Tourism Govt. of Maharashtra
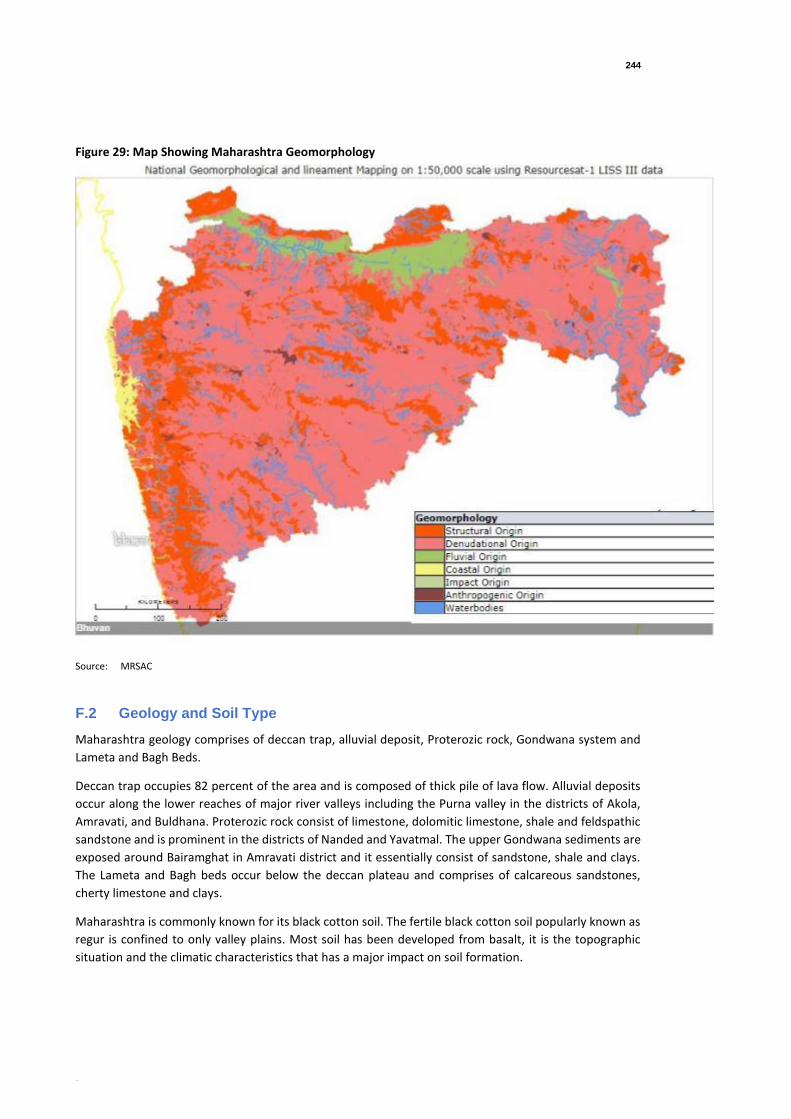
244
[Title]
Figure 29: Map Showing Maharashtra Geomorphology
Source: MRSAC
F.2 Geology and Soil Type
Maharashtra geology comprises of deccan trap, alluvial deposit, Proterozic rock, Gondwana system and
Lameta and Bagh Beds.
Deccan trap occupies 82 percent of the area and is composed of thick pile of lava flow. Alluvial deposits
occur along the lower reaches of major river valleys including the Purna valley in the districts of Akola,
Amravati, and Buldhana. Proterozic rock consist of limestone, dolomitic limestone, shale and feldspathic
sandstone and is prominent in the districts of Nanded and Yavatmal. The upper Gondwana sediments are
exposed around Bairamghat in Amravati district and it essentially consist of sandstone, shale and clays.
The Lameta and Bagh beds occur below the deccan plateau and comprises of calcareous sandstones,
cherty limestone and clays.
Maharashtra is commonly known for its black cotton soil. The fertile black cotton soil popularly known as
regur is confined to only valley plains. Most soil has been developed from basalt, it is the topographic
situation and the climatic characteristics that has a major impact on soil formation.

245
[Title]
The major soils of Maharashtra are classified in the following types32:
• Light black course shallow soil occurring in the central high elevation,
• Medium Black Soil occurring in the central Plateaus,
• Deep Black soil occurring in the central river valleys,
• Reddish brown soil occurring in western hill slopes,
• Alluvial soil occurring in the western coastal area,
• Yellowish Brown soil of mixed origin occurring in high elevation in the east,
• Yellowish brown soil occurring in eastern plateau,
• Laterite soil occurring in western coastal area and
• Saline soils occurring in the western Konkan region.
District wise geology and soil type is as indicated in Table 83. The map showing geology and soil type in
Maharashtra are as indicated in the figure below.
Figure 30: Map Showing Maharashtra Geology / Soil type
Source:
District wise soil moisture content map of Maharashtra is as indicated in the Figure below.
3232 Maharashtra Water Sector Improvement Project, Department of Agriculture, Maharashtra State.

246
[Title]
Figure 31: District Wise Soil Moisture Content Map of Maharashtra
Source:
F.3 Maharashtra Land-use Plan
Maharashtra Land-use map is as indicated in the Figure below.
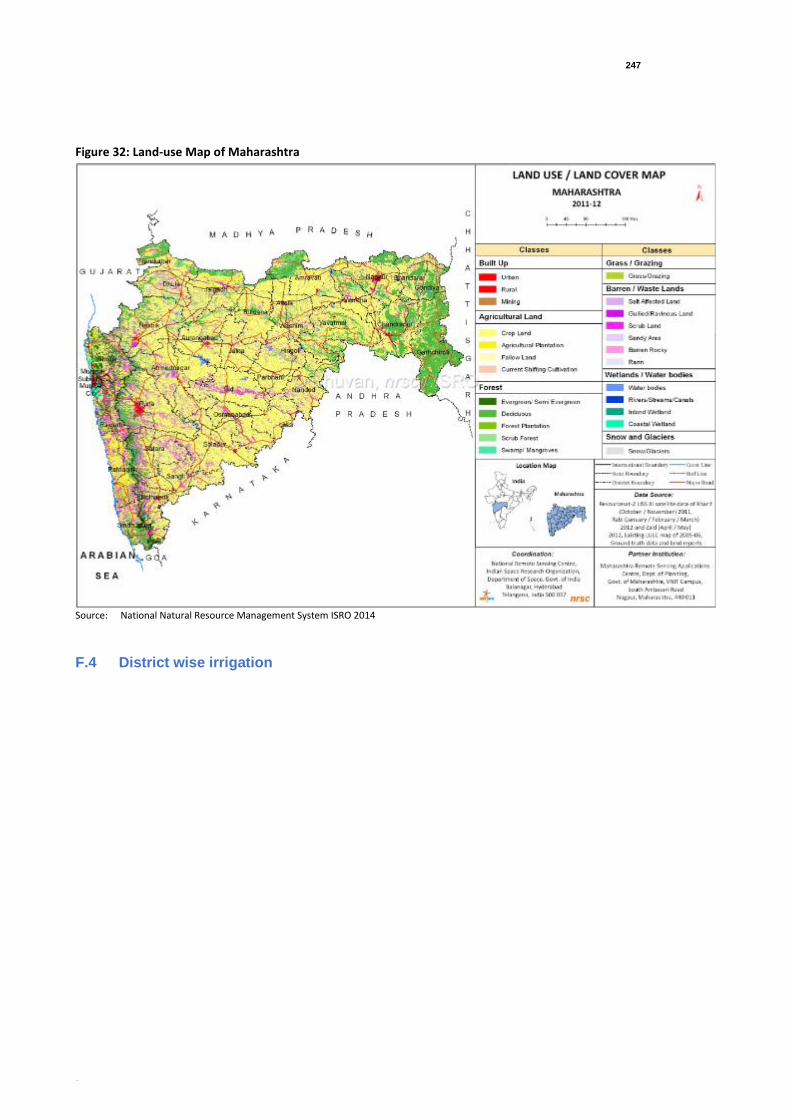
247
[Title]
Figure 32: Land-use Map of Maharashtra
Source: National Natural Resource Management System ISRO 2014
F.4 District wise irrigation

248
248
Table 83: District Wise Agricultural Statistics
All units in ‘000 Ha
S. No.
District Agro Climatic Zone
Geographical Area
Geology Soil Type Rainfall Agricultural Land-use
Irrigation Cropping Intensity
Forest Cover
1 Thane North Konkan Coastal Zone
934 Alluvium Deccan Trap Basalt
The major soil types are: Shallow red soil: 708.4 Medium deep red soil: 221.9 Deep Soil: 3.6
2597.5 mm
Net Sown area: 356 Area sown more than once 36 Gross cropped area 392
Net Irrigated area: 19.2 Gross Irrigated area: 21.3
Rainfed Area: 336.8 Canal, open, bore well
and lift irrigation
110 percent
330
2 Raigarh North Konkan Costal Zone
687 Alluvium and Laterite Gondwana
The major soil types are: Shallow soil: 453.8 Medium deep soil: 233.4 Deep Soil: 0.2
3200.9 mm
Net Sown area 203 Area sown more than once 30 Gross cropped area 233
Net Irrigated area:14.9 Gross Irrigated area: 17.4
Rainfed Area: 188.1 Canal and open well
114 percent
149
3 Ratnagiri South Konkan Coastal Zone
816 Alluvium, beach sand, laterite, shale
The major soil types are: Deep soil: 64.3 Medium deep soil: 234 Shallow Soil: 517.6
3591.3 mm
Net Sown area 303 Area sown more than once 35 Gross cropped area 338
Net Irrigated area: 9.4 Gross Irrigated area: 10.4
Rainfed Area: 293.6 Canal, open well and
micro irrigation
112 percent
6
4 Sindhudurg South Konkan Coastal Zone
504 Alluvium, beach sand, laterite, shale
The major soil types are: Deep Soil: 57.17 Medium Deep soil: 192.28
Shallow Soil: 254.53
3598.8 mm
Net Sown area 163 Area sown more than once 4 Gross cropped area 167
Net Irrigated area: 17 Gross Irrigated area: 20
Rainfed Area: 127 Open well, bore well and
lift irrigation scheme
102 percent
39
5 Satara Western Maharashtra Scarcity Zone
1058.2 Alluvium Deccan Trap Basalt
The major Soil type are: Shallow grey / black soil: 517.2 Deep black soil: 147.9 Medium lack soil: 134.3
768 mm Net Sown area 580.4 Area sown more than once 219 Gross cropped area 799.4
Net Irrigated area: 94.6 Gross Irrigated area:
283.0 Rainfed Area: 421.7
Canal, open well and lift irrigation
128 percent
13.5
6 Pune Western Maharashtra Plain Zone Scarcity Zone
1562 Alluvium Deccan Trap Basalt
The major soil type is: Shallow red grey soil: 571.1
Deep black soil: 200.5 Medium Deep black soil: 173.3
744.9 mm Net Sown area 945 Area sown more than once: 203 Gross cropped area 1148
Net Irrigated area: 287 Gross Irrigated area: 313
Rainfed Area: 835 Canal, tank, open well
and lift irrigation
121 percent
165.1

249
249
S. No.
District Agro Climatic Zone
Geographical Area
Geology Soil Type Rainfall Agricultural Land-use
Irrigation Cropping Intensity
Forest Cover
7 Kolhapur Sub Mountain Zone
776.3 Alluvium Deccan Trap Basalt
The major soil types are: Shallow laterite soil: 172.4
Deep brownish soil 151.5
Medium deep black soil: 102.9
1019.5 mm
Net Sown area 414.4 Area sown more than once 318.8 Gross cropped area 733.2
Net Irrigated area: 128 Gross Irrigated area: 135
Rainfed Area: 298.9 Tank, open well bore well,
lift irrigation
177 percent
147.2
8 Nashik Western Ghat Western Maharashtra Plain Zone Scarcity Zone
1536.4 Alluvium Deccan Trap Basalt
The major soil types are: Shallow red soil: 536.7 Medium red/black soil: 170.3 Deep black soil: 101.9
1076 mm Net Sown area 742.4 Area sown more than once 56.1 Gross cropped area 798.5
Net Irrigated area: 193 Gross Irrigated area:
407.4 Rainfed Area: 549
Canal, tank, open, bore well and lift irrigation
108 percent
320.6
9 Nandurbar Western Maharashtra Plain Zone
503 Alluvium Deccan Trap Basalt Bagh Beds
The major soil types are: Shallow black soil: 118.8
Medium deep black soil: 103.9 Deep black soil: 74.2
872 mm Net Sown area 297 Area sown more than once 100.0 Gross cropped area 397
Net Irrigated area: 66 Gross Irrigated area: 91
Rainfed Area: 231 Open well and bore well
irrigation
134 percent
105
10 Dhule Scarcity zone
824.6 Alluvium Deccan Trap Basalt Bagh Beds
The major soil types are: Shallow black soil: 278 Medium deep black soil: 111.0 Deep black soil: 75.8
728.5 mm Net Sown area 431 Area sown more than once 19 Gross cropped area 464
Net Irrigated area: 87.1 Gross Irrigated area:
117.1 Rainfed Area: 377.6
Canal, open well and bore well irrigation
108 percent
208.8
11 Ahmednagar Western Maharashtra Scarcity Zone
1511.78 Alluvium Deccan Trap Basalt
The major Soil type are: Shallow Grey Soil: 389.4
Medium deep black soil: 142 Deep black soil: 63.4
531 mm Net Sown area 645 Area sown more than once 130.4 Gross cropped area 784.4
Net Irrigated area:170.57 Gross Irrigated area:
131.45 Rainfed area: 108.67
Percentage: 20 percent Tank, open well, borewell
105 percent
121
12 Solapur Scarcity Zone
1487.8 Alluvium Deccan Trap Basalt
The major soil types are: Shallow black soil: 699 Deep black soil: 188.1 Medium black soil: 143.7
723.4 mm Net Sown area 919.7 Area sown more than once 102.8 Gross cropped area 1022.5
Net Irrigated area: 251.5 Gross Irrigated area: 271
Rainfed Area: 759.9 Canal, tank, open, bore
well and lift irrigation scheme
111 percent
35.3

250
250
S. No.
District Agro Climatic Zone
Geographical Area
Geology Soil Type Rainfall Agricultural Land-use
Irrigation Cropping Intensity
Forest Cover
13 Sangli Scarcity Zone Western Maharashtra Plain Zone
861 Alluvium Deccan Trap Basalt
The major soil types are: Shallow black / red soil: 389.4 Deep black soil: 142.7 Medium deep black soil: 63.4
692.4 mm Net Sown area 557.1 Area sown more than once 91.9 Gross cropped area 649
Net Irrigated area: 174 Gross Irrigated area: 190
Rainfed Area: 421.6 Canal, tank, open, bore
well, lift and micro irrigation
117 percent
45.1
14 Jalgaon Central Maharashtra Plateau Zone
1163.9 Alluvium Deccan Trap Basalt
The major soil types are: Shallow black soil 415.61
Medium Deep black soil 136 Deep black soil 85.16
750 mm Net Sown area 844.2 Area sown more than once 480.6 Gross cropped area 1324.8
Net Irrigated area: 213 Gross Irrigated area: 295
Rainfed Area: 717 Canal, open well, bore
well and lift irrigation
156 percent
155.9
15 Aurangabad Western Maharashtra Scarcity Zone Central Maharashtra Plateau Zone
1007.7 Alluvium Deccan Trap Basalt
The major soil type is: Deep black soil 200.61 Medium deep black soil 209.37 Shallow black soil 597.39
734.3 mm Net Sown area 654 Area sown more than once 130.4 Gross cropped area 784.4
Net Irrigated area: 163.3 Gross Irrigated area:
200.2 Rainfed area: 490.7
Percentage: 20 percent open well, bore well lift
irrigation
120 percent
72.6
16 Buldana Central Maharashtra Plateau Zone
967 Alluvium Deccan Trap Basalt
The major soil type is: Deep black soil 342.0 Medium Deep black soil 80.6 Shallow black soil 544.3
792.5 mm Net Sown area 712 Area sown more than once 44 Gross cropped area 756
Net Irrigated area: 43.45 Gross Irrigated area:
46.56 Rainfed Area: 704.12
Canal irrigation
106 percent
54
17 Jalna Central Maharashtra Plateau Zone
772.6 Alluvium Deccan Trap Basalt
The major soil types are: Shallow black soil 349.1 Medium Deep black soil 289.8 Deep black soil 213.5
750.4 mm Net Sown area 529 Area sown more than once 159 Gross cropped area 688
Net Irrigated area: 116.48 Gross Irrigated area:
124.03 Rainfed Area: 412.52
Canal Tank and open well irrigation
130 percent
4.9
18 Beed Western Maharashtra Scarcity Zone Central Maharashtra Plateau Zone
1068.6 Rocky and thin layer soil except on the banks of Godavari
The Major soil type are: Deep Black Soil 332.21 Medium Deep Black Soil 130.66 Shallow black soil 661.96
674.77 mm
Net Sown area 876 Area sown more than once 175.2 Gross cropped area 1051.2
Net Irrigated area: 137.7 Gross Irrigated area: 169
Rainfed area: 738.3 Percentage: 16 percent
open well irrigation
109 percent
22.9

251
251
S. No.
District Agro Climatic Zone
Geographical Area
Geology Soil Type Rainfall Agricultural Land-use
Irrigation Cropping Intensity
Forest Cover
19 Osmanabad Central Maharashtra Plateau Zone Scarcity Zone
748.5 Deccan Trap Basalt
The major soil types are: Deep black soil 171.69 Medium Deep black soil 79.54 Shallow soil 490.81
842.4 mm Net Sown area 519.31 Area sown more than once 321.88 Gross cropped area 841.19
Net Irrigated area: 106.65 Gross Irrigated area:
128.37 Rainfed Area: 412.6
Canal, tank, open, and bore well
161 percent
4.4
20 Latur Central Maharashtra Plateau Zone
715.7 Alluvium Deccan Trap Basalt
The major soil types are: Deep black soil 253.67 Medium deep black soil 105.80 Shallow black soil 351.10
769.7 mm Net Sown area 529 Area sown more than once 159 Gross cropped area 688
Net Irrigated area: 319 Gross Irrigated area: 349
Rainfed Area: 249 Canal and Open well
irrigation
130 percent
1.8
21 Parbhani Central Maharashtra Plateau Zone
631.1 Alluvium Deccan Trap Basalt
The major soil types are: Deep black soil 413.12 Medium deep soil 32.77 Shallow soil 322.15
957.6 mm Net Sown area 518.78 Area sown more than once 103.75 Gross cropped area 622.53
Net Irrigated area: 131.77 Gross Irrigated area:
182.269 Rainfed Area: 387.01
Canal, tank, open well irrigation
120 percent
6.4
22 Akola Central Maharashtra Plateau Zone
540 Alluvium Deccan Trap Basalt
Deep Black Soil 251.34 Medium Deep Black Soil 53.50 Shallow Black Soil 235.15
825.3 mm Net Sown area 434.9 Area sown more than once 91.1 Gross cropped area 526
Net Irrigated area: 24.51 Gross Irrigated area:
42.82 Rainfed area: 441.6
Open and canal irrigation
121 percent
35
23 Amravati Central Maharashtra Plateau Zone
1304 Alluvium Basalt Lameta Bed Gondwana Metamorphic
The major Soil type are: Deep Black Soil 653.7 Medium Deep Black Soil 13.1 Shallow Black Soil 501.2
886.4 mm Net Sown area 602 Area sown more than once 110 Gross cropped area 712
Net Irrigated area: 51.3 Gross Irrigated area: 63.8
Rainfed area: 540.7 Percentage: 8.8 percent
open well, bore well lift irrigation
118 percent
8.8
24 Washim Central Vidarbha zone
514 Alluvium Deccan Trap Basalt
The major soil types are: Deep black soil 239.2 Medium Deep black soil 50.9 Shallow black soil 223.8
965.3 mm Net Sown area 386 Area sown more than once 38 Gross cropped area 424
Net Irrigated area: 31.58 Gross Irrigated area:
41.81 Rainfed Area: 399.71
Canal, tank, open, bore well, lift and micro
irrigation
110 percent
35

252
252
S. No.
District Agro Climatic Zone
Geographical Area
Geology Soil Type Rainfall Agricultural Land-use
Irrigation Cropping Intensity
Forest Cover
25 Hingoli Central Maharashtra Plateau Zone Central Vidarbha zone
466.1 Alluvium Deccan Trap Basalt
The major soil types are: Deep black cotton soil 186.40 Medium deep black soil 40.77 Shallow black soil 285.81
946.6 mm Net Sown area 382.1 Area sown more than once 120.4 Gross cropped area 502.5
Net Irrigated area: 88.9 Gross Irrigated area:
204.3 Rainfed Area: 293.2
Canal, tank, open well, bore well and lift irrigation
132 percent
28.4
26 Nanded Central Maharashtra Plateau Zone Central Vidarbha Zone
1033.1 Alluvium Basalt Vindhyan Peninsular granite Pink and Grey Granite
The major soil types are: Deep black soil 394.65 Medium deep black soil 101.12 Shallow black soil 576.26
993.1 mm Net Sown area 711 Area sown more than once 100.1 Gross cropped area 811.1
Net Irrigated area: 112 Gross Irrigated area:
125.64 Rainfed Area: NA
Canal, tank, open wells, bore well and lift irrigation
114 percent
85.3
27 Yavatmal Central Vidarbha Zone
1352 Alluvium Deccan Trap Basalt
The major soil types are: Deep black soil 469.4 Medium Deep black soil 176.1 Shallow black soil 706.4
886.4 mm Net Sown area 884 Area sown more than once 15 Gross cropped area 899
Net Irrigated area: 35.4 Gross Irrigated area: 39
Rainfed Area: 839.3 Canal and open well
irrigation
102 percent
243
28 Wardha Central Vidarbha Zone
629 Alluvium Deccan Trap Basalt
The major soil types are: Deep black soil 245.1 Medium deep black soil 102.9 Shallow black soil 280.9
886.4 mm Net Sown area 284 Area sown more than once 158 Gross cropped area 442
Net Irrigated area: 31.58 Gross Irrigated area:
41.81 Rainfed Area: 399.71
Canal, tank, open, bore well, lift and micro
irrigation
156 percent
77
29 Nagpur Eastern Vidarbha Zone Central Vidarbha Zone
986 Alluvium Basalt Lameta Bed Gondwana Crystalline Rock
The major soil types are: Deep black soil 427.9
Medium deep black soil 136.4 Shallow black soil 421.5
1082.1 mm
Net Sown area 499 Area sown more than once 116 Gross cropped area 615
Net Irrigated area: 134 Gross Irrigated area:
228.9 Rainfed Area: 499
Canal, open wells, Drip and sprinkler irrigation
123 percent
159
30 Bhandara Eastern Vidarbha Zone
342 Rich alluvial soil, clayey loamy texture
The major soil types are: Deep mixed red and black soil 298.8 Shallow mixed red and black soil 45
1361.3mm
Net Sown area 178 Area sown more than once 64.9 Gross cropped area 243.2
Net Irrigated area: 107 Gross Irrigated area: 139 Canal, open well and lift
irrigation
136 percent
62

253
253
S. No.
District Agro Climatic Zone
Geographical Area
Geology Soil Type Rainfall Agricultural Land-use
Irrigation Cropping Intensity
Forest Cover
Medium deep mixed red and black soil 27.1
31 Chandrapur Central Vidarbha Zone Eastern Vidarbha Zone
1092 Alluvium Basalt Gondwana Vindhyan Crystalline
The major soil types are: Deep black soil 618.5 Shallow black soil 278.7
Medium deep black soil 114.7
1337.0 mm
Net Sown area 451.5 Area sown more than once 80.6 Gross cropped area 532.1
Net Irrigated area: 107 Gross Irrigated area: 118
Rainfed Area: 344.5 Canal and open well
irrigation
118 percent
388.2
32 Gadchiroli Eastern Vidarbha Zone
1492 Alluvium Soil and laterite
The major soil types are: Deep Black soil 1079.1 Medium deep black soil 302.2 Shallow black soil 110.6
1428.5 mm
Net Sown area 148 Area sown more than once 49 Gross cropped area 197
Net Irrigated area: 56.3 Gross Irrigated area: 60.7
Rainfed Area: 135.9 Canal, tank, open well,
borewell and lift irrigation
133 percent
1133
33 Gondia Eastern Vidarbha zone
586 Alluvium and Laterite
The major soil type is: Deep black soil 462.3 Medium Deep black soil 46.5 Shallow black soil 77.1
1377.9 mm
Net Sown area 182.9 Area sown more than once 46.5 Gross cropped area 229.4
Net Irrigated area: 98.6 Gross Irrigated area:
110.8 Rainfed Area: 84.3
Canal and Open wells
125 percent
215
Source: Department of Agriculture Cooperation and Farmers Welfare

254
F.5 Biodiversity and Forest Cover
Maharashtra’s forest lies on the borders of Madhya Pradesh state as well as the Sahyadri region too.
Some of these areas are converted into wildlife reserves thus preserving the biodiversity. The state has
61,358 sq. km (6,135.8 thousand Ha) under forest cover which is 19.94 percent to the total geographical
area of the state33. Out of this 10.79 percent is in Vidarbha region, 8.21 percent in western Maharashtra
region and remaining 0.94 percent in Marathwada region.
Out of the 307.71 lakh Ha of total geographical area, very dense forest cover is available in 8.7 Lakh Ha,
moderate dense forest cover is available in 20.75 Lakh Ha and open forest is available in 21.17 lakh Ha
as per India State of Forest report 2015.
District-wise forest distribution statistics indicate that Latur has the least area under forest cover and
Gadchiroli has the largest forest cover.
Maharashtra has 6 National Parks and 35 Wildlife Sanctuaries covering an area of 15,526 sq. km (1552.6
thousand Ha) which constitute 5.04 percent of the state’s geographic area. Some of the most visited
national parks include Chaprala Wildlife Sanctuary, Tipeshwer, Tadoba National Park, Navegaon National
ParkTipeshwer, Chikhaldhara, Dajipur, Bharmragarh Wild Life Sanctuary, Bor Wildlife Sanctuary. The
national parks of Maharashtra are full of variety of plant species that include Jamun, Palas, Shisam, Kate
sawar, Neem, Teak, Dhawada, Kalam, Saja/Ain, Bija, Shirish, Mango, Acacia, Awala, Kadamba, Moha,
Acacia, Terminalia, Hedu, Ficus.
Maharashtra has a migratory species and many more exclusive wildlife species of the various national
parks giant Indian squirrel, tiger, spotted deer, sambhar, Blackbuck, wild dog, butterflies, python,
barking deer, flying fox, Rhesus macaque, crocodile, wolves, Indian antelope, neelgai, hyena, fishes,
Bonnet Macaque, Black napped hare, etc.
The map showing forest cover of Maharashtra is as indicated in Figure below.
33 A statistic Outline current salient forest statistics 2013, Forest Department, Government of Maharashtra
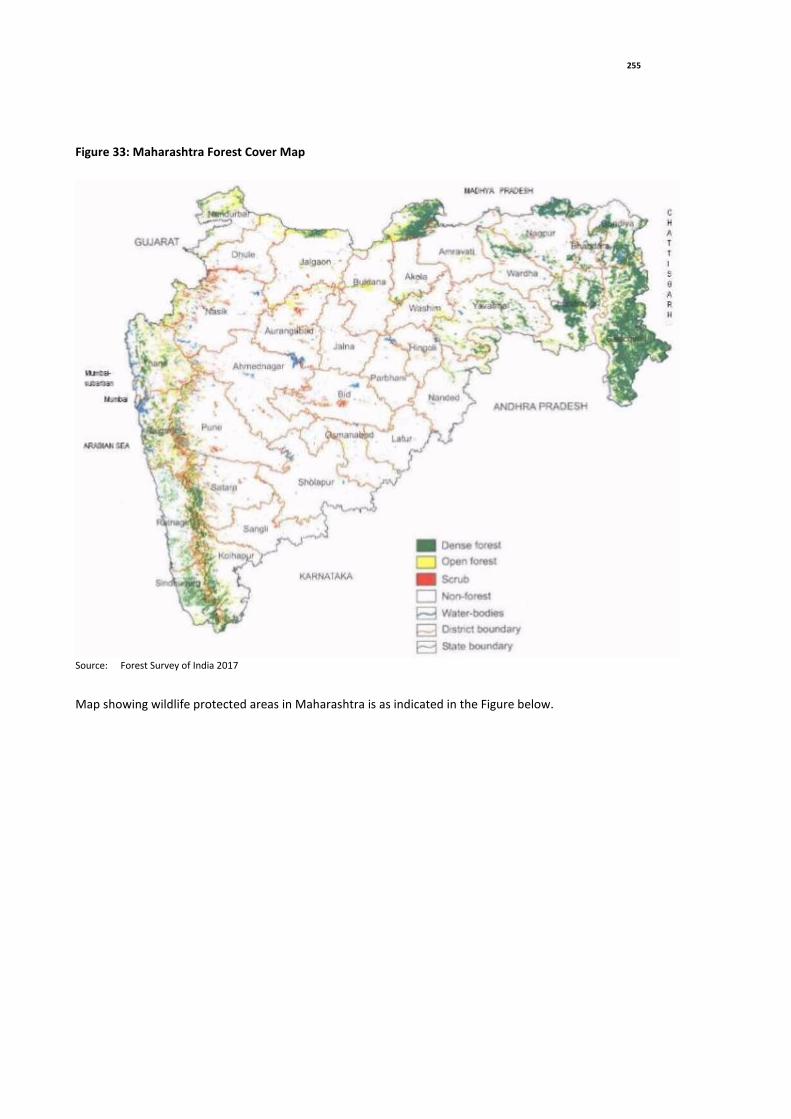
255
Figure 33: Maharashtra Forest Cover Map
Source: Forest Survey of India 2017
Map showing wildlife protected areas in Maharashtra is as indicated in the Figure below.

256
Figure 34: Map Showing Ecologically Hotspots in Maharashtra
Source: Department of Forest, Government of Maharashtra
District wise forest cover is as indicated in Table 83.
F.6 Wetlands
As per the Ramsar Convention on Wetlands 1971, wetlands are area of marsh, fen, peatland or water,
whether natural or artificial, permanent or temporary with water that is static or flowing fresh, brackish
or salt, including area of marine water the depth of which at low tide does not exceed 6 m.
Wetlands, marshes play a major role in treating and detoxifying wastes. Natural wetlands such as
riparian wetland reduces nutrient load by removing nitrate and phosphorous from surface and
subsurface runoff. Some wetland has been found to reduce nitrate by more than 80 percent. Wetlands
play an important role in flood control. Wetlands help lessen the impacts of flooding by absorbing water
and reducing the speed at which flood water flows. During periods of flooding, they trap suspended
solids and nutrient load. They are a natural capital substitute for conventional flood control investments
such as dykes, dams, and embankments.
Wetland area in Maharashtra is estimated to be 1,014,522 Ha which accounts to 3.30 percent of the
total geographical area of the state34. The district with largest wetlands area is Mumbai suburban (24.87
percent) and Mumbai Urban (11.06 percent) of their total area due to the coastal wetlands. Pune district
34 Jay Samant, Wetland Conservation in Maharashtra Need Threat and Potential, Proceedings of International Conference SWRDM 2012

257
has the largest inland wetlands (6.72 percent) in the state, mainly because of the number of large dams
in the Western Ghats part of the district. Out of the total 1,014,522 Ha of wetland 36.29 percent of
wetland are reservoir / barrages, 20.57 percent are tanks / ponds, 29.54 percent are rivers or stream,
creeks constitute 4.10 percent and mangroves constitute 2.98 percent.
India has 27 sites listed as Ramsar sites or notified wetlands as on February 2019. However, the list does
not include any wetland from Maharashtra. An additional list of 135 wetlands have been identified as
potential Ramsar Sites based on their biodiversity value and includes 3 sites from Maharashtra.
As part of National Wetland Inventory and Assessment (NWIA) project Maharashtra Remote Sensing
Application Centre (MRSAC) has been referred for the basic data on wetlands in Maharashtra. Below is
the map showing wetland in Maharashtra by MRSAC.
Figure 35: Maharashtra Wetland As per MRSAC Data
Source: National Wetland Atlas: Maharashtra by MRSAC

258
F.7 Crop wise Pest
Table 84: Crop-wise Pest
Crop Pests
Jowar ● Insects such as Shoot flay, Stem borer, Midge, White grub, Armyworm, Pyrilla, Shoot bug, Earhead caterpillars, Sugar cane aphid, Spider mite.
● Diseases such as Grain mold, Charcoal rot, Downy mildew, Ergot, read leaf spot, Rust.
● Weeds in Broad leaf such as Cock’scomb, Common purselane, False amarnath, Horse purslane, Pigweed, Swinecress, Black nightshade, Sessilis joywood, Punarnava, Tropical spiderwort, Whitetop weed, Bullhead, Coat button.
● Grasses such as Rabbit/crow foot grass, Goose grass, Barnyard grass, Crabgrass, Burmuda grass, Johnson grass, Gamba grass, Finger grass.
● Sedges such as Purple nutsedge, Flat sedge.
● Parasitic such as Witch weed
● Nematodes such as Lesion nematode, Cyst nematode.
Wheat ● Insect and mite such as Termite, Wheat aphid, Army worm / cut worm, American pod borer, Pink stem borer, shootfly, brown mite.
● Disease such as Brown rust, Yellow/Strip rust, Black rust, Loose Smut, Karnal bunt, powdery mildew, Helminthosporium, leaf spot / leaf blotch, Foot rot, Alternaria leaf blight, Flag smut, Hill bunt, Head Scab
● Nematodes such as Seed gall nematode, Cereal cyst nematode, Root knot nematode.
● Weeds such as Lambs quarter, scarlet pimpernel, sweet clover, Fine leaf fumitory Corn spurry, Field bindweed, onion weed, swine cress, Jangali Palak, Yellow pea, Thistle weed
● Grasses such as Wild oat, Canary grass, Blue grass, Rye grass, Purple nut sedge
● Rodents pest such as Lesser bandicoot, Black rat, Field mouse, Soft furred field rat, Indian Gerbil.
Rice ● Insect such as Yellow stem borer, brown plant hopper, Leaf folder, Gundhi bug, Gall midge, blue beetle.
● Diseases such as Rice blast, Bacterial Leaf blight, Sheath blight, false smut, brown spot.
● Nematodes such as Root knot nematode and white tip nematode.
● Weeds such as Echinochloa crusgalli, Cyperus rotundus, weedy rice.
● Rodents Smaller bandicoot, Soft furred field rat, Indian gerbil, Field mice.
Other Millets ● Insects such as Cut worm, White grub, Shoot fly, Stem borer.
● Disease such as Downy mildew, Rust, Blast.
● Weeds such as Cock’s comb, Common purselane, False amaranth, Horsepurslane, Pig weed, Swine cress Black night shade.
● Grasses such as Rabbit / crow foot grass, Goose grass, Barnyard grass, crabgrass, Burmuda grass, Purple nutsedge, Flat sledge, Witch weed.
● Rodents and birds.
Maize ● Insect such as Maize stem borer, Pink stem borer, Shoot fly.
● Disease such as Turcicum leaf blight, Maydis leaf blight, Fusarium stalk rot, Charcoal rot, banded leaf and sheath blight, common rust.
● Nematode such as cyst nematod.
● Weeds such as Dactyloctenium aegyptium, Eleusine indica, Celosia argentea, Portulaca Oleracea, Digera arvensis, Euphorbia.
● Rodents and parrots.
Red Gram ● Insects such as Pod borer, Pod fly, Leaf Webber, Spotted pod borer, Plume moth, Pulse beetle.
● Disease such as Wilt, Pigeon pea sterility mosaic, stem blight, Dry root rot.
● Weeds such as Horse purslane, Tick weed, Coat button, Pig weed, False amaranth, Black nightshade, Common purselane.
● Grasses such as Crab grass, Yellow foxtail, Goose grass, Bermuda grass, rabbit / crow foot grass
● Sedges such as Purple nutsedge, Flat sedge.
● Nematodes such as Pigeon pea cyst nematodes and Reniform nematodes.
Green Gram ● Insects such as Pod borer, Spotted pod borer, Spiny pod borer, Blue butterfly, Grass blue butterfly, Bihar hairy caterpillar, Stem fly, Pod weevil, Bean aphid, Leaf hopper, Pod fly, Lablab bug, White fly, Thrips, Blister beetle.
● Nematodes such as Cyst nematodes, Root Knot nematode.
● Diseases such as Anthracnose, Bacterial leaf blight, Cercospora leaf spot, Powdery mildew, Root rot and leaf blight, Rust, Macrophomina blight, Yellow mosaic disease and Leaf crinkle disease. Black Gram

259
Crop Pests
Gram ● Weeds such as Pig weed, False amaranth, Horse purslane, Tick weed, Stonebreaker, Common lambs’ quarter, Burclover, Canada Thistle, Field bindweed, Three flowered ticker foil.
● Grass such as Goose grass, Rabbit/ crow foot grass, Barnyard grass.
● Sledge such as Flat sedge.
Cotton ● Insects such as Leaf hopper, White fly, Thrips, Aphids, Mirids, Mealy bugs, Tobacco caterpillar, Pink boll worm, Spotted and spiny boll worm, Helicoverpa boll worm, Leaf roller, Red Cotton Bug, Dusky cotton bug, Semi-looper, Stem weevil, Shoot weevil.
● Diseases such as Blackarm / Angular leaf spot / Bacterial blight, Alternaria Leaf spot, Myrothecium leaf spot, Root rot, Fusarium wilt, Cotton leaf curl virus, Grey Mildew, Verticillium wilt, Leaf rust.
● Monocot Weeds such as Doob grass, Barnyard grass, Makra, Signal grass, Terpedo grass, Nut grass.
● Dicot weeds such as Datura, Wild Jute, Cox comb, Carpet weed, Purselane, Coat Buttons, Hiran Khuri, Velvet leaf, Kanghi buti, Spurge, Carrot grass and silk leaf.
● Nematodes such as Root knot Nematodes and Reniform Nematodes.
Soybean ● Insects such as stem fly, Tobacco caterpillar, Green Semi loopers, Girdle beetle, Pod borer, White fly, Leaf miller.
● Diseases such as Rust, Soybean mosaic, Collar rot, Charcoal rot, Rhizoctonia root rot, Bacterial pustule, Myrothecium leaf spot, Indian Bug Blight, Purple seed stain, Brown spot, No-podding /Phyllody /Bud proliferation.
● Weeds such as Amaranthus viridis, Cyperus iria, Trianthema Portulacastrum, Euphorbia geniculate, Dactyloctenium aegyptium, Echinochloa Spp, Eleusine indica, Setaria glauca.
Mango ● Insects such as mango hopper, Mango Maely bug, Fruit fly, Inflorescence midge, stem borer, Bark eating caterpillar, Stone weevil, Red ant, Eriophyid mite, Termite
● Disease such as Powdery mildew, Anthracnose, Die back, Sooty mould, mango malformation complex, Gummosis,
● Post-harvest disease such as Anthracnose, Aspergillus rot, Stem end rot
● Weeds such as Amaranthus viridis, Common purselane, false amaranth, carrot grass, Goat weed, Cotton buttons, Spanish needles, silk leaf, Madras Leaf flower, Dendrophthae, Bermuda grass, Barnyard grass
Cashew nut ● Insects such as Mosquito bug, Stem and root borer, leaf miner, leaf and blossom webber, flower thrip, Foliage thrips
● Disease such as Dieback or pink disease, damping off, Anthracnose, inflorescence blight, Shoot rot and leaf fall
● Weeds such as Pig weed, Common purselane, false amaranth, Carrot grass, Goat weed, Coat button, Bermuda grass, Barnyard grass
● Sledges such as purple sledge and flat sledge.
Grapes ● Insects such as Mealybugs, Flea Beetle, Girdle beetle/grape cane girdler, Thrips, Hoppers, Stem borer, Leaf eating caterpillar, Greap leaf folder, Red mite.
● Dieses such as Downy mildew, Powdery mildew, Anthracnose, Greenaria bitter rot, bacterial leaf spot, Alternaria blight, Black rot, Post.
● Harvesting diseases such as Blue mould rot, Black mould rot, Green mould, Rhizopus, botrytis bunch rot or gray mould of grape.
● Nematode such as Root - knot nematode, Reniform nematode.
● Weeds such as in broad leaf Pigweed, Common purselane, False amaranth, carrot grass, Goat weed, Coat buttons, Spanish needles, Silk leaf, Madras leaf flowers.
In Grass Barnyard grass, Bermuda grass. In sedges – Purple nutsedge, flat sedge.
Pomegranate ● Insects such as Anar butterfly, Stem borer, whitefly, Shot hole borer, Thrips, Fruit borer.
● Diseases such as Bacterial leaf and fruit spot, Leaf and fruit spot, Anthracnose, Wilt.
● Weeds such as in Broadleaf Tropical spiderwort, Swine cress, Horse purslane, Black nightshade, False amaranth, Puncture vine, Field bindweed, Common cocklebur, Asthma herb, Carrot grass.
● In Grasses Bermuda grass, Annual brachiaria, Viper grass.
● In sedges Purple nut sedge, Flat sedge.
Custard Apple ● Insects such as Mealybug, Fruit fly, Scales, Fruit borer.
● Diseases such as Fruit rot & anthracnose, Alternaria leaf spot, Cylindrocladium, Diplodia rot, Black canker.
● Weeds such as in Broadleaf Horse purslane, Black nightshade, False amaranth, Puncture vine, Common cocklebur, Asthma herb/spurge, Carrot grass, Stone breaker, Sensitive plant, Broadleaf woodsorrel, Common purslane, Bermuda grass, annual brachiaria, Viper grass, Dropseed, Purple nut sedge.
● Nematodes such as Spiral nematode, Stunt nematode.
● Vertebrate pests such as lesser bandicoot, House rat/roof rat, Soft furred rat, Indian fruit bat, Pteropus giganteus.

260
Crop Pests
Banana ● Insects such as Banana rhizome weevil, Banana stem weevil, banana leaf eating caterpillar, Banana aphid, Banana leaf and fruit scarring beetle, banana lacewing bug.
● Banana thrips such as Rust thrips, Leaf thrips, Flower thrips.
● Diseases such as Panama wilt, Anthracnose, Tip rot or bacterial soft rot, Banana bunchy top disease, Banana bract mosaic virus, Banana streak disease, Infectious chlorosis.
● Weeds such as in Broad leaf Spiny pigweed, Slender pigweed, Carrot weed, Common purslane, Tridax daisy, Spurge, Knotweed, touch me not weed.
● Grasses such as Bermuda grass, Crab grass, Indian goose grass.
● Sedges such as Purple nut sedge.
Papaya ● Insects such as Mealybug, Grasshopper.
● Diseases such as Stem or foot or collar rot, Papaya ring spot disease, Papaya mosaic disease, Anthracnose, Anthracnose, Rhizopus rot, Fruit rot, Phomopsis, Stem end rot, Papaya leaf curl disease.
● Weeds such as in broadleaf Carrot grass, Coat buttons, yellow spider flower, Asthma herb/Spurge, Cock’s comb, Pigweed, Goat weed.
● Grasses such as large crabgrass, Yellow foxtail, Goose grass, Bermuda grass.
● Sedge such as Purple nutsedge, Flat sedge, Umbrella sedge.
● Birds such as Jungle crow, Myna, Roseinged parakeet.
Sweet Lime
● Insects such as Aphid, Citrus psylla, Citrus leaf miner, Citrus/lemon butterfly, Citrus blackfly, Armoured scale, Mealybug, Fruit sucking moth.
● Diseases such as Gummosis, Fruit rot, Anthracnose, Scab, Sooty mould, Citrus canker, Tristeza, Greening, Blue mould rot, Green mould rot, Sour rot.
● Nematods such as Citrus nematode, Lance nematode, Lesion nematode.
● Weeds in broad leaf weeds such as Tropical spiderwort, Swine cress, Horse purslane, Black nightshade, False amaranth, Puncture vine, Field bindweed, Common cocklebur, Spurge, Carrot grass.
● Grassy weeds such as Bermuda grass, Annual brachiaria Orange
Sapota ● Insects such as Leaf webber, Green scale, Fruit fly, Bud borer, Sapota seed borer, Bud worm, Stem borer, Hairy caterpillar, Leaf miner, Spiralling whitefly, Leaf twisting weevil, Scale.
● Diseases such as Leaf spot, Leaf blight, Sooty mould, Basal rot, Heart rot, Anthracnose.
● Postharvest diseases like Soft rot, Fruit rot.
● Weeds Broadleaf such as Tick weed, Coat buttons, Congress grass, Horse Purslane, Crofton weed, Siam weed, False amaranth, Spurge, Crab grass, Yellow foxtail, Bermuda grass, Torpedo grass, Purple nutsedge, Flat sedge.
Guava ● Insects such as Fruit fly, bark eating caterpillar, Whitefly, Fruit borer complex like Capsule borer, Pomegranate butterfly, Fruit borer.
● Diseases such as Guava wilt, Fruit rots, Stem canker, Fruit canker, Dieback, anthracnose and fruit rot.
● Weeds in broad leaf such as coat buttons, beggar-ticks, silk leaf, Canoe weed, Mohanavallee, Amaranth, False amaranth, Asthma herb, Milk weed, Whitetop weed, horse purslane.
● Grasses such as Bermuda grass, Hairy crabgrass, Egyptian crowfoot grass, Buffalo grass, Cogon grass
● Sedges such as Purple nut sedge, Flat sedge.
Tomato ● Insects such as Gram pod borer, Tobacco caterpillar, Whitefly, Serpentine leaf miner, Thrips, Red spider minte.
● Diseases such as Damping off, Tomato leaf, Early blight, Late blight, bacterial Wilt, Fusarium wilt, Bacterial stem and fruit canker, Tomato mosaic disease, Bacterial fruits and leaf canker, Tomato mosaic disease, Bacterial fruits and leaf spots, Tomato spot wilt diseases, powdery mildew.
● Nematodes such as Root-knot nematode, Reniform nematode.
● Rodents such as Lesser bandicoot, Plam rat/house rat, Indian gerbil.
● Weeds such as in Major Kharif in Broadleaf Pigweed, Swine crees, Black nightshade, Common purselane, False amarnath.
● Grasses such as Rabbit/crow foor grass, Crab grass, Barnyard.
● Sedges such as Purple nutsedge, Flat sedge.
● Weeds in Major Rabi, in broadleaf Lamb’s quarter, Scarlet pimpernel, Sweet clover, Fine leaf fumitory, Corn spurry.
● In grasses such as Blue grass, Canary grass.
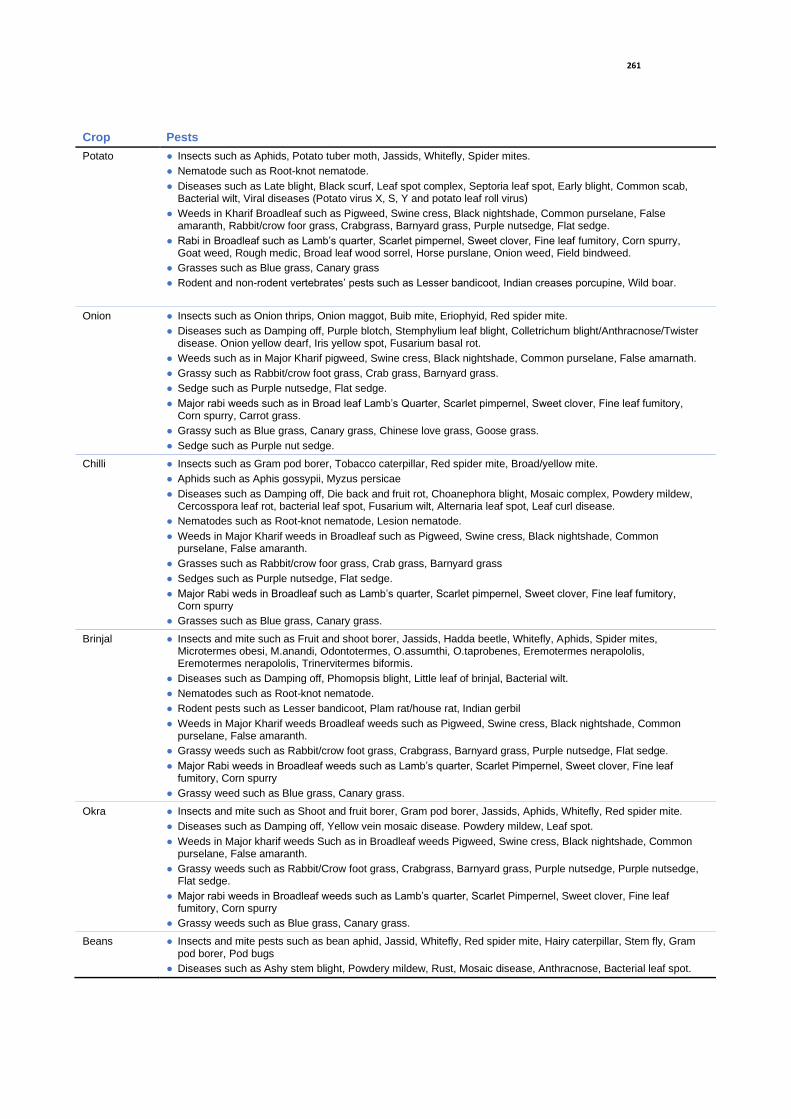
261
Crop Pests
Potato ● Insects such as Aphids, Potato tuber moth, Jassids, Whitefly, Spider mites.
● Nematode such as Root-knot nematode.
● Diseases such as Late blight, Black scurf, Leaf spot complex, Septoria leaf spot, Early blight, Common scab, Bacterial wilt, Viral diseases (Potato virus X, S, Y and potato leaf roll virus)
● Weeds in Kharif Broadleaf such as Pigweed, Swine cress, Black nightshade, Common purselane, False amaranth, Rabbit/crow foor grass, Crabgrass, Barnyard grass, Purple nutsedge, Flat sedge.
● Rabi in Broadleaf such as Lamb’s quarter, Scarlet pimpernel, Sweet clover, Fine leaf fumitory, Corn spurry, Goat weed, Rough medic, Broad leaf wood sorrel, Horse purslane, Onion weed, Field bindweed.
● Grasses such as Blue grass, Canary grass
● Rodent and non-rodent vertebrates’ pests such as Lesser bandicoot, Indian creases porcupine, Wild boar.
Onion ● Insects such as Onion thrips, Onion maggot, Buib mite, Eriophyid, Red spider mite.
● Diseases such as Damping off, Purple blotch, Stemphylium leaf blight, Colletrichum blight/Anthracnose/Twister disease. Onion yellow dearf, Iris yellow spot, Fusarium basal rot.
● Weeds such as in Major Kharif pigweed, Swine cress, Black nightshade, Common purselane, False amarnath.
● Grassy such as Rabbit/crow foot grass, Crab grass, Barnyard grass.
● Sedge such as Purple nutsedge, Flat sedge.
● Major rabi weeds such as in Broad leaf Lamb’s Quarter, Scarlet pimpernel, Sweet clover, Fine leaf fumitory, Corn spurry, Carrot grass.
● Grassy such as Blue grass, Canary grass, Chinese love grass, Goose grass.
● Sedge such as Purple nut sedge.
Chilli ● Insects such as Gram pod borer, Tobacco caterpillar, Red spider mite, Broad/yellow mite.
● Aphids such as Aphis gossypii, Myzus persicae
● Diseases such as Damping off, Die back and fruit rot, Choanephora blight, Mosaic complex, Powdery mildew, Cercosspora leaf rot, bacterial leaf spot, Fusarium wilt, Alternaria leaf spot, Leaf curl disease.
● Nematodes such as Root-knot nematode, Lesion nematode.
● Weeds in Major Kharif weeds in Broadleaf such as Pigweed, Swine cress, Black nightshade, Common purselane, False amaranth.
● Grasses such as Rabbit/crow foor grass, Crab grass, Barnyard grass
● Sedges such as Purple nutsedge, Flat sedge.
● Major Rabi weds in Broadleaf such as Lamb’s quarter, Scarlet pimpernel, Sweet clover, Fine leaf fumitory, Corn spurry
● Grasses such as Blue grass, Canary grass.
Brinjal ● Insects and mite such as Fruit and shoot borer, Jassids, Hadda beetle, Whitefly, Aphids, Spider mites, Microtermes obesi, M.anandi, Odontotermes, O.assumthi, O.taprobenes, Eremotermes nerapololis, Eremotermes nerapololis, Trinervitermes biformis.
● Diseases such as Damping off, Phomopsis blight, Little leaf of brinjal, Bacterial wilt.
● Nematodes such as Root-knot nematode.
● Rodent pests such as Lesser bandicoot, Plam rat/house rat, Indian gerbil
● Weeds in Major Kharif weeds Broadleaf weeds such as Pigweed, Swine cress, Black nightshade, Common purselane, False amaranth.
● Grassy weeds such as Rabbit/crow foot grass, Crabgrass, Barnyard grass, Purple nutsedge, Flat sedge.
● Major Rabi weeds in Broadleaf weeds such as Lamb’s quarter, Scarlet Pimpernel, Sweet clover, Fine leaf fumitory, Corn spurry
● Grassy weed such as Blue grass, Canary grass.
Okra ● Insects and mite such as Shoot and fruit borer, Gram pod borer, Jassids, Aphids, Whitefly, Red spider mite.
● Diseases such as Damping off, Yellow vein mosaic disease. Powdery mildew, Leaf spot.
● Weeds in Major kharif weeds Such as in Broadleaf weeds Pigweed, Swine cress, Black nightshade, Common purselane, False amaranth.
● Grassy weeds such as Rabbit/Crow foot grass, Crabgrass, Barnyard grass, Purple nutsedge, Purple nutsedge, Flat sedge.
● Major rabi weeds in Broadleaf weeds such as Lamb’s quarter, Scarlet Pimpernel, Sweet clover, Fine leaf fumitory, Corn spurry
● Grassy weeds such as Blue grass, Canary grass.
Beans ● Insects and mite pests such as bean aphid, Jassid, Whitefly, Red spider mite, Hairy caterpillar, Stem fly, Gram pod borer, Pod bugs
● Diseases such as Ashy stem blight, Powdery mildew, Rust, Mosaic disease, Anthracnose, Bacterial leaf spot.
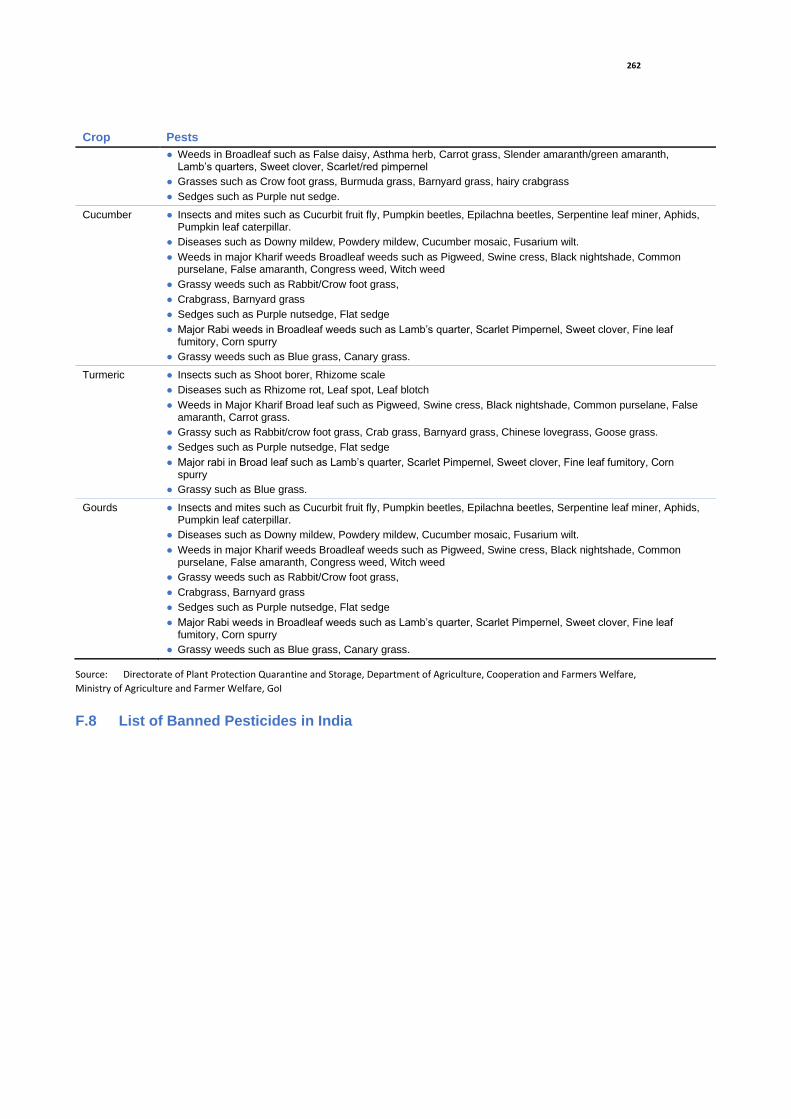
262
Crop Pests
● Weeds in Broadleaf such as False daisy, Asthma herb, Carrot grass, Slender amaranth/green amaranth, Lamb’s quarters, Sweet clover, Scarlet/red pimpernel
● Grasses such as Crow foot grass, Burmuda grass, Barnyard grass, hairy crabgrass
● Sedges such as Purple nut sedge.
Cucumber ● Insects and mites such as Cucurbit fruit fly, Pumpkin beetles, Epilachna beetles, Serpentine leaf miner, Aphids, Pumpkin leaf caterpillar.
● Diseases such as Downy mildew, Powdery mildew, Cucumber mosaic, Fusarium wilt.
● Weeds in major Kharif weeds Broadleaf weeds such as Pigweed, Swine cress, Black nightshade, Common purselane, False amaranth, Congress weed, Witch weed
● Grassy weeds such as Rabbit/Crow foot grass,
● Crabgrass, Barnyard grass
● Sedges such as Purple nutsedge, Flat sedge
● Major Rabi weeds in Broadleaf weeds such as Lamb’s quarter, Scarlet Pimpernel, Sweet clover, Fine leaf fumitory, Corn spurry
● Grassy weeds such as Blue grass, Canary grass.
Turmeric ● Insects such as Shoot borer, Rhizome scale
● Diseases such as Rhizome rot, Leaf spot, Leaf blotch
● Weeds in Major Kharif Broad leaf such as Pigweed, Swine cress, Black nightshade, Common purselane, False amaranth, Carrot grass.
● Grassy such as Rabbit/crow foot grass, Crab grass, Barnyard grass, Chinese lovegrass, Goose grass.
● Sedges such as Purple nutsedge, Flat sedge
● Major rabi in Broad leaf such as Lamb’s quarter, Scarlet Pimpernel, Sweet clover, Fine leaf fumitory, Corn spurry
● Grassy such as Blue grass.
Gourds ● Insects and mites such as Cucurbit fruit fly, Pumpkin beetles, Epilachna beetles, Serpentine leaf miner, Aphids, Pumpkin leaf caterpillar.
● Diseases such as Downy mildew, Powdery mildew, Cucumber mosaic, Fusarium wilt.
● Weeds in major Kharif weeds Broadleaf weeds such as Pigweed, Swine cress, Black nightshade, Common purselane, False amaranth, Congress weed, Witch weed
● Grassy weeds such as Rabbit/Crow foot grass,
● Crabgrass, Barnyard grass
● Sedges such as Purple nutsedge, Flat sedge
● Major Rabi weeds in Broadleaf weeds such as Lamb’s quarter, Scarlet Pimpernel, Sweet clover, Fine leaf fumitory, Corn spurry
● Grassy weeds such as Blue grass, Canary grass.
Source: Directorate of Plant Protection Quarantine and Storage, Department of Agriculture, Cooperation and Farmers Welfare,
Ministry of Agriculture and Farmer Welfare, GoI
F.8 List of Banned Pesticides in India
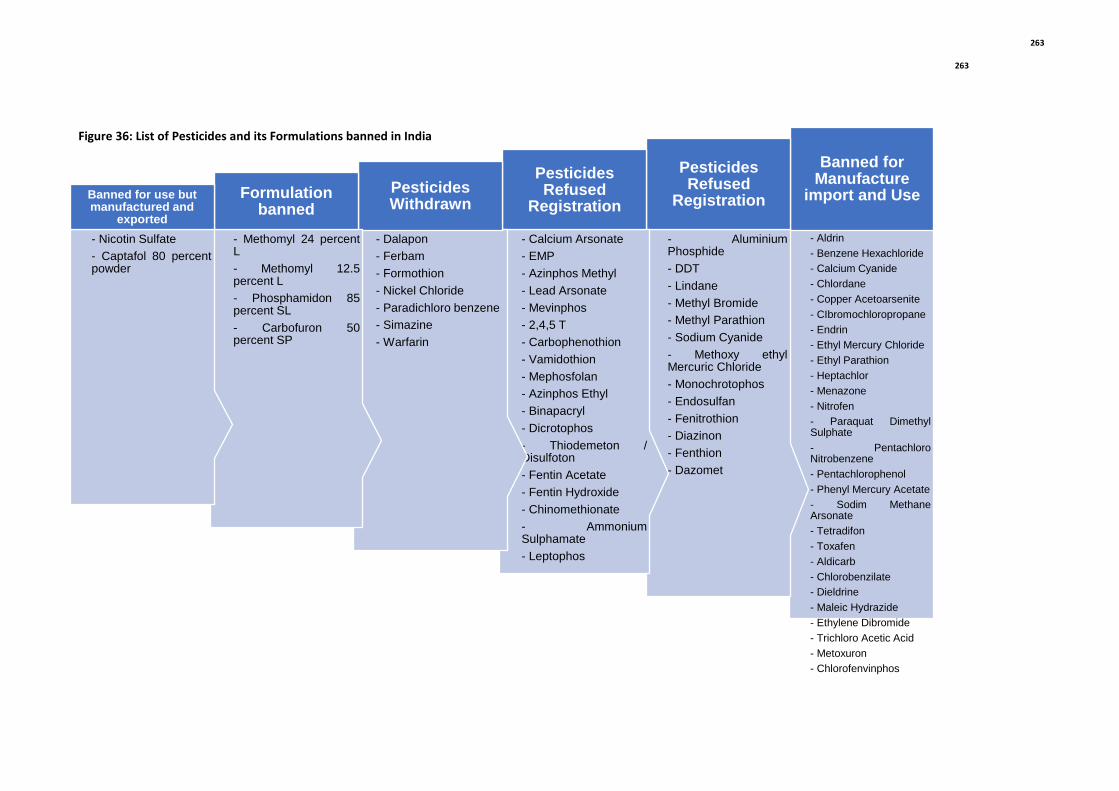
263
263
Figure 36: List of Pesticides and its Formulations banned in India
- Aldrin
- Benzene Hexachloride
- Calcium Cyanide
- Chlordane
- Copper Acetoarsenite
- CIbromochloropropane
- Endrin
- Ethyl Mercury Chloride
- Ethyl Parathion
- Heptachlor
- Menazone
- Nitrofen
- Paraquat DimethylSulphate
- PentachloroNitrobenzene
- Pentachlorophenol
- Phenyl Mercury Acetate
- Sodim MethaneArsonate
- Tetradifon
- Toxafen
- Aldicarb
- Chlorobenzilate
- Dieldrine
- Maleic Hydrazide
- Ethylene Dibromide
- Trichloro Acetic Acid
- Metoxuron
- Chlorofenvinphos
Banned for Manufacture
import and Use
- AluminiumPhosphide
- DDT
- Lindane
- Methyl Bromide
- Methyl Parathion
- Sodium Cyanide
- Methoxy ethylMercuric Chloride
- Monochrotophos
- Endosulfan
- Fenitrothion
- Diazinon
- Fenthion
- Dazomet
Pesticides Refused
Registration
- Calcium Arsonate
- EMP
- Azinphos Methyl
- Lead Arsonate
- Mevinphos
- 2,4,5 T
- Carbophenothion
- Vamidothion
- Mephosfolan
- Azinphos Ethyl
- Binapacryl
- Dicrotophos
- Thiodemeton /Disulfoton
- Fentin Acetate
- Fentin Hydroxide
- Chinomethionate
- AmmoniumSulphamate
- Leptophos
Pesticides Refused
Registration
- Dalapon
- Ferbam
- Formothion
- Nickel Chloride
- Paradichloro benzene
- Simazine
- Warfarin
Pesticides Withdrawn
- Methomyl 24 percentL
- Methomyl 12.5percent L
- Phosphamidon 85percent SL
- Carbofuron 50percent SP
Formulation banned
- Nicotin Sulfate
- Captafol 80 percentpowder
Banned for use but manufactured and
exported

264
F.9 Health and Safety – Food and Beverages
Food safety and quality have been gaining considerable importance at the state, national and international level
since enhanced food safety is key to improvements to health and nutrition. Food safety, besides reducing cost of
food borne diseases, enhances food security, increased trade, expands income generation and thus assists in
poverty alleviation, raise living standard and reduce negative stimulate economic development.
This food safety refers to the agricultural growth of commodities & use of pesticides & insecticides while growing.
It also refers to the practices after harvesting & during transportation & Storage of agricultural goods.
In Maharashtra, food safety has not been taken seriously by farmers or growers & food handlers. Some of the
Challenges faced are:
● Lack of formal Education;
● Lack of awareness towards GAP (Good Agricultural Practices), Food safety practices;
● Lack of sufficient resources to make farmers aware of everything;
● Lack of government laboratories to test all the required parameters;
● Distance of market from the farms;
● Lack of agricultural commodity’s processing, packaging & exporting;
● Lack of government schemes;
● Poor knowledge of personal hygiene;
● A weak policy & regulatory framework;
● Inadequate enforcement of existing standards; and
● Predominance of small farms.
F.10 Good Agriculture Practices
GAP Practices that address environmental, economical & social sustainability for on farm process which results in
safe & quality food & agricultural produce.
Other GAP benefits are –
● Consistent crop & safe food quality,
● Safe environment which leads to other benefits,
● Soil quality improvement,
● Facilitation domestic & export market access and
● Reduction in noncompliance risks i.e. Permitted pesticides, MRL’s & other hazards.
There are few challenges to adopt GAP in Maharashtra’s agricultural sector
● Lack of general awareness, education & benefits of implementing GAP,
● Small & divided farming land,
● Same crop over years,
● Not many farmer’s association,
● Lack of awareness & training about GAP & its benefits,

265
● Increase in production cost which includes trained personnel, record keeping, residue testing, soil & water
testing, organic manure etc,
● Inadequate access to support system,
● Insufficient infrastructure and
● Inadequate funds.
Recommendations to Adopt GAP in Maharashtra –
● Small group of trainers needs to be identified who can train the farmers in different regions for different crops;
● Capacity building of farmers & their families through awareness camps & training programmes at district level;
● Capacity improvement of existing setup of government testing laboratories;
● Make funds available from government banks at lower interest rates; and
● Government can open farmer’s school where they can come & learn Good practices through practical trainings.
Needs to setup few cold storages, common facility centres, primary processing & packaging facilities at district
level.
F.11 Commodity Wise MRL
Food Safety and Standard Act 2006 regulates manufacturing storage distribution sale and import of food which
includes GM food.
Commodity wise Maximum Residue Level as per Food Safety Standard (contamination toxins and residue)
Regulation 2011 is as indicated in Annexure C.
F.12 Cartagena Protocol on Biosafety
India is signatory to the Cartagena Protocol on biosafety and ratified it on January 23rd, 2003. As per article 20 of
the Cartagena protocol a Bio Safety Clearing house has been set-up in order to facilitate the exchange of scientific,
technical, environmental and legal information on Living Modified Organism (LMO).
Pursuant to section 6, 8 and 25 of Environmental Protection Act 1986 and with the view to protecting the
Environment, nature and health in connection with application of gene technology and microorganism, India has
ratified the rule for Manufacture / Use / Import / Export and storage of Hazardous Microorganism or Genetically
Engineered Organism Rule 1989. As per the regulation, no person shall import export transport manufacture store
or process use or sell any GMO substance or cell except with approval of GEAC. Regulatory committee is set-up in
each district where research and application of GMOs are contemplated.
As per the regulations in India, there are procedures for import / export of GE planting material for research
purpose, quarantine processing of transgenic planting material and procedure for approval of confined field trials
and environmental release of GE plants.
As per the mandate, Ministry of Agriculture must draft policies aimed at agriculture growth, Indian Council of
Agriculture Research (ICAR) is responsible for monitoring the benefit of Genetically modified technology and
monitoring post release performance of GM crops.
Ministry of Agriculture has formulated National Seeds Policy 2002. As per the policy transgenic crops varieties are
tested to determine the agronomic value for at least two seasons by ICAR before any variety is commercially
release in the market. Performance of the commercially released varieties are monitored for at least 3 to 5 years
by the Ministry of Agriculture and State Department of Agriculture. All seed imported into the country are required

266
to be accompanied by a certificate from the Competent Authority of the exporting country regarding transgenic
character or otherwise.
The Project shall comply with the regulations ratified in India with respect to Cartagena Protocol applicable to
agricultural sector.
F.13 Sheep and Goat Rearing Practices
Sheep and goat rearing are traditional occupation of economically weaker sections of society, particularly in rain
shadow areas. These two species have been a major source of economic sustenance and financial cushioning,
especially for economically weaker section of society. In India 83.4 percent of goat rearers belong to landless, small
and marginal farmers category and 84.4 percent belong to SC / ST and OBC communities. Goat rearing is dominant
in ecologically vulnerable and drought prone areas.
Goat breeds of Maharashtra are Osmanabadi goat, Sangamneri goat, Surti and Konkan Kanyal. The breeds of sheep
reared in Maharashtra are Deccani sheep and Mandgyal sheep. In Maharashtra. As per 2012 livestock census, the
state has 25.80 lakh sheep and 84.35 lakh Goat.
Estimated meat production from sheep and goat different sources in Maharashtra during summer 2016-17 are as
follows:
Table 85: Estimated Meat Production from sheep and Goat Annual 2016-17
S. No Species Estimated no of Animals Slaughtered
(Lakhs)
Average Meat Production / animal
(kg)
Total meat production (000’ M.T)
From Registered Slaughter Houses
1 Sheep 3.761 12.749 4.798
2 Goat 6.593 12.261 8.064
From House Hold and Butcher Shop (Rural)
1 Sheep 6.082 12.223 7.434
2 Goat 42.681 11.392 48.601
From House Hold and Butcher Shop (Urban)
1 Sheep 2.177 12.58 2.739
2 Goat 37.716 12.201 45.834
Source: Government of Maharashtra, Department of Animal Husbandry, Integrated Sample Survey Scheme 2016-17
Maharashtra ranks 2nd in terms of meat production and 7th in terms of wool production among major livestock
production state in India.
F.14 Climate Change Impacts on Crops
Agriculture is the sector most vulnerable to climate change due to its high dependence on climate and weather.
The Maharashtra agricultural sector is already facing problems due to climate change and occurrence and intensity
of draught have increased over the years in Maharashtra. These concerns have grown in recent years as altered
rainfall patterns associated with climate change have become more frequent, increasing the likelihood of short-run
crop failures and long-run production declines. Small, Marginal farmers and agricultural laborers, who are poor
and have few assets and limited access to credit and insurance, are the worst affected.
The worst affected districts in Maharashtra are Sholapur, Osmanabad, Nanded, Aurangabad, Ahmednagar, Sangli,
Satara, Beed, Nashik, Buldhana, Latur, Jalna, Jalgaon and Dhule.

267
Agriculture in Maharashtra is mainly dependent on rainfall, presently irrigated area in the state is just 17 percent
which is expected to increase to 23 percent. This means more than 75 percent area will remain dependent on
rainfall. Water requirement for most of the crop shown in state is less than 1200 mm and hence rainfall is
sufficient to raise the crops if one or two protective irrigation is provided.
The trends of rainfall in different regions of Maharashtra indicate that it is declining in Konkan slightly and in
Madhya Maharashtra sharply during monsoon season and increasing in post monsoon season. Thus, annual rainfall
is not affected much. But, kharif crops productivity is affected adversely. Increasing trend in post monsoon season
in whole Maharashtra increases black mould in sorghum and favours incidence of Heliothis spp. in cotton and red
gram.
Drought affected tahsils of Maharashtra State are as presented in Figure below.
Figure 37: Drought Affected Tahsils of Maharashtra
Source: State Disaster Management Authority Mantralaya, Mumbai, April 2016, Disaster Management Unit, Relief and Rehabilitation
Department, Government of Maharashtra
History of disaster in the state of Maharashtra are as indicated in the table below.

268
Table 86: History of Natural Disaster in Maharashtra
Natural Disaster History Vulnerable Area
Flood 33 districts in 2005 and 31 districts in 2006
All districts of the state
Cyclones 1882 Bombay Six coastal districts including Mumbai
Hail Storm Occasional Some parts of the state specially Marathwada and Vidarbha
Extreme heavy rainfall sometimes resulting in cloud burst
26th July 2005 Mumbai
2006 Chiplun & Mahad
2007 Amravati &Chiplun
Especially Konkan area
Heat waves Vidarbha region and Nashik region Marathwada, Vidarbha and Nashik division.
Drought 2001, 2002, 2003, 2004, 2008, 2011, 2012, 2013
Drought Prone districts especially Marathwada, and parts of Vidarbha
Sea erosion Konkan, 720 km of coast Konkan division districts
Earthquake 1967 Koyna earthquake
1993 Latur earthquake
High risk: Ratnagiri, Raigad, Satara, Thane and Latur.
Landslide and Mud flow 2005 Mumbai, Mahad
2006 Ratnagiri
High risk Ratnagiri, Raigad, Satara, Thane, Nashik, Mumbai and Sindhudurg.
Dam failures / Dam burst 1961 Panshet 106 major dams across state may be a secondary disaster
Source: State Disaster Management Authority Mantralaya, Mumbai, April 2016, Disaster Management Unit, Relief and Rehabilitation Department, Government of Maharashtra
Earthquake zones in Maharashtra is as presented in the Figure below.

269
Figure 38: Earthquake Zones in Maharashtra
Source: State Disaster Management Authority Mantralaya, Mumbai, April 2016, Disaster Management Unit, Relief and Rehabilitation
Department, Government of Maharashtra
F.14.1 National Mission on Sustainable Agriculture
Ministry of Agriculture and Farmers Welfare, Government of India has formulated National Mission on Sustainable
Agriculture (NMSA) for enhancing agricultural productivity especially in rainfed areas focusing on integrated farming,
water use efficiency, soil health management and synergizing resource conservation. NMSA derives its mandate
from Sustainable Agriculture Mission which is one of the eight Missions outlined under National Action Plan on
Climate Change (NAPCC).
NMSA will cater to key dimensions of ‘Water use efficiency’, ‘Nutrient Management’ and ‘Livelihood diversification’
through adoption of sustainable development pathway by progressively shifting to environmentally friendly
technologies, adoption of energy efficient equipment, conservation of natural resources, integrated farming, etc.
Besides, NMSA aims at promoting location specific improved agronomic practices through soil health management,
enhanced water use efficiency, judicious use of chemicals, crop diversification, progressive adoption of crop-
livestock farming systems and integrated approaches like crop-sericulture, agro-forestry, fish farming, etc
The Components of NMSA are:
● Rainfed Area Development,
270
● Sub-mission on Agroforestry,
● National Bamboo Mission,
● Soil Health Management and
● Climate Change and Sustainable Agriculture – Monitoring Modelling and Networking.
Under the climate change and sustainable agriculture component of NMSA, a consortium approach has been evolved
with various stake holders including knowledge partners like State Agricultural Universities (SAUs), Krishi Vigyan
Kendras (KVKs), Indian Council of Agricultural Research (ICAR) Institutes etc. by the State Government to provide
single window service/knowledge provider system for the benefit of farming community. Financial support may be
provided through States to institutionalize the concept and meeting supplementary developmental activities.
F.14.2 Project on Climate Resilient Agriculture
Maharashtra government with financial assistance from World Bank has implemented Project on Climate Resilient
Agriculture (POCRA) to address the drought related vulnerability in the agriculture sector. The objective is to enhance
climate resilience and profitability of smallholder farming system in selected districts of Maharashtra. PoCRA plans
to intervene in about 5,142 villages which include drought affected villages in Marathwada region (3,088) and in
Vidarbha region (1,122) and 932 salinity affected villages in Purna river basin.
The components of POCRA are:
● Promoting Climate-resilient Agriculture System,
● Post-harvest management and value chain promotion,
● Institutional development knowledge and policies and
● Project Management to cover institutional set-up.

271
G. Stakeholder Consultation Details
G.1 Bitter Gourd and Onion
Raigad, 11/04/19
Village: Alibaug
• Bitter gourd is sowed in raining season.
• Inter cropping followed - grown along with other vegetables
such as onion.
• Produce is supplied directly to the consumers.
• Supply to 10 hotels in Alibaug which buy 40 – 50 kgs of
onion
• Transportation is expensive. (Rs 3500/- for Mumbai; Rs.6000
to Pune; Rs 1200-1500 to Alibaug).
• Farmers intend to grow climate resilient varieties but cost is
prohibitive
• Prevailing price of gourd given to farmers is Rs 28/- per kg in
open market
• No fertilizers used as prices are higher and no subsidy
• Pesticide used not disclosed but used at the rate of five litres
per acre and cost of Rs.1200 per litre
• Bitter Gourd Yield is 50-60 tonnes / annum / Ha
Challenges faced by the FPC are:
• Lack of adequate irrigation and hence follow traditional
method of collecting rainwater in ponds.
• Power supply is not adequate.
• Solar equipment is too expensive to use.
• High cost of seeds at Rs.1200-1800 per 250 grams with no
assurance on quality.
• ST farmers not able to avail bank loan due to lack of collateral
and hence borrow from money lenders; government has
given land but it cannot be sold
• Basic infrastructure of packing is also not available.
• Branding & marketing of the product is necessary.
• Grievance redressal system not available. Director of FPC
needs to visit Ministers & ask for funds. Shortage of funds to
expand.
• Cold storage required. Too much heat affects quality of
crop.
Observations
• Dr Hermann Gmeiner Adivasi FPC. Director Name - Mr Anil Pawar.
• Owned by 277 ST farmers (63 farmers own one-two acres of land
and remaining, work on those farms)
•
Stakeholder

272
G.2 Cotton
Yavatmal, 18/04/19
Village: Sarangpur, Ner
• There is no standalone FPC for cotton. This FPC is for
multiple commodities.
• Lack of adequate irrigation system, totally dependent
on rainwater, drip irrigation available only in 10
percent area.
• High Cost of seeds & fertilizers.
• Economical condition of most the farmers is very
poor. Average landholding size per farmer is 5-6 acres.
• Cotton is directly sold to companies & farmers are
paid according to quality & quantity.
• No intercropping practiced in cotton field.
• Farmers can buy seeds, fertilizers and pesticides from
the FPC.
• 30 – 40 percent farmers in the FPC adopt organic
farming.
• Advanced technologies required for farmers such as
cotton plucking automated machines.
• Protective fencing required to stray away wild animals
from entering in to fields.
Fertilizer: DAP & Urea; 50 kg / Ha; price of fertilizer is INR
750 to 1000 per 50 kg bag.
Pesticide: Bio-pesticides used; price is Rs 1500 – 2000 / litre.
Yield of Cotton: 1.4 to 1.5 MT per hectare.
The requirements of FPC are:
➢ High Density Producer Machine,
➢ Storage facility,
➢ Seeds processing related machines,
➢ Transportation facility and
➢ Marketing of product is needed with branding.
Observations
• Name of FPC – Joyous Agrivision FPC
• Name of Interviewer – Sachin Baskar Wankhade
• Total members - 222 shareholders & 400 farmers
Stakeholder

273
G.3 Wheat
G.3.1 Stakeholder - 1
Nagpur, 16/04/19
Village: Kalameshwar
• Lack of adequate irrigational system. Drip irrigation, canal
irrigation and sprinkler irrigation available in some areas.
• Extremely harsh weather condition for agriculture.
• Water required is 7-10 litres per acres.
• FPC processing capacity is 2.5 ton per hour However the
same is not operational since there is not adequate power
supply.
• FPC has grading, cleaning & packing facilities available. User
charge is Rs 50/- per quintal.
• Capacity utilization of processing equipment is 4-5 hrs/day.
• Prevailing price of wheat is Rs 1800-2000 per quintal. Crop
insurance is there for farmers but no return is provided.
• The farmers are economically very poor in the region.
• 40 percent farmers have Kisan Credit Card
• Crop insurance is given to farmers collectively and no
individual insurance given.
Fertilizer: DAP & Urea; 60 -70 kg DAP per acre and 120 kg urea
per acre; price of urea 1800 to 2000 per 40 kg bag.
Pesticide: Neem pesticide used at the rate of 1 litre per acre.
Yield: 5 MT per Ha
Crop residue: used for making compost
The requirements of FPC are:
• Infrastructure needs to be robust,
• Require Storage facility,
• Steady Power supply,
• Technological advance machines and
• Finance to keep the FPC running.
Observations
• Name of FPC – Zero Mile FPC, Linga , Nagpur
• Name of interviewer– Rajnikanth Bhailal Patel
• Total no. of farmers – 449
Stakeholder

274
G.3.2 Stakeholder – 2
Nagpur, 16/04/19
Village: Kalameshwar
• Lack of adequate irrigation facility, Drip irrigation and
canal irrigation available in some areas. Extreme
weather conditions
• The farmers are economically very poor.
• Seeds available at the rate of Rs 50 per kg
• FPC has a storage facility of 1200 sq feet.
• FPC has cleaning, grading, graining facility. User rate
charges is Rs 100 per quintal
• FPC Processing capacity is 2 MT per hour.
• Prevailing price of wheat is Rs 1800 per quintal.
• 60 percent of the farmers have KCC.
• 200 acres of area under wheat cultivation.
Fertilizer: DAP and Urea; 60 kg per acre urea and 50 kg per acre
DAP;
Pesticide: No pesticide used
Yield: 2.5 MT per Ha
Crop residue: Compost
The requirements of FPC are:
• Infrastructure needs to be robust,
• Require Storage facility,
• Steady Power supply,
• Technological advance machines and
• Finance to keep the FPC running.
Observations
• Name of FPC – Shri Krishna FPC , Nagpur
• Name of Interview– Vinod P Gonan
• Total no. of farmers – 377
Stakeholder

275
G.4 Chilli (Green)
Nagpur, 17/04/19
Village: Sitapur
• The SHG helps women farmers to sell their produce with
Tejaswini brand name.
• Intercropping is practices and major crops cultivated are
chilli, wheat and rice.
• Borewell irrigation practiced. Water given on rent to
farmers not having borewell.
• Power supply not available for farming.
• 2015 & 2018 chilli production was affected due to worm
attack.
• 80 percent female do the farming
• Labour cost is very high.
• Income from farming is less.
• Men are migrating from farming to other jobs and hence
farming is mostly done by women.
• No nearby market available and hence women are forced
to sell their produce to traders at a lower price.
• Fertilizers & pesticides are used but names not revealed.
• Training related to fertilizers, insecticides, pesticides
provided through govt agencies.
• Machine automation that are women friendly are required
and training for usage is also required.
Fertilizer: No information available
Pesticides: Neem based pesticides used
Crop residue: Compost in the field
Requirements of the SHG are:
• Transportation facility required,
• Market to sell their produce and
• Additional Training required for new techniques of farming.
Observations
• Tejaswini SHG, Mahim Women SHG, Sitapur, Nagpur
• Interviewee: Manjusa Zanjade
• Members of SHG – 100 women
Stakeholder

276
G.5 Chilli (Red)
Nagpur, 19/04/19
Village: Bhiwapur
• Major source of living is cultivation of chilli & extraction of
chilli powder.
• Lack of adequate irrigation facility. Drip irrigation, canal
irrigation and well irrigation available.
• Weather protection is required. Hailstorm & excessive
raining spoil production.
• Area under chilli cultivation is 300-350 acres. Per farmers
owns about 1-2 acres. Total time required to harvest = 3-4
months.
• On field there is no dryer. It takes 15 days to dry. Loss due
to chilli drying 1/4th of total
• FPC has a storage facility of 4 – 6 quintals. FPC has crushing
and pounding machine. Processing capacity 8 hours per
day.
• Chilli powder is made personally at home & then sold in
market
• Average annual production is 60-70 quintal per acre.
• On field there is no dryer. It takes 15 days to dry . Loss due
to chilli drying 1/4th of total.
• SHG has bank linkage with ICICI
Fertilizer: No fertilizer used
Pesticide: Not used
Organic Farming: 100 percent
Yield: 6 – 7 MT per acre; price is 120 to 150 per kg for dry chilli
Farm residue: Compost in field
Requirements of SHG:
• Marketing and branding and
• Collective processing required, and this intern require
additional land.
Observations
• Name of CBO – Anup Kandap Kendra
• Name of Person – Neelma Suresh Nagaos
• No members
Stakeholder

277
G.6 Rice
Bhandara, 17/04/19
Village: Wakeshwar
• Canal and borewell irrigation adopted. Area has extreme
weather conditions
• 90 percent use crop insurance. 20-25 percent are
beneficiaries of KCC. 25-30 percent have soil health cards.
• Area under cultivation is 400-500 hectare.
• Average land holding is 1-2 acres
• FPC has rice mill and has Storage facility of 1-2 Ton with
processing capacity of 1-2 ton per hr.
• User charge rate is Rs 60 per quintal.
• Average Capacity utilization of processing equipment is 8-10
hrs in season.
• Prevailing price of rice given to farmers is Rs 2000 per
quintal.
• FPC has power supply.
Fertilizer: Suphola & urvashi fertilizer; 100 kg per acre; price Rs
2000.
Pesticides: Malathion pesticide: 1 lt per acre; Price 600 per litre
Organic farming: 20 percent
Crop residue: compost
Requirements of FPC:
Observations
• Name -
• Name of Interviewer- Maruti Prahlad Magkar
• Total No. of farmers = 550
Stakeholder

278
G.7 Turmeric
Nanded, 22/04/19
Village: Sawargaon, Ardhapur
• Irrigation facility available and drip irrigation in 80 – 90
percent.
• Total area of cultivations 500 acres (biggest turmeric belt in
Nanded). Average land holding size is 2-3 acres.
• Market is not available nearby.
• Woods used for boiling the turmeric.
• Drying takes 15 days under the sun
• 100 percent crop insurance
• No KCC and Soil health card
• Farmers do Poultry & dairy farming at their own expense.
• Egg and milk are sold in local market.
• Trader exploitation is high here.
• FPC has 3 – 3.5 MT storage facility.
• User charges rate is Rs 25/kg (rate at which powder is
made).
• Loss after drying is 5-10 percent loss;
Fertilizer: DAP and Urea; 125 kg per acre urea, price Rs 1150 –
1200 50 kg
Pesticide: Microcare insecticide; price Rs 700 to 1000 per litre
Yield: 6 – 7 MT per hectare
Observations
• Name of FPC – Mahalakshmi, SHG
• Name of person – Jyoti Gaikwad
• SHG members = 10-12 women farmers
Stakeholder

279

280
G.8 Soybean
G.8.1 Stakeholder - 1
Ahmednagar, 26/04/19
Village: Puntamba, Rahata
• Irrigation facility available in 80 percent of the area under
FPC and canal irrigation and drip irrigation available.
• Area under cultivation is 560 hectares. Average land holding
size is 2 hectare per farmer.
• Soybean is sold to APMC market. Prevailing price of maize
given to farmers is Rs 2800-3600 per quintal.
• All the farmers have KCC, crop insurance and soil health
card.
• FPC has storage facility. Processing facility capacity is 2 MT
per hour.
• FPC has Gravity separator, Spiral separator, grader, Grinder
• User charges Rs 100 per quintal
• Capacity utilization processing equipment is 180 days
Fertilizer: 50:75:00 NPK; urea rate is Rs 270 per 45 Kg bag; SSP
rate is Rs 370 per 50 kg bag.
Pesticides: Neemark Beavearia and Coragen Hamla; quantity
used are Neemark,- 1 liter /acre, Beavearia -2 lit /acre, and
Coragen-180ml/acre; price Neemark -400Rs/lit, Beavearia-200
Rs/lit and Coragen-560/180ml
Yield: 2.5 T per hectare
Crop residue: burning in pit
Agrochemicals: Ropicanazol, Hexacanazol types of
agrochemicals.
Observations
• Name of FPC – Punyastambh Farmer Producer Company
• Name of person – Kishor Suresh Kadu, Gore Rajdatta Tukaram
• Members of the FPC: 350
•
Stakeholder
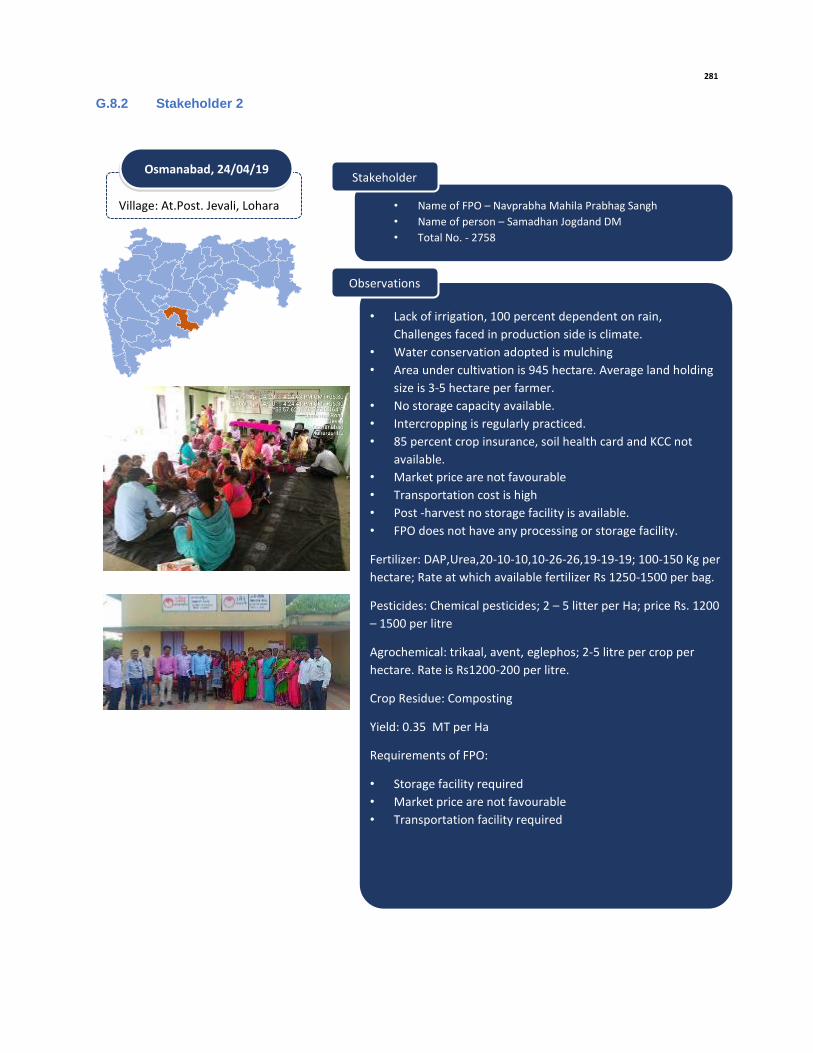
281
G.8.2 Stakeholder 2
Osmanabad, 24/04/19
Village: At.Post. Jevali, Lohara
• Lack of irrigation, 100 percent dependent on rain,
Challenges faced in production side is climate.
• Water conservation adopted is mulching
• Area under cultivation is 945 hectare. Average land holding
size is 3-5 hectare per farmer.
• No storage capacity available.
• Intercropping is regularly practiced.
• 85 percent crop insurance, soil health card and KCC not
available.
• Market price are not favourable
• Transportation cost is high
• Post -harvest no storage facility is available.
• FPO does not have any processing or storage facility.
Fertilizer: DAP,Urea,20-10-10,10-26-26,19-19-19; 100-150 Kg per
hectare; Rate at which available fertilizer Rs 1250-1500 per bag.
Pesticides: Chemical pesticides; 2 – 5 litter per Ha; price Rs. 1200
– 1500 per litre
Agrochemical: trikaal, avent, eglephos; 2-5 litre per crop per
hectare. Rate is Rs1200-200 per litre.
Crop Residue: Composting
Yield: 0.35 MT per Ha
Requirements of FPO:
• Storage facility required
• Market price are not favourable
• Transportation facility required
Observations
• Name of FPO – Navprabha Mahila Prabhag Sangh
• Name of person – Samadhan Jogdand DM
• Total No. - 2758
Stakeholder

282
G.9 Onion
G.9.1 Stakeholder 1
Ahmednagar, 26/04/19
Village: Mehenduri, Akole
• Area under irrigation is 85 percent Water source is
through ridges method.
• Area under cultivation is 260 acres with average land
holding of 1 acre.
• Onions are sold in the APMC market in Mumbai.
• No crop insurance and KCC available with farmers but
they all have soil health cards.
• No use of solar energy. Training regarding use of
insecticides, pesticides are provided by the government.
• FPC has Storage Facility - Godown 56*30 Feet. No
existing processing infrastructure available.
Fertilizer: SSP,10:26:26,18:466, potash; price of SSP is Rs 350 per
bag, 10:26:26 is Rs. 1400 per bag, 18:466 at Rs.1450, potash 5 at
Rs. 900.
Pesticide: Confidor, Actra, Karate; price 3 litres used at rate Rs
400 per litre.
Agrochemicals: M-45, Z-78, Cabrotap. 3 litres used per acre at
rate of Rs 800 per litre Average annual production is 35 tonnes.
Crop Residue: Burned in pits
Requirements of FPC:
• Post harvesting storage facility required
• Processing machineries required.
Observations
• Name of CBO – Agasti Farmers producrer company.ltd.
• Name of person – Mr. Balnath Sonawane
• Total size of FPC – 329
Stakeholder

283
G.9.2 Stakeholder 2
Nashik, 24/04/19
Area: Nifad
● Source of water are canal, well and bore well. ● Onion water requirement is 30 – 45 mm / Ha ● FPC has 300 members ● Average landholding size is 2 acres ● About 65 farmers have tractors ● Compost / farm yard manure requirement is 20 – 25 tones / Ha ● FPC has just storage facility and has no processing facility. ● Seeds are purchased from agri service centre at the rate of Rs 800
– 900 per Kg. ● Farmers require training for usage of pesticides. ● Prevailing price of onion given to farmers is 4 – 7 Rs per Kg.
Fertilizer: N : P: K , Urea, 120:50:50; price at the rate of 1200 per
bag of 50 kg; used at the rate of 5 bags per acre.
Pesticides: Antrocol, M-45, Carate, carbendozin for attack of
Fusarium, leaf blight, Downey. Use of Sticky trap and pheromone
trap is done
Agrochemicals: Acephate on thrips 50 ml/Ha, Cypermethrin 0.11
lts / acre, Downy mildew 6 gm/litre, Metalaxil
Crop residue: used as cattle feed and fuel
Yield: 280 quintal per Ha
Concerns of FPC:
● Price is not favourable ● Market linkage issue
Observations
● Name of FPC: Gautami CMRC Nifad ● Name of Interviewee: Ms Gayabai Prabhakar Barkale
Stakeholder

284
G.9.3 Stakeholder 3
Pune, 23/04/19
Area: Junner
● Source of water for cultivation are surface water ground water and rain water.
● Irrigation type available are drip irrigation 25 percent and canal irrigation 75 percent.
● FPC has 1000 members. ● The FPC has no storage or processing facility. ● Average land holding size is 1 Ha ● Seeds are purchased from local market or nursery. ● Seeds are available at Rs 1000 to 1500 per kg ● Onion varieties cultivated are red onion wing, Vidalia. Red wing
variety is climate resistant. ● Left over pesticide bottles are thrown away or destroyed. ● All farmers have crop insurance and KCC and only 40 percent have
soil health cards. ● Onions are sold in local market or Mumbai market. ● Time required for harvest after planting is 6 months. ● Female generating engage in sowing, weeding and harvesting while
men mainly focus on marketing, pesticide usage and irrigation process.
● Onions are sold at Rs 3000 to 4000 per quintal.
Fertilizer: Urea, 1846, 1026, potash / organic fertilizer; Used at
the rate of 100 kg, 400 kg, 800 kg and 100 kg respectively per Ha;
purchased at the rate of Rs. 320, Rs. 1400, Rs 1300 and Rs 1600
per 50 kg bag.
Pesticides: Antracall, Bavistin and Newon; used at the rate of 5
litre per Ha; purchased at the rate of Rs. 400 to 1500.
Crop residue: prepare Farm Yard Manure (FYM)
Yield: 18 tonnes per Ha
Requirements:
● Cold storage, packaging and grading facility ● Market linkage ● Demonstrate and improved agriculture practices
Observations
● Name of FPC: SHIVNERI LOKSANCHALIT SADHAN KENDRA ● Name of Interviewee: Mrs. Manisha Kale
Stakeholder

285
G.10 Potato
Ratnagiri, 22/04/19
Area: Vefgaon, Khed
● Source of water for cultivation are well and canal. 40 percent drip irrigation and 60 percent canal irrigation
● FPC has 430 members established in Jan 2013 ● The FPC has just storage facility and no processing unit. ● Average land holding size is 2.5 to 5 acres. ● 50 farmers have tractors. ● Seeds are purchased from Punjab, Jalandhar. Varieties of potato
cultivated are 1533, ATL, FC-3 FC-5. ● Seeds are purchased at the rate of Rs 3200 per Kg. ● Left over pesticide bottles are buried or recycled. ● About 230 farmers have kisan credit card, 45 have crop insurance
and only 10 have soil health card. ● 40 women farmers, 10 SC and 4 ST farmers are engaged in potato
farming. ● GRM is available and issues are resolved in 15 days to 1 month ● There were 3 draughts in past 5 years. ● Farmers are trained by KVK, Agriculture Department ● No intercropping is practiced.
Fertilizer: FYM, 10:26:26, DAP, 15:15:0; used at the rate of 11
bags per Ha; purchased at the rate of Rs 1000 per bag.
Pesticides: Profex, Korojan, Hamula, Neuran; used at the rate of
1.5 litre per Ha; purchased at the rate of Rs 800 per litre.
Crop residue: No Response
Organic Farming: None
Yield: 20 Tonnes per Ha
Concerns:
● Fertilizer prize are high and problem in transport ● No storage facility and logistics ● Fixed rate and monopoly in the market.
Observations
● Name of FPC: Satvaji Babu Agro Producer Company ● Name of Interviewee: Mr. Ajay Bhagwat
Stakeholder

286
G.11 Maize
Ahmednagar, 26/04/19
Village: Chincholi, Rahuri
• Area under irrigation is 1400 hectare. Canal irrigation is
40 percent, Drip irrigation is 10 percent and other
methods is 50 percent.
• Area under maize cultivation is 250 hectare. Average
land holding size is 1 hectare per farmer.
• Farmers do contract farming with seed company at Rs.
300 per Kg.
• Prevailing price of maize given to farmers is Rs 1200 per
quintal.
• Soil health cards & KCC used by the farmers. Crop
insurance is not used.
• FPO has Storage Facility - Godown Available. Processing
capacity of 3 tonnes per hour. User rate charges is Rs
100 per quintal. Capacity utilization processing at rate
of 8 hours per day.
• Pesticides used as per recommendations. Proper
training on use of it provided.
• Challenges faced in production side is pest attack.
• Challenges faced in production side is pest attack.
Fertilizer: zinc phosphate, DAP, urea; Price of DAP is 250 per Kg;
Pesticide: Neem oil; price is Rs 650 per litre
Yield: 8 Tonnes per Ha
Crop Residue: Used as compost
Observations
• Name of FPO – Sai Parava FPO
• Name of person – Kadam DC
• Members of FPO – 500
Stakeholder

287
G.12 Jowar
Solapur, 29/04/19
Village: Vairag, Barshi
• Canal irrigation is 10 percent, Drip irrigation is 30
percent and other methods is 60 percent. Water
conservation adopted is mulching.
• Area under cultivation is 6804 hectares. Average land
holding size is 2-3 hectare per farmer.
• Intercropping is practices and crops such as sunflower
and Safallore.
• Seed purchased from local market.
• Crop is sold in APMC and local market.
• Soil health cards & KCC used by very few farmers. Crop
insurance is done by almost all.
• Prevailing price of maize given to farmers is Rs 3000-
3200 per quintal.
Fertilizer: Urea, SSP, FYM; Usage is 100 Kg/ Ha; Rate at which
available Urea -Rs 300 per 45 kg Bag, SSP-350 Rs 50 kg Bag
Pesticides: 125 ml per hectare. rate of pesticide is Rs 500 per
hectare.
Agrochemicals: 125 ml per hectare of agrochemicals used at rate
of Rs 2500-3000 per hectare.
Organic Farming: 60 – 70 percent
Yield: 2.5 to 3 tonnes per Ha
Crop Residue: Composting
Requirements of FPC:
• Storage facility required
• Transportation facility required
• Agronomical service required
Observations
• Name of FPC – Navi Disha FPC, Malwandi
• Name of person – Umesh Revu Jadhav (CC- Malwandi MSRLM)
• Total size of FPC – 2024
•
Stakeholder

288
G.13 Black Gram
Osmanabad, 24/04/19
Village: Javeli, Lohara
• Lack of irrigation facility, 100 percent dependent on
rainwater
• Area under maize cultivation is 765 hectares. Average land
holding size is 3-5 hectare per farmer.
• Average annual production is 400-600 kg per hectare.
• Intercropping with soyabean crop regular.
• Crop insurance is present, but no complaint redressal
system activated in FPC till yet.
• Seeds are purchased from KVK and Local market. 12 – 15 kg
per Ha
• Black Gram is sold in local district market
• Water conservation adopted is mulching.
• Prevailing price of maize given to farmers is Rs 5000-6000
per quintal.
Fertilizer: DAP, SSP, Urea; used at the rate of 80 -100 Kg per acre;
Price is Rs 1500 per bag
Pesticides: Phorate and Zineb; used at the rate of 1 litre per Ha;
Price is Rs 1000-1600 per litre
Yield: 0.4 to 0.6 Tonnes per Ha
Organic Farming: 15 percent
Crop residue: Compost
Requirements of FPC:
• Storage facility required
• Transportation facility required
• Rates are not favourable
Observations
• Name of FPC – Navprabha Mahila Prabhag Sangh
• Name of person – Altaf Jikre
• Members – 219 SHG & 2167 members
Stakeholder

289
G.14 Tomato
G.14.1 Stakeholder 1
Sangli, 20/04/19
Village: Karanjwade, Walwa
• Area under irrigation is 100 percent with 90 percent from drip
irrigation. The source of water is open well, bore well & lift
irrigation.
• Water requirement for tomato cultivation is 4000 - 6000 cu. meter
per hectare or 300 - 400 mm
• Area under tomato cultivation is 150 acres. Average land holding
size is 2-5 hectare per farmer.
• Intercropping is practices with other crops such as Cabbage,
Cauliflower , & Leafy Vegetables
• Nursery purchased from Higtech nursery. Rs. 1 per plant.
• Prevailing price of tomato is Rs 6 per kg.
• Training provided to the farmers. Farmers have problem regarding
pricing of the tomatoes which is fluctuating as per demand &
supply. • FPC has Storage facility available with capacity of 1000 sq ft work
shed.
• Processing facility are vegetable electric dryer - 60 kg per batch,
Vegetable cutter with 40 kg per hour & vegetable slicer with 50kg
per hour is available as processing infrastructure.
Fertilizer: 10.26.; used at the rate of 50 kg per hectare; Price at rate of
Rs 1400 per kg.
Pesticides: Thrips - Confidor a.i.Imedaclopride 23.5 EC , White Fly -
Confidor a.i.Imedaclopride 23.5 EC , Fruit Borer - Emamectin Benzoate
5 percent SG, Red mite - OMITE a.i.Propargite 57 percent EC &
Thiodicarb 75 percent WP.
Agrochemical: Early Blight -Tricyclezone75 percent
Late Bligh -Cymoxanil 8 percent + Mancozeb 65 percent
Powdery Mildew - dinocap 75 percent or NATIVO 75 percent
Downy Mildew - Ridomill Gold a.e. metala xyl 4 percent + Moncozeb 64
Observations
• Name of FPO – Varnamai Agro Producer Co.Ltd
• Name of person – Varnamai Agro Producer Co.Ltd.- Ramrao
Sampat Patil
• Total size of FPC - 500
Stakeholder
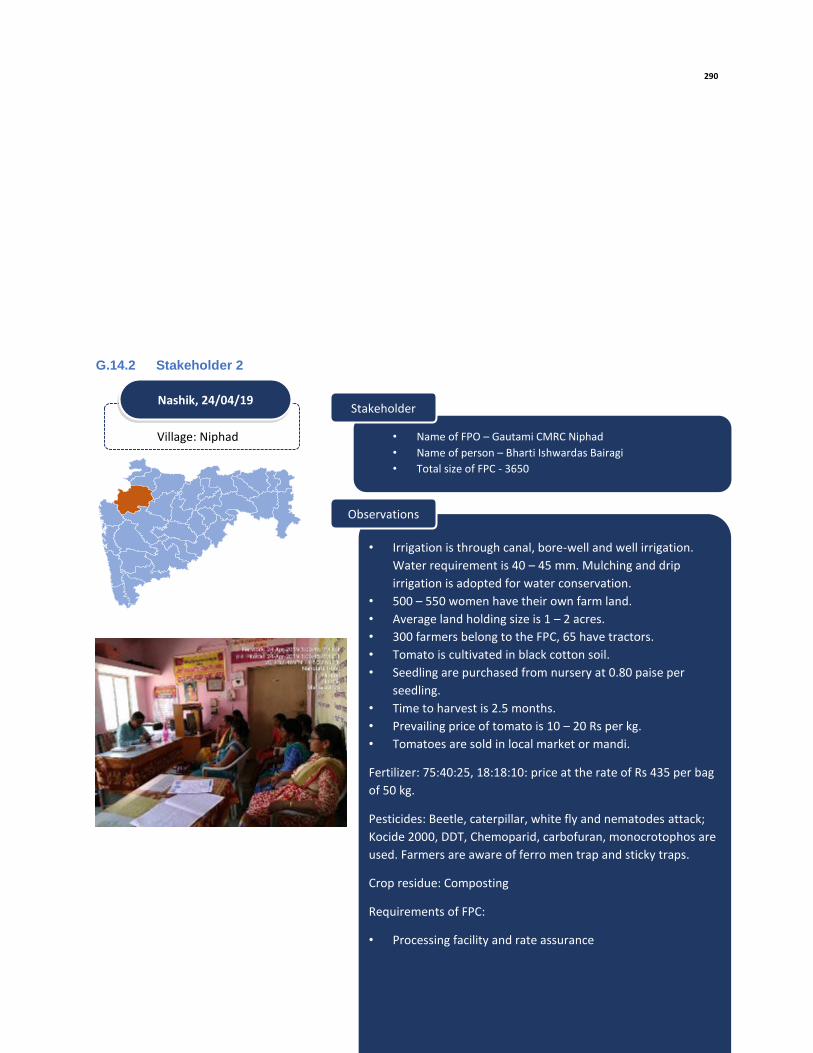
290
G.14.2 Stakeholder 2
Nashik, 24/04/19
Village: Niphad
• Irrigation is through canal, bore-well and well irrigation.
Water requirement is 40 – 45 mm. Mulching and drip
irrigation is adopted for water conservation.
• 500 – 550 women have their own farm land.
• Average land holding size is 1 – 2 acres.
• 300 farmers belong to the FPC, 65 have tractors.
• Tomato is cultivated in black cotton soil.
• Seedling are purchased from nursery at 0.80 paise per
seedling.
• Time to harvest is 2.5 months.
• Prevailing price of tomato is 10 – 20 Rs per kg.
• Tomatoes are sold in local market or mandi.
Fertilizer: 75:40:25, 18:18:10: price at the rate of Rs 435 per bag
of 50 kg.
Pesticides: Beetle, caterpillar, white fly and nematodes attack;
Kocide 2000, DDT, Chemoparid, carbofuran, monocrotophos are
used. Farmers are aware of ferro men trap and sticky traps.
Crop residue: Composting
Requirements of FPC:
• Processing facility and rate assurance
Observations
• Name of FPO – Gautami CMRC Niphad
• Name of person – Bharti Ishwardas Bairagi
• Total size of FPC - 3650
Stakeholder

291
G.15 Brinjal
Sangli, 20/04/19
Village: Karanjwade, Walwa
• Area under irrigation is 100 percent with 90 percent from drip
irrigation. The source of water is open well, bore well & lift
irrigation.
• Water requirement for brinjal cultivation is 8000 - 10000 cu. meter
per hectare or 600 - 650 mm
• Area under brinjal cultivation is 100 acres. Average land holding
size is 2-3 hectare per farmer.
• Intercropping is practices with other crops such as Cabbage,
Cauliflower, & Leafy Vegetables
• Nursery purchased from Higtech nursery. Rs. 1 per plant.
• Prevailing price of brinjal is Rs 20 per kg.
• Brinjals are sold in APMC market in Sangli and Ratnagiri and
Jaysingpur. • FPC has Storage facility available with capacity of 1000 sq ft work
shed.
• Processing facility are vegetable electric dryer - 60 kg per batch,
Vegetable cutter with 40 kg per hour & vegetable slicer with 50kg
per hour is available as processing infrastructure.
Fertilizer: 10.26.26, used at the rate of 250 kg/Ha; Price at rate of Rs
1400 per kg.
Pesticides: Thrips - Confidor a.i.Imedaclopride 23.5 EC , White Fly -
Confidor a.i.Imedaclopride 23.5 EC , Fruit Borer - Emamectin Benzoate
5 percent SG, Red mite - OMITE a.i.Propargite 57 percent EC &
Thiodicarb 75 percent WP.
Agrochemical: Fusarium wilt used at the rate of 1 kg per Ha: Price Rs
1600 per Kg.
Observations
• Name of FPO – Varnamai Agro Producer Co.Ltd
• Name of person – Varnamai Agro Producer Co.Ltd.- Ramrao
Sampat Patil
• Total size of FPC - 500
Stakeholder

292
G.16 Paddy
Sindhudurg, 24/04/19
Village: Humaraila
• Lack of adequate irrigation system, The source of water are
open well, bore well & lift irrigation. Rainfall plays an
important role. 10 mm water required per day.
• Area under cultivation is 1500-2000 hectare. Average land
holding size is 1-2 acre per farmer.
• Seeds are purchased from local nursery at the rate of Rs 300
to Rs 400 per Kg.
• Crop insurance 75 percent, Soil health card 50 percent and
25 percent KCC.
• No Intercropping
• High cost of seed
• Labour not available
• Training Provided to farmers
• FPC has no storage facility & no processing unit available.
Fertilizer: NPK (50.12.12), Urea & DAP; Used at the rate of 110 Kg
per acre and 27 Kg / acres of DAP
Pesticide: Used but information not provided
Agrochemicals: Redomil gold available at Rs 500-500 per 1/2 kg
Yield: 5-7 tonnes per hectare.
Crop residue: dry leaves which is put into ground back
Requirement of FPC:
Observations
• Name of FPC – Agricar Farmer Producer Company
• Name of person – Vaibhav Pawar
• Total size of FPC – 100
Stakeholder

293
G.17 Banana
Kolhapur, 21/4/2019
Village: Bhadgoan
• Area under irrigation is 85 percent and source of water is
warana river. 10 litre per day per plant water is required for
cultivation.
• Area under banana cultivation is 70 acres and Average land
holding size is 1.5 acre.
• Raw banana is sold at Rs 8000-10,000 metric tonne & ripened
banana is Rs 15,000-20,000 metric tonne.
• Saplings purchased from nearby Nursery at the rate of Rs 13
per plant.
• 15 percent of the farmers have tractors.
• No crop insurance. 40 percent have KCC. Soil health cards
used.
• FPC has 20MT cold storage for banana, 1700 sq ft fertilizer go-
down. Vacuum packing machine, washing buckets, grading
tables, weighing machine. Processing capacity of 4 MT per
day. User charges rate are Rs 2 per kg. 70 percent capacity
utilization of processing unit.
Fertilizer: Yara Fertilizer; Price is Rs 300-2500 per bag depending on
the quality
Pesticide: BVG life sciences pesticides used as 1 litre per hectare
available at Rs 1000 per hectare.
Observations
• Name of FPC – Family Farming Producer Company Ltd.
• Name of person – Asitsith Patil
• Total size of FPC - 530
Stakeholder

294
G.18 Okra
Thane, 8/04/19
Area: Angad, Shapur
• Irrigation is through river water, well and borewell.
• Average landholding size of okra farmers is 2 – 2.5 Ha
• Total area under okra farming is 80 acres.
• Okra is mostly rainwater dependent.
• Seeds are purchased from market at a rate of Rs. 2200
per kg. 4 kg seed is required per acre.
• Only 2 farmers are having tractor in the village.
• FPC has just 4 ton storage capacity and there are no
processing or grading machineries in the FPC.
• Farmers are trained by Department of agriculture
officials.
• Farmers sell their produce as per demand either in open
market or APMC market.
• Farmers have soil health card and crop insurance but no
KCC.
Fertilizer: 1818, 1919, urea, compost; price Rs 800 per 50 kg bag.
Pesticide: Neuoron, Tymote, Neemer; Used at the rate of 1 litre
per acre; purchased at the rate of Rs. 900/ litre.
Observations
• FPC Name: Mahuli Shethkari Producer Company
• Promoter: Mr. Sudhir Jairam Gadge
• Interviewee / Partner: Mr Rajesh Jairam Gadge
Stakeholder

295
G.19 Millet
Kolhapur, 21/4/2019
Village: Bhadgoan
• Lack of irrigation system, completely dependent on rainfall.
• Area under cultivation is 13450 hectares. Average land
holding size is less than 1 acre per farmer.
• No intercropping
• Seeds are supplied by government at Rs 60 per Kg.
• No insurance, KCC and soil health cards.
• Millet is sold to Vasant Dalal Shahji Patil 30 tonnes per
month at Rs 2000 per quintal.
• FPC has rental go-down of 5000 Tonnes capacity.
• FPC has processing facilities such as primary cleaning unit.
Observations
• Name of FPC – Vinayak Farms Producer Company Ltd.
• Name of person – Abhijit Davane
• Total size of FPC – 509
Stakeholder

296
G.20 Mango (Private Processing Unit)
Ratnagiri, 13/4/2019
Village:
• Processing unit (seasonal) is a private entity and was set-up
recently in 2018.
• It produces mango pulp from mix of Alphonso and other
varieties of mangoes.
• Contractual labour in the FPC of 13-15 people.
• Mangos are purchased from middle man since farmers are
not able to supply the desired quantity of mangoes.
• Instant processing is done.
• Storage facility is 1000 tonne
Observations
• Processing Unit – Konkan Mango Processing Unit, Ratnagiri
• Person interviewed – Ram Chandra Jainta Desai / Amar Desai
Stakeholder

297
G.21 Cashew Nut
G.21.1 Stakeholder 1
Ratnagiri, 13/4/2019
Village: Goankhadi
• Irrigation is through well and bore-well. Source of cultivation is
good as river flows nearby.
• Area under cultivation is 500 acres
• Land holdings is 1 – 2 acres.
• Saplings are purchased from government nursery at Rs. 80 – 100
per
Observations
• Name – Tejaswini Prakriya Unit, Kheravse, Lanja, Ratnagiri
• Person interviewed – Ms. Samuradhi Vichare
• Members: 30
Stakeholder

298
G.21.2 Stakeholder 2
Ratnagiri, 13/4/2019
Village: Dhamandevi Mohalla
• Irrigation is through well and borewell. Water requirement is 40
litre per day.
• Landholding size is 1 – 2 acres per farmer.
• Saplings are purchased from government nursery. Two varieties of
cashew nuts are grown namely vanguard 4 and vanguard 7
purchased at Rs 100 and Rs 140 respectively.
Observations
• Name of FPC – Chandika Mahila Bachat Gad
• Person of interview – Sneha More
• Total no. of persons - 120
Stakeholder

299
G.22 Pomegranate
Solapur, 27/4/2019
Village: Kadlas
• Irrigation is through water ponds and borewell. 90 percent
through drip irrigation. Water conservation is also practiced
through mulching.
• Area under cultivation is 516 hectares. Average land holding size is
1 hectare per farmer.
Observations
• Name of CBO – Saksham Mahila Prabhgh Sangh kadlas.
• Name of person – Mr. Krunal Mahadev Patil
• Total size of FPC - 1550
Stakeholder

300
G.23 Grapes
Sangli,
Village: Tasgaon
• Irrigation is by Potable water. 85 percent is through drip
irrigation. water conservation measures through Farm
Observations
• Name of FPC – Suvidha Lok sanchalit Sadhan Kendra, Tasgaon
• Name – Mr.Dattajirao Kokate ,Manager,Suvidha
• Total size of FPC - 650
•
Stakeholder

301
G.24 Tur Dal
Yavatmal, 18/4/2019
Village: Ner
• Pipe irrigation is 75 percent & drip irrigation at 25 percent.
Observations
• Name of FPC – Tejaswini Dal Mill SHG. Name of person –
Neelama Raut
• Total farmers = 550
Stakeholder

302
G.25 Gram
Raigad, 12/4/2019
Village: Indapur
• FPC name – Somjai farmers Producers Company
• Director name - Mr Pramod Dalvi
• Total no. of farmers – 502
Stakeholder
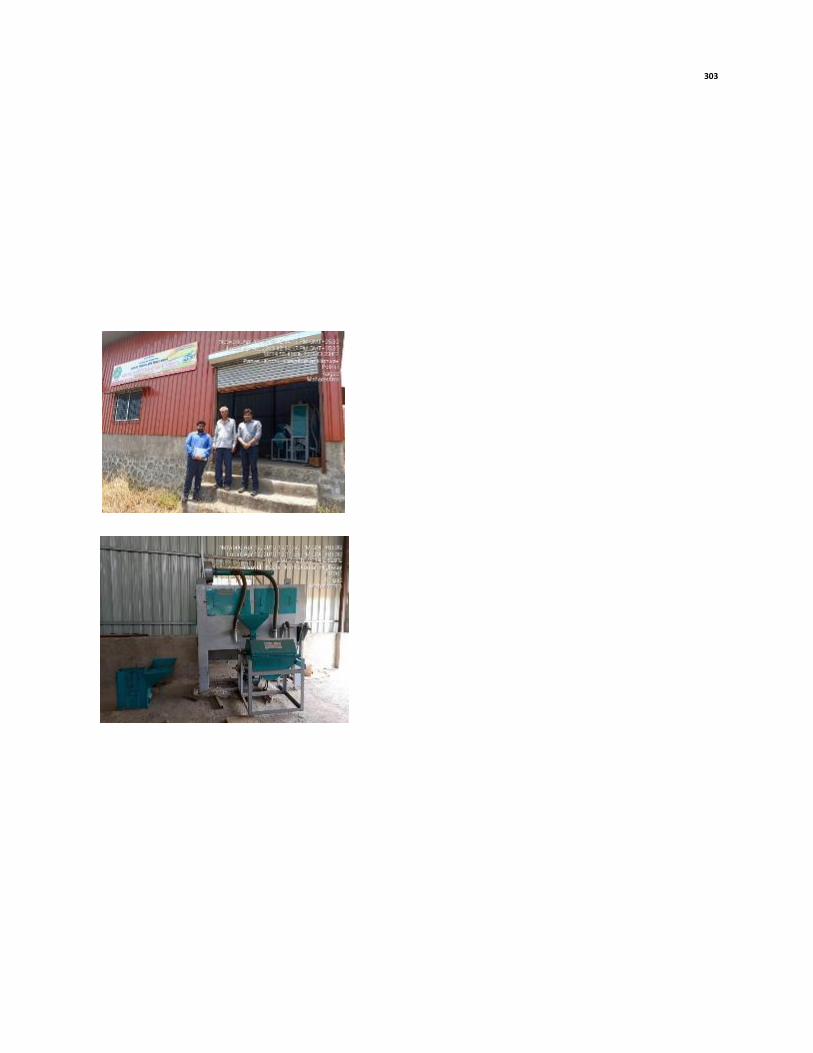
303

304
G.26 Sapota
G.26.1 Stakeholder 1
Palghar, 9/4/2019
Village: Dhanu
• Irrigation is done by bore-well, well and canal irrigation. Only 5
percent area is under canal irrigation. Water requirement for saporta
is 100 litres per day per tree. Saporta farming is completely
dependent on rain.
• Area under saporta cultivation in Dhanu is 7427 Ha Average land
holding is 10 – 12 acres.
• No intercropping is practiced since the tree is dense and will not
support.
• Farmers have crop insurance, soil health cards and KCC
• Saplings are purchased mostly from government nursery at a price of
Rs 60 per graft.
• 50 percent farmers have tractors.
• 90 percent are women labourers in Saporta farming.
• Saporta requires calcium rich soil and alluvial black soil.
• At present there are no proper FPC with cleaning grading and
packaging for Saporta.
• Solar energy is used for drying Saporta to make chips.
• There is a need to set-up processing facilities for Saporta since it’s a
very perishable commodity. At present some women in the village
make Saporta Chips, chocolate and pickle but there is lack of
branding and marketing support from the government.
• Saporta tree require rejuvenation to get better yield but labour cost is
high, so farmers generally don’t rejuvenate the tree by cutting the old
barks.
• Price for Saporta is done by open market auction.
• Saporta grading is done based on no. of fruits per 10 Kg. Sold in
Mumbai and Delhi market.
Fertilizer: Organic fertilizers such as sterameal and oilcake; used at the
rate of 10 kg per tree each; Price is 25,000 to 30,000 per Tonne.
Pesticide: seed borer and bud borer are the pest that attack Saporta and
it is controlled by IPM i.e., use of big red ants.
Agrochemical: Trichoderma and pseudomonas bacteria are used to
control phytothora fungal infection. Used at the rate of 100 – 200 gm
per tree
Yield: 10 Tonne per hectare; price Rs 7 – 10 per Kg
Crop Residue: broom and dumped; due to latex problem the leaves are
difficult to compost.
Observations
• CBO Visited – Maharashtra Rajya Chiku Utpadak Sang
• Director name - Mr Vinayak Bari and Member Secretary – Mr.
Milind Nhaphna
• Total members – 300 members
Stakeholder

305
G.26.2 Stakeholder 2 (Private Processing Industry)
Palghar, 9/4/2019
Village: Bordi
• Area of the industry is 6000 sq.ft and type of industry is small
scale.
• Raw material used for processing are mango and Saporta.
• Processing capacity is 50 Kg per day.
• Fruits are mostly bought from own field via truck
• Price of Saporta paid to the farmer is Rs. 20 / kg.
• Cleaning is done with water wash
• Activities done in the industry are cleaning, manual pealing,
cutting, deseeding
• Saporta is ripened for 96 hr after plucking using ethylene
ripening.
• Power consumption is 8 Hp and solar dryer for drying the
Saporta pieces to make chips.
• Plant has D.G back up rating is 25 KVA.
• Source of water is borewell
• No effluent for treatment
• Sewage is handled in septic tank.
• No of persons employed are 14 women and 1 man. All belong
to ST category.
• Solid waste generated is Saporta skin and seeds. Mostly it is
composted.
• Products are Saporta Chips, Saporta Powder, Saporta Pickle
and Mango slices.
• The processing unit has FSAAI license and factory license.
• Government gives 80 percent subsidy for modern techniques
but Branding and Marketing of product is required.
• Every commodity is unique and tailor made solution are
required.
Observations
• Food Processing Unit: Arya’s Natural Chipzee
• Name of the partner: Mr Sidharth Patil and Mr. Pranil Chowdhary
and Mr Aniket Chowdhary
Stakeholder

306
G.27 Market / Traders / Retailers
G.27.1 Stakeholder 1 (APMC)
Mumbai, 10/4/2019
Area: Vashi
• The market was set-up in 1975 and it handles all type of fruits and vegetables. Market is spread in an area of 70
hectare. Leas period is 60 years.
• Prices of the commodities are displayed in big screen at the entry gate. Also, the prices are listed on the website.
• Market timing is 7 am to 2 am.
• Farmers and mostly traders bring commodities to the markers. The market caters all over India.
• Cold storage facility is available but not yet operational.
• No grading and packaging facility available.
• No preservatives are used.
• Market has power connectivity
• Weighing facility is available.
• Female members & STSC staff members are available
• Price of commodity is decided on the demand & supply of the produce.
• DG Set is available only in head-office.
• Police station is available inside the market. Each market has departments & grievance redressal system is also
operational. Grievances are resolved in a weeks’ time.
• Drinking water and separate toilet facility available for male and females.
• No waste water treatment facility.
• Additional land required to expand capacity of market place and new advanced machineries required.
• Market has bank facility
• Food quality checks are done.
• Solid waste management is not adequate, and market is not clean.
• Export is done from the market to Japan, U.S.A, Australia, South Korea, New Zealand, China, Russia, Kazakhstan and
Mauritius.
• Farmers having 1 – 2 Ha land holding can register for export in the market. 80 percent of the produce can be
exported and remaining is sold in domestic market.
• For exports, field audits are conducted, audit duration varies from commodity to commodity and every commodity
has different registration period e.g. okra farmer must register every year and mango farmer registers in every 5
years
• This year around 20,000 farmers have registered for exports. Farmers and new entrepreneurs are training for better
quality produce and provide a platform for interaction between farmers and entrepreneurs.
• Farmers are free to supply in any season.
• As per special requirements of export country, post-harvest treatment is given to fruits and vegetables.
• Final product reaches consumer with PUC code and farmer code and hence can be tracked.
Observations
• Name of Wholesale Market – Mumbai Agri Produce Market
Committee, Mumbai
• Name of interviewee - Mr K.R. Powar ( PRO & Asst Secretary )
Stakeholder

307
G.27.2 Stakeholder 2 (APMC)
Satara, 3/5/2019
Area: Phaltan
• Market was set-up in 1952 and total land holdings is 17.56 Ha
Land ownership is with ULB.
• Commodities handled are Wheat, gram, jawar, bajra, maize,
onion, fruits, vegetables, sheep-goat, cattle, fodder and
forage.
• Rate of lease is 0.50 / sq,ft/year deposited in DCC bank.
• Market is open 6 days in a week except Monday.
• Fruits and vegetables are handled from 6 am to 10 am and
grain market from 11 am to 5 pm.
• The market has ticker board and Market Information Display
board.
• The market caters 128 villages. Village road is not good.
• Fruits and vegetables handled are pomegranate, potato and
onions.
• The market does not have cold storage facility.
• Market use ethylene to ripen mangoes and banana. The
quantity used in 1000 ppm.
• The market has power connection and facility for weighing of
goods.
• The market has 19 elected members and includes 2 females.
• Allotment of space is on first cum first basis and space is free
of cost to sellers.
• Price of commodities are decided by auction and displayed in
large ticker board.
• Solid waste is collected by APMC and disposed at municipal
dump yard.
• Waste water is discharged to RCC gutter pipeline.
• GRM is available and issues are resolved in the same day.
• Market has a bank within the premises.
• The marker has following requirements:
• Cold storage and storage structures for onion
• Separate area for fruits and vegetables
• Cleaning and grading machines
• Additional area for expansion.
Observations
• Whole sale Market: Agriculture Producer Market Committee,
Phaltan
• Interviewee: Mr Shankar Sarjerao Sonwalkar (Secretary Phaltan
APMC)
Stakeholder

308
G.27.3 Stakeholder 3 (Private Retailer)
Sangli, 4/5/2019
Area: Wai
• The retail is under local Authority and the commodities
handled are Turmeric Soybeans and Rajma.
• Total land holding size is 30 x 40 sq.ft.
• Price is decided by open auction and price is displayed in the
notice board.
• Buyer arrange their own mode of transportation.
• Complete are is used as storage and there is no cold storage
facility.
• No packaging facility available
• Retailer has power facility and weighing facility.
• The market has 10 workers, and all are women.
• About 40 – 50 women sellers approach the retailer.
• About 30 – 40 SC sellers approach the retailer.
• The retailer has FSSAI License
• No food quality testing provision is available with the retailer.
• Retailer face storage problems.
• The retailer does not have a Grievance Redressal Mechanism
Observations
• Retailer: Parvin Kumar Kantilal Jain
• Retail run by Regional Municipal Corporation
Stakeholder

309
G.27.4 Stakeholder 4 (Trader)
Dhule, 6/5/2019
Area: Dhule
• The trader company was established 20 years back.
• The commodities handled are wheat, maize, bajra and jawar.
• Total land holding is 150 sq.ft and is APMC shop
• Rs. 1 lakh has been deposited and Rs 750 per month is the
rent.
• Quantity of commodity handled is 25 Tonnes on daily basis.
• CBO / FPC are about 10 – 15 km far and commodities are
brought to the company mostly via tractors
• The trader has two go-downs and does not have cold storage.
• The trader has moisture meter, polishing machine and grading
machine and electronic weighing machine.
• Rejected material is feed as cattle feed.
• No women and ST farmers approach the trader.
• Price is decided by open auction and displayed in board.
• The trader has about 8 workers.
• The trader is in need of cold storage facility.
• The trader has power supply.
Observations
• Trader Company: Jitendra Traders
• Mr. Bhika R. Baviskar
Stakeholder

310
G.27.5 Stakeholder 5 (Retailer)
Nashik, 6/5/2019
Area: Market Yard, Nashik
• The retail was set-up in 1974.
• Total land holding is 300 sq.ft
• Commodities handled are chilli, ginger, brinjal, carrot
• Lease deposited to APMC is Rs 12,000 per month.
• Commodities are brought by farmers via truck or auto.
• Retailer does not have space for storage and does not have
cold storage facility. Also, there is no packaging facility.
• Quality check is by visual appearance freshness, colour size
etc.
• Price of the commodity is fixed by auction.
• Waste generated is managed by APMC
• There are 4 workers in retail shop.
• GRM is available with APMC and the issues are resolved on the
same day.
• Due to increased temperature vegetable get spoiled or the
quality deteriorates.
• The retail does not have any quality testing equipment.
• The retailer faces theft issues.
Observations
Retailer: Dyaneshwar Laxman Vanmali
Stakeholder

311
G.28 Goatery / Slaughter House
G.28.1 Stakeholder 1(BMC Slaughter House)
Mumbai, 10/4/2019
Area: Deonar
• Slaughter house area is 64 acres. Only Mumbai market is catered.
• Slaughter house capacity is 6000 heads of sheep / goat, 300 buffalo & 200 pigs
• The facility works in 2 shifts of 8 hours each.
• The facility does not have any processing unit and hence runs at a lower capacity utilization level.
• The facility is informed to have valid consent from the Pollution Control Board
• Quality checks for the facility is done by HACCP (Hazard Analysis Critical Control Plant)
• No grading of goats is done. Good hygiene is maintained. All the modern method to handling goat is present.
• Slaughter house has storage capacity of 24,000 goats in stable.
• Meat is kept in chilling plant with no preservatives for 3-4 days.
• Source of Power is through Electricity board & DG sets are available. Municipal corporation provides water
supply.
• ETP available with a capacity of 1.3 MCD
• Solid waste generated from slaughter house is reused for trade. Solid waste is managed through Bio metration
plant of 15 MT After slaughter waste (if any) can be used as pesticides as well.
• Odour management measures are taken by use of bio-methan. Pest control dept. of municipal Corp controls it.
• Animals are accepted /rejected as per Slaughter House Rules, 2001. It can be rejected before slaughter & after
slaughter
• Animals are bought to the facility by villagers / traders and the meat is sold to shopkeepers in Mumbai
• Slaughter house purchase animals from Individual licence holders.
• Animals reach the slaughter house mostly by trucks.
• Buffalo meat is directly sold by the slaughter house where as goat and sheep meat are sold to shopkeepers.
• Total no. of employees is 350 of which 50 percent are on government pay role & 50 percent on contractual role.
• Slaughter house privatization is suggested but employees are not willing to privatize.
• Processing unit expansion is required.
• New laws are difficult to maintain.
• Grievance redressal mechanism is available, and complaints are resolved in 1 – 2 days.
• Female employees are very less at present the strength is 10 and mostly does security works, veterinary doctor.
Observations
• Name of Slaughter House – Deonar Abattoir , Deonar, in the eastern
suburb of Mumbai, India.
• Name of interveiwer - Mr Yogesh Shetje (GM)
• Name of Promoter - Brihanmumbai Municipal Corporation (BMC)/
Municipal Corporation Greater Mumbai (MCGM)
Stakeholder

312
G.28.2 Stakeholder 2 (Goat Rearing Farmer)
Nandurbar, 22/4/2019
Village: Akkalkuwa
• Mostly farmers have goat shelter near their house.
• Out of 670 female farmers engaged in goat rearing 88 are from
SC category and 582 are from ST category.
• On an average farmer keep 10 goats.
• Breed of goat reared are Osmanabadi and Rural breeds.
• Farmers buy goat breed from local market or Khetiya in
Madhya Pradesh
• On an average a baby goat is purchased at Rs 4000 to Rs 7000
• Farmers take their goat for grazing in forest area out of the
village.
• On an average goat require 3 – 4 kg of green fodder and 4 – 5
kg of dry fodder
• Farmers give crushed grain as food supplements to goats. It is
purchased at the rate of Rs 20 per kg.
• Goat require 3 – 5 litters of water in a day.
• On an average a goat weigh around 12 – 15 kg.
• A goat gives around half litre of milk in a day.
• Goat milk is sold at Rs 30 per litre
• Goat meat is sold at Rs 400 per kg.
• PDR / FMD / HS / BQ and Enterotoxima are the vaccines given
to goat and is available at Rs 15 for a goat and they are vaccine
annually.
Observations
• Name of the GRC: Ranikajal Community Managed Resource Centre
• Interviewee: Mrs. Rita Manohar Padvi
• Members of GRC: 2056
Stakeholder

313
G.29 Pesticide Residue Testing Lab
Pune, 04/6/2019
Village: Akkalkuwa
• Only two government pesticide testing laboratories in
Maharashtra i.e., in Nagpur and Pune.
• Pune lab test 56 molecules out of 293.
• No test for regular commodities, only organic commodities
are tested particularly fruits vegetables and grains.
• Only some pesticides and insectisides are promoted.
• Testing is limited to the presence of pesticide and not for
the quantity.
• These labs don’t come under FSSAI and hence don’t follow
their regulations.
Recommendation / Sugession
• It was suggested that random samples from market can be
collected by FDA and Health departments under FSSAI and
the same shall be send to the lab for testing.
• There are missing linkage between all the govt departments.
There should be a common link & work pattern within
Observations
• Pune Residue Testing Lab
• Mr Neetin Phulsundar (Analytical Chemist)
Stakeholder

314
G.30 List of CBOs Consulted
Table 87: List of CBOs Consulted
S. No.
Commodity Name
Name of the FPC
Address of the FPC
Shareholders
Name of the Promoter(s)/Partner(s)
Address of the FPC
Contact No of FPC
1 Saporta Maharashtra Rajya Chiku Utpadak Sang
Dhanu, Palghar 300 Mr Vinayak Bari Dhanu, Palghar 9766555522
2 Bitter gourd Dr Hermann Gmeiner Adivasi FPC
Alibaug, Raigad 277 5 Board Members
Alibaug, Raigad 9260478499
3 Gram Somjai farmers Producers Company
Indapur, Raigad 502 10 Indapur, Raigad
8446720046
4 Cashew Nut (SHG)
Chandika Mahila Bachat Gat
Sheer, Tombore wadi, Ratnagiri
120 Mrs Sheha More Sheer, Tombore wadi
7588573047
5 Cashew Nut (SHG)
Tejaswini Kaju Packaging Unit
Ratnagiri 30 Mrs Samuridhi Khorvese Conja Ratnagiri
9423910927
6 Wheat Zero Myle FPC Kalameshwar, Nagpur
Me Rajinikanth Bhailal Patel
Kalameshwar, Nagpur
9579207551
7 Wheat Shree Krushna FPC
Kalameshwar, Nagpur
377 Mr Vinod P Gohar
Kalameshwar, Nagpur
7875007261

315
S. No.
Commodity Name
Name of the FPC
Address of the FPC
Shareholders
Name of the Promoter(s)/Partner(s)
Address of the FPC
Contact No of FPC
8 Chillies Tejaswini SHG Sitapur Nagpur NA NA NA NA
9 Paddy Lokmanas FPC Wakeshwar, Bhandara
13 committee members
Mr Maruti P Maskar
Wakeshwar, Bhandara
8605628356 / 8806245824
10 Turmeric (SHG)
Mahalakshmi SHG
Sawargaon, Ardhapur, Nanded
10 members
Mrs Jyoti Gaikward
NA 8380848600
11 Chillies Anup Kondap Kendra
Bhiwapur Nagpur
Mrs Neelema Suresh
NA 9145411938 / 9390864647
12 Cotton Joyous Agrivission FPC
Sarangpur, Ner, Yavatmal
222 shareholders
Mr. Sachin Baskar Wankhade
Sarangpur, Ner, Yavatmal
6766246063 / 7776032966
13 Tur Tejaswini Dal Mill (SHG)
Ashoknagar, Ner, Yavatmal
11 Mrs PushpaTai Geda
Ashoknagar, Ner, Yavatmal
9049463743 / 9049615324
14 Rice Bhatsa Shetkari Producer Company Limited
Shapur Thane 300 members
Mr Rajesh Jairam Gadke
Shapur Thane
15 Jowar CLF Seva Dhanje, Nandurbar
SHG 17 members
NA NA NA
16 Maize CLF Pragati Varfadya, Nandurbar
140 SHG 9420326340
17 Black Gram Navprabha Mahila Prabhag sangh
At.post.Jevali (N) Tq. Lohara Dist. Osmanabad
219 SHG 2167 member
President: Shashikala Chavale Secretary- Minakshi Mali
At.post.Jevali (N) Tq. Lohara Dist. Osmanabad
Telephone No.: Mobile No.:9970932012
18 Soybean Navprabha Mahila Prabhag sangh
At.post.Jevali (N) Tq. Lohara Dist. Osmanabad
219 SHG 2167 member
President: Shashikala Chavale Secretary- Minakshi Mali
At.post.Jevali (N) Tq. Lohara Dist. Osmanabad
Telephone No.: Mobile No.:9970932012
19 Paddy Agricart FPC Humarmala, Sindhudurg
100 Gawade Santosh Ankush
Humarmala, Sindhudurg
9423301440
20 okra PHALTAN WOMEN FARMER PRODUSER COMPANI LTD.
At post-SAKHARWADI Taluk-PHALTAN
500 1) SIMA RAJENDRA JAGTAP 2) LATA BHAGVAN MADKAR 3) RANJANA ANKUSH NALAVDE 4) SANDHYA VASANTRAO JAGTAP 5) SUNITA SOMNATH BHOSALE
AT.POST. -SAKHARWADI Taluk-PHALTAN
Telephone No.: Mobile No.: -9423863960
21 Paddy Venna Valley Agro Producer Company Ltd.
Asani tal (Kelghar) Tal- Jawali (Medha)
452 - Asani tal (Kelghar) Tal- Jawali (Medha)
Telephone No.: Mobile No.: 9604515314
22 Pomegranate
Gopalkrushna Farmer Agro Producer Company Ltd.
At-post-Girvi Tal- Phaltan Dist-satara
360 1) Ajay Balasaheb Kadam 2) Nilesh Maljirao Kadam 3) Bhaskar
At-post-Girvi Tal- Phaltan Dist-satara
Telephone No.: Mobile No.:9130540111

316
S. No.
Commodity Name
Name of the FPC
Address of the FPC
Shareholders
Name of the Promoter(s)/Partner(s)
Address of the FPC
Contact No of FPC
Popatrao Kadam 4) Vijay Narayan Kadam 5) Ajay Balasheb Kadam
23 Turmeric Ajinkyatara Satvik Organic Farmers Producer Company
At Post Malgaon Tal & Dist Satara
270 Vikram Sadashiv KAdam
At Post Malgaon Tal & Dist Satara
Telephone No.: Mobile No.:
24 Wheat Ramrajya Agro Producer Company Ltd.
At post- Fadatarwadi tal-phaltan
418 1) Bhaubali Ratanchand Saha 2) Mukund Dattatray Dhanawade 3) Deepak Vilas Gaikwad 4) Govind Shanker Nanaware 5) Mahendra Babanrao Gaikwad
At post- Fadatarwadi tal-phaltan
Telephone No.: - Mobile No.: - 9890395393
25 Wheat Pharandwadi krushikranti Agro Producer Company Ltd.
At post-Pharandwadi tal-phaltan
452 1) Bappu Subhash Borate 2)Dilip Mahipat Dalvi 3)Abhijit Vishnu Nale 4)Rajendra Kanta Borate 5)Vijay Savta Nale
Telephone No.: - Mobile No.: -9960472429
26 Turmeric Krishna koyna Agro Producer company
A/P Wadgoan haveli tal - karad Dist- Satara
420 Rajendra Bajirao Thorat suhas Shankarrao jagtap Ranjit Balasaheb Jagtap Pratap Dhondiram jagtap Shobha Pandurang Jagtap
a/p wadgoan haveli tal karad dist satara
Telephone No.: Mobile No.:
27 Soybean shri yamai agro producer company aundh
ap aundh tal khatav dist satara
283 1)sourabh chndrakant kumbhar2),Bhimrao tukaram bhosle3),sanket sandip ingale4),prashant bhgvan kumbhar5)Anis Altaf patvakari
ap aundh tal khatav dist satara
Telephone No.: Mobile No.:9850426238
28 Banana Lokvikas Farmers Producer Company Ltd. Shetphal (N)
Gat No-93, At/Post- Shetphal (N), Tal- Karmala, Dist- Solapur
20 1. Pol Vishnu Satish 2. Gajendra Nagnath Pol 3. Prashant Bhagvan Naiknavare
Gat No-93, At/Post- Shetphal (N), Tal- Karmala, Dist- Solapur
Telephone No.: Mobile No.: 7755936262

317
S. No.
Commodity Name
Name of the FPC
Address of the FPC
Shareholders
Name of the Promoter(s)/Partner(s)
Address of the FPC
Contact No of FPC
4. Vaibhav Vasant Pol 5. Nanasaheb Vikram Salunke
29 Maize Malkavathe FPO Gat 291 at post malkavathe tal. south solapur dist. solapur
660 11 Gat 291 at post malkavathe tal. south solapur dist. solapur
Telephone No.:8830569553 Mobile No.:
30 Onion Kalman Agro Producer Company Ltd. KALMAN
At/Post- KALMAN, Tal- NORTH SOLAPUR,, Dist- Solapur
11 PATIL NANDKUMAR SUBHASH,anil babruvan pawar,prabhakar madhukar bidawe,abhiman pandhari mali.dhanaji laxman shinde,sunil nanasaheb patil
At/Post- KALMAN, Tal- NORTH SOLAPUR,, Dist- Solapur
Telephone No.: Mobile No.: 9764643830
31 Pomegranate
Spiritual Farming Natural Agro Producer Company Ltd.
Madha Solapur 110 NA Madha Solapur 9028598955
32 FPC Onion Agasti Farmers producrer company.ltd.
Mehenduri,Tal:akole
329 5 Mehenduri.Tal:Akole.
Telephone No.: Mobile No.:9975299214
33 FPC Maize Sai Pravara FPO Chincholi, Rahuri
Ashok Vishwanath Gagare
A/P - Chincholi, Rahuri
Telephone No.: Mobile No.:7757914735, 992294149
34 FPC Soyabean
Punyastambh Farmer Producer Compony
Ap: Puntamba Tal- Rahata
350 Vijay Pandharinath Dhanawate
Ap: Puntamba Tal- Rahata
Telephone No.:8208786733 Mobile No.::8208786733
35 FPC Soyabean
Boradi Parisar FPC
Boradi Parisar,Boradi,Tal Shirpur,Dist-Dhule.
251 President - Raman Shankar Pawara,Secretory - Rahul Prabhakar Badgujar.(Total No Of Promotors -5)
Boradi Parisar,Boradi,Tal Shirpur,Dist-Dhule.
Telephone No.:9423288310 Mobile No.:9823605417
36 FPC Maize Surmai Farmer Producers Company
Khalane Tal-Shindkheda Dist Dhule
324 President -Sudhakar Prakash Wagh Vice Pre.Ganesh Subhash Bhadane (No of Promotres 5)
Khalane Tal-Shindkheda Dist Dhule
Telephone No.: Mobile No.:9730855885
37 FPC Maize Rajmudra Farmer Producer Co. LTD
Kusumba Tal Dist -Dhule
350 Members
Pre. Mahendra Nimba Pardeshi, Sec.Savita Hiralal Pardeshi
Kusumba Tal Dist -Dhule
Telephone No.: Mobile No.:7588319968

318
S. No.
Commodity Name
Name of the FPC
Address of the FPC
Shareholders
Name of the Promoter(s)/Partner(s)
Address of the FPC
Contact No of FPC
( 5 Members of Promotors )
38 FPC Maize Jyotiba Farmer Producer Company
Nyahalod Tal Dist -Dhule
209 Members
Pre.-Prakash Kautik Wagh,Sec.-Nanabhau Keshav Pawar (Promoters no. 5)
Nyahalod Tal Dist -Dhule
Telephone No.: Mobile No.:7588002074
39 FPC Onion Shree Vignharta Farmar Producer company
At Post Chhadvel Korde Tal Sakri Dist. Dhule
320 Hemraj Fakira Patil
At/p- Chhadvel Korde Tal- Sakri Dist- Dhule
Telephone No.: Mobile No.:9049409777
40 FPC Onion Krushi Aaradhana Farmar Procuer Company
At/post -Jaitane Tal-Sakri Dist-Dhule
218 Anil Madhukar Sonawane (Total no of 5 Promotors)
At/Post -Jaitane Tal-Sakri Dist-Dhule
9860988525
41 FPC Paddy Ajara Agro Producer Company Ltd.
Old post galli Ajara, Kolhapur
503 Mr. Sambhaji Hari Sawant - President Mr. Appa Krushna Pawale - Vice President
Old post galli Ajara, Kolhapur
9420133762
42 FPC Millet Vinayak Farmers producer co. l MT
96A, Bhadgaon Road, Gadhinglaj
509 Kiran Magdum, Rajshri Magdum, Rajendra More, Ramkrishna Magdum, Nikhil Magdum
96A, Opp. Jagruti hgh school, Bhadgaon road, Gadhinglaj
9423276321
43 FPC Banana Family farming producer company limited
525 wathar-warana state highway, Talsande, Warana, Kolhapur
530 Pladi Ajitsinh Abasaheb
525 wathar-warana state highway, Talsande, Warana, Kolhapur
7507155551 7507997711
44 FPC Soyabean
Shetkari Vikas Agro producers company ltd
Sajani, Tal. Hatkangle, District Kolhapur
470 Mr Bharat M Kanise
Sajani, Tal. Hatkangle, District Kolhapur
9373246533
45 FPC Cashewnut
Jivhala Farmers Producer Cpmapny Ltd
A/P Uttur 386 hivshankar Sidhoji Jakkhanawar Sanjay Hanamant Hatlargi
A/P Uttur 9673922373
46 FPC Paddy Nesu Parisar FPC, Ltd. Khandbara
AT post Khandbara Tal Navapur Dist - Nandurbar.
227 5 AT post Khandbara Tal Navapur Dist - Nandurbar.
Mobile No.: 9049418233 Mobile No.: 8551078778
47 FPC Paddy Bahugunit FPC, Ltd. Karanji
AT Post Karanji Tal Navapur Dist - Nandurbar.
316 1) Kisan Nandya Gavit 2) samvel Rupaji Gavit 3) Rajendra Madhukar Vasave 4) Kantilal Gobji gavit 5) Sangita Suresh Gavit
AT Post Karanji Tal Navapur Dist - Nandurbar.
Mobile No.: 9404800339 Mobile No.: 9404758922

319
S. No.
Commodity Name
Name of the FPC
Address of the FPC
Shareholders
Name of the Promoter(s)/Partner(s)
Address of the FPC
Contact No of FPC
48 FPC Paddy Yaha Adivasi Navapur FPC, Ltd. Vadsatra
AT Post Vadsatra, Tal - Navapur Dist - Nandurbar.
255 1)Kisan Jana Vasave 2) Gemji Narsi Valvi 3) Nima Vasu Gavit 4) Suresh Jarmansing Naik 5) Ajit Shamsing Valvi
AT Post Vadsatra, Tal - Navapur Dist - Nandurbar.
Mobile No.: 9405577713 Mobile No.: 8888053767
49 FPC Gram Jivandayini Tapi Innovative farmer Producer Co.ltd
At/post-fesh Tal Shahada Dist-Nandurbar
300 yogesh vijay patil Sandeep laxman patil Rajshri Ravindra patil Sanjay Bansi Patil Sanjay Bansi Pati Sanjay Jangesh Chudhari Kiran hiralal pat Bapu Mansaram Marathe
At/post fesh TalShahadaDist Nandurbar At/post-fesh Tal Shahada Dist-Nandurbar
Telephone No.: Mobile No.:7588921700
50 FPC Paddy Nesu Parisar FPC, Ltd. Khandbara
AT post Khandbara Tal Navapur Dist - Nandurbar.
227 5 AT post Khandbara Tal Navapur Dist - Nandurbar.
Mobile No.: 9049418233 Mobile No.: 8551078778
51 FPC Brinjal Varnamai Agro Producer Co.Ltd
Karanjwade , Tal- Walwa, Dist- Sangli
500 Ramrao Sampat Patil, Pramod Shivaji Patil
Gat No.147, A/p- Karanjwade , Tal- Walwa, Dist- Sangli
Telephone No.: Mobile No.: 7768065707
52 FPC Tomato Varnamai Agro Producer Co.Ltd
Karanjwade , Tal- Walwa, Dist- Sangli
500 Ramrao Sampat Patil, Pramod Shivaji Patil
Gat No.147, A/p- Karanjwade , Tal- Walwa, Dist- Sangli
Telephone No.: Mobile No.: 7768065707
53 FPC Grapes Drakshayani Farmers Producer Co Ltd.
At Soni Tal Miraj Dist Sangli
100 Rangrao Dhondiram Jadhav And Other 10
At Soni Tal Miraj Dist Sangli
Mobile No.:9764062211
54 FPC Jowar Pimpalpaan Organic Farmers Producer Company Limited.
Irali , Tal. - Kavthe- Mahankal , Dist. - Sangli , 416405 .
631 Shree Nitin Shankar Patil
Irali , Tal. - Kavthe- Mahankal , Dist. Sangli , 416405 .
Telephone No.: Mobile No.: 7057639777
55 FPC Pomegranate
Shetkari Praja Farmers producers Company Ltd. Atpadi Dist- Sangli
Krushinagar, Atpadi Dist- Sangli
300 member
Chairman- Sanjay Chavan
Krushinagar, Atpadi Dist- Sangli
Telephone No.: Mobile No.: 992292029
56 FPC Soyabean
Shree Mahaganapati agro producer company Ltd.
Thanapude, Tal: Walwa, Sangli 415412
909 Chairman :Subhash Rangrao Patil, Secretory :
Thanapude, Tal: Walwa, Sangli 415412
"Telephone No.: 9403780147

320
S. No.
Commodity Name
Name of the FPC
Address of the FPC
Shareholders
Name of the Promoter(s)/Partner(s)
Address of the FPC
Contact No of FPC
Lavankush Rajaram Nangare
Mobile No.: 9673625798"
57 FPC Brinjal Varnamai Agro Producer Co.Ltd
Karanjwade , Tal- Walwa, Dist- Sangli
500 Ramrao Sampat Patil, Pramod Shivaji Patil
Gat No.147, A/p- Karanjwade , Tal- Walwa, Dist- Sangli
"Telephone No.: Mobile No.: 7768065707"
58 FPC Tomato Varnamai Agro Producer Co.Ltd
Karanjwade , Tal- Walwa, Dist- Sangli
500 Ramrao Sampat Patil, Pramod Shivaji Patil
Gat No.147, A/p- Karanjwade , Tal- Walwa, Dist- Sangli
"Telephone No.: Mobile No.: 7768065707"
59 FPC Brinjal Varnamai Agro Producer Co.Ltd
Karanjwade , Tal- Walwa, Dist- Sangli
500 Ramrao Sampat Patil, Pramod Shivaji Patil
Gat No.147, A/p- Karanjwade , Tal- Walwa, Dist- Sangli
"Telephone No.: Mobile No.: 7768065707"
60 FPC Tomato Varnamai Agro Producer Co.Ltd
Karanjwade , Tal- Walwa, Dist- Sangli
500 Ramrao Sampat Patil, Pramod Shivaji Patil
Gat No.147, A/p- Karanjwade , Tal- Walwa, Dist- Sangli
"Telephone No.: Mobile No.: 7768065707"
61 FPC Banana Lokvikas Farmers Producer Company Ltd. Shetphal (N)
Gat No-93, At/Post- Shetphal (N), Tal- Karmala, Dist- Solapur
20 1. Pol Vishnu Satish 2. Gajendra Nagnath Pol 3. Prashant Bhagvan Naiknavare 4. Vaibhav Vasant Pol 5. Nanasaheb Vikram Salunke
Gat No-93, At/Post- Shetphal (N), Tal- Karmala, Dist- Solapur
"Telephone No.: Mobile No.: 7755936262"
62 FPC Onion Kalman Agro Producer Company Ltd. KALMAN
At/Post- KALMAN, Tal- NORTH SOLAPUR,, Dist- Solapur
11 PATIL NANDKUMAR SUBHASH,anil babruvan pawar,prabhakar madhukar bidawe,abhiman pandhari mali.dhanaji laxman shinde,sunil nanasaheb patil
At/Post- KALMAN, Tal- NORTH SOLAPUR,, Dist- Solapur
"Telephone No.: Mobile No.: 9764643830"
63 FPC Maize Gat 291 at post malkavathe tal. south solapur dist. solapur
660 11 Gat 291 at post malkavathe tal. south solapur dist. solapur
"Telephone No.:8830569553 Mobile No.:"
64 FPC Paddy Darnamai Farmer Producer Company Ltd
Kurhegaon, Igatpuri, Nashik
650 Director - 5, Promoter - 5
Kurhegaon, Igatpuri, Nashik
9921468476/ 9270127718
65 FPC Onion Five star green farmers producer company
At post sawki, Deola, Nashik
502 12 At post sawki, Deola, Nashik
7972839593 9970253418
66 FPC Tomato Janki Agriculture farmer producer company, palkhed
Palkhed, Niphad, Nashik
652 President - Anil Madhukar Nikam Secretary - Santosh
Palkhed, Niphad, Nashik
9822398255
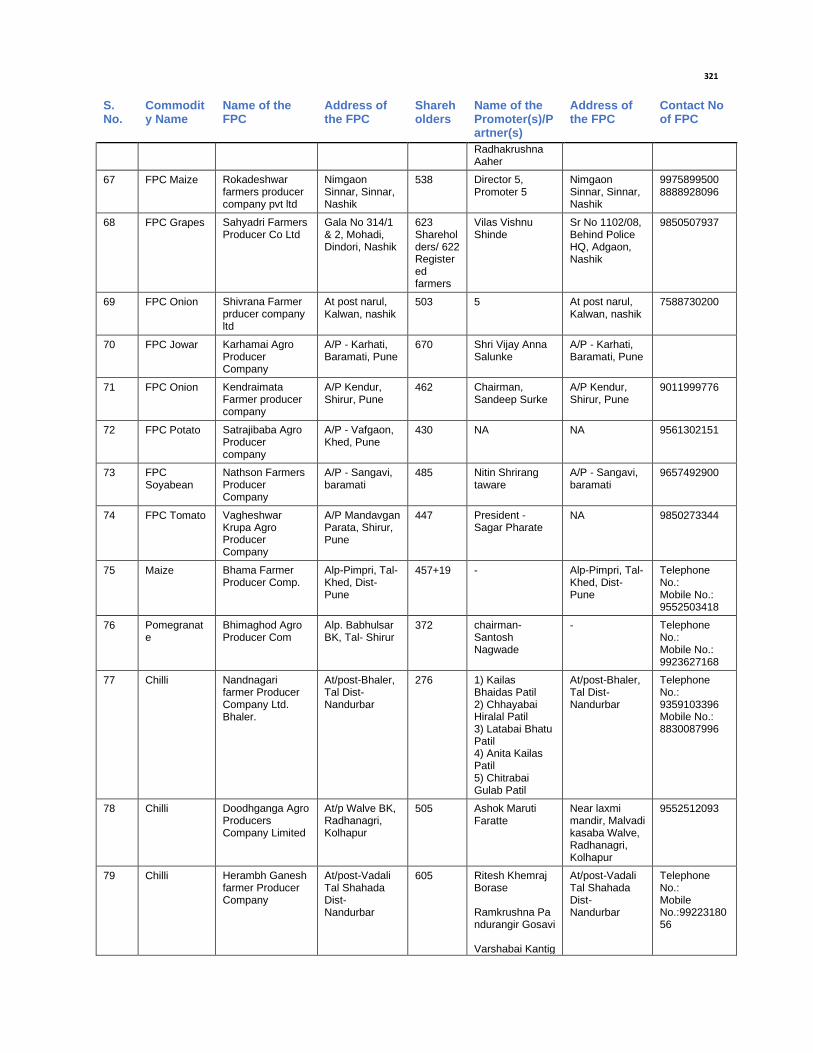
321
S. No.
Commodity Name
Name of the FPC
Address of the FPC
Shareholders
Name of the Promoter(s)/Partner(s)
Address of the FPC
Contact No of FPC
Radhakrushna Aaher
67 FPC Maize Rokadeshwar farmers producer company pvt ltd
Nimgaon Sinnar, Sinnar, Nashik
538 Director 5, Promoter 5
Nimgaon Sinnar, Sinnar, Nashik
9975899500 8888928096
68 FPC Grapes Sahyadri Farmers Producer Co Ltd
Gala No 314/1 & 2, Mohadi, Dindori, Nashik
623 Shareholders/ 622 Registered farmers
Vilas Vishnu Shinde
Sr No 1102/08, Behind Police HQ, Adgaon, Nashik
9850507937
69 FPC Onion Shivrana Farmer prducer company ltd
At post narul, Kalwan, nashik
503 5 At post narul, Kalwan, nashik
7588730200
70 FPC Jowar Karhamai Agro Producer Company
A/P - Karhati, Baramati, Pune
670 Shri Vijay Anna Salunke
A/P - Karhati, Baramati, Pune
71 FPC Onion Kendraimata Farmer producer company
A/P Kendur, Shirur, Pune
462 Chairman, Sandeep Surke
A/P Kendur, Shirur, Pune
9011999776
72 FPC Potato Satrajibaba Agro Producer company
A/P - Vafgaon, Khed, Pune
430 NA NA 9561302151
73 FPC Soyabean
Nathson Farmers Producer Company
A/P - Sangavi, baramati
485 Nitin Shrirang taware
A/P - Sangavi, baramati
9657492900
74 FPC Tomato Vagheshwar Krupa Agro Producer Company
A/P Mandavgan Parata, Shirur, Pune
447 President - Sagar Pharate
NA 9850273344
75 Maize Bhama Farmer Producer Comp.
Alp-Pimpri, Tal-Khed, Dist-Pune
457+19 - Alp-Pimpri, Tal-Khed, Dist-Pune
Telephone No.: Mobile No.: 9552503418
76 Pomegranate
Bhimaghod Agro Producer Com
Alp. Babhulsar BK, Tal- Shirur
372 chairman-Santosh Nagwade
- Telephone No.: Mobile No.: 9923627168
77 Chilli Nandnagari farmer Producer Company Ltd. Bhaler.
At/post-Bhaler, Tal Dist-Nandurbar
276 1) Kailas Bhaidas Patil 2) Chhayabai Hiralal Patil 3) Latabai Bhatu Patil 4) Anita Kailas Patil 5) Chitrabai Gulab Patil
At/post-Bhaler, Tal Dist-Nandurbar
Telephone No.: 9359103396 Mobile No.: 8830087996
78 Chilli Doodhganga Agro Producers Company Limited
At/p Walve BK, Radhanagri, Kolhapur
505 Ashok Maruti Faratte
Near laxmi mandir, Malvadi kasaba Walve, Radhanagri, Kolhapur
9552512093
79 Chilli Herambh Ganesh farmer Producer Company
At/post-Vadali Tal Shahada Dist- Nandurbar
605 Ritesh Khemraj Borase Ramkrushna Pandurangir Gosavi Varshabai Kantig
At/post-Vadali Tal Shahada Dist- Nandurbar
Telephone No.: Mobile No.:9922318056

322
S. No.
Commodity Name
Name of the FPC
Address of the FPC
Shareholders
Name of the Promoter(s)/Partner(s)
Address of the FPC
Contact No of FPC
ir Bawa Raghunath Bhalchandra Chaudhari g Shankar Dhondu Mali
80 Navi Disha FPC, Malwandi
Madha-Vairag Road (Vairag Tah. Barshi
2024 MSRLM Devashala Sutrar
Telephone No.: Mobile No.: Aware Tai - 8830415709
81 SAKSHAM MAHILA PRABHGH SANGH,KADLAS.
AT POST KADLAS TAL SANGOLA
MSRLM AT POST - KADLAS, TAL SANGOLA
Telephone No .: Mobile No .: LATIFA PATEL 7875490100.
82 Paddy Asmita Loksanchait-Sadhan Kendra
Karveer, Kolhapur
4718 17 villages Karveer, Kolhapur
Telephone No.:0231-2368481 Mobile No.: 9834547893
83 Millet Akkarani community managed resource centre , Dhudagaon, Nandurbar
Smt Arunabai Virasing Pawara, Near suresh welding workshop, Dudhgaon, Nandurbar
2271 Ms Suraja Baraku Valvi
Smt Arunabai Virasing Pawara, Near suresh welding workshop, Dudhgaon, Nandurbar
Telephone No.:NA Mobile No.:9403817300
84 Maize Akkarani community managed resource centre , Dhudagaon, Nandurbar
Smt Arunabai Virasing Pawara, Near suresh welding workshop, Dudhgaon, Nandurbar
2271 Ms Suraja Baraku Valvi
Smt Arunabai Virasing Pawara, Near suresh welding workshop, Dudhgaon, Nandurbar
Telephone No.:NA Mobile No.:9420856276, 9404299174
85 Onion SHIVNERI LOKSANCHALIT SADHAN KENDRA
MAHABARE COMPLEX NEAR NEW BUS STAND JUNNER
2286 MAHILA AARTHIK VIKAS MAHAMANDAL PUNE DISTRICT
MAHABARE COMPLEX NEAR NEW BUS STAND JUNNER
Telephone No.: Mobile No.:7219778019
86 Onion Jidnyasa Loksanchalit Sadhan Kendra Manchar
Near shrikrishana patasanstha moraya market Taluka manchar,Ambegoan
1872 Mahila Arthikm Vikas Mahamandal Pune
Near shrikrishana patasanstha moraya market Taluka manchar,Ambegoan
Telephone No.: Mobile No.:996054336
87 Paddy Dipstambha loksanchalit sadhan kendra
Near S.T front of shramik hall Ta.bhor District Bhor
3225 Mahila Arthik Vikas Mahamandal Pune
Near S.T front of shramik hall Ta.bhor District Bhor
Telephone No.:8788244578 Mobile No.:
88 Potato Jidnyasa Loksanchalit Sadhan Kendra Manchar
Near shrikrishana patasanstha moraya market Taluka manchar,Ambegoan
1872 Mahila Arthikm Vikas Mahamandal Pune
Near shrikrishana patasanstha moraya market Taluka manchar,Ambegoan
Telephone No.: Mobile No.:996054336

323
S. No.
Commodity Name
Name of the FPC
Address of the FPC
Shareholders
Name of the Promoter(s)/Partner(s)
Address of the FPC
Contact No of FPC
89 Tomato SHIVNERI LOKSANCHALIT SADHAN KENDRA
MAHABARE COMPLEX NEAR NEW BUS STAND JUNNER
2286 MAHILA AARTHIK VIKAS MAHAMANDAL PUNE DISTRICT
MAHABARE COMPLEX NEAR NEW BUS STAND JUNNER
Telephone No.: Mobile No.:7219778019
90 Grapes Suvidha Loksanchalit Sadhan Kendra, Tasgaon.
Siddheshwar Road, Opp. CBI, Tal- Tasgaon, Dist- Sangli.
4255 Mahila Arthik Vikas Mahamandal
Siddheshwar Road, Opp. CBI, Tal- Tasgaon, Dist- Sangli.
Telephone No.: 02346-240266 Mobile No.: 9049828454
91 Wheat NA NA NA NA NA Telephone No.: 02166-25942 Mobile No.:9763418716
92 Soybean Pragati Locksanchilt Sadhan Kendra
Karanje Peth Manas Apartment , Karanje
4833 NA NA Telephone No.: 02162-235081 Mobile No.:9604751860
93 Jowar Pragati Locksanchilt Sadhan Kendra, Satara
Karanje Peth Manas Apartment , Karanje
4833 NA NA Telephone No.: 02162-235081 Mobile No.:9604751860
94 Onion Shiddeshware Shetphal 212 Sakuntla Mane Shetphal Telephone No.: Mobile No.:9665042765
95 Pomegranate
Parivartan CMRC Velapur
A-P Velapur, Tal-Malshiras
50 Sapna Mahibub Shaikh
A-P Velapur Telephone No.: Mobile No.:9763613984
96 Maize Disha Loksanchit Sadhan Kendra
At post Boradi 6 Lalita Vijay Mali At post Shirpur Telephone No.: Mobile No.:9518785411
97 Onion Aadhur Loksanchlit Sadhan Kendra
At Post-Nijampur Tal-Sakri Dist-Dhule
11 Aadhur Loksanchlit Sadhan Kendra
At Post-Nijampur Tal-Sakri Dist-Dhule
Telephone No.: Mobile No.:9284681235

324
G.31 List of GRCs Consulted
Table 88: List of GRC Consulted
S. No
Name of the GRC
Address of the GRC
No of Sharehold
ers / members
of GRC
Name of the Promoter(s)/Partner(s)
Address of the GRC
Contact No of GRC
1 MKVG Hatkangle AIP Hatkangle, Kolhapur
4329 18 villages Hatkangle Telephone No: 0230-2483684 Mobile No:
2 Ranikajal community Managed resource centre
At past pikkalkuwa Tq Akkalkuwa, Nandurbar
2056 Smt Rekha Padvi At past pikkalkuwa Tq Akkalkuwa, Nandurbar
Telephone No: NA Mobile No: 9404035707
3 Parivartan CMRC,Kavathemahankal
At-Post/Taluka - Kavathemahankal Dist-Sangli
4215 Mahila Arthik Vikas Mahamandal
At-Post/Taluka - Kavathemahankal Dist-Sangli
Telephone No.: 02341222060 Mobile No.: 9765845057
4 OMSAI CMRC Phaltan
Burud gali Kasba Peth Phaltan
NA Mavim Burud Galli Telephone No.: 02166-220942 Mobile No.: 9763418716
5 Shiddeshwar Shetphal 347 Sarika Dipak Pawar
A/P Shetphal Telephone No.: Mobile No.: 9665042765
6 Parivartan CLF Velapur
Velapur, Ta-Malshiras Dist-Solapur
50 Sapna Mahibub Shaikh
At PO-Velapur Telephone No.:02185245066 Mobile No.: 9763613984
7 KRUSHI KUMAR sheep and goat company
At post: Rashin Ta :karjat .
459 santosh vasant kambale
at post : Rashin Ta :karjat .
Telephone No.: Mobile No.: 9970796415
G.32 List of APMC Market Consulted
Table 89: List of APMC Market Consulted
S. No
Name of the Wholesale Market
Type of Wholesale Market (Corporate /SME/ Start-up)
Name of the Promoter / Partners
Address of the Wholesale Market
Contact No.
1 APMC Ahmednagar
Govt. (Regulated market )
Elected body kisankranti Building marketyard Ahmednagar
Telephone: Mobile:9423162935
2 APMC Shevgaon
Govt. (Regulated market )
Elected body APMC, Marketyard Shevgoan
Telephone: Mobile:9423162935
3 Ajay Traders Other Vijay Vasantrao Chinchole
Apmc Dhule dist Dhule Telephone: Mobile: 9422798397
4 Kolhapur Agriculture Produce Market Committee, Kolhapur
Semi Gov. - Local Authority
Director Body . Shree Shahu Market Yard, Kolhapur
Telephone: 02312651404 Mobile: 8888846136
5 Jaysingpur A.P.M.C.Jaysingpur, Taluka-Shirol, Sist.Kolhapur
semi governmet local authority.
co-operative Jaysingpur apmc jaysingpur, ratnappa kumbhar market yard, taluka shirol,dist-kolhapur
Telephone: 02322(221588, 221688)" Mobile:

325
S. No
Name of the Wholesale Market
Type of Wholesale Market (Corporate /SME/ Start-up)
Name of the Promoter / Partners
Address of the Wholesale Market
Contact No.
6 Nandurbar APMC
Govt. Regulated Market
Nandurbar APMC
Nandurbar APMC Telephone: Mobile:
7 Shahada APMC Govt. Regulated Market
Shahada APMC Shahada APMC Telephone: Mobile:
8 APMC Sinner Govt Public Authority APMC Sinner, Shirdi road, Sinner
Telephone:02551-220037 Mobile:7588172707
9 Nashik Govt Directors Dindori road, Panchavati, Nashik
Telephone: Mobile:
10 Shri Navnath Sriram Lokhande
Corporate Market, Startup-25/02/1985
Shri Navnath Sriram Lokhande
A.P.M.C Market Yard Khed Tal-Khed Dist-Pune Pin-410505
Telephone:-02135-222031 Mobile:-9822318382
11 Agriculture Produce Market committee, Phaltan
Local Authority - Market yard, Mahad-Pandharpur Road, Phaltan, Dist-Satara
02166-222216, 9623889988
12 Agriculture produce market committee,Palus
Local authority - Karad-Tasgaon Road Main Market Yard Palus 416310
Telephone:02346- 229454 Mobile:
13 Agriculture Produce Market committee,islampur
local authority - Islampur Telephone:0234-2222056 Mobile:
14 Wai APMC local authority - Yashwantnagar Wai Telephone:02167-227004 Mobile:9975192104
15 Vashi APMC Market
Govt Mumbai Agri Produce Market Committee, Mumbai
Sector 19, Vashi, Navi Mumbai, Maharashtra 400703
(022) 2788 8414, (022) 2788 1400
G.33 List of Retailers Consulted
Table 90: List of Retailer Consulted
S. No.
Name of the Retailer
Type of Retailer (Corporate /SME/ Start-up)
Name of the Promoter / Partners
Address of the Retailer
Contact No.
1 Rajendra Waman Thorat
Govt. (Regulated Market)
Proprietor Marketyard Ahmednagar
Telephone: Mobile:9890654600
2 Rajendra Luxman Dheadray
Govt. (Regulated market)
Proprietor Gala No.1 marketyard APMC Shevgoan
Mobile-9272701651
3 Mr. Bhika R. Baviskar(jitendra traders)
Other Mr. Bhika R. Baviskar(jitendra traders)
Shop No.5 Apmc Dhule
Telephone: Mobile:9822051658
4 Mohsin Harun Bagwan
Self-owner Mohsin Harun Bagwan
12 th lane Jaysingpur, Tal.Shirol Dist.kolhapur
Telephone: Mobile: 9552529501

326
S. No.
Name of the Retailer
Type of Retailer (Corporate /SME/ Start-up)
Name of the Promoter / Partners
Address of the Retailer
Contact No.
5 JamirHazir nazaruddin Bagwan
Self-owner JamirHazir nazaruddin Bagwan
gala no.-24,vegetable market Kolhapur apmc Tal.-karveer Dist.kolhapur
Telephone: Mobile: 9822399111
6 Vijay Parimal Jain Propritership own Apmc Shahada 9763629925
7 Kanhaiyalal Ravaji Wani
Propritership single apmc nandurbar 9822435555
8 Anil Jaiprakash Kalantri
Individual Anil Jaiprakash Kalantri
Gala no. 8 and 9, Main Market yard, APMC, Nashik
Telephone: Mobile:9822012561
9 Omsai Traders Corporate S.B.Kalekar Nashik Telephone: Mobile:9881809083
10 Dyaneshwar Laxman Vanmali
Individual Dyaneshwar Laxman Vanmali
Gala no. 8 and 9, Main Market yard, APMC, Nashik
Telephone: Mobile:9422250482
11 Santosh B. Agrahari Individual Santosh B. Agrahari 44-34, Panchavati, Nashik
Telephone: Mobile:9890717420
12 Ms.Namdevrao B. Jadhav Company
self owener - Market yard phaltan pandharpur road,satara
02166-222216
13 Shre Shantappa Sangappa Kondikop.
corporate - Karad-Tasgaon Road Main Market Yard Palus 416310
Telephone: Mobile: 8408803292
14 Parasnath trading company
SME Shailendra s.karande apmc islampur 7588920671
15 Pravinkumar Kantilal Jain
local authority Kantilal Jain 381 Madhali alli wai Telephone:
02167-220904 Mobile:9822090116
16 Mr. Mohan Pandit Patil
Other Patil and Company Shop No.1,2 and 3, Market yard Shirpur, Dist -Dhule
Telephone: Mobile:9422289393
G.34 List of Traders Consulted
Table 91: List of Traders Consulted
S. No Name of the Trading Company
Type (Corporate /SME/ Start-up)
Name of the Promoter / Partners
Contact No.
1 Sunny trading company corporate no Mobile: 9422033901
2 Sundesh Traders corporate no Mobile: 7218118844
3 Durga Trading Co. corporate no Mobile: 9423222076
4 Kate Agro Foods corporate no Mobile: 9970317849
5 Shantilal Sobhachand Munot corporate no Mobile: 9890509109

327
G.35 List of Slaughter house Consulted
Table 92: List of Slaughter House Consulted
S. No
Name of the Slaughter house
Owner Address Contact Area Type
1 Deonar Abattoir BMC 1, Sindhi Society, Chembur, Mumbai, Maharashtra 400071
Telephone: 022225563285, 02225563286
64 acres large
2 Pune Muncipal Corporation Kondwa Slaughterhouse
PMC Salunke Vihar Road,Kamela,Kondhwa Pune.
Telephone: 02025501237, 02025501226 Mobile: 26831966
2 acres Medium
G.36 List of Industries Consulted
Table 93: List of Industries Consulted
S. No
Name of the Industry
Owner Address Contact Area Type
1 Aryas Natural Chipzee
Mr Siddharth Patil Mr Pranil Chowdhary Mr Aniket Chowdhary
Sy. No. 372/1/1, Jamburgaon, Bordi, Palghar
Telephone : Mobile:9096445234 e-mail id:[email protected]
6000 sq.ft Small
2 Konkan Mango Processing Ratnagiri
Mr. Ramchandra Jainta Desai / Amar Desai
Ratnagiri 9552274274 [email protected]
Small

328
H. Definition of Terms Used in RAP
"Agricultural labourer" means a person primarily resident in the affected area who does not hold any land in the
affected area but who earns his/her livelihood principally by manual labour on agricultural land therein immediately
before such declaration and who has been deprived of his/her livelihood.
"Agricultural land" includes lands being used for the purpose of - i) Agriculture or horticulture; ii) Dairy farming,
poultry farming, pisciculture, breeding of livestock or nursery growing medicinal herbs; iii) Raising of crops, grass
or garden produce; and land used by an agriculturist for the grazing of cattle, but does not include land used for
cutting of wood only.
"BPL family": The below poverty line (BPL) families shall be those as defined by the Planning Commission of India
from time to time and included in a BPL list for the time being in force.
“Competent Authority”: means any person authorized by the Central /State Government, by notification, to perform
the functions of the Competent Authority for such area as may be specified in the notification.
"Census": is a data collection technique of completing enumeration of all Project Affected Families and their assets
through household questionnaire.
"Compensation": means payment in cash or in kind to replace losses of land, housing, income, and other assets
caused by a project.
"Cut-off date": This refers to the date prior to which the project affected family was in possession of the immovable
or movable property within the affected zone. The Cut-off date for identifying the affected families including land
owners, those having title claims recognized under other state and central laws, squatters and other non-title
holders shall be the date of first land acquisition (LA) notification issued under Section 3 c (ii), (iv) (vi) of Land
Acquisition, 2013. It is provided that the ―PAP census survey shall be the basis for finalizing the eligibility for
extending R&R benefits including assistance towards the replacement of affected structures of non-title holder PAPs.
“Encroacher”- A person/family, who transgresses into the public land (prior to the cut of date), adjacent to his/her
own land or other immovable assets and derives his/her additional source of shelter/livelihood.
"Entitlement": is defined as the right of project affected persons (PAPs) to receive various types of compensation,
relocation assistance, and support for income restoration in accordance with the policy provisions.
"Entitlement Matrix": is a table to define different nature of PAPs losses and compensation packages and other
relocation assistance.
"Family": includes a person, his or her spouse, minor sons, unmarried daughters, minor brothers, unmarried sisters,
father, mother and other relatives residing with him or her and dependent on him or her for their livelihood; and
includes "nuclear family" consisting of a person, his or her spouse and minor children.
“Independent Evaluator”: means an evaluator registered with government, hired by SMART PCMU, to provide
inputs to the competent authority in arriving at the replacement cost of land.
"Holding" means the total land held by a person as an occupant or tenant or as both.
"Khatedar" means a person whose name is included in the revenue records of the parcel of land under reference.
"Marginal farmer" means a cultivator with an un-irrigated land holding up to one hectare or irrigated land holding
up to half hectare.

329
"non-agricultural labourer" means a person who is not an agricultural labourer but is primarily residing in the
affected area who does not hold any land under the affected area but who earns his/her livelihood principally by
manual labour or as a rural artisan immediately before such declaration and who has been deprived of earning
his/her livelihood principally by manual labour or as such artisan in the affected area.
"Non-title holder": Affected persons/families with no legal title to the land, structures and other assets adversely
affected by the project. Non-titleholders include encroachers, squatters, etc.
"Notification" means a notification published in the Gazette of India or, as the case may be the Gazette of a State.
"Project": Refers to the Dedicated Freight Corridor project (DFC project).
"Project Affected Persons (PAPs)": indicates any person being as it may an individual, a household, a firm or a
private or public who, on account of the execution of the project, or any of its components or sub-projects or parts
thereof would have their right, title or interest in any house, land or any other asset acquired or possessed, in full or
in part; or business, occupation, work, place of residence or habitat adversely affected; or standard of living
adversely affected, including the follows.
Rehabilitation (Income restoration/Livelihood restoration): means the process to restore income earning capacity,
production levels and living standards in a longer term.
Replacement cost/value: Replacement cost is the cost of purchasing comparable assets elsewhere by the affected
person in lieu of the acquired land, buildings, structures, and other immovable assets, etc.
Socio-economic survey: is carried out in order to prepare profile of PAPs and to prepare for Resettlement Action
Plan. The survey result is used (i) to assess incomes, identify productive activities, and plan for income restoration,
(ii) to develop relocation options, and (iii) to develop social preparation phase for vulnerable groups.
Small farmer – A cultivator with an un-irrigated land holding up to 2 hectares or with an irrigated land holding up to
1 hectare, but more than a marginal farmer.
Squatter – A person/family that has settled on the public land without permission or has been occupying public
building without authority prior to the cut-off date and is depending for his or her shelter or livelihood and has no
other source of shelter or livelihood.
"Tenants": are those persons having bonafide tenancy agreements, written or unwritten, with a private property
owner with clear property titles, to occupy a structure or land for residence, business or other purposes. They are
eligible for certain compensation or assistance as per the existing norms and practice.
"Title holder": A PAP/PAF who has legal title to land, structures and other assets in the affected zone.
"Vulnerable Group": defined as disabled, destitute, orphans, widows, unmarried girls, abandoned women or
persons above 50 years of age; who are not provided or cannot immediately be provided with alternative livelihood,
and who are not otherwise covered as part of a family.
"Wage-earner": Wage earners are those whose livelihood would be affected due to the displacement of the
employer.

330
I. Social Screening Checklist
Name of the CBO:
Project Location- District/ Cluster/
Taluka:
(Provide Latitude and Longitude
information as well along with
complete address)
Sub-project:
Proposed activities:
Extent of the land required for the
project in acres / hectares:
Details:
Land Use, Resettlement, and/or Land Acquisition
S.NO Components Yes No Detail
1. Does the project involve acquisition of private land?
2. Alienation of any type of Government land including that owned by PRI/ Urban Local Body?
3. Clearance of encroachment from Government/ Urban Local Body Land/ PRI Land?
4. Clearance of squatters/hawkers from Government/ Urban Local Body Land/ PRI Land?
5. Number of structures, both authorized and/or unauthorized to be acquired/ cleared?
6. Number of household to be displaced?
7. Details of village common properties to be alienated Pasture Land (acres) Cremation/ burial ground and others specify?
8. Describe existing land uses on and around the project area (e.g., community facilities, agriculture, tourism, private property)?
9. Will the project result in the permanent or temporary loss of the following? Specify with numbers Crops, Fruit trees / coconut palms, Petty Shops/ Kiosks, Vegetable / Fish / Meat vending, Cycle repair shop, Garage, Tea Stalls, Grazing Lands, etc.

331
10. Is the project likely to provide local employment opportunities, including employment opportunities for women?
11. Is the project being planned with sufficient attention to local poverty alleviation objectives?
12. Is the project being designed with sufficient local participation (including the participation of women) in the planning, design, and implementation process?
13. Population proposed to be benefitted by the proposed project
14. No. of Females proposed to be benefitted by the proposed project
15. Vulnerable households /population to be benefitted
16. No. of BPL Families to be benefitted
17. Are there socio-cultural groups present in or use the subproject area who may be considered as "tribes" (hill tribes, schedules tribes, tribal peoples), "minorities" (ethnic or national minorities), or "indigenous communities" in the subproject area?
a. Are there national or local laws or policies as well as anthropological researches/studies that consider these groups present in or using the subproject area as belonging to "ethnic minorities", scheduled tribes, tribal peoples, national minorities, or cultural communities?
b. Do such groups self-identify as being part of a distinct social and cultural group?
c. Do such groups maintain collective attachments to distinct habitats or ancestral territories and/or to the natural resources in these habitats and territories?
d. Do such groups maintain cultural, economic, social, and political institutions distinct from the dominant society and culture?
e. Do such groups speak a distinct language or dialect?
f. Have such groups been historically, socially and economically marginalized, disempowered, excluded, and/or discriminated against?
18. Are such groups represented as "Indigenous Peoples" or as "ethnic minorities" or "scheduled tribes" or "tribal populations" in any formal decision-making bodies at the national or local levels?
19. Will the subproject directly or indirectly benefit or target Indigenous Peoples?
20. Will the subproject directly or indirectly affect Indigenous Peoples' traditional socio-cultural and belief practices? (e.g., child-rearing, health, education, arts, and governance)?
21. Will the subproject affect the livelihood systems of Indigenous Peoples? (e.g., food production system, natural resource management, crafts and trade, employment status)?
22. Will the subproject be in an area (land or territory) occupied, owned, or used by Indigenous Peoples, and/or claimed as ancestral domain?
Verified and certified by safeguard specialist of the district
Name:
Designation:
Office:

332
Date:

333
J. Format for Recording Consultations
District: Village
Date: Time:
Venue: Duration:
1. Project Description
2. Issues raised by the community and responses provided
i. Issues
ii. Response by PIU/ PRI/ ULB
3. Key issues
i. ________________________________
ii. ________________________________

334
iii. __________________________________
4. Conclusion by PRI representatives
Suggested Content of Consultation sessions…
The meeting duration shall be for about 1-1/2 to 2 hours and shall cover the following.
All these steps of the consultation shall be recorded in the format
I. The session shall start with a description of the project by the PIU officials to the community. The following information shall be covered:
Overview of SMART and criteria for selection
Involvement of PRIs & communities in project planning, design and implementation
Expectations of the project from the beneficiaries, the communities
Provisions of the project as the Resettlement Framework provisions, mechanisms for voluntary land donation
process etc.
Census survey
Mechanisms for Grievances, implementation arrangements
Likely construction schedule
II. After the description of the project, suggestions from the community on the project and issues will be obtained
III. Responses to the issues raised will be provided by the PIU, PRI during the meeting. For issues that require a visit to the site or involves certain engineering decisions, or consultations with other Government agencies, a date shall be committed for response to the same. The response shall be given by the PIU to the PRI within the specified date.
IV. The PIU shall summarize the issues
V. Conclusion by the PRI representatives and attendance of the participants
On a separate sheet mark the attendance at the meeting in the following format
Community PIU/PRI

335
Name of Person and Village
of residence
Signature Name and Designation of
Official
Signature

336
K. Census & Socio-economic Survey
Questionnaire
Project Coordinator
Household Identification number
Plot no./Patta No./Khasra No.
Head of Household (Name)
Vulnerability tick,
whether belong to
SC ST Women
HH
Physically
challenged
BPL Other
If BPL, proof of BPL Ration Card Yes Card No.
NO
Household size (No. of persons)
No. of earning adult members (Nos)
No. of dependents (Nos) Adults
Children
Nature of impact (tick) Agriculture Residence Commercial Other
Agriculture <Marginal
Size of Total holding (ha) >Marginal
Extent of Impact ( percent total land
holding including any other land parcels
owned elsewhere by PAP)
<10
percent
>10
percent
=100
percent
Size of residual holding (ha)

337
Residence
Plot size (sqm)
Extent of impact (Full/Partial)
Impacted Area (sqm)
Residual plot viable (Yes/No) Yes NO
If No, Alternate house
site (if relocation reqd.)
Yes No If yes Specify
Commercial establishments
Plot size (sqm)
Extent of
impact (tick)
Full Partial
Impacted area (sqm.)
Commercial Plot viable
(tick)
Yes No
If No, Alternate
commercial site (if
relocation required)
Yes NO If yes, Specify
Asset Loss
Inventory assets lost (Trees, Wells, Handpump, CPRs,
etc.)
Livelihood Loss Yes No If yes, specify
Alternate livelihood sources, other than mentioned above

338
Annexure AA: Format for Census Survey
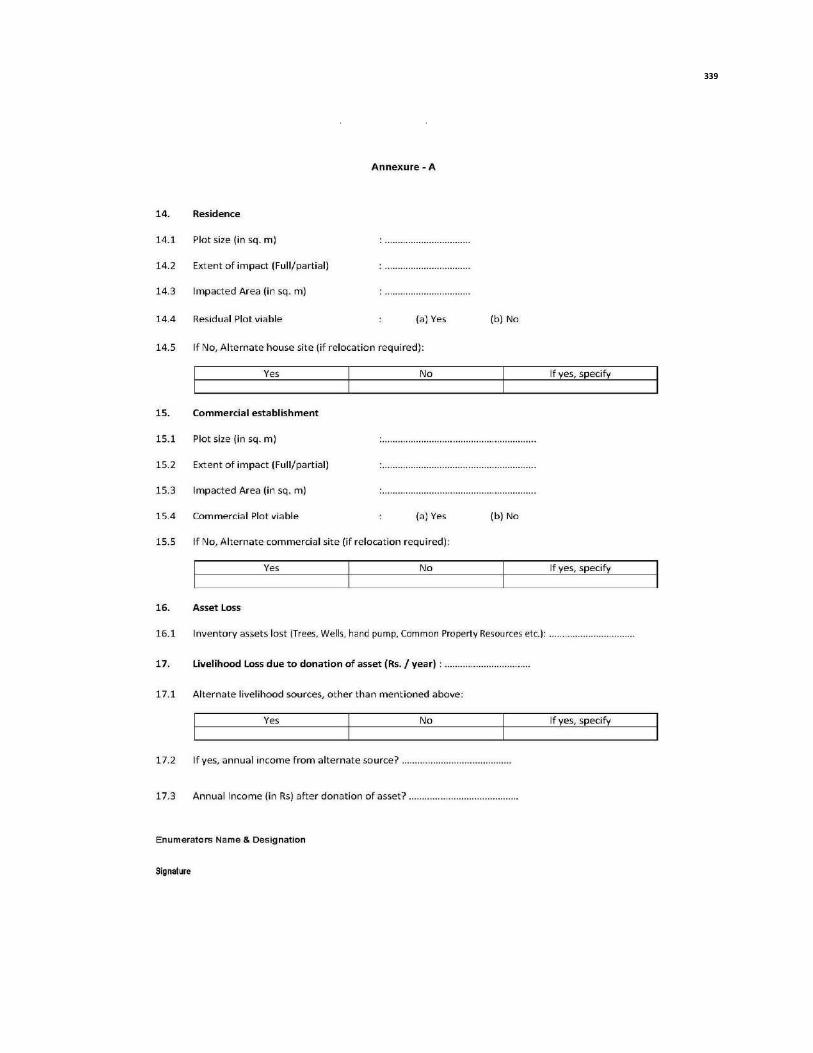
339

340 | Mott MacDonald Cambridge Education | Confidential (little long) | Ecology & Modelling Study into Deterioration of Shellfish Species. It looks like this if it goes more than one line
Job/Div/Sub/Rep/Rev 29 February 2016 File path footer
L. Sample MoU formats
Memorandum of Understanding (Land provided by Titleholder)
[for ------]
This memorandum of understanding is made on ________ day of ________ 20__ between Sri / Srimati
_____________________ resident of _______________________ (hereinafter referred to as the ‘First Party’)
and the Governor of (State) through Sri / Srimati ______________________ (designation, office address)
________________________ (hereinafter referred to as the ‘Second Party’)
These present witness as follows:
1. That the First Party is landowners with transferable right of _____________ acres of land bearing plot
numbers _______________ in village _________________ block _____________, tehsil ________________,
district _________________.
2. That the First Party has taken part in the consultation conducted by the Public Works Department,
Government of Maharashtra, under the requirements of the State of Maharashtra Agribusiness and Rural
Transformation Project (SMART) and has been made to understand the benefits of obtaining a road in the village
/ town under SMART.
3. That the First Party hereby grants to the Second Party, out of its free will, above said land for the construction
and development of SMART Project road in the village / town ____________ under ________________
Panchayat for the benefit of public at large.
4. That the first party would not claim any compensation in the above said grant of land.
5. That the second party agrees to accept the above grant of land for the purposes mentioned in clause 3.
6. That the second party shall develop and construct the Road and take all possible precautions to avoid damage
to land adjacent to SMART Project road.
7. That the first party also assures the second party that the first party will not indulge in wilful act of damaging
the road or obstructing the movement of public and vehicles on the road.
8. That both the Parties hereto agree that the road so constructed / developed / shall be public premises.
9. That the provisions of the Memorandum of Understanding will come into force and effect from the date of
signing of this deed.
IN WITNESS HEREOF, the parties hereto have signed this deed on the day and the year first above written:
Signature of the first party Signature for and behalf of the second party
Witnesses: Witnesses:
1 1
2 2
3 3
(Signature, name and address) (Signature, name and address)

341
Memorandum of Understanding (Non-Titleholder)
(Squatter / Encroacher)
[for roads]
This memorandum of understanding is made on ________ day of ________ 20__ between the persons listed below
on the one part (hereinafter collectively referred to as the ‘First Party’) and the Governor of (State) through Sri /
Srimati ______________________ (designation, office address) ________________________ (hereinafter referred
to as the ‘Second Party’)
These present witness as follows:
1. That the First Party is the squatter / encroacher of Government land of the respective acres (or other units as
applicable) of land as listed below in village _________________ block _____________, tehsil ________________,
district _________________.
2. That the First Party has consulted the Public Works Department, Government of Maharashtra, under the
requirements of the State of Maharashtra Agribusiness and Rural Transformation Project (SMART) and has been
made to understand the benefits of obtaining a road in the village under SMART.
3. That the First Party willingly leave their existing land as detailed in the list below for the construction and
development of SMART Project road in the village / town ____________ under ________________ Panchayat for
the benefit of public at large on which they had encroached / squatted on to the land of the second party
4. That the first party would not claim any compensation in return of leaving their encroached / squatted land.
5. That the second party agrees to clause 3.
6. That the second party shall develop and construct the Road and take all possible precautions to avoid damage to
land adjacent to SMART Project road.
7. That the first party also assures the second party that the first party will not indulge in wilful act of damaging the
road or obstructing the movement of public and vehicles on the road.
8. That both the Parties hereto agree that the road so constructed / developed shall be public premises.
9. That the provisions of the Memorandum of Understanding will come into force and effect from the date of signing
of this deed.
S. No. Name Area encroached / squatted in acres Description of land granted for SMART
(add as many more members who are giving up their claim on the above said land)

342
Memorandum of Understanding (Land & Buildings)
This memorandum of understanding is made on _______________ day of _____ 20__ between Sri/Srimati
_________________________________________ resident of _________________________________
(hereinafter referred to as “the First Party”) and the (Name of the FPO/CBO and Address) through Sri/Srimati
______________________________ (designation) __________________________________ (hereinafter referred
to as “the Second Party”).
THESE PRESENTS WITNESS AS FOLLOWS:
1. That the First Party is landowners with transferable right of _________________________ acres of land
bearing khasra Nos. __________ in village ___________________ block ___________________ revenue circle __
____________________ district _________________.
2. That the First Party has been consulted as per the requirements of the SMART and has been made to
understand the benefits of the obtaining land/building for ___________________________
(FPO/CBO/Market/Organization, etc.)
3. That the First Party grants the Second Party, out of its free will, above said land for the construction and
development of Land/Building in the Village/Town ________________________ under ______________________
Panchayat/Town for the benefit of the members of the
______________________(FPO/CBO/Market/Organization, etc.), and the public at large.
4. That the First Party would not claim any compensation against the above said grant of land.
5. That the Second Party agrees to accept the above grant of land for the purposes mentioned in clause 3.
6. That the Second Party shall develop land and the buildings and take all possible precautions to avoid damage
adjacent to ________________ (organization name) land/building.
7. That the First Party also assures the Second Party that the first party will not indulge in any willful act of
damaging the land / building of the ___________________ (organization) or obstructing the movement of public
and vehicle.
8. That both the parties hereto agree that _______________ (name of the organization) Land / Building so
developed / constructed shall be public premises.
9. That the provisions of the MEMORANDUM OF UNDERSTANDING will come into force and effect from the date
of signing of this deed.
IN WITNESS WHEREOF the Parties hereto have signed this deed on the day and the year first above written.
Signature of First Party Signature for and on behalf of the Second Party
Witness: Witness:
1.________________________ 1.______________________________
2._________________________ 2.______________________________
(Signature, name and address) (Signature, name and address)

343
M. Screening Checklist
Basic Information
Name of Project:
Village: Cluster: Block: District
Type of the Project: Total Area:
Name of Monitor‘s:
Name of Supervisor:
Section A: Project Siting
Will the Project : Yes No Specify/Remarks
1. Be located within or near environmentally sensitive areas like:
i. Forests (Protected / Reserve) ii. Wetlands iii. Threatened species iv. Special area for protecting biodiversity v. Cultural heritage site
2. Affect environmentally sensitive areas or critical habitats – wetlands, woodlots, natural forests, rivers, etc.)?
3. Affect the indigenous biodiversity (flora and fauna)?
4. Cause any loss or degradation of any natural habitats, either directly (through project works) or indirectly?
5. Affect the aesthetic quality of the landscape?
6. Cause soil erosion or degradation?
7. Have risk of deforestation?
8. Divert the water resource from its natural course /location?
9. Cause ecological degradation resulting from modification of non-agricultural lands to agricultural lands?
10. Reduce people‘s access to the pasture, water, public services or other resources they depend on?
SCREENING CHECKLIST – AGRICULTURE SECTOR
(NEW SUBPROJECTS)
STATE OF MAHARASHTRA AGRIBUSINESS AND RURAL TRANSFORMATION PROJECT

344
11. Cause any dislocation or involuntary resettlement of people?
12. Cause social problems due to land tenure and use conflicts?
13. Result in any type of human wildlife conflicts?
14. Affect the natural drainage of the area?
15. Be located in a site vulnerable to major natural or induced hazards such as:
i. Landslides ii. Flooding iii. Storm iv. Earthquakes
16. Have approach to roads and what is its quality?
17. Have suitable area for construction purposes?
Section B: Constructional Impacts (w.r.t Infrastructure requirements)
Will the Project cause: Yes No Specify/Remarks
1. Noise from construction?
2. Air pollution from the construction?
3. Water pollution from the constructional activities?
4. Soil contamination and degradation due to construction?
5. Risk and vulnerabilities related to occupational health and safety due to physical chemical and biological hazards during project construction and operation?
6. Large population influx during project construction and operation that cause increased burden on social infrastructure and services (such as water supply and sanitation systems)?
7. Social conflicts if workers from other regions are hired?
8. Any generation of construction and disposal wastes?
Section C: Potential Environmental Impacts
Will the Project cause: Yes No Specify/Remarks
1. Any type of accidental damage?
2. Downstream water pollution from discharge of contaminated water from the agricultural field with drain water?
3. Reduction of water supplies from competing uses (e.g., irrigation or domestic)?
4. Pollution in nearby aquatic environments from adequate farm management?
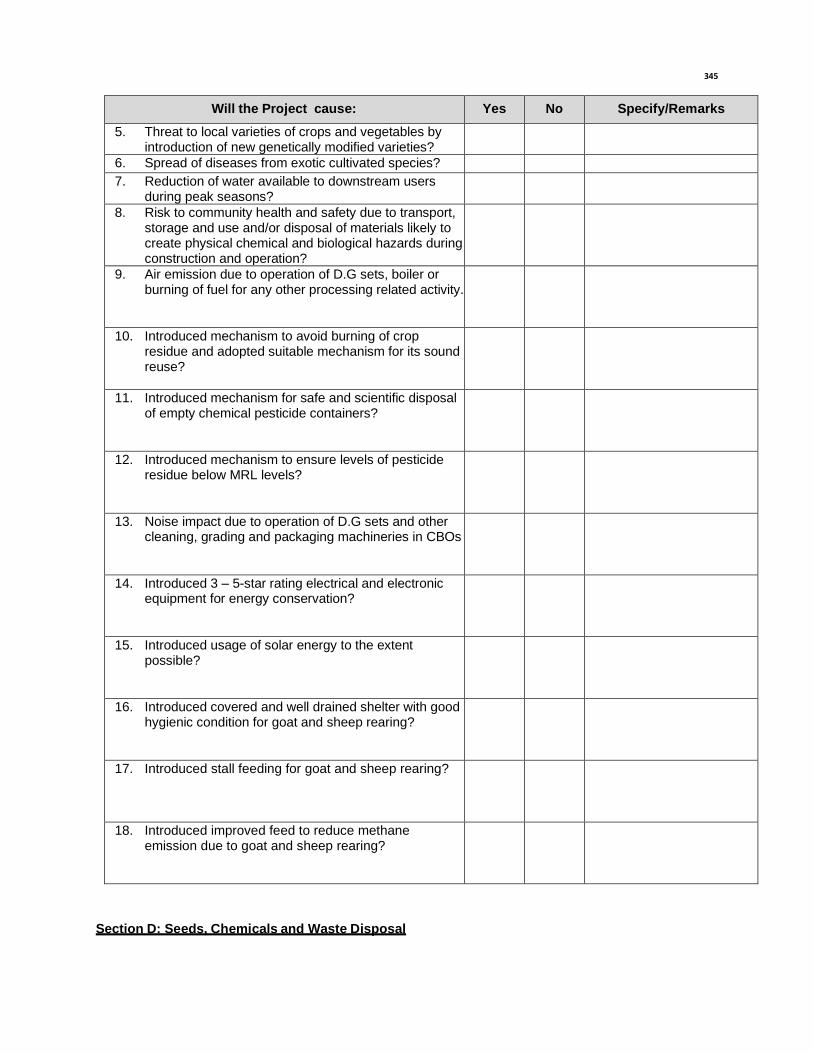
345
Will the Project cause: Yes No Specify/Remarks
5. Threat to local varieties of crops and vegetables by introduction of new genetically modified varieties?
6. Spread of diseases from exotic cultivated species?
7. Reduction of water available to downstream users during peak seasons?
8. Risk to community health and safety due to transport, storage and use and/or disposal of materials likely to create physical chemical and biological hazards during construction and operation?
9. Air emission due to operation of D.G sets, boiler or burning of fuel for any other processing related activity.
10. Introduced mechanism to avoid burning of crop residue and adopted suitable mechanism for its sound reuse?
11. Introduced mechanism for safe and scientific disposal of empty chemical pesticide containers?
12. Introduced mechanism to ensure levels of pesticide residue below MRL levels?
13. Noise impact due to operation of D.G sets and other cleaning, grading and packaging machineries in CBOs
14. Introduced 3 – 5-star rating electrical and electronic equipment for energy conservation?
15. Introduced usage of solar energy to the extent possible?
16. Introduced covered and well drained shelter with good hygienic condition for goat and sheep rearing?
17. Introduced stall feeding for goat and sheep rearing?
18. Introduced improved feed to reduce methane emission due to goat and sheep rearing?
Section D: Seeds, Chemicals and Waste Disposal

346
Will the Project : Yes No Specify/Remarks
1. Involve the use of chemicals/ fertilizers/pesticides, or increase existing use?
2. Cause contamination of water courses by chemicals/fertilizers/pesticides?
3. Cause contamination of soil by chemicals/fertilizers/ pesticides or affect soil salinity and alkalinity?
4. Require scheduled chemical application?
5. Introduce new varieties of seeds?
6. Experience effluent and /or emissions discharge?
7. Introduce waste management and disposal practices?
8. Introduce integrated pest management practices?
9. Introduced Soil Health Card to all the farmer members?

Mott MacDonald | Draft ESA and ESMF State of Maharashtra Agri-Business and Rural Transformation
408004 | 02 | 24 September 2019
347
Basic Information
Name of Project:
Village: Cluster: Block: District
Type of the Project: Total Area:
Name of Monitor‘s:
Name of Supervisor:
Section A: Project Siting
Will the Project : Yes No Specify/Remarks
1. Be located within or near environmentally sensitive areas like:
i. intact natural forests ii. wetlands iii. Threatened species
iv. Special area for protecting biodiversity v. Cultural heritage site?
2. Affect environmentally sensitive areas or critical habitats – wetlands, woodlots, natural forests, rivers, etc.)?
3. Affect the indigenous biodiversity (flora and fauna)?
4. Cause any loss or degradation of any natural habitats, either directly (through project works) or indirectly?
5. Affect the aesthetic quality of the landscape?
6. Cause soil erosion or degradation?
7. Have risk of deforestation?
8. Divert the water resource from its natural course / location?
9. Cause any dislocation or involuntary resettlement of people?
10. Cause social problems due to land tenure and use conflicts?
11. Affect the natural drainage of the area?
SCREENING CHECKLIST – ENTERPRISE SECTOR
STATE OF MAHARASHTRA AGRIBUSINESS AND RURAL TRANSFORMATION PROJECT

Mott MacDonald | Draft ESA and ESMF State of Maharashtra Agri-Business and Rural Transformation
408004 | 02 | 24 September 2019
348
Will the Project : Yes No Specify/Remarks
12. Be located in a site vulnerable to major natural or induced hazards such as:
i. Landslides ii. Flooding iii. Storm iv. Earthquakes
13. Have approach to roads and what is its quality?
14. Have suitable area for construction purposes?
Section B: Constructional Impacts(w.r.t Infrastructure requirements)
Will the Project cause: Yes No Specify/Remarks
1. Noise from construction?
2. Air pollution from the construction?
3. Water pollution from the constructional activities?
4. Soil contamination and degradation due to construction?
5. Risk and vulnerabilities related to occupational health and safety due to physical chemical and biological hazards during project construction and operation?
6. Large population influx during project construction and operation that cause increased burden on social infrastructure and services (such as water supply and sanitation systems)?
7. Social conflicts if workers from other regions are hired?
8. Any generation of construction and disposal wastes?
Section C: Potential Environmental Impacts
Will the Project cause: Yes No Specify/Remarks
1. Any type of accidental damage?
2. Downstream water pollution from discharge of contaminated water from the enterprise with drain water?
3. Reduction of water available to downstream users during peak seasons?
4. Risk to community health and safety due to transport, storage and use and/or disposal of materials likely to create physical chemical and biological hazards during construction and operation?

Mott MacDonald | Draft ESA and ESMF State of Maharashtra Agri-Business and Rural Transformation
408004 | 02 | 24 September 2019
349
5. Air emission due to operation of machineries such as D.G sets
6. Noise generation due to operation of machineries
7. Energy rating of the equipment used in the project? (equipment used much have a star rating of 3 to 5 star rating.)
8. Usage of solar energy and its extend in the project.
Section D: Chemicals and Waste Disposal
Will the Project : Yes No Specify/Remarks
1. Involve the use of chemicals/ preservatives, or increase existing use?
2. Cause contamination of water courses by chemicals/preservatives?
3. Cause contamination of soil by chemicals/ preservatives or affect soil salinity and alkalinity?
4. Experience effluent and /or emissions discharge?
5. Introduce waste management and disposal practices?
Section E: Compliance with IFC Performance Standard
Will the Project: Yes No Specify/Remarks
1. Does the Enterprise have mechanism for assessment and management of environmental and social risk and Impacts? (Policy, mechanism for identification of risk and impacts, management programs, emergency preparedness plan, monitoring and review, stakeholder engagement plan, external communication and grievance mechanism and reporting to the community)

Mott MacDonald | Draft ESA and ESMF State of Maharashtra Agri-Business and Rural Transformation
408004 | 02 | 24 September 2019
350
2. Does the Enterprise have mechanism for sound worker management relations ship? (Human Resource Policy for management of workers, working condition and terms of employment, permission for workers union, non-discrimination and equal opportunity, grievance mechanism, policy against child labor, bounded labor, occupational health and safety and efforts for its compliance with workers engaged by third party and supply chain.)
3. Does the Enterprise have mechanism or approach to resource efficiency and pollution prevention? (Mechanism to achieve resource efficiency, reduction in GHG emission, water conservation measures, waste minimization techniques, hazardous material management mechanism, pesticide use and its management)
4. Does the Enterprise have Mechanism to minimize risk and impacts to the community health? (Evaluate risk and impact to health and safety of affected community, good industrial practices, compliance with EHS guidelines, infrastructure and equipment design and safety, Hazardous material management and safety, community exposure to disease, principles of proportionality and good international practices while hiring security personnel.)
5. Does the Enterprise policy or guideline for land acquisition and involuntary resettlement? (Community engagement, resettlement and livelihood restoration planning and implementation)
6. Does the Enterprise has mechanism for biodiversity conservation and sustainable management of living natural resources?
7. Does the Enterprise have policy to address and involve Indigenous People? (Avoidance of adverse Impact, participation and consent, free prior and informed consent, mitigation and developmental benefits)
8. Does the Enterprise have mechanism for protection of cultural heritage sites and equitable sharing of benefits from the usage of cultural heritage? (protection of cultural heritage in project design and execution)

Mott MacDonald | Draft ESA and ESMF State of Maharashtra Agri-Business and Rural Transformation
408004 | 02 | 24 September 2019
351
N. Monitoring Format
N.1 Monitoring Format for CBOs
Name of CBO:
Address:
Contact
S. No Parameters Target Baseline
Scenario
Status as on
Previous
monitoring
Current Status Remarks
1 percent of Farmers having
Soil Health Card
2 percent of Farmers
received training for
Pesticide Usage, banned
pesticides, usage of PPE,
climate change impacts etc
3 percent of Farmers Using
Bio-pesticides
4 percent of Farmers
received training on proper
disposal of empty pesticide
containers
5 percent of Farmers
received training on back
yard Farming for goat and
sheep rearing for hygienic
practices, grazing practices
etc.
6 percent of Farmers making
alternative use of crop
residue or than burning.
7 percent of Farmers /
transporters using Bharat
Stage IV and above
compliant vehicles
8 percent of Farmers
received training on IPM

Mott MacDonald | Draft ESA and ESMF State of Maharashtra Agri-Business and Rural Transformation
408004 | 02 | 24 September 2019
352
9 Does the CBO have Food
Safety Testing Facility?
10 Does the CBO has 3 star or
above rating electrical and
electronic machineries?
11 Does the CBO follow
Guidelines on clearance
procedure for food and agri
imports to India?
N.2 Monitoring Format for Slaughter Houses
No.
Slaughter house Name
Good Industrial
Practice for Slaughter
House is part of Contract
Documents (Y/N)
EMP Being Implemented
(Y/N)
Status of
Implementation
(Excellent/
Satisfactory/Partially
Satisfactory/ Below
Satisfactory)
Action
Proposed and
Additional
Measures Required
N.3 Monitoring Format for Enterprises
Name of Enterprise:
Address:
Contact
S. No Parameters Target Baseline
Scenario
Status as on
Previous
monitoring
Current Status Remarks
1 Does the Enterprise have
Valid FSSAI License?

Mott MacDonald | Draft ESA and ESMF State of Maharashtra Agri-Business and Rural Transformation
408004 | 02 | 24 September 2019
353
2 Does the Enterprise have
a valid Consent from the
Pollution Control Board ?
3 Does the Enterprise have
License under Factory
Act?
4 Does the Enterprise
conduct regular
monitoring of Ambeint air
quality, effluent quality
and noise level?
5 Does the Enterprise have
arrangement for scientific
disposal of waste
generated?
6 Does the enterprise used
3 star or above rating
electronic equipment?
N.4 Monitoring Format for Market
No.
Name of Market
Does the
Market have arrangement
for management of
solid waste (Y/N)
Does the Market have air pollution
control arrangement for
D.G set (Y/N)
Status of
Implementation
(Excellent/
Satisfactory/Partially
Satisfactory/ Below
Satisfactory)
Action
Proposed and
Additional
Measures Required

Mott MacDonald | Draft ESA and ESMF State of Maharashtra Agri-Business and Rural Transformation
408004 | 02 | 24 September 2019
354
N.5 Construction Monitoring Format
No.
Subproject Name
EMP Part of Contract
Documents (Y/N)
EMP Being Implemented
(Y/N)
Status of
Implementation
(Excellent/
Satisfactory/Partially
Satisfactory/ Below
Satisfactory)
Action
Proposed
and
Additional
Measures Required

Mott MacDonald | Draft ESA and ESMF State of Maharashtra Agri-Business and Rural Transformation
408004 | 02 | 24 September 2019
355

Mott MacDonald | Draft ESA and ESMF State of Maharashtra Agri-Business and Rural Transformation
408004 | 02 | 24 September 2019
356
O. Template for Environmental Baseline
Database – Agricultural Value Chain
Template for SMART Project’s Environmental Baseline Database Requirement from the Agricultural Value Chain Subproject Partnership Plans
A. Production Stage
A.1. Basic Production Related Information for the Given Agricultural Commodity
(ies)
Sr No.
Enlist Name of the Agricultural Commodity (ies)
Production Through- Agrochemicals or Organic Method
Total Area under Production in Ha
Quantity Produced in Tons/Ha/Yr
Irrigation Type- Rain fed/Canal/
Drip/Sprinkler
Water Requirement for Irrigation in (litres/Ha or m3/Ha per Yr
1.
2.
3.
A.2. Maximum Residue Limit (MRL) Compliance for Export and Local Markets
For Agro-Chemicals Usage- Pesticides/Insecticides/Weedicides
To be Filled In By the CBOs/Enterprises To be Filled In By SMART Env. Expert
Sr No.
Name of the Agro-Chemical’s
Used
Name of the Target Pest(s)
and Frequency of Attack (Frequent-Annual/biennial or Rare)
Type- Pesticide/
Insecticide/Weedicide
Quantity Applied Solid- (kg/ha/yr)
Liquid (ml/ha/yr)
Price (INR/Kg) or
(INR/Litre)
MRL (Mg/Kg) Prescribed by FSSAI Regulation 2011
Actual
Above MRL
Below MRL
1.
2.
3.
Total
A. 3. For Fertilizers- Synthetic, Organic Fertilizer or Both (Represent Separately)

Mott MacDonald | Draft ESA and ESMF State of Maharashtra Agri-Business and Rural Transformation
408004 | 02 | 24 September 2019
357
Sr No.
Name of the Synthetic Agro /Organic Fertilizer
Type-
Synthetic or Organic Fertilizer
Quantity Applied
Solid (kg/ha/yr)
Liquid (ml/ha/yr)
Price
(INR/Kg) or
(INR/Litre)
Whether Soil Health Card (SHC)–Issued/Not-Issued
Whether Fertigation done as per SHC
1.
2.
3.
Total
A.4 For Pest Management and Training Need Assessment
Sr No.
Name of the Agri-Commodity (ies)
Number of IPM Demonstrations Done (if any)
Area in Ha Brought under IPM
Number of INM Demonstrations Done (if any)
Area in Ha Brought under INM
1.
2.
3.
A.5. Waste Production
Sr No.
Type of Waste Generated
Quantity Produced
(tons/ha/yr)
Is it Reused
on Field? (Yes/No)
Purpose of Reuse Disposal Method
Storage and
Cleaning
Field Applicati
on
Open Dumping/
Underground Burial
Collection by
Supplier/
CBOs
1. Biodegradable Waste – Plant Residue (stalks, bagasse, drops and pruning’s)
2. Non-Biodegradable Waste (Pesticide/Fertilizer Plastic Containers, Plastic Bags, Sheets)
Total
A. 6. Area brought under GLOBAL G.A.P. (Good Agriculture Practices) Certification
or INDGAP Certification whichever is applicable: ……………….. (Ha)

Mott MacDonald | Draft ESA and ESMF State of Maharashtra Agri-Business and Rural Transformation
408004 | 02 | 24 September 2019
358
B. Harvesting and Storage Stage- SMART Support for Equipment’s and
Technologies
Sr
No
Name of the Harvesting, Storage Activity and/or Operation Machinery
Name of the Machinery Used Ex: Thresher/Combined Harvester/DG Set/Cold Storage
Diesel/Petrol Consumed in (litres / ton of agri-produce)
Electricity Consumed in (kWh / ton of agri-produce)
Source of Electricity- Grid Supply/Solar/Co-generation (Within Unit)
1.
2.
C. Transportation Stage
Sr No.
Purpose of Transportation Mode of Transportation used- Truck/Van/
Tempo/Bullock Cart/Others
Average Distance Travelled in Kms per Trip
Type of Fuel-
Diesel/
Petrol
Quantity of Fuel Used in Litres/Km
Average price of the Fuel in INR/Litre
From To
1. Field Production
Aggregation Point
2. Aggregation Processing
3. Processing Trader/
Retailer
D. Processing Stage
Sr
No
Name of the Processing Activity- Ex: Cleaning/Boiling/Drying
Grading/Sorting or any Other (Pls name it)
Name of the Machinery Used
Diesel/Petrol/ furnace oil Consumed in litres / ton of agri-produce)
Electricity Consumed in (kWh / ton of agri-produce)
Source of Electricity- Grid Supply/Solar/Co-generation (Within Unit)
Quantity of Waste Produced in Processing Activities ( tons/ ton of agricultural produce)
Quantity of Waste Water Produced in Processing Activities (litres / ton of agricultural produce)
1.
2.

Mott MacDonald | Draft ESA and ESMF State of Maharashtra Agri-Business and Rural Transformation
408004 | 02 | 24 September 2019
359
P. Template for Environmental Baseline
Database – Animal Husbandry
Template for SMART Project’s Environmental Baseline Database Requirement
from the Animal Husbandry Subproject Partnership Plans
A. Production Stage
A.1. Basic Goat (Ruminant) Production Related Information
Sr No.
Ruminant Type
Name of the Goat Breeds
Total Nos. of Goat’s being Reared
Average Age of
Tradable Goat
Avg.
Area of Goat
Enclosure in m2
Type of Feeding Practices Type of Silage
Free Grazing
(FG)
Semi-Stall (SS)
Stall (S)
Grass and Forest Litter
Maize and
Cereal
1.
2.
A.2. Maximum Residue Limit (MRL) Compliance for Export and Local Markets
For Antibiotic and Steroid Usage
To be Filled In By the CBOs/Enterprises To be Filled In By Partner & SMART Env. Expert
Sr No.
Average Body Weight of the Tradable Goat
Name of the Veterinary Drugs Administered used (if any)
Used for Treatment of – Bacterial/Viral/ Endo-parasitic diseases/ Ecto-parasitic diseases, etc.
Quantity Administered
Tablet (mg/animal)
Liquid (ml/animal)
Meat Maximum Residue Level (Mg/Kg) Prescribed by APEDA/
WHO
Actual
Above MRL
Below MRL
1.
2.
A.3 For Good Production Practices- Training Need Assessment

Mott MacDonald | Draft ESA and ESMF State of Maharashtra Agri-Business and Rural Transformation
408004 | 02 | 24 September 2019
360
Sr No.
Goat Sheds/Housing Source of Water for Goat’s
Anti-mortem Inspection- Diseased Animal
Disposal of Carcass of the Diseased Animal and Disposal of dead foetus and placenta
Ventilated
or
Not-Ventilated
Water-Drained or
Not-Drained
Open- Ponds, Lakes, Rivers,
Quality Drinking Water in Goat Sheds
Separated from healthy one
Not Separated
Burial Burning
1.
2.
B. Slaughtering of Goat(s), Waste and Waste Water Generation and Treatment
Sr No.
Slaughter House License
Requirement- FSSAI as per Food Safety (License and
Registration of Food Business)
Regulations 2011
Licensed (L)
Non Licensed (NL)
Quantity of Abattoir Solid
Waste Generated in
tons/day
(animal bones, horns,
faeces, fat, trimmings,
paunch content, etc.)
Disposal Method of Abattoir Solid
Waste
Bio methanation (tons/day)
Composting (tons/day)
Rendering (tons/day)
Quantity of Abattoir Waste Water
Generated
(M3/day) or
(Litres/day)
Effluent Treatment
Plant (ETP)
Present (P)
Absent (A)
Quantity of Abattoir
Waste Water Treated in the
ETP
(M3/day)
or (Litres/day)
1.
2.
C. Processing- Post Slaughtering Stage
Sr
No
Name of the Processing Activity- Ex: Cleaning/
Freezing/
Packaging/Name any other activity in sequence
Which is the Gas Used in Refrigeration-
Chilling/
Freezing Unit
Diesel Consumed in D.G. Sets
(litres / ton of meat)
Electricity Consumed in Processing
(kWh / ton of meat)
Type of Meat Packing
Material Used- Carton, Boxes, Polybag
Quantity of Packing
Material Used (Kgs/Day)
or (Kgs/ ton of meat)
Method of disposal of Packing Waste
(Open dumping/
Collection by Municipality)
1.

Mott MacDonald | Draft ESA and ESMF State of Maharashtra Agri-Business and Rural Transformation
408004 | 02 | 24 September 2019
361
2.
D. Transportation Stage
Sr No.
Purpose of Transportation
Mode of Transportation used- Truck/Van/
Tempo/Ship/Flight and Is the Vehicle Disinfected (Yes/No)
Average Distance Travelled in Kms per Trip to the Nearest Market
Type of Fuel-
Diesel/Petrol/ Fuel Oil/Jet Fuel
Quantity of Fuel Used in Litres/Trip/Export to the Market/Trip
Average Local Price of the Fuel in INR/Litre
From To
1.
2.
3.
E. Quality Control and Development: Whether in-house lab and implementation of quality
assurance system such as Hazard Analysis and Critical Control Point (HACCP) and ISO is Present
(P)/Not Present (NP): . If Yes, then tons of Goat meat is brought under
quality control system for International (I)/Local (L) Market.

Mott MacDonald | Draft ESA and ESMF State of Maharashtra Agri-Business and Rural Transformation
408004 | 02 | 24 September 2019
362
Q. Maximum Residue Level Results
Sr.No
Commodity Pesticide
MRL (mg/kg)
Actual values (BMRL) Actual Values (AMRL) (mg /kg)
1 Jowar
KH
2,4-Dichloro phenoxy acetic acid
0.01 BLQ
Sum of benomyl & carbendazim expressed as carbndazim 0.5
BLQ
Carbaryl 1.5 BLQ
Carbendazim 0.1 BLQ
Carbofuran (sum of carbofuran & 3-hydroxy carbofuran expressed as carbofuran) 0.1
BLQ
Chlopyriphos 0.05 BLQ
Thiometon(Residues determined as thiometon its sulfoxide & sulphone expressed as thiometon) 0.03
BLQ
Trichlorfon 0.05 BLQ
Maximum Residue level
Ref - Food Safety Standards (contaminants ,toxins & residues ) Regulation 2011 & Pesticide Residue Testing laboratory Pune
Note - We have not mentioned the below MRL values ,(BLQ denotes for Below quantification level )we have only added the values which are exceeding the MRL levels.

Mott MacDonald | Draft ESA and ESMF State of Maharashtra Agri-Business and Rural Transformation
408004 | 02 | 24 September 2019
363
Sr.No
Commodity Pesticide
MRL (mg/kg)
Actual values (BMRL) Actual Values (AMRL) (mg /kg)
Deltamethrin (Decamethrin)2
BLQ
Dichlorvos (DDVP)(content of di-chloroacetaldehyde (D.C.A) be reported where possible ) 1
BLQ
Dithiocarbamates (the residue tolerance limit are determined & expressed as mg/CS2/kg & refer separately to the residues arising from any or each group of dithiocarbamates) 0.2
BLQ
Ethion (Residues to be determined as ethion & its oxygen analogue & expressed as ethion) 0.03
BLQ
Malathione (Malathione to be determined & expressed as combined residues of malathion & malaoxon) 4
BLQ
Monocrotophos 0.03 BLQ
Oxydemeton -Methyl 0.02 BLQ
Paraquat dichloride (Determined as paraquatcations) 0.03
BLQ
Phenthoate 0.05 BLQ
Phorate (sum of phorate ,its oxygen analogue & their sulphoxides & sulphones ,expressed as phorate) 0.05
BLQ
Pirimiphos -methyl 7 BLQ
Emamectin Benzoate 0.01
0.065
Denotefuron 0.01
0.29

Mott MacDonald | Draft ESA and ESMF State of Maharashtra Agri-Business and Rural Transformation
408004 | 02 | 24 September 2019
364
Sr.No
Commodity Pesticide
MRL (mg/kg)
Actual values (BMRL) Actual Values (AMRL) (mg /kg)
Buprofezin 0.01
0.036
Imidaloprid 0.01
0.024
2 Jowar
Rb
2,4-Dichloro phenoxy acetic acid 0.01
BLQ
Sum of benomyl & carbendazim expressed as carbndazim 0.5
BLQ
Carbaryl 1.5
BLQ
Carbendazim 0.1
BLQ
Carbofuran (sum of carbofuran & 3-hydroxy carbofuran expressed as carbofuran) 0.1
BLQ
Chlopyriphos 0.05
BLQ
Thiometon(Residues determined as thiometon its sulfoxide & sulphone expressed as thiometon) 0.03
BLQ
Trichlorfon 0.05
BLQ
Deltamethrin (Decamethrin)2
BLQ
Dichlorvos (DDVP)(content of di-chloroacetaldehyde (D.C.A) be reported where possible ) 1
BLQ
Dithiocarbamates (the residue tolerance limit are determined & expressed as mg/CS2/kg & refer separately to the residues arising from any or each group of dithiocarbamates) 0.2
BLQ

Mott MacDonald | Draft ESA and ESMF State of Maharashtra Agri-Business and Rural Transformation
408004 | 02 | 24 September 2019
365
Sr.No
Commodity Pesticide
MRL (mg/kg)
Actual values (BMRL) Actual Values (AMRL) (mg /kg)
Ethion (Residues to be determined as ethion & its oxygen analogue & expressed as ethion) 0.03
BLQ
Malathione (Malathione to be determined & expressed as combined residues of malathion & malaoxon) 4
BLQ
Monocrotophos 0.03
BLQ
Oxydemeton -Methyl 0.02
BLQ
Paraquat dichloride (Determined as paraquatcations) 0.03
BLQ
Phenthoate 0.05
BLQ
Phorate (sum of phorate ,its oxygen analogue & their sulphoxides & sulphones ,expressed as phorate) 0.05
BLQ
Pirimiphos -methyl 7
BLQ
3 Wheat
2,4-Dichloro phenoxy acetic acid 0.01
BLQ
Azoxystrobin 0.2 BLQ
Bitertanol 0.05
BLQ
Carbaryl 2
BLQ
Carbendazim 0.05
BLQ
Carfentrazone Ethyl 0.01
BLQ
Chlorimuron Ethyl 0.05
BLQ

Mott MacDonald | Draft ESA and ESMF State of Maharashtra Agri-Business and Rural Transformation
408004 | 02 | 24 September 2019
366
Sr.No
Commodity Pesticide
MRL (mg/kg)
Actual values (BMRL) Actual Values (AMRL) (mg /kg)
Chlorpyriphos 0.5
BLQ
Cypermethrin (sum of isomers)(Fat soluble residue) 2
BLQ
Deltamethrin (Decamethrin) 2
BLQ
Dichlorvos (DDVP)(content of dichlroacetaldehyde (D.C.A.)be reported where possible) 7
BLQ
Diclofop (sumdiclofop-methyl & diclofop acid expressed as diclofop-methyl) 0.1
BLQ
Difenoconazole 0.02
BLQ
Dithiocarbamates 1
BLQ
Epoxyconazole 0.01*
BLQ
Fenoxaprop-p-ethyl 0.02
BLQ
Fipronil 0.01*
BLQ
Iodosulfuron Methyl sodium 0.01
BLQ
Isoproturon 0.1
BLQ
Keroxim Methyl 0.05*
BLQ
Malathion (malathion to be determined & expressed as combined residues of malathion & malaoxon) 10
BLQ
Mesosulfuron Methyl 0.01
BLQ
Methabenzthiazuron 0.5
BLQ
Methyl Chlorophenoxy Acetic acid (MCPA) 0.2
BLQ
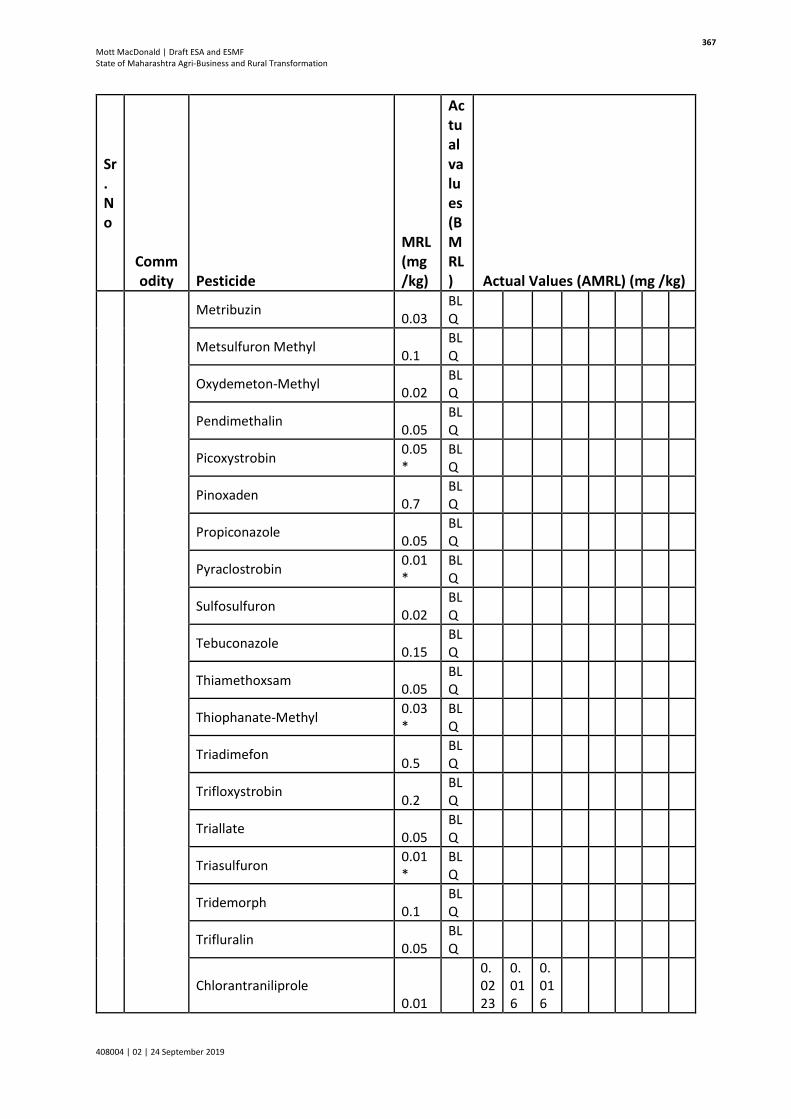
Mott MacDonald | Draft ESA and ESMF State of Maharashtra Agri-Business and Rural Transformation
408004 | 02 | 24 September 2019
367
Sr.No
Commodity Pesticide
MRL (mg/kg)
Actual values (BMRL) Actual Values (AMRL) (mg /kg)
Metribuzin 0.03
BLQ
Metsulfuron Methyl 0.1
BLQ
Oxydemeton-Methyl 0.02
BLQ
Pendimethalin 0.05
BLQ
Picoxystrobin 0.05*
BLQ
Pinoxaden 0.7
BLQ
Propiconazole 0.05
BLQ
Pyraclostrobin 0.01*
BLQ
Sulfosulfuron 0.02
BLQ
Tebuconazole 0.15
BLQ
Thiamethoxsam 0.05
BLQ
Thiophanate-Methyl 0.03*
BLQ
Triadimefon 0.5
BLQ
Trifloxystrobin 0.2
BLQ
Triallate 0.05
BLQ
Triasulfuron 0.01*
BLQ
Tridemorph 0.1
BLQ
Trifluralin 0.05
BLQ
Chlorantraniliprole 0.01
0.0223
0.016
0.016

Mott MacDonald | Draft ESA and ESMF State of Maharashtra Agri-Business and Rural Transformation
408004 | 02 | 24 September 2019
368
Sr.No
Commodity Pesticide
MRL (mg/kg)
Actual values (BMRL) Actual Values (AMRL) (mg /kg)
Emamectin Benzoate 0.01
0.052
0.019
Buprofezin 0.01
0.012
4 Bajra
2,4-Dichloro phenoxy acetic acid 2
BLQ
Sum of benomyl & carbendazim expressed as carbndazim 0.5
BLQ
Carbaryl 1.5
BLQ
Carbendazim 0.1
BLQ
Carbofuran (sum of carbofuran & 3-hydroxy carbofuran expressed as carbofuran) 0.1
BLQ
Chlopyriphos 0.05
BLQ
Thiometon(Residues determined as thiometon its sulfoxide & sulphone expressed as thiometon) 0.03
BLQ
Trichlorfon 0.05
BLQ
Deltamethrin (Decamethrin)2
BLQ
Dichlorvos (DDVP)(content of di-chloroacetaldehyde (D.C.A) be reported where possible ) 1
BLQ
Dithiocarbamates (the residue tolerance limit are determined & expressed as mg/CS2/kg & refer separately to the residues arising from any or each group of dithiocarbamates) 0.2
BLQ

Mott MacDonald | Draft ESA and ESMF State of Maharashtra Agri-Business and Rural Transformation
408004 | 02 | 24 September 2019
369
Sr.No
Commodity Pesticide
MRL (mg/kg)
Actual values (BMRL) Actual Values (AMRL) (mg /kg)
Ethion (Residues to be determined as ethion & its oxygen analogue & expressed as ethion) 0.03
BLQ
Spinosad 0.01
0.029
Imidacloprid 0.01
0.0104
Lufenuron 0.01
0.013
Metribuzin 0.01
0.0179
Chlorantraniliprole 0.01
0.197
5 Rice
Malathione (Malathione to be determined & expressed as combined residues of malathion & malaoxon) 4
BLQ
Monocrotophos 0.03
BLQ
Oxydemeton -Methyl 0.02
BLQ
Paraquat dichloride (Determined as paraquatcations) 0.03
BLQ
Phenthoate 0.05
BLQ
Phorate (sum of phorate ,its oxygen analogue & their sulphoxides & sulphones ,expressed as phorate) 0.05
BLQ
Pirimiphos -methyl 7
BLQ

Mott MacDonald | Draft ESA and ESMF State of Maharashtra Agri-Business and Rural Transformation
408004 | 02 | 24 September 2019
370
Sr.No
Commodity Pesticide
MRL (mg/kg)
Actual values (BMRL) Actual Values (AMRL) (mg /kg)
Bensulfuron Methyl 0.01 BLQ
Bifethrin 0.05 BLQ
Bispyribac Sodium 0.05 BLQ
Buprofezin 0.05 BLQ
Butachlor 0.05 BLQ
Captan 0.3 BLQ
Carbaryl 2.5 BLQ
Carbendazim 2 BLQ
Carbosulfan 0.2 BLQ
Carfentrazone Ethyl 0.1 BLQ
Carproamid 1 BLQ
Cartap hydrochloride 0.5 BLQ
Chlorantraniliprole 0.4 BLQ
Chlorimuron Ethyl 0.01 BLQ
Chlothianidin (Chlothianidin & its metabolites Thiazolmethylguanidine (TMG), Thiazomethylurea(TZMU),Methylnitroguanidine (MNG)TNG) 0.5
BLQ
Chromafenozide 0.03 BLQ
Cinmethylene 0.05 BLQ
Clomazone 0.01 BLQ

Mott MacDonald | Draft ESA and ESMF State of Maharashtra Agri-Business and Rural Transformation
408004 | 02 | 24 September 2019
371
Sr.No
Commodity Pesticide
MRL (mg/kg)
Actual values (BMRL) Actual Values (AMRL) (mg /kg)
Copper Hydroxide (copper determined as elemental copper) $
BLQ
Cypermethrin (sum of isomers)(fat soluble residue) 2
BLQ
Deltamethrin (Decamethrin) 2 BLQ
Difenoconazole 0.01 BLQ
Dinotefuran 8 BLQ
Edifenphos 0.02 BLQ
Epoxyconazole 0.05 BLQ
Ethofenprox 0.01 BLQ
Ethoxysulphuron 0.01 BLQ
Fenobucarb(BMPC) 0.01 BLQ
Fenpropathrin 0.03*
BLQ
Fipronil 0.01 BLQ
Flonicamid 0.05*
BLQ
Flubendiamide 0.1 BLQ
Flufenacet 0.05 BLQ
Flusilazole 0.01 BLQ
Glyphosate 0.01 BLQ
Hexaconazole 0.02 BLQ
Imidacloprid 0.05 BLQ

Mott MacDonald | Draft ESA and ESMF State of Maharashtra Agri-Business and Rural Transformation
408004 | 02 | 24 September 2019
372
Sr.No
Commodity Pesticide
MRL (mg/kg)
Actual values (BMRL) Actual Values (AMRL) (mg /kg)
Idoxacarb 0.05 BLQ
Iprobenfos 0.2 BLQ
Iprodione 10 BLQ
Isoprothiolane 10 BLQ
Kasugamycin 0.05 BLQ
Lambda cyhalothrin 1 BLQ
Methyl chlophenoxy acetic acid (MCPA) 0.05
BLQ
Methyl parathion (combined residues of methyl parathion &its oxygen analogue to be dertermined & expressed as methyl parathione) 0.01
BLQ
Metsulphuron methyl 0.01 BLQ
Oxadiazon 0.03 BLQ
Oxyfluorfen 0.05 BLQ
Pencycuron 0.01 BLQ
Pendimethalin 0.05 BLQ
Penoxusum 0.1* BLQ
Picoxystrobin 0.05*
BLQ
Pretilachor 0.05 BLQ
Pirimiphos-methyl 0.5 BLQ
Propiconazole 0.05 BLQ

Mott MacDonald | Draft ESA and ESMF State of Maharashtra Agri-Business and Rural Transformation
408004 | 02 | 24 September 2019
373
Sr.No
Commodity Pesticide
MRL (mg/kg)
Actual values (BMRL) Actual Values (AMRL) (mg /kg)
Propineb 0.05 BLQ
Pyraclostrobin 0.02*
BLQ
Pyrazosulfuron Ethyl 0.01 BLQ
Pymetrozine 0.01*
BLQ
Quinalphos 0.01 BLQ
Tebuconazole 1.5 BLQ
Thiocloprid 0.02 BLQ
Thifluzamide 0.05 BLQ
Thiamethoxam 0.02 BLQ
Tricyclazole 3 BLQ
Validamycin 0.01 BLQ
Propanil 0.05*
BLQ
Thiocyclam Hydrogen Oxalate 0.01*
BLQ
Bentazone 0.05*
BLQ
Flucetosulphuron 0.02*
BLQ
Fluxapyroxad 5 BLQ
Sulfoxaflor 0.01*
BLQ
6 Other millets Carbaryl 0.01
BLQ

Mott MacDonald | Draft ESA and ESMF State of Maharashtra Agri-Business and Rural Transformation
408004 | 02 | 24 September 2019
374
Sr.No
Commodity Pesticide
MRL (mg/kg)
Actual values (BMRL) Actual Values (AMRL) (mg /kg)
7 Red
Gram
Benfuracarb 0.05 BLQ
Deltamethrin (Decamethrin) 0.01 BLQ
Lambda cyhalothrin 0.05 BLQ
Pendimethalin 0.05*
BLQ
Spinosad 0.01 BLQ
Thiodicarb 0.05 BLQ
Chlorantranilipro 0.01
0.178
Metribuzin 0.01
0.0117
8 Green Gram Dithianon (Metiram as CS2)
0.05*
BLQ
9 Black gram
Captan 0.01*
BLQ
Chlorantraniliprole 0.03*
BLQ
Dithianon (Metiram as CS2) 0.05*
BLQ
Fenoxaprop-p-ethyl 0.01 BLQ
Flubendiamide 1 BLQ
Hexaconazole 0.01*
BLQ
Lefenuron 0.02*
BLQ

Mott MacDonald | Draft ESA and ESMF State of Maharashtra Agri-Business and Rural Transformation
408004 | 02 | 24 September 2019
375
Sr.No
Commodity Pesticide
MRL (mg/kg)
Actual values (BMRL) Actual Values (AMRL) (mg /kg)
Methyl parathion (combined residues of methyl parathion & its oxygen analogue to be determined & expressed as methyl parathion) 0.01
BLQ
Propaquizafop 0.01 BLQ
Pyraclostrobin 0.02*
BLQ
Quizalofop ethyl 0.01*
BLQ
Tebuconazole 0.01*
BLQ
Thiodicarb 0.03 BLQ
10 Gram
11
Cotton
Chlorantraniliprole 0.3 BLQ
Pyraclostrobin 0.02*
BLQ
Carbendazim 0.01
0.018
12
Soyabean
Alachor 0.1 BLQ
Beta Cyfluthrin 0.03 BLQ
Clodinafop-propargyl 0.05*
BLQ
Diclosulam 0.05*
BLQ
Epoxyconazole 0.05*
BLQ
Fluazifop-p-butyl 0.05 BLQ

Mott MacDonald | Draft ESA and ESMF State of Maharashtra Agri-Business and Rural Transformation
408004 | 02 | 24 September 2019
376
Sr.No
Commodity Pesticide
MRL (mg/kg)
Actual values (BMRL) Actual Values (AMRL) (mg /kg)
Flubendiamide 0.07 BLQ
Fluchloralin 0.05 BLQ
Hexaconazole 0.002
BLQ
Imazethapyr 0.03 BLQ
Imidacloprid 3 BLQ
Indoxacarb 0.5 BLQ
Kresoxim Methyl 0.02*
BLQ
Lambda cyhalothrin 0.01 BLQ
Methomyl 0.2 BLQ
Permethrin 0.05 BLQ
Picoxystrobin 0.05*
BLQ
Profenofos 0.01*
BLQ
Quinalphos 0.05 BLQ
Sodium Aceflourofen 0.05*
BLQ
Tebuconazole 0.15 BLQ
Thiamethoxam 0.05*
BLQ
Triadimefon 0.02*
BLQ
Fomesafen 0.02*
BLQ
Spinetoram & its metabolites (Spinosyn -J & Spinosyn -L) 0.02
BLQ

Mott MacDonald | Draft ESA and ESMF State of Maharashtra Agri-Business and Rural Transformation
408004 | 02 | 24 September 2019
377
Sr.No
Commodity Pesticide
MRL (mg/kg)
Actual values (BMRL) Actual Values (AMRL) (mg /kg)
Bentazone 0.05*
BLQ
Haloxyfop-R Methyl 2 BLQ
Sulfentrazone & its metabolite Desmethylsulfentrazone & 3-hydroxymethylsulfentrazone 0.2
BLQ
13
Mango
Alpha Napthyl Acetic Acid 0.05 BLQ
Azoxystrobin 0.7 BLQ
Sum of benomyl & carbendazim expressed as carbendazim 2
BLQ
Buprofezin 0.1 BLQ
Carbendazim 5 BLQ
Deltamethrin (Decamethrin) 0.01 BLQ
Dinocap 0.1 BLQ
Mancozeb 2 BLQ
Ethephon 2 BLQ
Hexaconazole 0.02 BLQ
Imidacloprid 0.2 BLQ
Lambda cyhalothrin 0.2 BLQ
Paclobutrazol 0.01 BLQ
Penconazole 0.05 BLQ
Tebuconazole 0.2 BLQ

Mott MacDonald | Draft ESA and ESMF State of Maharashtra Agri-Business and Rural Transformation
408004 | 02 | 24 September 2019
378
Sr.No
Commodity Pesticide
MRL (mg/kg)
Actual values (BMRL) Actual Values (AMRL) (mg /kg)
Thiamethoxam 0.2 BLQ
Triadimefon 0.03*
BLQ
Trifloxystrobin 0.4 BLQ
Tridemorph 0.05 BLQ
Emammectic Benzoate 0.01 x 0.97
14
Cashewnut
BLQ
15
Grapes
Alpha Napthyl Acetic Acid 0.05 BLQ
Ametroctradin 6 BLQ
Azoxystrobin 2 BLQ
Buprofezin 1 /0.01
0.0337
Carbendazim 3 BLQ
Chlormequat Chloride (CCC) 0.05*
BLQ
Copper Hydroxide $ BLQ
Copper Sulphate $ BLQ
Cuprous Oxide $ BLQ
Cyantranilipole 0.01 BLQ
Cyazofamid 1 BLQ
Cymoxanil 0.1 BLQ

Mott MacDonald | Draft ESA and ESMF State of Maharashtra Agri-Business and Rural Transformation
408004 | 02 | 24 September 2019
379
Sr.No
Commodity Pesticide
MRL (mg/kg)
Actual values (BMRL) Actual Values (AMRL) (mg /kg)
Difenoconazole 3 BLQ
Dimethomorph 2 BLQ
Mancozeb 5 BLQ
Metiram as CS2 5 BLQ
Diuron 1 BLQ
Famoxadone 2 BLQ
Fenamidone 0.6 BLQ
Fipronil 0.01*
BLQ
Flusilazole 0.05 BLQ
Forchlorfenuron 0.01 BLQ
Fosetyl-Al 10 BLQ
Hydrogen Cyanamide 0.01 BLQ
Imidacloprid 1 BLQ
Iprodione 10 BLQ
Lambda cyhalothrin 0.05 BLQ
Mandipropamid 2 BLQ
Metalaxyl-M 1 BLQ
Methomyl 0.3 BLQ
Myclobutanil 1 BLQ

Mott MacDonald | Draft ESA and ESMF State of Maharashtra Agri-Business and Rural Transformation
408004 | 02 | 24 September 2019
380
Sr.No
Commodity Pesticide
MRL (mg/kg)
Actual values (BMRL) Actual Values (AMRL) (mg /kg)
Penconazole 0.4 BLQ
Picoxystrobin 0.05*
BLQ
Propineb 0.5 BLQ
Pyraclostrobin 2 BLQ
Tebuconazole 6 /0.01
0.0208
Thiophanate-Methyl 3 BLQ
Triadimefon 2 BLQ
Trifloxystrobin 3 BLQ
Tridemorph 0.5 BLQ
Fluopicolide 2 BLQ
Fluopyram and its metabolites 2 BLQ
Boscalid 5 BLQ
Metrafenone 5 BLQ
Fluxapyroxad 3 BLQ
Abamectin 0.05*
BLQ
Hexaconazole 0.1 BLQ
Iprovalicarb 0.01
0.0539
0.0511
0.0127
Myclobutanil 0.01
0.0436
0.0746

Mott MacDonald | Draft ESA and ESMF State of Maharashtra Agri-Business and Rural Transformation
408004 | 02 | 24 September 2019
381
Sr.No
Commodity Pesticide
MRL (mg/kg)
Actual values (BMRL) Actual Values (AMRL) (mg /kg)
16
Pomegranates
Difenoconazole 0.8
0.011
0.0149
Metiram as CS2 0.05*
BLQ
Ethephon 0.05 BLQ
Propineb 0.5 BLQ
Pyraclostrobin 0.02*
BLQ
Carbendazim 0.01
0.091
0.011
0.021
0.111
0.044
0.062
0.234
0.318
Tebuconazole 0.01
0.107
Azoxystrobin 0.1
0.016
0.108
0.05
Cyfluthrin 0.01 0.71
0.28
Benfluralin 0.01
0.011
Fenpropanthrin 0.01
0.015
Lambda Cyhalothrin 0.01
0.012
0.02
Hexaconazole 0.01
0.014
0.0155
Deltamethrin 0.01 0.12

Mott MacDonald | Draft ESA and ESMF State of Maharashtra Agri-Business and Rural Transformation
408004 | 02 | 24 September 2019
382
Sr.No
Commodity Pesticide
MRL (mg/kg)
Actual values (BMRL) Actual Values (AMRL) (mg /kg)
Enamectin Benzoate 0.01
0.0128
0.0122
Thiophanate methyl 0.01
0.429
0.463
Imidacloprid 0.01
0.0149
17
Custard Apple
18
Banana
Sum of benomyl and carbendazim expressed as carbendazim 1
BLQ
Carbendazim 1 BLQ
Metiram as CS2 2 BLQ
Diuron 0.1 BLQ
Pyraclostrobin 0.02*
BLQ
Trifloxystobin 0.1 BLQ
Tebuconazole 1.5 BLQ
BLQ
19
Papaya Copper Sulphate $
BLQ
Thiophanate-Methyl 7 BLQ
BLQ
20
Sweetlime
Carbendazim 0.01
0.142

Mott MacDonald | Draft ESA and ESMF State of Maharashtra Agri-Business and Rural Transformation
408004 | 02 | 24 September 2019
383
Sr.No
Commodity Pesticide
MRL (mg/kg)
Actual values (BMRL) Actual Values (AMRL) (mg /kg)
Profenophos 0.01
0.0266
21
Orange (Citrus)
Carbaryl 15 BLQ
Cuprous Oxide $ BLQ
Cymoxanil 0.05*
BLQ
Diafenthiuron 0.2 BLQ
Mancozeb 0.05*
BLQ
Diuron 1 BLQ
Imidacloprid 1 BLQ
Copper Sulphate $ BLQ
Phosalone 1 BLQ
Quinalphos 0.05 BLQ
Monocrotophos 0.2 BLQ
Azoxystrobin 0.01
0.265
Dimethomorph 0.01
0.103
0.163
Carbendazim 0.01
0.129
22
Sapota Benomyl 0.01
0.044

Mott MacDonald | Draft ESA and ESMF State of Maharashtra Agri-Business and Rural Transformation
408004 | 02 | 24 September 2019
384
Sr.No
Commodity Pesticide
MRL (mg/kg)
Actual values (BMRL) Actual Values (AMRL) (mg /kg)
Carbandezim 0.01
0.047
23
Guava
Copper Sulphate $ BLQ
Chlorantraniliprole 0.01
0.243
Enamectin Benzoate 0.01
0.056
24
Tomato
Alpha naphthyl Acetic Acid 0.1 BLQ
Ametroctradin 0.3 BLQ
Azoxystrobin 1 BLQ
Chlorantraniliprole 0.6 BLQ
Cyantranilipole 0.5 BLQ
Cyazofamid 0.01*
BLQ
Cymoxanil 0.01*
BLQ
Deltamethrin (Decamethrin) 0.3 BLQ
Difenoconazole 0.2 BLQ
Dimethomorph 0.2 BLQ
Metiram as CS2 5 BLQ
Ethephon 2 BLQ
Famoxadone 2 BLQ

Mott MacDonald | Draft ESA and ESMF State of Maharashtra Agri-Business and Rural Transformation
408004 | 02 | 24 September 2019
385
Sr.No
Commodity Pesticide
MRL (mg/kg)
Actual values (BMRL) Actual Values (AMRL) (mg /kg)
Fenamidone 1.5 BLQ
Fenazaquin 0.01 BLQ
Flubendiamide 2 BLQ
Imidacloprid 1 BLQ
Indoxacarb 0.5 BLQ
Iprodione 5 BLQ
Kasugamycin 0.05 BLQ
Lambda cyhalothrin 0.1 BLQ
Mandipropamid 0.3 BLQ
Metalaxyl-M 0.5 BLQ
Methomyl 1 BLQ
Metribuzin 0.05*
BLQ
Novaluron 0.01 BLQ
Propineb 1 BLQ
Pyraclostrobin 0.3 BLQ
Spiromesifen 0.7 BLQ
Tebuconazole 2 BLQ
Thiamethoxam 0.7 BLQ
Trifloxystrobin 1 BLQ

Mott MacDonald | Draft ESA and ESMF State of Maharashtra Agri-Business and Rural Transformation
408004 | 02 | 24 September 2019
386
Sr.No
Commodity Pesticide
MRL (mg/kg)
Actual values (BMRL) Actual Values (AMRL) (mg /kg)
Sodium Para Nitro Phenolate 0.3 BLQ
Emamectin Benzoate 0.01
0.533
25
Potato
2,4-Dichlorophenoxy Acetic Acid 0.2
BLQ
Ametroctradin 0.05 BLQ
Azoxystrobin 7 BLQ
Carbaryl 0.2 BLQ
Carbendazim 0.01*
BLQ
Chlormequat Chloride (CCC) 0.1 BLQ
Chlorothalonil 0.1 BLQ
Chlorpropham 30 BLQ
Chlorpyriphos 2 BLQ
Copper Hydroxide $ BLQ
Copper Oxychloride $ BLQ
Cuprous Oxide $ BLQ
Cyazofamid 0.02*
BLQ
Cymoxanil 0.01 BLQ
Dimethomorph 0.05 BLQ
Dithiocarbamates 0.2 BLQ

Mott MacDonald | Draft ESA and ESMF State of Maharashtra Agri-Business and Rural Transformation
408004 | 02 | 24 September 2019
387
Sr.No
Commodity Pesticide
MRL (mg/kg)
Actual values (BMRL) Actual Values (AMRL) (mg /kg)
Metiram as CS2 0.2 BLQ
Famoxadone 0.05 BLQ
Fenamidone 0.02 BLQ
Hexaconazole 0.02 BLQ
Kresoxim Methyl 0.02*
BLQ
Mandipropamid 0.05*
BLQ
Mepiquat Chloride 0.1 BLQ
Metalaxyl-M 0.05*
BLQ
Metribuzin 0.05*
BLQ
Oxyfluorfen 0.01 BLQ
Paraquat dichloride 0.2 BLQ
Phosalone 0.1 BLQ
Propineb 0.5 BLQ
Pyraclostrobin 0.05*
BLQ
Thiamethoxam 0.3 BLQ
Thiometon 0.05 BLQ
BLQ
26
Onion Azoxystrobin 0.05
BLQ
Mancozeb 4 BLQ

Mott MacDonald | Draft ESA and ESMF State of Maharashtra Agri-Business and Rural Transformation
408004 | 02 | 24 September 2019
388
Sr.No
Commodity Pesticide
MRL (mg/kg)
Actual values (BMRL) Actual Values (AMRL) (mg /kg)
Metiram as CS2 0.05*
BLQ
Fenoxaprop-p-ethyl 0.05*
BLQ
Fipronil 0.04 BLQ
Lambda cyhalothrin 0.01 0.42
Oxadiargyl 0.1 BLQ
Pendimethalin 0.4 BLQ
Propaquizafop 0.01*
BLQ
Pryraclostrobin 1.5 BLQ
Quizalofop ethyl 0.01*
BLQ
Tebuconazole 0.15 BLQ
Chlorpyriphos 0.01 BLQ
Oxyflurofen 0.05 BLQ
Tau fluvalinate 0.01 0.02
27
Chilli
Acetamiprid 2 BLQ
Alpha naphthyl Acetic Acid 0.2 BLQ
Azoxystrobin 1 BLQ
Buprofezin 2 BLQ
Carbaryl 5 BLQ
Carbosulfan 2 BLQ

Mott MacDonald | Draft ESA and ESMF State of Maharashtra Agri-Business and Rural Transformation
408004 | 02 | 24 September 2019
389
Sr.No
Commodity Pesticide
MRL (mg/kg)
Actual values (BMRL) Actual Values (AMRL) (mg /kg)
Chlorantraniliprole 0.6 BLQ
Chlorfenapyr 0.05 BLQ
Cuprous Oxide $ BLQ
Cyantranilipole 0.5 BLQ
Deltamethrin (Decamethrin) 0.05 BLQ
Diafenthiuron 0.05 BLQ
Dicofol (sum of o,p' & p,p' isomers) 1
BLQ
Difenoconazole 0.01 BLQ
Dimethoate 0.5 BLQ
Dithiocarbamates 1 BLQ
Mancozeb 1 BLQ
Metiram as CS2 1 BLQ
Fenazaquin 0.5 BLQ
Fenpropathrin 0.2 BLQ
Fenpyroximate 1 BLQ
Fipronil 0.01 BLQ
Flubendiamide 0.02 BLQ
Flusilazole 0.01 BLQ
Hexaconazole 0.5 BLQ

Mott MacDonald | Draft ESA and ESMF State of Maharashtra Agri-Business and Rural Transformation
408004 | 02 | 24 September 2019
390
Sr.No
Commodity Pesticide
MRL (mg/kg)
Actual values (BMRL) Actual Values (AMRL) (mg /kg)
Hexythiazox 0.01 BLQ
Imidachloprid 0.3 BLQ
Indoxacarb 0.01 BLQ
Kresoxim Methyl 0.15 BLQ
Lambda cyhalothrin 0.05 BLQ
Lufenuron 0.05 BLQ
Metalaxy-M 0.02 BLQ
Methomyl 0.05 BLQ
Milbemectin 0.01 BLQ
Monocrotophos 0.2 BLQ
Myclobutanil 0.2 BLQ
Novaluron 0.01 BLQ
Oxydemeton-Methyl 2 BLQ
Pendimethalin 0.05*
BLQ
Picoxystrobin 0.05*
BLQ
Propargite 2 BLQ
Propineb 2 BLQ
Pyraclostrobin 0.05*
BLQ
Pyridalyl 0.02 BLQ

Mott MacDonald | Draft ESA and ESMF State of Maharashtra Agri-Business and Rural Transformation
408004 | 02 | 24 September 2019
391
Sr.No
Commodity Pesticide
MRL (mg/kg)
Actual values (BMRL) Actual Values (AMRL) (mg /kg)
Pyriproxyfen 0.02 BLQ
Quinalphos 0.2 BLQ
Spinosad 0.01 BLQ
Spiromesifen 0.1 BLQ
Thiacloprid 0.02 BLQ
Thiodicarb 0.01 BLQ
Thiamethoxam 0.5 BLQ
Triadimefon 0.4 BLQ
Trifloxystrobin 0.4 BLQ
Triazophos 0.2 BLQ
Tricyclazole 0.3 BLQ
Spinetoram and its metabolites 0.05 BLQ
Spirotetramat 2 BLQ
Abamectin 0.05*
BLQ
28
Brinjal
Beta Cyfluthrin 0.2 BLQ
Chlorantraniliprole 0.6/0.01
0.0235
Chlormequat Chloride (CCC) 0.1
BLQ
Cyantranilipole 0.06 BLQ

Mott MacDonald | Draft ESA and ESMF State of Maharashtra Agri-Business and Rural Transformation
408004 | 02 | 24 September 2019
392
Sr.No
Commodity Pesticide
MRL (mg/kg)
Actual values (BMRL) Actual Values (AMRL) (mg /kg)
Cypermethrin 0.2 BLQ
Deltamethrin (Decamethrin) 0.3 BLQ
Diafenthiuron 1 BLQ
Etoxazole 0.2 BLQ
Fenazaquin 0.01 BLQ
Fenpropathrin 0.2 BLQ
Fenvalerate (Fat soluble residue) 2
BLQ
Flubendiamide 0.1 BLQ
Imidacloprid 0.2 BLQ
Lambda cyhalothrin 0.2 BLQ
Propargite 2 BLQ
Pyriproxyfen 0.02 BLQ
Spiromesifen 0.5 BLQ
Thiacloprid 0.7 BLQ
Thiodicarb 0.05 BLQ
Thiamethoxam 0.3 BLQ
Spirotetramat 1 BLQ
Enamectin Benzoate 0.01
0.0119

Mott MacDonald | Draft ESA and ESMF State of Maharashtra Agri-Business and Rural Transformation
408004 | 02 | 24 September 2019
393
Sr.No
Commodity Pesticide
MRL (mg/kg)
Actual values (BMRL) Actual Values (AMRL) (mg /kg)
29
Okra
Acetamiprid 0.1 BLQ
Beta Cyfluthrin 0.01*
BLQ
Buprofezin 0.01*
BLQ
Carbaryl 10 BLQ
Chlorantraniliprole 0.3 BLQ
Cyantranilipole 0.5 BLQ
Cypermethrin 0.5 BLQ
Deltamethrin (Decamethrin) 0.05 BLQ
Emamectin Benzoate 0.05 BLQ
Fenazaquin 0.01 BLQ
Fenpropathrin 0.5 BLQ
Fenvalerate (Fat soluble residue) 2
BLQ
Imidacloprid 2 BLQ
Lambda cyhalothrin 2 BLQ
Pyridalyl 0.02 BLQ
Pyriproxyfen 0.03 BLQ
Spiromesifen 0.03 BLQ
Thiamethoxam 0.5 BLQ
Tolfenpyrad 0.7 BLQ

Mott MacDonald | Draft ESA and ESMF State of Maharashtra Agri-Business and Rural Transformation
408004 | 02 | 24 September 2019
394
Sr.No
Commodity Pesticide
MRL (mg/kg)
Actual values (BMRL) Actual Values (AMRL) (mg /kg)
Spirotetramat 1 BLQ
Flupyradifurone and its metabolites Difluroacetic Acid and Difluroethylamino-furanone 0.8
BLQ
Chlorofevinphos 0.01 0.05
Tau fluvalinate 0.01 0.02
Profenophos 0.01
0.011
30 Beans
31
Cucumber
Ametroctradin 0.4 BLQ
Azoxystrobin 0.05*
BLQ
Cymoxanil 0.1 BLQ
Mancozeb 0.4 BLQ
Metiram as CS2 2 BLQ
Ethion 0.5 BLQ
Imidacloprid 1 BLQ
Permethrin 0.5 BLQ
Pyraclostrobin 0.2 BLQ
Thiophanate-Methyl 0.2 BLQ

Mott MacDonald | Draft ESA and ESMF State of Maharashtra Agri-Business and Rural Transformation
408004 | 02 | 24 September 2019
395
Sr.No
Commodity Pesticide
MRL (mg/kg)
Actual values (BMRL) Actual Values (AMRL) (mg /kg)
Carbendazim 0.01 BLQ
0.0394
0.0149
32
Turmeric Zineb as CS2 2
BLQ
33
Gourd
Chlorantraniliprole 0.03 BLQ
Halosulfuron methyl 0.01*
BLQ
Thiophanate-Methyl 0.4 BLQ
34
Meat & Meat
Products
Acephate 0.05 BLQ
Acetamiprid 0.05 BLQ
Bitertanol 0.05 BLQ
Chlorantraniliprole 0.2 BLQ
Chlorothalonil 0.02 BLQ
Chlothianidin 0.02 BLQ
Deltamethrin (Decamethrin) 0.5 BLQ
Difenaconazole 0.2 BLQ
Dimethoate 0.05 BLQ
Mancozeb 0.1 BLQ
Ethofenprox (Etofenprox) 0.5 BLQ
Fenpropathrin 0.02 BLQ

Mott MacDonald | Draft ESA and ESMF State of Maharashtra Agri-Business and Rural Transformation
408004 | 02 | 24 September 2019
396
Sr.No
Commodity Pesticide
MRL (mg/kg)
Actual values (BMRL) Actual Values (AMRL) (mg /kg)
Fipronil 0.01 BLQ
Fluzilazole 1 BLQ
Glyphosate 0.05 BLQ
Imidacloprid 0.1 BLQ
Indoxacarb 2 BLQ
Kresoxim Methyl 0.05 BLQ
Methomyl 0.02 BLQ
Oxydemeton-Methyl 0.05 BLQ
Penconazole 0.05 BLQ
Profenofos 0.05 BLQ
Propiconazole 0.01 BLQ
Spinosad 2 BLQ
Tebuconazole 0.05 BLQ
Thiacloprid 0.1 BLQ
Thiodicarb 0.02 BLQ
Thiamethoxam 0.02 BLQ
Triadimefon 0.02*
BLQ
35
Milk & Milk
Products
2,4-Dichlorophenoxy Acetic Acid 0.05
Acephate 0.02
Acetamiprid 0.02
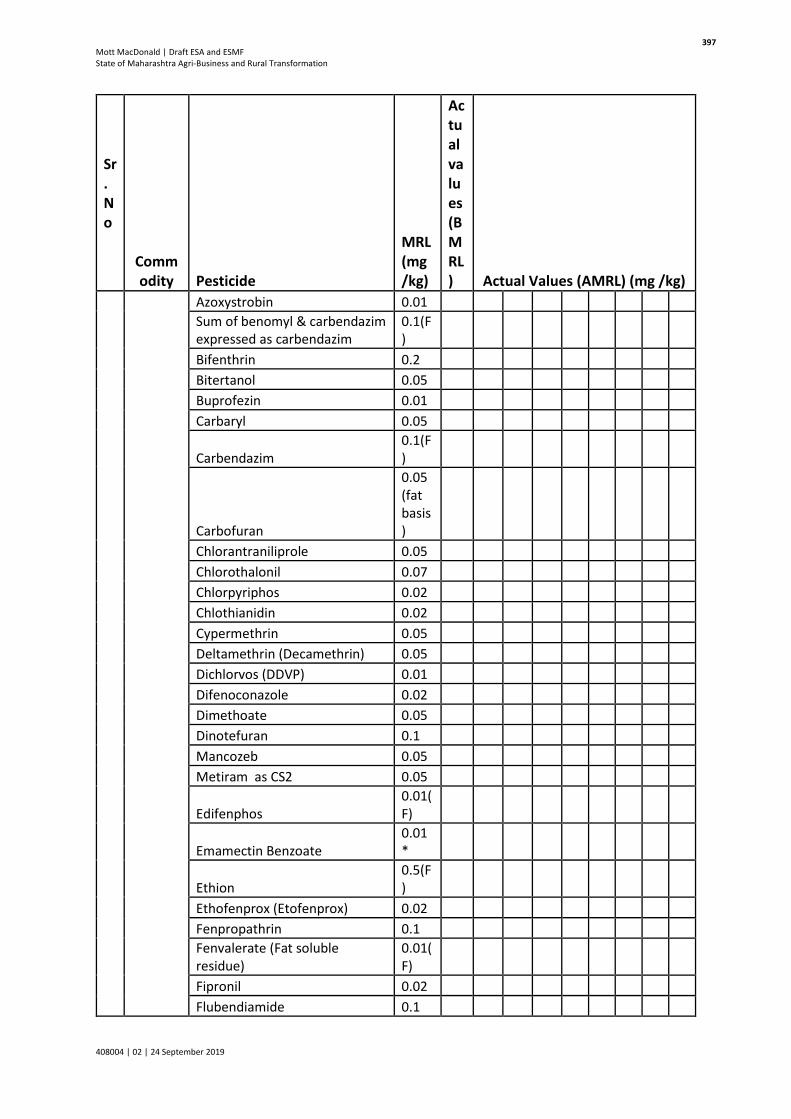
Mott MacDonald | Draft ESA and ESMF State of Maharashtra Agri-Business and Rural Transformation
408004 | 02 | 24 September 2019
397
Sr.No
Commodity Pesticide
MRL (mg/kg)
Actual values (BMRL) Actual Values (AMRL) (mg /kg)
Azoxystrobin 0.01
Sum of benomyl & carbendazim expressed as carbendazim
0.1(F)
Bifenthrin 0.2
Bitertanol 0.05
Buprofezin 0.01
Carbaryl 0.05
Carbendazim 0.1(F)
Carbofuran
0.05 (fat basis)
Chlorantraniliprole 0.05
Chlorothalonil 0.07
Chlorpyriphos 0.02
Chlothianidin 0.02
Cypermethrin 0.05
Deltamethrin (Decamethrin) 0.05
Dichlorvos (DDVP) 0.01
Difenoconazole 0.02
Dimethoate 0.05
Dinotefuran 0.1
Mancozeb 0.05
Metiram as CS2 0.05
Edifenphos 0.01(F)
Emamectin Benzoate 0.01*
Ethion 0.5(F)
Ethofenprox (Etofenprox) 0.02
Fenpropathrin 0.1
Fenvalerate (Fat soluble residue)
0.01(F)
Fipronil 0.02
Flubendiamide 0.1

Mott MacDonald | Draft ESA and ESMF State of Maharashtra Agri-Business and Rural Transformation
408004 | 02 | 24 September 2019
398
Sr.No
Commodity Pesticide
MRL (mg/kg)
Actual values (BMRL) Actual Values (AMRL) (mg /kg)
Flusilazole 0.05
Glufosinate Ammonium 0.02
Imidacloprid 0.1
Indoxacarb 0.1
Kresoxim Methyl 0.01
Methomyl 0.02
Methyl Chlorophenoxy Acetic Acid 0.04
Metolachlor 0.01*