Embed Size (px)
Citation preview

FINAL REPORT VOT 75146 RESEARCH MANAGEMENT CENTRE
EFFECT OF VARIOUS PROCESSING PARAMETERS ON THE QUALITY OF PAPAYA FRUIT TEA
Project Leader:
DR. IDA IDAYU BINTI MUHAMAD
BIOPROCESS ENGINEERING DEPARTMENT FKKKSA UTM

LIST OF CONTENTS
CHAPTER TITLE PAGE
I INTRODUCTION
1.1 Research background 1
1.2 Objective of study 3
1.3 Scope of study 3
II LITERATURE REVIEW
2.1 Papaya fruit 4
2.1.1 Origin 4
2.1.2 Content of papaya 5
2.2 Drying process 7
2.2.1 Definition of drying 7
2.2.2 Drying technology 8
2.3 Microwave drying 10
2.4 Microwave-assisted air dehydration 13
2.4.1 Conventional drying 13
2.4.1.1 Parameters: temperature, air
velocity and geometry of fruit 15
2.4.2 Osmotic dehydration 16
2.4.2.1 Influence of process variables on
osmotic dehydration 17
2.5 Quality of dehydrated papaya 19
2.5.1 Vitamin C content 19
2.5.1 1 Factors of vitamin C degradation 19

2.5.2 Papain enzyme 21
2.5.2.1 Factors of papain stability 22
III METHODOLOGY
3.1 Raw material 23
3.2 Drying procedure 24
3.2.1 Microwave drying 24
3.2.2 Microwave-assisted air dehydration 24
3.2.3 Tray drying 25
3.3 Quality analysis of dehydrated papaya 26
3.3.1 Determination of moisture content 26
3.3.2 Enzyme analysis 26
3.3.2.1 Extraction of papain enzyme 26
3.3.2.2 Determination of enzyme activity 27
IV FINDINGS AND DISCUSSION
4.1 Processing effects 28
4.1.1 Microwave drying 28
4.1.2 Tray drying 32
4.1.2.1 Experimental design and response value 32
4.1.2.2 Drying kinetics of fresh papaya 33
4.1.2.3 Response Surface Methodology of
moisture content 35
4.1.2.4 Analysis variance of moisture content 39
4.1.2.5 Optimization from central composite
design 40
4.1.2.6 Enzyme analysis 41
4.1.2.7 Response Surface Methodology for
enzyme activity 42
4.1.2.8 Analysis variance of enzyme activity 45

4.1.2.9 Optimization from central composite
Design 46
4.1.3 Osmotic dehydration 47
4.1.3.1 Enzyme Activity Analysis Using
Experimental Design 50
4.1.3.2 Weight Reduction Analysis Using
Experimental Design 63
V CONCLUSION
5.1 Comparison of different drying methods 75
5.2 Microwave drying of papaya fruit drinks 76
5.3 Tray drying of papaya fruit drinks 76
5.4 Osmotic dehydration of papaya fruit drinks 77

1
CHAPTER I
INTRODUCTION
1.1 Research background
Exotic fruits from which drinks are made in most tropical countries are so
abundant and such in a great variety, that it would probably be impossible for people
to sample all of them, but they worth a try. Some of the great varieties of fruits used
in drinks are bananas, guavas, papayas, oranges, pineapples, grapes, mangoes,
watermelon, coconuts, longans, rambutans, strawberries, lime and tamarind.
From the various fruits listed, papaya is found to be one of the easiest fruits
grown in all tropical countries. It is grown extensively in all tropical and sub-tropical
parts of the world. Papaya is a wholesome, all season fruit. It has more carotene
compared to other fruits such as apples and guavas, which is converted into vitamin
A in our body. It also contains vitamins B, D, E, K and C, and minerals such as
sodium, magnesium, iron, calcium, phosphorus and potassium. Rich in vitamin A
and C, papaya has been used to heal ulcers and other internal bleeding.

2
For nowadays, papaya fruits have been commercialized in various ways of
marketing ranging from drinks to food and even more vitamins supplement. There
are pure papaya fruit juice, concentrated fresh juice, bottled soft drinks, fruits shake
with crushed ice and milk or cream, papaya fruit powder drink and papaya flavored
tea drink. More and more people have shown their attraction towards papaya in their
daily meals. As for that, a new way of commercializing papaya fruit drink is
proposed to meet the needs of consumer health and pleasure.
Papaya fruit drink is expected to be a nutritious beverage by maintaining the
quality of the processed papaya fruit. The quality is indicated by the ability to retain
the original coloring, taste, aroma and its biological active gradient throughout the
process. Drying method and various processing parameters has huge effects on the
quality of dried fruits. It is reported that drying method will seriously decrease the
nutritive and sensorial values cause by water removal of the fruits (Lenart, 1996).
The degradation rate of quality increases as the drying temperature increases. Hence,
selection of proper drying technique and conditions is necessary for minimizing
thermal stresses, over drying and maintenance of relevant compounds in order to
retain the quality of the dehydrated product.

3
1.2 Objective of study
The objective of this research is to study the effects of processing parameters
during various dehydration processes on the quality of dehydrated papaya.
1.3 Scope of study
The scopes of this research include:
• Tray drying, osmotic dehydration and microwave drying process.
• Analysis on moisture content and drying characteristics of dehydrated
papaya.
• Analysis and ddetermination of papain enzyme activity of dehydrated
papaya.

4
CHAPTER II
LITERATURE REVIEW
2.1 Papaya fruit
2.1.1 Origin
Papaya with the scientific name, Carica papaya is a common fruit to be
found in tropical countries. It is a succulent fruit of the family Caricaceas. Papayas
are usually grown from seed. Their development is rapid, fruit being produced before
the end of the first year. Under favorable conditions, a papaya plant may live for five
years or more.
Papaya is oval in shape and the colour of the skin is green if unripe. It will
turn to green yellowish when it is ripe. The flesh of papaya is white before maturity,
turns to a rich orange-yellow or deep rose when ripe, with colour varying according
to variety. Papaya fruit is sweet in taste, with an agreeable musky tang, which is
more pronounced in some varieties and in some climates than in others.

5
2.1.2 Content of papaya
Papaya has been regarded as one of the most valuable tropical fruits that
contains many biological active compounds. Different types of enzymes are present
in papaya. Protease enzyme, also known as papain is a protein-digesting enzyme.
This substance presents in papaya is an excellent aid to digestion. This enzyme
greatly resembles the animal enzyme protein in its digestive action. It has a high
commercial value because of its ability to hydrolyze protein. Papain also exhibits
pain relieving properties and the United States Food and Drug Administration has
approved its medicinal use to ease the discomfort of slipped discs. This is used for
injection into herniated inter vertebral lumbar discs to relieve pain caused by the
pressure on nerves.
Papaya when consumed regularly will ensure a good supply of vitamin A and
C. It also contains vitamins B, D, E, K and C, and minerals such as magnesium,
sodium, iron, calcium, phosphorus and potassium. Rich in vitamin A and C, papaya
has been used to heal ulcers and other internal bleeding. Healing speeds up with
pieces of papaya laid on wounds and surgical incision.
Papaya is a good source of beta-carotene, which helps to prevent damage by
free radical, which may other wise lead to some forms of cancer. It has more
carotene compared to other fruits such as apples and guavas. Carotene in food is
converted into vitamin A in people’s body. Papaya is a low calorie fruit compared to
others. 100 grams of ripe papaya contains only 32 kcal. The comparative low
calories content make this a favorite fruit of obese people who are into weight
reducing regime. This low calorie, nutritive and low in cost fruit is the best dietary
supplement for a healthy life. It will be more convenient if papaya fruit is processed
as drinks that can be included in our regular daily meals. The characteristics of
papaya such as the aroma, flavor, color, nutrient content and enzymatic concentration
are expected to be retained for a high quality dehydrated papaya throughout this
research.

6
Table 1. Components in papaya fruit (Source: Malaysian Food Nutrition Composition, IMR 1982)
Components Every 100g
Energy 35.0 calMoisture 90.7 gProtein 1.5 gFat 0.1 gCarbohydrates 7.1 gFiber 0.5 gAsh 0.1 gCalcium 11.0 mgPhosphorus 3.0 mgIron 0.7 mgSodium 3.0 mgPotassium 16.0 mgBeta carotene 1160.0 µgVitamin B1 0.03 mgVitamin B2 0.07 mgNiacin 0.1 mgVitamin C 71.0 mg

7
2.2 Drying process
2.2.1 Definition of drying
Drying is a process in which water is removed to halt or slow down the
growth of spoilage microorganisms, as well as the occurrence of chemical reactions
(Vega-Mercado et al., 2001). Drying is usually defined as the removal of moisture
until equilibrium with the environment, while the removal of moisture to a very low
moisture content, nearly bone-dry condition is called dehydration (Stuchly et al.,
1983). The drying process can be further divided into two periods, which are the
constant drying rate period and the falling drying rate period.
During the first stage of drying, the wet materials contains so much water that
all existing liquid surfaces will dry in a manner comparable to an open surface of
water. The drying rate depends only on the ambient conditions and the total water
surface area. The drying rate is constant because the surface of the material contains
free moisture. Towards the end of the constant drying rate period, moisture has to be
transported from the inside of the material to the surface. The moisture content at
which the drying rate ceases to be constant is called the critical moisture content.
After the constant drying rate period, dry spots appear on the surface and the
drying rate decreases. This is called the falling rate period, in which two processes
involved: the movement or migration of moisture within the material (mass transfer)
to the surface and the removal of moisture from the surface. When the surface is
completely dry, the moisture is transported from the inner parts of the material to the
external surface as the result of concentration gradients between the interior of the
material and the surface (Mujumdar, 1995).

8
2.2.2 Drying technology
Drying of food has been widely used for preservation of food in the last few
years. There are as many reasons as there are materials that can be dried. Dried
food, especially fruits and vegetables can be stored and transported at a relatively
low cost. The handling of product marketing will be easier and faster. However,
water removal during drying leads to a serious decrease in the nutritive and sensorial
values of the product (Lenart et al., 1996). Several factors should be considered in
order to apply drying for food preservation to achieve the best possible quality of the
product. Akanbi et al. (2005) studied on drying characteristics of tomato slices,
including moisture content at different drying temperature. A research has to be
undertaken in order to obtain the most optimum drying method and processes for
higher product quality of nutrient, enzymatic reaction and sensory acceptability
retention.
Drying technology has evolved from the simple use of solar energy to current
technology that includes, among others, kiln drying, tray drying, tunnel drying, spray
drying, freeze dehydration, osmotic dehydration, extrusion, fluidization, and the use
of microwaves, radio frequency, refractance window and hurdle technology. The
development of dehydration technology can be divided in four groups or generations
(Vega-Mercado, 2001) as shown in Fig. 1.

9

10
2.3 Microwave drying
Microwaves heating and drying processes have been well established in
various industrial applications, and in many cases are replacing the less efficient, less
economic and less convenient conventional methods of drying. In recent years,
microwave drying has gained popularity as an alternative drying method in the food
industry. Microwave drying is rapid, more uniform and energy efficient compared to
conventional hot- air drying. Microwaves are of increased interest among food
researchers and processors because of its energy saving possibilities they might
represent. However, microwave drying should be fully understood in order to avoid
lack of optimization, particularly with regard to uniformity of moisture and
temperature distributions in the treated material. The microwave oven equipment is
shown in Fig. 2.
Fig. 2. Microwave oven drying unit

11
Numerous electromagnetic and thermal parameters are involved in the
microwave heating and drying process. The apparent limitations of the microwave
process are established by the material quality, processing time, temperature and
moisture distributions (Stuchly et al., 1983). In other words, the process rate
depends on the maximum permissible temperature and moisture gradients. It is
therefore obvious that the product quality is improved by the reduction of moisture
and temperature gradients.
Microwave drying of foodstuffs gives rise to complicated chemical
conversions and reactions. Such reactions can cause degradation of vitamins, lipid
oxidation and browning reactions. However, the retention of vitamins during
blanching, cooking and reheating of foods in a microwave oven was found to be
comparable to the retention using conventional methods of heating. In the
conventional drying process, moisture is removed initially from the external surface
of the body producing the internal moisture gradient necessary for outward
diffusional moisture flow. As a result of the relatively dry surface, case-hardening,
shrinkage, local overheating and structural damage of materials are very common. In
this case, microwave process has the potential to be the latest advance in drying
technology to overcome such problems contributed by the conventional drying
process.
It was observed that temperature in the interior of dried food in microwave
procedure is higher than on the surface and moisture is trabsferred to surface more
dinamically than during conventional drying method. The simulation results showed
that in larger samples, heating occurs mainly from the surface towards the centre,
whereas in smaller samples, heating is also significant at the inner parts of the sample
(Oliveira et al., 2002). Rotation of the samples in microwave drying caused a
decrease in temperature gradients, resulting in more uniform temperature
distributions.

12
A microwave-generated thermal gradient produces a completely different
moisture distribution in the dried body. Because of the exponential dependence of
the diffusivity on temperature, the diffusional flow rate for a given moisture gradient
will be much higher near the centre of the bulk than near the surface (Stuchly et al.,
1983). As a result, a strong moisture-leveling process exists as moisture gradients
decrease with increasing depth, to compensate for the rapidly increasing diffusivity.
Moisture content will decrease more uniformly throughout the bulk and thus
eliminate part of the disadvantages of the conventional drying process. Fig. 3 shows
the schematic representation of microwave drying unit.
Fig. 3. Schematic representation of microwave drying unit

13
2.4 Microwave-assisted air dehydration
The progresses in microwave drying on the industrial level has been
relatively slow in comparison with the laboratory level because of its high initial
capital investment and comparatively lower energy efficiency with conventional
drying techniques (Piotrowski et al., 2004). Removing water by means of
microwaves is expensive because of high costs of electric energy. For lowering
costs, usually a combination of microwave drying with conventional drying is taken
into account. The schematic illustration of microwave-assisted air dehydration
equipment is shown in Fig. 5.
Fig. 5. Schematic illustration of microwave-assisted air dehydration equipment
2.4.1 Conventional drying
A tray or compartment dryer is an enclosed, insulated housing in which solids
are placed upon tiers of trays in the case of particulate solids. Heat transfer may be
direct from air to solids by circulation of large volume of hot air. A conventional

14
drying unit is shown in Fig. 6. A conventional tray dryer consists of removable tray
loaded in a cabinet in which loading of fruit cubes is provided. It essentially consists
of an insulated cabinet containing an air circulating fan that moves the air directly
through a heater and adjustable baffles. The air moves either horizontally between
the trays of food material or vertically through the trays and food.
Fig. 6. Schematic diagram of the convection drying equipment
The major concern in hot air drying of fruits is the tremendous energy
consumption and low drying efficiency (Yongsawatdigul et al., 1996). The
conventional hot air method of drying fruits often degrades product quality. Van
Arsdel et al. (1973) indicated that hot air drying can cause heat damage and
adversely affect flavor, color, size, texture, nutritional value and enzymatic reaction
of the products. Case-hardening is a common defect particularly found in dried fruits
due to rapid drying. As drying progresses, the rate of water evaporation is faster than
the rate of diffusion to the product surface (Yongsawatdigul et al., 1996). Therefore,
the outer skin becomes dry and acts as water barrier, causing a wet interior.
Furthermore, loss of volatile compounds inevitably occurs during this conventional
drying. Since the fruits material are exposed to high temperature for a long period,
these volatile compounds are vaporised and lost with water vapor. This causes a
significant loss of characteristic flavor and aroma in dried products. High
temperature and long drying time also diminished the original color of the products.

15
2.4.1.1 Parameters: temperature, air velocity and geometry of fruit
The quality of dried fruit is highly depended on the optimum drying
conditions. To achieve the best possible quality, selection of proper drying
conditions is necessary for minimizing thermal stresses and maintaining the relevant
compounds, which determine the quality of the product (Ramesh et al., 2000).
In tray drying process, temperature of air significantly plays an important role
to dehydrate the fruits to an acceptable moisture content. High temperature of hot air
may result in faster moisture or water removal of fruit and better effectiveness of
diffusivities. However, an excessive air temperature will reduce the sensorial and
quality of the fruit and may cause seriously damage in flavors, colors and nutrients.
Lower temperature of hot air is not expected to alter the properties of the fruit
significantly but more time is required to reduce the moisture content to an
acceptable amount.
Air velocity that moves through the fruit loaded on the tray is also aiding the
heat and mass transfer of the drying process. The water was transferred through the
air and was carried away. When air velocity increased, the effective water diffusivity
also increased.
It is very common in literature to consider finite food geometry as an infinite
flat plate configuration, neglecting the diffusion in the other direction. In other word,
geometry of cutting size usually does not take into consideration. However, it is
important to take into account the effect of geometry of fruit cut for the purpose of
comparison among various drying methods.
Geometry or shape of cutting size influences the peripheral of diffusion of
fruit during drying process. Breadth flat surface tends to increase the drying rate
rather than denting surface that obstruct water diffusion from the fruit into the air

16
during drying process. Other consideration is the thickness of cutting size. Rastogi
et al. (2004) reported that when thickness is very small as compared to length and
breadth of fruit cut, the peripheral diffusion is negligible. However, when thickness
is of equal magnitude to length and breadth, which indicates that the fruit was cut
into cubes, this assumption is no longer valid because more consideration was
required to account for the peripheral diffusion, considering the food piece as a
rectangular rather than an infinite plate.
2.4.2 Osmotic dehydration
Osmotic dehydration is a useful technique that involves product immersion in
a hypertonic aqueous solution leading to a loss of water through the cell membranes
of the product and subsequent flow along the inter-cellular space before diffusivity in
the solution (Sereno et al., 2001). It is an efficient form of moisture removal from
solid food, causing no change of phase of the water.
Osmotic dehydration is mainly intended for processing fruits and vegetables.
Osmotic dehydration is a method used for attaining better quality fruits and is used as
a preliminary drying period. This method is based on the immersion of fruits in a
hypertonic solution of sugar. This hypertonic solution presents a higher osmotic
pressure and a lower water activity. In the osmotic process, this semi-permeable
membrane is represented by the cellular surface structure of the fruits.
Osmotic dehydration can be used as a pre-treatment for drying process of
fruits. This technique also allows the incorporation of certain solutes, without
modifying the integrity of the product. The product will become tastier and last
longer. Osmotic dehydration is said to be one of the way for food preservation. The
water removal from solid foods inhibits the growths of microorganisms, besides

17
preventing a large part of biochemical reactions which occur in the presence of
moisture. The process of osmotic dehydration promotes stabilization of color
parameters, reducing non-enzymatic browning reactions and often improves fruit
product color (Krokida et al., 2000). Furthermore, the dehydration is also a mean of
reducing energy costs, important for the transportation, packaging and storing of
foods with high water content (Park et al., 2002).
2.4.2.1 Influence of process variables on osmotic dehydration
a) Temperature
Temperature of dipping pretreatment of osmotic dehydration has huge
influences on the drying time, drying kinetics and the organoleptic properties of the
osmo-dehydrated products. Pangavhane et al. (1999) studied the effect of different
pretreatment parameters on the quality of seedless grapes. It was reported that with
cold dipping pretreatment, the drying time of the grapes reduced significantly with
better quality raisins produced compared to those obtained from untreated grapes.
While for hot dipping pretreatment, though the drying time was further reduced, the
quality of raisins produced was found to be poor. Moreover, the hot dipping method
was also not convenient to handle.
b) Geometry of fruit cut
The most common geometries used in drying of fruits are cubes and slices.
El-Aouar et al. (2003) used 2cm3 cubes of papaya in their study, while Araujo et
al.(2004) cut the sample of nectarine (Prunus persica) into flat slabs in their study.
Graziella et al.(2004) studied the geometry of papaya fruit cut as one of the
independent variables for osmotic dehydration process to determine the water loss,

18
weight loss and solid gain of dehydrated papaya. They reported that papaya slices
provided more water loss, weight loss and solid gain compared to cubes.
c) Sucrose and lactic acid concentration
Sucrose concentration has influences on the solid gain and water loss of the
dehydrated fruit. Sucrose exhibits fast diffusion inside cells. Previous studies
showed that sucrose concentration used was usually ranging from 50°Brix to
70°Brix. Silveira et al.(1996) reported that water loss and solid gain increased with
increasing sucrose concentration. While Giraldo et al. (2002) reported that effective
diffusion coefficient in the mango fruit liquid phase increased when sucrose
concentration decreased.
19
2.5 Quality of dehydrated papaya
2.5.1 Vitamin C content
Papaya (Carica papaya L.) is one of the major sources of vitamin C. It was
reported that papayas contains 16% more vitamin C than oranges. Vitamin C is an
important anti-oxidant compound that helps protect against cancers, heart disease and
stress. Vitamin C helps in maintaining healthy immune system since it is needed for
antibody production besides increasing the absorption of nutrients in the gut.
2.5.1 1 Factors of vitamin C degradation
Degradation of ascorbic acid depends on several factors as below:
a) Drying condition
Vitamin C is a heat sensitive compound compared to other nutrients and this
may cause problems to retain it whenever exposed to heat. Raising the drying
temperature increases the loss of vitamin C.
b) Oxygen
Presence of oxygen may cause loss of vitamin C since it is a type of anti-
oxidant compound. Oxidation of food ingredient such as acid ascorbic or other
vitamins, pigments and aroma compounds is one of the most important causes of
quality loss. Accordingly, the absence of air during drying may inhibit oxidation and

20
therefore, nutrient content such as acid ascorbic, color and aroma compound of
product can be largely preserved. Processing under low oxygen conditions in an
inert atmosphere and control drying conditions of temperature, air velocity and
relative humidity may lower the oxidative effects and maintain the nutritional value
of the process food.
c) Cutting size of fruit
In some cases of fruit drying, it is significant to have shorter drying time. To
achieve shorter drying time, most of the fruits were chopped before drying. However,
chopped fruit may cause loss of nutrients such as vitamin C. Hence, cutting size
might also influence vitamin C retention. Larger surface area exposed to heat may
increase the degradation of vitamin C.
d) Sample moisture content
The stability and retention of vitamin C depended on the sample moisture
content, due to its solubility in the water. According to previous study on rosehip,
high rate of vitamin C loss was found at a relatively higher moisture content at the
beginning of drying, followed by a period of less rapid degradation as the moisture
content decreased. The high rate of loss at the beginning of the drying process may
be attributed to high moisture content of the material. This proves that the stability
and retention of vitamin C is not only depended on drying conditions but also on
sample moisture content.
21
2.5.2 Papain enzyme
Enzymes are biological catalysts that have the ability to increase the rate of
chemical reaction and will not be destroyed by the chemical reaction that is
accelerates. Protease refers to a group of enzyme that has a very beneficial function
through its ability to hydrolyze almost all proteins. They are also known as
proteolytic enzymes that are very important in digestion as they catalyses the
breakdown of peptide bonds in protein foods to liberate the amino acids needed by
the body. Additionally, protease enzymes have been used for many applications and
various forms of therapy, which are mostly used in medicine based on several
clinical studies indicating their benefits in inflammatory conditions and blood
rheology control. Besides, they have the ability to digest the unwanted debris in the
blood including certain bacteria and viruses.
Papain is a sulfhydryl protease from Carica papaya latex. Papain degrades
most protein substrates more extensively than the pancreatic proteases. Papain is a
single peptide chain of 211 residues folded into two parts that form a cleft. Papain is
activated by cysteine, sulfide and sulfite. It is enhanced when heavy metal binding
agents such as EDTA are also present.
Papain is used in the pharmaceutical industry, in medicine as well as in the
food processing industry. It is used in the preparation of vaccines and for the
treatment of hard skin. It also has veterinary applications such as deworming of
cattle. If papain is to be exploited commercially for an export market or local food
industry use, it is important to be able to determine the enzyme activity.

22
2.5.2.1 Factors of papain stability
a) Temperature
Temperature is the major effect of enzyme stability. Enzymes are very
sensitive to heat since they are biochemical catalysts that made up at least partially
protein. This will cause problem to retain papain enzyme during drying since
temperature is the main parameter in the process. Furthermore, raising temperatures
of the environment generally multiplies the degree of enzyme, but once an optimum
temperature has been reached, rapid degradation of the enzyme will occur with
concurrent and irreversible loss in activity. However, the optimum temperature
generally ranges from 37 ˚C to 60 ˚C.
b) pH of the environment
The pH of the environment affects the enzyme activity and stability.
Optimum pH for enzyme activity varies for most enzymes including proteases.
However, the optimum pH for the biological catalyst lies between pH 4.5 to 7.5.

23
CHAPTER III
METHODOLOGY
3.1 Raw material
Mature green papaya has been selected for the purpose of producing papaya
fruit drinks as it contains high papain enzyme and vitamin C. The Brix index of the
selected papaya should be within 10 - 12°Brix. The Hawaiian type of papayas were
supplied by MARDI, Pontian. The fruits were hand-peeled and cut into slices (4.0 x
2.0 x 0.5 cm) and cubes (2.0 x 2.0 x 1.0 cm).

24
3.2 Drying procedure
3.2.1 Microwave drying
Drying processes were carried out using microwave oven (Sharp R-4A53)
with various processing parameters. Drying procedure followed Wang et al.(2005)
with slight modification. Different geometry (slices and cubes) of papaya were
treated in microwave oven at different levels of power intensities (110 W, 380 W,
750 W) until the sample weight became constant. Sample weight was determined by
the digital balance weight. The weight was taken every 10 seconds to determine the
moisture content of the samples.
3.2.2 Microwave-assisted air dehydration
Microwave drying processes were carried out using microwave oven.
Different geometry (slices and cubes) of papaya were treated in microwave oven at
different levels of power input (110 W, 380 W, 750 W) for a specified time before
treated in an oven at different temperature (20, 40 and 60°C). Maximum drying
temperature was selected at 60ºC because degradation of enzyme occurred at
temperature higher than 60ºC.

25
3.2.3 Tray drying
The tray drying procedure followed Park et al. (2002) with slight
modification. Drying processes were carried out using tray dryer (Armfield UOP8)
at different temperature (20, 40 and 60°C). Maximum drying temperature was
selected at 60ºC because degradation of enzyme occurred at temperature higher than
60ºC.
The tray dryer consists of horizontal air flow through trays and samples
loaded on it. Prior to this, the weight of empty tray was measured so that the weight
of samples could be determined. Firstly, the air flow needs to be set up first. Air
flow was adjusted by anemometer at the end corner of tray dryer where the air was
supplied by the circulating fan. The drying temperature was automatically applied in
the process by the electrical heater, placed at the inlet of the tray drier. Thermocouple
was used in order to determine the temperature. The drying process started until it
reaches steady state. Sample weight was determined by the digital balance weight.
The weight was taken with time interval range of 15 – 120 minutes until the weight
became constant.

26
3.3 Quality analysis of dehydrated papaya
3.3.1 Determination of moisture content
The moisture content was expressed on a dry basis as kg of water per kg of
free-moisture solid or kg H2O/kg dry solid. It was determined by an oven method,
slightly modified from Funebo et al. (2000). Papaya slices were placed in oven
(Memmert) at 100°C for 24 hours to obtain the dry weight. Time-dependent
moisture content of the samples were calculated as follows:
3.3.2 Enzyme analysis
3.3.2.1 Extraction of papain enzyme
Prior to the extraction process, the dried sample was blended to provide more
surfaces for the reaction to occur. Enzyme extraction from the dried papaya was
carried out using acetone solution at ratio 5 g of sample : 10 mL of acetone. The
sample bottles then need to be properly wrapped with aluminum foiled to avoid
oxidation for 24 hours.
dryweightdryweightWetweightntentMoistureCo −
=

27
3.3.2.2 Determination of papain enzyme activity
A volume of 5 ml of casein substrate was pipetted into test tubes and soaked
in water bath at 40°C for 15 minutes. Then 2 ml of extracted enzyme solution was
added into the test tubes, followed by 3 ml of trichloroacetic acid to precipitate the
protein. After 60 minutes soaked in water bath at 40°C, the sample was centrifuged
and the supernatant was then measured with spectrophotometer at wavelength
280nm.
The determination was based on hydrolysis of the casein substrate. One
enzyme unit (U) is defined as an enzyme activity that release 1 g tyrosine at 40°C for
60 minutes. Standard curve was prepared by plotting the absorption versus the
enzyme concentration. The enzyme activity of the samples were calculated as
follows:
U/mg = (A x C x 10)/ W
whereas; U = enzyme unit defined as an enzyme activity that releases 1g tyrosine at
40 ˚C for 60 minutes, A = standard activity of enzyme, C = concentration of enzyme,
W = sample weight in mg and constant 10 represents the final mixture volume.

28
CHAPTER IV
FINDINGS AND DISCUSSION
4.1 Processing effects
4.1.1 Microwave drying
The effect of microwave drying parameters and geometry of papaya fruit cut
on the dehydrated product is studied The moisture content versus time curves during
microwave drying of papaya cubes for each of power intensities studied are shown in
Fig. 1, 2 and 3. As the microwave power intensity increased, the time required to
achieve moisture content to nearly zero decreased. The processing time for
microwave power 380 W and 750 W were slightly the same. However for
microwave power 110 W, the time required to remove the moisture until low
moisture content in papaya cubes is 20 minutes, compared to 4 minutes for 380 W
and 750 W.

29
The effect of changing the microwave power intensity on the drying
characteristics of papaya cubes is shown in Fig. 4. Drying rates were higher during
higher moisture content and decreased with decreasing moisture content. The drying
rate increased with increasing of power intensity at the same moisture content. The
comparison made for power intensity showed that at lower microwave power, the
drying rate was low and increased during higher power levels. The results indicated
that mass transfer is rapid during larger microwave power heating because more heat
was generated within the samples, creating a larger vapor pressure differential
between the centre and the surface of products (Lin et al., 1998). Although papayas
have high moisture content, an expected constant rate period was not observed in this
study. It is obvious that the entire drying process for the samples occurred in the
range of falling rate period.
y = 8.0893e-0.175x
R2 = 0.9965
0
1
2
3
4
5
6
7
8
9
0 5 10 15 20 25Time (min)
Moi
stur
e co
nten
t (kg
H2O
/kg
dry
solid
)
Fig. 1. Moisture content curve for microwave power 110W

30
y = 8.5177e-0.0153x
R2 = 0.9975
0
1
2
3
4
5
6
7
8
9
0 50 100 150 200 250 300
Time (s)
Moi
stur
e co
nten
t (kg
H2O
/kg
dry
solid
)
Fig. 2. Moisture content curve for microwave power 380W
y = 8.8096e-0.0157x
R2 = 0.9918
0
1
2
3
4
5
6
7
8
9
10
0 50 100 150 200 250 300Time (s)
Moi
stur
e co
nten
t (kg
H2O
/kg
dry
solid
)
Fig. 3. Moisture content curve for microwave power 750W

31
0
1
2
3
4
5
6
0 1 2 3 4 5 6
Moisture Content (kg/kg d.b.)
Dry
ing
Rat
e (k
g/kg
d.b
./min
)110 W380 W750 W
Fig. 4. Drying rate curves for different microwave power intensities

32
4.1.2 Tray drying
4.1.2.1 Experimental design and response value
Table 2: Result of different runs of drying
Run Independent variables Dependent variables
Block
Geometry
Velocity (m/s)
Temperture(˚C)
Moisture content
Enzyme acticity (U/mg)
1 1 -1 0.5 40 0.4839 0.0041 2 1 -1 0.5 60 0.3570 0.0037 3 1 -1 1.5 40 0.0968 0.0040 4 1 -1 1.5 60 0.08 0.0035 5 1 1 0.5 40 1.6349 0.0049 6 1 1 0.5 60 1.1818 0.0042 7 1 1 1.5 40 1.4444 0.0046 8 1 1 1.5 60 0.7302 0.0036
12 2 -1 0.11808 50 0.5013 0.0047 13 2 1 1.88192 50 0.6981 0.0043 14 2 -1 1 32.3617 0.7583 0.0080 15 2 1 1 67.6383 0.2154 0.00033
The range of different parameters (geometry, velocity and temperature) for the
drying process of papaya fruit tea is shown in Table 2 along with the value of response
(moisture content and enzyme activity).

33
4.1.2.2 Drying kinetics of fresh papaya
a) Effect of temperature and air velocity
Drying kinetics of slice
0
1
2
3
4
5
6
7
8
0 200 400 600
Time, min
Moi
stur
e co
nten
t, M
0.5,40
0.5,601.5,40
1.5,60
Drying kinetics of cube
0
1
2
3
4
5
6
7
8
9
0 200 400 600 800
Time, min
Moi
stur
e co
nten
t, M
0.5,40
0.5,60
1.5,40
1.5,60
(a) (b)
Fig 4.1: Drying kinetics of (a) slice and (b) cube
Figure 4.1 represented the drying kinetics of two types of geometry and showed
the influences of air velocity and temperature towards moisture content and drying time.
By observing, it seems like the air velocity did not markedly influenced the drying
kinetics for either slice or cube. It can be clearly seen that increasing of temperature from
40 ˚C to 60 ˚C, caused the decreasing of moisture content. However, by increasing the air
velocity from 0.5 m/s to 1.5 m/s, the drying curve was remained as the same pattern.
According to drying mechanism of transport properties, it indicates that the temperature
played important role for mass and heat transfer in the interphase between hot air and
fruit surface. On the other hand, air velocity was only aiding the drying process. With
this, it can be conclude that temperature is more significant on affecting drying rate than
air velocity. This result was valid to both geometry of slice and cube.

34
At the early stage of drying process, the moisture content was rapidly decline but
then the drying curves show some convergence at the final drying process as the
equilibrium conditions are reached. It shows that the beginning of drying process, both of
air velocity and air temperature strongly influenced drying rate, however close to the end
of drying the air temperature had effect upon drying, which higher than air velocity. This
was due to high internal resistance of fruit rather external of fruit that made the air
velocity insignificantly affect the drying process.
b) Effect of geometry of fruit cut
Effect of V at 40 C
0123456789
0 200 400 600 800
time, min
Moi
stur
e co
nten
t, M
0.5 S
1.5 S
0.5 C
1.5 C
Effect of V at 60 C
0
1
2
3
4
5
6
7
8
9
0 100 200 300 400 500 600 700
time, min
Moi
stur
e co
nten
t, M
0.5 S
1.5 S
0.5 C
1.5 C
(a) (b)
Fig 4.2: Effect of geometry for (a) 40 C and (b) 60 C
Figure 4.2 represents the drying kinetics of papaya at different temperature.
Temperature once again profound to be the most influence factor compare to air velocity
as it becomes more accentuated at 60 °C (b). This was according the less moisture
retained at 60 °C compared to 40 °C for either slice or cube.

35
Comparing both graph, it can be seen clearly that slice geometry having rapid
drying process and retained less moisture content than cube. Compared to cubic geometry
with slow drying process and retained more moisture. This occurred for both temperature
of 40 and 60 °C.
4.1.2.3 Response Surface Methodology of moisture content
a) Effect of temperature and air velocity
-1.674 -1.412 -1.149 -0.887 -0.625 -0.362 -0.1 0.162 0.425 0.687 above
Fitted Surface; Variable: MOISCON3 factors, 2 Blocks, 14 Runs; MS Residual=.082085
DV: MOISCON
Figure 4.3: Response surface of moisture content versus air temperature and velocity.

36
The variation apparent of moisture content with duration of temperature and air
velocity for the drying process at constant geometry is presented in figure 4.3. Referring
to the 3-D graph of combination effect of both independent variables showed that
temperature played most significant effect towards moisture content rather than air
velocity. It is observed from the figure that the higher the temperature was, the lower
moisture could be retained. These obey the theory, that the temperature mostly influenced
the water loss. However air velocity still influenced the performance by restricting the
drying process. From the observation, at higher air velocity of certain temperature would
result in lower moisture content and faster drying rate. This is because air velocity was
proved significantly in aiding the drying process. However, increasing more air velocity
would decrease the drying rate and decreased water loss from sample. This phenomenon
is caused by the decreasing distance of air through to attach fruit surface and less
moisture could be carried away. Nevertheless slow velocity provides longer attachment
between air and fruit surface, which provided more moisture to be carried away.
b) Effect of geometry of fruit cut
-0.941 -0.624 -0.307 0.01 0.327 0.644 0.961 1.277 1.594 1.911 above
Fitted Surface; Variable: MOISCON3 factors, 2 Blocks, 14 Runs; MS Residual=.082085
DV: MOISCON
Figure 4.4: Response surface of moisture content versus temperature and geometry.

37
Figure 4.4 representing the response surface of moisture content on combination
of two independent variables of air temperature and geometry. Referring to the graph,
geometry of cutting fruit gave the most significant impact on moisture content rather than
air temperature, which becomes insignificant for all analyzed samples. This would mean
that retaining moisture content was still strongly depended on geometry of fruit cut.
According to the graph, the lower the value of geometry (slice representing by -1), the
lower the moisture content will be retained. This result showed that slice provided less
moisture content than cube.
-0.236 -0.023 0.189 0.402 0.614 0.827 1.039 1.252 1.464 1.677 above
Fitted Surface; Variable: MOISCON3 factors, 2 Blocks, 14 Runs; MS Residual=.082085
DV: MOISCON
Figure 4.5: Response surface of moisture content versus air velocity and geometry.
Figure 4.5 consolidated statements above that geometry still plays most important
part. According to 3-D graph presented above, geometry still controlling the effect on
moisture content rather than air velocity that still proved that slice provided higher water
loss than cubic geometry.

38
Table 3: Summary relation from response surface methodology
Figure
Relation of parameters and moisture content
Moisture content,
Z
TTVVZ 00068.00038.04264.069243.0102212.1 215 −−−+×−= −
0.8986
2807.0)857143.0(0038.00128.0)8571.0(0055.000068.00459.02749.00664.1102212.1 2215
+−−+−+++×−= −
TGTGTTGGZ
1.7194
7028.0)8571.42(0038.0)8571.42(0128.00055.04264.06924.02749.00664.110221.1 2215
+−−+−+++×−= −
VGGVVVGGZ
1.6571

39
4.1.2.4 Analysis variance of moisture content
Table 4: ANOVA table
The result of the analysis of set of experimental data is displayed in Table A
which is known as analysis of variance. The entries in the data table represent the sources
that contribute to the total variation in the data values. ANOVA analysis was based on F
value that is defined as the ratio of the mean square due to the real regression and the
mean square due to real error. According to table above, F value that exceed p
(probability) value will result in the rejection of nul hypothesis states that all of the
coefficient, bi (excluding bo) is zero which then implies that not all of the bi are zero.
Hence, the contribution of F value from each source is equivalent to having the fitted
model as below:
9831.00128.000378.00055.000324.01619.05890.1102212.1
31
322132115
+−++−−+×= −
XXXXXXXXXZ

40
With: Geometry (X1)
Velocity (X2)
Temperature (X3)
Similarly, the value of accompanying statistics or quadratic regression (R2) is
0.9324. This showed that 93.24% of the total variation is explained by the fitted model.
4.1.2.5 Optimization from central composite design
a) Optimum values
The determination of optimum value is based on the critical value obtained from
the model. The value expressed from the response surface as below.
Table 5: Optimum value for each parameter
Factor Observed minimum
Critical values Observed maximum
Geometry -1 0.99400 1
Velocity (m/s) 0.118080 0.62445 1.88192
Temperature (˚C) 32.36170 40.88942 67.63830
Therefore, optimum values are:
Geometry = 0.99400 ~ 1 (cube)
Velocity = 0.62445 ~ 0.5 m/s
Temperature = 40.88942 ~ 40 ˚C

41
4.1.2.6 Enzyme analysis
Table 6: Enzyme concentration and enzyme activity
Run
OD
Enzyme Concentration
(mg/ml) Enzyme acticity
(U/mg) 1 0.104 0.2047 0.0041 2 0.116 0.1836 0.0037 3 0.108 0.1977 0.0040 4 0.121 0.1748 0.0035 5 0.082 0.2434 0.0049 6 0.101 0.2100 0.0042 7 0.09 0.2293 0.0046 8 0.117 0.1819 0.0036
12 0.087 0.2346 0.0047 13 0.098 0.2153 0.0043 14 -0.0074 0.4006 0.0080 15 0.211 0.0165 0.00033

42
4.1.2.7 Response Surface Methodology for enzyme activity
a) Effect of temperature and air velocity
-0.014 -0.012 -0.01 -0.008 -0.006 -0.004 -0.002 -1.657e-5 0.002 0.004 above
Fitted Surface; Variable: ENZYME_A3 factors, 2 Blocks, 14 Runs; MS Residual=.0000042
DV: ENZYME_A
Fig 4.6: Response surface of enzyme activity versus air temperature and velocity.
-0.012 -0.007 -0.003 8.655e-4 0.005 0.009 0.013 0.018 0.022 0.026 above
Fitted Surface; Variable: ENZYME_A3 factors, 2 Blocks, 14 Runs; MS Residual=.0000042
DV: ENZYME_A
Figure 4.7: Response of enzyme activity versus temperature and geometry.

43
According to response surface of enzyme activity, it can be inferred that
temperature exhibit as the tremendous effect compare to other independent variables such
air velocity and geometry. Referring to figure 4.6, increasing of temperature result in the
degradation on enzyme concentration in sample. Lower enzyme activity will be obtained
since enzyme concentration is proportionate to enzyme activity. However air velocity
seems not affect much on the enzyme retained. Hence, the surface exhibits a curvature
shape.
This is due to the behavior of enzyme that sensitive to varying temperature and
time. At low temperature, the drying process mostly influenced by air velocity and
therefore, drying will not seriously damaging the enzymes inside and will only degrade
some of it due to the time exposure. However, higher temperature will caused rapid
degradation of the enzyme with concurrent and irreversible loss. Hence little amount of
enzyme could only be retained.
-0.011 -0.009 -0.006 -0.004 -8.758e-4 0.002 0.004 0.007 0.01 0.012 above
Fitted Surface; Variable: ENZYME_A3 factors, 2 Blocks, 14 Runs; MS Residual=.0000042
DV: ENZYME_A
Figure 4.8: Response surface of enzyme activity versus velocity and geometry.

44
But, the degradation of enzyme is actually affecting by the geometry of cutting
size of sample, which automatically influences the losses of enzyme. This due to surface
exposure where larger surface area exposes to heat may increase the degradation of
enzyme. Slice that provides thin breadth surface rather than cubic geometry will provide
more surface to heat by temperature which contributed to the losses of enzyme. This
explained the result obtained in table 6, where lower enzyme concentration obtained for
slice compared to cube at same condition of temperature and air velocity.
Table 7: Summary relation from response surface methodology
Figure
Relation of parameters and moisture content
Moisture content,
Z
TVTTVVZ
626
4218
109142.7102509.3102624.400166.000311.010030.1
−−
−−
×−×+
×−+−×−=
-0.0158
00145.0)85714.0(109142.7102332.9)85714.0(000132.0102509.3
102624.40184.0104174.410030.1
6
626
42418
−×−
×−−×+
×−+×+×−=−−
−−−
TTGGT
TGGZ
0.0024
0123.0)8571.42(109142.7)8571.42(102332.900311.00184.04174.410030.1
66
218
−×−×+
−++×−=−−
−
TGVGGZ
0.0042

45
4.1.2.8 Analysis variance of enzyme activity
Table 8: ANOVA table
From table above, quadratic regression (R2) was significant at level 0.7954 which
also performing the correlation and interaction of observed response due to the
experiment factor. Hence, the value considered acceptable yet unsatisfied which means
that only 79.54% of total variation contributed by the fitted model. Hence, the
contribution of F value from each source is equivalent to having the fitted model as
below:
01374.0109142.710233.900013.0
10784.6103918.30367.0104282.6102010.1
326
316
21
36
242
11418
−×+×−−
×−×−+×−×−=−−
−−−−
XXXXXX
XXXXZ
With:
Geometry (X1)
Velocity (X2)
Temperature (X3)

46
4.1.2.9 Optimization from central composite design
a) Optimum values
The determination of optimum value is based on the critical value obtained from
the model. The value expressed from the response surface as below.
Table 9: Optimum value for each parameter
Factor Observed minimum
Critical values Observed maximum
Geometry -1 0.00873 1
Velocity (m/s) 0.118080 1.09597 1.88192
Temperature (˚C) 32.36170 66.90409 67.63830
Therefore, optimum values are:
Geometry = 0.00873~ 1 (cube)
Velocity = 1.09597~ 1.0 m/s
Temperature = 66.90409~ 60 ˚C

47
4.1.3 Osmotic dehydration
Response surface and methodology (RSM) is a set of technique design to find the
best value of the response which generally is used for the following three steps:
(1) Design and collection of experimental data which allow fitting a general quadratic
equation for smoothing and prediction
(2) Regression analysis to select the best equation for description of the data
(3) Examination of the fitted surface via contour plots and other graphical and
numerical tools.
Response surface and methodology using experimental design was used for the
optimizing of all variables. A second level design with four factors at three levels each
was used in order to take into account the individual effects. The experimental design
included 16 different treatments and three central points for the each geometry sample,
totalling 22 experiments.
The study includes 22 experiments or run with four factors which are called
independent variables. The independent variables studied were the geometry (slice and
cube), lactic acid concentration (0, 0.05, 0.1M), sucrose concentration (40, 50, 60˚B) and
temperature (30, 45, 60˚C). The dependent variables or the responses for this study are
weight reduction (WR %), water loss (WL %), solid gain (SG %), enzyme concentration
and enzyme activity.
Analysis of variance (ANOVA) was performed which factors and interactions are
significant. Pareto chart will shows the effect estimate of the most important factor. P-
values calculated by the program will be comparing with the F-ratios values to determine

48
which factors and interactions have significance effects. Data statistica analyses were
performed using Statistica5.0 Software (Statsoft, 1997).
The goal at the stage of experimental design analysis is to describe in detail the
relationship between the factor and the response. From the Table 1, we have decided to
use a quadratic equation to describe the relationship between our response, Y, and the
independent variables, Xi’s. The following polynomial model was fitted to the data:
43344224
322341143113211244332211
XXbXXbXXbXXbXXbXXbXbXbXbXbbY o
++++++++++=
Where bn are constant regression coefficients; Y is the predicted response (percentage of
WL, WR,SG and enzyme activity(%)); X1, X2, X3 and X4 are geometry (slice or cube),
lactic acid concentration (M), sucrose concentration (˚Brix) and temperature (˚C)
respectively.

49
Table 10 : Experimental design and observed values of response variables.

50
4.1.3.1 Enzyme Activity Analysis Using Experimental Design
Table 11: The Experimental and Theoretical Predicted Values
Table 11 shows the result of experimental and theoretical predicted values for
papain enzyme activity. The predicted response calculated by the program and the
graph observed versus predicted values shown in the Graph 4.9. Our goals is to find
the best values for the constant in the models which is the values of constant that
give the best fit to set of data. A good fit of the line to the data means that the line
should be as close to all the data points as possible.

51
Observed vs. Predicted Values4 factors, 2 Blocks, 22 Runs; MS Residual=.0000008
DV: ENZYME_A
Observed Values
Pre
dict
ed V
alue
s
-0.001
0.000
0.001
0.002
0.003
0.004
0.005
0.006
0.007
0.008
-0.001 0.000 0.001 0.002 0.003 0.004 0.005 0.006 0.007 0.008 0.009
Figure 4.9 : Graph Observed vs. Predicted Values for Enzyme Activity Response
R2 is the fraction of the total variability in the data that is explained by the
model which is useful indicator of how closely the regression equation matches the
data. The quadratic regression (R2) was significant at level of 0.919, which is
considered high, since the R2 values provides a measure of the variability of the
observe response due to the experiment factor and their interaction. The value of R2
is measured the total variation of observed value about the mean obtained by the
fitted model or correlation between the observed and predicted value from the result.

52
Table 12: Regression Analysis for Enzyme Activity, Quadratic Response Surface
Model Fitting (Predicted Value).
From Table 12, the regression equation obtained after analysis of variance
give the level of panels response as a function of the independent variables of the
geometry (slice or cube), lactic acid concentration (M), sucrose concentration (˚Brix)
and temperature (˚C). All terms regardless of their significance are included in the
quadratic equation below describing the relationship between independent variables
to the response:
42324131214
233
222
211
00047.000026.000007.000001.000216.00072.000001.000159.004884.023946.000223.045477.011678.23
XXXXXXXXXXXXXXXXXY
−++−−−−+−++−=
The standard error provides an indication of the “accuracy” of the point
estimate of standard deviation. Smaller of the standard error indicate that the point
estimate is likely to be more accurate because its variability about true value of
probability (p) is smaller.
Optimum or critical values are obtained from this equation. The values for the
coefficient of the model are obtained from the response surface methodology
calculation.

53
Table 13 : Optimum Value for each Parameter
From the model, the optimum values are:
Geometry (slice or cube) = 101.3327
Lactic acid concentration = 0.1700 M
Sucrose concentration = 53.6658 ˚Brix
Temperature = 37.4810 ˚C
The result of the analysis of a set of experimental data can be displayed in
table form known as the analysis of variance table. The analysis of variance table
displaying the total, regression (SS), and residual sums of squares (MS) as shown in
Table 14. The entries in the table represent sources that contribute to the total
variation in the data values. The total variation in the data values is called the “total
sum of squares”. Total sum of square is the sum of two quantities; the sum of square
due to the regression (SS) and sum of squares of the residuals (MS). The quantity of
total sum of square has associated with it N-1 degree of freedom (df) with N is the
total number of observations collected.
54
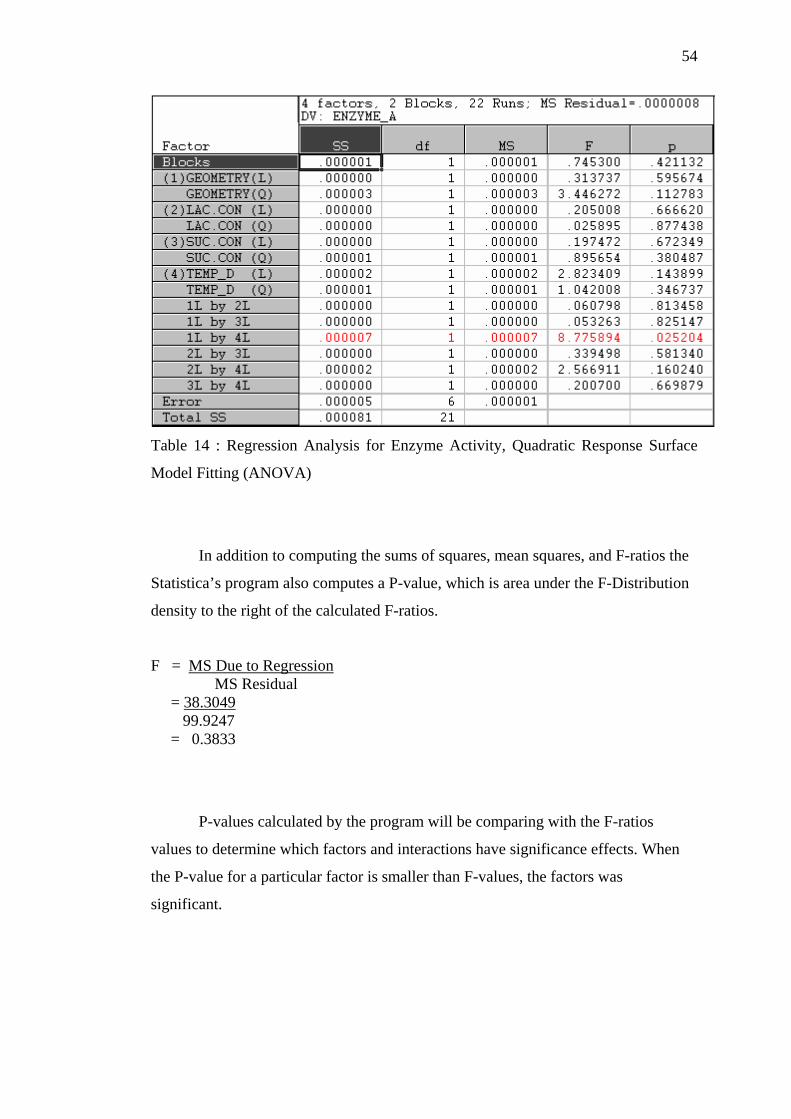
Table 14 : Regression Analysis for Enzyme Activity, Quadratic Response Surface
Model Fitting (ANOVA)
In addition to computing the sums of squares, mean squares, and F-ratios the
Statistica’s program also computes a P-value, which is area under the F-Distribution
density to the right of the calculated F-ratios.
F = MS Due to Regression MS Residual = 38.3049 99.9247 = 0.3833
P-values calculated by the program will be comparing with the F-ratios
values to determine which factors and interactions have significance effects. When
the P-value for a particular factor is smaller than F-values, the factors was
significant.

55
The Pareto chart from Figure 4.10 shows the ANOVA standardized effect
estimates sorted by their absolute size to indicate the minimum magnitude of
statistically significant effects.
Pareto Chart of Standardized Effects; Variable: ENZYME_A4 factors, 2 Blocks, 22 Runs; MS Residual=.0000008
DV: ENZYME_A
Effect Estimate (Absolute Value)
-.16092-.230788-.246573
.444378-.447995.4527776
-.560123.5826645
.8633075-.94639
-1.02079-1.60216
-1.68031.856414
2.962413
p=.05
LAC.CON(Q)1Lby3L1Lby2L
(3)SUC.CON(L)3Lby4L
(2)LAC.CON(L)(1)GEOMETRY(L)
2Lby3LBLOCK(1)
SUC.CON(Q)TEMP_D(Q)
2Lby4L(4)TEMP_D(L)
GEOMETRY(Q)1Lby4L
-0.5 0.0 0.5 1.0 1.5 2.0 2.5 3.0 3.5
Figure 4.10: Pareto Chart of Effect of Variables for Experimental Design of Enzyme
Activity.
The Pareto chart shows the effect estimate of the most important factor. In
this case, the most important factor is the interaction between temperature and
geometry, followed by geometry, temperature and sucrose concentration
respectively. Lactic acid concentration shows the least significant effect to the
experiment. From this result, we can decide that temperature and geometry is the
most important factor and helps to increase enzymatic activity in the product.
The result from the Pareto chart was as in the theory which is temperature is
the main factor affected to the enzyme.

56
0.002 0.003 0.004 0.004 0.005 0.006 0.006 0.007 0.008 0.008 above
Fitted Surface; Variable: ENZYME_A4 factors, 2 Blocks, 22 Runs; MS Residual=.0000008
DV: ENZYME_A
Figure 4.11 : Contour surface plot of enzyme activity value as function of the
geometry and lactic acid concentration.
z=23.116776632396-.45476785054866*x+.0022346296357955*x^2 +.23945552580742*y-.048842617767441*y^2-.002161235099074*x*y -.000010114416440681*53.6658*x+.000074599568516824*37.481*x +.00025535568975708*53.6658*y-.00046810267872745*37.481*y -.20602156

57
-8.521e-5 8.007e-4 0.002 0.003 0.003 0.004 0.005 0.006 0.007 0.008 above
Fitted Surface; Variable: ENZYME_A4 factors, 2 Blocks, 22 Runs; MS Residual=.0000008
DV: ENZYME_A
Figure 4.12 : Contour surface plot of enzyme activity value as function of the
geometry and sucrose concentration.
z=23.116776632396-.45476785054866*x+.0022346296357955*x^2 +.0015939358894136*y-.0000054774839779093*y^2 -.002161235099074*.17*x-.000010114416440681*x*y +.000074599568516824*37.481*x+.00025535568975708*.17*y -.00000065445379077491*37.481*y-.2381565

58
-0.006 -0.004 -0.003 -9.922e-4 5.468e-4 0.002 0.004 0.005 0.007 0.008 above
Fitted Surface; Variable: ENZYME_A4 factors, 2 Blocks, 22 Runs; MS Residual=.0000008
DV: ENZYME_A
Figure 4.13 : Contour surface plot of enzyme activity value as function of the
temperature and geometry.
z=23.116776632396-.45476785054866*x+.0022346296357955*x^2 -.0072011507232675*y-.0000032483884393514*y^2 -.002161235099074*.17*x-.000010114416440681*53.6658*x +.000074599568516824*x*y-.00046810267872745*.17*y -.00000065445379077491*53.6658*y+.111390137

59
-0.001 -8.044e-4 -3.234e-4 1.577e-4 6.387e-4 0.001 0.002 0.002 0.003 0.003 above
Fitted Surface; Variable: ENZYME_A4 factors, 2 Blocks, 22 Runs; MS Residual=.0000008
DV: ENZYME_A
Figure 4.14 : Contour surface plot of enzyme activity value as function of the lactic
acid concentration and sucrose concentration.
z=23.116776632396+.23945552580742*x-.048842617767441*x^2 +.0015939358894136*y-.0000054774839779093*y^2 -.002161235099074*101.3327*x-.000010114416440681*101.3327*y +.00025535568975708*x*y-.00046810267872745*37.481*x -.00000065445379077491*37.481*y-23.128108

60
-0.005 -0.004 -0.004 -0.003 -0.002 -8.664e-4 1.172e-5 8.898e-4 0.002 0.003 above
Fitted Surface; Variable: ENZYME_A4 factors, 2 Blocks, 22 Runs; MS Residual=.0000008
DV: ENZYME_A
Figure 4.15 : Contour surface plot of enzyme activity value as function of the
temperature and lactic acid concentration.
z=23.116776632396+.23945552580742*x-.048842617767441*x^2 -.0072011507232675*y-.0000032483884393514*y^2 -.002161235099074*101.3327*x+.000074599568516824*101.3327*y +.00025535568975708*53.6658*x-.00046810267872745*x*y -.00000065445379077491*53.6658*y-23.122209

61
-0.008 -0.007 -0.006 -0.004 -0.003 -0.002 -0.001 1.22e-4 0.001 0.002 above
Fitted Surface; Variable: ENZYME_A4 factors, 2 Blocks, 22 Runs; MS Residual=.0000008
DV: ENZYME_A
Figure 4.16 : Contour surface plot of enzyme activity value as function of the
temperature and sucrose concentration.
Using the optimum value from the model:
Geometry (slice or cube) = 101.3327
Lactic acid concentration = 0.1700 M
Sucrose concentration = 53.6658 ˚Brix
Temperature = 37.4810 ˚C
We can calculate the optimum enzyme activity from one of the equation from
the contour surface plot of enzyme activity value as function of the factors.
One of the models is Figure 4.16 that shows the contour surface plot of
enzyme activity value as function of the temperature and sucrose concentration.
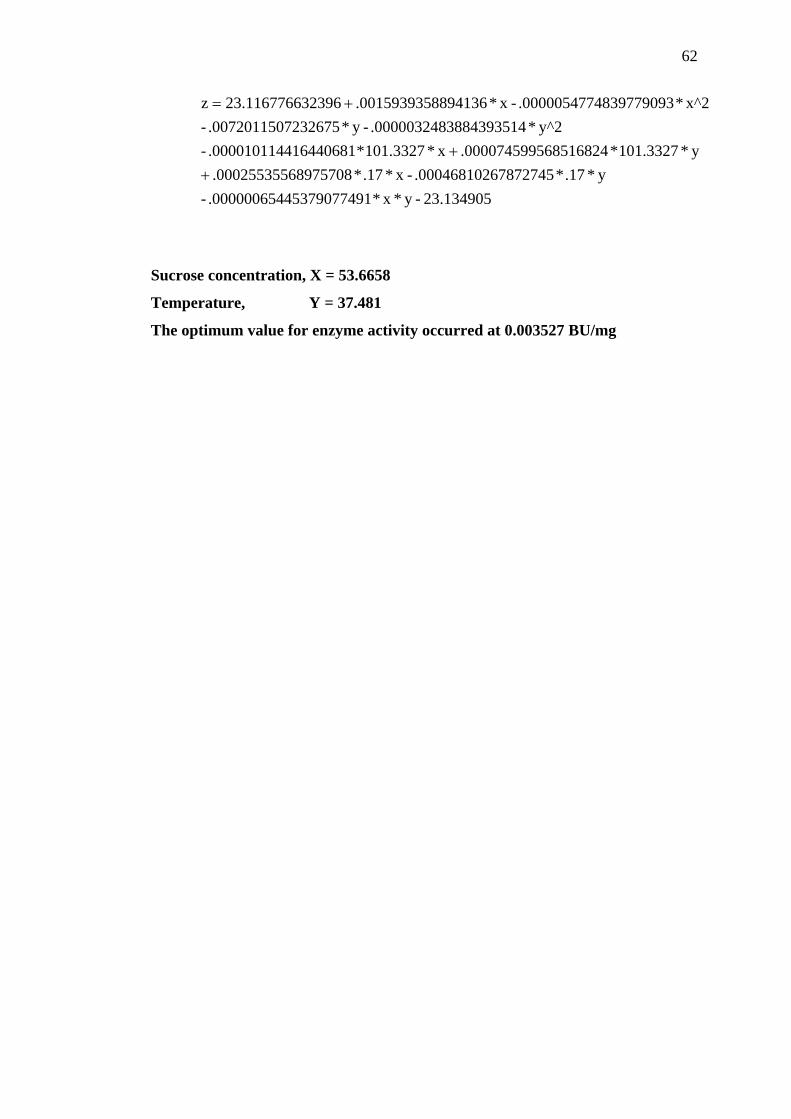
62
23.134905-y*x*14537907749.000000654-y*.17*67872745.000468102-x*.17*68975708.000255355
y*101.3327*568516824.000074599x*101.3327*416440681.000010114-y^2*3884393514.000003248-y*7232675.007201150-
x^2*4839779093.000005477-x*8894136.0015939353239623.1167766z
++
+=
Sucrose concentration, X = 53.6658
Temperature, Y = 37.481
The optimum value for enzyme activity occurred at 0.003527 BU/mg

63
4.1.3.2 Weight Reduction Analysis Using Experimental Design
Table 15: The Experimental and Theoretical Predicted Values
Table 15 shows the result of experimental and theoretical predicted values for
weight reduction, WR(%). The predicted response calculated by the program and the
graph observed versus predicted values shown in the Figure 4.12. Our goals is to find
the best values for the constant in the models which is the values of constant that
give the best fit to set of data. A good fit of the line to the data means that the line
should be as close to all the data points as possible.

64
Observed vs. Predicted Values4 factors, 2 Blocks, 22 Runs; MS Residual=99.92472
DV: WR_%
Observed Values
Pre
dict
ed V
alue
s
0
10
20
30
40
50
60
70
80
-10 0 10 20 30 40 50 60 70 80
Figure 4.17 : Graph Observed vs. Predicted Values for Weight Reduction Response
R2 is the fraction of the total variability in the data that is explained by the
model which is useful indicator of how closely the regression equation matches the
data. Figure 4.17 shows that the quadratic regression (R2) was significant at level of
0.919, which is considered high, since the R2 values provides a measure of the
variability of the observe response due to the experiment factor and their interaction.
The value of R2 is measured the total variation of observed value about the mean
obtained by the fitted model or correlation between the observed and predicted value
from the result.
65
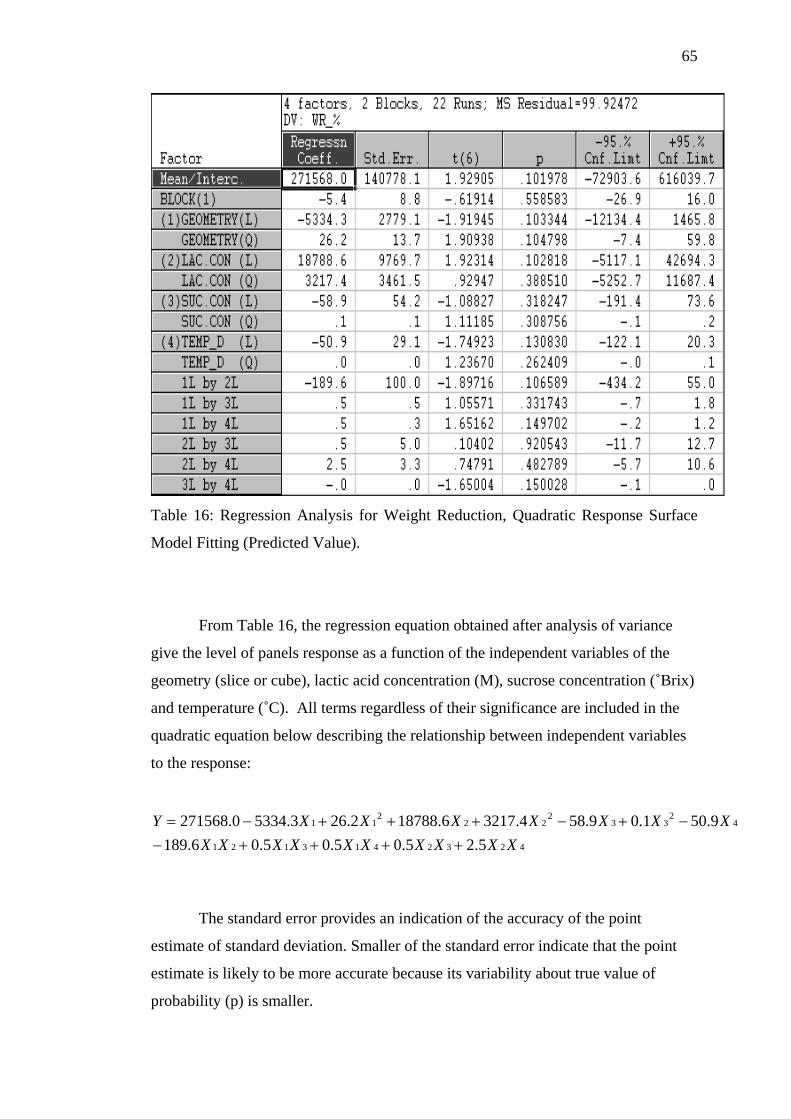
Table 16: Regression Analysis for Weight Reduction, Quadratic Response Surface
Model Fitting (Predicted Value).
From Table 16, the regression equation obtained after analysis of variance
give the level of panels response as a function of the independent variables of the
geometry (slice or cube), lactic acid concentration (M), sucrose concentration (˚Brix)
and temperature (˚C). All terms regardless of their significance are included in the
quadratic equation below describing the relationship between independent variables
to the response:
4232413121
42
332
222
11
5.25.05.05.06.1899.501.09.584.32176.187882.263.53340.271568
XXXXXXXXXXXXXXXXXY
++++−−+−+++−=
The standard error provides an indication of the accuracy of the point
estimate of standard deviation. Smaller of the standard error indicate that the point
estimate is likely to be more accurate because its variability about true value of
probability (p) is smaller.

66
Table 17 : Optimum Value for each Parameter
From the model, the optimum values are:
Geometry (slice or cube) = 100.9717
Lactic acid concentration = 0.0339 M
Sucrose concentration = 47.2674 ˚Brix
Temperature = 47.2369 ˚C
The result of the analysis of a set of experimental data can be displayed in
table form known as the analysis of variance table. The analysis of variance table
displaying the total, regression (SS), and residual sums of squares (MS) as shown in
Table 18. The entries in the table represent sources that contribute to the total
variation in the data values. The total variation in the data values is called the “total
sum of squares”. Total sum of square is the sum of two quantities; the sum of square
due to the regression (SS) and sum of squares of the residuals (MS). The quantity of
total sum of square has associated with it N-1 degree of freedom (df) with N is the
total number of observations collected.

67
Table 18 : Regression Analysis for Weight Reduction Values, Quadratic Response
surface Model Fitting (ANOVA)
In addition to computing the sums of squares, mean squares, and F-ratios the
Statistica’s program also computes a P-value, which is area under the F-Distribution
density to the right of the calculated F-ratios.
F = MS Due to Regression MS Residual = 38.3049 99.9247 = 0.3833
P-values calculated by the program will be comparing with the F-ratios
values to determine which factors and interactions have significance effects. When
the P-value for a particular factor is smaller than F-values, the factors was
significant.

68
The Pareto chart from Figure 1 shows the ANOVA standardized effect
estimates sorted by their absolute size to indicate the minimum magnitude of
statistically significant effects.
Pareto Chart of Standardized Effects; Variable: WR_%4 factors, 2 Blocks, 22 Runs; MS Residual=99.92472
DV: WR_%
Effect Estimate (Absolute Value)
.10402-.444317
-.619142.7479086
-.838831.9294719
1.0557131.111853
1.2366961.324221
-1.650041.651619
-1.897161.9093771.942882
p=.05
2Lby3L(1)GEOMETRY(L)
BLOCK(1)2Lby4L
(4)TEMP_D(L)LAC.CON(Q)
1Lby3LSUC.CON(Q)TEMP_D(Q)
(3)SUC.CON(L)3Lby4L1Lby4L1Lby2L
GEOMETRY(Q)(2)LAC.CON(L)
-0.5 0.0 0.5 1.0 1.5 2.0 2.5 3.0
Figure 4.18: Pareto Chart of Effect of Variables for Experimental Design of Weight
Reduction.
The Pareto chart shows the effect estimate of the most important factor. In
this case, the most important factor is lactic acid concentration, geometry of samples,
sucrose concentration and followed by temperature respectively. From this result, we
can decide that the lactic acid concentration is the most important factor and help to
increase weight reduction of samples. However, from the Pareto chart above, the
small differential value between lactic acid concentrations to the geometry of the
samples makes the geometry of the samples also as the main important factor to
increase percentage weight reduction of samples.

69
-2.873 9.594 22.061 34.528 46.995 59.462 71.929 84.396 96.863 109.33 above
Fitted Surface; Variable: WR_%4 factors, 2 Blocks, 22 Runs; MS Residual=99.92472
DV: WR_%
Figure 4.19: Contour Surface Plot of Weight Reduction Value as a Function of
Lactic Acid Concentration and Geometry.
4988.2448-y*47.2369*415912.49209024y*47.2674*55499.519904123x*47.2369*27146.474329329x*47.2674*44068.527657653
y*x*80902189.644405-y^2*553353217.39220y*7194818788.5631x^2*5668926.2121097x*834855334.28736-89165271568.017z
++++
+++=

70
-4.964 5.39 15.744 26.098 36.452 46.806 57.16 67.514 77.868 88.222 above
Fitted Surface; Variable: WR_%4 factors, 2 Blocks, 22 Runs; MS Residual=99.92472
DV: WR_%
Figure 4.20: Contour Surface Plot of Weight Reduction Value as a Function of
Sucrose Concentration and Geometry.
1660.4885-y*47.2369*732913.027490257-y*.0339*55499.519904123x*47.2369*27146.474329329y*x*44068.527657653
x*.0339*80902189.644405-y^2*829587.073390161y*4697358.9354481-x^2*5668926.2121097x*834855334.28736-89165271568.017z
+++
++=

71
-0.42 14.323 29.066 43.809 58.552 73.295 88.038 102.781 117.524 132.267 above
Fitted Surface; Variable: WR_%4 factors, 2 Blocks, 22 Runs; MS Residual=99.92472
DV: WR_%
Figure 4.21: Contour Surface Plot of Weight Reduction Value as a Function of
Temperature and Geometry.
1980.2938-y*47.2674*732913.027490257-y*.0339*415912.49209024y*x*27146.474329329x*47.2674*44068.527657653
x*.0339*80902189.644405-y^2*129873.044882298y*0279850.9190039-x^2*5668926.2121097x*834855334.28736-89165271568.017z
+++
++=

72
-3.733 7.829 19.391 30.953 42.515 54.077 65.639 77.201 88.764 100.326 above
Fitted Surface; Variable: WR_%4 factors, 2 Blocks, 22 Runs; MS Residual=99.92472
DV: WR_%
Figure 4.22: Contour Surface Plot of Weight Reduction Value as a Function of
Sucrose and Lactic Acid Concentration.
271414.91-y*47.2369*732913.027490257-x*47.2369*415912.49209024y*x*55499.519904123
y*100.9717*44068.527657653x*100.9717*80902189.644405-y^2*829587.073390161y*4697358.9354481-
x^2*553353217.39220x*7194818788.563189165271568.017z
+++
+++=

73
-0.039 15.064 30.166 45.269 60.371 75.473 90.576 105.678 120.78 135.883 above
Fitted Surface; Variable: WR_%4 factors, 2 Blocks, 22 Runs; MS Residual=99.92472
DV: WR_%
Figure 4.23: Contour Surface Plot of Weight Reduction Value as a Function of
Temperature and Lactic Acid Concentration.
271475.58-y*47.2674*732913.027490257-y*x*415912.49209024x*47.2674*55499.519904123
y*100.9717*27146.474329329x*100.9717*80902189.644405-y^2*129873.044882298y*0279850.9190039-
x^2*553353217.39220x*7194818788.563189165271568.017z
+++
+++=

74
2.332 19.82 37.309 54.798 72.286 89.775 107.263 124.752 142.24 159.729 above
Fitted Surface; Variable: WR_%4 factors, 2 Blocks, 22 Runs; MS Residual=99.92472
DV: WR_%
Figure 4.24: Contour Surface Plot of Weight Reduction Value as a Function of
Temperature and Sucrose Concentration.
271380.67-y*x*732913.027490257-y*.0339*415912.49209024x*.0339*55499.519904123
y*100.9717*27146.474329329x*100.9717*44068.527657653y^2*129873.044882298y*0279850.9190039-
x^2*829587.073390161x*4697358.9354481-89165271568.017z
++++
++=

75
CHAPTER IV
CONCLUSION
5.1 Comparison of different drying methods
The comparison of the product quality among three drying methods;
microwave drying, tray drying and osmotic dehydration process, cannot be made.
This is due to the different sample volume for each method. Nevertheless, the
conclusion of the effect of process variable on the product quality for each method is
stated in the next section.

76
5.2 Microwave drying of papaya fruit drinks
From the study, it can be concluded that microwave power intensity
influenced the drying characteristics of papaya fruit. As microwave power increased,
the drying rate increased. As to achieve moisture content to nearly zero during
microwave drying of papaya, increase in power intensity results in shorter drying
time. The processing time for microwave power 380 W and 750 W were slightly the
same. However for microwave power 110 W, the time required to remove the
moisture until low moisture content in papaya cubes is 20 minutes, compared to 4
minutes for 380 W and 750 W.
Drying rates were higher during higher moisture content and decreased with
decreasing moisture content. The drying rate increased with increasing of power
intensity at the same moisture content. The comparison made for power intensity
showed that at lower microwave power, the drying rate was low and increased during
higher power levels. The results indicated that mass transfer is rapid during larger
microwave power heating because more heat was generated within the samples,
creating a larger vapor pressure differential between the centre and the surface of
products (Lin et al., 1998). Although papayas have high moisture content, an
expected constant rate period was not observed in this study. It is obvious that the
entire drying process for the samples occurred in the range of falling rate period.
5.3 Tray drying of papaya fruit drinks
From the obtained result, it has been approved that temperature was the most
important factor affected the drying rate and quality of fresh papaya for each
geometry of slice and cube. Increase of air temperature and air velocity caused
reduction of moisture content. However, geometry cut was the most significant

77
factor played as a controlling effect on moisture content, in which larger surface
exposure helps temperature to take action strongly. Papaya slices suffered higher
water loss than cubes with regression level (R2) 0.932.
The best quality of papaya fruit drinks is determined by the minimum
moisture content and the maximum enzyme concentration retained. The summary
result obtained from statistical experimental design, showing that the minimum
moisture content is 0.8986 kg water/kg dry weight and the maximum enzyme activity
is 0.0042 U/mg. The optimal condition of moisture content corresponds at
coordinate point (1, 1, 40) of geometry, air velocity and temperature respectively
while optimal condition for enzyme activity was significant at coordinate point
(1,1,60).
5.4 Osmotic dehydration of papaya fruit drinks
The results obtained from all analysis were analyzed statistically using
Response Surface Methodology. The data were analyzed using regression procedure
to estimate the optimum parameters for each response variable.
The critical values for the parameters of enzyme activity response are;
geometry (101.33), lactic acid concentration (0.17M), sucrose concentration
(53.67°B) and temperature (37.48°C). The optimum value for enzyme activity
occurred at 0.003527 U/mg. The interaction between temperature and geometry
affected the quality of the product in term of enzyme activity. However, there is no
significant effect of temperature and geometry to the moisture content.

78
The critical values for water loss variable are; geometry (100.63), lactic acid
concentration (0.0000M), sucrose concentration (47.4348°B) and temperature
(48.6465°C). Geometry and sucrose concentration show the most effects on the
water loss of the product. The value of water loss was determined using the fitted
model. From the surface contour graph, it is concluded that higher sucrose
concentration with higher value geometry gives higher water loss. This is because
large size of sample geometry has larger amount of moisture content.
Osmotic dehydration technique is one of the best methods for pre-treatment
process before finish drying method such as conventional drying or microwave
drying.

REFERENCES
Akanbi, C.T., Adeyemi, R.S. and Ojo, A. (2005). Drying characteristics and sorption
isotherm of tomato slices. Journal of Food Engineering (Article in Press).
Araujo, E.A.F., Suezilde, R.C.A., Azoubel, P.M. & Xidieh Murr, F.E. (2004). Drying
kinetics of nactarine (Prunus persica) with and without shrinkage. Proceedings of
the 14th International Drying Symposium. Sao Paulo, Brazil, 2189-2194.
Arnon, R. (1970). Methods Enzymol. (Perlman, G.E. & Lorand L., eds.) Vol. 19, 226-44.
Papain.
Cui, Z.W., Xu, S.Y. & Sun, D.W. (2003). Dehydration of garlic slices by combined
microwave-vacuum and air drying. Drying Technology, 21(7), 1173-1185.
Cui, Z.W., Xu, S.Y. & Sun, D.W. (2004). Microwave-vacuum drying kinetics of carrot
slices. Journal of Food Engineering, 65, 157-164.
Drenth, J., Jansonius, J.N., Koekoek, R. and Wolthers, B.G. (1971). The Enzymes
(Boyer, P.D., ed.) 3rd edition, Vol. III, Academic Press, 485-99. Papain, X-ray
structure.
Drouzas, A.E. & Schubert, H. (1996). Microwave application in vacuum drying of fruits.
Journal of Food Engineering, 28, 203-209.
Drouzas, A.E., Tsami, E. & Saravacos, G.D. (1999). Microwave/vacuum drying of model
fruit gels. Journal of Food Engineering, 39, 117-122.

El-Aouar, A.A., Azoubel, P.M. & Xidieh Murr, F.E. (2003). Drying kinetics of fresh and
osmotically pre-treated papaya (Carica papaya L.). Journal of Food Engineering,
59, 85-91.
Elisabeth G. and Diane M. B. (2000). Preservative Treatments for Fresh-Cut Fruits and
Vegetables. Trends Food Science Technology. 14:7-11.
Funebo, T., Ahrné, L., Kidman, S., Langton, M. and Skjöldebrand, C. (2000). Microwave
heat treatment of apple before air dehydration – effects on physical properties and
microstructure. Journal of Food Engineering, 46, 173-182.
Garcia-Al Varado M. A., Salgado-Cervantes M. A., Rodriguez – Jimenes G. C., Tejero-
Andrade J. M., and Rosado-Zarrabal T. L. (2001). Determination of water
sorption isosteric heat in papaya (Carica papaya) by thermal analysis. Fruits.
56:6-16
Giraldo, G., Talens, P., Fito, P. & Chiralt, A. (2003). Influence of sucrose solution
concentration on kinetics and yield during osmotic dehydration of mango. Journal
of Food Engineering, 58, 33-43.
Glazier, A.N. & Smith, E.L. (1971). The Enzymes (Boyer, P.D., ed.) 3rd edition, Vol. lll,
Academic Press,501-46. Papain and other plant sulfhydryl proteolytic enzymes.
Graziella, C.A, Azoubel, P.M.,. Alves, D.G., El-Aouar, A.A. & Xidieh Murr, F.E. (2004).
Osmotic dehydration of papaya (Carica papaya L.): Influence of process
variables. Proceedings of the 14th International Drying Symposium Sao Paulo,
Brazil. 1998-2004.
Kouvonen, L. (1980). Biochem. Biophys. Acta 626, 244-53. Solubilization of the pig
ileal intrinsic factor receptor with papain treatment and studies on the solubilized
receptor.

Krokida, M.K. & Marinos-Kouris, D. (2003). Rehydration kinetics of dehydrated
products. Journal of Food Engineering, 57, 1-7.
Kullmann, W. (1982). Proc. Natl. Acad. Sci. USA 79, 2840-4. Protease-catalyzed peptide
bond formation: application to synthesis of the COOH-terminal octapeptide of
cholecystokinin.
Kullmann, W. (1984) .Biochem . J.220,405- 16. Kinetics of chymotrypsin-and papain-
catalysed synthesis of (leucine)enkephalin and (methionine)enkephalin.
Lenart, A. (1996). Osmo-convective drying of fruits and vegetables: technology and
application. Drying Technology, 14(2), 391-413.
Lin, W.S., Armstrong, D.A., and Gaucher, G.M. (1975.) Can. J. Biochem. 53, 298.
Formation and repair of papain sulfenic acid.
Matsumura, S. Kumon, A. and Chiba, T. (1985). J. Biol. Chem.260 (3),1959-66.
Proteolytic substructure of brain myosin.
Mitchel, R., Chaiken, I.M., and Smith, E.L. (1970). J. Biol. Chem. 245, 3485. The
complete amino acid sequence of papain. Additions and corrections.
Mujumdar, A.S. (1995). Chapter I. In: Mujumdar, A.S. Handbook of Industrial Drying
(2nd Edn.) p. 21.
Nono Y. J., Nuadje G. B., Anne-Lucie R.-W. and Francois G. (2000). Behavior of certain
tropical fruits during the watering-impregnation soaking process in sucrose
solutions. Fruits. 56:75-83.
Odisseia C. P. G., Eduador G., Dannielle J. S., H.Gerlane C., Magalhaes M. M. d. A. and
Edson L. d. O. (2004). Application of Model Difusional of Plain Plate in the
Drying of Tropical Fruits. Drying 2004 - Proceedings of the 14th International
Drying Symposium (IDS 2004) Sao Paulo, Brazil. C:2113-2119.

Oliveira, M.E.C. & Franca, A.S. (2002). Microwave heating of foodstuffs. Journal of
Food Engineering, 53(4), 347-359.
Pangavhane, D.R., Sawhney, R.L. & Sarsavadia, P.N. (1999). Effect of various dipping
pretreatment on drying kinetics of Thomson seedless grapes. Journal of Food
Engineering, 39, 211-216.
Park, K.J., Bin, A., & Brod, F.P.R. (2002). Drying of pear d’Anjou with and without
osmotic dehydration. Journal of Food Engineering, 56, 97-103.
Piotrowski, D., Lenart, A. & Wardzynski, A. (2004). Influence of osmotic dehydration on
microwave-convective drying of frozen strawberries. Journal of Food
Engineering, 65, 519-525.
Ramesh, M.N., Wolf, W., Tevini, D. & Jung, G. (2000). Influence of processing
parameters on the drying of spice paprika. Journal of Food Engineering, 4, 63-72.
Rastogi, N.K., Nayak, C.A. & Raghavarao, K.S.M.S. (2004). Influence os osmotic pre-
treatments on rehydration characteristics of carrots. Journal of Food Engineering,
65, 287-292.
Robert E. P., Chen W. (1997). Minimal Processing of Papaya (Carica papya L.) and the
Physiology of Halved Fruit. Postharvest Biology and Technology. 12: 93-99.
Sereno, A.M., Moreira, R. & Martinez, E. (2001). Mass transfer coefficients during
osmotic dehydration of apple in single and combined aqueous solution of sugar
and salt. Journal of Food Engineering, 47, 43-49.
Silveira, E.T.F., Rahman, M.S. & Buckle, K.A. (1996). Osmotic dehydration of
pineapple: kinetics and product quality. Food Research International, 29, 227-
233.

Sluyterman, L.AE. & DeGraaf, M.J.M. (1972). Biochim. Biophys. Acta 258, 554. The
effect of salts upon the pH dependence of the activity of papain and succinyl-papain.
Sluyterman, L.AE. (1967). Biochim. Biophys. Acta 139, 418
Smith, E.L. and Kimmel, J.R. (1960. The Enzymes (Boyer, P.D. et al. eds.) 2nd edition,
Vol. 4, Academic Press, 133- 73. Papain.
Stuchly, S.S. & Stuchly, M.A. (1983). Microwave Drying: Potential and Limitations. In:
Mujumdar, A.S. Advances in Drying, Volume II. Washington, New York,
London: Hemisphere Publishing Corporation. 53-71.
Telis-Romero J., Guizzo-Silva L.K., Telis V. R. N. (2003). Rheology Properties of
Rehydrated Papaya. Brazillian Journal of food Technology. 6(2):221-227
U. S. Patent Document Workman. 996623. August 1993. 426/597.
Van Arsdel, W.B., Copley, M.J. & Morgan, A.I. (1973). Food Dehydration , Vol. 2, (2nd
Edn.) . Van Nostrand/AVT Publishing, New York.
Vega-Mercado, H, Gongora-Nieto, M.M. & Barbosa-Canovas, G.V. (2001). Advances in
dehydration of foods. Journal of Food Engineering, 49, 271-289.
Vinci, G., Botrè, F., Mele, G. & Ruggieri, G. (1995). Ascorbic acid in exotic fruits: a
liquid chromatographic investigation. Food Chemistry, 53, 211-214.
Wang, J. & Sheng, K. (xxxx). Far-infrared and microwave drying of peach. Article in
Press.
Yongsawatdigul, J. & Gunasekaran, S. (1996). Microwave-vacuum drying of cranberries:
Part I. Energy use and efficiency. Journal of food processing and preservation,
20, 121-143.

EFFECT OF DRYING PARAMETERS AND GEOMETRY
ON PAPAYA QUALITY
NURUL ASYIKIN MD ZAKI*, LIZAWATI MOHD DARWI, LIZA MD. SALLEH, IDA
IDAYU MUHAMAD
Bioprocess Engineering Department, Faculty of Chemical Engineering and Natural Resources,
Universiti Teknologi Malaysia, 81310 Skudai, Johor.
Email: [email protected]
Due to the importance of minimizing thermal stresses over drying and maintenance of
relevant compounds, selection of proper drying condition is necessary to maintain the
quality of the processed fruit. The aim of this project is to study the effect of various
drying parameters i.e. temperature, air velocity and geometry cut on the quality of papaya
based on moisture content. Slices (0.5 x 1.5 x 1.5 cm) and cubes (1.0 cm) of papaya were
treated in tray drier (Armfield UOP8) at different levels of temperature (40, 50 and 60 ºC)
and air velocity (0.5, 1.0 and 1.5 m/s). Temperature was found to be significantly
influencing the drying performance for both slices and cubes. However, geometry was
the most significant factor played as a controlling effect on moisture content, in which
larger surface exposure helps temperature to take action strongly. Slices suffered higher
water loss than cubes with regression level (R2) 0.932.
Keywords: tray drying; papaya; moisture content; geometry; response surface
methodology

USM 4th Food Science and Technology Seminar 23 July 2005, Universiti Sains Malaysia
Effect of Osmotic Dehydration Parameters on
Papain Enzyme Activity of Papaya Nurul Asyikin Zaki*, Rosmaria Abu Darim, Liza Md Salleh, Ida Idayu Muhamad
Department of Bioprocess Engineering, Faculty of Chemical and Natural Resources Engineering, Universiti Teknologi Malaysia, 81310 UTM Skudai, Johor.
Email: [email protected]
Due to the increasing demands of fruit drink mixes, papaya fruit tea is proposed for
commercialization as a nutritious tea drink by maintaining the quality of the processed
fruit. The aim of this project is to study the effect of various processing parameters on
quality of the preserved papaya based on papain enzyme activity. Slices (1.5 x 1.5 x 0.5
cm) and cubes (1.0 cm) of papaya were treated in solution of sucrose (45, 55 and 65
ºBrix) and lactic acid (0, 0.005 and 0.10 M) under specified temperature (30, 40 and 60
ºC). Osmotic dehydration process was carried out for 24 hours. Analysis of papain
enzyme activity was then carried out. Analysis of variance (ANOVA) using Statistica
5.0 was performed to determine the lack of fit and the significance of the product effect
of the independent variables on the quality attributes. Preservation of fruit by osmotic
dehydration has been proved to increase product quality retention. A unique processing
technique of papaya fruit tea has been established by optimization of the dehydration
process.
Keywords: papaya, osmotic dehydration, papain, enzyme activity, response surface

Effect of Microwave Power Intensity on Drying Characteristic of Carica papaya L.
Nurul Asyikin Zaki*, Ida Idayu Muhamad, Liza Md. Salleh
Bioprocess Engineering Department, Faculty of Chemical Engineering and Natural Resources,
Universiti Teknologi Malaysia, 81310 Skudai, Johor. Email: [email protected]
Microwave drying is of increased interest among food researchers. The
microwave power plays an important part to ensure that the product quality is improved.
The aim of this project is to study the effect of power intensities during microwave
dehydration on drying characteristics of Carica papaya L. Papaya cubes of 2 cm were
treated in microwave oven at different power levels (110W, 380W and 750W) until the
moisture content reached nearly zero. The effect of changing the microwave power
intensity on the drying characteristics of papaya cubes is studied. The drying rate
increased with increasing of power intensity at the same moisture content. Higher
microwave power level results in shorter drying time.
Keywords: papaya, microwave drying, drying characteristics, moisture content
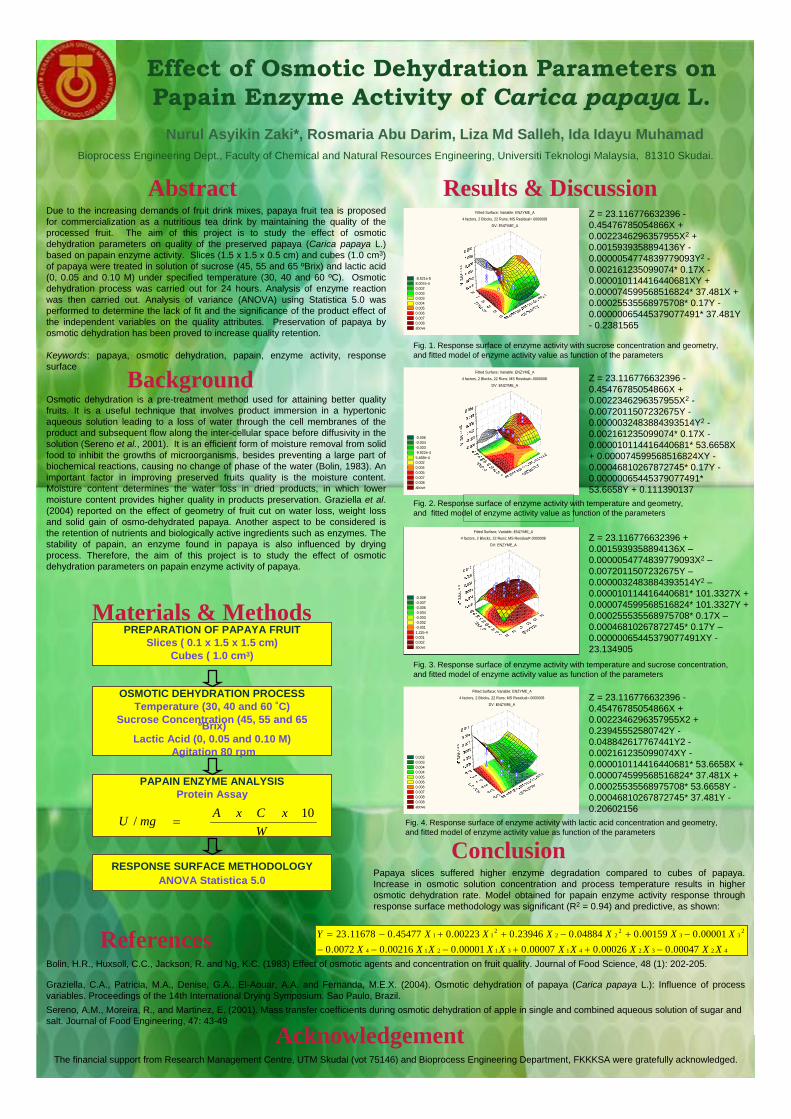
Effect of Osmotic Dehydration Parameters onPapain Enzyme Activity of Carica papaya L.
Nurul Asyikin Zaki*, Rosmaria Abu Darim, Liza Md Salleh, Ida Idayu MuhamadBioprocess Engineering Dept., Faculty of Chemical and Natural Resources Engineering, Universiti Teknologi Malaysia, 81310 Skudai.
Abstract
Acknowledgement
Due to the increasing demands of fruit drink mixes, papaya fruit tea is proposed for commercialization as a nutritious tea drink by maintaining the quality of the processed fruit. The aim of this project is to study the effect of osmotic dehydration parameters on quality of the preserved papaya (Carica papaya L.) based on papain enzyme activity. Slices (1.5 x 1.5 x 0.5 cm) and cubes (1.0 cm3) of papaya were treated in solution of sucrose (45, 55 and 65 ºBrix) and lactic acid (0, 0.05 and 0.10 M) under specified temperature (30, 40 and 60 ºC). Osmotic dehydration process was carried out for 24 hours. Analysis of enzyme reaction was then carried out. Analysis of variance (ANOVA) using Statistica 5.0 was performed to determine the lack of fit and the significance of the product effect of the independent variables on the quality attributes. Preservation of papaya by osmotic dehydration has been proved to increase quality retention.
Keywords: papaya, osmotic dehydration, papain, enzyme activity, response surface
The financial support from Research Management Centre, UTM Skudai (vot 75146) and Bioprocess Engineering Department, FKKKSA were gratefully acknowledged.
Background Osmotic dehydration is a pre-treatment method used for attaining better quality fruits. It is a useful technique that involves product immersion in a hypertonic aqueous solution leading to a loss of water through the cell membranes of the product and subsequent flow along the inter-cellular space before diffusivity in the solution (Sereno et al., 2001). It is an efficient form of moisture removal from solidfood to inhibit the growths of microorganisms, besides preventing a large part of biochemical reactions, causing no change of phase of the water (Bolin, 1983). An important factor in improving preserved fruits quality is the moisture content. Moisture content determines the water loss in dried products, in which lower moisture content provides higher quality in products preservation. Graziella et al. (2004) reported on the effect of geometry of fruit cut on water loss, weight loss and solid gain of osmo-dehydrated papaya. Another aspect to be considered is the retention of nutrients and biologically active ingredients such as enzymes. The stability of papain, an enzyme found in papaya is also influenced by drying process. Therefore, the aim of this project is to study the effect of osmotic dehydration parameters on papain enzyme activity of papaya.
References
Graziella, C.A., Patricia, M.A., Denise, G.A., El-Aouar, A.A. and Fernanda, M.E.X. (2004). Osmotic dehydration of papaya (Carica papaya L.): Influence of process variables. Proceedings of the 14th International Drying Symposium. Sao Paulo, Brazil.
Bolin, H.R., Huxsoll, C.C., Jackson, R. and Ng, K.C. (1983) Effect of osmotic agents and concentration on fruit quality. Journal of Food Science, 48 (1): 202-205.
Sereno, A.M., Moreira, R., and Martinez, E. (2001). Mass transfer coefficients during osmotic dehydration of apple in single and combined aqueous solution of sugar and salt. Journal of Food Engineering, 47: 43-49
Conclusion Papaya slices suffered higher enzyme degradation compared to cubes of papaya. Increase in osmotic solution concentration and process temperature results in higher osmotic dehydration rate. Model obtained for papain enzyme activity response through response surface methodology was significant (R2 = 0.94) and predictive, as shown:
42324131214
233
222
211
00047.000026.000007.000001.000216.00072.000001.000159.004884.023946.000223.045477.011678.23
XXXXXXXXXXXXXXXXXY
−++−−−−+−++−=
Results & Discussion
Fig. 1. Response surface of enzyme activity with sucrose concentration and geometry, and fitted model of enzyme activity value as function of the parameters
Fig. 2. Response surface of enzyme activity with temperature and geometry, and fitted model of enzyme activity value as function of the parameters
-8.521e-5 8.007e-4 0.002 0.003 0.003 0.004 0.005 0.006 0.007 0.008 above
Fitted Surface; Variable: ENZYME_A4 factors, 2 Blocks, 22 Runs; MS Residual=.0000008
DV: ENZYME_A
Fig. 3. Response surface of enzyme activity with temperature and sucrose concentration, and fitted model of enzyme activity value as function of the parameters
-0.006 -0.004 -0.003 -9.922e-4 5.468e-4 0.002 0.004 0.005 0.007 0.008 above
Fitted Surface; Variable: ENZYME_A4 factors, 2 Blocks, 22 Runs; MS Residual=.0000008
DV: ENZYME_A
-0.008 -0.007 -0.006 -0.004 -0.003 -0.002 -0.001 1.22e-4 0.001 0.002 above
Fitted Surface; Variable: ENZYME_A4 factors, 2 Blocks, 22 Runs; MS Residual=.0000008
DV: ENZYME_AZ = 23.116776632396 + 0.0015939358894136X –0.0000054774839779093X2 –0.0072011507232675Y –0.0000032483884393514Y2 –0.000010114416440681* 101.3327X + 0.000074599568516824* 101.3327Y + 0.000255535568975708* 0.17X –0.00046810267872745* 0.17Y –0.00000065445379077491XY -23.134905
Z = 23.116776632396 -0.45476785054866X + 0.0022346296357955X2 -0.0072011507232675Y -0.0000032483884393514Y2 -0.002161235099074* 0.17X -0.000010114416440681* 53.6658X + 0.000074599568516824XY -0.00046810267872745* 0.17Y -0.00000065445379077491* 53.6658Y + 0.111390137
Z = 23.116776632396 -0.45476785054866X + 0.0022346296357955X2 + 0.0015939358894136Y -0.0000054774839779093Y2 -0.002161235099074* 0.17X -0.000010114416440681XY + 0.000074599568516824* 37.481X + 0.00025535568975708* 0.17Y -0.00000065445379077491* 37.481Y - 0.2381565
Materials & Methods
OSMOTIC DEHYDRATION PROCESSTemperature (30, 40 and 60 ˚C)
Sucrose Concentration (45, 55 and 65 ºBrix)Lactic Acid (0, 0.05 and 0.10 M)
Agitation 80 rpm
PREPARATION OF PAPAYA FRUITSlices ( 0.1 x 1.5 x 1.5 cm)
Cubes ( 1.0 cm3)
RESPONSE SURFACE METHODOLOGYANOVA Statistica 5.0
PAPAIN ENZYME ANALYSISProtein Assay
WxCxAmgU 10/ =
0.002 0.003 0.004 0.004 0.005 0.006 0.006 0.007 0.008 0.008 above
Fitted Surface; Variable: ENZYME_A4 factors, 2 Blocks, 22 Runs; MS Residual=.0000008
DV: ENZYME_A
Fig. 4. Response surface of enzyme activity with lactic acid concentration and geometry, and fitted model of enzyme activity value as function of the parameters
Z = 23.116776632396 -0.45476785054866X + 0.0022346296357955X2 + 0.23945552580742Y -0.048842617767441Y2 -0.002161235099074XY -0.000010114416440681* 53.6658X + 0.000074599568516824* 37.481X + 0.00025535568975708* 53.6658Y -0.00046810267872745* 37.481Y -0.20602156

Effect of Microwave Power Intensity onDrying Characteristics of Carica papaya L.
Nurul Asyikin Zaki*, Ida Idayu Muhamad, Liza Md. SallehBioprocess Engineering Department, Faculty of Chemical Engineering and Natural Resources,
Universiti Teknologi Malaysia, 81310 Skudai, Johor.
Abstract
Background
Results & Discussion
Materials & Methods
Conclusion
References
Acknowledgement
Microwave drying is of increased interest among food researchers. The microwave power plays an important part to ensure that the product quality is improved. The aim of this project is to study the effect of power intensities during microwave dehydration on drying characteristics of Carica papaya L. Papaya cubes of 2 cm3
were treated in microwave oven at different power levels (110W, 380W and 750W) until the moisture content reached 0.1 kg/kg d.b. The effect of changing the microwave power intensity on the drying characteristics of papaya cubes is studied. The drying rate increased remarkably with the increase of power intensity at the same moisture content. Higher microwave power level results in shorter drying time.
Keywords: papaya, microwave drying, drying characteristics, moisture content
Papaya (Carica papaya L.) has been regarded as one of the most valuable tropical fruits that contains beta carotene, protein, carbohydrate, vitamins and minerals. Thus processing and preservation of papaya is important to improve the product quality and retain its nutritional value. Selection of proper drying technique and conditions is necessary to optimize the drying performance while retain the quality of the dehydrated product. In recent years, microwave drying has offered an alternative way to improve the quality of the dehydrated products.
Major advantages of microwave drying of foods are higher drying rate, energy saving and uniform temperature distribution giving a better product quality (Wang and Sheng, 2005). The microwave energy penetrates directly into the material, causes volumetric heating from the inside out of the material and provides fast and uniform heating throughout the entire product. The quick energy absorption by water molecules causes rapid evaporation of water, resulting in higher drying rate of the food and creating an outward flux of rapidly escaping vapor. Because the removal of moisture is accelerated, the heat transfer to the solid is slowed down significantly due to the absence of convection (Wang and Xi, 2005). The increased drying rate and lower heat transfer provides energy saving of microwave drying. The aim of this project is to study the effect of microwave power intensities on drying characteristics of Caricapapaya L.
The financial support from Research Management Centre, UTM Skudai (vot 75146) and Bioprocess Engineering Department, FKKKSA were gratefully acknowledged.
Funebo, T., Ahrné, L., Kidman, S., Langton, M. and Skjöldebrand, C. (2000). Microwave heat treatment of apple before air dehydration – effects on physical properties and microstructure. Journal of Food Engineering, 46, 173-182.Maskan, M. (2000). Microwave/air and microwave finish drying of banana. Journal of Food Engineering, 44, 71-78.Wang, J. & Sheng, K. (2005). Far-infrared and microwave drying of peach. Food Science and Technology, In Press, Corrected Proof.Wang, J. & Xi, Y.S. (2005). Drying characteristics and drying quality of carrot using a two-stage microwave process. Journal of Food Engineering, 68, 505-511.
Microwave power intensity influences the drying characteristics of papaya fruit. The drying rate increased remarkably with the increase of power intensity at the same moisture content. Higher microwave power level during microwave drying of papaya cubes results in shorter drying time.
Fig. 1. Moisture ratio versus time at different microwave power intensities
Fig. 2. Drying rate versus moisture content at different microwave power intensities
The effect of changing the microwave power intensity on the drying characteristics of papaya cubes is shown in Figure 2. Drying rates were higher at higher moisture content and decreased with the reduce of moisture content. The drying rate increased remarkably with power intensity at the same moisture content. The comparison between different power intensities showed that using lower microwave power, the drying process was slower. When higher power levels were used, the drying process was more rapid as illustrated by the gradients. These indicated that using large microwave power, more heat was generated within the samples causing rapid mass transfer creating a large vapor pressure differential between the centre and the surface of products (Lin et al., 1998). Although papayas have high moisture content, an expected constant rate period was not observed in this study. It is obvious that the entire drying process for the samples occurred in the range of falling rate period.
PREPARATION OF PAPAYA FRUITHand-peeled and Cut
Cubes ( 2.0 cm3)
MICROWAVE DRYING PROCESS(Wang & Sheng, 2005)
Power Intensity (110W, 380W, 750W)
MOISTURE CONTENT DETERMINATIONOven Method (Funebo, 2000)
dryweightdryweightWetweightntentMoistureCo −
=
Figure 1 shows the moisture ratio versus time during microwave drying of papaya cubes at different power intensities. As the microwave power intensity increased, the time required to achieve low moisture content i.e.0.1 kg/kg d.b. decreased. Four and five minutes processing times were required for microwave power 380W and 750W respectively. However for 110W, longer time was required i.e. 14 minutes.
0
1
2
3
4
5
6
0 1 2 3 4 5 6
Moisture Content (kg/kg d.b.)
Dry
ing
Rat
e (k
g/kg
d.b
./min
)
110 W
380 W
750 W
0
0.1
0.2
0.3
0.4
0.5
0.6
0.7
0.8
0.9
1
0 200 400 600 800 1000 1200
Time (s)
Moi
stur
e R
atio
110 W
380 W
750 W

RESEARCH MANGEMENT CENTRE FOR OFFICIAL USE ONLY PROGRESS REPORT FOR FUNDAMENTAL RESEARCH GRANT FOR EVERY 6 MONTH AFTER PROJECT APPROVED …………. (CIRCLE ONE) (Please TYPE and submit only ONE (1) copy. Please be brief with MAXIMUM of 4 pages). NAME OF PROJECT LEADER : DR. IDA IDAYU BINTI MUHAMAD UTM I/D NO : 7307
VOTE NO : 75146
i) SEO CODE ii) FOR CODE
SEO & FOR CODE ( Please check with the recent MASTIC handbook (ed. 1999) for the updated codes. Please ignore them if the recent codes were similar to the ones in your project proposal (UTM/RMC/F/0001(1999) or if you have noted in your previous progress report. 1. (a) PROJECT TITLE : EFFECT OF PROCESSING PARAMETERS ON THE DRYING OF PAPAYA FRUIT TEA
(b) PROJECT OBJECTIVE(S) : To study the effect of various processing parameters on quality of papaya fruit tea
2. NEW RESEARCHERS : NAME POSITION (CHOOSE ONE CODE)* UTM ID (i) ………………………………………………………….. …………………………… …………… (ii) ………………………………………………………….. …………………………... …………….
RESEARCHERS WHO LEFT THE PROJECT : POSITION (CHOOSE ONE CODE)* UTM ID NAME : (i) …………………………………………………………. …………………………… …………… (ii) …………………………………………………………. …………………………… …………… * Position’s code : Researcher (1), Research Assistant (2), Research Officer (3), Fellowship (4), MSc. (5), Ph. D Student (6) 3. APPROVED PERIOD : STARTING DATE: 01/09/2004 EXPECTED COMPLETION DATE: ___________ 4. PROBLEM FACED (Pleased tick)
YES NO YES NO
FUNDING ( ) ( / ) MANPOWER ( ) ( / ) EXECUTION ( ) ( / ) EQUIPMENT ( ) ( / ) TIME ( ) ( / ) LACK OF INTEREST ( ) ( / ) SPACE ( ) ( / ) OTHER (briefly detail-out) …………………………………………………………………………………………………………………………………………….……. ……………………………………………………………………………………………………………………………………………….….
HAVE YOU HIGHLIGHTED THE ABOVE PROBLEMS TO RMC/FACULTY? ……………………………………………………………………………………………………………………………………………….….
5. LIST OF EQUIPMENT BOUGHT USING THIS VOT
Vacuum pump, pH meter, Blender, Hotplate Stirrer
-1-
Date Received i) JKKP : …………..………. ii) RMC : ……………….…. No. of Report : ……………….….
S F

06. OPERATION PLAN :
MONTH No. PROJECT ACTIVITIES
1 2 3 4 5 6 7 8 9 10 11 12 1
Literature study
2 3 4 5 6 7
Fruit selection and brix index determination Equipment purchasing and installation Experiment and data analysis Evaluation studies Process optimization of product Technology transfer activities
Milestone completed
Milestone not completed 7. a) SUMMARY OF RESEARCH PROGRESS TILL THE DATE OF THIS PROJECT
The objective of this research is to study the effect of various processing parameters on the quality of papaya fruit tea. Studies that have been carried out:
i) Drying of papaya by tray dryer, determination of moisture content and papain enzyme activity of dried product, evaluation of drying parameters effect on the product quality, and process optimization by statistical analysis.
ii) Preservation of papaya by osmotic dehydration, determination of moisture content and papain enzyme activity of preserved product, evaluation of processing parameters effect on the product quality, and process optimization by statistical analysis.
iii) Drying of papaya by microwave oven, determination of moisture content and vitamin C retention of dried product, and study of effect of drying parameters on the quality of dried product.
b) LIST OF PAPERS PRESENTED/PUBLISHED FOR THE LAST SIX MONTHS (INCLUDE TITLE NAMES, DATE, PLACE, AND ORGANIZER/PUBLISHER) (Please enclosed a copy of each paper)
1. Effect of Microwave Power Intensity on Drying Characteristics of Carica papaya L. 22 November 2005, Genting Highlands Resort First International Symposium on Papaya 2. Effect of Osmotic Dehydration Parameters on Papain Enzyme Activity of Carica papaya L. 23 July 2005, Universiti Sains Malaysia USM 4th Food Science and Technology Seminar 3. Effect of Drying Parameters on Moisture Content and Papain Enzyme Activity of Dried Papaya 23 July 2005, Universiti Sains Malaysia USM 4th Food Science and Technology Seminar 4. Effect of Microwave Dehydration Parameters on the Quality of Dehydrated Papaya 26 October 2005, Universiti Teknologi Malaysia 1st Stage Master’s Degree Proposal Presentation, FKKKSA 5. Effect of Drying Parameters and Geometry Cut on Papaya Quality
2 & 3 May 2005, Primula Beach Resort, Kuala Terengganu KUSTEM 4th Annual Seminar on Sustainable Science and Management 6. The Study of Effect of Various Processing Parameters on Quality Papaya Fruit Tea 31 March 2005, Universiti Teknologi Malaysia Thesis Presentation, Bioprocess Engineering Department, FKKKSA 7. Effect of Processing Parameters on the Drying of Papaya Fruit Tea 31 March 2005, Universiti Teknologi Malaysia Thesis Presentation, Bioprocess Engineering Department, FKKKSA
- 2 -

c) STATUS OF RESULTS (Please Tick)
YES NO
COMMERCIALISEABLE ( ) ( ) PATENTABLE ( ) ( ) EXHIBITABLE ( ) ( )
d) FINDINGS
The research findings are:- i) For tray drying process, papain enzyme is best retained in the following condition: Drying temperature 60 ºC, Air velocity 1.0 m/s, Geometry Cube ii) For tray drying process, the optimum value for moisture content variable are: Drying temperature 40 ºC, Air velocity 0.5 m/s, Geometry Cube iii) For osmotic dehydration process, papain enzyme is best retained in the following condition: Lactic acid 0.17M, Sucrose 55 ºBrix, Temperature 40 ºC iv) For osmotic dehydration process, the optimum value for moisture content variable are: Lactic acid 0.00M, Sucrose 50 ºBrix, Temperature 50 ºC v) For microwave drying process, moisture content and vitamin C concentration is higher in papaya cubes compared to
slices.
8. FUTURE PLAN
Recommendations: Further experiments and analysis such as sensory evaluation of the papaya fruit tea coloring, taste and aroma shall be carried out. Commercialization of papaya fruit tea as nutritious healthy drinks shall be considered.
9. FINANCIAL STATUS (1 Sept 2004 – 31 Dec 2005)
Project Cost Components Approved Fund Allocation Actual Spending (RM) Balance (RM)
* Equipment/Accessories/ Repairs * Materials and Supply * Travel/Transportation * Wage/Allowance/ Other Services
6 818.00 5 014.35 1 804.00 14 988.45
Total 48 000.00 28 624.80
% SPENT : 100%
10. SIGNATURE OF PROJECT LEADER …………………………………. DATE : 26 May 2006
- 3 -

EVALUATION (hand written)
a) JKPP FACULTY
Research status ( ) ( ) ( ) ( ) ( ) ( ) Spending ( ) ( ) ( ) ( ) ( ) ( ) Overall Status ( ) ( ) ( ) ( ) ( ) ( )
Excellent Very Good Good Satisfactorily Fair Weak Faculty’s response to problem faced by researcher ……………………………………………………………………………………………………………………………………….. ……………………………………………………………………………………………………………………………………….. ……………………………………………………………………………………………………………………………………….. Comment/Suggestion ……………………………………………………………………………………………………………………………………….. ……………………………………………………………………………………………………………………………………….. ……………………………………………………………………………………………………………………………………….. ………………………………………... Name : …………………………………… (Signature and stamp of JKP chairman)
Date : …………………………
b) RMC
Research status ( ) ( ) ( ) ( ) ( ) ( ) Spending ( ) ( ) ( ) ( ) ( ) ( ) Overall Status ( ) ( ) ( ) ( ) ( ) ( )
Excellent Very Good Good Satisfactorily Fair Weak
Academic standing : ………………………………………………………………………………………………………………………………………..
………………………………………………………………………………………………………………………………………..
……………………………………………………………………………………………………………………………………….. Notes : ……………………………………………………………………………………………………………………………………….. ……………………………………………………………………………………………………………………………………….. ……………………………………………………………………………………………………………………………………….. ……………………………………………. Name: ………………………………… Signature and stamp of Dean/Deputy Dean Research and Management Centre Date : ………………………….. - 4 -

UNIVERSITI TEKNOLOGI MALAYSIA
UTM/RMC/F/0024 (1998)
BORANG PENGESAHAN
LAPORAN AKHIR PENYELIDIKAN TAJUK PROJEK : EFFECT OF VARIOUS PROCESSING PARAMETERS
ON THE QUALITY OF PAPAYA FRUIT TEA Saya, DR. IDA IDAYU BINTI MUHAMAD____________________
Mengaku membenarkan Laporan Akhir Penyelidikan ini disimpan di Perpustakaan Universiti Teknologi Malaysia dengan syarat-syarat kegunaan seperti berikut :
1. Laporan Akhir Penyelidikan ini adalah hakmilik Universiti Teknologi Malaysia.
2. Perpustakaan Universiti Teknologi Malaysia dibenarkan membuat salinan untuk tujuan rujukan sahaja.
3. Perpustakaan dibenarkan membuat penjualan salinan Laporan Akhir
Penyelidikan ini bagi kategori TIDAK TERHAD.
4. * Sila tandakan ( / )
SULIT (Mengandungi maklumat yang berdarjah keselamatan atau Kepentingan Malaysia seperti yang termaktub di dalam AKTA RAHSIA RASMI 1972). TERHAD (Mengandungi maklumat TERHAD yang telah ditentukan oleh Organisasi/badan di mana penyelidikan dijalankan). TIDAK TERHAD TANDATANGAN KETUA PENYELIDIK
Nama & Cop Ketua Penyelidik Tarikh : _________________
√
CATATAN : * Jika Laporan Akhir Penyelidikan ini SULIT atau TERHAD, sila lampirkan surat daripada pihak berkuasa/organisasi berkenaan dengan menyatakan sekali sebab dan tempoh laporan ini perlu dikelaskan sebagai SULIT dan TERHAD.
Lampiran 20

1
UTM/RMC/F/0014 (1998)
UNIVERSITI TEKNOLOGI MALAYSIA Research Management Centre
PRELIMINARY IP SCREENING & TECHNOLOGY ASSESSMENT FORM
(To be completed by Project Leader submission of Final Report to RMC or whenever IP protection arrangement is required) 1. PROJECT TITLE IDENTIFICATION :
EFFECT OF PROCESSING PARAMETERS ON THE DRYING OF PAPAYA FRUIT TEA
Vote No:
2. PROJECT LEADER :
Name : DR. IDA IDAYU MUHAMAD
Address : BIOPROCESS ENGINEERING DEPT, FKKKSA, UNIVERSITI TEKNOLOGI
MALAYSIA, SKUDAI.
Tel : 07-5535541 Fax : 07-5581463 e-mail : [email protected]
3. DIRECT OUTPUT OF PROJECT (Please tick where applicable)
4. INTELLECTUAL PROPERTY (Please tick where applicable) Not patentable Technology protected by patents
Patent search required Patent pending
Patent search completed and clean Monograph available
Invention remains confidential Inventor technology champion
No publications pending Inventor team player
No prior claims to the technology Industrial partner identified
Scientific Research Applied Research Product/Process Development Algorithm Method/Technique Product / Component Structure Demonstration / Process Prototype Data Software
Other, please Other, please Other, please specify specify specify ___________________ __________________ ___________________________ ___________________ __________________ ___________________________ ___________________ __________________ ___________________________
75146

2
UTM/RMC/F/0014 (1998)
5. LIST OF EQUIPMENT BOUGHT USING THIS VOT
Vacuum pump pH meter Blender Hotplate Stirrer
6. STATEMENT OF ACCOUNT
a) APPROVED FUNDING RM : …………………………
b) TOTAL SPENDING RM : …………………………
c) BALANCE RM : ………………………… 7. TECHNICAL DESCRIPTION AND PERSPECTIVE
Please tick an executive summary of the new technology product, process, etc., describing how it works. Include brief analysis that compares it with competitive technology and signals the one that it may replace. Identify potential technology user group and the strategic means for exploitation. a) Technology Description
Papaya fruit tea is proposed to be a healthy beverage because of its nutraceutical value with
biologically active ingredients that can promote health and is consumed as nutritional
supplement.
b) Market Potential
Tea is the most widely consumed beverage in the world. The total tea produced for
consumption is black tea (78%), green tea (20%) and oolong tea (2%). The market of these
herb and fruit based tea is increasing as these teas are claimed to have nutraceutical values as
well as medicinal values. According to 2nd Industrial Master Plan 1996-2005, Malaysia’s share
of world trade in processed fruit is negligible at only 0.2% despite of wide variety of tropical fruit
available for export. With well-planned and systematic approaches, the marketing of this fruit
based tea will increase at our local market, and will possibly be accepted over the world.

3
c) Commercialization Strategies
For commercialization purposes, this papaya fruit tea is mainly aimed to be distributed to hotels,
franchise restaurants, spas and salons, in order to promote its beneficial use and medicinal value
to consumers.
8. RESEARCH PERFORMANCE EVALUATION
a) FACULTY RESEARCH COORDINATOR Research Status ( ) ( ) ( ) ( ) ( ) ( ) Spending ( ) ( ) ( ) ( ) ( ) ( ) Overall Status ( ) ( ) ( ) ( ) ( ) ( ) Excellent Very Good Good Satisfactory Fair Weak
Comment/Recommendations : _____________________________________________________________________________
_____________________________________________________________________________
_____________________________________________________________________________
_____________________________________________________________________________
_____________________________________________________________________________
………………………………………… Name : ………………………………………
Signature and stamp of Date : ……………………………………… JKPP Chairman
UTM/RMC/F/0014 (1998)
4
RE
b) RMC EVALUATION
Research Status ( ) ( ) ( ) ( ) ( ) ( ) Spending ( ) ( ) ( ) ( ) ( ) ( ) Overall Status ( ) ( ) ( ) ( ) ( ) ( ) Excellent Very Good Good Satisfactory Fair Weak
Comments :- _____________________________________________________________________________
_____________________________________________________________________________
_____________________________________________________________________________
_____________________________________________________________________________
_____________________________________________________________________________
_____________________________________________________________________________
Recommendations :
Needs further research
Patent application recommended
Market without patent
No tangible product. Report to be filed as reference
……………………………………………….. Name : ………………………………………
Signature and Stamp of Dean / Deputy Dean Date : ………………………………………. Research Management Centre
UTM/RMC/F/0014 (1998)