Embed Size (px)
Citation preview
Stress Tests and Texas Banks: An Analysis of Capital Adequacy Measurements for
Banks in the Dallas FDIC Region
Joe Barber and Peter Kraus1
[email protected] ; [email protected]
School of Business
LeTourneau University
February 2015
ABSTRACT: This financial analysis seeks to make use of historical data for a selected sample of financial
institutions to see if accurate predictions can be made concerning future financial stability. As a partial
examination of stress tests and their effect on banks, this study attempts to simulate stress test conditions by
using relevant variables to explain past financial performance, thereby providing a foundation for an estimation
of the future condition of the subject banks. Focusing on smaller banks under the control of the Dallas FDIC
field office, this study is by no means comprehensive, but rather seeks to make use of a small study sample to
determine what factors influence the accuracy of capital adequacy measurement systems on a more general
scale. The findings of this study indicate a high overall financial stability of the institutions tested as well as a
tendency of institutions with higher initial levels of capital adequacy to experience greater decreases in the same
during periods of adverse market conditions.
Keywords: stress test, variables, risk of default, FDIC, capital adequacy measurement
JEL Classifications: G17, G21
This paper was written and prepared under the guidance and instruction of Juan R. Castro, Professor of
Economics and Finance, School of Business, LeTourneau University
Prepared for the 2015 Economics Scholar Program
Dallas Federal Reserve
An Analysis of Capital Adequacy Measurements for Banks in the Dallas FDIC Region
Introduction and Literature Review
The concept of stress testing can be characterized as both innovative and controversial. With many
advocates and critics alike, stress test models have proved at times to be invaluable and at others completely
insufficient as means of predicting reactions to economic scenarios. As a rather recent development, stress tests
faced a harsh trial by fire during the recent recession, a period renowned for its foiling of various financial
models and systems. Currently, the Federal Deposit Insurance Corporation (FDIC) imposes requirements on
financial institutions that attempt to promote both accountability and preparedness on the part of these firms.
While requirements vary based on the size of a given institution, stress tests are conducted for a wide array of
firms, with the following three conditions being most common: 1) stress tests conducted by FDIC on largest
financial institutions, 2) stress tests conducted by institutions and reported to FDIC per requirements, and 3)
stress tests conducted by institutions for internal purposes only. This study, while not fitting the exact profile of
any one of these options, seeks to make use of public financial data to predict risk of default for a chosen
sample of banks. Also, a set of variables is studied in an effort to determine which financial data factors have
the most influence on the accuracy of a given capital adequacy measurement system.
In a working paper published by the Federal Reserve Bank of Atlanta, Larry Wall compares the Basel III
and stress tests models of measuring capital adequacy in order to determine whether the newer stress test model
1 Research conducted under the instruction and guidance of Juan R. Castro Ph.D. Professor of Finance and Economics, School of Business, LeTourneau University ([email protected])
has any place in a Basel-dominated structure. Given the fact that the costly Basel system has existed in some
form for over two decades, this paper seeks to ascertain the value of the stress test model. It should be noted
that the stress test model is relatively new, having been “pressed into service in early 2009 to help restore
confidence to the banking system” by means of an on-going annual Dodd-Frank requirement. 2 According to
Wall, his study seeks to discover how stress tests could potentially alleviate and provide alternatives to any
weaknesses present in the Basel system. Wall concludes his introduction by listing two reason that stress tests
can be beneficial: 1) stress tests give supervisors additional flexibility, and 2) stress tests “measure the losses
associated with specific scenarios” 3 rather than all banking risks.
The body of the paper provides an in-depth study of the weaknesses of both models and how stress tests
might cover errors from the Basel model. Wall concludes by stating that the Basel model essentially views a
wide spectrum of possibilities in general detail, while stress tests provide a detailed study of only one scenario.
Thus, stress tests are generally more accurate when specific situations are being tested; stress tests also attempt
to predict future events, while Basel III is not as forward-oriented. In conclusion, both models have
weaknesses, but stress tests have the potential to mitigate Basel weaknesses for three main reasons: “(a) stress
test errors are unlikely to be perfectly correlated with Basel III errors, (b) stress tests are less reliant on models
run by the banks, and (c) stress test scenarios can be designed to address weaknesses in both the Basel III risk
weightings and supervisors’ perception of estimation error in the stress test models.” 4 Also, the effectiveness
with which stress tests will mitigate these weaknesses depends on the models implemented by supervisors.
Kupiec’s short work, “Scrapping Basel III for Stress Tests Would Be a Big Mistake,” provides a short
yet succinct summary of reasons the author does not support the exclusive utilization of stress tests in the
financial world. While Kupiec does not dismiss all the positive attributes of stress tests, he presents a
compelling argument against the Fed’s potential use of this model in the future as the sole determinant of capital
adequacy. The main concern voiced in this work concerns statements made by Daniel Tarullo, a Federal
Reserve Board Governor, who made statements earlier this year favoring the adoption of the stress test model
over the Basel III model. Kupiec indicates that he has had much experience with stress tests and that this
familiarity with such a controversial topic has revealed many faults of stress tests that must be taken into
account before a major decision is made.
Since stress tests are future-oriented, Kupiec points out that stress tests must serve a dual purpose of
predicting financial crises and estimating financial loss. Describing these goals as “gigantic measurement
problems,” both of which are “easier said than done,” Kupiec expresses doubt that the model’s goals can be
adequately achieved.5 Kupiec’s doubt seems to stem from multiple failures of the stress test model to predict
financial ruin; several examples of recent botched attempts are provided, including the widely-recognized
housing agencies Fannie Mae and Freddie Mac, both of which are said to have passed stress test requirements
not long before their respective failures. In case his reader thinks such examples are anomalies or ancient
history, Kupiec also notes that as recently as this year stress tests failed to spot a significant aberration in a
major financial institution’s balance sheet. Assuming stress tests do predict financial crises, however, Kupiec
maintains that accurate loss predictions for individual banks are highly unlikely. Two main reasons are given
for this statement: 1) banks tend to be regional, thus altering the effect of a financial crisis for different banks;
2) bank losses are only loosely correlated to macroeconomic conditions and tend to have a lagged effect when
correlation does exist. Kupiec states that, with all his experience with stress tests being considered, “the best
2 Wall, Larry, “Measuring Capital Adequacy: Supervisory Stress Tests in a Basel World” (Federal Reserve Bank of Atlanta, 2014), 1. 3 Wall, Larry, “Measuring Capital Adequacy: Supervisory Stress Tests in a Basel World” (Federal Reserve Bank of Atlanta, 2014), 3. 4 Wall, Larry, “Measuring Capital Adequacy: Supervisory Stress Tests in a Basel World” (Federal Reserve Bank of Atlanta, 2014), 19-20. 5 Kupiec, P., “Scrapping Basel III for Stress Tests Would Be a Big Mistake” (American Banker, 2014), 1.
econometric models . . . typically explain only about 25% of the quarterly variation in individual banks profits
and losses,” implying that most variation remains unexplained.6 Kupiec concludes by noting that large margins
of error are unavoidable when using stress tests, and he makes a case for an improved Basel III model that could
provide a beneficial compromise between the two models.
Annual Stress Test, a report issued earlier this year by the Office of the Federal Register, outlines
potential changes to stress tests models to be implemented by the Federal Depository Insurance Corporation
(FDIC) in 2016. The policy changes discussed in the report are interesting, but perhaps of greater value are the
key background information and stress test characteristics provided throughout the work. In short, the proposed
change involves a potential alteration in the timeline under which banks must operate when reporting stress test
results. Although the given timeframes imposed by the FDIC on regulated banks vary depending on certain
bank characteristics (usually amount of total assets), the yearly rotation used for gathering financial data to be
used remains the same across the industry. According to the report, all relevant banks operate on a cycle that
begins October 1 and ends September 30 of a given year. Thus, after September banks gather data to be used in
stress tests reports due the following calendar year. The difference in reporting timelines depends on which of
the two classifications of a “covered bank” a given institution falls under: “a state nonmember bank or state
savings association that has total consolidated assets from (1) $10 billion to $50 billion or (2) over $50 billion.” 7 For the former covered banks, stress test results must be reported by March 31, with a published summary to
follow during the latter half of June; the latter covered banks have a shorter timeframe for reporting and
publishing results, with January 5 and late March serving as respective deadlines. The report indicates,
following the explanation of these deadlines, that the FDIC is aware that many financial institutions face both
additional regulatory deadlines and resource constraints during the very period in which testing must be
conducted. The solution summarized in this report is a proposal to shift the stress test cycle to match a calendar
year (January 1 – December 31); also, the FDIC would provide the scenarios to be used in the stress test models
in February rather than November. These changes would push back reporting deadlines to July 31 for smaller
covered banks and April 7 for large covered banks. Small and large covered banks would be required to publish
the results of the testing by late October and late July, respectively. The FDIC hopes such changes will allow
banks to meet deadlines while providing results that accurately reflect the financial condition of financial
institutions.
In addition to providing information on upcoming policy changes, the report also provides useful
information regarding bank classifications and stress test requirements. For example, the report reveals that the
Board of Governors of the FDIC conducts stress tests on banks with assets totaling over $50 billion, whereas
smaller institutions (greater than $10 billion) are required to conduct the tests themselves and report the results.
Another interesting fact disclosed is that there are “approximately 2,363 small [$175 million or less in assets]
state nonmember banks and state savings associations,” 8 most of which fall outside of major policy changes
that apply only to much larger banks. While stress tests can be conducted by individual financial institutions,
the FDIC is mainly concerned with larger banks that have billions of dollars’ worth of assets. Most discussions
of FDIC-regulated stress tests will therefore concern these larger institutions.
In the working paper, “An International Survey of Stress Tests,” the author highlights the importance of
stress testing through conducting a survey of large international banks. Stress tests are described as “a risk
management tool that measures a firm’s exposure to extreme movements in asset prices.” 9 Stress tests measure
the impact of market shocks on financial firms and observe how much the firm is affected in its operations and
6 Kupiec, P., “Scrapping Basel III for Stress Tests Would Be a Big Mistake” (American Banker, 2014), 2. 7 Best, V.J., Annual Stress Test (Federal Depository Insurance Corporation, 2014), 2. 8 Best, V.J., Annual Stress Test (Federal Depository Insurance Corporation, 2014), 5. 9 Ingo Fender, Michael S. Gibson, and Patricia C. Mosser, "An International Survey of Stress Tests" (Volume 7, No. 10, 2001), 1.
overall portfolio. This paper presents the two most common methods of stress testing—sensitivity stress tests
and stress test scenarios. The first type focuses on the changes in asset prices which result from an impact on
portfolio value. The stress test scenario method is more difficult to conduct since it focuses on a variety of
factors that could have an impact on portfolio value and asset prices. These factors include interest rates, equity
prices, exchange rates, and interest rate spreads. This method uses either past market events or possible events
that are prone to occur in the future. In the survey conducted by central banks from the Group of Ten countries
in the summer of 2000, financial institutions were asked to identify the role of stress tests in risk management.
A majority of the institutions responded that stress testing is used to help banks better understand their risk
profiles and senior managers to become better informed of the results so that appropriate actions can be taken in
capital allocation to alleviate the effects of potential market shocks.
In Douglas J. Elliott’s working paper entitled “Bank Capital and the Stress Tests,” the author provides a
detailed explanation of capital and how it relates to stress tests. Like many sources from previous literature
reviews, Elliott defines “stress tests” as an examination of financial institutions’ health regarding their adequacy
to withstand worse-than-expected future recessions. Therefore, in times of bad economic environment,
financial institutions that have completed stress testing will be able to anticipate losses from their loans and
investments and provide a protective covering that will alleviate the initial market shock.
According to stress levels determined by various factors and different models used to calculate portfolio
risk, banks are sometimes required to hold more than a sufficient amount of capital to provide a financial
cushion in case of severe market shocks. In more specific terms, banks are required to raise temporary funds to
meet their Tier 1 capital ratio of 6%, which is considered by regulators as “well-capitalized.” Tier 1 capital is
described as the measurement of financial strength that primarily focuses on common stock and retained
earnings in the view of bank regulators. Banks who have failed the requirements are required raise the
necessary funds within six months immediately following the stress test. If banks fail to acquire these funds,
the Treasury interferes by purchasing new preferred securities from the banks so that a sufficient level of capital
will be achieved. However, the downside of this action is that these preferred securities are automatically
converted to common stocks after seven years at a 10% discount if banks fail to return the funds to the
Treasury. This method is intended to provide equity to banks when needed to anticipate possible economic
downturn, while at the same time, these institutions are pressured to improve their economic stability without
falling into the ownership of the Fed.
In the short working paper titled “Stress Testing Practice for Risk Management,” Marius Motocu
presents new risk-management practices at financial institutions. These policies have revolutionized overtime
to a more statistical model based approach to measure and evaluate market risk, credit risk and operational risk.
These stress test models have been widely accepted by financial institutions because of its effectiveness in
determining, analyzing and communicating all risks to senior management. Stress tests provide two major
pieces of information that are essential for risk management: the probability of losses under severe and
unfavorable market conditions and the different scenarios in which these losses can occur. The author also
highlights the main requirements for financial institutions (mostly large regulated commercial banks) to meet
capital requirements under the stress testing requirements of Basel II which were implemented in 2006. This
supervisory document emphasizes three key elements for stress tests: plausibility (determines all the possible
stress scenarios that could be exposed and exacerbate losses), severity (stress test developed in effort to identify
most adverse scenarios based on unique characteristics of the bank), and usefulness (the capacity of the bank to
generate sufficient capital to cover potential losses and be able to minimize risk while conserving capital).
Originally, VaR (Value at Risk) models were the standard tools for risk-management. This method of
risk measurement uses historical data to predict risk and possible losses. However, VaR models contain many
shortcomings that limit their ability to generate accurate results or capture spontaneous market changes;
therefore, “stress tests” were developed to address this very issue in expanding the financial variables that could
have an impact a bank’s portfolio value. Some of these stress-testing variables include interest rate, equity,
foreign exchange, and commodity instruments.
In the paper “Systematic Scenario Selection – Stress Testing and the Nature of Uncertainty,” Mark D.
Flood and George G. Koreko present an efficient and systematic technique for identifying multidimensional
shock scenarios for the purpose of stress testing. Under traditional stress testing, regulators simulate market
shocks by choosing one or more scenarios that could possibly impact the firm’s portfolio value. The paper
emphasizes the importance of carefully choosing the scenarios due to the costly price of both computational and
organizational requirements of stress tests. Furthermore, banks must also carefully choose market scenarios due
to the possible result of plausibility or reliability. Some scenarios might be irrelevant and insignificant, leading
to mislead test results. The authors suggest that, to avoid such mistakes, banks might look into conducting a
reverse stress test which requires answers to some inverse questions regarding effecting factors. Reverse stress
testing has proven to be effective in choosing the right scenarios to provide relevant outcomes.
Data
This study makes use of both historical and year-to-date data to determine the financial stability of the
chosen bank sample. The regression models for the Tier One capital ratio, the capital adequacy ratio, and the
core capital (leverage) ratio utilize YTD data gathered from the FDIC website that is current as of June 30th of
this year (2014). For these models, variables are selected based on an apparent relevance to the given response
variables; a complete list of the twenty predictor variables used for these models can be found in Appendix A.
It is important to note that these variables, while relevant to the given model and quite useful in predicting data
significance, are not chosen based on any specific formula but rather on their significance to the various
dependent variables as reasoned by the authors. Virtually endless studies could be conducted using all sorts of
financial variables, but this study only seeks to use those most likely to have great effect on determining capital
adequacy within a financial institution. In conclusion, the three regression models here discussed make use of
spot data for the selected sample of banks that provides values for a chosen set of twenty variables as of this
year.
Historical data also plays a major role in the running of a stress test regression and ratings based system.
The final study—that in which a ratings-based system is utilized in order to provide indication of future bank
default—utilizes the following four variables obtained through numerous official sources: 10
U.S. unemployment rate
U.S. GDP in billions of current dollars
Federal funds effective rate (percent per year)
U.S. inflation, consumer prices (annual percentage)
For this part of the study, data is utilized that covers the most recent ten years (2004-2013), with 2014 not being
included due to a lack of data. Each variable consists of a single data entry for each year within this period, as
the data is listed in annual terms. This model also makes use of historical data for the Tier One capital ratio of a
chosen sample of financial institutions, obtained from the FDIC website and covering the same time period as
10 GDP data was obtained from the following source: http://bea.gov/national/index.htm; Federal funds data was obtained from the following source: http://federalreserve.gov/releases/h15/data.htm; inflation data was obtained from the following source: http://databank.worldbank.org/data/viws/reports/tableview.aspx#; unemployment data was obtained from the following source: http://data.bls.gov/timeseries/LNS14000000
the four independent variables mentioned above. This historical model places the Tier One capital ratio as the
dependent variable, with the four independent variables as predictors.
Methodology
Three key elements comprise the methodology section of this study: 1) the running of multiple
regression equations using the tier one capital ratio, the capital adequacy ratio, and the core capital leverage
ratio as response variables; 2) the development of a ratings-based system that attempts to imitate the CAMELS
system used by regulators when analyzing financial institutions; and 3) the running of a stress test regression
that uses historical data for GDP, inflation, unemployment, and the federal funds rate as predictors and the Tier
One capital ratio for a sample of banks as the response. The first element, as mentioned in the data section,
utilizes spot data for a sample of 100 banks to determine what factors affect capital adequacy the most. The
second element groups these 100 banks into categories based on their Tier One capital ratio values and selects a
bank from each category to serve as the subject, and the third element uses these classifications to first
determine how the four mentioned variables affect capital adequacy and second to evaluate how stress test
conditions such as negative changes in the four variables impact capital adequacy of a selected sample of banks.
Selection of Texas Banks
This study seeks to demonstrate how stress testing models influence local Texas banks. When providing
parameters for the data search, institution type, size, and location are restricted in the following manner:
The type of financial institution included in the study is limited to insured commercial banks,
thus eliminating insured savings institutions and insured branches of foreign banks from the sample
data.
The size of chosen institutions is limited based on total assets to $175 million or less, thus
ensuring that only those institutions defined as “small” and outside of major FDIC policies per
Annual Stress Test are examined (see Literature Review).
Institution location is initially limited to the Dallas FDIC geographic region. This region
includes the states of Arkansas, Colorado, Louisiana, Mississippi, New Mexico, Oklahoma,
Tennessee, and Texas. To create a more localized study, the data is subsequently limited to the
Dallas supervisory region of the FDIC, which includes just four of the above states (Colorado, New
Mexico, Oklahoma, and Texas). This region contains eight field offices (Albuquerque, Dallas,
Houston, Oklahoma, Austin, Denver, Lubbock, and Tulsa); for this study, the data used is limited to
include only those institutions under the Dallas field office.
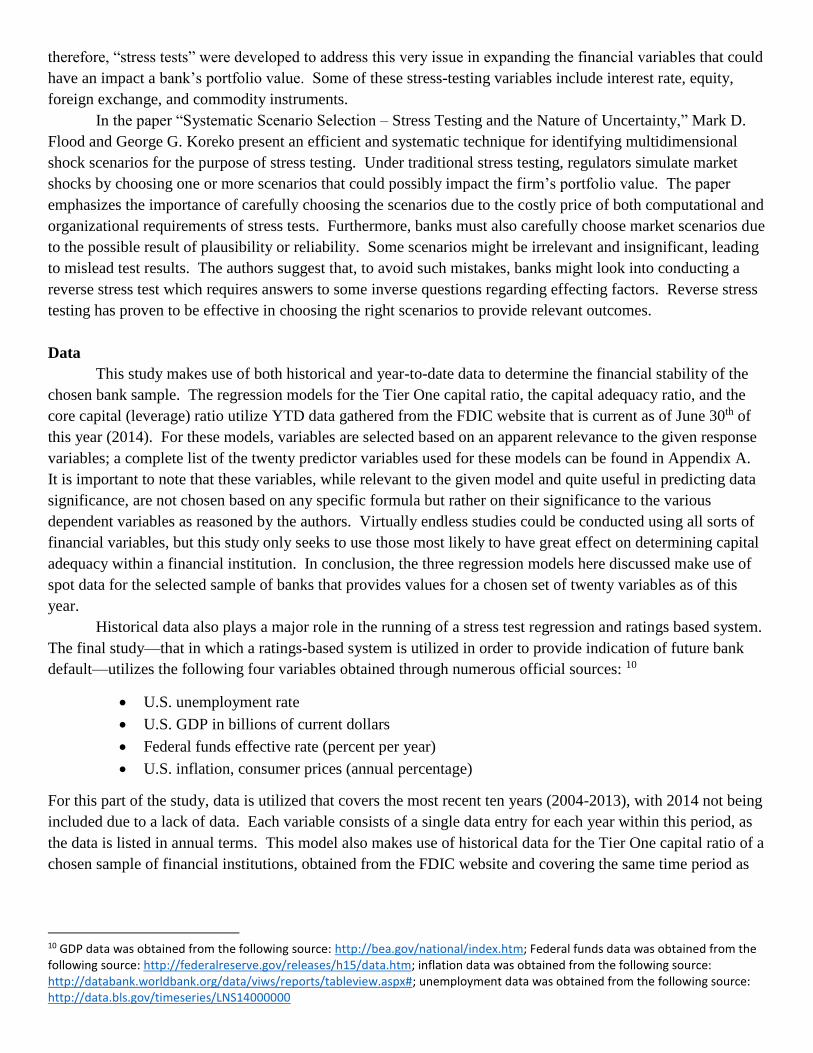
The restrictions mentioned above yield a sample of exactly 100 banks to be tested. The FDIC website and
database allows data to be gathered either in cumulative—sum total figures of all 100 banks combined—or as
individual numbers for each institution. For this study, emphasis is placed on statistics for individual banks
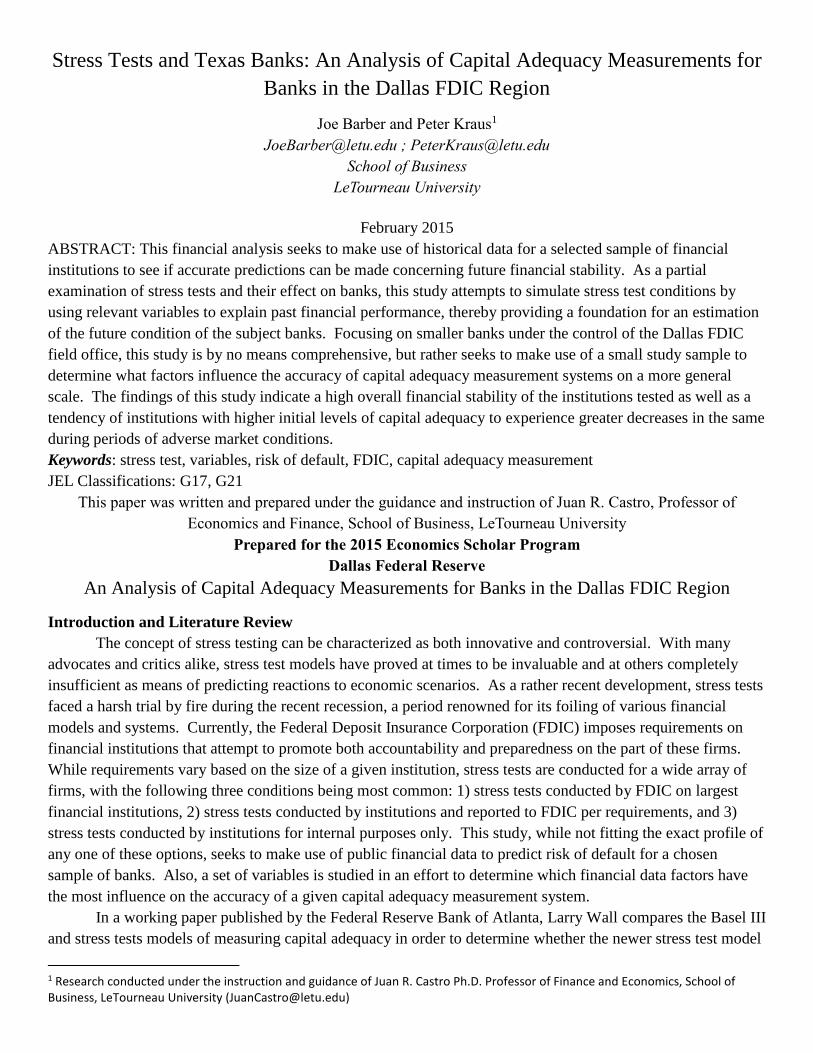
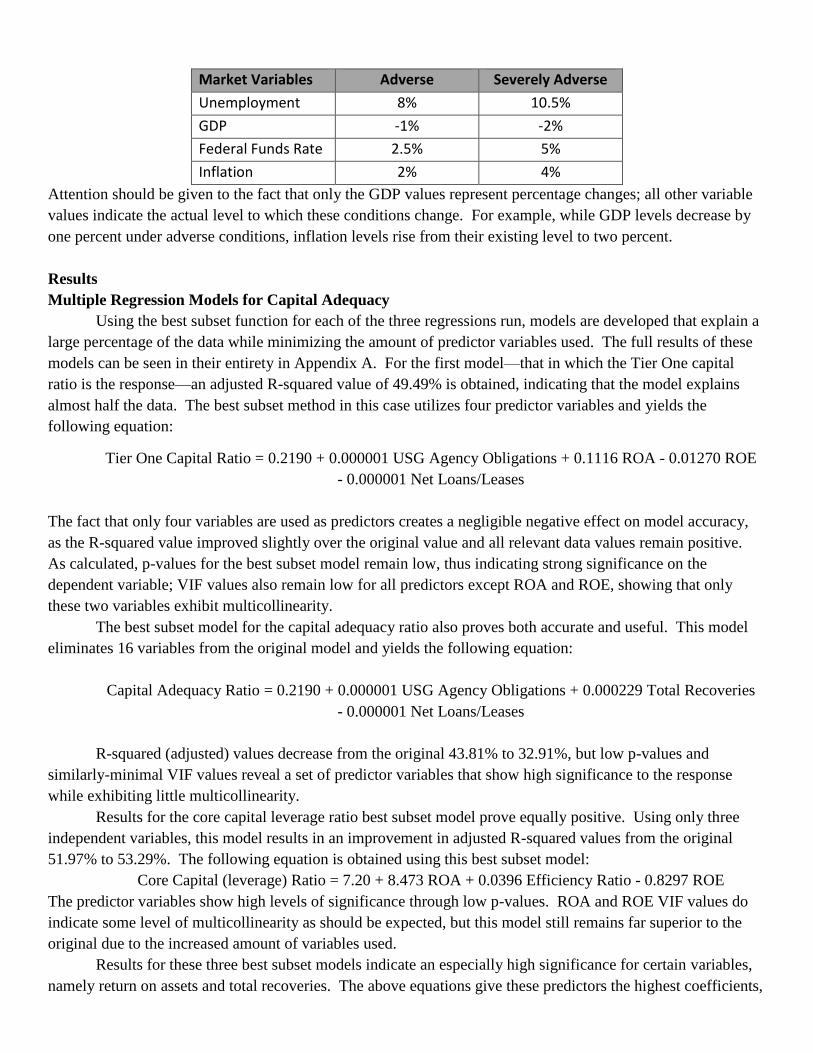
within the overall sample. While the size of the chosen institutions varies, many of the major characteristics
remain relatively similar. The chart below shows, for example, the linear relationship between total assets and
total liabilities for these institutions.

In addition, this study benefits from certain diversity within the model sample, as all banks, regardless of size,
must meet achieve a certain level of capital adequacy to remain free of the possibility of default. Stress tests
and numerous variations thereof can be applied to a wide array of institutions or agencies, and this study seeks
to provide a similar set of results as do the various capital adequacy measurement systems currently in use in
the financial market.
Stress tests as conducted by the FDIC or individual financial institutions provide an indication of a
firm’s capital adequacy given a prescribed and hypothetical set of economic circumstances. In simpler terms,
stress tests attempt to replicate various financial scenarios or crises in order to determine a firm’s financial
stability. While stress test models vary per institution, the overall goal is the same—make use of existing
historical data to create scenarios that will test and predict future performance of banks or other institutions.
This study, as limited by a lack of future-oriented or hypothetical scenario-testing, is limited to the use of
existing data to show what factors have the most influence on capital adequacy. In other words, while this
study is capable of explaining existing values using available data, limitations do exist that restrict the
effectiveness of future-oriented study or predictions. Regardless, the authors believe that the implementation of
negative changes on major predictor variables and conditions will in some ways provide insight as to future
financial institution performance should such conditions actually degenerate. Although not a perfect replica of
actual regulatory stress tests, this study still uses these tests as a comparison for several key reasons:
Stress tests focus on capital adequacy, the topic of this study.
Stress tests are controversial models which require additional study.
Stress test models remain a discreet and private method of measurement, so little public data
exists that would facilitate the replication of a true stress test in the public sector.
Adequate information and resources do exist to facilitate the primitive manipulation of a model’s
economic factors in an effort to determine how such changes would actually affect a financial
institution’s capital adequacy.
Capital Adequacy Measurement
Capital adequacy values and ratios for financial institutions have long been used as indicators of
financial stability. When considered as part of regulatory functions, capital adequacy values normally face
minimum levels that must be met or exceeded in order for an institution to be deemed financially stable. Such
values tend to be portrayed as ratios, or percentages for which a lowest-acceptable standard is set. Banks whose
capital adequacy ratios exceed these standards face no issues from a regulatory perspective; any banks whose
0
20000
40000
60000
80000
100000
120000
140000
160000
180000
200000
0 20000 40000 60000 80000 100000 120000 140000 160000 180000
Tota
l Ass
ets
(th
ou
san
ds)
Total Liabilities (thousands)
Sample Banks - Total Assets vs Total Liabilities
ratios prove deficient, however, are subject to additional scrutiny and possibly intervention from the overseeing
federal institution.
In order to make sense of such ratios, however, it is first necessary, both for the purposes of this study
and for a greater understanding of federal regulations, to define the set of terms used to calculate the discussed
ratios. When discussing capital, two classifications are normally given: 1) Tier 1 or core capital is defined as
“the sum of core capital elements less any amounts of goodwill, other intangible assets, interest-only strips
receivables and nonfinancial equity investments that are required to be deducted.” According to these same
federal regulations, Tier 1 capital includes the following:
“(i) Common stockholder’s equity;
(ii) Qualifying noncumulative perpetual preferred stock (including related surplus); and
(iii) Minority interest in the equity accounts of consolidated subsidiaries.” 11
While Tier 1 capital comprises the vast majority of relevant and important data, a second classification—named
Tier 2 capital—also exists. This capital category consists of “supplementary capital elements” that are not
included in the Tier 1 capital definition.
When calculating capital adequacy measures, capital or some portion thereof serves as the numerator of
the chosen ratio. Three main ratios exist, the only differences between them being whether or not Tier 2 capital
is included and whether the denominator is composed of risk-weighted assets or simply total assets. In order to
provide an estimation of financial stability, capital adequacy ratios utilize risk-weighted exposure or assets
(RWA) as the denominator, with the exception of the leverage ratio, which uses total assets. While variations
of these ratios have been implemented over the years, few major changes exist, as usually relatively minute
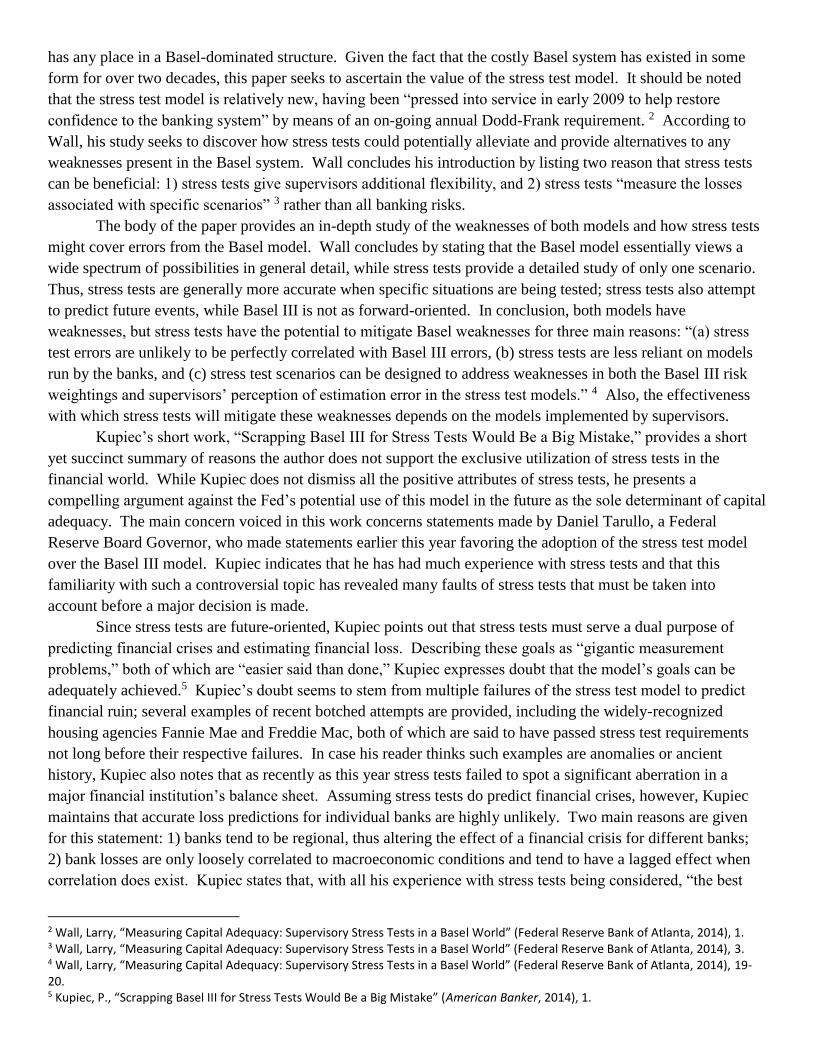
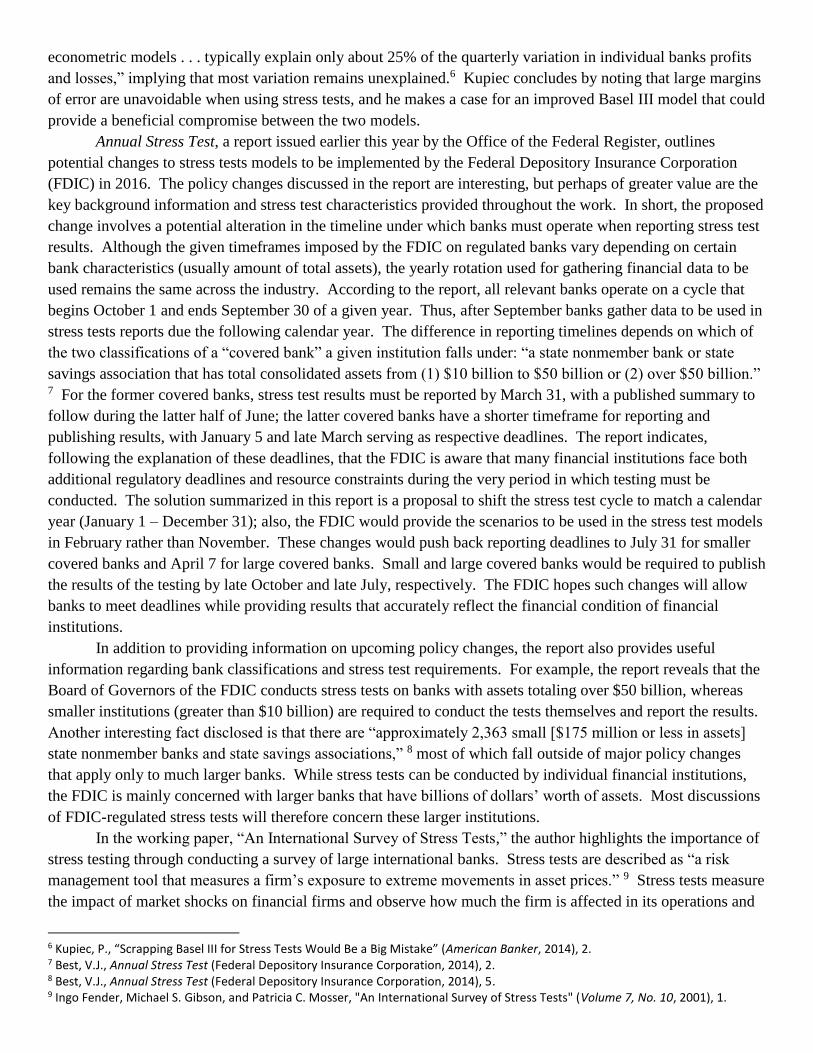
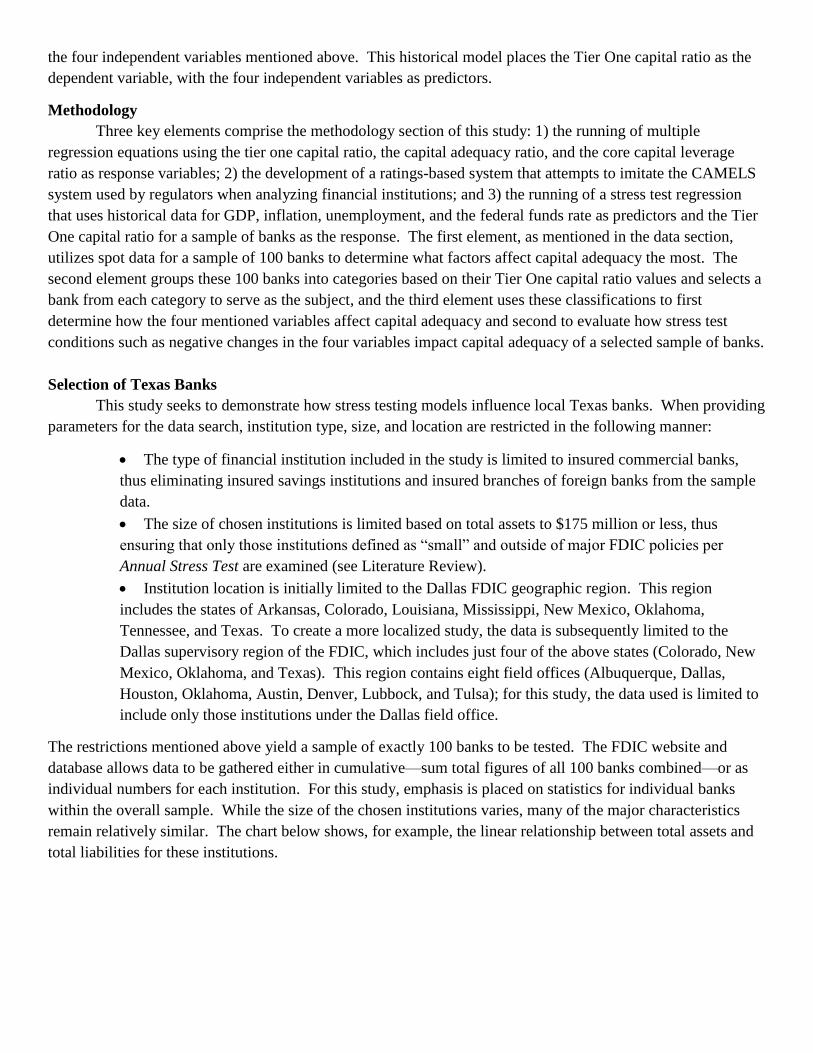
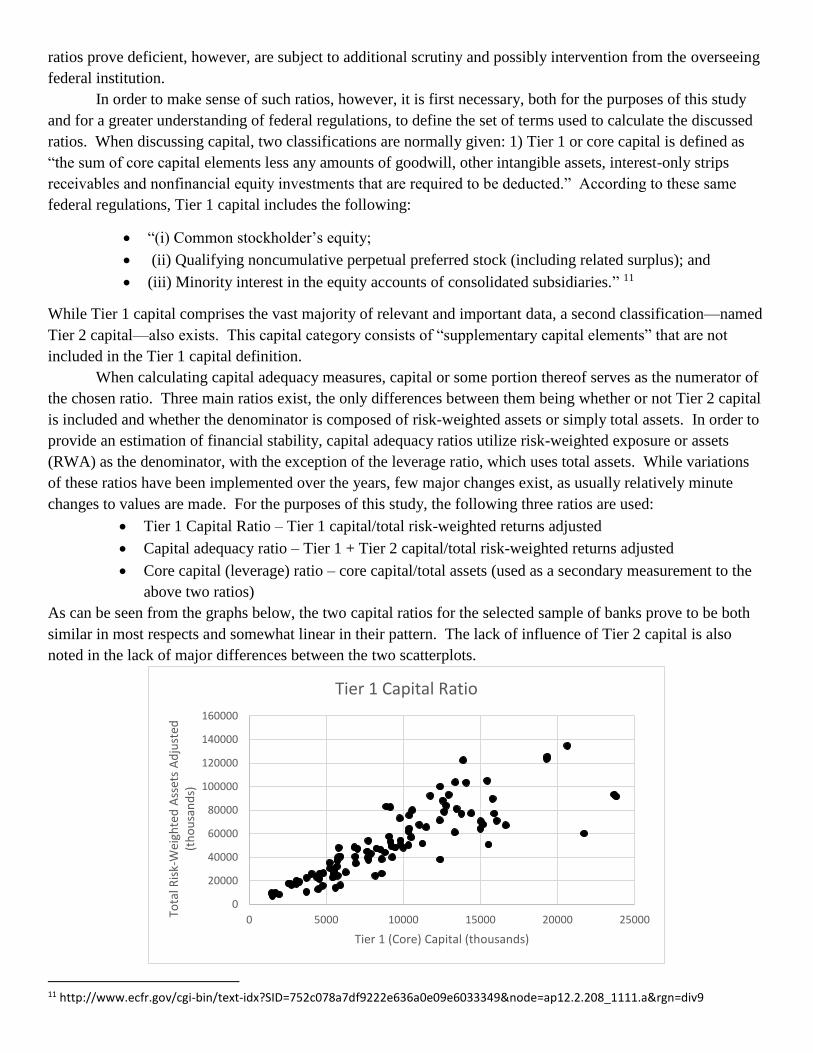
changes to values are made. For the purposes of this study, the following three ratios are used:
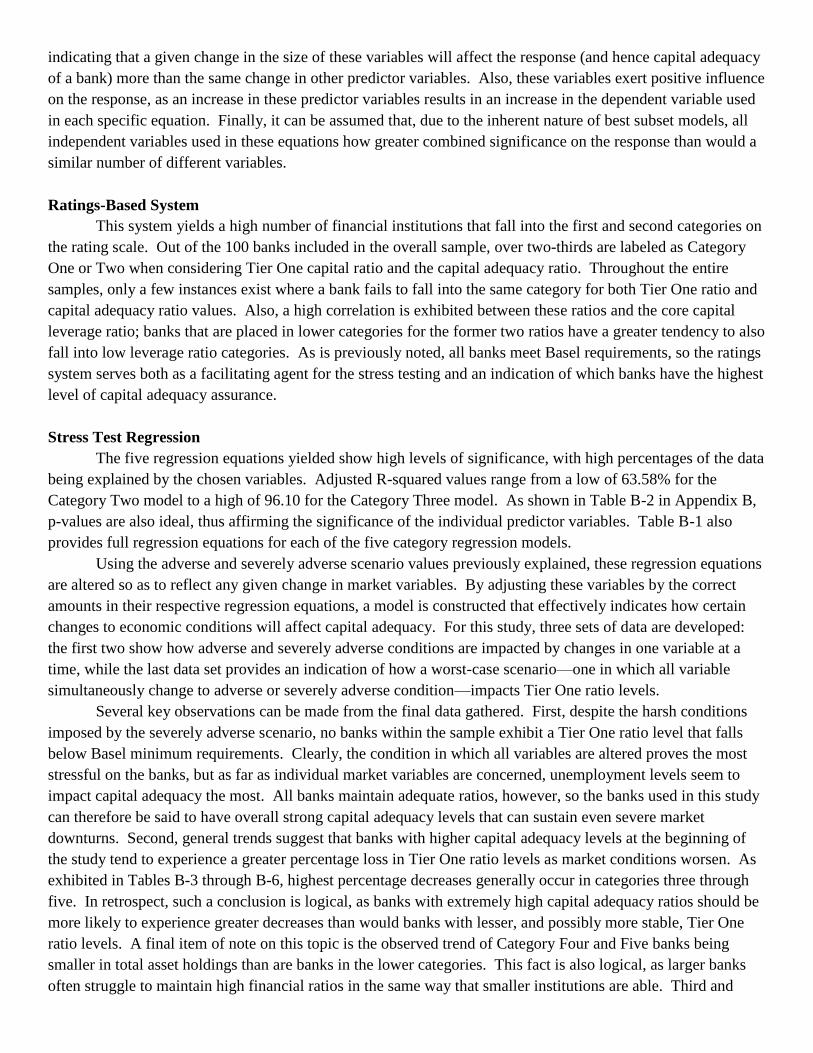
Tier 1 Capital Ratio – Tier 1 capital/total risk-weighted returns adjusted
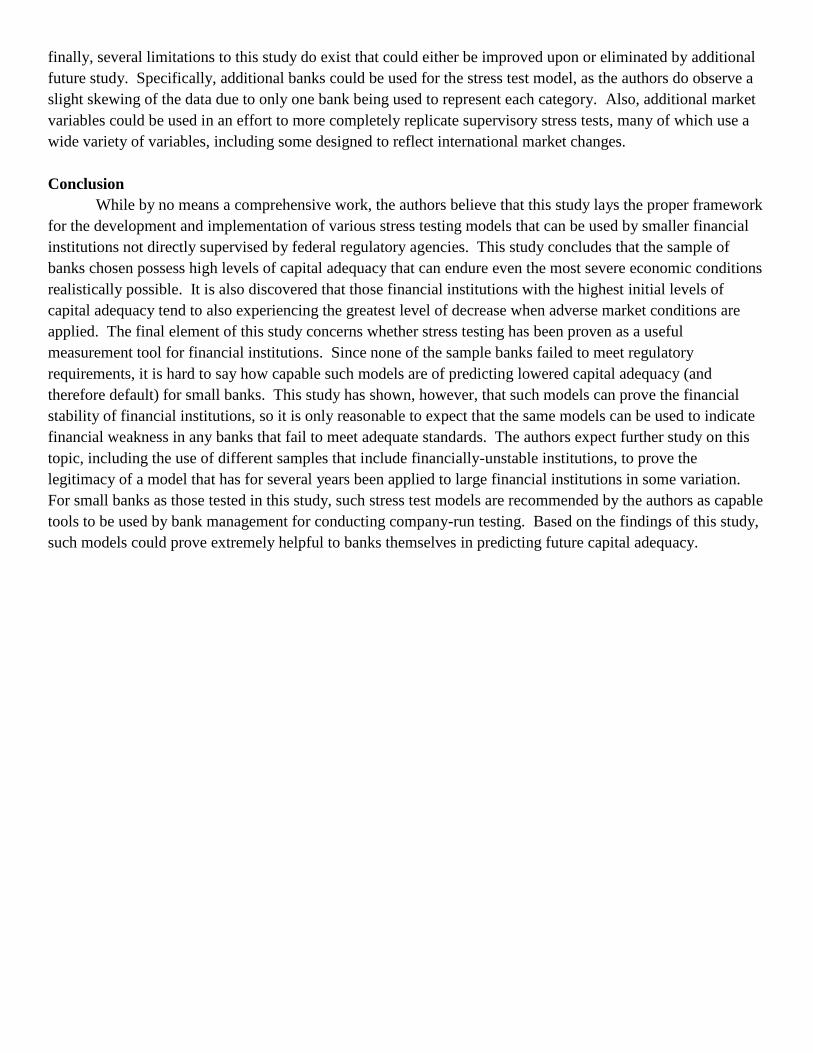
Capital adequacy ratio – Tier 1 + Tier 2 capital/total risk-weighted returns adjusted
Core capital (leverage) ratio – core capital/total assets (used as a secondary measurement to the
above two ratios)
As can be seen from the graphs below, the two capital ratios for the selected sample of banks prove to be both
similar in most respects and somewhat linear in their pattern. The lack of influence of Tier 2 capital is also
noted in the lack of major differences between the two scatterplots.
11 http://www.ecfr.gov/cgi-bin/text-idx?SID=752c078a7df9222e636a0e09e6033349&node=ap12.2.208_1111.a&rgn=div9
0
20000
40000
60000
80000
100000
120000
140000
160000
0 5000 10000 15000 20000 25000Tota
l Ris
k-W
eigh
ted
Ass
ets
Ad
just
ed
(th
ou
san
ds)
Tier 1 (Core) Capital (thousands)
Tier 1 Capital Ratio

Numerous regulating agencies have imposed minimum capital requirements for financial institutions
based on these three ratios. The Bank for International Settlements in Basel, Switzerland serves as the
formulating agency for a series of recent banking regulations, termed the first, second and third Basel Accords.
Currently, Basel III, the most recent of these accords, is being implemented by means of phase-ins expected to
last until 2019. Designed to ensure strong financial stability amongst financial institutions around the world,
these regulations impose minimum capital adequacy requirements that usually involve the above ratios. These
requirements are discussed further in the ratings-based system section of this work.
Multiple Regression Models for Capital Adequacy
Regression models attempt to show the influence a set of independent variables has on a chosen
response, or dependent, variable. Since this study seeks to determine factors that influence capital adequacy,
the Tier One capital ratio, the capital adequacy ratio, and the leverage ratio as previously defined and explained
are used as dependent variables in three distinct regressions that utilize the same predictor variables (as listed in
Appendix A). As mentioned in the Data section of this paper, this set of independent variables is chosen from
the FDIC database based on an assumed relevance to capital adequacy measurement systems.
In general, regression models with lower amounts of predictor variables are preferable, as lower
numbers make the model simpler and reduce chances of multicollinearity among the variables. This particular
study follows these principles by creating best subset models that seek to obtain the best data values while using
the fewest number of variables possible. The ultimate best subset model developed should utilize only a small
number of variables while still explaining a large percentage of the data. This study first runs each of the three
regressions using all variables; then, the best subset function is utilized in order to aid in the choosing of one
equation that shows both high relevance and a small variable sample. Results obtained using this method show
little change in data relevance while a significant decrease in multicollinearity among the independent variables.
Ratings-Based System
When determining the financial stability of a given financial institution, regulating agencies devise
numerous methods of assigning positive or negative ratings that financial institutions can use as indicators of
individual elements such as capital adequacy and liquidity. The assigning of such ratings requires in-depth
study and analysis of a financial institution’s current financial holdings—the size and nature of such assets or
earnings comprises a major element used in determining overall financial stability. As one of the most widely
used regulatory ratings-based systems, the CAMELS system has become a benchmark for ratings models.
0
20000
40000
60000
80000
100000
120000
140000
160000
0 5000 10000 15000 20000 25000 30000
Tota
l Ris
k-W
eigh
ted
Ass
ets
Ad
just
ed
(th
ou
san
ds)
Total Risk-Based Capital - Tier 1 + Tier 2 Capital (thousands)
Capital Adequacy Ratio
Currently in use by the Federal Reserve, the FDIC, and the Office of the Comptroller of the Currency, this
system has existed in some form since 1979. The name CAMELS stands for the six components measured by
the system—capital adequacy, asset quality, management capability, earning quality, liquidity adequacy, and
sensitivity to market risk. For each of these categories, a financial institution earns a score ranging from one to
five, with one being the best and five being the worst. In general, regulatory agencies are not highly concerned
about a financial institution’s financial stability or risk of default unless that institution earns consistent scores
of three or above in numerous categories. Also, CAMELS scores are private, as they are usually only seen by
the regulating agency as well as the upper management of the financial institution being studied (Lopez, 1999).
This paper attempts to create a ratings-based system similar to the CAMELS model, only focusing
solely on capital adequacy rather than all six elements analyzed by this common model. The model here
presented makes use of the three financial ratios discussed in the Capital Adequacy Measurement section of the
work in order to create a standard on which to judge the sample banks’ capital adequacy. Like the CAMELS
system, this model uses a scoring system of 1-5, with one being the best score possible and five representing the
least ideal level of capital adequacy. In order to create a system unique to this paper and to the chosen sample
of financial institutions, the creation of the five divisions is conducted in the following manner:
For each of the three ratios, the lowest and highest values are obtained and the range between
the values calculated
In order to create five divisions, the range between each ratio’s values is divided into five equal
segments. Each division consists of a lower and upper limit, with the lower limit being a whole
percentage (e.g. 18 or 0.18) and the upper limit being a percentage rounded to five decimal
places (e.g. 20.99999 or 0.20999). It should be noted that the Tier One capital ratio and the
capital adequacy ratio values are in decimal format (0.18), while the leverage ratio is shown in
actual percentage form (18). Final category ranges are as follows: Tier One capital ratio range
of 0.1-0.39999; capital adequacy ratio range of 0.11-0.41999; leverage ratio range of 6-
20.99999. Each of these ranges is comprised of five identically-sized divisions into which bank
values fall.
Each division is color-coded according to scoring results; the data can also be grouped
according to category.
The existence of a five-category system allows for multiple levels of scenario testing, a concept which is
explained further in the stress test regression section of this paper. This system also allows for easy comparison
between regulatory capital adequacy standards and the financial ratios maintained by these sample banks. For
regulatory purposes, international standards set by institutions such as the Bank for International Settlements
(BIS) create minimum requirements that financial institutions must meet in order to avoid intervention or
increased monitoring from regulating agencies. Currently, international standards are set forth in the Basel
Accords, with the third incarnation of these requirements being phased-in through 2018. Basel III, just like its
predecessors, was developed under the guidance of the BIS and is implemented through regulatory agencies in
each nation subscribing to its standards. The ratings-based system used in this model provides a simple yet
effective method of comparing the sample banks to the regulations faced by much larger financial institutions.
For example, the current enforced Basel minimum level for Tier One capital ratio is four percent (Basel III
Phase-In Arrangements, 2014). While ratios for this study vary based on category, it is clear from viewing
these categories that not a single bank in the sample falls below this four percent minimum. Indeed, all three
capital adequacy ratios, when compared to Basel standards, exhibit highly satisfactory levels in this given
sample. Even when increased minimum requirements currently being phased in under Basel III are considered,
all banks analyzed in this study exceed these required ratio values.

Given this information, it is clear that this ratings-based system retains more value as an indicator of
future bank performance than it does as a regulations enforcement tool. In other words, all banks pass Basel
requirements, so the ratings system can be used in a stress test system to indicate how the different bank
categories will react to adverse economic scenarios. This concept is explained further in the following section.
Stress Test Regression
The final aspect of this study relates most specifically to the stress test models currently in use by both
regulatory agencies and upper management of major financial institutions. While multiple regression models
and ratings-based systems can provide valuable information regarding capital adequacy in the here and now,
stress test models attempt to predict a financial institution’s response to various negative economic factors.
Stress tests, by their very nature, are forward-thinking, as they strive to go beyond assessing current financial
stability by showing how a financial institution’s capital adequacy—and therefore overall financial stability—
will be impacted should uncontrollable external forces come into play. Regulatory government agencies use
stress tests as a means of monitoring major institutions that fall under various guidelines for supervision. This
study attempts to replicate basic stress test conditions for the sample of 100 Texas banks in order to supplement
existing data and show how these banks will react in the future given certain changes in economic factors.
To achieve this goal, simple regressions as previously developed prove insufficient, as such models only
reveal current trends at a given time. Therefore, this final section of this study combines regression models with
the ratings-based system already developed in order to create a system that has forward-looking capabilities.
For this study, the recently-released Dodd-Frank stress test supervisory scenarios guidelines will be used in
addition to the methodology and results report for 2014 stress tests. These documents are obtained using online
resources from the Federal Reserve, and they serve as benchmark standards on which the tests here conducted
are based. A major reason for this study is the lack of stress testing conducted on the huge number of banks that
resemble those in this study’s sample in overall asset size. The banks comprising this sample hold no more than
$175 million in total assets; according to 2014 stress test guidelines, most stress tests (especially those
conducted by regulators) involve banks with at least $10 billion in total assets. Two major types of stress tests
exist—supervisory and company-run—and the relevant type is chosen mainly by the size of a given financial
institution. According to the Federal Reserve (citing the Dodd-Frank Act), “all financial companies with more
than $10 billion in total consolidated assets that are supervised by a primary federal financial regulatory agency
are required to conduct an annual company-run stress test” (Dodd-Frank Act Stress Test 2014: Supervisory
Stress Test Methodology and Results, 2014). The Dodd-Frank Act also specifies that certain financial
institutions deemed as “covered” are additionally subject to mid-cycle testing as well as a supervisory stress
test. Covered companies are defined as “any bank holding company with total consolidated assets of $50
billion or more” as well as certain non-bank companies that do not concern this study (Dodd-Frank Act Stress
Test 2014: Supervisory Stress Test Methodology and Results, 2014). In summary, banks with assets of between
ten and fifty billion dollars are subject to annual company-run testing, while banks holding more than fifty
billion dollars’ worth of assets must also submit to supervisory testing by regulatory agencies. For this study,
the key element of note is that banks of the size exhibited in this chosen sample are not usually subject to
significant stress testing of any kind, besides minor testing conducted by bank management. It is therefore a
major purpose of this study to determine both how banks such as these would benefit from traditional stress
testing as well as how these banks are expected to react to the same adverse economic scenarios created by
stress test models.
To achieve this goal, this model makes use the ratings-based system to predict how banks in each
category respond to a single economic factor being changed or even to a combination of such changes. In
preparation for the stress testing, the bank exhibiting the lowest Tier One ratio value in each category is
selected, for a total of five banks. The Tier One ratio is used mainly due to its simplicity and its adequate ability
to indicate the overall capital adequacy of a given financial institution. These five banks represent all banks in
their given categories as the stress testing is completed. This method allows for a reasonably accurate
prediction of category responses without having to include historical data for 100 separate banks.
For the testing itself, published Federal Reserve stress testing guidelines and scenarios are utilized in
order to effectively create a model that will provide reliable data. Since stress tests are future-oriented,
historical data along with hypothetical future predictions are used to determine how financial institutions should
react to uncontrollable changes in the general economy. For this study, four such changes/variables are used:
the U.S. unemployment rate, U.S. GDP in billions of current dollars, the federal funds rate (percent per year),
and inflation based on consumer prices (annual percentage). Supervisory stress tests conducted by regulatory
agencies make use of many additional variables, but the authors believe that, for the purposes of this study, the
above variables provides an adequate representation of shifting economic conditions as a whole. Also, while
regulatory stress tests use variables designed to reflect changes in international economic conditions, such
elements are not included in this study due to their perceived irrelevance to the sample of small Texas banks
being studied.
For the four variables discussed above, historical data is obtained going back a period of ten years,
providing data from 2004 to 2013 (data not available for 2014). Tier One ratio values for the five sample banks
is also obtained for the same time period, thus providing the basis for initial regressions that show the
significance of the chosen variables on capital adequacy. Using this information, five separate regression
models are constructed—one for each sample bank (category)—in order to reveal how a bank’s category or
level of capital adequacy is affected by economic conditions.
These regressions provide data that explains current conditions and variable significance; the final
element of the stress test seeks to generate future-oriented predictions. Given the regression equations obtained
using the above-mentioned methods, a set of change factors can be developed that replicates a downtrend or
negative change in the economy. For this model, Federal Reserve stress testing standards are once again
consulted to develop three different scenarios: baseline (current/expected values), adverse, and severely adverse
(2015 Supervisory Scenarios for Annual Stress Tests Required under the Dodd-Frank Act Stress Testing Rules
and the Capital Plan Rule, 2014). The following conditions were utilized when constructing a baseline
scenario:
The 2013 GDP value was used as a baseline standard
The federal funds rate baseline is placed at 0.25%, the current rate as of this writing
An unemployment rate of 5.8%--the current rate as of October 2014—is used as a baseline
The average inflation level for 2013 (1.5%) is used as a baseline
The adverse and severely adverse scenarios here replicated are designed as adverse economic conditions, with
the latter being the worse of the two. To create severely adverse changes, the worst annual recessionary
conditions exhibited over the last ten years for each category is used as a guideline. For example, the federal
funds rate exceeded five percent in 2007, so a level of five percent is utilized as the standard for the severely
adverse scenario. It should be noted that some such values are rounded to whole numbers to simplify the
overall model. Adverse scenarios are then constructed based on lower negative changes than before, yet still
enough to create potential for a downturn in capital adequacy. For several variables, this involves dividing the
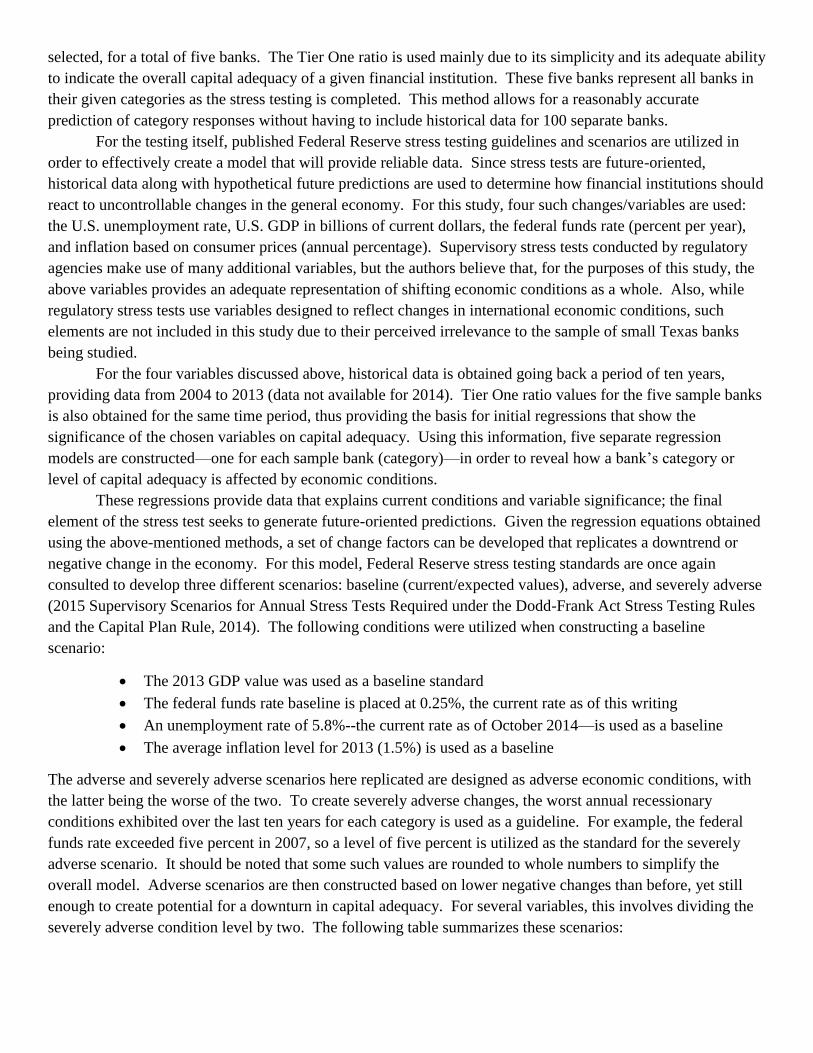
severely adverse condition level by two. The following table summarizes these scenarios:
Market Variables Adverse Severely Adverse
Unemployment 8% 10.5%
GDP -1% -2%
Federal Funds Rate 2.5% 5%
Inflation 2% 4%
Attention should be given to the fact that only the GDP values represent percentage changes; all other variable
values indicate the actual level to which these conditions change. For example, while GDP levels decrease by
one percent under adverse conditions, inflation levels rise from their existing level to two percent.
Results
Multiple Regression Models for Capital Adequacy
Using the best subset function for each of the three regressions run, models are developed that explain a
large percentage of the data while minimizing the amount of predictor variables used. The full results of these
models can be seen in their entirety in Appendix A. For the first model—that in which the Tier One capital
ratio is the response—an adjusted R-squared value of 49.49% is obtained, indicating that the model explains
almost half the data. The best subset method in this case utilizes four predictor variables and yields the
following equation:
Tier One Capital Ratio = 0.2190 + 0.000001 USG Agency Obligations + 0.1116 ROA - 0.01270 ROE
- 0.000001 Net Loans/Leases
The fact that only four variables are used as predictors creates a negligible negative effect on model accuracy,
as the R-squared value improved slightly over the original value and all relevant data values remain positive.
As calculated, p-values for the best subset model remain low, thus indicating strong significance on the
dependent variable; VIF values also remain low for all predictors except ROA and ROE, showing that only
these two variables exhibit multicollinearity.
The best subset model for the capital adequacy ratio also proves both accurate and useful. This model
eliminates 16 variables from the original model and yields the following equation:
Capital Adequacy Ratio = 0.2190 + 0.000001 USG Agency Obligations + 0.000229 Total Recoveries
- 0.000001 Net Loans/Leases
R-squared (adjusted) values decrease from the original 43.81% to 32.91%, but low p-values and
similarly-minimal VIF values reveal a set of predictor variables that show high significance to the response
while exhibiting little multicollinearity.
Results for the core capital leverage ratio best subset model prove equally positive. Using only three
independent variables, this model results in an improvement in adjusted R-squared values from the original
51.97% to 53.29%. The following equation is obtained using this best subset model:
Core Capital (leverage) Ratio = 7.20 + 8.473 ROA + 0.0396 Efficiency Ratio - 0.8297 ROE
The predictor variables show high levels of significance through low p-values. ROA and ROE VIF values do
indicate some level of multicollinearity as should be expected, but this model still remains far superior to the
original due to the increased amount of variables used.
Results for these three best subset models indicate an especially high significance for certain variables,
namely return on assets and total recoveries. The above equations give these predictors the highest coefficients,
indicating that a given change in the size of these variables will affect the response (and hence capital adequacy
of a bank) more than the same change in other predictor variables. Also, these variables exert positive influence
on the response, as an increase in these predictor variables results in an increase in the dependent variable used
in each specific equation. Finally, it can be assumed that, due to the inherent nature of best subset models, all
independent variables used in these equations how greater combined significance on the response than would a
similar number of different variables.
Ratings-Based System
This system yields a high number of financial institutions that fall into the first and second categories on
the rating scale. Out of the 100 banks included in the overall sample, over two-thirds are labeled as Category
One or Two when considering Tier One capital ratio and the capital adequacy ratio. Throughout the entire
samples, only a few instances exist where a bank fails to fall into the same category for both Tier One ratio and
capital adequacy ratio values. Also, a high correlation is exhibited between these ratios and the core capital
leverage ratio; banks that are placed in lower categories for the former two ratios have a greater tendency to also
fall into low leverage ratio categories. As is previously noted, all banks meet Basel requirements, so the ratings
system serves both as a facilitating agent for the stress testing and an indication of which banks have the highest
level of capital adequacy assurance.
Stress Test Regression
The five regression equations yielded show high levels of significance, with high percentages of the data
being explained by the chosen variables. Adjusted R-squared values range from a low of 63.58% for the
Category Two model to a high of 96.10 for the Category Three model. As shown in Table B-2 in Appendix B,
p-values are also ideal, thus affirming the significance of the individual predictor variables. Table B-1 also
provides full regression equations for each of the five category regression models.
Using the adverse and severely adverse scenario values previously explained, these regression equations
are altered so as to reflect any given change in market variables. By adjusting these variables by the correct
amounts in their respective regression equations, a model is constructed that effectively indicates how certain
changes to economic conditions will affect capital adequacy. For this study, three sets of data are developed:
the first two show how adverse and severely adverse conditions are impacted by changes in one variable at a
time, while the last data set provides an indication of how a worst-case scenario—one in which all variable
simultaneously change to adverse or severely adverse condition—impacts Tier One ratio levels.
Several key observations can be made from the final data gathered. First, despite the harsh conditions
imposed by the severely adverse scenario, no banks within the sample exhibit a Tier One ratio level that falls
below Basel minimum requirements. Clearly, the condition in which all variables are altered proves the most
stressful on the banks, but as far as individual market variables are concerned, unemployment levels seem to
impact capital adequacy the most. All banks maintain adequate ratios, however, so the banks used in this study
can therefore be said to have overall strong capital adequacy levels that can sustain even severe market
downturns. Second, general trends suggest that banks with higher capital adequacy levels at the beginning of
the study tend to experience a greater percentage loss in Tier One ratio levels as market conditions worsen. As
exhibited in Tables B-3 through B-6, highest percentage decreases generally occur in categories three through
five. In retrospect, such a conclusion is logical, as banks with extremely high capital adequacy ratios should be
more likely to experience greater decreases than would banks with lesser, and possibly more stable, Tier One
ratio levels. A final item of note on this topic is the observed trend of Category Four and Five banks being
smaller in total asset holdings than are banks in the lower categories. This fact is also logical, as larger banks
often struggle to maintain high financial ratios in the same way that smaller institutions are able. Third and
finally, several limitations to this study do exist that could either be improved upon or eliminated by additional
future study. Specifically, additional banks could be used for the stress test model, as the authors do observe a
slight skewing of the data due to only one bank being used to represent each category. Also, additional market
variables could be used in an effort to more completely replicate supervisory stress tests, many of which use a
wide variety of variables, including some designed to reflect international market changes.
Conclusion
While by no means a comprehensive work, the authors believe that this study lays the proper framework
for the development and implementation of various stress testing models that can be used by smaller financial
institutions not directly supervised by federal regulatory agencies. This study concludes that the sample of
banks chosen possess high levels of capital adequacy that can endure even the most severe economic conditions
realistically possible. It is also discovered that those financial institutions with the highest initial levels of
capital adequacy tend to also experiencing the greatest level of decrease when adverse market conditions are
applied. The final element of this study concerns whether stress testing has been proven as a useful
measurement tool for financial institutions. Since none of the sample banks failed to meet regulatory
requirements, it is hard to say how capable such models are of predicting lowered capital adequacy (and
therefore default) for small banks. This study has shown, however, that such models can prove the financial
stability of financial institutions, so it is only reasonable to expect that the same models can be used to indicate
financial weakness in any banks that fail to meet adequate standards. The authors expect further study on this
topic, including the use of different samples that include financially-unstable institutions, to prove the
legitimacy of a model that has for several years been applied to large financial institutions in some variation.
For small banks as those tested in this study, such stress test models are recommended by the authors as capable
tools to be used by bank management for conducting company-run testing. Based on the findings of this study,
such models could prove extremely helpful to banks themselves in predicting future capital adequacy.
References
(2014). 2015 Supervisory Scenarios for Annual Stress Tests Required under the Dodd-Frank Act Stress Testing
Rules and the Capital Plan Rule. Federal Reserve, Board of Governors of the Federal Reserve System.
Retrieved from http://www.federalreserve.gov/newsevents/press/bcreg/bcreg20141023a1.pdf
Basel III Phase-In Arrangements. (2014). Retrieved from Bank for International Settlements:
http://www.bis.org/bcbs/basel3/basel3_phase_in_arrangements.pdf
Best, V. J. (2014, July 1). Annual Stress Test. Federal Depository Insurance Corporation.
Databases, Tables & Calculators by Subject. (2014). Retrieved from United States Department of Labor Bureau
of Labor Statistics: http://data.bls.gov/timeseries/LNS14000000
(2014). Dodd-Frank Act Stress Test 2014: Supervisory Stress Test Methodology and Results. Federal Reserve,
Board of Governors of the Federal Reserve System. Retrieved from
http://www.federalreserve.gov/newsevents/press/bcreg/bcreg20140320a1.pdf
(n.d.). DSC Risk Management Manual of Examination. Federal Deposit Insurance Corporation. Retrieved from
https://www.fdic.gov/regulations/safety/manual/section2-1.pdf
Elliott, D. J. (2009). Bank Capital and the Stress Tests. Brookings, Initiative on Business and Public Policy.
Retrieved from
http://www.brookings.edu/~/media/research/files/papers/2009/3/03%20bank%20capital%20elliott/0
303_bank_capital_elliott.pdf
Flood, Mark D. and Korenko, George G. (2013). Systematic Scenario Selection. U.S. Department of the
Treasury, Office of Financial Research.
Ingo Fender, Michael S. Gibson, and Patricia C. Mosser. (2001, November). "An International Survey of Stress
Tests". Volume 7, No. 10. Retrieved from New York Fed:
http://www.newyorkfed.org/research/current_issues/ci7-10/ci7-10.html
Kupiec, P. (2014, July 8). Scrapping Basel III for Stress Tests Would Be a Big Mistake. American Banker, 1(104).
Lopez, J. A. (1999, June 11). FRBSF Economic Letter: Using CAMELS Ratings to Monitor Bank Conditions.
Retrieved from Federal Reserve Bank of San Francisco: http://www.frbsf.org/economic-
research/publications/economic-letter/1999/june/using-camels-ratings-to-monitor-bank-conditions/
Motocu, M., & Crisan, C. (2009). "Stress Testing Practice for Risk Management". UASVM Horticulture, Volume
66(2). Retrieved from http://journals.usamvcluj.ro/index.php/horticulture/article/view/4362/4053
National Economic Accounts: Gross Domestic Product (GDP). (2014). Retrieved from U.S. Department of
Commerce Bureau of Economic Analysis: http://bea.gov/national/index.htm
Selected Interest Rates (Daily). (2014). Retrieved from Board of Governors of the Federal Reserve System:
http://federalreserve.gov/releases/h15/data.htm
Wall, L. (2013). Measuring Capital Adequacy: Supervisory Stress Tests in a Basel World. Working Paper
Series(15), 1-25.
World Databank: World Development Indicators. (2014). Retrieved from The World Bank (citing International
Monetary Fund statistics):
http://databank.worldbank.org/data/views/reports/tableview.aspx?isshared=true#
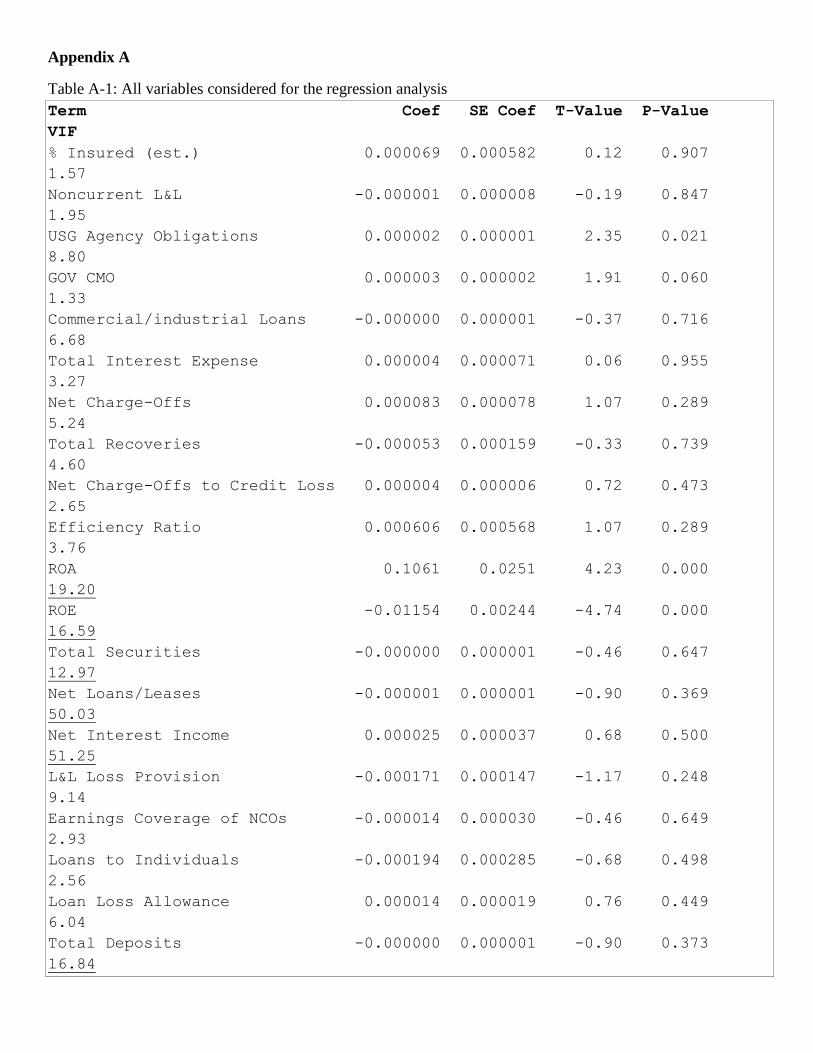
Appendix A
Table A-1: All variables considered for the regression analysis
Term Coef SE Coef T-Value P-Value
VIF
% Insured (est.) 0.000069 0.000582 0.12 0.907
1.57
Noncurrent L&L -0.000001 0.000008 -0.19 0.847
1.95
USG Agency Obligations 0.000002 0.000001 2.35 0.021
8.80
GOV CMO 0.000003 0.000002 1.91 0.060
1.33
Commercial/industrial Loans -0.000000 0.000001 -0.37 0.716
6.68
Total Interest Expense 0.000004 0.000071 0.06 0.955
3.27
Net Charge-Offs 0.000083 0.000078 1.07 0.289
5.24
Total Recoveries -0.000053 0.000159 -0.33 0.739
4.60
Net Charge-Offs to Credit Loss 0.000004 0.000006 0.72 0.473
2.65
Efficiency Ratio 0.000606 0.000568 1.07 0.289
3.76
ROA 0.1061 0.0251 4.23 0.000
19.20
ROE -0.01154 0.00244 -4.74 0.000
16.59
Total Securities -0.000000 0.000001 -0.46 0.647
12.97
Net Loans/Leases -0.000001 0.000001 -0.90 0.369
50.03
Net Interest Income 0.000025 0.000037 0.68 0.500
51.25
L&L Loss Provision -0.000171 0.000147 -1.17 0.248
9.14
Earnings Coverage of NCOs -0.000014 0.000030 -0.46 0.649
2.93
Loans to Individuals -0.000194 0.000285 -0.68 0.498
2.56
Loan Loss Allowance 0.000014 0.000019 0.76 0.449
6.04
Total Deposits -0.000000 0.000001 -0.90 0.373
16.84
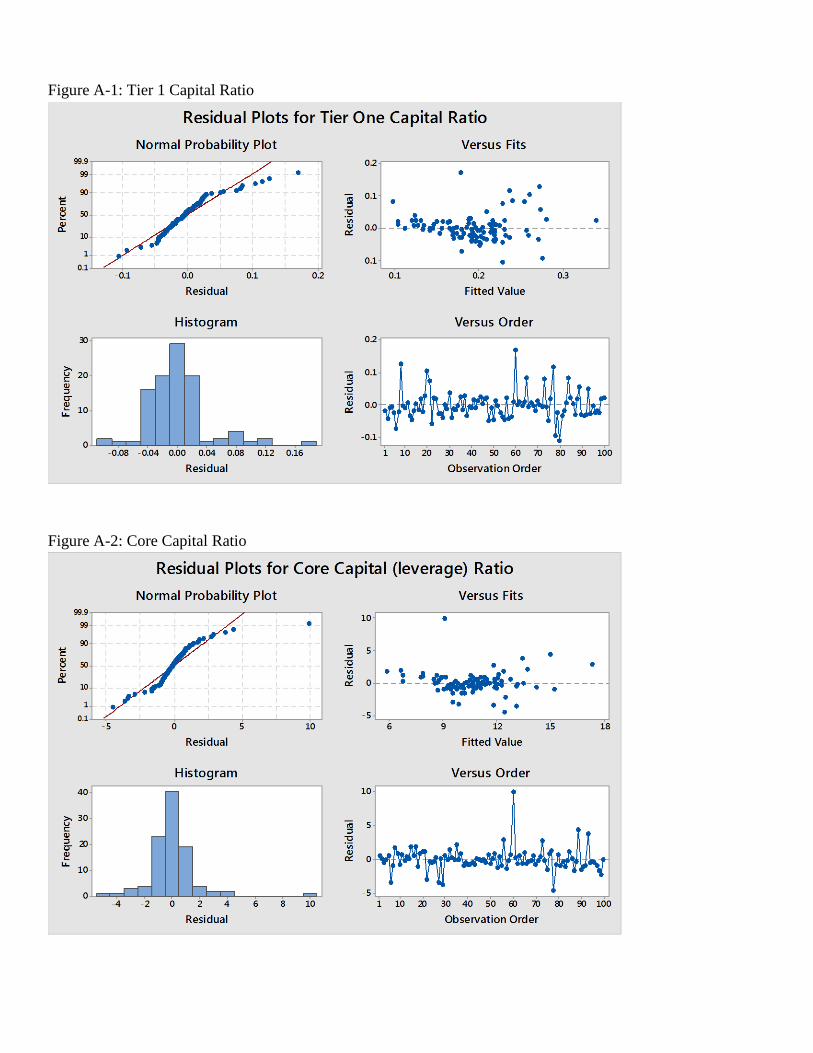
Figure A-1: Tier 1 Capital Ratio
Figure A-2: Core Capital Ratio
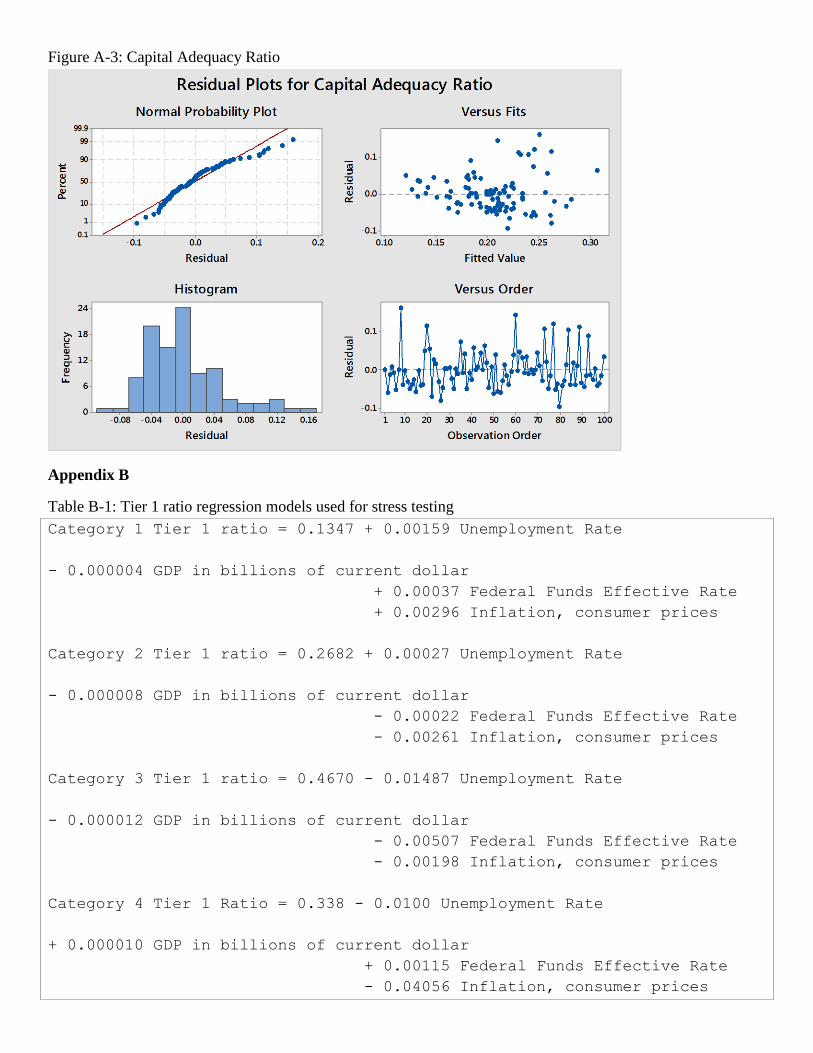
Figure A-3: Capital Adequacy Ratio
Appendix B
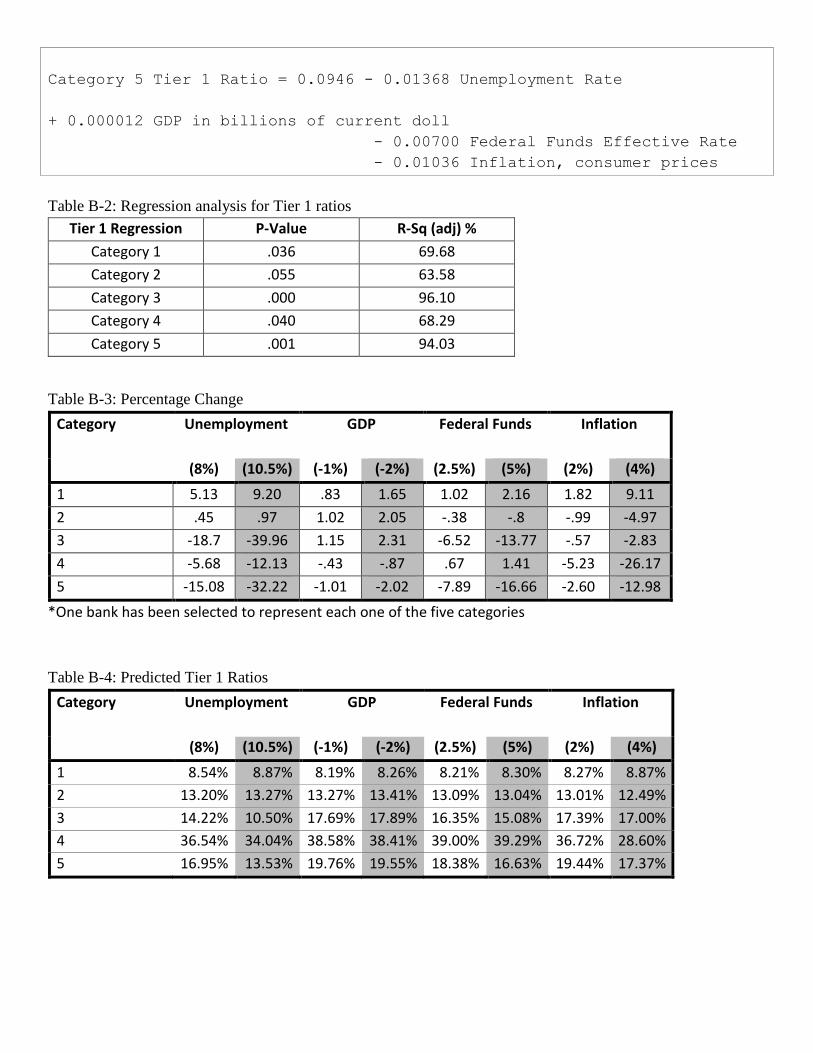
Table B-1: Tier 1 ratio regression models used for stress testing
Category 1 Tier 1 ratio = 0.1347 + 0.00159 Unemployment Rate
- 0.000004 GDP in billions of current dollar
+ 0.00037 Federal Funds Effective Rate
+ 0.00296 Inflation, consumer prices
Category 2 Tier 1 ratio = 0.2682 + 0.00027 Unemployment Rate
- 0.000008 GDP in billions of current dollar
- 0.00022 Federal Funds Effective Rate
- 0.00261 Inflation, consumer prices
Category 3 Tier 1 ratio = 0.4670 - 0.01487 Unemployment Rate
- 0.000012 GDP in billions of current dollar
- 0.00507 Federal Funds Effective Rate
- 0.00198 Inflation, consumer prices
Category 4 Tier 1 Ratio = 0.338 - 0.0100 Unemployment Rate
+ 0.000010 GDP in billions of current dollar
+ 0.00115 Federal Funds Effective Rate
- 0.04056 Inflation, consumer prices
Category 5 Tier 1 Ratio = 0.0946 - 0.01368 Unemployment Rate
+ 0.000012 GDP in billions of current doll
- 0.00700 Federal Funds Effective Rate
- 0.01036 Inflation, consumer prices
Table B-2: Regression analysis for Tier 1 ratios
Tier 1 Regression P-Value R-Sq (adj) %
Category 1 .036 69.68
Category 2 .055 63.58
Category 3 .000 96.10
Category 4 .040 68.29
Category 5 .001 94.03
Table B-3: Percentage Change
Category Unemployment GDP Federal Funds
Inflation
(8%) (10.5%) (-1%) (-2%) (2.5%) (5%) (2%) (4%)
1 5.13 9.20 .83 1.65 1.02 2.16 1.82 9.11
2 .45 .97 1.02 2.05 -.38 -.8 -.99 -4.97
3 -18.7 -39.96 1.15 2.31 -6.52 -13.77 -.57 -2.83
4 -5.68 -12.13 -.43 -.87 .67 1.41 -5.23 -26.17
5 -15.08 -32.22 -1.01 -2.02 -7.89 -16.66 -2.60 -12.98
*One bank has been selected to represent each one of the five categories
Table B-4: Predicted Tier 1 Ratios
Category Unemployment GDP Federal Funds
Inflation
(8%) (10.5%) (-1%) (-2%) (2.5%) (5%) (2%) (4%)
1 8.54% 8.87% 8.19% 8.26% 8.21% 8.30% 8.27% 8.87%
2 13.20% 13.27% 13.27% 13.41% 13.09% 13.04% 13.01% 12.49%
3 14.22% 10.50% 17.69% 17.89% 16.35% 15.08% 17.39% 17.00%
4 36.54% 34.04% 38.58% 38.41% 39.00% 39.29% 36.72% 28.60%
5 16.95% 13.53% 19.76% 19.55% 18.38% 16.63% 19.44% 17.37%
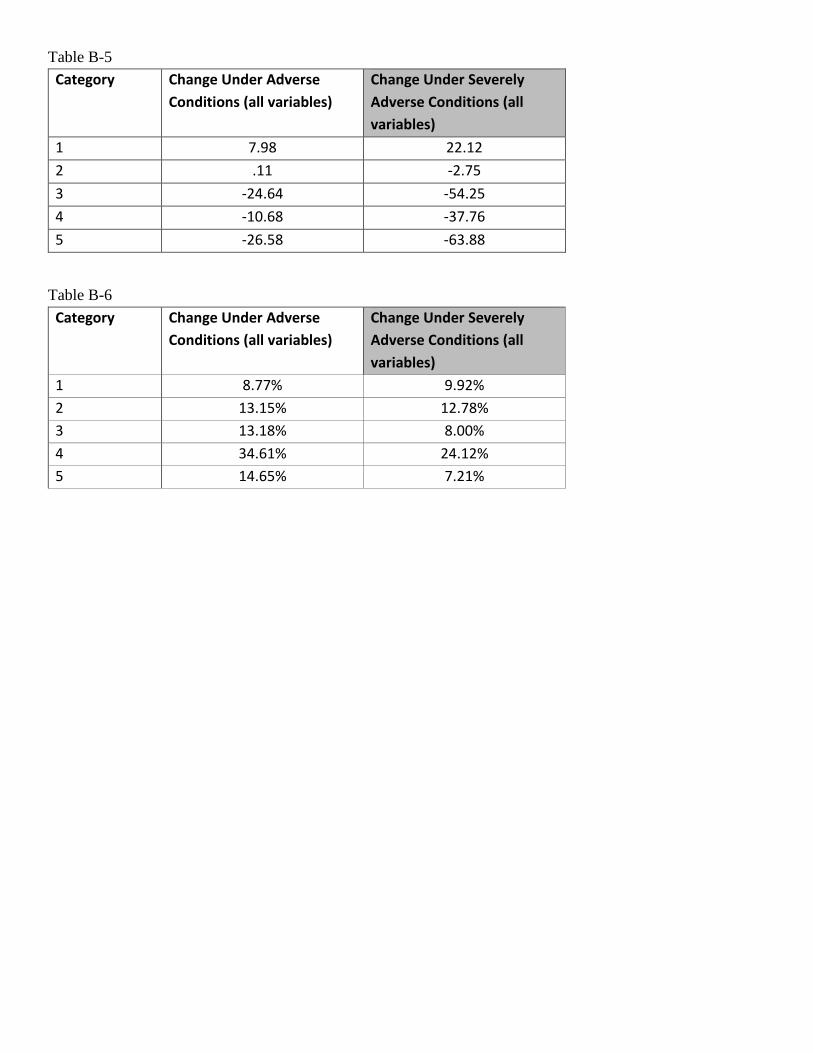
Table B-5
Category Change Under Adverse
Conditions (all variables)
Change Under Severely
Adverse Conditions (all
variables)
1 7.98 22.12
2 .11 -2.75
3 -24.64 -54.25
4 -10.68 -37.76
5 -26.58 -63.88
Table B-6
Category Change Under Adverse
Conditions (all variables)
Change Under Severely
Adverse Conditions (all
variables)
1 8.77% 9.92%
2 13.15% 12.78%
3 13.18% 8.00%
4 34.61% 24.12%
5 14.65% 7.21%