Embed Size (px)
Citation preview

Turkey Branch Dissolved Oxygen TMDL Alapaha River Basin (HUC 03110202) in the Suwannee River Basin Submitted to: U.S. Environmental Protection Agency Region 4 Atlanta, Georgia Submitted by: Georgia Department of Natural Resources Environmental Protection Division Atlanta, Georgia June 2002

2
Ochlockonee River Turkey Branch Dissolved Oxygen TMDL – Suwannee River Basin FINAL
Table of Contents
Section Title Page TMDL Executive Summary ...................................................................................... 3 1.0 Introduction ............................................................................................................... 5 2.0 Problem Understanding ............................................................................................. 6 3.0 Water Quality Standards............................................................................................ 9 4.0 Source Assessment .................................................................................................. 10 5.0 Summary of the Technical Approach ...................................................................... 12 6.0 Loading Capacity..................................................................................................... 24
7.0 Waste Load and Load Allocations........................................................................... 25 8.0 Margin of Safety ...................................................................................................... 26 9.0 Seasonal Variation................................................................................................... 26 10.0 Monitoring Plan....................................................................................................... 27 11.0 Point and Nonpoint Source Approaches.................................................................. 27 12.0 Public Participation.................................................................................................. 27 13.0 References................................................................................................................ 28 Appendix A - Data Used in TMDL Analysis ............................................................................. 30
3
Ochlockonee River Turkey Branch Dissolved Oxygen TMDL – Suwannee River Basin FINAL
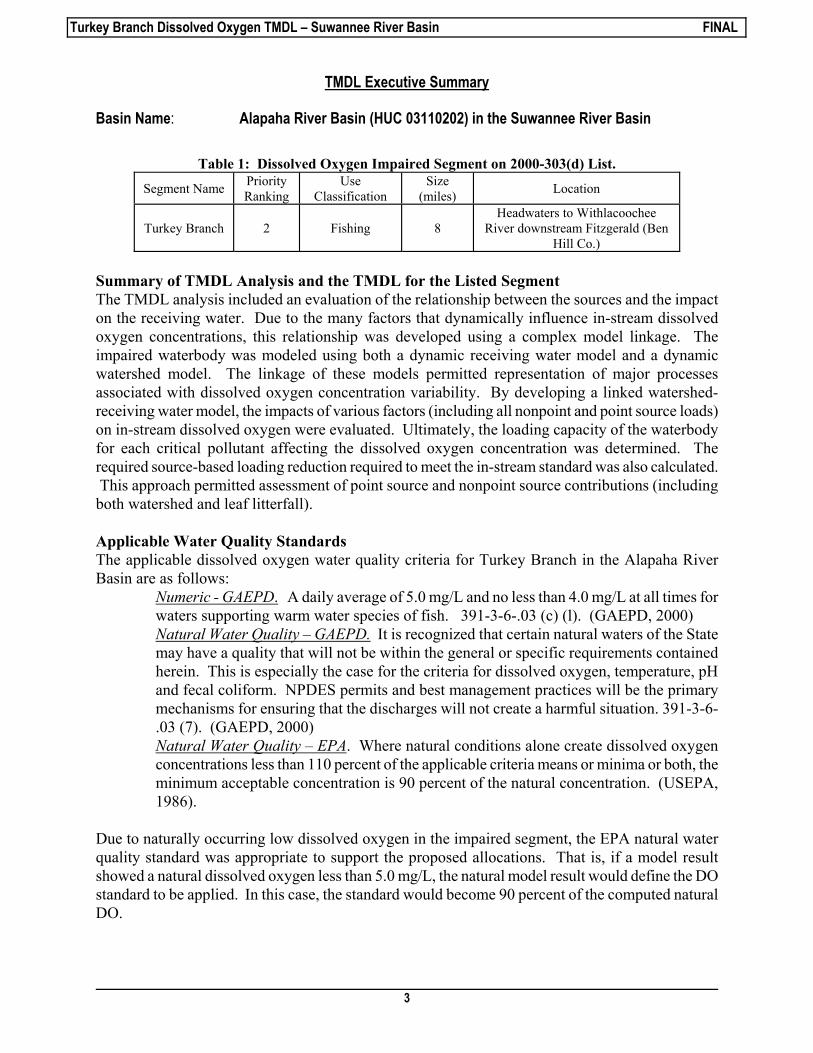
TMDL Executive Summary Basin Name: Alapaha River Basin (HUC 03110202) in the Suwannee River Basin
Table 1: Dissolved Oxygen Impaired Segment on 2000-303(d) List.
Segment Name Priority Ranking
Use Classification
Size (miles) Location
Turkey Branch 2 Fishing 8 Headwaters to Withlacoochee
River downstream Fitzgerald (Ben Hill Co.)
Summary of TMDL Analysis and the TMDL for the Listed Segment The TMDL analysis included an evaluation of the relationship between the sources and the impact on the receiving water. Due to the many factors that dynamically influence in-stream dissolved oxygen concentrations, this relationship was developed using a complex model linkage. The impaired waterbody was modeled using both a dynamic receiving water model and a dynamic watershed model. The linkage of these models permitted representation of major processes associated with dissolved oxygen concentration variability. By developing a linked watershed-receiving water model, the impacts of various factors (including all nonpoint and point source loads) on in-stream dissolved oxygen were evaluated. Ultimately, the loading capacity of the waterbody for each critical pollutant affecting the dissolved oxygen concentration was determined. The required source-based loading reduction required to meet the in-stream standard was also calculated. This approach permitted assessment of point source and nonpoint source contributions (including both watershed and leaf litterfall). Applicable Water Quality Standards The applicable dissolved oxygen water quality criteria for Turkey Branch in the Alapaha River Basin are as follows:
Numeric - GAEPD. A daily average of 5.0 mg/L and no less than 4.0 mg/L at all times for waters supporting warm water species of fish. 391-3-6-.03 (c) (l). (GAEPD, 2000) Natural Water Quality – GAEPD. It is recognized that certain natural waters of the State may have a quality that will not be within the general or specific requirements contained herein. This is especially the case for the criteria for dissolved oxygen, temperature, pH and fecal coliform. NPDES permits and best management practices will be the primary mechanisms for ensuring that the discharges will not create a harmful situation. 391-3-6-.03 (7). (GAEPD, 2000) Natural Water Quality – EPA. Where natural conditions alone create dissolved oxygen concentrations less than 110 percent of the applicable criteria means or minima or both, the minimum acceptable concentration is 90 percent of the natural concentration. (USEPA, 1986).
Due to naturally occurring low dissolved oxygen in the impaired segment, the EPA natural water quality standard was appropriate to support the proposed allocations. That is, if a model result showed a natural dissolved oxygen less than 5.0 mg/L, the natural model result would define the DO standard to be applied. In this case, the standard would become 90 percent of the computed natural DO.

4
Ochlockonee River Turkey Branch Dissolved Oxygen TMDL – Suwannee River Basin FINAL
Technical Approach Models Applied: Hydrologic Simulation Program Fortran (HSPF) and the
Environmental Fluids Dynamic Computer Code (EFDC). Calibration Data: USGS field data from June-July, 1998. Calibration Conditions: (1) USGS flows measured in June-July, 1998. (2) USGS Temperatures measured in June-July 1998. (3) Point source DMR data for June-July, 1998. (4) Depths, velocities, kinetic rates, reaeration, and boundary
conditions based on 1998 USGS field data and/or GAEPD standard modeling practices.
Critical Conditions: (1) June-July, 1998 (low flow and high temperature). (2) Point source discharges at current permit limits.
(3) Same depths, velocities, kinetic rates, reaeration, and boundary conditions as calibration conditions.
Natural Conditions: (1) Same flows as critical conditions. (2) Same temperatures as critical conditions. (3) All point sources completely removed. (4) Same depths, velocities, kinetic rates, reaeration, and boundary
conditions as calibration conditions. Margin of Safety: Implicit, based on the following conservative assumptions:
(1) Modeling linked watershed and instream processes. (2) Permitted point sources are loaded into model for allocation runs
(average monthly permit values). (3) Ran model with real flow and temperature during summer instead
of 7Q10 and 75% temperature. (4) Assumed 41% saturation for upstream DO (Meyer, 1992).
Seasonality: Dissolved oxygen data predominantly showed impairments during
the high-temperature, low-flow conditions (June-July, 1998). Monitoring: Follow-up monitoring according to 5-year River Basin Planning
cycle (Georgia EPD, 1996). Approach: NPDES Permits for point sources; Best management practices for
nonpoint sources. Date Submitted: Draft - June 2000, Re-proposed - March 2002, Final – June 2002
Table 2: Summary of TMDL for Turkey Branch.
Listed Segment TMDL – TOC
(lbs/yr) TMDL – TN
(lbs/yr) TMDL – TP
(lbs/yr) Turkey Branch 2,405,771 81,878 72,113

5
Ochlockonee River Turkey Branch Dissolved Oxygen TMDL – Suwannee River Basin FINAL
1.0 Introduction The State of Georgia is required to develop total maximum daily loads (TMDLs) for waters not meeting water quality standards, in accordance with Section 303(d) of the Clean Water Act and the U. S. Environmental Protection Agency (EPA) Water Quality Planning and Management Regulations (40 CFR Part 130). Water quality data collected in 1998 indicate that a number of waterbodies in the Suwannee River Basin did not achieve water quality standards for dissolved oxygen. The low dissolved oxygen conditions may be due to naturally occurring conditions. These waterbodies were listed on the Georgia 2000-303(d) list. There were 49 TMDLs for dissolved oxygen that were finalized in December 2001, but due to a revision in the point and nonpoint source allocations from the June 2000 draft TMDLs, the Turkey Branch TMDL was re-proposed in this final TMDL report. This document presents the dissolved oxygen TMDL for Turkey Branch in the Alapaha River Basin (HUC 03110202). The Alapaha River Basin is part of the Suwannee River Basin as shown in Figure 1-1. Four river basins, the Ochlockonee, Suwannee, Satilla, and the St. Marys were the focus of TMDL development in Georgia in 2000. The four river basins are shown in Figure 1-1.
Figure 1-1. Southern Four Georgia Basins Requiring Dissolved Oxygen TMDL
Development (Ochlockonee, Suwannee, Satilla, and St. Mary’s River Basins)

6
Ochlockonee River Turkey Branch Dissolved Oxygen TMDL – Suwannee River Basin FINAL
2.0 Problem Understanding The Suwannee River Basin, from the headwaters to the Gulf of Mexico, covers an area of approximately 2,785 mi2. Turkey Branch is located in the headwaters of the Suwannee River Basin near Fitzgerald, GA in the Alapaha River Basin (HUC 03110202) as shown in Figure 2-1. The Turkey Branch watershed, 12-digit HUC 031102020502, is approximately 17 mi2. Turkey Branch flows into the Willacoochee River and then eventually into the Alapaha River near the town of Willacoochee, GA. Figure 2-1 shows the drainage area and relative location of the Turkey Branch watershed. The GAEPD established water quality monitoring stations for the Ochlockonee, Suwannee, Satilla, and St. Marys River Basins as a part of the Georgia River Basin Planning Program (GAEPD, 1996). There were 138 stations established and sampled in the southern Georgia four river basins in 1998. Sixty-nine of the sampling stations were in the Suwannee River Basin. The monitoring work was conducted as a cooperative effort between the GAEPD and the United States Geologic Survey (USGS). The four river basins will be monitored again in 2003. It should be noted that core stations in the four basins are monitored each year. During 1998, the USGS measured gage height, water temperature, pH, and dissolved oxygen on-site and collected water samples for laboratory analyses. The laboratory water quality parameters included turbidity, five-day biochemical oxygen demand (BOD5), ammonia, nitrate-nitrite, total phosphorus, total organic carbon, and fecal coliform. In addition, samples for metals analyses were collected at each station. These data were used to assess compliance with water quality standards and the assessment results were used by the GAEPD in the development of the 2000-303(d) list. For the 303(d) listing of Turkey Branch on the state’s 2000 list, the water quality station that exhibited dissolved oxygen impairments in 1998 was USGS 02316120 – Turkey Branch near Fitzgerald, GA (also GAEPD 09010401). The water quality station, the NPDES discharges, populated areas, streams from the USGS National Hydrography Dataset (NHD), and the impaired segment are all shown in Figure 2-2. There were 20 measurements during the 1998 monitoring period for USGS 02316120. The data are presented in Appendix A. Figures 2-3 and 2-4 display the dissolved oxygen measurements versus temperature, BOD5, and ammonia. The dissolved oxygen data do not meet the GAEPD criterion of 5.0 mg/L for the daily average and meet the 4.0 mg/L minimum only 10% (2 of 20 measurements) of the time. The dissolved plots show that the hypoxia conditions are prevalent during the June through September period. The instream BOD5 and NH3 measurements were above the detection limit most of the time with BOD5 measurements ranging from 1.0 to 5.2 mg/L and NH3 ranging from 0.03 to 5.5 mg/L. There was not a continuous flow gage in the Turkey Branch watershed. During the 1998 monitoring year, due to drought conditions, the USGS did not report a flow measurement for each sampling event. The state’s 303(d) list and the water quality station name identify this stream segment as Turkey Branch. Some other map sources show the stream name as Turkey Creek. For this report, the stream name of Turkey Branch will be used to be consistent with the 303(d) list and the water quality station name.

7
Ochlockonee River Turkey Branch Dissolved Oxygen TMDL – Suwannee River Basin FINAL
WILLACOOCHEE RIVER
ALPAH
A R
ALPAHA R
BIG
CRDEEP CR
ALPAH
A R
Fitzgerald
Ocilla
Valdosta
Tifton
Moultrie Adel
Nashville
Waycross
Lake City
Quitman
Ashburn
Sylvester
Arabi
Willacoochee
Turkey Branch Watershed
Suwannee 8-Digit HUCs :ALAPAHALITTLEUPPER SUWANNEEWITHLACOOCHEE
Populated AreasTurkey Branch WatershedSuwannee Streams
10 0 10 Miles
N
EW
S
GEORGIA
Suwannee River Basin
Turkey Branch Watershed
Figure 2-1. Location Map of the Turkey Branch Watershed.
#S#Y
GA0047236USGS 02316120GAEPD 09010401
Fitzgerald
Populated AreasTurkey Branch WatershedNHD Streams303(d) Listed Segment for DORoads
#S USGS/GAEPD WQ Station#Y NPDES Discharge
1 0 1 Miles
N
EW
S
Turk
ey B
ranc
h
Figure 2-2. 303(d) Listed Segment for Dissolved Oxygen, NPDES Discharges, and Water
Quality Stations on Turkey Branch.

8
Ochlockonee River Turkey Branch Dissolved Oxygen TMDL – Suwannee River Basin FINAL
0
1
2
3
4
5
6
7
8
9
10
Jan-98 Feb-98 Mar-98 Apr-98 May-98 Jun-98 Jul-98 Aug-98 Sep-98 Oct-98 Nov-98 Dec-98
Dis
solv
ed O
xyge
n (m
g/L)
0
5
10
15
20
25
30
Tem
pera
ture
(deg
C)
Dissolved Oxygen (mg/L)
Water Temperature (deg C)
GAEPD DO Criterion = 5.0 mg/L Daily Average
Figure 2-3. Dissolved Oxygen versus Temperature at USGS 02316120 (GAEPD 09010401)
– Turkey Branch near Fitzgerald, GA.
0
1
2
3
4
5
6
7
8
9
10
Jan-98 Feb-98 Mar-98 Apr-98 May-98 Jun-98 Jul-98 Aug-98 Sep-98 Oct-98 Nov-98 Dec-98
Dis
solv
ed O
xyge
n (m
g/L)
0
1
2
3
4
5
6
BO
D5
and
Am
mon
ia (m
g/L)
Dissolved Oxygen (mg/L)
BOD5 (mg/L)
Ammonia (mg/L)
GAEPD DO Criterion = 5.0 mg/L Daily Average
Figure 2-4. Dissolved Oxygen versus BOD5 and NH3 at USGS 02316120 (GAEPD
09010401) – Turkey Branch near Fitzgerald, GA.

9
Ochlockonee River Turkey Branch Dissolved Oxygen TMDL – Suwannee River Basin FINAL
3.0 Water Quality Standards Turkey Branch is designated by the State of Georgia with a water use classification of fishing. Georgia Water Quality Standards (GAEPD, 2000) have defined water quality criteria for surface waters as those that are used, or have a high potential to be used, for fishing and primary contact recreation. Georgia’s water quality standards state the following criteria for measurements of dissolved oxygen with a use classification of fishing: Numeric. A daily average of 5.0 mg/l and no less than 4.0 mg/l at all times for waters supporting warm water species of fish*. A daily average of 6.0 mg/l and no less than 5.0 mg/l at all times for waters designated as trout streams by the Wildlife Resource Division.
GAEPD, 2000 * Turkey Branch is assumed to be classified as supporting warm water species of fish. Certain waters of the state may have conditions where the dissolved oxygen is naturally lower than the recommended numeric dissolved oxygen criteria and cannot meet the numeric criteria unless reductions in the natural nutrient and carbon loads are obtained. This reduction in the natural forest or wetland contributions is not feasible, practicable or desirable, therefore the EPA Dissolved Oxygen Criteria was instituted and dissolved oxygen target limits were identified for TMDL development. The target limits were identified as 90% of the minimum naturally occurring concentration for impaired waterbodies. Natural Water Quality. “It is recognized that certain natural waters of the State may have a quality that will not be within the general or specific requirements contained herein. This is especially the case for the criteria for dissolved oxygen, temperature, pH and fecal coliform. NPDES permits and best management practices will be the primary mechanisms for ensuring that the discharges will not create a harmful situation.” 391-3-6-.03(7)
GAEPD, 2000 U.S. EPA guidelines supplement the Georgia guidelines for naturally low dissolved oxygen conditions by providing numeric targets: “Where natural conditions alone create dissolved oxygen concentrations less than 110 percent of the applicable criteria means or minima or both, the minimum acceptable concentration is 90 percent of the natural concentration.” Ambient Aquatic Life Water Quality Criteria for Dissolved Oxygen (Freshwater), EPA440/5-86-003, April 1986. USEPA, 1986 A dissolved oxygen violation analysis was performed for water quality station in the Turkey Branch watershed basin by comparing observation values to numeric water quality standards. The analysis confirmed that the water quality criterion was violated for the listed segment.

10
Ochlockonee River Turkey Branch Dissolved Oxygen TMDL – Suwannee River Basin FINAL
4.0 Source Assessment The 303(d) listing for Turkey Branch identified municipal sources as the primary contributor to the dissolved oxygen impairment. An examination of permits and land use information for the watershed was used to identify all potential sources of oxygen demanding substances in the basin. These sources (divided into Point and Nonpoint Sources) were considered in the source loading analysis and the subsequent TMDL. Point Sources Potential point sources affecting in-stream dissolved oxygen concentrations include wastewater treatment plants, industrial facilities (e.g., food processing facilities), combined sewer overflows, sanitary sewer overflows, and stormwater runoff. Point sources directly discharge organic and inorganic oxidizable substances into a waterbody, which ultimately affects dissolved oxygen concentrations. Pollutants that are typically monitored by facilities and should be considered in an evaluation of point source effects on in-stream dissolved oxygen concentrations include BOD, NH3, and TSS. The point source contributing to this listed water is GA0047236 – Fitzgerald – C.A. Newcomer WPCP. The facility is located in Ben Hill County and is approximately 2 miles upstream of the confluence of Turkey Branch and the Willacoochee River. Figure 2-2 shows its location with respect to the watershed. Table 4-1 shows the permit limits during the 1998 monitoring year for GA0047236. There is another facility located 4.5 miles upstream of the confluence and is identified as GA0046604 – Eaton Aeroquip, Inc. After reviewing the PCS data, it was determined to not play a significant role in the dissolved oxygen depletion in Turkey Branch and was not included in the analysis.
Table 4-1. Permit Limitations for GA0047236 – Fitzgerald – C.A. Newcomer WPCP. Season DO (mg/L) Flow (mgd) BOD-5 (mg/L) NH3 (mg/L) January 6.0 6.0 10.0 1.0 February 6.0 6.0 10.0 2.0 March 6.0 6.0 10.0 3.0 April 6.0 6.0 10.0 1.0 May - December 6.0 6.0 10.0 0.8
Nonpoint Sources Nonpoint sources of oxygen demanding substances are typically separated into urban and rural components. In urban or suburban settings, important sources of loading are surface storm runoff, failing septic systems, and leakage and overflows from sanitary sewer systems. In rural areas, sources of oxygen demanding substances may include diffuse runoff of agricultural fertilizer and animal wastes (from manure application or grazing animals), erosion of sediments, and runoff from concentrated animal operations. Based on a land use assessment and review of the literature, nonpoint source contributions from urban, agriculture, and forested areas are all likely in the Turkey Branch watershed. Croplands, pasture, forest, urban (or built-up) areas, and wetlands were all identified in the basin. The land use

11
Ochlockonee River Turkey Branch Dissolved Oxygen TMDL – Suwannee River Basin FINAL
distribution for the watershed contributing to the impaired segment is displayed in Table 4-2. Figure 4-1 graphically displays the land use distribution within the study area.
Table 4-2. Land Use for the Turkey Branch Watershed. Land Use Acres Percent of Total Built-Up Impervious 1,092 9.9 Built-Up Pervious 1,603 14.5 Cropland 4,775 43.1 Forest 1,740 15.7 Pasture 1,183 10.7 Wetland 674 6.1 TOTAL 11,067 100.0
Fitzgerald
MRLC LanduseUrbanBarren or MiningTransitionalAgriculture - CroplandAgriculture - PastureForestUpland Shrub LandGrass LandWaterWetlands
NHD StreamsTurkey Branch Watershed
1 0 1 Miles
N
EW
S
Figure 4-1. Land Use Representation in the Turkey Branch Watershed.
In addition to the aforementioned nonpoint sources of oxygen demanding substances, many southern Georgia streams receive significant contributions of oxygen demanding organic materials from local wetlands and forested stream corridors. In particular, the following sources of organic materials have been identified:
• adjacent wetland/swampy areas that have organically rich bottom sediments • direct leaf litterfall onto the water surface from overhanging trees and vegetation • lateral leaf litterfall that has fallen into the floodplains

12
Ochlockonee River Turkey Branch Dissolved Oxygen TMDL – Suwannee River Basin FINAL
Leaf litterfall plays a major role in the amount of carbon in the stream water column. The riparian areas of the watershed are the primary source of litterfall. At higher flows, the leaf litterfall in the floodplains are picked up and transported laterally into the stream. Many streams in southern Georgia are referred to as “blackwater” streams due to the humic substances leached from surrounding watersheds that impart color to the water (Meyer, 1992). Low dissolved oxygen in blackwater streams is common in the summer months when the temperatures are high and the flows are low. 5.0 Summary of the Technical Approach The TMDL analysis includes an evaluation of the relationship between the sources and the impact on the receiving water. Due to the many factors that dynamically influence in-stream dissolved oxygen concentrations, this relationship was developed using a complex model linkage. Impaired waterbodies were modeled using both a dynamic receiving water model and a dynamic watershed model. The linkage of these models permitted representation of major processes associated with dissolved oxygen concentration variability, including: • Input and oxidation of carbonaceous waste material • Input and oxidation of nitrogenous waste material • Input and oxygen demand of sediments in the water body • Use of oxygen through aquatic plant respiration • Reaeration • Oxygen production through photosynthesis By developing a linked watershed-receiving water model, the impacts of various factors (including all nonpoint and point source loads) on in-stream dissolved oxygen were evaluated. Ultimately, the loading capacity of the waterbody for each critical pollutant affecting the dissolved oxygen concentration was determined. The required source-based loading reduction required to meet the in-stream standard was also calculated. This approach permitted assessment of point source and nonpoint source contributions (including both watershed and leaf litterfall, etc.). The technical approach is summarized in the following sections: • Model selection • Source representation • In-stream representation • Model testing Model Selection The Hydrologic Simulation Program Fortran (HSPF), a dynamic watershed model capable of simulating a wide range of water quality parameters, was selected to represent nonpoint source pollutant contributions (and point source contributions as necessary) to the impaired waterbodies. The impaired waterbodies themselves were modeled using the Environmental Fluid Dynamics Code (EFDC), a 3-D hydrodynamic and water quality model capable of simulating dissolved oxygen and a

13
Ochlockonee River Turkey Branch Dissolved Oxygen TMDL – Suwannee River Basin FINAL
full suite of dissolved oxygen interactions. Output from the HSPF was applied directly to the EFDC, in order to provide the linkage between source and waterbody response. Source Representation Nonpoint and point sources were both represented in the linked models. The watershed model was primarily implemented to represent upstream nonpoint source contributions to the impaired waterbody. Direct contributions of leaf litter (representation of organic materials contributed by overhanging trees and vegetation) to each impaired waterbody were represented in the receiving water model. Point sources were represented in both the receiving water model and the watershed model. Facilities discharging within the same 12-digit subwatershed as a modeled impaired waterbody were represented in the receiving water model. Facilities discharging to unimpaired reach segments that affect impaired waterbodies, but were not explicitly modeled with the receiving water model, were represented in the watershed model. Nonpoint Source Representation Nonpoint source pollutants likely to impact dissolved oxygen include nutrients, BOD, and sediment. These pollutants have a direct impact on oxygen reducing procedures, including oxidation of carbonaceous and nitrogenous materials and exertion of oxygen demand by sediments. They also affect oxygen replenishment through plant respiration and photosynthesis production. The watershed model represents the variability of nonpoint source contributions through dynamic representation of hydrology and land practices. In a number of situations, the watershed model additionally accounts for point source contributions (where point sources are located on major streams contributing to an impaired waterbody that are not represented explicitly in the receiving water model). Key components of the watershed model include: • Watershed segmentation • Meteorological data • Simulation period • Land use representation • Hydrologic representation • Water quality representation
Watershed Segmentation In order to evaluate the sources contributing to an impaired waterbody and to represent the spatial variability of these sources within the watershed model, the contributing drainage area was represented by a series of subwatersheds. These subwatersheds were represented using the Georgia 12-digit watershed data layer. In some situations, the 12-digit data layer required further subdivision for appropriate hydrologic connectivity and representation.
Meteorological Data

14
Ochlockonee River Turkey Branch Dissolved Oxygen TMDL – Suwannee River Basin FINAL
Nonpoint source loadings and hydrologic conditions are dependent on weather conditions. Weather parameters required to simulate various components of hydrology and water quality include precipitation, air temperature, dew point, wind speed, solar radiation, and percent cloud cover. Hourly data from weather stations within the boundaries of or in close proximity to the subwatersheds being modeled, were applied to the watershed model. The weather station used to represent the hydrology in the Turkey Branch watershed was Abbeville 4 S (GA0010). Examination of the precipitation at this stations shows that the wettest months are typically January, February, March, and July. The driest month is typically October. Monthly and annual patterns are similar for all stations. Appendix A presents rainfall characteristics, including monthly mean and annual total precipitation for the Abbeville station.
Simulation Period Selection of an appropriate simulation period is important in nonpoint source modeling due to the variability of hydrologic and source loading conditions over time. The year 1998 was selected as the simulation period. This time period was selected due to its coverage of a wide range of hydrologic conditions, including heavy rainfall and drought conditions. Additionally, this period contained the most extensive monitoring data, which is necessary for model calibration. The HSPF model was run for 10 years to examine the watershed water quality loading over an extended period of time. The 1998 watershed load was also compared directly to the 1997 loading year to see if there were any anomalies in the loading rates.
Land Use Representation The watershed model uses land use data as the basis for representing hydrology and nonpoint source loading. Land use categories for modeling were selected based on the USGS Multi-Resolution Land Classification (MRLC) data set, and included built-up, forest, cropland, pasture, and wetlands. The USGS data represents conditions in the early to middle 1990’s. The modeling categories and their corresponding USGS classifications are presented in Table 5-1. The land use acreages for the Turkey Branch watershed used in modeling are presented in Table 4-2 and the graphical display in Figure 4-1.

15
Ochlockonee River Turkey Branch Dissolved Oxygen TMDL – Suwannee River Basin FINAL
Table 5-1. Land Use Representation.
Land Categories Represented in the Model
MRLC Land Use Code MRLC Land Use Classes % Impervious
Built-up
21 22 23 33
Low Intensity Residential High Intensity Residential High Intensity Comm./Ind./Trans. Transitional
19 65 80 10
Forest
31 32 41 42 43 51 52 53 71 85
Bare Rock/Sand/Clay Quarries/Strip Mines/Gravel Pits Deciduous Forest Evergreen Forest Mixed Forest Deciduous Shrubland Evergreen Shrubland Mixed Shrubland Grassland/Herbaceous Other Grasses
0 0 0 0 0 0 0 0 0 0
Wetland
91 92
Woody Wetlands Emergent Herbaceous Wetlands
0 0
Cropland
61 82 83 84
Planted/Cultivated Row Crops Small Grains Bare Soil
0 0 0 0
Pasture
81
Pasture/Hay
0
The HSPF model requires division of land uses in each subwatershed into separate pervious and impervious land units. For each land use, this division can be made based on typical imperviousness percentages from individual land use categories, such as those used in the Soil Conservation Service’s TR-55 method. For modeling purposes, the percent imperviousness of a give land category can be calculated as an area-weighted average of land use classes encompassing the modeling land category.
Hydrologic Representation Watershed hydrology plays an important role in the determination of nonpoint source flow and ultimately nonpoint source loadings to a waterbody. The watershed model must appropriately represent the spatial and temporal variability of hydrologic characteristics within a watershed. Key hydrologic characteristics include interception storage capacities, infiltration properties, evaporation and transpiration rates, and watershed slope and roughness. The HSPF modules used to represent watershed hydrology for TMDL development include PWATER (water budget simulation for pervious land units) and IWATER (water budget simulation for impervious land units). A detailed description of relevant hydrologic algorithms is presented in the HSPF User’s Manual.

16
Ochlockonee River Turkey Branch Dissolved Oxygen TMDL – Suwannee River Basin FINAL
Water Quality Representation A total of four water quality parameters were simulated using the watershed model: biochemical oxygen demand (BOD,) total nitrogen (TN), total phosphorus (TP), and total suspended solids (TSS). These parameters (either directly or indirectly) constitute the primary nonpoint sources contributing to dissolved oxygen depletion and/or replenishment. The buildup and washoff of these pollutants were represented using the PQUAL (simulation of quality constituents for pervious land segments) and IQUAL (simulation of quality constituents for impervious land segments) modules in HSPF. Different buildup and washoff rates were used to represent the different land categories (e.g. fertilizer and manure application generally result in a higher nutrient buildup and washoff from cropland than from urban lands). Upon application to the receiving water model, many of parameters simulated in the watershed model were converted into more applicable constituents for in-stream modeling.
Leaf Litterfall Representation Loadings of leaf litterfall were assumed to be consistent with a study performed on the Ogeechee River in southern Georgia (Meyer et al. 1997). The direct leaf litterfall was reported as 843 g/m2/yr and lateral leaf litterfall was reported as 3,520 g/m2/yr. The surface area of the stream channel was used to derive loading rates into the model. The lateral leaf litterfall was flow dependent to simulate the loading increase when the flows are large enough to inundate the floodplains. During the higher flows, the organic material deposited in the floodplain is picked up and transported into the stream. The leaf litterfall loading was only applied to the receiving water model grid segments (during simulation of each impaired river segment). Loadings from the HSPF model (particularly BOD, which was ultimately converted to TOC) were assumed to account for residual leaf litterfall from upstream segments (transported to the impaired segment). The majority of leaf litter was assumed to be deposited on the stream bottom within each segment, thus forming an organic-enriched bed, resulting in higher simulated Sediment Oxygen Demand (SOD). Point Source Representation After identifying all point source facility locations in the subwatersheds contributing to the impaired waterbodies, appropriate facilities were represented in the linked models. Depending on location, point sources were either represented in the watershed model or the receiving water model. Facilities discharging within a Georgia 12-digit subwatershed containing an impaired waterbody were represented as direct inputs into the receiving water model. Facilities discharging within a subwatershed representing an unimpaired waterbody were represented in the watershed model. In the later case, the facilities discharge into waterbodies that eventually feed into an impaired waterbody, and thus must be considered in the source representation. Due to their indirect impact on the impaired waterbody, however, their contributions are subject to fate and transport in the watershed model through a stream system leading to the impaired waterbody. Point source facilities were represented in both the watershed and receiving water models using a constant flow and pollutant loading. DMR data (flow and pollutant concentrations or loads) were represented in the models to simulate existing conditions – for calibration. Permitted flows and

17
Ochlockonee River Turkey Branch Dissolved Oxygen TMDL – Suwannee River Basin FINAL
loads were used to represent initial conditions for TMDL development. The monthly average permitted conditions were loaded into the in-stream model for the allocation runs. For example, where BOD5 is permitted at a maximum of 45 mg/L and an average of 30 mg/L, the average of 30 mg/L would be multiplied by the average daily, permitted flow to produce a daily mass loading (lbs/day). The monthly average permitted values, versus the monthly maximum, are more representative in determining assimilative capacity in the system. In special circumstances, such as a major point source discharge, a step-function would be implemented so that the waterbody would receive a maximum daily load during the month, but still maintain the permitted monthly average. Water quality constituents represented include BOD, TN, TSS, and TP. BOD and TSS values were represented using DMR and permitted values. TN values were based on monitored NH3 values for the facilities. TP values were assumed to be 5 mg/L for municipal facilities (due to the absence of DMR data and permitted values). Refer to Table 4-1 for point source flows and loads used in the modeling process. In-stream Representation The receiving water model, EFDC, was used to simulate all in-stream dissolved oxygen processes for the impaired waterbodies. Impaired waterbodies received flow and water quality output from the corresponding HSPF model (which represented watershed contributions). Unimpaired waterbodies located in stream networks contributing to impaired waterbodies were not represented explicitly using EFDC, but instead were represented using HSPF in-stream algorithms. Key components of the in-stream representation include: • Hydrodynamic representation • Water quality configuration • Unimpaired waterbody representation Hydrodynamic Representation Independent grid systems were developed to represent impaired waterbodies using EFDC, except in the case where multiple impaired waterbodies were connected. In these situations extended grids representing the entire impaired system were developed. The longitudinal extent of each waterbody impairment, as defined in the Georgia 303(d) list, was used to determine the grid coverage. In general, the grid for each impairment was extended to the waterbody’s intersection with the nearest up- and down-stream Georgia 12-digit subwatershed boundary. This standardized the grid development processes, as well as the watershed model-receiving water model linkage. Under this configuration, the entire extent of each impairment was fully represented. The extent of impairment in Turkey Branch was 8 miles. Each cell was rectangular and represented a single vertical water layer (one dimension). Cells were typically on the order of 1 km (0.62 mi) to 3.22 km (2 mi) in length. Lateral dimensions were derived from USGS cross-sectional data obtained from USGS monitoring stations located on each of the impaired segments. Tributary inflows, point sources, and nonpoint source contributions were applied directly to applicable cells in the grid. For impaired headwaters, the total flow from the contributing 12-digit subwatershed was divided into two portions. The first portion (typically 20% of the flow) was applied directly into the most upstream cell, while the remaining portion (typically 80%) was

18
Ochlockonee River Turkey Branch Dissolved Oxygen TMDL – Suwannee River Basin FINAL
divided equally among the remaining cells to represent nonpoint source inflows. For downstream impairments, upstream inflows (represented in the watershed model) were applied directly to the most upstream cell in the grid. Flow from the 12-digit subwatershed(s) in immediate vicinity of the impaired waterbody (also represented in the watershed model) were distributed evenly among the cells. Flow from incoming tributaries (represented as stream networks in the watershed model) and point sources were applied directly to the most appropriate cell in the configuration. Figure 5-1 presents an example of the in-stream configuration for an impaired headwater and its linkage to the watershed model.
Figure 5-1. Diagram of In-stream Model Configuration. The hydrodynamic portion of the EFDC model is designed to solve three-dimensional, vertically hydrostatic, free surface, turbulent averaged equations of motion for a variable-density fluid. The model uses stretched or sigma vertical coordinates and Cartesian or curvilinear, orthogonal horizontal coordinates. Dynamically-coupled transport equations for turbulent kinetic energy, turbulent length scale, salinity and temperature are also solved. The two turbulence parameter transport equations implement the Mellor-Yamada level 2.5 turbulence closure scheme (Mellor & Yamada, 1982) as modified by Galperin et al (1988). The EFDC model also simultaneously solves an arbitrary number of Eulerian transport-transformation equations for dissolved and suspended materials. The EFDC model allows for drying and wetting in shallow areas by a mass conservation scheme. A number of alternatives are in place in the model to simulate general discharge control

19
Ochlockonee River Turkey Branch Dissolved Oxygen TMDL – Suwannee River Basin FINAL
structures such as weirs, spillways and culverts. The theoretical and computational basis for the model is documented in Hamrick (1992a). Water Quality Configuration Simulation of dissolved oxygen in the receiving water model considered a large suite of model state variables and kinetic processes. The EFDC model simulates the interactions between up to 21 state variables including dissolved oxygen, suspended algae (3 groups), various components of carbon, nitrogen, phosphorus and silica cycles, and fecal coliform bacteria. The kinetic processes included in this model use the Chesapeake Bay three-dimensional water quality model, CE-QUAL-ICM (Cerco & Cole, 1994). Figure 5-2 is a schematic diagram of the EFDC water column water quality model. The primary sources and sinks of oxygen represented in the EFDC model are: • algal photosynthesis and respiration • nitrification • heterotrophic respiration of dissolved organic carbon • oxidation of chemical oxygen demand (COD) • surface reaeration • sediment oxygen demand (SOD) • external loads Refer to A Three-Dimensional Hydrodynamic-Eutrophication Model (HEM-3D): Description of Water Quality and Sediment Process Submodels (EFDC Water Quality Model) for a full description of relevant equations and formulations. In order to represent all sources and sinks of dissolved oxygen, the water quality model required temperature representation and inputs of water quality parameters from the watershed model and point source discharges. For calibration purposes, in-situ temperature data measured concurrently with dissolved oxygen was input into the model. For the allocation model runs, a representative, seasonal distribution of temperature was created for the entire southern four basins. The data used to create the seasonal pattern in the model was collected by the USGS at the 5 monitoring sites in Georgia. The monitoring site that was the closest to the southern four basins in Georgia was at USGS02213700 on the Ocmulgee River near Warner Robbins, Georgia. A sinusoidal function was used to fit to the daily maximum and minimum from the Ocmulgee River station to create the representative temperature for the allocation runs.

20
Ochlockonee River Turkey Branch Dissolved Oxygen TMDL – Suwannee River Basin FINAL
Figure 5-2. EFDC water column water quality model schematics diagram. Water quality parameters were input to cells in the grid using the same procedure as for flow. All upstream inputs, tributary inputs, point sources, and nonpoint source contributions in immediate vicinity of the impaired waterbody were accounted for. Specific parameters transferred from the watershed model (and point sources) to the receiving water model included TSS, BOD, TN, and TP.
BOD5 to Total Organic Carbon The HSPF subwatershed model runs were calibrated primarily to 5-day biochemical oxygen demand (BOD5) and total suspended solids (TSS). Due to the inherent solutions of the water quality models, it was necessary to convert the BOD5 from the point and nonpoint sources to TOC. The watershed loads simulated by HSPF are with respect to BOD5, TN, TP, and TSS. EFDC is a carbon-based water quality model, and therefore, the model simulates organic matter as carbon rather than BOD. Therefore, to put the watershed loads into the in-stream model, BOD5 had to be converted to TOC. By breaking the ratio down into a BODU/BOD5 and TOC/BODU components, the multiplier was justified by a typical in-stream f-ratio (ratio of ultimate BOD to a 5-day BOD) of 4.0 and literature value for converting ultimate BOD to TOC of 2.7 (Thomann and Mueller, 1987). Therefore, an 11.0 (sensitivity ranged from 10.8 to 11.2) multiplier was initially used to convert BOD5 to TOC.

21
Ochlockonee River Turkey Branch Dissolved Oxygen TMDL – Suwannee River Basin FINAL
Unimpaired Waterbody Representation Unimpaired waterbodies contributing to impaired segments were represented as a component of the watershed model. The RCHRES and GQUAL HSPF modules were used to simulate in-stream flow and general water quality. Flow determination using HSPF required development of rating curves for each stream modeled. Rating curves were developed for streams using cross-sectional dimensions estimated from regional watershed area-bankfull channel dimension curves (Rosgen, 1996). No explicit water quality interactions were represented using the GQUAL module. General first-order decay was used to represent all processes typically influencing the fate of water quality parameters, e.g. transformation, settling, etc. Model Testing After developing the watershed and receiving water models to represent source contributions and in-stream response, the models were tested for validity. This testing is typically referred to as model calibration, and it involves the comparison of simulated results to observed data and the subsequent adjustment of model parameter values. Calibration of the linked models was performed for the year 1998, due to the availability of monitoring data. Hydrology and water quality were first calibrated for the watershed model. Once the preliminary calibration results from the watershed model were applied to the receiving water model, calibration of the receiving water model ensued. Calibration of the receiving water model additionally required further calibration of the watershed model, and thus an iterative approach to calibration was taken. Watershed Model Hydrology Calibration Hydrologic calibration involved an adjustment of parameters related to all components of the hydrologic cycle including overland flow, infiltration, groundwater flow, and evapotranspiration. Adjustments were made during a comparison of in-stream flow monitoring data to modeled in-stream flow at a representative location for the region. The location selected was Little Satilla River near Offerman, GA (USGS02227500). The entire drainage area contributing to flow at this station was modeled and results were compared to the monitoring data. After making appropriate adjustments, the model results showed a good correlation with the observed values. The resulting hydrology parameters were validated at two additional stations in the region; Withlacoochee River at McMillan Road near Bemiss, Georgia and Okapilco Creek at Route 33 near Quitman, Georgia. Once hydrologic parameters were calibrated and validated, the values were applied to the remaining subwatersheds in the basin. Watershed Model Water Quality Calibration Once hydrology was calibrated and validated for the watershed model, calibration of water quality parameters was necessary. Water quality calibration consisted of adjusting TSS, BOD, TN, and TP buildup and washoff parameters within a reasonable range to achieve a good match between model output and in-stream water quality observations. Key considerations in the water quality calibration for the watershed model were baseflow concentrations, background concentrations, seasonal variations, and stormflow concentrations.

22
Ochlockonee River Turkey Branch Dissolved Oxygen TMDL – Suwannee River Basin FINAL
Initial buildup and washoff parameters were based on past studies in the southeast, including the Nonpoint Source Pollutant Loading Evaluation - ACT and ACF Water Allocation Formula -Environmental Impact Statements and Water-Quality Improvements in the Lower Mississippi River Valley – Analysis of Nutrient Loadings in the Yazoo River Basin. Each land use category was represented by a different buildup and washoff rate, in order to simulate the variability between load contributions from different sources. The parameters were adjusted through a comparison of model output to typical loading rates from various land uses and monitoring data. As with the hydrology parameters, water quality parameter values were additionally applied to the remaining subwatersheds in the basin. Receiving Water Model Calibration Kinetic parameters that required adjustment included reaeration formula, ratios for nutrient splits, leaf litterfall nutrient split, and density of periphyton. For the in-stream, EFDC model runs, the primary water quality parameters for evaluating a calibrated model were dissolved oxygen and TOC. Secondary parameters include ammonia, nitrate-nitrite, total nitrogen, and total phosphorus. Sediment Oxygen Demand (SOD) and Chemical Oxygen Demand (COD) benthic flux were also examined to see how much oxygen demand is derived by the sediment. In addition to the water quality calibration, flow, velocity, and depth were examined to ensure proper calibration of the hydrodynamics. The dissolved oxygen calibration for Turkey Branch is shown in Figure 5-3. The instream model was calibrated for the following parameters in EFDC: flow, velocity, depth, temperature, dissolved oxygen, ammonia nitrogen, nitrite-nitrate nitrogen, total phosphorus, total organic carbon, and total suspended sediment. The oxygen balance was calibrated by making adjustments to reaeration, algal growth and death, instream kinetic rates, partitioning coefficients for sediment fluxes, and water temperatures.

23
Ochlockonee River Turkey Branch Dissolved Oxygen TMDL – Suwannee River Basin FINAL
Figure 5-3. Turkey Branch Dissolved Oxygen Calibration.
Figure 5-4. Longitudinal Dissolved Oxygen for Turkey Branch and TMDL Alternatives.

24
Ochlockonee River Turkey Branch Dissolved Oxygen TMDL – Suwannee River Basin FINAL
6.0 Loading Capacity The tested model was ultimately used to identify the allowable loading capacity for the listed segment. The first step in the process was to determine naturally occurring dissolved oxygen concentrations for the impaired waterbody. By doing so, the applicable water quality standard used for TMDL development was identified. To determine the naturally occurring dissolved oxygen concentrations, the in-stream model was run using watershed model input representing pristine conditions (entirely forest and wetland contributions) and leaf litterfall. The resultant in-stream dissolved oxygen concentrations represented natural conditions. The range of values was representative of naturally low dissolved oxygen concentrations and was below 110% of the state water quality standard, therefore the EPA criteria was instituted and dissolved oxygen target limits were identified for TMDL development. The target limits were identified as 90% of the minimum naturally occurring concentration for impaired waterbody. After identifying the dissolved oxygen target limits, the models were run to determine the loading capacity of the waterbody. This was done through a series of simulations aimed at meeting the dissolved oxygen target limit by varying source contributions. The final acceptable scenario represented the TMDL (and loading capacity of the waterbody). Subsequent sections of this report present components of the TMDL. Confirmation of Waterbodies Reaching Dry Conditions An analysis of USGS daily discharge data at selected gaging stations located throughout the southern four Georgia basins suggests that many streams in the region actually exhibit no-flow conditions for extended periods of time. Several of the impaired waterbodies dry for significant periods of time throughout the year. Analysis of water quality is virtually impossible during no-flow conditions and situations where streams contain no flow or pooled non flowing water. Seven stations were selected for the analysis. Each station is located on a unique waterbody representing a drainage area between 139 and 1,260 mi2 (Table 6-1).
Table 6-1. USGS Gaging Stations and Characteristics.
The three stations representing the smallest drainage areas (02227000, 02317755, and 02318700) had no-flow days more than 9% of the time. The remaining stations, representing larger watersheds, exhibited no-flow conditions less than 1% of the time. Although the timing of no-flow conditions varied from one waterbody to the next, the most common months exhibiting no-flow conditions
USGS Gaging Station ID
Drainage Area (mi2) Waterbody Basin Period of Record
02227000 139 Hurricane Creek Satilla 10/1/51 - 10/8/7102227500 646 Little Satilla River Satilla 1/27/51 - 9/30/9802314500 1,260 Suwannee River Suwannee 4/20/37 - 9/30/9802316000 663 Alapaha River Suwannee 4/26/37 - 9/30/7602317755 537 Withlacoochee River Suwannee 10/20/76 - 1/4/9002318000 577 Little River Suwannee 6/12/40 - 9/30/7102318700 269 Okapilco Creek Suwannee 12/21/79 - 9/30/98

25
Ochlockonee River Turkey Branch Dissolved Oxygen TMDL – Suwannee River Basin FINAL
were October, November, and June. Precipitation data for the basin supports these trends in that October and November are typically the driest months, and June often exhibits lower rainfall totals (compared to other months). Refer to Appendix A for detailed information regarding precipitation at appropriate weather stations in the basin. Table 6-2 presents information, by station, related to no-flow time periods.
Table 6-2. No-Flow Characteristics for Selected USGS Gaging Stations.
Under no-flow conditions, the development or determination of an appropriate naturally occurring dissolved oxygen water quality standard is not possible or appropriate. Therefore, when using the models to identify minimum dissolved oxygen concentrations under natural conditions, no-flow periods were not considered. The minimum dissolved oxygen concentrations and related loadings were identified only during periods when there was flow in the stream. 7.0 Waste Load and Load Allocations Two critical components of the TMDL are the Waste Load Allocations (WLAs) and the Load Allocations (LAs). The WLAs represent the load allocations to point source facilities contributing to impaired waterbodies, while the LAs represent load allocations to the nonpoint source contributions. LAs are assumed to represent all watershed and leaf litterfall loads to the impaired waterbody. The LAs are divided into subwatersheds (representing all subwatersheds contributing to an impaired waterbody). The WLAs and LAs presented in Table 7-1 represent successful allocation scenarios (in which the dissolved oxygen target limit is met). WLAs and LAs sum to represent the entire TMDL, because MOS is implicitly considered through model assumptions. The partitioning of allocations between point (WLA) and nonpoint (LA) sources was based on modeling results and professional judgment to meet the TMDL. The WLAs may be modified by GAEPD during the NPDES permitting process. The TMDLs will be used to assess the permit renewals in the impaired segments.
USGS Gaging Station ID
Days with No Flow Total Days
% of Days with No Flow
Month with Most No-Flow Days
02227000 745 7306 10.20 June02227500 50 17414 0.29 October02314500 74 22,444 0.33 November02316000 106 14403 0.74 October02317755 142 1233 11.52 November02318000 17 11433 0.15 June02318700 683 6859 9.96 October

26
Ochlockonee River Turkey Branch Dissolved Oxygen TMDL – Suwannee River Basin FINAL
Table 7-1. TMDL Results for Turkey Branch.
The TMDL analysis determined that a 25% point source reduction to GA0047236 and a 57% nonpoint source reduction would meet the instream dissolved criteria of 5.0 mg/L for a daily average. For the point source compliance, the TOC load will be converted to a BOD5 load to be consistent with NPDES permits. The contributing watershed is given its own reduction in the nonpoint source load. 8.0 Margin of Safety The margin of safety (MOS) is part of the TMDL development process. There are two basic methods for incorporating the MOS (USEPA, 1991):
• Implicitly incorporate the MOS using conservative model assumptions to develop allocations, and
• Explicitly specify a portion of the total TMDL as the MOS; use the remainder for allocations.
The MOS was considered implicitly in the TMDL development process. Conservative modeling assumptions include:
• Running dynamic model, • Permitted point sources are loaded into model for allocation runs (average monthly permit
values), taking into account the daily maximum loads, • Running model with actual flow and temperature during one or more annual cycles including
a critical summer period, and • 41% saturation for upstream dissolved oxygen (Meyer, 1992).
9.0 Seasonal Variation The Statute and regulations require that a TMDL be established with consideration of seasonal variations. Seasonal variation was considered through dynamic representation of a full calendar year. The model simulations included a wide range of hydrologic and pollutant loading scenarios and led to development of a TMDL corresponding to these scenarios.
Turkey Branch - Alapaha River BasinTOC (lb/yr) TN (lb/yr) TP (lb/yr)2,405,771 81,878 72,113
Nonpoint Sources (LA) TOC (lb/yr) TN (lb/yr) TP (lb/yr) TOC (lb/yr) TN (lb/yr) TP (lb/yr) TOC (lb/yr) TN (lb/yr) TP (lb/yr)Contributing Subwatersheds
031102020502 2,800,705 84,108 8,421 1,204,303 36,167 3,621 57 57 57Total 2,800,705 84,108 8,421 1,204,303 36,167 3,621
Point Sources (WLA)Fitzgerald WPCP (GA0047236) 1,601,958 60,949 91,323 1,201,469 45,712 68,492 25 25 25Total 1,601,958 60,949 91,323 1,201,469 45,712 68,492
Existing Loads Allocation Loads (WLA) % Reduction
TMDL = WLA + LA
Existing Loads Allocation Loads (LA) % Reduction

27
Ochlockonee River Turkey Branch Dissolved Oxygen TMDL – Suwannee River Basin FINAL
10.0 Monitoring Plan The GAEPD has adopted a basin approach to water quality management; an approach that divides Georgia’s major river basins into five groups. Each year the GAEPD water quality monitoring resources are concentrated in one of the basin groups. One goal is to continue to monitor 303(d) listed waters. This monitoring will occur in the next monitoring cycle for the Suwannee in 2003 and will help further characterize water quality conditions resulting from the implementation of best management practices in the watershed. 11.0 Point and Nonpoint Source Approaches Permitted discharges will be regulated through the NPDES permitting process described in this report. The total organic carbon nonpoint source loading to the streams in the Turkey Branch watershed is made up of a combination of naturally occuring leaf litter and anthropogenic non-point source loads. Because most of the oxygen demanding loadings to the streams in the Turkey Branch watershed is the result of nonpoint sources, the implementation goal for nonpoint sources will be to reduce the loading from anthropogenic non-point source loads. The reduction in anthropogenic non-point source loading should lead to the attainment of water quality standards. To ensure that anthropogenic non-point source load reductions occur in the Turkey Branch watershed, Georgia EPD will work with the Natural Resource Conservation Service (NRCS), the Georgia Soil and Water Conservation Commission (GSWCC), and the Georgia Forestry Commission to implement best management practices (BMPs) to reduce anthropogenic nonpoint source loading of total organic carbon. Implementation of BMPs to reduce anthropogenic non-point source loading of total organic carbon is expected to lead to the attainment of water quality standards. This TMDL is being prepared using a phased approach due to the insufficient data available on the natural background dissolved oxygen concentrations. The permittee will perform dissolved oxygen monitoring upstream and downstream of the point source to verify the natural dissolved oxygen concentrations assumed in the model. The target TMDL reduction will not be implemented until sufficient data has been collected to verify the model assumptions. If it is determined that the model assumptions are incorrect, the target TMDL reductions will be re-evaluated based on the new data collected during critical conditions. 12.0 Public Participation A thirty-day public notice will be provided for this TMDL. During that time, the availability of the TMDL will be public noticed, a copy of the TMDL will be provided upon request, and the public will be invited to provide comments on the TMDL.
28
Ochlockonee River Turkey Branch Dissolved Oxygen TMDL – Suwannee River Basin FINAL
13.0 References Bicknell, B.R. et al., 1996. Hydrological Simulation Program – Fortran (HSPF) User’s Manual for
Release 11. Environmental Research Laboratory, Office of Research and Development, USEPA, Athens, GA.
Cerco, C.F. and T.M. Cole, 1994. Three-dimensional eutrophication model of Chesapeake Bay:
Volume 1, main report. Technical Report EL-94-4, US Army Engineer Waterways Experiment Station, Vicksburg, MS.
DiToro, D.M. and J.J. Fitzpatrick, 1993. Chesapeake Bay sediment flux model. Contract Report
EL-93-2, US Army Engineer Waterways Experiment Station, Vicksburg, MS. Dyar, T.R. and S.J. Alhadeff, 1997. Stream-Temperature Characteristics in Georgia. United States
Geological Survey prepared in cooperation with the Georgia Department on Natural Resources Environmental Protection Division, Water-Resources Investigations Report 96-4203.
Edwards, R.T. and J.L. Meyer, 1987. Metabolism of a subtropical low gradient blackwater river.”
Freshwater Biology, 17:251-263. Galperin, B., L.H. Kantha, S. Hassid, and A. Rosati, 1988. A quasi-equilibrium turbulent energy
model for geophysical flows. Journal of Atmospheric Sciences, 45, 55-62. Georgia EPD, 1996. Georgia's Watershed Protection Approach: River Basin Management
Planning, Draft Program Description. February 1996. Georgia EPD, 2000. Rules and Regulations for Water Quality Control. Chapter 391-3-6. Revised –
July 2000. Georgia Department of Natural Resources. Environmental Protection Division. Atlanta, GA.
Hamrick, J.M., 1992. A three-dimensional environmental fluid dynamics computer code:
theoretical and computational aspects. The College of William and Mary, Virginia Institute of Marine Science. Special Report 317, 63pp.
Hamrick, J.M., 1996. User’s Manual for the Environmental Fluid Dynamics Computer Code.
Special Report No. 331 in Applied Marine Science and Ocean Engineering, Department of Physical Sciences, School of Marine Sciences, Virginia Institute of Marine Sciences.
Mellor, G.L. and T. Yamada, 1982. Development of a turbulence closure model for geophysical
fluid problems. Rev. Geophys. Space. Phys., 20, 851-875. Meyer, J.L., 1992. Seasonal patterns of water quality in blackwater rivers of the Coastal Plain,
Southeastern United States. Water Quality in North American River Systems, Battelle Press, Columbus, Ohio, pages 249-276.
Meyer et al., 1997. Organic matter dynamics in the Ogeechee River, a blackwater river in Georgia, USA. Journal of the North American Benthological Society, 16(1):1.

29
Ochlockonee River Turkey Branch Dissolved Oxygen TMDL – Suwannee River Basin FINAL
Novotny et al., 1989. Karl Imhoff's handbook of urban drainage and wastewater disposal. Wiley, New York.
Park, K. et al., 1995. A Three-Dimensional Hydrodynamic-Eutrophication Model (HEM-3D)
Description of Water Quality and Sediment Process Submodels (EFDC Water Quality Model). Special Report No. 327 in Applied Marine Science and Ocean Engineering, Department of Physical Sciences, School of Marine Sciences, Virginia Institute of Marine Sciences.
Sierra Club v. Hankinson. Civil Action File No. 1: 94-CV-2501-MHS. Consent decree signed
7/15/97. Thomann, R.V. and J.A. Mueller, 1987. Principles of surface water quality modeling and control.
Harper Collins Publishers Inc., New York. U.S. Army Corps of Engineers. 1998. Nonpoint Source Pollutant Loading Evaluation-ACT and
ACF Water Allocation Formula-Snvironmental Impact Statements. USEPA, 1991. Guidance for Water Quality Based Decisions: The TMDL Process. EPA 440/4-91-
001. U.S. Environmental Protection Agency; Assessment and Watershed Protection Division, Washington, DC.
USEPA Region 4, 1999. Draft – Water Quality Improvements in the Lower Mississippi River
Valley: Analysis of Nutrient Loading in the Yazoo River Basin. USEPA, 1986. Ambient Aquatic Life Water Quality Criteria for Dissolved Oxygen (Freshwater).
Office of Water Regulations and Standards Criteria and Standards Division, EPA440/5-86-003.
USGS, 1999. National Water Data Storage and Retrieval System (WATSTORE). U.S. Geological
Survey, Reston, VA. Wharton, C. H. and M. M. Brinson, 1979. Characteristics of southeastern river systems. Pages 32-
40 in R. R. Johnson and J. F. McCormick, editors. Strategies for protection and management of floodplain wetlands and other riparian ecosystems. U. S. Forest Service General Technical Report WO-12. National Technical Information Service, Springfield, VA.

30
Ochlockonee River Turkey Branch Dissolved Oxygen TMDL – Suwannee River Basin FINAL
Appendix A
Data Used in TMDL Analysis

31
Ochlockonee River Turkey Branch Dissolved Oxygen TMDL – Suwannee River Basin FINAL
Table A-1. Water Quality Data Collected by USGS During 1998 at USGS 02316120 – Turkey Branch near Fitzgerald, GA (EPD ID 09010401).
Sample
Date Sample
Time
Water Temp
(deg C)
Air Temp (deg C)
Stage (feet)
Turbidity (NTU)
Specific Cond
(uS/cm)
DO (mg/L)
BOD5 (mg/L) pH NH3
(mg/L)NO2+NO3
(mg/L) TP
(mg/L) TOC
(mg/L)
Fecal Coliform
(mpn) 01/14/1998 815 15.5 15.5 6.50 7.2 120 3.0 3.5 6.6 0.52 1.50 0.38 4.2 02/25/1998 810 13.0 7.0 6.50 2.0 99 4.0 1.8 6.5 0.07 0.68 0.12 6.6 230 03/04/1998 735 11.5 1.0 6.26 196 3.6 6.8 790 03/18/1998 825 15.1 12.5 6.23 118 2.8 6.5 80 03/24/1998 840 14.5 20.0 6.20 3.9 181 3.4 2.8 6.6 0.21 0.83 0.30 5.9 80 04/08/1998 840 19.0 22.0 5.62 4.1 256 1.1 2.9 6.7 1.80 0.20 0.19 6.8 490 04/15/1998 815 17.4 21.0 6.52 93 2.5 6.4 530 04/22/1998 820 18.6 18.0 6.03 115 1.3 6.7 35000 05/06/1998 845 20.1 20.0 5.93 1.0 125 1.5 1.2 6.6 0.06 0.75 0.10 7.5 170 06/08/1998 900 23.3 29.0 6.09 2.5 364 0.2 3.8 6.8 5.50 0.13 0.71 9.0 07/08/1998 920 27.0 32.0 5.94 1.0 612 1.6 1.5 6.7 0.30 3.70 1.70 7.1 20 07/15/1998 850 26.2 27.0 6.12 399 0.6 6.9 20 07/22/1998 920 27.1 31.0 6.12 445 0.9 6.9 50 08/05/1998 930 25.7 29.0 6.13 71.0 456 0.9 5.2 6.7 0.61 1.00 1.40 9.6 170 09/09/1998 930 25.4 28.0 6.21 7.2 167 0.8 2.4 6.7 0.09 1.50 0.35 14.0 10/01/1998 755 23.5 24.5 6.87 7.6 110 3.5 2.1 6.2 0.03 0.37 0.14 4.4 330 10/08/1998 715 24.0 24.0 7.43 108 3.1 6.3 11000 10/22/1998 755 20.5 14.0 5.97 236 3.7 6.5 330 10/29/1998 910 20.0 18.0 6.17 3.3 342 4.0 1.0 6.9 0.14 0.52 0.30 3.6 1700 12/08/1998 855 20.0 20.0 6.57 3.1 380 3.6 1.1 6.8 0.12 0.37 0.38 5.5 min 11.5 1.0 5.62 1.0 93 0.2 1.0 6.2 0.03 0.13 0.10 3.6 20 mean 20.4 20.7 6.27 9.5 246 2.3 2.4 6.6 0.79 0.96 0.51 7.0 3187 max 27.1 32.0 7.43 71.0 612 4.0 5.2 6.9 5.50 3.70 1.70 14.0 35000

32
Ochlockonee River Turkey Branch Dissolved Oxygen TMDL – Suwannee River Basin FINAL
TOTAL MONTLY PRECIPITATION (IN)
Station: ABBEVILLE 4 S (GA0010) Analysis Period: 50 years (from June, 1948 to June, 1998) Month Count Mean Min Max St Dev Median 25th 75th January 50 3.85 0.20 10.30 2.46 3.44 1.91 5.28 February 50 4.20 0.40 7.84 2.06 4.05 2.76 5.90 March 50 4.59 0.35 9.91 2.28 4.67 2.85 6.21 April 50 3.05 0.10 6.86 2.02 2.79 1.15 4.28 May 50 2.91 0.00 7.03 1.94 2.39 1.61 3.59 June 51 3.78 0.82 9.90 1.78 3.44 2.50 4.90 July 50 5.16 0.00 11.76 2.85 4.87 2.82 6.70 August 50 4.03 0.81 11.77 2.38 3.92 2.24 5.11 September 50 3.11 0.10 9.50 2.19 2.51 1.39 4.38 October 50 2.10 0.00 8.13 1.96 1.65 0.61 2.99 November 50 2.55 0.15 9.34 2.14 2.08 0.76 3.41 December 49 3.42 0.46 8.25 1.67 2.95 2.33 4.45
Figure A-1. Average Monthly Mean Precipitation for Abbeville (GA0010).