Embed Size (px)
Citation preview

Case StudyFinancial Accounting
LI-KUAN FANG

BackgroundMillicom International Cellular S.A.
Millicom International Cellular S.A., currently headquartered in Luxembourg, offers a range ofdigital services as an international telecommunications and media company. Millicom operatesmainly in Africa and Latin America.
They provide fixed and mobile telecommunications services, cable and satellite TV, mobilefinancial services and content like music and sports to more than 62 million customers throughtheir consumer brand, Tigo. Millicom just celebrated their 25th year last 2015.
Millicom – Business Branches

The Business Structure:No significant change with the structures of revenue and earnings in 2015

Balance SheetMillicom International Cellular S.A.
Balance Sheet US$ (in million) 2013 2014 2015 % ChangeIntangible assets, net 2,458 5,515 4,835 -12.33%Tangible assets, net 2,771 4,751 4,236 -10.84%Investments in joint ventures and associates
449 274 363 32.48%
Cash and cash equivalents and restricted cash
989 822 1,083 31.75%
Other (non-)current assets 2,104 2,056 1,888 -8.17%Total assets 8,771 13,418 12,405 -7.55%
Equity attributable to owners
1,929 2,339 3,285 40.44%
Non-controlling interests 152 1,391 1,128 -18.91%Debt and financing 3,861 4,923 5,385 9.38%Other (non-)current liabilities
2,829 4,765 2,607 -45.29%
Total equity and liabilities 8,771 13,418 12,405 -7.55%Numbers taken from M illicom's Annual Reports o f 2015 and 2014
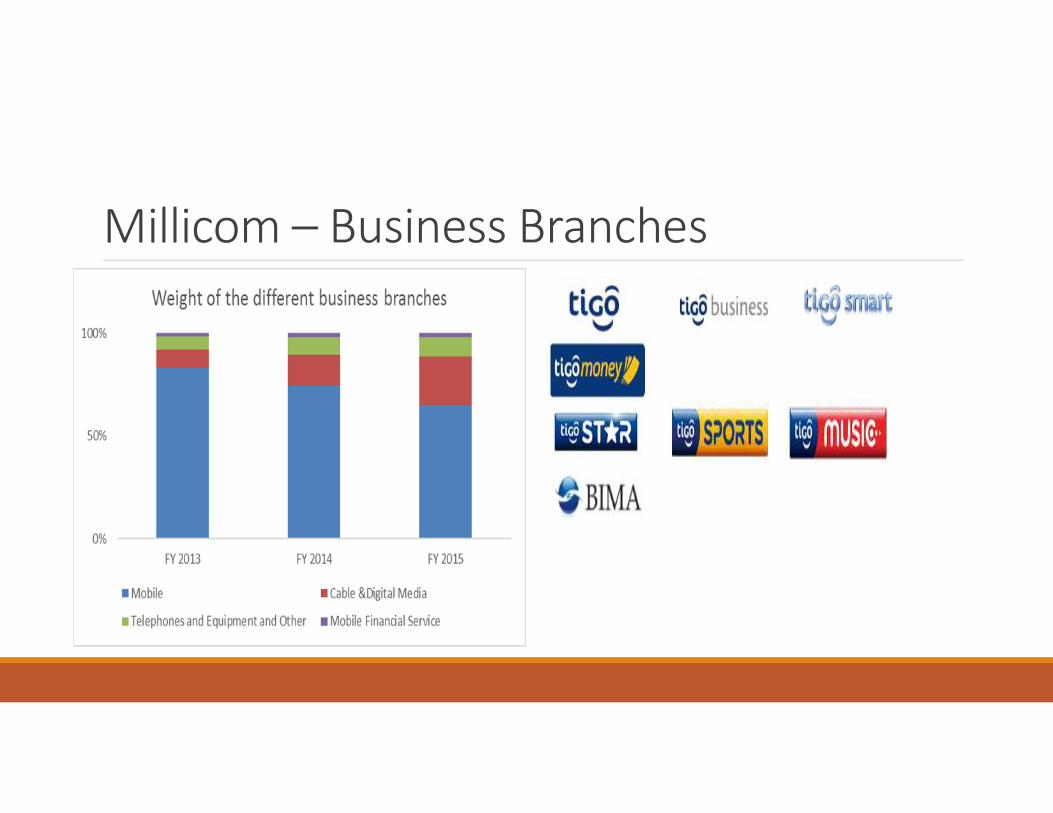
Income StatementMillicom International Cellular S.A.
Income StatementUS$ (in million) 2013 2014 2015 % ChangeRevenue 4,390 6,386 6,730 5.39%Gross profit 2,667 4,692 4,876 3.92%Gross profit margin 61% 73.5% 72.5%
Operating profit 583 924 791 -14.39%Operating profit margin 13.3% 14.5% 11.8%
Profit (loss) before taxes 412 3,036 153 - -105.04%Charge for taxes 144 - 256 - 291 - 13.67%Net profit attributable to owners
229 2,643 559 - -121.15%Numbers taken from M illicom's Annual Reports o f 2015 and 2014

The evolution of the Net Income sincethe company was founded
Millicom revalued to fair value its 55% interest inComcel, and recognised a gain of $2,250 million underother non-operating (expenses) income,net.
Local currenciesdepreciateddramaticly in 2015.
WPA1
Slide 7
WPA1 WAICMAN Paula Andrea, 11/20/16

Cash flow StatementMillicom International Cellular S.A.
Cash Flow StatementUS$ (in million) 2013 2014 2015 % ChangeCash flow from operating activities
916 1,458 1,651 13.24%
Cash flow from investing activities
1,878 - 276 - 1,244 - 350.72%
Cash flow from financing activities
715 1,368 - 84 - -93.86%
Cash and cash equivalents 909 694 937 35.01%Numbers taken from M illicom's Annual Reports o f 2015 and 2014
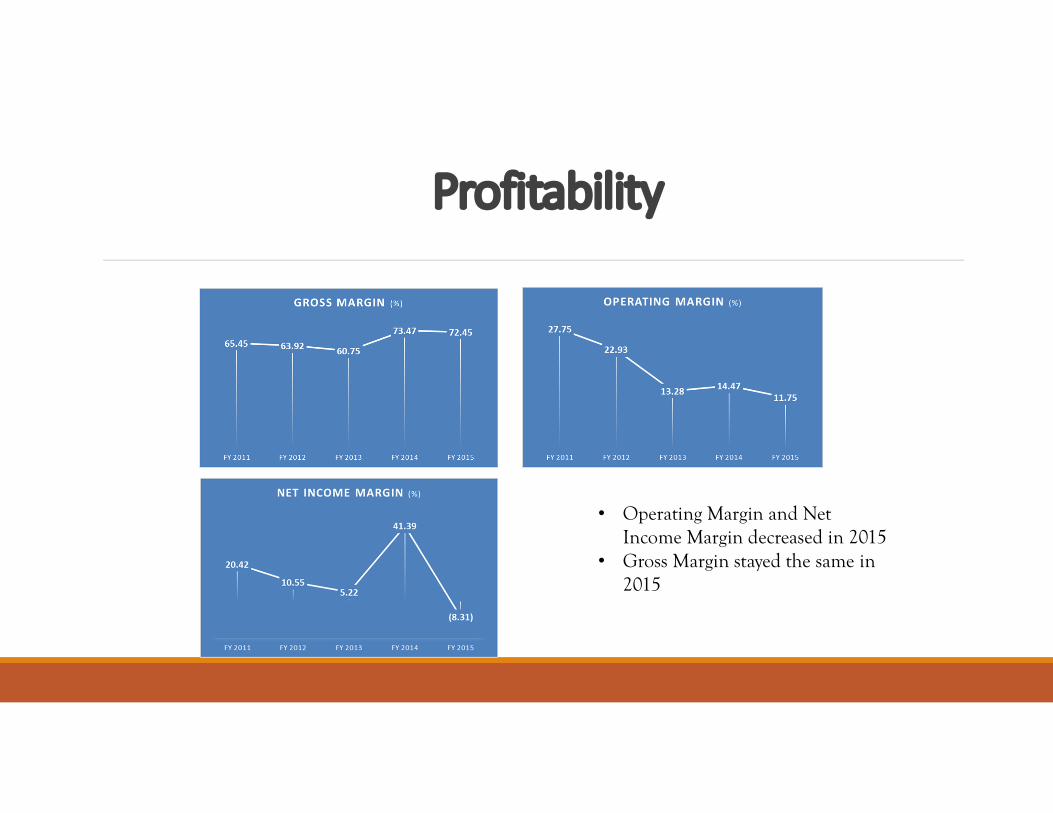
Profitability
• Operating Margin and Net Income Margin decreased in 2015
• Gross Margin stayed the same in 2015
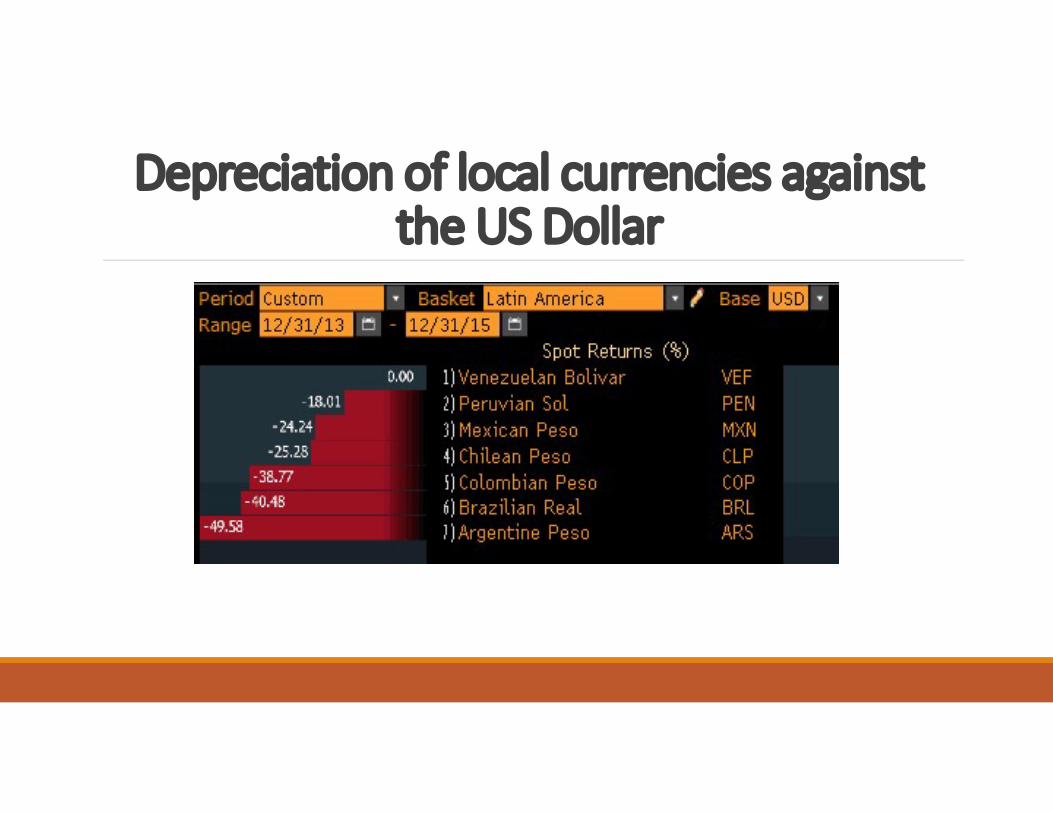
Depreciation of local currencies againstthe US Dollar
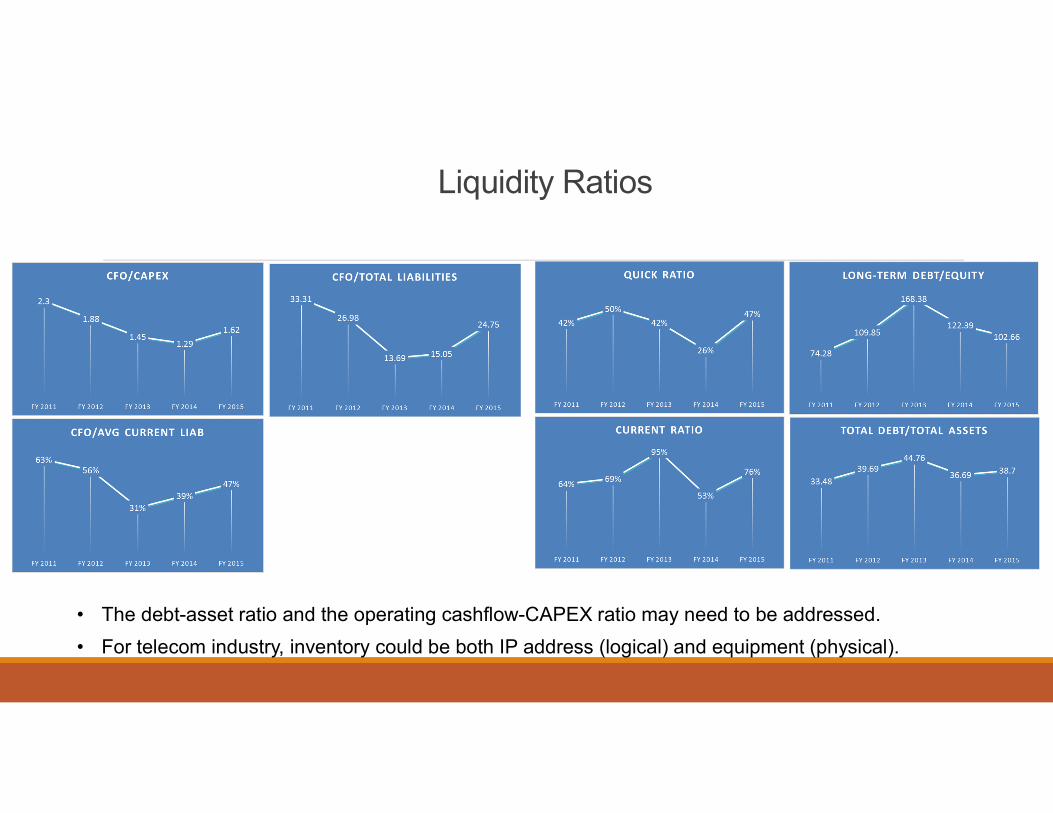
Liquidity Ratios
• The debt-asset ratio and the operating cashflow-CAPEX ratio may need to be addressed.
• For telecom industry, inventory could be both IP address (logical) and equipment (physical).
NII Holdings, Inc.NII Holdings, Inc. is an American holding company that provides mobile communications services, under the Nextel brand, in Brazil.
NII went through bankruptcy in 2014 and 2015
América MóvilAmérica Móvil is a Mexican telecommunications corporation headquartered in Mexico city.
It is the 4th largest mobile network operator in the world.
It is a venture of Carlos Slim
América Móvil provides services to:◦ 289.4 million wireless subscribers, ◦ 35 million landlines, ◦ 22.6 million broadband accesses and◦ 21.5 million PayTV
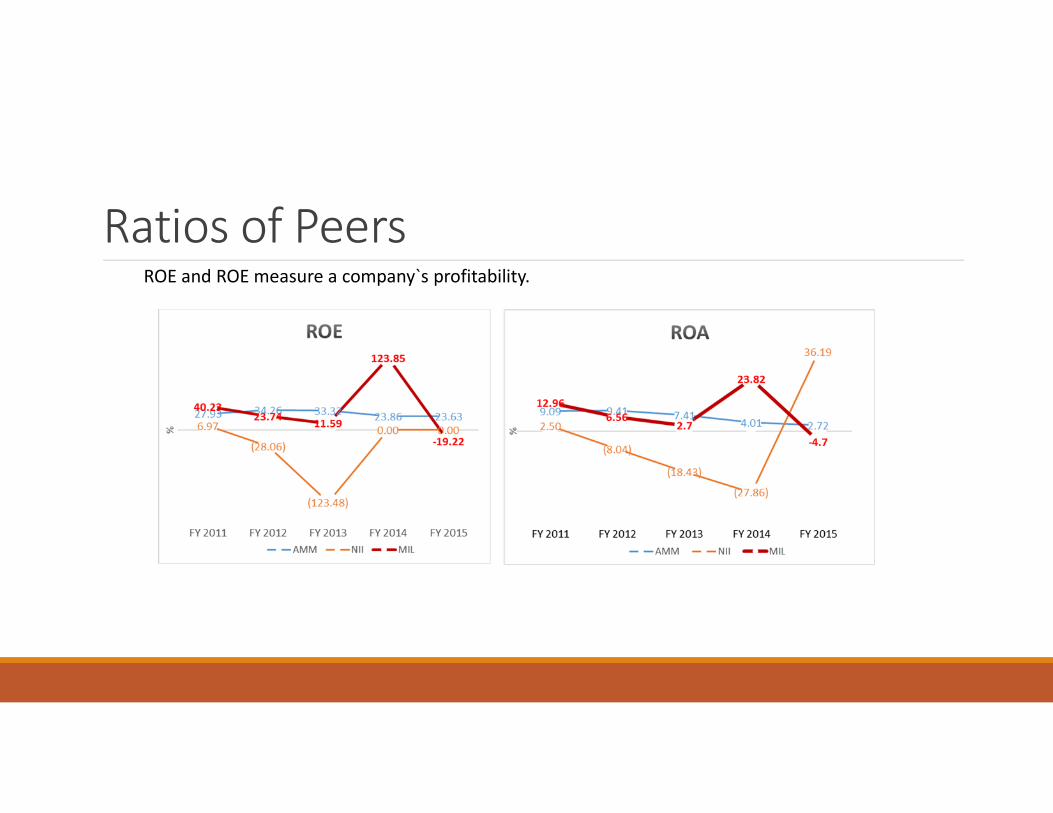
Ratios of PeersROE and ROE measure a company`s profitability.
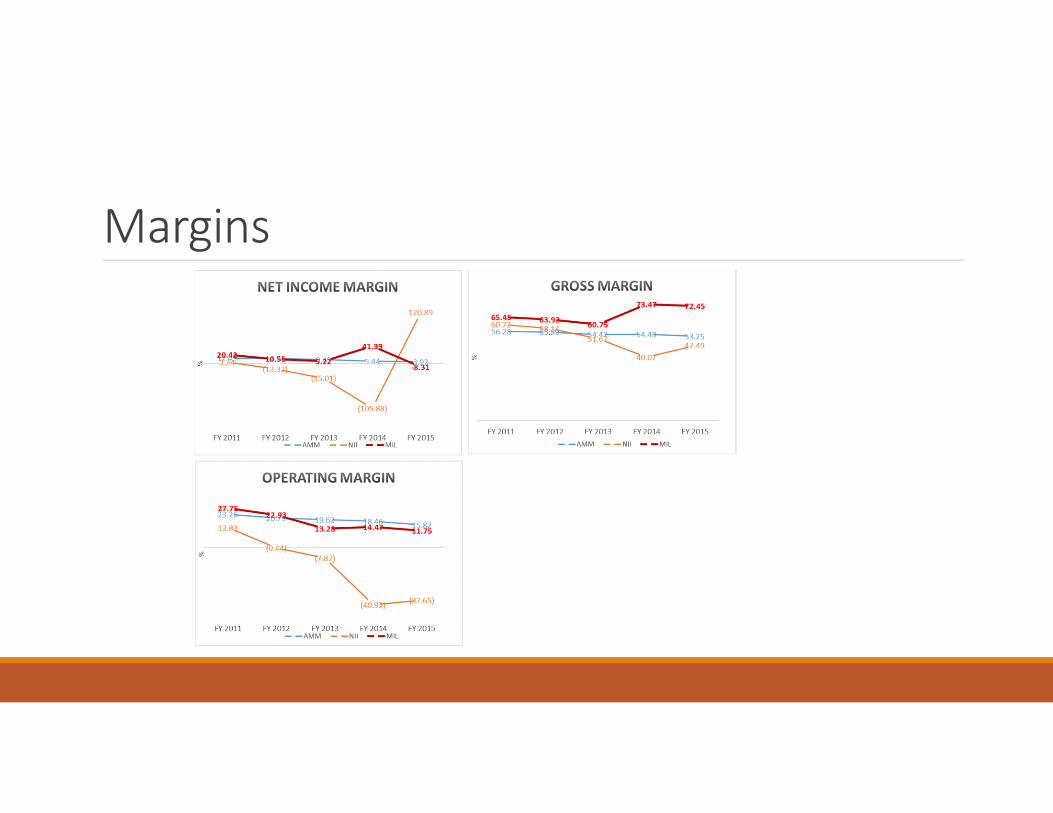
Margins

Payout ratio
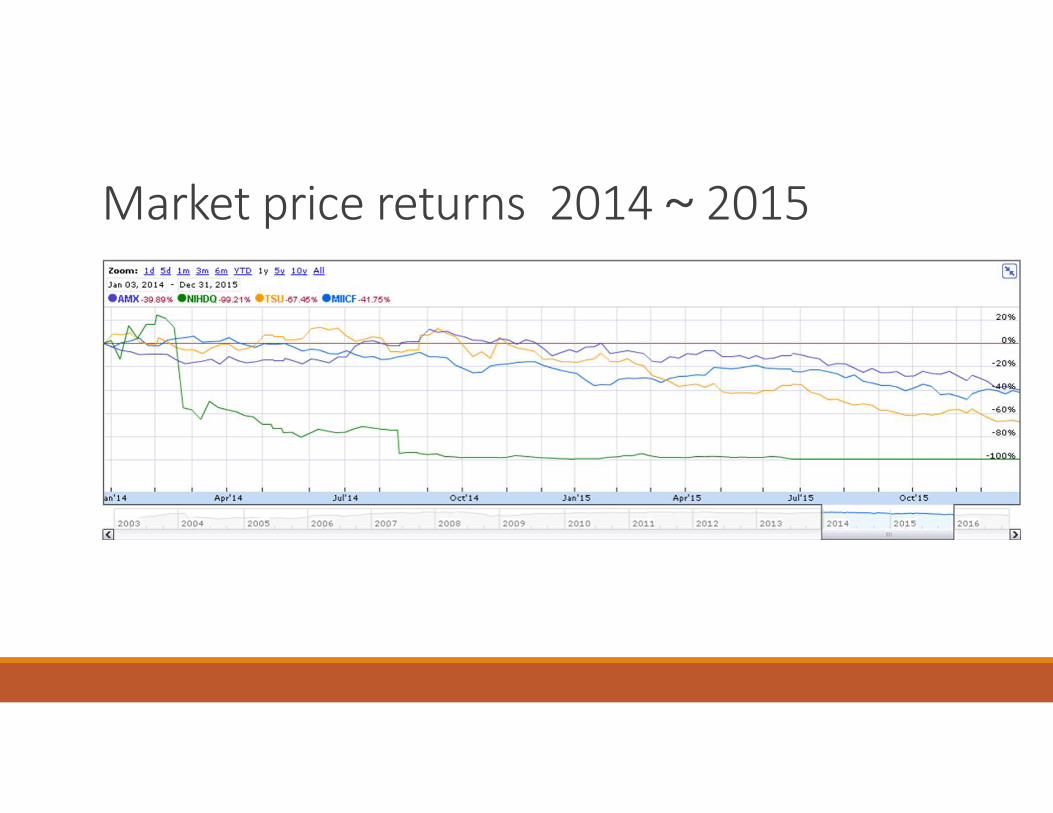
Market price returns 2014~2015

Thank you.