Embed Size (px)
Citation preview
Financial Flows for Environment:
World Bank, UNDP, UNEP
Uwe Steckhan
August 2009
CONCESSIONAL FINANCE AND GLOBAL PARTNERSHIPS VICE PRESIDENCY
THE WORLD BANK GROUP

Abstract
While there is a common understanding of the urgent need to support the environment, there is little analysis of the financial flows directed to do so. This note attempts to provide an overview of the development financial flows for the environment through the three main implementing agencies of the Global Environment Facility (GEF), the World Bank, the United Nations Development Programme (UNDP), and the United Nations Environment Programme (UNEP). The GEF is a major source of grant funding for the environment, with annual flows averaging about US$658 million for its implementing agencies. The World Bank adds additionally about US$2 billion annually for the environment through its lending operations. Flows for the environment through trust funds analyzed in this note average US$244 million annually, and are in a similar order of magnitude than the flows through the UNDP and the UNEP. Finally, this note presents details on the thematic and regional focus areas of these channels and draws out trends in the development of the financial flows through these.
Acknowledgements
This note was prepared by Uwe Steckhan (CFPTP) with guidance from Rocio Castro (CFPVP). Input was provided from Buenaflor Cabanela (CFPTP), Zhimei Xu (CFPTP), Fernando Machado (CFPMI), Eri Tsutsui (ENV), Louise Shaw-Berry (ENVGC). Comments and feedback were received from James Warren Evans (ENV), Kulsum Ahmed (ENV), Yewande Awe (ENV), Steve Gorman (ENVGC), Siv Tokle (ENVGC), Priya Basu (CFPMI), Pamela Crivelli (CFPMI), Jonathan Caldicott (CFPMI), Lesley Wilson (CFPMI), Abebe Adugna (CFPIR), Kjell Nordlander (CFPTP), Brian Hammond (Consultant).

Abbreviations and Acronyms
AFR
CFPMI Multilateral Trustee and Innovative Financing
CFPTO Global Partnership & Trust Fund Operations
CFPTP Global Partnership & Trust Fund Policy
CFPVP Concessional Finance and Global Partnerships Vice Presidency
DAC Development Assistance Committee
EAP East Asia and Pacific
ECA Europe and Central Asia
ENRM Environment and Natural Resources Management
ENV Environment Department
ENVGC GEF Coordination Team
FY Fiscal Year
GEF Global Environment Facility
GEFIA GEF IBRD as Implementing Agency
IBRD International Bank for Reconstruction and Development
IDA International Development Association
LAC Latin America and Caribbean
MNA Middle East and North Africa
ODA Official Development Assistance
OECD Organisation for Economic Co-operation and Development
OPCS Operations Policy & Country Services
OSG Office of the Secretary General
RETF Recipient Executed Trust Funds
SAR South Asia Region
STAP Scientific and Technical Advisory Panel
UNDP United Nations Development Programme
UNEP United Nations Environment Programme

Financial Flows for Environment:
World Bank, UNDP, UNEP
Table of Contents
Executive Summary...................................................................................................................................... i
A. Global Environment Facility................................................................................................................1
B. World Bank.........................................................................................................................................3
B.1. World Bank Lending Commitments for Environment..................................................................3
B.1.1. World Bank Lending Commitments for Environment by Region........................................................4
B.1.2. World Bank Lending Commitments for Environment by Sub-Theme.................................................4
B.2. World Bank Recipient Executed Trust Fund Grant Disbursements for Environment...................5
B.2.1. World Bank RETF Grant Disbursements for Environment by Country’s Borrowing Eligibility.............7
B.2.2. World Bank RETF Grant Disbursements for Environment by Region.................................................7
B.2.3. World Bank RETF Grant Disbursements for Environment by Sub-Theme..........................................8
C. UNDP.................................................................................................................................................10
D. UNEP.................................................................................................................................................12
E. Concluding Remarks..........................................................................................................................13
Annex........................................................................................................................................................15
I. Approach and Methodology......................................................................................................15
II. Data Tables................................................................................................................................18

FiguresFigure 1: GEF Council and CEO Net Funding Decisions – By Implementing Agencies..................................1
Figure 2: GEF Trustee Commitments – By Implementing Agencies.............................................................2
Figure 3: World Bank ENRM Lending by Country’s Borrowing Eligibility.....................................................3
Figure 4: World Bank IBRD / IDA ENRM Lending – Regional Breakdown.....................................................4
Figure 5: World Bank IBRD / IDA ENRM Lending – Share of Sub-Themes...................................................5
Figure 6: Recipient Executed Trust Fund Disbursements – Environment and Natural Resources Management Theme...................................................................................................................................6
Figure 7: RETF ENRM Disbursements – Breakdown by Country’s Borrowing Eligibility...............................7
Figure 8: RETF ENRM Disbursements – Regional Breakdown......................................................................8
Figure 9: RETF ENRM Disbursements – Share of Sub-Themes.....................................................................8
Figure 10: UNDP – Expenditures & Share of Environment........................................................................10
Figure 11: UNEP – Sources of Income.......................................................................................................12
TablesTable 1: Commitment of GEF grants through the World Bank as implementing agency..........................18
Table 2: GEF Council and CEO Net Funding Decisions – By Implementing Agencies.................................18
Table 3: GEF Trustee Commitments – By Implementing Agencies............................................................18
Table 4: World Bank ENRM Lending by Country’s Borrowing Eligibility / # of Lending Projects................19
Table 5: World Bank ENRM Lending – Regional Breakdown for IBRD:......................................................19
Table 6: World Bank ENRM Lending – Regional Breakdown for IDA:........................................................19
Table 7: World Bank ENRM Lending – Share of Sub-Themes for IBRD:.....................................................20
Table 8: World Bank ENRM Lending – Share of Sub-Themes for IDA:.......................................................20
Table 9: Recipient Executed Trust Fund Disbursements............................................................................20
Table 10: Number of RETF / RETF Grants..................................................................................................20
Table 11: RETF ENRM Disbursements – Breakdown by Country’s Borrowing Eligibility............................21
Table 12: RETF ENRM Disbursements – Regional Breakdown...................................................................21
Table 13: RETF ENRM Disbursements – Share of Sub-Themes..................................................................21
Table 14: UNDP – Total Income Received from Governments and Other Contributors............................22
Table 15: UNDP – Expenditures & Share of Environment.........................................................................22
Table 16: UNEP – Sources of Income.........................................................................................................22

Executive Summary
1. This note presents an analysis of development financial flows directed to support the environment through the World Bank1, the United Nations Development Programme (UNDP), and the United Nations Environment Programme (UNEP) - the main implementing agencies of the Global Environment Facility (GEF). As such, this note complements the analysis of environment aid based on data from the OECD-DAC.2
2. The objective of the note is to shed light as to the volume of financial flows channeled by each of the three agencies as well as their allocation to sub-themes and regions. Because of the data availability constraints and different ways of reporting, data are not strictly comparable across agencies (some are based on commitments, disbursements, or expenditures). Notwithstanding these limitations, it is still possible to ascertain orders of magnitude of the size of financial flows channeled by the various agencies.
3. The World Bank is the largest source of funding for the environment among the three agencies. During FY04-08, World Bank lending commitments for the environment have grown more rapidly than overall lending and averaged US$1.97 billion a year; or 9% of overall lending commitments. In FY08, environment related commitments peaked at US$2.66 billion. On average, 75 projects (with an environmental component) were approved annually during FY04-08.
IBRD commitments averaged US$1.39 billion annually, or about 70% of the Bank’s environmental lending over FY04-08. The majority was directed to the East Asia Pacific and Latin America and Caribbean regions. Thematically the bulk of IBRD environment commitments were directed to Water Resources Management and Pollution Management and Environmental Health, although the share of Climate Change surged to 40% in FY08 up from an average of 8% in the preceding four fiscal years.
IDA commitments (including those to blend countries) averaged US$516 million annually or 27% of total environment related financial flows. Most commitments were directed to the Sub-Saharan Africa region. In terms of themes, Water Resources Management plays an even larger role, averaging 30% during FY04-08, growing to a share of 45% in FY08.
4. In addition, the World Bank channels several recipient executed trust funds (RETFs) which target the environment. Notably, GEF grant commitments through the World Bank as implementing agency (GEFIA) added an average of US$261 million a year over the period. Given that GEFIA grants account for 71% of disbursements from World Bank administered RETFs for the environment, overall RETF commitments are estimated at US$368 million a year3.
1 According to the World Bank classification the Environment and Natural Resources Management theme includes Biodiversity, Climate Change, Environmental Policies and Institutions, Land Administration and Management, Pollution Management and Environmental Health, Water Resources Management, and Other Environment and Natural Resources Management.2 See the paper on “The Architecture of Aid for the Environment – A ten-year statistical perspective”.3 RETF figures are based on disbursement data, as a detailed breakdown of trust fund data is not available on a commitment basis due to the fact that trust fund commitments are not allocated upfront to specific themes.
i

5. The majority of disbursements from environment related RETFs go to IBRD countries (close to 60%), mainly for the East Asia Pacific region, with a decreasing share for the South Asia region and increasing shares to the Sub-Saharan Africa and Middle East and North Africa region. Thematically, Pollution Management and Environmental Health accounts for the largest share, similar to lending commitments, together with grant commitments to Environmental Policies and Institutions.
6. For UNDP, environment related activities make up an average of 11% of UNDP’s expenditures, averaging US$312 million a year over CY04-07; with GEF providing the majority of funding. With GEF funding averaging US$241 million a year (or 5% of UNDP’s income during the period), it is estimated that GEF finances over 75% of UNDP’s expenditures for the environment. UNDP environmental activities have a stronger focus on Biodiversity than the World Bank, with an average share of 28% of UNDP’s expenditures.
7. For UNEP it is assumed that all of its activities are environment related. UNEP’s income has stayed largely flat at an average of US$268 million during CY04-07. On the other hand, GEF commitments to UNEP have declined significantly over the last years, going down from US$140 million in fiscal year 2004 to US$36 million in FY 2007, suggesting that the importance of GEF in UNEP funding is declining.
8. In sum, the GEF is an important source of funding for UNDP and UNEP, but plays a relatively smaller role in funding environmental activities for the World Bank. With commitments averaging about US$2 billion a year, the World Bank provides three times as much as the GEF annually (US$658 million a year). In terms of concessional financing, GEF commitments are somewhat higher than IDA financing for the environment (US$516 million a year).
ii

A. Global Environment Facility
1. The GEF is a major source of grant funding for the global environment. 4 The GEF provides grants for projects related to six focal areas (Biodiversity, Climate Change, International Waters, Land Degradation, the Ozone Layer, and Persistent Organic Pollutants). Since its inception in 1991 the World Bank, UNDP, and UNEP have been the three implementing agencies of the GEF, complemented by seven more agencies since 1999, but remain the major recipients of funds from the GEF. Donor countries have provided funding to the GEF in four year replenishment cycles, with the third GEF replenishment covering the period from July 1, 2002 to June 30, 2006 (FY03 through FY06), and the fourth from FY07 through FY10.
2. The GEF Council approves and the GEF CEO subsequently endorses funding decisions for project proposals brought forward by the implementing agencies, which negotiate these with the recipient countries.5 The World Bank as Trustee of the GEF trust fund commits these funds, after CEO endorsement, to the implementing agencies. Partly because of time lags, there can be differences between the value of funding decisions, commitments, and disbursements.
Figure 1: GEF Council and CEO Net Funding Decisions – By Implementing Agencies
FY04 FY05 FY06 FY07 FY080
100
200
300
400
500
600
700
800
900
1,000
327.8 297.9264.2
456.1236.2
275.8 258.2
256.6
328.9
320.1
99.2 78.9
55.5
80.0
67.3 UNIDOUNEPUNDPIFADIBRDIADBFAOEBRDAfDBADB
USD
mill
ions
Source: CFPMI; includes projects, fees and project preparation activities but does not include cancellations
3. Figure 1 displays funding decisions from the GEF Council to the ten GEF implementing agencies over the last five fiscal years. A decline in funding decisions is apparent over the term of the third replenishment cycle, with a similar trend visible also for the fourth replenishment cycle from its start in FY07. Notably, GEF funding decisions to the World Bank dropped by almost 50% from US$456.1 million in FY07 to US$236.2 million in FY08, for the first time falling behind UNDP, having been endorsed for US$320.1 million in FY08.
4 Source: GEF: About the GEF (http://www.thegef.org/interior_right.aspx?id=50)5 Source: GEF: GEF Project Cycle; GEF/C.31/7; May 14, 2007
1

4. Figure 2 displays GEF Trustee commitments to implementing agencies over the same period 6. The level of commitments picked up significantly in FY08, reaching US$913 million in FY08, reflecting increased funding decisions in FY07. The World Bank, UNDP and UNEP account on average for 95% of all commitments, with the World Bank alone covering an average of 45% of all commitments; 49% (US$450.6 million) in FY08. The UNDP accounts on average for 39% of all commitments, and the UNEP on average for 11%, with declining shares through FY08.
Figure 2: GEF Trustee Commitments – By Implementing Agencies
FY04 FY05 FY06 FY07 FY080
100
200
300
400
500
600
700
800
900
1,000
320.0 270.1267.0
180.5
450.6
259.7218.4
202.8
236.9
345.5139.5
60.896.1
35.5
28.2
UNIDOUNEPUNDPIFADIBRDIADBFAOEBRDAfDBADB
USD
mill
ions
Source: CFPMI; reflects initial Trustee commitments less cancellations and unused amounts from financially closed projects; includes stand alone projects, projects attached to Programmatic Initiatives, fees and project preparation activities; does not
include project and fee amounts pending Agency approval
5. The subsequent sections will provide additional details on the development financial flows allocated to support the environment from different sources through the three main implementing agencies of the GEF.
6 GEF figures are commitments, as GEF disbursement data is not available from all implementing agencies and is used only in the RETF analysis part.
2

B. World Bank
6. The World Bank supports the environment by drawing on its own resources and by integrating GEF grants with its lending operations.7
B.1. World Bank Lending Commitments for Environment
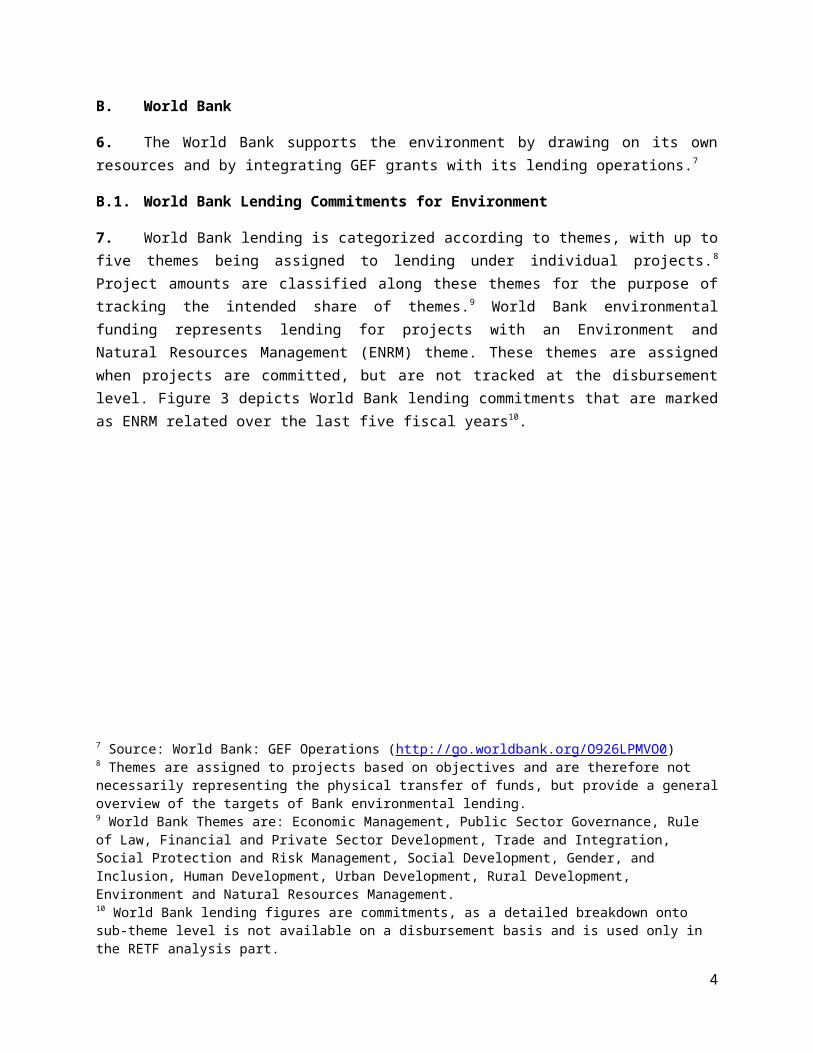
7. World Bank lending is categorized according to themes, with up to five themes being assigned to lending under individual projects.8 Project amounts are classified along these themes for the purpose of tracking the intended share of themes.9 World Bank environmental funding represents lending for projects with an Environment and Natural Resources Management (ENRM) theme. These themes are assigned when projects are committed, but are not tracked at the disbursement level. Figure 3 depicts World Bank lending commitments that are marked as ENRM related over the last five fiscal years10.
Figure 3: World Bank ENRM Lending by Country’s Borrowing Eligibility
FY04 FY05 FY06 FY07 FY080
500
1,000
1,500
2,000
2,500
3,000
758.7
2,057.4
1,025.81,351.7
1,775.4492.4
417.9
361.6
444.3
734.6
53.5
1.9
0.0
221.0
151.8
Blend Lending
IDA Lending
IBRD Lending
USD
mill
ions
Source: World Bank Project Portfolio Database; includes all Environment Projects with at least one ENRM sub-theme; data does not include GEF and Montreal Protocol Projects
8. Overall Bank lending commitments grew by an average of 4% per year since FY04, reaching US$24.64 billion in FY08. Over the period, ENRM marked lending fluctuated but showed a general upward trend; peaking at US$2.66 billion in FY08. 7 Source: World Bank: GEF Operations (http://go.worldbank.org/O926LPMVO0)8 Themes are assigned to projects based on objectives and are therefore not necessarily representing the physical transfer of funds, but provide a general overview of the targets of Bank environmental lending.9 World Bank Themes are: Economic Management, Public Sector Governance, Rule of Law, Financial and Private Sector Development, Trade and Integration, Social Protection and Risk Management, Social Development, Gender, and Inclusion, Human Development, Urban Development, Rural Development, Environment and Natural Resources Management.10 World Bank lending figures are commitments, as a detailed breakdown onto sub-theme level is not available on a disbursement basis and is used only in the RETF analysis part.
3

Overall ENRM lending accounted for an average of 9% of all Bank lending, having grown with a compound annual growth rate of 15%, significantly higher than the growth rate of 4% for overall Bank lending commitments; with 25% of all Bank projects containing an ERNM share.
On average, 75 projects annually had an ENRM component, with an average ENRM component of US$28 million per project.
Regarding the borrowing eligibility of recipient countries, an average of 70% of these ENRM commitments go to IBRD countries (with about a third of this being committed to China), 26% to IDA countries and the remainder to blend countries.
B.1.1. World Bank Lending Commitments for Environment by Region
9. Among IBRD countries, a third of ENRM commitments are directed to the Latin America and Caribbean (LAC) and East Asia Pacific (EAP) region, with about a fifth going to the Europe and Central Asia (ECA) region. For IDA countries on average about half of the commitments go to Sub-Saharan Africa (AFR) and a fifth to South Asia (SAR) and EAP. Middle East and North Africa (MNA) has a small share.
Figure 4: World Bank IBRD / IDA ENRM Lending – Regional Breakdown
FY04 FY05 FY06 FY07 FY080%
10%
20%
30%
40%
50%
60%
70%
80%
90%
100%
40%48%
65%
48% 46%
23%14%
5%24% 23%
12% 15%
16%5%
3%3% 1%
1%
3%2%
4%1%
18% 22%12%
20% 26%
World Bank IDA Lending Commitments
AFR EAP ECA LCR MNA SAR
Source: World Bank Project Portfolio Database
B.1.2. World Bank Lending Commitments for Environment by Sub-Theme
10. For World Bank ENRM lending commitments a more detailed breakdown by sub-themes is available, providing additional information on specific topic areas to which the loan amounts are assigned. The ENRM theme consists of seven sub-themes: Biodiversity, Climate Change, Environmental Policies and Institutions, Land Administration and Management, Pollution Management and Environmental Health, Water Resources Management, and Other Environment and Natural Resources Management (see Annex for details), to which ENRM lending is classified.
FY04 FY05 FY06 FY07 FY080%
10%
20%
30%
40%
50%
60%
70%
80%
90%
100%
35%19%
37% 34% 32%
33%
16%
9%25%
20%
19%
41%
44% 25% 37%
12%
8%
4% 13% 3%
1%17%
5% 2% 7%
1%
World Bank IBRD Lending Commitments
4

Figure 5: World Bank IBRD / IDA ENRM Lending – Share of Sub-Themes
FY04 FY05 FY06 FY07 FY080%
10%
20%
30%
40%
50%
60%
70%
80%
90%
100%
19% 4%9%
1%
40%5%10%
23%
21%
20%
8% 13%
16%
4%
9%
37% 32%
24%
39%
19%27% 34%15%
30%
7%4% 1% 5% 2% 3%
6% 8% 1% 1%
World Bank IBRD ENRM Lending Commitments
Biodiversity Climate Change
Environmental Policies and Institutions Land Administration and Management
Pollution Management and Environmental Health Water Resources Management
Other Environment and Natural Resources Management
Source: World Bank Project Portfolio Database
11. Comparing a breakdown by sub-theme of ENRM lending to IBRD and IDA countries side by side (Figure 5) shows largely similar distributions between IBRD and IDA. Although the patterns vary, Water Resources Management, together with Pollution Management and Environmental Health account for the largest share of ENRM financial flows. On average about half of all commitments are assigned to these sub-themes for IBRD and IDA countries. Biodiversity accounts for the smallest share for both IBRD and IDA with an average of 3% of all loans. Notable is an increase in Climate Change related commitments for IBRD countries, which surged from an average of 8% to 40% in FY08. For IDA countries a growth of Water Resources Management in FY07 and FY08 to an average of 30% is apparent.
B.2. World Bank Recipient Executed Trust Fund Grant Disbursements for Environment
12. Besides World Bank lending operations, the World Bank as implementing agency of the GEF (GEFIA), channels GEF grants to recipient countries. Financial flows under these projects are additional to the World Bank ENRM lending commitments. Table 1 displays the amount of World Bank commitments of GEF grants during the last five fiscal years. GEFIA commitments account for an average of 14% on top of World Bank ENRM lending commitments, an average of US$261 million, with an average of 37 new GEFIA projects per fiscal year.
Table 1: Commitment of GEF grants through the World Bank as implementing agency
FY04 FY05 FY06 FY07 FY08
GEFIA Grant Amount (USD millions) 217.6 245.6 324.6 238. 280.0
FY04 FY05 FY06 FY07 FY080%
10%
20%
30%
40%
50%
60%
70%
80%
90%
100%
3% 3% 6% 1%7% 7%
9%
3% 7%
11% 15%
27%
16%19%
14%
37% 7%
11%
15%
31%
20%
12%
27% 10%
32%10%
25% 39% 45%
3% 8% 14%4% 3%
World Bank IDA ENRM Lending Commitments
5

9
# of GEFIA Projects 37 43 41 31 35Source: World Bank Project Portfolio Database; includes all Global Environment Project & Medium Sized Projects
13. The GEFIA grants are accounted for under the World Bank administered recipient executed trust funds (RETFs). As opposed to World Bank lending projects, trust funds are assigned to themes only at the time of disbursement of the grants. Commitment data for the GEFIA is available due to the GEF approval and endorsement process. The following section on World Bank RETF financial flows for the environment therefore provides data on disbursements from these trust funds and cannot directly be compared with the previous section on World Bank lending commitments, but provides an idea of the focus of RETF grants for the environment along ENRM themes.
Figure 6: Recipient Executed Trust Fund Disbursements – Environment and Natural Resources Management Theme
FY04 FY05 FY06 FY07 FY080
50
100
150
200
250
300
350
0%
2%
4%
6%
8%
10%
12%
14%
16%
18%
126.3157.1 171.8 172.5
235.0
51.8
59.459.2
91.9
96.715%
15%16%
13% 13%
ENRM Theme (w/o GEFIA)GEFIA ENRM ThemeENRM Share of RETF DisbursementsU
SD m
illio
ns
Source: CFPTO Trust Fund Data Analysis Group
14. RETF disbursements for environment have been increasing since FY04, but growing slower than overall RETF disbursements, averaging US$244 million and reaching US$332 million in FY08 (Figure 6). However, as a share of total RETF disbursements, RETF ENRM disbursements declined from 15% to 13% between FY04 and FY08. Disbursements from the GEFIA trust fund make up for the majority (71% on average) of all RETF ENRM disbursements.
15. On average, a quarter of all RETF’s have disbursed grants supporting the ENRM theme; 87 out of 310 RETF in FY08. The number of individual grants for ENRM purposes from RETFs remained at an average of 132 grants per year until FY07, with an overall average size of US$2 million. In FY08, the number of grants declined to 92 with a significantly higher average grant size of US$3.9 million.
B.2.1. World Bank RETF Grant Disbursements for Environment by Country’s Borrowing Eligibility
16. The breakdown by country’s borrowing eligibility (Figure 7) shows a majority of disbursements going to IBRD countries (58% on average). Again China accounts for a large share of IBRD ENRM
6
disbursements with an average of 46%. The share of IDA countries (excluding blend countries) in trust fund disbursements averages 19%.
17. About 12% of trust fund grants are going to global or regional projects; a category that is not applicable to World Bank lending. Out of these global / regional grants about half are attributable to two large regional projects (the West Bank & Gaza IBRD funded program and the Nile Basin Initiative trust fund program), with the remainder belonging largely to a number of GEFIA projects. These programs focus to a large extent on the AFR and MNA region, supporting mainly Water Resource Management and partly Environmental Policies and Institutions and Biodiversity projects.
Figure 7: RETF ENRM Disbursements – Breakdown by Country’s Borrowing Eligibility
FY04 FY05 FY06 FY07 FY080%
10%
20%
30%
40%
50%
60%
70%
80%
90%
100%
62% 62%
48%61% 59%
15% 17%
20%
22% 20%
12% 7%18%
11%6%
11% 13% 13%6%
15%
Global/RegionalBLENDIDAIBRD
Source: CFPTO Trust Fund Data Analysis Group
B.2.2. World Bank RETF Grant Disbursements for Environment by Region
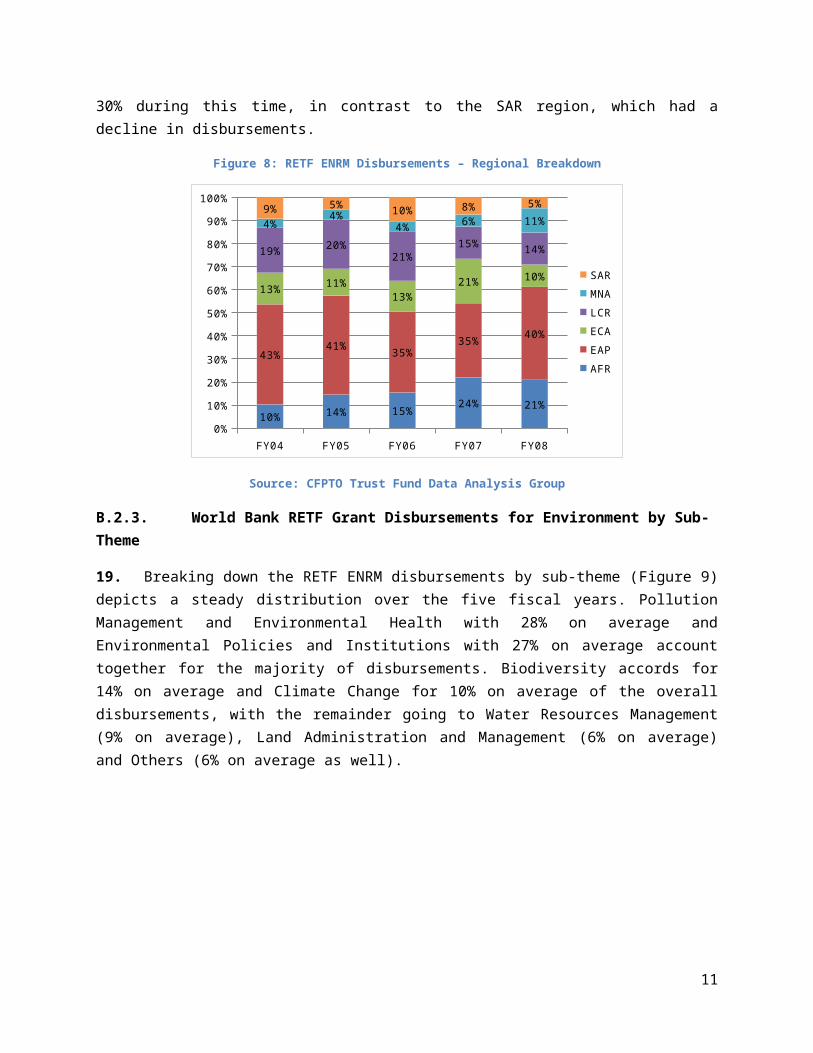
18. On a regional level on average 38% of all RETF ENRM grants are going to the EAP region ( Figure8), with an average of 69% of this being disbursed to China. About 18% each go to the AFR and LCR region. AFR’s share shows a strong growth trend, whereas LCR’s share has staid rather flat over the last five fiscal years. ECA has received an average of 14%, also staying rather flat. Trust fund disbursements to the MNA and SAR regions are accounting for the smallest shares with about 6% on average. MNA shows a similar trend as AFR, growing over 30% during this time, in contrast to the SAR region, which had a decline in disbursements.
7
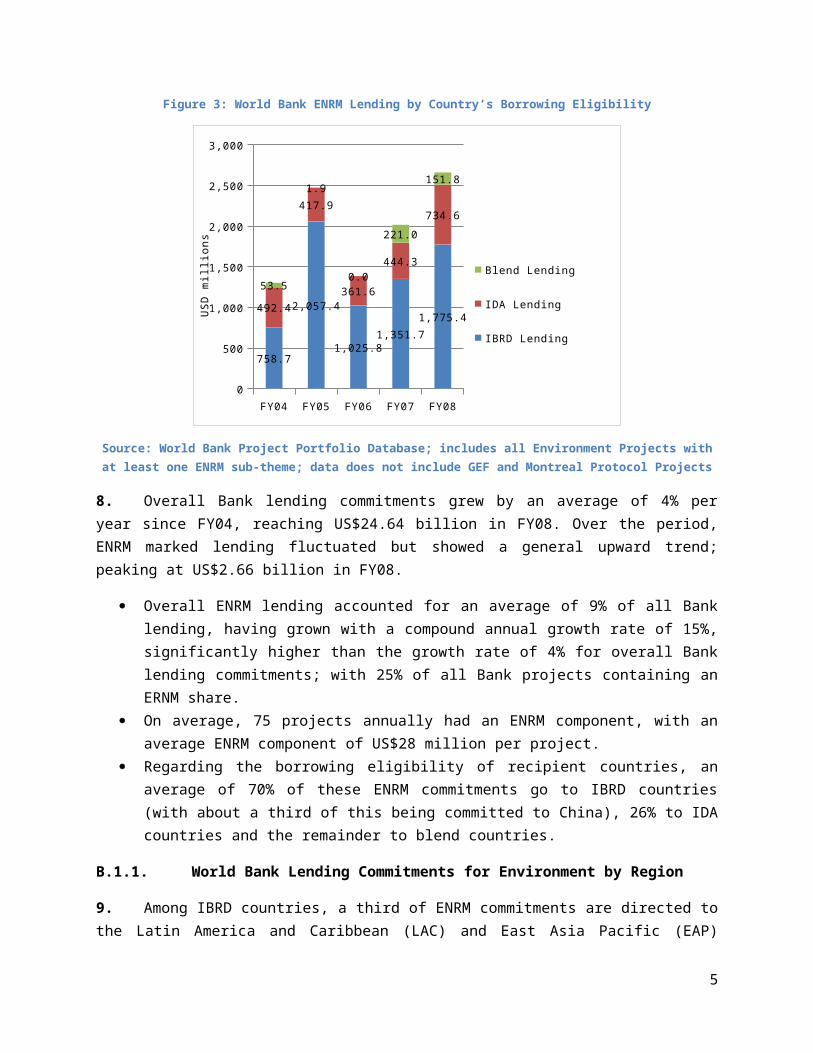
Figure 8: RETF ENRM Disbursements – Regional Breakdown
FY04 FY05 FY06 FY07 FY080%
10%
20%
30%
40%
50%
60%
70%
80%
90%
100%
10% 14% 15%24% 21%
43%41%
35%35%
40%
13% 11%13%
21% 10%
19% 20%21%
15% 14%
4%4%
4% 6% 11%9% 5% 10% 8% 5%
SARMNALCRECAEAPAFR
Source: CFPTO Trust Fund Data Analysis Group
B.2.3. World Bank RETF Grant Disbursements for Environment by Sub-Theme
19. Breaking down the RETF ENRM disbursements by sub-theme (Figure 9) depicts a steady distribution over the five fiscal years. Pollution Management and Environmental Health with 28% on average and Environmental Policies and Institutions with 27% on average account together for the majority of disbursements. Biodiversity accords for 14% on average and Climate Change for 10% on average of the overall disbursements, with the remainder going to Water Resources Management (9% on average), Land Administration and Management (6% on average) and Others (6% on average as well).
Figure 9: RETF ENRM Disbursements – Share of Sub-Themes
FY04 FY05 FY06 FY07 FY080%
10%
20%
30%
40%
50%
60%
70%
80%
90%
100%
3% 4% 8% 8% 6%9% 7%
9% 11% 11%
31% 31% 24% 27% 26%
3% 4% 10% 6%5%
31% 29% 22% 25% 27%
9% 10% 11% 8% 13%
14% 15% 16% 15% 12% Biodiversity
Climate Change
Environmental Policies and Institutions
Land Administration and Management
Pollution Management and Environmental Health
Water Resources Man-agement
Other Environment and Natural Resources Man-agement
Source: CFPTO Trust Fund Data Analysis Group
8

20. The Biodiversity sub-theme plays a larger role in trust fund disbursements, with on average a four times larger share, than it does in lending commitments. Also disbursements for Environmental Policies and Institutions have a larger share in trust fund disbursement financial flows. In contrast, the role of Water Resources Management is larger in Bank lending than in trust fund grants. Still Pollution Management and Environmental Health are attributable for the largest share in trust fund grants and Bank lending.
21. The following section aims to give an indication of the role of the UNDP and UNEP, as the other major implementing agencies of the GEF besides the World Bank, in allocating development financial flows for the environment. Due to limitations in the data that is available for these agencies, relying on financial data from different sources instead of commitment or disbursement data, the figures for the different agencies are not directly comparable, but should provide an overall idea of the size of financial flows for environment from these institutions and the role of the GEF in their environmental activities.
9

C. UNDP
22. After the World Bank, the UNDP is the second largest GEF implementing agency, becoming the largest recipient of GEF grants in regards to GEF Council funding decisions in FY08. The UNDP's primary role is the development and management of capacity building programs and technical assistance projects.7 above UNDP’s work focuses on five themes: Democratic Governance, Poverty Reduction and Achievement of the MDGs, Responding to HIV and AIDS, Crisis Prevention and Recovery and Environment and Energy for Sustainable Development. UNDP’s expenditures in these themes have totaled US$3.2 billion in calendar year 2007 (Figure 10)11.
Figure 10: UNDP – Expenditures & Share of Environment
CY04 CY05 CY06 CY070
500
1,000
1,500
2,000
2,500
3,000
3,500
0%
2%
4%
6%
8%
10%
12%
14%
260.0 327.0 363.0 298.0
11% 11%11%
9%
Democratic governance
Poverty reduction and achievement of the MDGs
Responding to HIV and AIDS
Crisis prevention and recovery
Environment and Energy for sustainable devel-opment
% Environment and Energy for sustainable development over TO-TAL
USD
mill
ions
Source: OSG/UNDP; UNDP Annual Report
23. For the purpose of this analysis, UNDP’s expenditures on Environment and Energy for Sustainable Development are considered environmental financial flows. This theme accounts on average for 11% of UNDP’s overall expenditures, US$312 million per year during CY04-07.
24. Regarding its role as a GEF implementing agency, UNDP draws upon its expertise in institution strengthening, human resource development, and non-governmental and community participation to assist countries in designing and implementing activities consistent with the purpose of the GEF. In addition, UNDP manages the Small Grants Programme on behalf of the GEF.7 above
11 UNDP figures are actual expenditures as provided in the UNDP Annual Reports, due to unavailability of other UNDP financial data, as opposed to commitment data for World Bank lending; limiting the possibility of direct comparisons between the implementing agencies.
10

25. The UNDP GEF Trust Fund accounts on average for 5% of UNDP’s income, US$241 million a year over CY04-07.12 Assuming that funding out of this trust fund is solely used for environmental purposes and is fully spent, the GEF is estimated to contribute 77% of UNDP’s environmental expenditures.
26. UNDP’s environmental work can be sub-divided into six priority areas, out of which Conservation and Sustainable use of Biodiversity has the largest share (28% on average) on the same level as Frameworks and Strategies for Sustainable Development, followed by Access to Sustainable Energy Sources (20% on average), Water Governance (11% on average), Ozone and Persistent Organic Pollutants (7% on average), and Sustainable Land Management and Desertification (5% on average).
27. These priority areas can be compared with the World Bank’s ENRM sub-themes. Notably, Biodiversity (Conservation and Sustainable use of Biodiversity) plays a much larger role for UNDP’s environmental activities than in World Bank lending, with a share of 28% (against 3% for the World Bank). UNDP’s expenditures related to biodiversity are on average US$88 million annually, even nominally higher compared to an average of US$62 million for World Bank lending commitments; although the World Bank biodiversity lending commitments fluctuated significantly over time.
12 For UNDP income figures see data tables in Annex
11

D. UNEP
28. UNEP is the third largest GEF implementing agency, which focuses on catalyzing the development of scientific and technical analysis and advancing environmental management in GEF-financed activities. UNEP helps to relate GEF-financed activities to global, regional and national environmental assessments, policy frameworks and plans, and to international environmental agreements. UNEP is also responsible for supporting the Scientific and Technical Advisory Panel (STAP) of the GEF.7 above
Figure 11: UNEP – Sources of Income
CY04 CY05 CY06 CY070
50
100
150
200
250
300
156.4 156.4175.1 175.1
UN Regular BudgetCounterpart ContributionsTrust FundsEnvironment FundU
SD m
illio
ns
Source: Global Policy Forum
29. For this analysis it is assumed that all of UNEP’s activities are environment related. As shown in Figure 11, UNEP’s income has remained largely flat over the last four calendar years, with a total income of US$280 million in CY0713. Trust Fund contributions to UNEP’s income accord on average for 62% of its income. If the GEF trustee commitments are used to estimate the contribution to UNEP’s income data, GEF would contribute on average a third to UNEP’s total income and half of its trust fund resources. A declining trend of GEF trustee commitments to UNEP is apparent over the last years, reducing its impact on UNEP’s income, down to 13% of its total income in calendar year 2007.
13 UNEP figures are income data, as collected by the Global Policy Forum, due to unavailability of other UNEP financial data, as opposed to commitment data for World Bank lending and expenditure data for UNDP; limiting the possibility of direct comparisons between the implementing agencies.
12

E. Concluding Remarks
30. A number of trends can be identified based on the findings from this note. Notably, World Bank lending commitments for the environment have grown with a compound annual growth rate of 15%, which is significantly higher than the growth rate of 4% for overall Bank lending commitments. Disbursements from recipient executed trust funds for the environment have grown at a comparable rate of 13%, although five percentage points slower than overall RETF disbursements. For both lending and trust funds, the majority of funds flow to IBRD countries, with flows to China making up the majority of these funds.
31. Most of the funds for environmental themes are flowing towards projects dealing with Pollution Management and Environmental Health, Water Resources Management and Environmental Policies and Institutions. However, the share of Climate Change increased significantly in FY08 for IBRD countries. In IDA countries the focus remains on Water Resources Management.
32. World Bank lending commitments for the environment, averaging about US$2 billion, were about six times the size of trust fund commitments. Both for UNDP and UNEP, the size of funds attributable to the environment is in a similar range of about US$300 million annually, which is comparable to the Bank’s environmental flows from trust funds, but represents a fraction compared to Bank lending commitments to the environment.
33. The GEF is an important source of funding for the UNDP and the UNEP, but it plays a relatively smaller role in funding environmental activities for the World Bank. With GEF commitments averaging US$658 million a year, the World Bank provides three times as much as the GEF annually. In terms of concessional financing, GEF commitments are somewhat higher than IDA financing for the environment (US$516 million a year).
34. It is important to note that besides GEF and the implementing agencies reviewed in this note, there are a multitude of other sources of funding for the environment, which are out of the scope of this analysis14 or have not yet disbursed funds15.
14 E.g. see the paper on “The Architecture of Aid for Environment – A Ten-Year Perspective” analyzing ODA flows for the environment reported to the OECD-DAC.15 E.g. the Climate Investment Funds, the Adaptation Fund and other Climate and Carbon Funds, for which the World Bank acts as Trustee or Financial Intermediary, but which are partly not recipient executed or have not yet disbursed funds, as well as other partnerships not involving funding from the World Bank’s trust fund portfolio.
13
Annex
I. Approach and Methodology
This analysis uses different data sources due to limitations of data availability for the different agencies. The analysis is based on commitment data for World Bank lending and the GEFIA, disbursement data for trust funds, and financial statement expenditure / income data for UNDP and UNEP. For this reason, data is not always comparable between the implementing agencies.
Where available, data for the last five fiscal years (for Bank channels) or calendar years has been taken into account. The specific data sources are listed and limitations of the data and findings are pointed out accordingly. A regional breakdown has been provided where available and if possible also a distinction between aid to IBRD and IDA countries has been made.
For the purpose of this analysis, environmental flows have been classified according to each agency’s definition. For the World Bank lending and trust fund data all financial flows marked with the Environment and Natural Resources Management (ENRM) theme are considered environment related for this analysis. This theme comprises seven sub-themes, which have been broken out where possible to identify focus areas of the different channels:
Biodiversity Climate Change Environmental Policies and Institutions Land Administration and Management Pollution Management and Environmental Health Water Resources Management Other Environment and Natural Resources Management
These sub-themes include following activities16:
Biodiversity includes activities aimed at: - in situ conservation (establishment of protected areas, management of
existing protected areas)- ex situ conservation (ex situ collections, germplasm and genebanks, arboretums, zoos)- targeted biodiversity training, research and assessments- Ecosystem management approaches, including payment for ecological services- Freshwater and marine biodiversity protection- Wetlands, mangroves, and coral reef protection
Climate Change includes activities aimed at:- carbon sequestration- alternative and renewable energy technologies- gas-flaring abatement- energy conservation and efficiency improvements
16 Source: World Bank OPCS
14

- nonmotorized transport- cleaner transportation technologies
Environmental Policies and Institutions includes activities aimed at:- establishment and strengthening of environmental regulatory institutions (national,
subnational, local) environmental policies, regulations, monitoring, and enforcement- environmental assessment and management-capacity improvement- financing mechanisms and economic instruments for environmental management- environmental awareness building, education, and training
Land Administration and Management includes activities aimed at:- control and mitigation of land
degradation, desertification and drought- land policies and administration,
including titling, registration, tenure, and mapping- land rehabilitation, protection and conservation- sustainable land management practices- access to land resources, markets, information and technologies, and capacity building- impact monitoring of land use and land use changes and interventions- rural cadastres
Pollution Management and Environmental Health includes activities aimed at:- mitigation of pollution and health effects from pesticide use- reduction and elimination of the use of persistent organic pollutants and ozone
depleting substances- mitigation of non-point source pollution from agricultural runoffs- cleaner fuels- oil spill contingency planning and remediation- rehabilitation of contaminated production sites and surrounding areas- improved environmental management in mining and energy operations- cleaner production and eco-efficiency- industrial pollution control and prevention- hazardous waste treatment, management, storage, and disposal- reduction and elimination of the production of persistent organic pollutants and ozone
depleting substances- pollution abatement from shipping activities- vehicle emissions monitoring and maintenance- water pollution abatement- sanitation and sewerage- wastewater management and treatment- solid waste management- surface and ground water quality management and monitoring
Water Resources Management includes activities aimed at:- freshwater/coastal/marine water resource management- groundwater management
15

- watershed and river basin protection, management, and rehabilitation- water resources management infrastructure (transbasin transfers, reservoirs and bulk
water canals)- water quality management- flood protection and management- bulk water allocation and pricing (water rights)- drainage- reservoir management improvement- dam safety measures- coastal zone and marine water management- flood protection and management (e.g., inland navigation)
Other Environment and Natural Resources Management includes all other environmental activities that do not fall under other themes
16
II. Data Tables
Table 1: Commitment of GEF grants through the World Bank as implementing agencyFY04 FY05 FY06 FY07 FY08
GEFIA Grant Amount (USD millions) 217.6 245.6 324.6 238.9 280.0# of GEFIA Projects 37.0 43.0 41.0 31.0 35.0
Source: World Bank Project Portfolio Database; includes all Global Environment Project & Medium Sized Projects
Table 2: GEF Council and CEO Net Funding Decisions – By Implementing AgenciesUSD millions FY04 FY05 FY06 FY07 FY08ADB 1.1 28.0 0.4 13.7 36.2AfDB 0.0 0.0 0.0 0.9 8.9EBRD 0.0 0.0 0.0 0.0 30.7FAO 0.0 13.1 0.0 10.9 12.7IADB 8.4 7.1 5.0 24.4 11.2IBRD 327.8 297.9 264.2 456.1 236.2IFAD 7.2 11.9 2.2 11.7 49.1UNDP 275.8 258.2 256.6 328.9 320.1UNEP 99.2 78.9 55.5 80.0 67.3UNIDO 4.6 1.2 0.9 27.0 30.4TOTAL 724.3 696.4 584.6 953.5 803.0
Source: World Bank CFPMI; includes projects, fees and project preparation activities but does not include cancellations
Table 3: GEF Trustee Commitments – By Implementing AgenciesUSD millions FY04 FY05 FY06 FY07 FY08ADB 8.4 23.8 0.4 4.6 20.4AfDB 0.0 0.0 0.0 0.0 1.0EBRD 0.0 0.0 0.0 0.0 0.6FAO 0.0 0.0 3.6 0.0 16.7IADB 2.5 12.9 1.5 0.6 5.6IBRD 320.0 270.1 267.0 180.5 450.6IFAD 0.4 6.7 9.3 5.5 12.7UNDP 259.7 218.4 202.8 236.9 345.5UNEP 139.5 60.8 96.1 35.5 28.2UNIDO 0.9 4.7 2.0 1.7 31.7TOTAL 731.4 597.4 582.6 465.3 913.0
Source: World Bank CFPMI; reflects initial Trustee commitments less cancellations and unused amounts from financially closed projects; includes stand alone projects, projects attached to Programmatic Initiatives, fees and project preparation activities; does not include project and fee amounts pending Agency approval
17
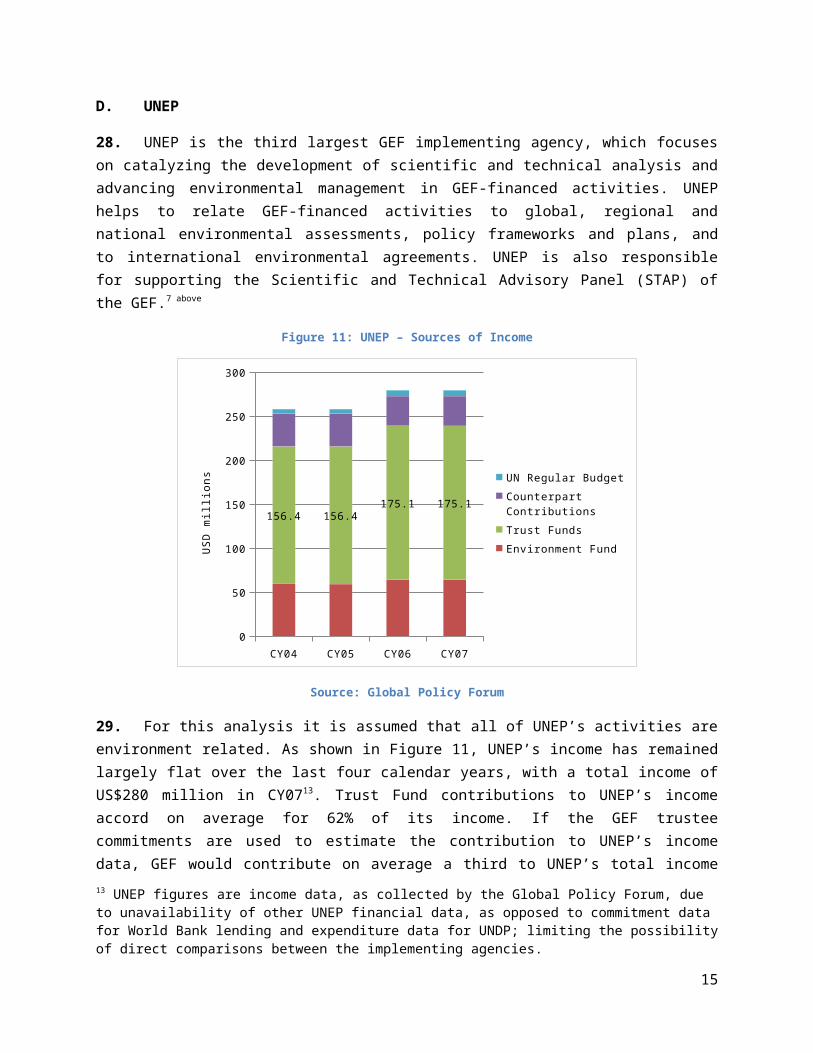
Table 4: World Bank ENRM Lending by Country’s Borrowing Eligibility / # of Lending ProjectsUSD millions FY04 FY05 FY06 FY07 FY08IBRD 758.7 2,057.4 1,025.8 1,351.7 1,775.4
of which China 259.4 358.2 357.5 414.2 505.0IDA 492.4 417.9 361.6 444.3 734.6Blend 53.5 2.0 0.0 220.9 151.8
IDA share in Blend 23.8 1.0 0.0 74.5 31.4TOTAL ENRM Lending 1,304.6 2,477.3 1,387.3 2,017.0 2,661.8# of ENRM Lending Projects 67 79 74 81 76TOTAL BANK Lending 20,080.1 21,893.1 23,581.2 24,535.8 24,644.5# of BANK Lending Projects 256 292 297 318 319
Source: World Bank Project Portfolio Database; includes all Environment Projects with at least one ENRM sub-theme; data does not include GEF and Montreal Protocol Projects
Table 5: World Bank ENRM Lending – Regional Breakdown for IBRD:USD millions FY04 FY05 FY06 FY07 FY08AFR 0.0 0.0 15.0 0.0 0.0EAP 265.5 388.6 377.5 457.2 573.7
of which China 259.4 358.2 357.5 414.2 505.0ECA 251.4 332.6 91.4 342.5 356.1LCR 142.4 836.8 451.0 340.0 653.6MNA 93.8 158.3 42.7 179.0 60.0SAR 5.5 341.1 48.1 33.0 132.0TOTAL 758.7 2,057.4 1,025.8 1,351.7 1,775.4
Source: World Bank Project Portfolio Database
Table 6: World Bank ENRM Lending – Regional Breakdown for IDA:USD millions FY04 FY05 FY06 FY07 FY08AFR 195.2 200.7 235.6 212.0 338.0EAP 115.1 58.4 18.9 107.8 172.4ECA 58.0 61.8 57.4 20.7 19.5LCR 14.9 2.4 3.0 13.0 11.2MNA 20.0 1.9 1.8 0.7 5.0SAR 89.2 92.8 44.9 90.2 188.6TOTAL 492.4 417.9 361.6 444.3 734.6
Source: World Bank Project Portfolio Database
18

Table 7: World Bank ENRM Lending – Share of Sub-Themes for IBRD:USD millions FY04 FY05 FY06 FY07 FY08Biodiversity 0.0 122.1 77.6 16.9 15.0Climate Change 144.6 90.4 95.3 20.1 718.1Environmental Policies and Institutions 38.7 212.8 239.7 289.9 360.1Land Administration and Management 59.0 257.6 159.6 55.3 158.3Pollution Management and Environmental Health 282.8 664.8 249.5 527.8 331.9Water Resources Management 201.5 690.5 156.0 408.8 130.9Other Environment and Natural Resources Management 32.2 19.4 48.0 33.0 61.0TOTAL 758.7 2,057.4 1,025.8 1,351.7 1,775.4
Source: World Bank Project Portfolio Database
Table 8: World Bank ENRM Lending – Share of Sub-Themes for IDA:USD millions FY04 FY05 FY06 FY07 FY08Biodiversity 15.4 14.3 23.4 1.4 9.6Climate Change 33.4 31.2 31.5 12.2 53.7Environmental Policies and Institutions 53.3 64.3 96.0 72.0 136.2Land Administration and Management 66.6 152.6 25.9 47.3 109.1Pollution Management and Environmental Health 153.6 83.1 44.1 119.0 70.1Water Resources Management 155.8 40.3 91.9 175.1 333.8Other Environment and Natural Resources Management 14.4 32.2 48.9 17.3 22.0TOTAL 492.4 417.9 361.6 444.3 734.6
Source: World Bank Project Portfolio Database
Table 9: Recipient Executed Trust Fund DisbursementsUSD millions FY04 FY05 FY06 FY07 FY08GEFIA ENRM Theme 126.3 157.1 171.8 172.5 235.0ENRM Theme (w/o GEFIA) 51.8 59.4 59.2 91.9 96.7Non ENRM Theme 971.9 1,260.5 1,214.0 1,828.6 2,248.3TOTAL 1,150.0 1,477.0 1,445.0 2,093.0 2,580.0
Source: World Bank CFPTO Trust Fund Data Analysis Group
Table 10: Number of RETF / RETF GrantsFY04 FY05 FY06 FY07 FY08
# of RETF supporting ENRM Grants 49 52 60 82 87TOTAL # of RETF 241 259 222 274 310# of ENRM Grants from RETF 118 167 146 139 92
Source: World Bank CFPTO Trust Fund Data Analysis Group
Table 11: RETF ENRM Disbursements – Breakdown by Country’s Borrowing Eligibility
19
USD millions FY04 FY05 FY06 FY07 FY08IBRD 110 135 112 160 197
of which China 60 65 38 63 100IDA 27 37 47 58 65BLEND 22 16 42 29 19Global/Regional 19 29 31 17 51TOTAL 178 217 231 264 332
Source: World Bank CFPTO Trust Fund Data Analysis Group
Table 12: RETF ENRM Disbursements – Regional BreakdownUSD millions FY04 FY05 FY06 FY07 FY08AFR 18 30 35 63 69EAP 76 89 80 92 133
of which China 60 65 38 63 100ECA 24 24 30 55 32LCR 34 44 49 40 46MNA 7 9 9 15 35SAR 16 11 24 21 15Others 3 10 4 -21 1TOTAL 178 217 231 264 332
Source: World Bank CFPTO Trust Fund Data Analysis Group
Table 13: RETF ENRM Disbursements – Share of Sub-ThemesUSD millions FY04 FY05 FY06 FY07 FY08Biodiversity 25 32 36 40 39Climate Change 16 21 25 22 44Environmental Policies and Institutions 55 62 50 66 90Land Administration and Management 6 9 23 15 16Pollution Management and Environmental Health 55 68 55 72 85Water Resources Management 16 16 21 29 37Other Environment and Natural Resources Management 5 9 20 21 21TOTAL 178 217 231 264 332
Source: World Bank CFPTO Trust Fund Data Analysis Group
Table 14: UNDP – Total Income Received from Governments and Other Contributors
20

USD millions CY04 CY05 CY06 CY07Regular contributions received 842.0 914.5 916.3 1,108.2Cost-sharing contributions 1,921.7 2,261.5 2,320.9 2,435.2Other Contributions 76.1 56.0 60.8 93.0Trust Funds established by the Administrator, excluding GEF 894.7 1,027.8 918.2 850.5GEF Trust Fund 108.8 309.2 274.2 272.3TOTAL 3,843.3 4,568.9 4,490.4 4,759.2
Source: UNDP; Contributions Unit, Treasury Division, Office of Finance and Administration, Bureau of Management, UNDP; Statistical Annex; UNDP Executive Board Documents; includes accounting linkage and tax reimbursement adjustments
Table 15: UNDP – Expenditures & Share of EnvironmentUSD millions CY04 CY05 CY06 CY07Environment and Energy for sustainable development 260.0 327.0 363.0 298.0Crisis prevention and recovery 379.5 386.0 362.0 440.0Responding to HIV and AIDS 148.8 160.0 141.0 86.0Poverty reduction and achievement of the MDGs 521.9 762.0 928.0 1,055.0Democratic governance 1,050.4 1,403.0 1,368.0 1,290.0TOTAL 2,360.6 3,038.0 3,162.0 3,169.0
Source: OSG/UNDP; UNDP Annual Report
Table 16: UNEP – Sources of IncomeUSD millions CY04 CY05 CY06 CY07Environment Fund 59.3 59.3 63.9 63.9Trust Funds 156.4 156.4 175.1 175.1Counterpart Contributions 37.1 37.1 33.8 33.8UN Regular Budget 5.3 5.3 6.6 6.6TOTAL 258.0 258.0 279.5 279.5
Source: Global Policy Forum
21