Embed Size (px)
Citation preview

Financial Failure Prediction in Banks: The Case of European Union Countries
Zeynep TÜRKCAN Antalya Akev University
Programme of Banking and Insurance Antalya, Turkey
orcid.org/0000-0002-1193-818X [email protected]
Abstract Financial crisis in 2007, affecting the whole world, revealed the significance of
early prediction of distressed banks and companies, and subsequently research on financial distress prediction in the banking sector accelerated considerably. This study estimates the financial failure of banks and looks at the factors related to bank failure using a five-stage empirical model based on panel data for the 1990-2010 period, for banks operating in 27 European Union (EU) countries. Using a panel logit model to determine which of the independent variables led to the bank failure, it is observed that “Non-interest Income to Total Income” is the best predictor. Keywords: Financial Distress, EU, Financial Ratios, Macro-economic Indicators, Panel Logit Model
1. Introduction
Banks fulfill an important role in the economy by providing financial services forhouseholds and businesses. Supporting customers through strong, sustainable and focused relationships is at the heart of successful banking. Banks play an important role in ensuring consumer access to daily banking services. They also facilitate payments and financing, support small and medium-sized businesses through consulting and funding, play a role in infrastructure and private financing investments, and help businesses in risk-taking and managing. Banks also act as mediators between suppliers and capital users in the market. All these functions are necessary for proper functioning of the today’s market economy.
While banks fulfill all these functions, they have to make profits to exist. Bank profitability continues to receive much skepticism especially regarding the ability to meet the financial needs of the real sector. The success of the banks in the financial sector is one of the most important conditions for the real sector and consequently the economic stability of the country. However, financial crisis disrupt the ability of banks
DOI: 10.20491/isarder.2018.444

Z. Türkcan 10/2 (2018) 554-569
İşletme Araştırmaları Dergisi Journal of Business Research-Türk
555
to perform their activities in a healthy manner. Since the 2007 global crisis many of the smaller banks either went bankrupt or were expropriated. The first victim of the crisis in Europe was the German bank Sachsen Landesbank, which invested in the high-risk mortgage market. In August 2007, French investment bank BNP Paribas announced to investors that they would not be able to withdraw funds from their funds and then merged. In September 2007, the British Northern Rock requested expeditious assistance from the British National Bank and expropriated it afterwards. On October 1, 2007, Swiss UBS became the world’s first major bank reporting losses of 3.4 billion dollars. These are a few examples that show the negative effects of economic crisis on the bank existence.
Examining bank failure is an important issue in many respects. First, it improves regulators’ ability to predict potential crises, and allows banks to manage, coordinate and monitor more effectively. Second, early discrimination between unsuccessful and successful banks allows appropriate actions to be taken to prevent failures and helps to protect those who are healthy. Third, it helps reduce direct financial capital costs and restructuring costs of banks and private firms. Fourth, it aids in preventing contagion. For example, crisis in the financial sector may lead foreign exchange crisis, which further weakens the economy and increases the costs of failure. Finally, the failure of the bank, accompanied by the credit crunch, can lead to the underutilization and inappropriate distribution of funds, which can prevent growth in the economy (Maghyereh and Awartani, 2014, p. 127).
The main purpose of this study is to identify indicators that distinguish between financially healthy and unhealthy banks as accurately as possible. By establishing a reliable and consistent model that can correctly classify unsuccessful banks, it is possible to identify banks experiencing financial difficulties before bankruptcy occurs and at the same time to minimize the potential costs of both macro and micro levels of financial distress. In addition, accurate and timely identification of risky banks in the financial sector will ensure that the bank’s supervisory mechanism works well and allocates limited bank monitoring resources more efficiently. Monitoring of the banks on site can be completed successfully by determining the banks that need inspection and intervention. In addition to these, reliable models that predict failure can help assess the relative effectiveness of different measures (merger, state intervention, liquidation) that can help to cope with the bank failure.
The early warning studies in the banking sector have gained popularity after the global crisis in 2007, which affected the whole world and revealed the importance of early recognition of distressed banks and businesses. The majority of current literature on distress prediction of banks focuses on U.S. banks, and some emerging economies. However, the number of studies concerning the prediction of bank failures across the EU is rather small (e.g. Gropp et al., 2006; Cippolini and Fiordelisi, 2009; Poghosyan and Cihak, 2009). This is because until 2007 crisis the number of bank failures in the EU countries is low compared to the rest of the world and there are no bank failures in some EU countries.
In this study, the banks of 27 EU countries are included in the data set, which will result in more comprehensive results than can be achieved by analyzing a single country or a smaller set of countries. Moreover, the 21-year period, from 1990 to 2010, ensures an important contribution to the literature in predicting bank failure.

Z. Türkcan 10/2 (2018) 554-569
İşletme Araştırmaları Dergisi Journal of Business Research-Türk
556
The study is structured as follows: Section 2 summarizes empirical studies in predicting financial failure of banks in the EU countries. Section 3 introduces the data set followed by the Section 4 which presents econometric methods used and findings. Finally, Section 5 concludes.
2. Financial Failure Prediction in EU Banks Gropp et al. (2006) and Distinguin et al. (2006) provide the preliminary studies on
predicting financial failure in EU banks. Gropp et al. (2006) examine 59 European banks between 1991 and 2001 for the prediction of financial failure, while also assessing the impact of market variables on financial failure. The authors use C1 and lower graded Fitch/IBCA’s ratings as indicators of bank failure. They use the distance-to-default calculation to detect bank fragility. In addition to accounting ratios, the use of market indicators leads to a decrease in type II errors2. Similarly, Distinguin et al. (2006) investigate the financial failure forecast of 64 European banks traded in the stock exchange between 1995 and 2002 using market and accounting indicators. They develope a “logit early warning model” especially designed for European banks to test whether market-based indicators outrank those based on accounting data. Consistent with prior literature, the effect of market-based indicators on the predictive accuracy of the model changes depending on whether bank liabilities are being traded on the market or not. For banks based predominantly on deposits, market indicators do not provide useful information and the amount of subordinated debt issued by banks do not contribute to the improvement of the forecast.
As for studies using advanced statistical approaches, Cielen et al. (2004) compare the performance of data envelopment analysis, minimum sum of deviations (MSD) and rule induction (C5.0)3 for bankruptcy prediction in Belgian banks. Using the data from the Belgian Central Bank, data envelopment analysis performed better than the other two models in terms of accuracy.
Brossard et al. (2007) attempt to predict the financial failure of 82 EU banks between 1991 and 2005 using the adverse selection effect approach. The authors develop a default distance indicator and find that the average asset growth rate has a strong, statistically significant and positive effect on the probability of bank failure in future.
Cippolini and Fiordelisi (2009) examine 180 large banks in 25 EU countries operating between 2003 and 2007 in order to analyze the impact of bank concentration on financial distress. They use “shareholder value ratio” as a distress criteria and employ a panel probit regression estimated by GMM. Their findings suggest that bank concentration has a positive and statistically significant effect on financial failure. Similarly, using financial ratios in their model, Poghosyan and Cihak (2009) examine the causes of bank failure in the EU banking sector. Analyzing 5,708 banks in 25 1 Fitch/IBCA’s individual ratings are designed to assess a bank’s exposure to, appetite for, and management of risk, and thus represent the view on the likelihood that it would run into significant difficulties. The rating “C” indicates an adequate bank which, however, possesses one or more troublesome aspects. There may be some concerns regarding its profitability and balance sheet integrity, franchise, management, operating environment or prospects. 2 Type II errors are defined as misclassified non-downgrades (i.e. the indicator classifies “downgrade” when the bank was in fact not downgraded). 3 C5.0 is sophisticated data mining tool for discovering patterns that delineate categories, assembling them into classifiers, and using them to make predictions. C5.0 has been designed to analyze substantial databases containing thousands to millions of records and tens to hundreds of numeric, time, date, or nominal fields (http://rulequest.com/see5-info.html).

Z. Türkcan 10/2 (2018) 554-569
İşletme Araştırmaları Dergisi Journal of Business Research-Türk
557
countries in the EU between 1996 and 2007, the logit analysis reveals capital adequacy, asset quality and profitability as the best indicators to distinguish healthy banks from weak banks.
Continuing in the grouping of ratios as indicators approach, Betz et al. (2014) test in 20 EU countries, excluding Cyprus, Estonia, Lithuania and Romania, 546 banks between 2000 and 2013 whose total assets exceed 1 billion euros. They develop three different groups of indicators; namely bank-specific sensitive indicators, indicators explaining the macro-financial imbalances and indicators related to the banking sector. According to the results of logit analysis, they report that the model was useful in predicting bank failure during the current financial crisis.
3. Data In order to identify indicators that distinguish between financially healthy and
unhealthy banks, it is collected a total of 81 accounting ratios for banks in EU countries for the period 1990-2010 from DataStream database. There are a total of 402 banks operating in 27 EU countries, for the period of 1990-2010 in the study (after eliminating banks with missing data, 402 banks are left). The total number of observations is 8,442.
In addition to accounting ratios at the bank-level, several macro-economic indicators are also used, which are retrieved from European Central Bank, Eurostat and World Bank. SAS 8.2 and STATA 13 are used to calculate and analyze the data.
3.1. Dependent Variables In order to distinguish distressed banks from healthy banks, five different
dependent variables are created and used in the empirical analysis. Following prior literature, the five different distress definitions are used in the study as follows:
DV1 is developed by Carapeto et al. (2010) based on three basic indicators of failure; capitalization, asset quality and profitability used in the study of Poghosyan and Cihak (2009). Accordingly, the failure criteria are: A bank is classified as distressed if its ROE is below -37.9 %, or its leverage ratio is below 2.7 %, or its loan loss provision to total loans is above 14.3 %. It should be noted that for a bank to be classified as distressed it is necessary that only one of these conditions is met (Carapeto et al., 2010, pp. 10-11).
DV2 is used in the article of Elsas (2007). It is defined as the ratio of loan loss provision to total loans based on a 1-year industry average. According to this criteria, a bank is classified as distressed if it is in the highest two deciles of its industry.
DV3 is applied by many different researchers, but it came to the forefront with the study of Poghosyan and Cihak (2009). It is used to measure the degree of credit risk and asset quality of banks. A bank is defined as distressed if this criteria is in the highest two deciles of its industry based on a 1-year industry average.
DV4 is the classification criteria used in the study of Maghyereh and Awartani (2014). According to this criteria, distress is defined as the satisfaction of any of the following conditions: (1) The bank’s operation was temporarily suspended; (2) The bank was recapitalized or it received any liquidity support from the monetary authority; (3) The bank eventually merged with another bank due to financial distress (i.e. distressed mergers); (4) The bank was closed by the government; (5) The ratio of non-
Z. Türkcan 10/2 (2018) 554-569
İşletme Araştırmaları Dergisi Journal of Business Research-Türk
558
performing loans to total loans during two subsequent years belongs to the fourth quartile of the sample empirical distribution of this ratio.
DV5 is used by Whitaker (1999). According to his criteria, a bank is determined as distressed if its cash flow is lower than its long-term borrowing.
3.2. Independent Variables Following the study by Betz et al. (2014) and Maghyereh and Awartani (2014), it
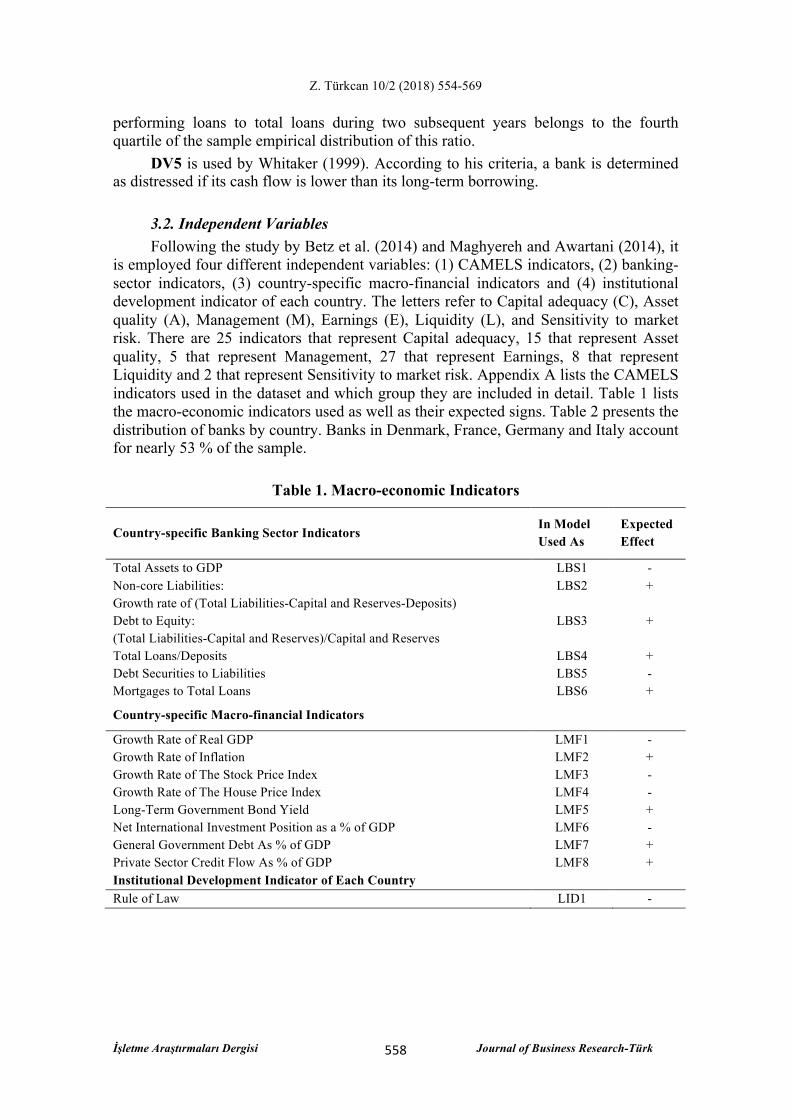
is employed four different independent variables: (1) CAMELS indicators, (2) banking-sector indicators, (3) country-specific macro-financial indicators and (4) institutional development indicator of each country. The letters refer to Capital adequacy (C), Asset quality (A), Management (M), Earnings (E), Liquidity (L), and Sensitivity to market risk. There are 25 indicators that represent Capital adequacy, 15 that represent Asset quality, 5 that represent Management, 27 that represent Earnings, 8 that represent Liquidity and 2 that represent Sensitivity to market risk. Appendix A lists the CAMELS indicators used in the dataset and which group they are included in detail. Table 1 lists the macro-economic indicators used as well as their expected signs. Table 2 presents the distribution of banks by country. Banks in Denmark, France, Germany and Italy account for nearly 53 % of the sample.
Table 1. Macro-economic Indicators
Country-specific Banking Sector Indicators In Model Used As
Expected Effect
Total Assets to GDP LBS1 - Non-core Liabilities: Growth rate of (Total Liabilities-Capital and Reserves-Deposits)
LBS2 +
Debt to Equity: (Total Liabilities-Capital and Reserves)/Capital and Reserves
LBS3 +
Total Loans/Deposits LBS4 + Debt Securities to Liabilities LBS5 - Mortgages to Total Loans LBS6 +
Country-specific Macro-financial Indicators
Growth Rate of Real GDP LMF1 - Growth Rate of Inflation LMF2 + Growth Rate of The Stock Price Index LMF3 - Growth Rate of The House Price Index LMF4 - Long-Term Government Bond Yield LMF5 + Net International Investment Position as a % of GDP LMF6 - General Government Debt As % of GDP LMF7 + Private Sector Credit Flow As % of GDP LMF8 + Institutional Development Indicator of Each Country Rule of Law LID1 -

Z. Türkcan 10/2 (2018) 554-569
İşletme Araştırmaları Dergisi Journal of Business Research-Türk
559
Table 2. Distribution of Banks by Country
Country Number of
Banks Country Number of
Banks Country Number of Banks
Austria 12 Germany 47 Netherlands 8 Belgium 13 Greece 19 Poland 18 Bulgaria 6 Hungary 2 Portugal 14 Cyprus 4 Ireland 5 Romania 3 Czech Republic 2 Italy 58 Slovakia 4 Denmark 54 Latvia 2 Slovenia 2 Estonia4 0 Lithuania 3 Spain 27 Finland 8 Luxemburg 4 Sweden 9 France 54 Malta 4 U.K. 20
4. Econometric Method and Findings
The econometric method applied in this study consists of five main stages: 1) Analysis of variance (ANOVA) 2) Removal of multicollinearity problem 3) Implementation of stepwise regression method 4) Establishment of panel logit model 5) Performing of classification accuracy analysis
In order to narrow down the number of independent variables, it is selected those variables that are statistically significant in the univariate ANOVA analysis. The lagged variables are used to identify banks one year before distress. Then it is addressed the multicollinearity problem by removing variables with VIF values higher than 5.5 The remaining variables are subjected to a forward stepwise regression model, followed by a panel logit model in which the dependent variable is equal to “1” if the bank is distressed and “0” otherwise.
The probability that the dependent variable takes the value “1” is expressed as the logistic distribution function.
The logistic regression equation for “𝑖” observations of the general form of the classical regression model with “𝑘” independent variables and “𝑁” observations can be expressed as:
𝑦! = 𝛽! + 𝛽!𝑥!!+. . .+ 𝛽!𝑥!" (1)
In the equation (1), “𝛽“ represents the regression coefficients and “𝑥” stands for the independent variables.
The logistic regression equation is used to determine the probability that the dependent variable will have a value of “1” or “0”. The independent variables test to see whether the probability values impact significant (if 𝑃! is < 0.5 then 𝑦!=0) or not
4 Any information related to Estonia could not be included in the analysis because it was not provided in the sample period. 5 As the VIF value increases, there is a serious multicollinearity between the independent variables. In practice, VIF values above 10 indicate that there is a serious multicollinearity. In this study, VIF values equal to 5 were taken into consideration since it is used intensively in the empirical researches in this area.

Z. Türkcan 10/2 (2018) 554-569
İşletme Araştırmaları Dergisi Journal of Business Research-Türk
560
significant (if 𝑃! is ≥ 0.5 then 𝑦!) against the possibility of financial distress. Thus, the logistic regression model is simultaneously a classification model.
𝑃! =!!!
!!!!! (2)
In the equation (2), “𝑦!”, is the predicted probability that the “i”th observation is in one of the categories of the dependent variable. “𝑒” is a constant equal to 2.718.
When the natural logarithm of 𝑃! is taken, the following result is obtained:
𝐿! = 𝑙𝑛 !!!
!!!!! (3)
𝐿! in the equation (3) is called logit. Therefore, the logit model comes from the equation (3) (Gujarati, 1999: 555). Table 3 presents the results of the panel logit analysis.
Table 3. Panel Logit Analysis DV1 DV2 DV3 DV4 DV5 LC3 -0.1743 -0.2101*** -0.2356*** (0.8132) (0.0000) (0.0006) LC4 -0.0030 (0.4621) LC9 0.0273** (0.0177) LC15 -0.1058* (0.0832) LA3 0.0300 (0.1885) LA5 -0.0764*** (0.0003) LA12 0.2998 -0.9708** (0.3305) (0.0233) LA14 0.1149 0.2655*** 0.3645*** 0.1829** (0.3097) (0.0007) (0.0001) (0.0121) LE3 0.0086** (0.0213) LE9 0.5855*** (0.0000) LE11 -0.0567* 0.0181 0.0047 (0.0684) (0.2069) (0.7535) LE12 -0.0462** 0.0126 -0.2269*** (0.0131) (0.6779) (0.0000) LE15 0.0002 -0.0398** (0.9203) (0.0220) LE18 -0.0021 0.0213* (0.2835) (0.0509) LE25 -0.0104 (0.2864) LL2 -0.0216 -0.0997 (0.6029) (0.1032) LL4 -0.0060 (0.3746) LBS1 0.0118*** (0.0004) LBS2 0.0537 (0.1847) LBS4 0.0180 0.2296*** (0.2273) (0.0038)

Z. Türkcan 10/2 (2018) 554-569
İşletme Araştırmaları Dergisi Journal of Business Research-Türk
561
LMF5 0.4286 (0.2773) LMF6 0.0356 (0.2639) LMF7 -0.1018** -0.0011 -0.0334 (0.0163) (0.9768) (0.6303) Wald Chi2 292.13 194.44 87.74 112.74 144.48 Pseudo R2 0.313 0.190 0.213 0.284 0.513 Log likelihood -463.88 -550.03 -255.68 -222.69 -136.01 Observation 2505 1604 960 912 438 Country Effect Yes Yes Yes Yes Yes Year Effect Yes Yes Yes Yes Yes Notes: DV1 to DV5 represent alternate definitions of Bank Distress as explained in Section 3.1. Standard errors are robust standard errors. Constant coefficient is included. The p-values of the respective values are shown in parentheses. The significance levels of 10 %, 5 %, 1 % are indicated by *, **, *** respectively.
According to the results of the panel logit analysis, in Model DV1, there is a negative relationship between LE11 (Non-interest Income to Total Revenues) and bank distress. Hence, banks that earn less than half of their total income from interest are more likely to go into distress.
In model DV2, LE3 (Cash Earnings to ROE), LE9 (Net Interest Income to Earning Assets) and LBS1 (Total Assets to GDP) are all positively and significantly related to bank distress. Whereas, LE12 (Operating Income to Total Capital) is negatively and significantly related to bank distress. In other words, if a bank’s operating income as fraction of total capital is higher, the bank is less likely to go into distress.
Model DV3 shows that LC3 (Common Equity to Total Assets) and LMF7 (General Government Debt to GDP) are negatively and significantly related to bank distress. Whereas, the effect on the probability of distress of LA14 (Reserves for Loan Losses to Total Loans) is positive. However, the expected effect of this coefficient is negative. Despite the repayment risk related to the loans borrowed by the bank, it is necessary to keep sufficient reserve for loan losses on the balance sheet. The higher the share of reserves in total loans, the less likely the bank will go into distress. However, there is a decrease in banks’ cash flow as much as the reserves are separated. In addition, a high loan loss reserve also means that the expected losses may be high, which means that expected losses can be covered by a high amount of reserves. Therefore, the fact that the share of loan loss reserve in total lending is high means that there is a high amount of loss expectation about the loans and thus the bank allocates a large share for this item.
In Model DV4, LC3 (Common Equity to Total Assets), LC15 (Minority Interest to Total Capital) and LE15 (Reinvestment Rate) are all negatively and significantly related to bank distress. Whereas, LC9 (Fixed Assets to Common Equity), LA14 (Reserves for Loan Losses to Total Loans) and LE18 (Retained Earnings to Equity) are positively and significantly related to bank distress. All these positive relations are not consistent with the effects expected by the study. For example, in terms of LE18, retained earnings constitute a significant internal source of funding for corporate investment. In this way, banks are freed from the obligation to provide high-interest loans by issuing bonds. Therefore, this variable’s effect on the probability of bank distress could be negative.

Z. Türkcan 10/2 (2018) 554-569
İşletme Araştırmaları Dergisi Journal of Business Research-Türk
562
As can be seen in Table 3, in Model DV5, LA5 (Total Loans to Total Assets), LA12 (Provision for Loan Losses to Total Loans) and LE12 (Operating Income to Total Capital) are negatively and significantly related to bank distress. Whereas, LA14 (Reserves for Loan Losses to Total Loans) and LBS4 (Total Loans to Deposits) are positively and significantly related to bank distress. LA5’s negative effect is consistent with the expected sign. It is anticipated that distressed banks have higher credit volumes than healthy banks, and therefore they are more likely to go into distress, if credits are not paid. There is also a negative effect on the likelihood of distress of LA12. This is in the same direction with the expected sign. If the share of credit risk exposure in total loans is less than half, risky lenders are more likely to lead the bank to go into distress. For this reason, this indicator is lower in distressed banks compared to healthy banks. The negative sign of LE12 is also consistent with the expected effect. If in total capital of a bank the share of core income, which excludes tax and interest expenses is negative, then the bank is likely go into distress.
Given the results, CAMELS coefficients, notably capital adequacy, asset quality and profitability are important indicators for bank distress. In contrast, management performance factors and basic liquidity indicators do not seem to have a good predictive power. These findings are consistent with the work of Poghosyan and Cihak (2009). According to the authors, it is not very surprising, that liquidity ratios are not significantly related to bank distress, given that they are trying to identify distress over a one-year window. Since bank liquidity varies over time, the liquidity ratios account only for the amount of liquid assets banks hold in their portfolio at the last day of financial reporting (Poghosyan and Cihak, 2009, pp. 14-15).
The results show that macro-economic factors have less effect on the probability of failure in European banks. Among the six different banking sector indicators, used to take into account the imbalances in the banking sector of each EU country, LBS1 (Total Assets to GDP) and LBS4 (Total Loans to Deposits) are both statistically significant at 1%. According to the results of panel logit analysis, LBS1 has a positive sign, while the expected sign is negative. Since the ratio of total assets to GDP increases, the likelihood of bank distress is expected to decrease. The variable LBS4 (Total Loans to Deposits) is positively and significantly related to bank distress. This is consistent with the expected effect. Therefore, the ratio of total loans to total deposits is higher in distressed banks than in healthy banks. The findings of both banking sector indicators are consistent with the findings of Betz et al. (2014). Regarding LBS4, the authors stated that a loan explosion could arise from the composition of liabilities if individual deposits could not keep up with the active growth of the bank, and that banks could apply other funding sources like non-core liabilities to finance their loans. Distinguin et al. (2006) reach the conclusion that market indicators for banks based predominantly on deposits do not provide useful information. However, Gropp et al. (2006) argue that market indicators play an important role in predicting failure. They found that by including the market indicators to the model, the type II error rate (the probability rate that classifies a failed bank as healthy) decreases. In the article of Poghosyan and Cihak (2009), who develope an early warning system for predicting the failure probability of EU banks, macro-economic factors play a very minor role. Cippolini and Fiordelisi (2009) note, however, that banks in 25 EU countries have a negative relationship between GDP per capita and the likelihood of failure in their studies of failure events, and that the improved macro-economic level pushes down the bank’s risk profile as expected.

Z. Türkcan 10/2 (2018) 554-569
İşletme Araştırmaları Dergisi Journal of Business Research-Türk
563
In addition to macro-economic indicators, the independent variable LID1 (Rule of Law Index) was used to observe whether institutional development at country level has an impact on bank distress. However, LID1 was not found to be significant in any model.
At the last stage, it is evaluated the predictive accuracy of different models as seen in Table 4. Table 4 shows the results of the classification accuracy analysis for one year before failure. It reports the percentage of distress that is correctly classified, the percentage of non-distress that is correctly classified, the total percentage of distress that is incorrectly classified, and the total percentage of non-distress that is incorrectly classified. Percentages of overall prediction accuracy are also considered on the table.
Table 4. Classification Accuracy Analysis (%) DV1 DV2 DV3 DV4 DV5
Distressed banks are classified as distressed 28.80 21.58 13.73 30.61 90.72
Type I error rate6 71.20 78.42 86.27 69.39 9.28
Healthy banks are classified as healthy 99.05 98.09 98.60 98.28 79.59
Type II error rate7 0.95 1.91 1.40 1.72 20.41
Overall prediction accuracy 93.69 86.60 89.58 91.01 86.99
Among the five different predictors, with a type I error rate of 9.28 %, DV5 has a better predictive power than the other four. That is, 37 of 402 banks are classified as healthy even if they are distressed. The least type II error rate is observed in DV1. Here, only 4 of 402 banks are misclassified as distressed even if they are healthy. The overall success rate of the prediction accuracy is highest in DV1 with 93.69 %. This means that DV1 can provide the best predictive performance among the five different models applied in the study.
5. Conclusions
This study aimed to build a panel logit model for estimating the factors leading to financial failure one year prior in banks operating in 27 EU countries between 1990 and 2010. Using balance sheets and financial statements of EU banks, the study applied a five-stage early warning model for predicting bank distress. Indicators based on accounting and macro-economic data, which can impact distress of a bank, have been passed through various elections and then the factors that can identify distressed banks have been made ready for the logit model. According to the results of logit analysis, it is found CAMELS indicators are significant leading determinants to identify distress in EU banks, while the profitability indicator “Non-interest Income to Total Revenues” is the best predictor of bank distress. It means that EU banks that earn less than half of their total income from interest are more likely to go into distress.
6 Type I error rate is the probability rate that assigns a distressed bank as healthy. 7 Type II error rate is the probability rate that classifies a healthy bank as a distressed bank.

Z. Türkcan 10/2 (2018) 554-569
İşletme Araştırmaları Dergisi Journal of Business Research-Türk
564
Given the results, it was seen that past due receivables or non-performing loans that were thought to play an important role in determining the financial failure of banks were inadequate in predicting distress. Moreover, management performance factors and basic liquidity ratios were not significant indicators for bank distress.
Among the country-specific banking sector indicators, only “Total Loans to Deposits” was found to be statistically significant. In other words, the share of total loans in total deposits is higher in distressed banks than in healthy banks. It is found that country-specific macro-financial indicators are less likely to predict bank distress. Finally, the institutional development indicator (rule of law) was also found to be unrelevant in distress prediction.
Examining bank distress and predicting the factors leading to failure play a significant role for policy makers, fund managers, regulators and researchers, especially bank managers. The forecast of potential crisis in the banking sector allows bank managers and regulators to manage, coordinate and audit banks more effectively. Moreover, early discrimination between distressed and healthy banks allows appropriate actions to be taken to prevent distress. In terms of policy makers, the pre-determination of any distress situation in the banks is of great importance, as it may lead to other crises, such as the currency crisis, which further weakens the economy and increases the costs of failure.
Researchers interested in the prediction of financial failure may bring their work to a further stage, especially by choosing crisis periods as time intervals and/or applying and comparing different econometric methods in the empirical implementation phase.
Appendix A. Accounting Indicators
Accounting Ratios By DataStream Database Group In Model Used As Expected Effect
Tier1 Capital Ratio C LC1 -
Cash Dividends to Cash Flow C LC2 -
Common Equity to Total Assets C LC3 -
Dividend Payout (% Earnings) C LC4 -
Earning Assets to Total Available Funds C LC5 -
Ebit/Total Interest Expense Ratio C LC6 -
Equity to Total Capital C LC7 -
Equity to of Total Deposits C LC8 -
Fixed Assets to Common Equity C LC9 -
Invested Assets to Liabilities C LC10 -
Invested Assets toTotal Deposits C LC11 -
Invested Assets & Loans toTotal Deposits C LC12 -
Long Term Debt to Common Equity C LC13 +
Long Term Debt to Total Capital C LC14 +
Minority Interest to Total Capital C LC15 -
Operating Cash/Fixed Charges C LC16 -

Z. Türkcan 10/2 (2018) 554-569
İşletme Araştırmaları Dergisi Journal of Business Research-Türk
565
Preferred Stock to Total Capital C LC17 -
Reserves For Loan Losses to Total Capital C LC18 -
Total Assets/Common Equity Ratio C LC19 -
Total Capital to Total Assets C LC20 -
Total Capital to Total Deposits C LC21 -
Total Debt to Common Equity C LC22 +
Total Debt to Total Assets C LC23 +
Total Debt to Total Capital/Std C LC24 +
Total Deposits to Total Assets C LC25 -
Assets Per Employee A LA1 -
Capital Expenditure to Total Assets A LA2 +
Invested Assets to Assets A LA3 -
Total Asset Turnover A LA4 -
Total Loans to Total Assets A LA5 +
Actual Loan Losses to Reserves For Loan Losses A LA6 +
Loan Loss Coverage A LA7 -
Net Loan Losses to Total Loans A LA8 +
Non-performing Loans to Equity A LA9 +
Non-performing Loans to Reserves For Loan Losses A LA10 +
Non-performing Loans toTotal Loans A LA11 +
Provision For Loan Losses to Total Loans A LA12 -
Reserves For Loan Losses to Total Assets A LA13 -
Reserves For Loan Losses to Total Loans A LA14 -
Growth Rate (yearly) of Total Assets M LM1 -
Growth Rate (yearly) of Total Loans M LM2 -
Growth Rate (yearly) of Stock Returns M LM3 -
Total Non-interest Expenses / Total Assets M LM4 +
Total Non-interest Expenses / Total Capital M LM5 +
Operating Costs/Operating Income E LE1 +
Net Interest Margin E LE2 -
Cash Earnings Return On Equity E LE3 -
Cash Flow / Sales E LE4 -
Earning Assets to Assets E LE5 -
Efficiency Of Earning Assets E LE6 -
Interest Rate E LE7 +
Net Interest Income to Average Deposits E LE8 -
Net Interest Income to Earning Assets E LE9 -

Z. Türkcan 10/2 (2018) 554-569
İşletme Araştırmaları Dergisi Journal of Business Research-Türk
566
Net Margin E LE10 -
Non-interest Income to Total Revenues E LE11 -
Operating Income/Total Capital E LE12 -
Operating Profit Margin E LE13 -
Pretax Margin E LE14 -
Reinvestment Rate (Eeg)/Shr 1y E LE15 -
Reinvestment Rate (Eeg)/Tot 1y E LE16 -
Reinvestment Rate Per Shr Fis E LE17 -
Retained Earnings to Equity E LE18 -
Return On Assets E LE19 -
Return On Earning Assets E LE20 -
Return On Equity - Per Share E LE21 -
Return On Equity Per Share (Fis) E LE22 -
Return On Invested Capital E LE23 -
Sales Per Employee E LE24 -
Tax Rate E LE25 +
Total Interest Expense to Interest Bearing Liabilities E LE26 +
Total Interest Income to Earning Assets E LE27 -
Cash & Securities to Total Deposits L LL1 -
Ratio of Total Loans to Total Capital L LL2 +
Total Loans to Total Deposits L LL3 +
Demand Deposits to Total Deposits L LL4 -
Savings Deposits to Total Deposits L LL5 -
Foreign Office Deposits to Total Deposits L LL6 -
Deposits/Funding L LL7 -
(Short-term Borrowing-Cash)/Total Liabilities L LL8 +
Trading Income/Operating Income S LS1 +/-
Logarithm of Total Assets S LS2 +/-
Appendix B. Independent Variables
Capital Adequacy Ratio or Tier 1 (LC1) and Capital to Total Assets (LC3) are indicators which represent capital adequacy (C) and are used to proxy the level of bank capitalization. Higher level of capital acts as a buffer against financial losses protecting a bank’s solvency and is expected to reduce the probability of bank distress.
Asset Turnover (LA4), Non-performing Loans to Total Loans (LA11), Loan Loan Provisions to Total Loans (LA12), Loan Loss Reserves to Total Assets (LA13) and Loan Loss Reserves to Total Assets (LA14) are some of the 15 independent variables representing asset quality (A). In general, it is expected that there will be a positive relationship between poor asset quality and bank failure. It is expected that the
Z. Türkcan 10/2 (2018) 554-569
İşletme Araştırmaları Dergisi Journal of Business Research-Türk
567
probability of bank distress will increase as the share of non-performing loans and the share of loan loss provisions in total loans increases. However, this situation can be in the negative direction when the share of loan loss reserves in total assets or in total loans is concerned. Then, high level of loan loss reserves means that the expected losses may be high, which means that the expected losses can be covered by a high amount of reserves.
Five variables were used to represent the quality of management (M). These are 1 Year Growth Rate of Total Assets (LM1), 1 Year Growth Rate of Total Loans (LM2), 1 Year Growth Rate of Stock Return (LM3), Total Non-interest Expenses to Total Assets (LM4) and Total Non-interest Expenses to Total Capital (LM5). The expected effect of the first three variables in the model is negative, and the higher the growth rates, the more likely the probability of failure is expected to decrease. However, as the share of total non-interest expenses in total assets increases, the probability of failure is expected to increase. Likewise, as the share of total non-interest expenses in total capital increases, the likelihood of failure expected to increase.
Some variables that express earnings (E) are Income Cost (LE1), Net Interest Margin (LE2), Interest Rate (LE7), Return on Asset (LE19), Return on Equity (E21) and Tax Rate (LE25). Earning ratios show the extent to which the bank’s profits can be increased over a period of time. At the same time, it measures the efficiency and profitability of the bank. A successful bank is a bank that can continuously increase its profitability. The higher the amount of bank assets allocated for the loan and the lower the capital ratio, the greater the likelihood of bank distress. Accordingly, as the return on assets increases, the probability of failure decreases. Likewise, a higher rate of return on equity implies an increase in the net profit of the bank, which indicates that the bank has increased its share price. The higher the return on equity ratio, the smaller the probability of bank failure. The decline in the income cost ratio implies an increase in business efficiency. This means more efficient bank assets to generate profit. Another variable, which is negatively related to the probability of failure, is the net margin of interest. It represents the net gain found by subtracting the interest to dividend ratio paid to the fund resources from the interest to dividend ratio obtained from the funds invested by the bank. This high margin means protection against operational risks arising from the activities.
Liquidity (L) is represented by indicators such as Cash and Cash Equivalents to Total Deposits (LL1), Deposits to Funds (LL7) and Net Short Term Borrowing to Total Liabilities (LL8). As the share of cash and cash equivalents in total deposits increases, the probability of the bank distress is expected to shrink. Thus, the share of cash and cash equivalents in total deposits is negatively related to the failure status. It is expected that the ratio of deposits to funds will be negatively related to bank distress when deposits are generally considered to be a more stable source of funding than interbank market or securities financing. That is, as the ratio of deposits to funds decreases, the probability of bank distess increases. On the other hand, the share of net short term borrowing to total liabilities is positively related to distress. As the net short term borrowing rises, the probability of bank distress is expected to increase.
Share of Trading Income (LS1) and Logarithm of Total Assets (LS2) are both independent variables that measure the sensitivity to market risk (S). The share of trading income may be positively or negatively related to bank failure. On the one hand,

Z. Türkcan 10/2 (2018) 554-569
İşletme Araştırmaları Dergisi Journal of Business Research-Türk
568
higher trading income can be attributed to a riskier business model, as trading income is a volatile source of earnings. On the other hand, the fact that investment securities are more liquid assets than loans, can help to reduce the losses caused by the sale of the balance sheet assets in order to overcome the liquidity problem of the bank in case of a changing macro-financial environment. For this reason, the relationship between the share of trading income and the likelihood of distress may be positive or negative. The logarithm of total assets is simply measured as the natural logarithm of total assets and shows the size of bank. Distressed banks can be either large-scale or small-scale in terms of asset size.
Second, the banking sector indicators were used in the analysis to take account of the imbalances in the banking systems. These are; Total Assets to GDP (LBS1), Growth in Non-core Liabilities (LBS2), Debt to Equity Ratio (LBS3), Loans to Deposits Ratio (LBS4), Debt Securities to Liabilities (LBS5) and Mortgages to Total Loans (LBS6). The indicators related to the banking sector were obtained from the European Central Bank (ECB) for the banking sector in EU.
Third, eight country-specific macro-financial indicators have been used to identify macro-financial imbalances in countries where banks are located and to control stock prices and cyclical fluctuations in national income. These are; Real GDP Growth Rate (LMF1), Inflation Growth Rate (LMF2), Stock Price Growth Rate (LMF3), House Price Growth Rate (LMF4), Long Term Government Bond Yield (LMF5), Net International Investment Position to GDP (LMF6), Government Debt to GDP (LMF7) and Private Sector Credit Flow to GDP (LMF8). Related data is retrieved from Eurostat and the World Bank.
Finally, a Rule of Law Index was used to observe whether institutional development at the country level has an impact on bank distress. It reflects perceptions of the extent to which agents have confidence in and a bide by the rules of society. The index ranges from approximately -2.5 (weak) to +2.5 (strong) governance performance. The rule of law index is briefly shown as LID1 in the model. The index calculated for each country is obtained from the World Bank.
References Betz, F., Oprica, S., Peltonen, T. A., Sarlin, P., (2014). “Predicting Distress in European
Banks”, Journal of Banking and Finance, Vol. 45, 225-241. Brossard, O., Ducrozet, F., Roche, A., (2007). “An Early Warning Model for EU Banks
with Detection of the Adverse Selection Effect”, Cahiers du GRES – Groupement de Recherches Economiques et Sociales, Cahiers No: 2007-08.
Carapeto, M., Moeller, S., Faelten, A., Vitkova, V., Bortolotto, L., (2010). “Distress Classification Measures in the Banking Sector”, Cass Business School City University of London, Mergers and Acquisitions Research Centre, Working Paper.
Cielen, A., Peeters, L., Vanhoof K., (2004). “Bankruptcy Prediction Using a Data Envelopment Analysis”, European Journal of Operational Research, Vol. 154, 526-532.

Z. Türkcan 10/2 (2018) 554-569
İşletme Araştırmaları Dergisi Journal of Business Research-Türk
569
Cippolini, A., Fiordelisi, F., (2009). “The Impact of Bank Concentration on Financial Distress: The Case of the European Banking System”, Working Paper.
Distinguin, I., Rous, P., Tarazi, A., (2006). ”Market Discipline and the Use of Stock Market Data to Predict Bank Financial Distress”, Journal of Financial Services Research, Vol. 30, No. 4, 151-176.
Distinguin, I., Tarazi, A., Trinidad, J., (2011). “The Use of Accounting and Stock Market Data to Predict Bank Financial Distress: The Case of East Asian Banks”, Philippine Management Review (Special Issue), Vol. 18, 1-18.
Elsas, R., (2007). “Preemptive Distress Resolution through Bank Mergers”, LMU Munich, Working Paper.
Gropp, R., Vesala, J., Vulpes, G., (2006). “Equity and Bond Market Signals as Leading Indicators of Bank Fragility”, Journal of Money, Credit, and Banking, Vol. 38, No. 2, 399-428.
Gujarati, D.N., (1999). Temel Ekonometri, Literatür Yayıncılık, İstanbul. Maghyereh, A. I., Awartani, B., (2014). “Bank Distress Prediction: Empirical Evidence
from the Gulf Cooperation Council Countries”, Research in International Business and Finance, Vol. 30, 126-147.
Poghosyan, T., Cihak, M., (2009). “Distress in European Banks: An Analysis Based on a New Data Set”, WP 09/9, International Monetary Fund Working Paper.
Whitaker, R., (1999). “The Early Stages of Financial Distress”, Journal of Economics and Finance, Vol. 23, No. 2, 123-133.
http://rulequest.com/see5-info.html [Access December 11, 2017].