Embed Size (px)
Citation preview

Copyright 2007 Idemitsu Kosan Co., Ltd. All Rights Reserved.
Idemitsu Kosan Co., Ltd.
August 1, 2007
Financial Highlightsfor the First Quarter ofFY2007

Copyright 2007 Idemitsu Kosan Co., Ltd. All Rights Reserved.
Contents
1. Business Results for the First Quarter of FY2007(1) Outline(2) Business segment information
2. Forecast for Operating Results for FY2007(1) Outline(2) Business segment information(3) Topics
3. Reference Data

1. Business Results for the First Quarter of FY2007
3Copyright 2007 Idemitsu Kosan Co., Ltd. All Rights Reserved.
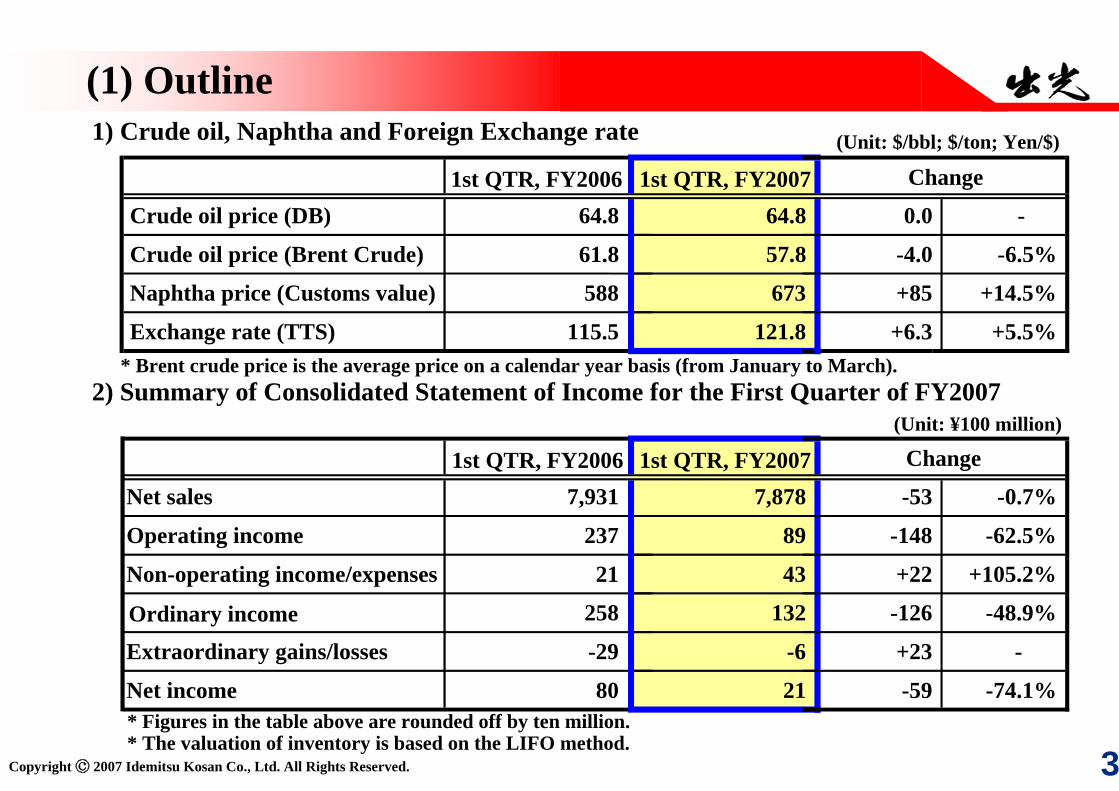
(1) Outline1) Crude oil, Naphtha and Foreign Exchange rate
2) Summary of Consolidated Statement of Income for the First Quarter of FY2007
* Figures in the table above are rounded off by ten million. * The valuation of inventory is based on the LIFO method.
* Brent crude price is the average price on a calendar year basis (from January to March).
(Unit: ¥100 million)
(Unit: $/bbl; $/ton; Yen/$)
1st QTR, FY2006 1st QTR, FY2007Crude oil price (DB) 64.8 64.8 0.0 -
Crude oil price (Brent Crude) 61.8 57.8 -4.0 -6.5%
Naphtha price (Customs value) 588 673 +85 +14.5%
Exchange rate (TTS) 115.5 121.8 +6.3 +5.5%
Change
1st QTR, FY2006 1st QTR, FY2007Net sales 7,931 7,878 -53 -0.7%
Operating income 237 89 -148 -62.5%
Non-operating income/expenses 21 43 +22 +105.2%
Ordinary income 258 132 -126 -48.9%
Extraordinary gains/losses -29 -6 +23 -
Net income 80 21 -59 -74.1%
Change

4Copyright 2007 Idemitsu Kosan Co., Ltd. All Rights Reserved.
(2) Business segment information1) Net sales
[Causes for increase/decrease]
Petroleum Products: Decrease in volumePetrochemical Products: Market price hikesOil Exploration and Production: Decline of crude oil priceOthers: Decrease in volume of engineering projects
(Unit:¥100 million)
1st QTR, FY2006 1st QTR, FY2007
Petroleum products 5,909 5,703 -206 -3.5%
Petrochemical products 1,480 1,677 +197 +13.3%
Oil exploration andproduction
235 217 -18 -7.5%
Others 307 281 -26 -8.5%
Total 7,931 7,878 -53 -0.7%
Change

5Copyright 2007 Idemitsu Kosan Co., Ltd. All Rights Reserved.
(2) Business segment information2) Operating income
[Causes for increase/decrease]Petroleum Products: Increase of depreciation due to change of tax system:
-¥1.8 billion;Product margin contraction: -¥4.3 billion;Increase in expenses: -¥4.6 billion
Petrochemical Products: Product margin expansion in basic chemicals: +¥2.7 billion;Increase of depreciation due to change of tax system:-¥0.6 billion;Increases in purchase cost and expenses: -¥4.0 billion
Oil Exploration and Production: Decline of crude oil priceOthers: Decrease in coals’ profits due to stronger A$
Increase in expenses related to new business development
(Unit:¥100 million)
1st QTR, FY2006 1st QTR, FY2007
Petroleum products 56 -52 -107 -
Petrochemical products 62 43 -19 -30.8%
Oil exploration andproduction
117 108 -9 -7.8%
Others 2 -10 -12 -
Total 237 89 -148 -62.5%
Change

2. Forecast for Operating Results for FY2007

7Copyright 2007 Idemitsu Kosan Co., Ltd. All Rights Reserved.
(1) Outline1) Assumptions for crude oil, naphtha and foreign exchange rate
2) Summary of Consolidated Statement of Income (Projected)
Note: The valuation of inventory is based on the LIFO method.
* Brent crude price is the average price on a calendar year basis (from January to December).
(Unit: $/bbl; $/ton; Yen/$)
Previous forecast Current forecast Assumptions for Aug.2007 and onward
Crude oil price (DB) 60.0 68.7 +8.7 +14.5% 70.0
Crude oil price (Brent Crude) 62.4 68.6 +6.2 +9.9% 74.0
Naphtha price (Customs value) 600 679 +79 +13.1% 680
Exchange rate (TTS) 115.0 121.9 +6.9 +6.0% 122.0
Change
(Unit: ¥100 million)
Previous forecast Current forecast
Net sales 32,400 36,700 +4,300 +13.3%
Operating income 850 870 +20 +2.4%
Non-operating income/expenses -40 -10 +30 -
Ordinary income 810 860 +50 +6.2%
Extraordinary gains/losses -95 -83 +12 -
Net income 290 290 0 -
Change

8Copyright 2007 Idemitsu Kosan Co., Ltd. All Rights Reserved.
(2) Business segment information1) Net sales
[Causes for increase/decrease]
Petroleum Products: Crude oil price hikes: +¥348.0 billion
Petrochemical Products: Market prices increases: +¥75.0 billion
Oil Exploration and Production: Crude oil price hikes and increase in production:+¥11.0 billion
Others: Decrease in sales of Australian coals due to demurrage:-¥4.0 billion
(Unit: ¥100 million)
Previous forecast Current forecast
Petroleum products 24,070 27,550 +3,480 +14.5%
Petrochemical products 5,900 6,650 +750 +12.7%Oil exploration andproduction
860 970 +110 +12.8%
Others 1,570 1,530 -40 -2.5%
Total 32,400 36,700 +4,300 +13.3%
Change

9Copyright 2007 Idemitsu Kosan Co., Ltd. All Rights Reserved.
(2) Business segment information2) Operating income
[Causes for increase/decrease]Petroleum Products: Time lag: -¥2.4 billion;
Increase in fuel cost for refining: -¥5.2 billion;Supply cost: +¥3.5 billion;Product margin expansion of naphtha for petrochemicals:+¥4.1 billion
Petrochemical Products: Product margin expansion in basic chemicals: +¥2.5 billion;Purchase cost increase: -¥2.5 billion
Oil Exploration and Production: Volume factor: +¥1.9 billion;Crude oil price hikes: +¥5.1 billion;
Others: Cost increase of Australian coals due to demurrage andstronger A$: -5.0 billion
(Unit: ¥100 million)
Previous forecast Current forecast
Petroleum products 75 75 0 -
Petrochemical products 390 390 0 -
Oil exploration andproduction
275 345 +70 +25.5%
Others 110 60 -50 -45.5%
Total 850 870 +20 +2.4%
Change

10Copyright 2007 Idemitsu Kosan Co., Ltd. All Rights Reserved.
(3) Topics
April 2007: Completion of Omaezaki Organic Light Emitting Diode MaterialsManufacturing Plant and commencement of production
May 2007: Acquired interests in 4 exploration blocks off the west coast of BritishTerritorial Shetland Islands from Faroe Petroleum plc
June 2007: Assigned a new credit rating of “A-” from the Japan Credit Rating AgencyLtd., and the board of directors’ resolution of the commercial paperprogram.
Development plan for Vega South field in the Norwegian North Seaapproved by the Norwegian Government
Agreed with Eni S.p.A. (Italy) to purchase partial interests of 15% for anexploration block in the Norwegian North Sea

3. Reference Data

12Copyright 2007 Idemitsu Kosan Co., Ltd. All Rights Reserved.
(1) Reference data for operating results: Forecast forthe 1st Half of FY2007 (Comparison with Previous Forecast)
1) Crude oil, foreign exchange rate and outline of consolidated statements of income
* Brent crude price is the average price on a calendar year basis (from January to June).
(Unit: $/bbl; $/ton; Yen/$)Previous forecast for1st Half of FY2007
Current forecast for1st Half of FY2007
Crude oil price (DB) 60.0 67.4 +7.4 +12.3%Crude oil price (Brent Crude) 60.9 63.3 +2.4 +3.9%Naphtha price (Customs value) 600 686 +86 +14.3%Exchange rate (TTS) 115.0 121.9 +6.9 +6.0%
Change
(Unit: ¥100 million)
Net sales 15,500 17,300 +1,800 +11.6%Operating income 330 270 -60 -18.2%Non-operating income/expenses -20 20 +40 - Ordinary income 310 290 -20 -6.5%Extraordinary gains/losses -60 -54 +6 - Net income 90 75 -15 -16.7%
Previous forecast for1st Half of FY2007
Current forecast for1st Half of FY2007 Change

13Copyright 2007 Idemitsu Kosan Co., Ltd. All Rights Reserved.
(1) Reference data for operating results: Forecast for operatingresults by business segment for the 1st Half of FY2007
2) Operating income by business segment(Unit: ¥100 million)
Previous forecast forthe 1st Half of FY2007
Current forecast forthe 1st Half of FY2007
Petroleum products 0 0 0 -
Petrochemical products 177 140 -37 -20.9%
Oil exploration andproduction
120 130 +10 +8.3%
Others 33 0 -33 -100.0%
Total 330 270 -60 -18.2%
Change

14Copyright 2007 Idemitsu Kosan Co., Ltd. All Rights Reserved.
(1) Reference data for consolidated operating results forthe 1st Quarter of FY2007
3) Breakdown of extraordinary gains/losses
(Unit: ¥100 million)
1st QTR, FY2007 1st QTR, FY2007 Change
Ext
raor
dina
ry g
ains
Gain on sale of fixed assets 1 3 +2
Others 5 3 -1
Total 6 7 +1
Ext
raor
dina
ry lo
sses
Loss on disposal of fixed assets 6 10 +4
Impairment loss on fixed assets 26 0 -26
Others 2 3 0
Total 34 12 -22
Total extraordinary gains/losses -29 -6 23

15Copyright 2007 Idemitsu Kosan Co., Ltd. All Rights Reserved.
4) Summary of consolidated balance sheet
(1) Reference data for consolidated operating results forthe 1st Quarter of FY2007
(Unit: ¥100 million)End of Mar.
2007End of Jun.
2007 Change
1,076 1,092 16 3,020 3,357 3374,137 4,618 481 3,423 3,600 177
3,356 3,337 -19 3,835 3,756 -781,570 1,436 -134 10,278 10,713 435
4,920 4,845 -752,520 2,521 1
10,139 10,484 345 7,440 7,366 -7410,437 10,430 -7 17,718 18,079 362
(Land) 6,224 6,218 -5 3,650 3,613 -37(Others) 4,213 4,211 -2 1,678 1,721 43
2,755 2,804 49 286 304 1913,192 13,234 41 5,614 5,638 2423,331 23,717 386 23,331 23,717 386
8,343 8,446 103
22.8% 22.5% -0.3%
Total interest-bearingdebtShareholders’ equityratio
Notes and accountsreceivable-tradeInventories
Other current assets
Other fixed assets
Total net assetsTotal liabilities andnet assets
Total current assets
Minority interest
Cash in hand anddeposits at bank
Fixed assets
Shareholders’ equityValuation andtranslation adjustments
Total fixed assets
Total assets
Notes and accountspayable-tradeShort-term borrowings
Other current liabilities
Total current liabilities
Long-term debtOther long-termliabilitiesTotal long-termliabilitiesTotal liabilities
End of Mar. 2007
End of Jun. 2007 Change

16Copyright 2007 Idemitsu Kosan Co., Ltd. All Rights Reserved.
(1) Reference data for consolidated operating results forthe 1st Quarter of FY2007
5) Consolidated cash flows (Unit: ¥100 million)
1st QTR of FY2006 1st QTR of FY2007 Change
CF from operating activities 429 0 -429Income before income taxes for 1stQTR 229 126 -103Depreciation and & amortization 133 171 38(Increase) decrease in notes andaccounts receivable-trade 34 -459 -493Others 33 162 130
CF from investing activities -37 -163 -126Purchases of tangible fixed assets -125 -192 -67Others 88 30 -59
CF from financing activities -181 14 195Increase (decrease) in borrowings -124 98 222Others -57 -84 -27
Cash and cash equivalents at end ofthe term 1,546 1,092 -454
17Copyright 2007 Idemitsu Kosan Co., Ltd. All Rights Reserved.
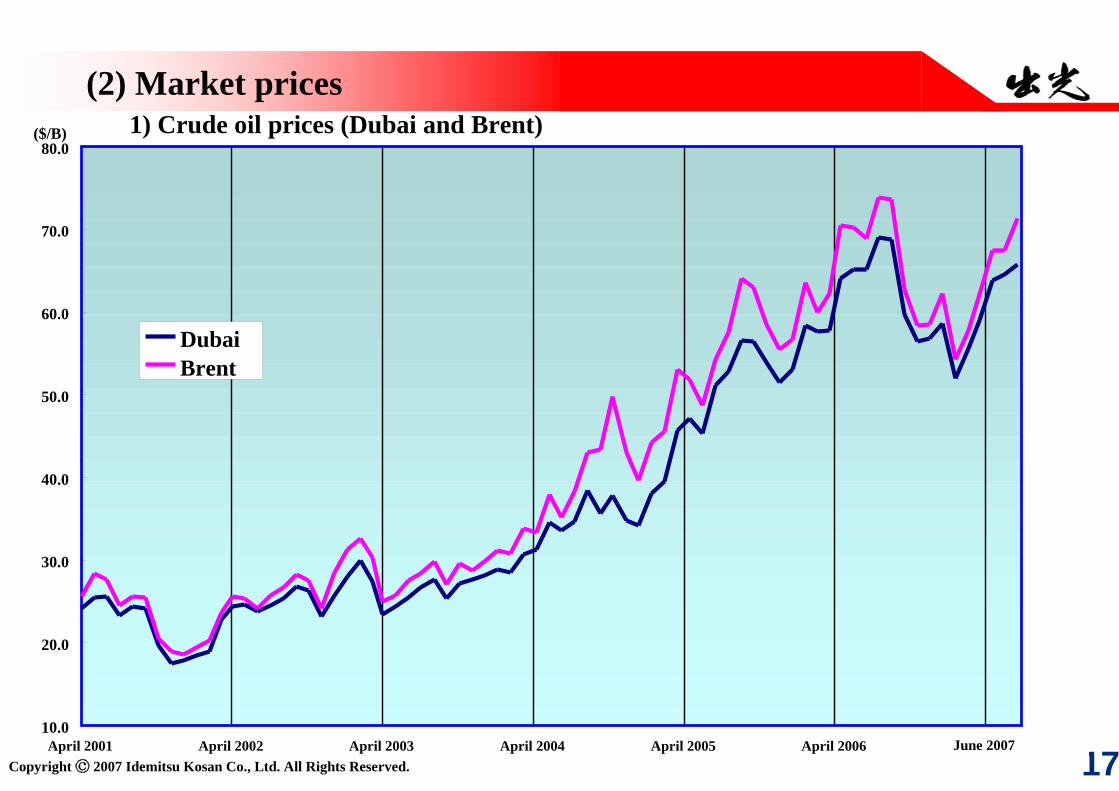
(2) Market prices1) Crude oil prices (Dubai and Brent)
10.0
20.0
30.0
40.0
50.0
60.0
70.0
80.0
April 2001 April 2002 April 2003 April 2004 April 2005 April 2006 Apr. 2007
DubaiBrent
($/B)
June 2007

18Copyright 2007 Idemitsu Kosan Co., Ltd. All Rights Reserved.
(2) Market prices2) Gasoline, crude oil and spreads
Note: Gasoline prices are based on data of the Oil Information Center.
2007年6月0
10,000
20,000
30,000
40,000
50,000
60,000
70,000
80,000
90,000
April 2001 April 2002 April 2003 April 2004 April 2005 April 2006 2007年4月20,000
22,000
24,000
26,000
28,000
30,000
32,000
34,000
36,000
38,000
40,000
(¥/KL) ( ¥ /KL)
June 2007
Spread (right scale)
Regular gasoline retail price (left scale)
Crude oil price, customs value, CIF (left scale)
19Copyright 2007 Idemitsu Kosan Co., Ltd. All Rights Reserved.
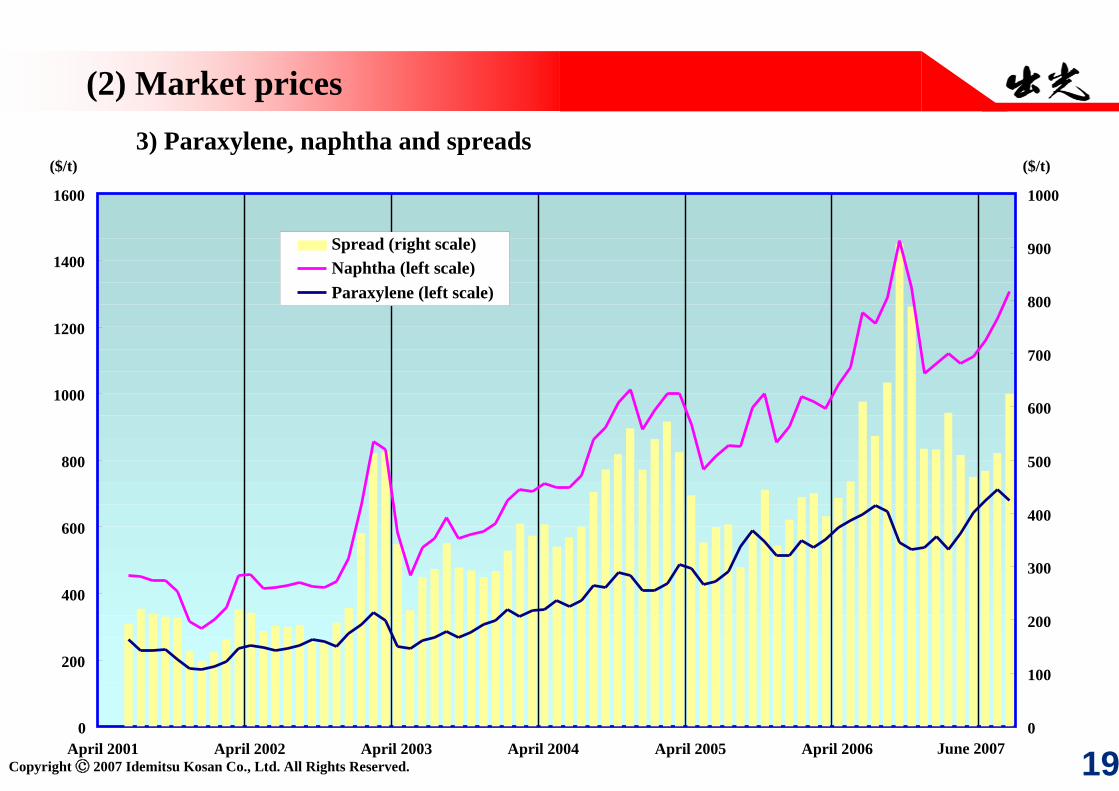
(2) Market prices3) Paraxylene, naphtha and spreads
0
200
400
600
800
1000
1200
1400
1600
April 2001 April 2002 April 2003 April 2004 April 2005 April 2006 2007年4月0
100
200
300
400
500
600
700
800
900
1000
($/t) ($/t)
June 2007
Spread (right scale)Naphtha (left scale)Paraxylene (left scale)

20Copyright 2007 Idemitsu Kosan Co., Ltd. All Rights Reserved.
(2) Market prices4) Styrene monomer, benzene and spreads
0
200
400
600
800
1,000
1,200
1,400
1,600
April 2001 April 2002 April 2003 April 2004 April 2005 April 2006 2007年4月0
50
100
150
200
250
300
350
400
450
($/t) ($/t)
June 2007
Spread (right scale)Benzene (left scale)Styrene monomer (left scale)

21Copyright 2007 Idemitsu Kosan Co., Ltd. All Rights Reserved.
(2) Market prices5) Coal price (Australian spot price)
20.0
25.0
30.0
35.0
40.0
45.0
50.0
55.0
60.0
65.0
April 2001 April 2002 April 2003 April 2004 April 2005 April 2006 2007年4月
($/t)
June 2007

22Copyright 2007 Idemitsu Kosan Co., Ltd. All Rights Reserved.
(3) Sales1) Sales volume for the 1st Quarter of FY2007
(Domestic sales volume of fuel oil, non-consolidated)(Unit: Thousand KL, %)
1st QTR of FY2006 1st QTR of FY2007 Change Growth rate
Gasoline 2,102 2,122 +20 100.9
(Super-unleaded) 336 329 -6 98.1
(Regular-unleaded) 1,766 1,792 +26 101.5
Naphtha 136 105 -31 77.4
Jet fuel 448 424 -24 94.6
Kerosene 604 539 -65 89.3
Diesel oil 1,501 1,529 +29 101.9
Heavy fuel oil A 892 806 -86 90.3
Heavy fuel oil C 716 570 -146 79.7
Total domestic sales volume 6,398 6,095 -303 95.3

23Copyright 2007 Idemitsu Kosan Co., Ltd. All Rights Reserved.
(3) Sales
2) Sales volume for the 1st Quarter of FY2007 (Petrochemical products, non-consolidated)
3) Sales volume for the 1st Quarter of FY2007 (Lubricants)
(Unit: Thousand ton; %)
1st QTR of FY2006 1st QTR of FY2007 Change Growth rate
Total petrochemical products 897 854 -43 95.2(Basic chemicals) 784 728 -56 92.8(Performance chemicals) 113 126 +13 111.4
Note: Including sales volume of overseas licensees
(Unit: Thousand KL)
Lubricants 244 242 -2 99.2
1st QTR of FY2006 1st QTR of FY2007 Change Growth rate
24Copyright 2007 Idemitsu Kosan Co., Ltd. All Rights Reserved.
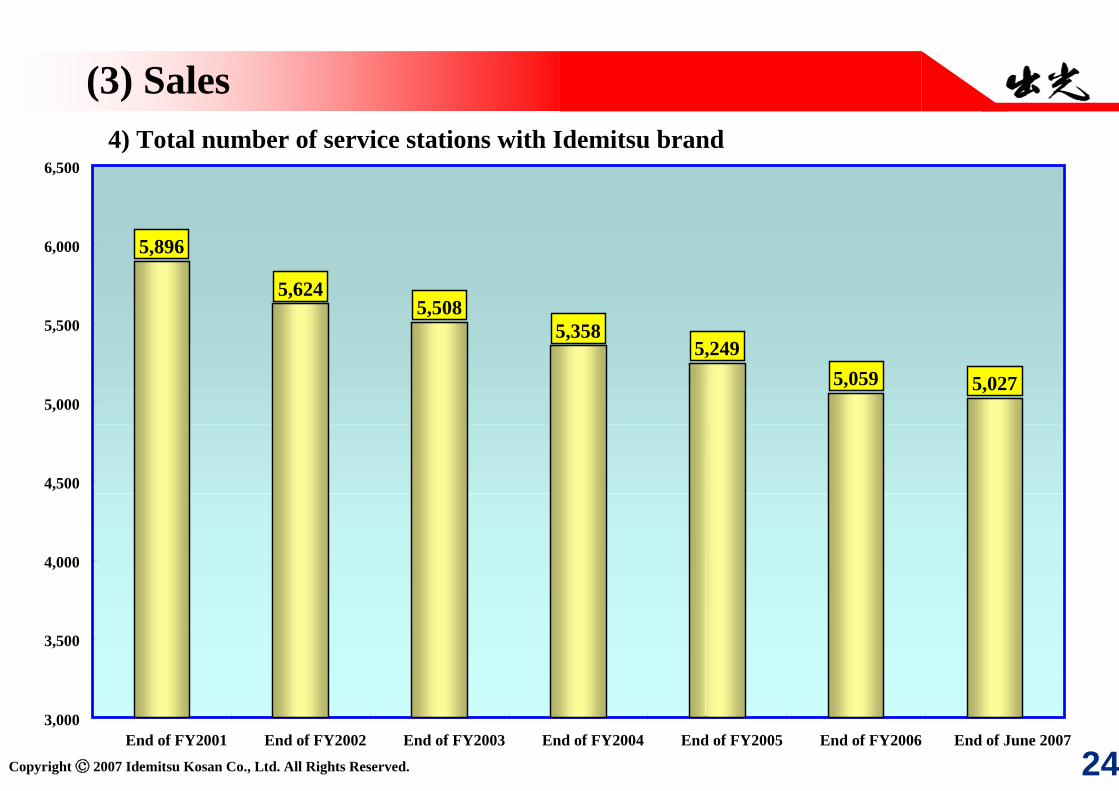
(3) Sales4) Total number of service stations with Idemitsu brand
5,896
5,6245,508
5,3585,249
5,059 5,027
3,000
3,500
4,000
4,500
5,000
5,500
6,000
6,500
End of FY2001 End of FY2002 End of FY2003 End of FY2004 End of FY2005 End of FY2006 End of June 2007

25Copyright 2007 Idemitsu Kosan Co., Ltd. All Rights Reserved.
(3) Sales5) Self-service stations with Idemitsu brand
88
215
322
400
488
638668
13.3%
1.5%
3.8%
5.8%
7.5%
9.3%
12.6%
0
100
200
300
400
500
600
700
800
End of FY2001 End of FY2002 End of FY2003 End of FY2004 End of FY2005 End of FY2006 End of June 20070%
2%
4%
6%
8%
10%
12%
14%
Number of self-service stations (left scale)Ratio of self-service stations (right scale)

26Copyright 2007 Idemitsu Kosan Co., Ltd. All Rights Reserved.
(4) Production
1) Production and growth rate of oil exploration and production
2) Production and growth rate of coal
* Figures in the table above are on the portion of the Idemitsu Group’s interests basis.
* Figures in the table above are on the portion of Idemitsu Petroleum Norge’s interests basis.
(Unit: Thousand bbl per day)
1st QTR of FY2006 1st QTR of FY2007
Production 30.7 33.4 2.7 +8.9%
Change
(Unit: Thousand ton)
Ensham (85%) 1,446 1,389 -57 -3.9%
Muswellbrook 406 316 -90 -22.2%
Boggabri 0 410 410 -
Tarawonga (30%) 0 33 33 -
Total production 1,852 2,148 296 +16.0%
1st QTR of FY2006 1st QTR of FY2007 Change

Copyright 2007 Idemitsu Kosan Co., Ltd. All Rights Reserved.
Cautionary warnings about forecasts
Of information about forecasts for the Company’s operating results,management strategy and management policy contained in this documents,any information which is not a historical fact is prepared according todecisions made by the top management of the Company based oninformation available as of the publication of the document.
Actual business environments contain potential risk factors anduncertainties including economic situations, crude oil prices, trends inpetrochemical products, markets conditions, currency exchange rates andinterest rates.
Consequently, actual operating results of the Company may substantiallydiffer from forecasts due to changes in important factors mentioned above.