Embed Size (px)
Citation preview
Financial Inclusion, Digital Payments and Their Impact on Income and Tax Revenue Around the World
CitationMaherali, Alim. 2017. Financial Inclusion, Digital Payments and Their Impact on Income and Tax Revenue Around the World. Master's thesis, Harvard Extension School.
Permanent linkhttp://nrs.harvard.edu/urn-3:HUL.InstRepos:33826588
Terms of UseThis article was downloaded from Harvard University’s DASH repository, and is made available under the terms and conditions applicable to Other Posted Material, as set forth at http://nrs.harvard.edu/urn-3:HUL.InstRepos:dash.current.terms-of-use#LAA
Share Your StoryThe Harvard community has made this article openly available.Please share how this access benefits you. Submit a story .
Accessibility
Financial Inclusion, Digital Payments and Their Impact on Income and Tax Revenue
Around the World
Alim Maherali
A Thesis in the Field of International Relations
for the Degree of Master of Liberal Arts
Harvard University
May 2017

2017 Alim Maherali
Abstract
This study investigates and quantifies the impact of financial inclusion and digital
payments on income and individual government tax revenues for countries around the
world. Of the almost two billion people in the world that are financially excluded, the
World Bank and other stakeholders have committed to helping one billion people gain
access to financial services and become involved in the formal economy by 2020. This
rapid pace of financial inclusion will bring vast amounts of income and tax revenues into
the global economy that is important to understand as it creates different opportunities
and challenges for developing and advanced countries that they will need to prepare for.
Using various global datasets, a methodology was developed to forecast financial
inclusion rates, digital payments rates, average income, and other factors up to the year
2020. The results suggest a sharp increase in financial inclusion rates and digital payment
rates which translate to hundreds of millions of people entering the formal economy.
Details of the most affected countries by dollar value, percent change, and the regional
affects are provided for various indicators throughout the study. With regards to
capturing the most tax revenue, China and the United States gain the most in dollar terms
while Turkmenistan gains the most in percentage terms. Between 2014 and 2020, a
cumulative $12 trillion of income is projected to enter the formal economy worldwide
resulting in $4.1 trillion in tax revenue. Governments around the globe could take
advantage of this significant opportunity.

iv
Dedication
To Saara, thank you for everything and always. With your support, obstacles are
surmountable, everything is possible, and success is inevitable.
v
Table of Contents
Abstract………………………………………………………………………...…….…..iii
Dedication……………………………………………………………………………......iv
List of Tables…………………………………………………………….……...……....vii
List of Figures ………………………………………………………….………..……..viii
I. Introduction…………………………………………………………………………......1
II. Financial Inclusion…………………………………………………………………......9
III. Digital Payments…………………………………………………………………......14
IV. The Widespread Benefits of Financial Inclusion……………………………….……21
Strategies to Increase Digital Payments and Financial Inclusion……….……..26
V. Methodology………………………………………………………………….………30
Tax Rate………………………………………………………………….………31
Calculating the Financially Excluded Population in Each Country……….……..31
Financial Inclusion Factor………………………………………………….….....33
Number of People Financially Included…………………………………………33
Determining Average Income …………………………………………………....34
Forecasting Average Income…………………………………………………….35
Digital Payments Rate………………………………………………………...….36
Digital Payment Growth Rate ………………………………………………...….37
Income Captured in the Formal Economy……………………………………….38
Captured Tax Revenue…………………………………………………………...39
vi
Total Annual Captured Tax Revenue ………………………….………………...40
VI. Results and Analysis…………………………………………………………………41
Opportunities for Future Research…………………………………………….....75
Key Insights and Conclusion…………………………………………………….76
Bibliography……………………………………………………………………………..79
Appendix 1: GDP per Capita Versus GDP per Capita Less Financially Excluded……...82
Appendix 2: Newly Financially Included (FI) Population by Country………………….86
Appendix 3: Digital Payment Rates by Country…………………………………………91
Appendix 4: Tax Rates Used by Country………………………………………………..95
Appendix 5: Total Additional Captured Income from Newly Financially
Included Persons in $1000’s USD………………………………………………..……...99
Appendix 6: Total Additional Tax Revenue from Newly Financially
Included Persons by Country in $1000’s USD…………………………………………103
Appendix 7: List of Counties with Associated Region and Income Group………...…..107
vii
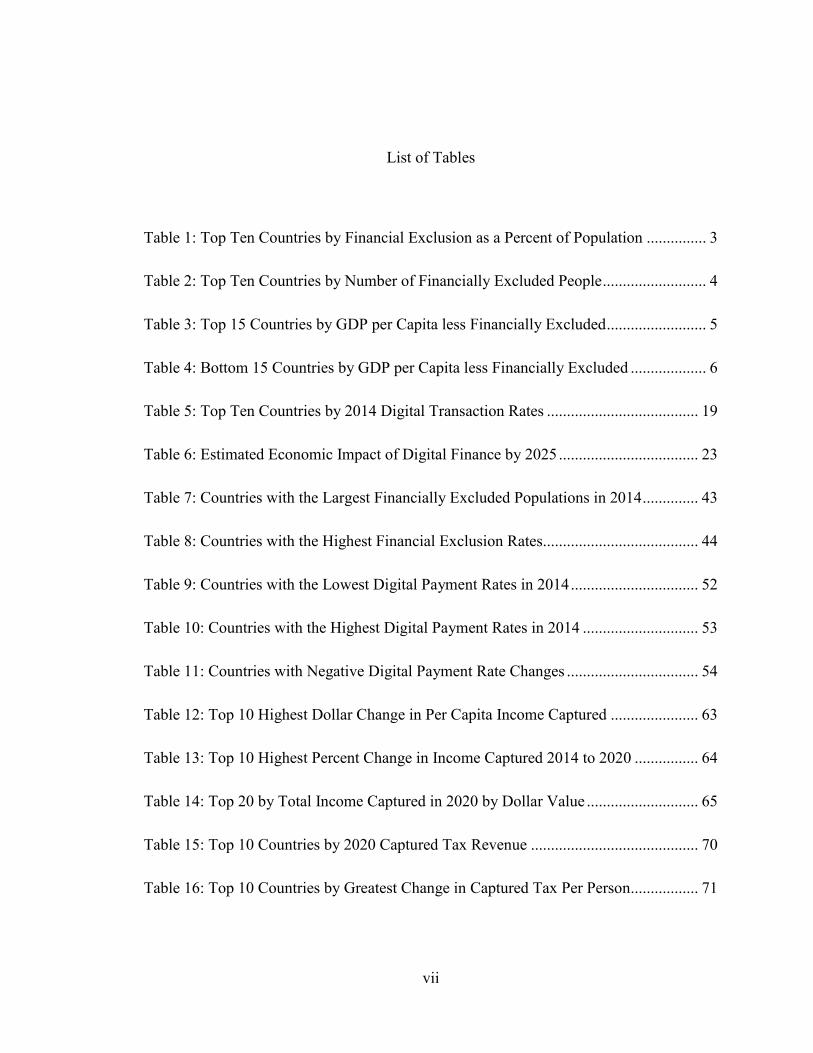
List of Tables
Table 1: Top Ten Countries by Financial Exclusion as a Percent of Population ............... 3
Table 2: Top Ten Countries by Number of Financially Excluded People .......................... 4
Table 3: Top 15 Countries by GDP per Capita less Financially Excluded ......................... 5
Table 4: Bottom 15 Countries by GDP per Capita less Financially Excluded ................... 6
Table 5: Top Ten Countries by 2014 Digital Transaction Rates ...................................... 19
Table 6: Estimated Economic Impact of Digital Finance by 2025 ................................... 23
Table 7: Countries with the Largest Financially Excluded Populations in 2014 .............. 43
Table 8: Countries with the Highest Financial Exclusion Rates....................................... 44
Table 9: Countries with the Lowest Digital Payment Rates in 2014 ................................ 52
Table 10: Countries with the Highest Digital Payment Rates in 2014 ............................. 53
Table 11: Countries with Negative Digital Payment Rate Changes ................................. 54
Table 12: Top 10 Highest Dollar Change in Per Capita Income Captured ...................... 63
Table 13: Top 10 Highest Percent Change in Income Captured 2014 to 2020 ................ 64
Table 14: Top 20 by Total Income Captured in 2020 by Dollar Value ............................ 65
Table 15: Top 10 Countries by 2020 Captured Tax Revenue .......................................... 70
Table 16: Top 10 Countries by Greatest Change in Captured Tax Per Person................. 71
viii
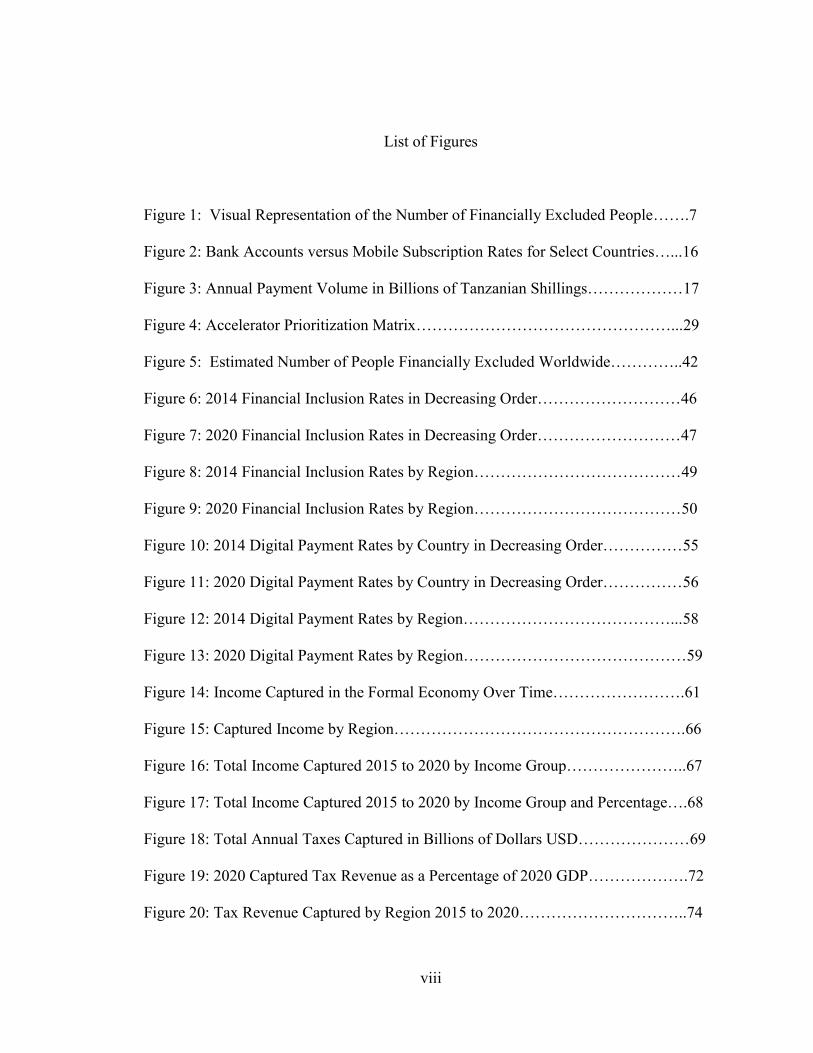
List of Figures
Figure 1: Visual Representation of the Number of Financially Excluded People…….7
Figure 2: Bank Accounts versus Mobile Subscription Rates for Select Countries…...16
Figure 3: Annual Payment Volume in Billions of Tanzanian Shillings………………17
Figure 4: Accelerator Prioritization Matrix…………………………………………...29
Figure 5: Estimated Number of People Financially Excluded Worldwide…………..42
Figure 6: 2014 Financial Inclusion Rates in Decreasing Order………………………46
Figure 7: 2020 Financial Inclusion Rates in Decreasing Order………………………47
Figure 8: 2014 Financial Inclusion Rates by Region…………………………………49
Figure 9: 2020 Financial Inclusion Rates by Region…………………………………50
Figure 10: 2014 Digital Payment Rates by Country in Decreasing Order……………55
Figure 11: 2020 Digital Payment Rates by Country in Decreasing Order……………56
Figure 12: 2014 Digital Payment Rates by Region…………………………………...58
Figure 13: 2020 Digital Payment Rates by Region……………………………………59
Figure 14: Income Captured in the Formal Economy Over Time…………………….61
Figure 15: Captured Income by Region……………………………………………….66
Figure 16: Total Income Captured 2015 to 2020 by Income Group…………………..67
Figure 17: Total Income Captured 2015 to 2020 by Income Group and Percentage….68
Figure 18: Total Annual Taxes Captured in Billions of Dollars USD…………………69
Figure 19: 2020 Captured Tax Revenue as a Percentage of 2020 GDP……………….72
Figure 20: Tax Revenue Captured by Region 2015 to 2020…………………………..74
1
Chapter I
Introduction
Prior to 2011, there was no consistent set of data that was available to understand
the financial lives of people all around the world. The release of the Global Financial
Inclusion database, known as the Global Findex, changed all that. The Global Findex has
published datasets in 2011 and 2014 with over 100 indicators, covering 140 countries and
interviews with 150,000 people.1 This dataset has become the world’s most
comprehensive and consistent dataset for looking at people’s financial lives.
Using the data from the Global Findex and other sources, this study will
investigate how financial inclusion efforts aided by digital payment technology will bring
millions of people into the economy, thereby raising the amount of income and taxes that
is captured in the economy. This section will go through an overview of the state of
financial exclusion in 2014, provide some unique perspectives on the scale of the issue
and introduce the research question of this study.
The results of the Global Findex project allows, for the first time, a measurement
to be taken of just how many people were financially included, and thus counted as part
of the formal economy, and how many were not. The Global Findex also allows for
interesting calculations to be made which could provide unique insights into various
1Asli Demirguc-Kunt et al., “The Global Findex Database 2014 Measuring Financial Inclusion
Around the World” (The World Bank Group, n.d.), 2,
http://www.worldbank.org/en/programs/globalfindex.
2
economies around the world, their standing versus one another and the economic
possibilities of various countries going forward.
For example, the gross domestic product per person or GDP per capita is
calculated as the gross domestic product of a country divided by its population. However,
prior to 2011, it was difficult to identify how many people were contributing to GDP
versus how many were not. As a first step to investigating this question, we would need
to know how many people are not contributing. However, getting a figure for the number
of people not being counted as part of GDP or the formal economy is complex and
challenging. One way to take a measurement is to take the population of a nation and
subtract from it the number of people that are contributing to GDP and the formal
economy. This leaves behind the number of people that do not contribute to GDP and are
not included in the formal economy.
While the definition of financial inclusion will be discussed in detail later in this
report, for simplicity we can define a person as being financially included if they have a
bank account and are an adult, defined as being aged 15 to 64. Then, adults aged 15 to 64
that do not have bank accounts can be defined as being financially excluded. Thanks to
the data from the Global Findex, this construction makes it possible to identify the
number of people financially excluded around the world and measure how GDP per
capita would change if the financially excluded population is removed. We start with
Table 1 below which shows the top ten countries with the largest percent of the
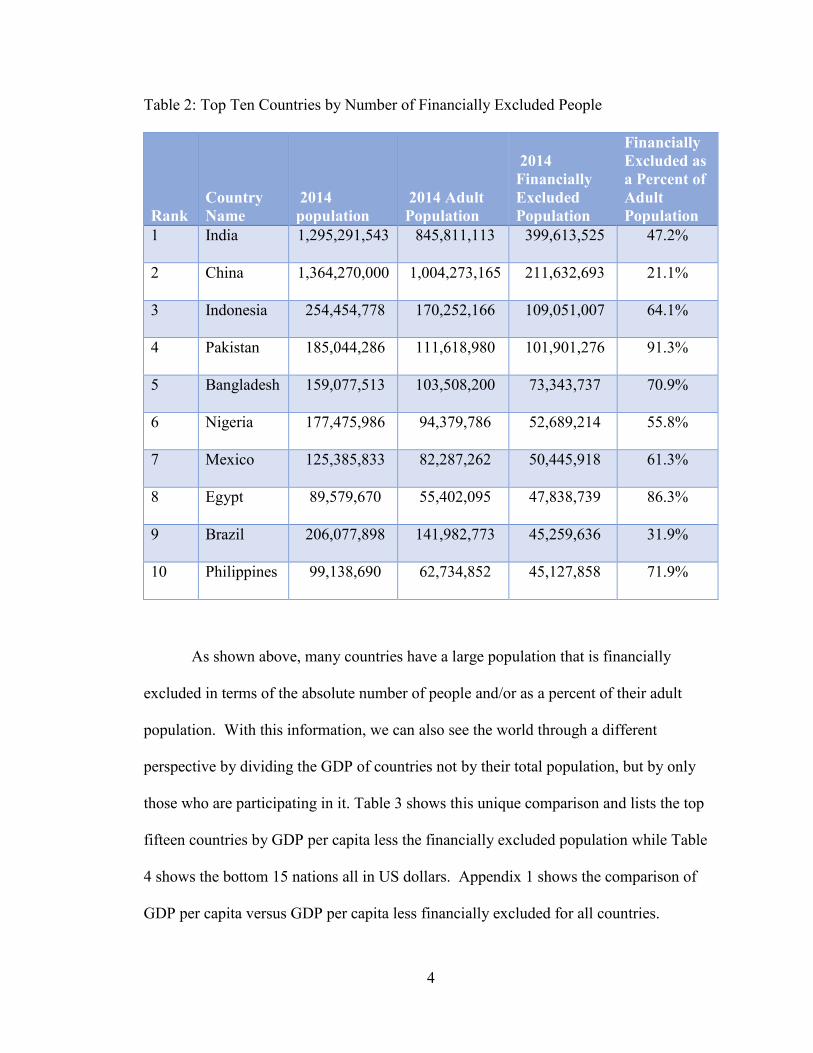
population who are financially excluded and Table 2 shows the top ten countries with the
largest population of people who are financially excluded.

3
Table 1: Top Ten Countries by Financial Exclusion as a Percent of Population
Rank
Country
Name
2014
population
2014 Adult
Population
2014
Financially
Excluded
Population
Financially
Excluded as a
Percent of
Adult
Population
1
Turkmenistan 5,307,188 3,582,006 3,517,861 98.21%
2
Niger 19,113,728 8,986,960 8,673,311 96.51%
3
Madagascar 23,571,713 12,997,261 12,252,844 94.27%
4
Guinea 12,275,527 6,652,949 6,242,454 93.83%
5
Yemen, Rep. 26,183,676 14,822,828 13,866,981 93.55%
6
Burundi 10,816,860 5,720,931 5,323,700 93.06%
7
Chad 13,587,053 6,732,902 6,214,502 92.30%
8
Pakistan 185,044,286 111,618,980 101,901,276 91.29%
9 Afghanistan
31,627,506 16,665,899 4,768,031 88.5%
10 Congo, Dem.
Rep. 74,877,030 38,092,678 11,471,638 87.8%
4
Table 2: Top Ten Countries by Number of Financially Excluded People
Rank
Country
Name
2014
population
2014 Adult
Population
2014
Financially
Excluded
Population
Financially
Excluded as
a Percent of
Adult
Population
1 India 1,295,291,543 845,811,113 399,613,525 47.2%
2 China 1,364,270,000 1,004,273,165 211,632,693 21.1%
3 Indonesia 254,454,778 170,252,166 109,051,007 64.1%
4 Pakistan 185,044,286 111,618,980 101,901,276 91.3%
5 Bangladesh 159,077,513 103,508,200 73,343,737 70.9%
6 Nigeria 177,475,986 94,379,786 52,689,214 55.8%
7 Mexico 125,385,833 82,287,262 50,445,918 61.3%
8 Egypt 89,579,670 55,402,095 47,838,739 86.3%
9 Brazil 206,077,898 141,982,773 45,259,636 31.9%
10 Philippines 99,138,690 62,734,852 45,127,858 71.9%
As shown above, many countries have a large population that is financially
excluded in terms of the absolute number of people and/or as a percent of their adult
population. With this information, we can also see the world through a different
perspective by dividing the GDP of countries not by their total population, but by only
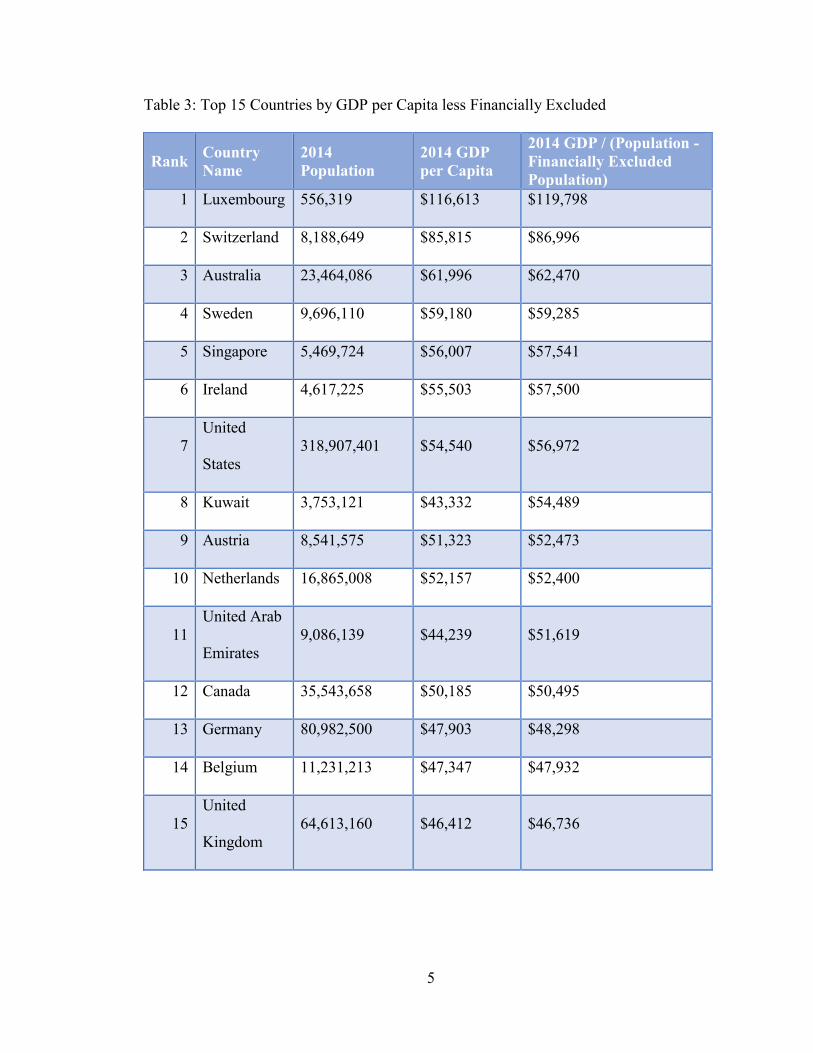
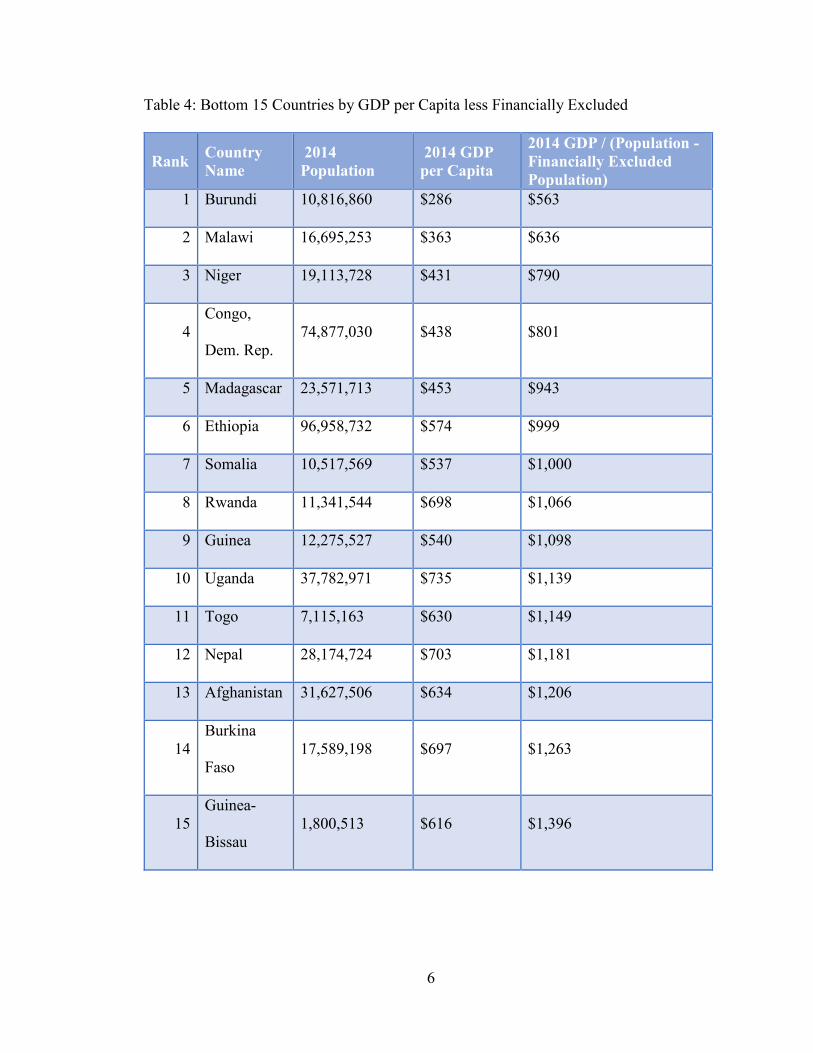
those who are participating in it. Table 3 shows this unique comparison and lists the top
fifteen countries by GDP per capita less the financially excluded population while Table
4 shows the bottom 15 nations all in US dollars. Appendix 1 shows the comparison of
GDP per capita versus GDP per capita less financially excluded for all countries.
5
Table 3: Top 15 Countries by GDP per Capita less Financially Excluded
Rank Country
Name
2014
Population
2014 GDP
per Capita
2014 GDP / (Population -
Financially Excluded
Population)
1 Luxembourg 556,319 $116,613 $119,798
2 Switzerland 8,188,649 $85,815 $86,996
3 Australia 23,464,086 $61,996 $62,470
4 Sweden 9,696,110 $59,180 $59,285
5 Singapore 5,469,724 $56,007 $57,541
6 Ireland 4,617,225 $55,503 $57,500
7
United
States
318,907,401 $54,540 $56,972
8 Kuwait 3,753,121 $43,332 $54,489
9 Austria 8,541,575 $51,323 $52,473
10 Netherlands 16,865,008 $52,157 $52,400
11
United Arab
Emirates
9,086,139 $44,239 $51,619
12 Canada 35,543,658 $50,185 $50,495
13 Germany 80,982,500 $47,903 $48,298
14 Belgium 11,231,213 $47,347 $47,932
15
United
Kingdom
64,613,160 $46,412 $46,736
6
Table 4: Bottom 15 Countries by GDP per Capita less Financially Excluded
Rank Country
Name
2014
Population
2014 GDP
per Capita
2014 GDP / (Population -
Financially Excluded
Population)
1 Burundi 10,816,860 $286 $563
2 Malawi 16,695,253 $363 $636
3 Niger 19,113,728 $431 $790
4
Congo,
Dem. Rep.
74,877,030 $438 $801
5 Madagascar 23,571,713 $453 $943
6 Ethiopia 96,958,732 $574 $999
7 Somalia 10,517,569 $537 $1,000
8 Rwanda 11,341,544 $698 $1,066
9 Guinea 12,275,527 $540 $1,098
10 Uganda 37,782,971 $735 $1,139
11 Togo 7,115,163 $630 $1,149
12 Nepal 28,174,724 $703 $1,181
13 Afghanistan 31,627,506 $634 $1,206
14
Burkina
Faso
17,589,198 $697 $1,263
15
Guinea-
Bissau
1,800,513 $616 $1,396
7
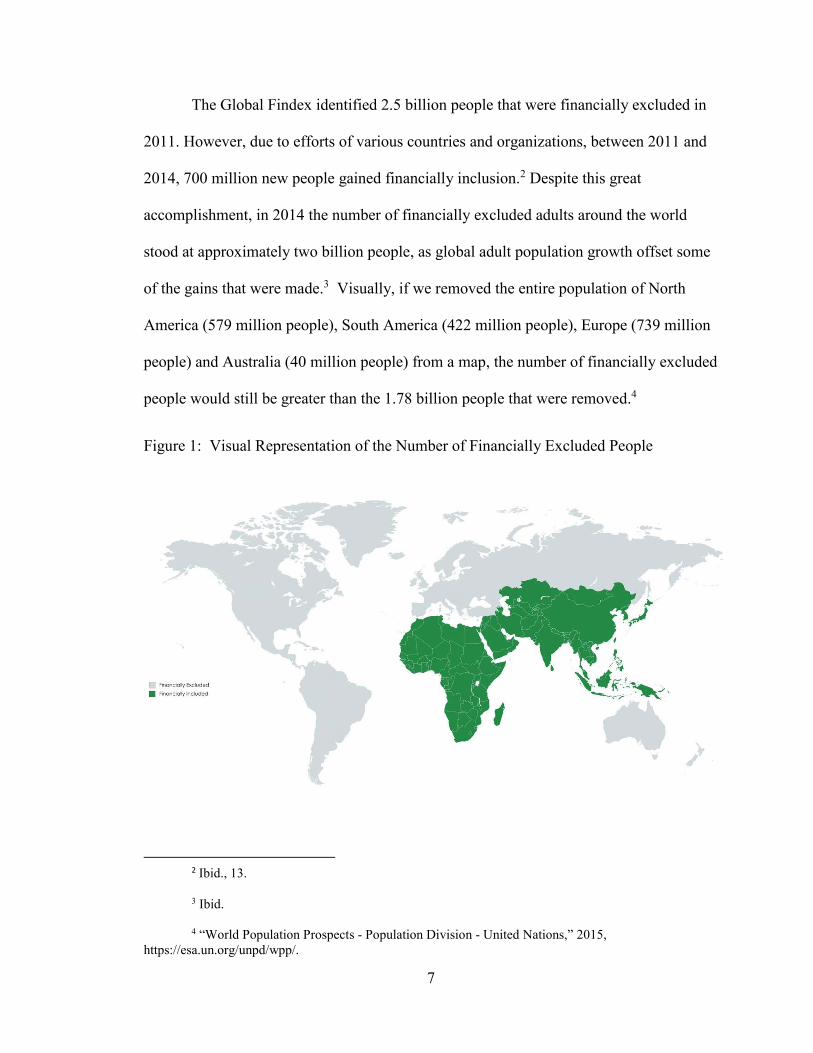
The Global Findex identified 2.5 billion people that were financially excluded in
2011. However, due to efforts of various countries and organizations, between 2011 and
2014, 700 million new people gained financially inclusion.2 Despite this great
accomplishment, in 2014 the number of financially excluded adults around the world
stood at approximately two billion people, as global adult population growth offset some
of the gains that were made.3 Visually, if we removed the entire population of North
America (579 million people), South America (422 million people), Europe (739 million
people) and Australia (40 million people) from a map, the number of financially excluded
people would still be greater than the 1.78 billion people that were removed.4
Figure 1: Visual Representation of the Number of Financially Excluded People
2 Ibid., 13.
3 Ibid.
4 “World Population Prospects - Population Division - United Nations,” 2015,
https://esa.un.org/unpd/wpp/.
8
As the world moves towards financial inclusion, it is important for governments
in each country to work towards increasing financial inclusion of their citizens so that
individual contributions are captured, their domestic economy is strengthened and to help
their country compete in the global economy. In addition, it is important for governments
to understand how the increased financial inclusion of their citizens will affect their
economy and tax revenues. As people become financially included and their incomes
grow over time, this will in turn increase their tax contributions to the government. Thus,
it is important for governments to understand this future impact so they can determine the
best way to utilize these increased revenues to move their nation forward.
Tax contributions to governments come in various forms such as income taxes,
business taxes, and tariffs from trade. The income tax that governments collect depend on
the number of people paying taxes and their level of income, both of which are directly
impacted by financial inclusion. Business and other taxes will be outside the scope of this
paper. This paper will focus on quantifying the incremental individual tax revenue that
will be captured by governments around the world as a result of financial inclusion and
answer the research question “How much individual tax revenue will governments gain
by the year 2020 because of financial inclusion?”
This section has introduced how the Global Findex allows for greater insight into
people’s financial lives, the state of financial exclusion in 2014, and the research question
that will be answered. The next section will present evidence of a direct link between
financial inclusion and economic gains, dive into the issues related to estimating financial
inclusion and discuss the broad range of benefits that result from increased financial
inclusion.
9
Chapter II
Financial Inclusion
In 2013, World Bank Group President Dr. Jim Yong Kim declared that "Universal
access to financial services is within reach thanks to new technologies, transformative
business models and ambitious reforms. As early as 2020, such instruments as e-money
accounts, along with debit cards and low-cost regular bank accounts, can significantly
increase financial access for those who are now excluded."5
Soon after Kim’s talk, the Universal Financial Access 2020 initiative was
launched led by the World Bank Group in partnership with various stakeholders. This
epic initiative looks to realize Kim’s vision and has committed to helping a billion
financially excluded adults join the formal financial system by the year 2020 which will
mean a 50% reduction in the number of financially excluded adults.6
Another organization that has done a lot of work around this topic is The Abdul
Latif Jameel Poverty Action Lab (J-PAL). J-PAL, housed in the Massachusetts Institute
of Technology’s Economics department, has gathered evidence from over 130 studies in
29 countries related to financial inclusion. Many of their key findings directly link
5 “Universal Financial Access Is Vital to Reducing Poverty, Innovation Key to Overcoming the
Enormous Challenge, Says President Jim Yong Kim,” Text/HTML, World Bank, accessed March 3, 2017,
http://www.worldbank.org/en/news/press-release/2013/10/11/universal-financial-access-vital-reducing-
poverty-innovation-jim-yong-kim.
6 “UFA2020 Overview: Universal Financial Access by 2020,” World Bank, accessed March 3,
2017, http://www.worldbank.org/en/topic/financialinclusion/brief/achieving-universal-financial-access-by-
2020.
10
financial inclusion to increased income for businesses and individuals.7 For example,
households that gained access to microcredit in Mexico increased revenue by 27 percent
and business-related expenditures by 36 percent.8 Similarly, a project by the World Bank
found that as a result of financial inclusion, Malawian farmers who had their earnings
directly deposited into a new bank account spent 13% more money on equipment and
increased the value of their crop output by 21%.9 In both these examples and as often is
the case, the use of non-cash digital payments enables financial inclusion while at the
same time creates records of income that can be used by governments to track taxes
owing to them. For now, what we have done is shown a direct link between financial
inclusion and increased incomes. However, before we discuss how this income can be
recognized so it can be taxed. we need a way to quantify financial inclusion.
While there is a link between financial inclusion and increased incomes,
measuring this link directly is not straight forward. For this paper, we define a person as
being financially included if they have a bank account and are an adult, defined as being
aged 15 to 64. However, the World bank states, “Financial inclusion means that
individuals and businesses have access to useful and affordable financial products and
services that meet their needs – transactions, payments, savings, credit and insurance –
7 “Financial Inclusion Helping the Poor Manage and Grow” (Innovation for Poverty Action,
2016), 2, http://www.poverty-action.org/sites/default/files/publications/IPA-Program-Area-Brief-Financial-
Inclusion-Letter-Updated.pdf.
8 Ibid.
9 Leora Klapper, Mayada El-Zoghbi, and Jake Hess, “Achieving the Sustainable Development
Goals” (Consultative Group to Assist the Poor, 2016), 2, http://www.cgap.org/sites/default/files/Working-
Paper-Achieving-Sustainable-Development-Goals-Apr-2016_0.pdf.
11
delivered in a responsible and sustainable way.”10 This definition leaves room for
improvement in two major ways. First is the concept of access rather than usage and the
second involves the breadth of financial instruments required to be counted as financial
included.
Counting someone as financially included based on access misses the mark unless
that person uses the financial services. The definition implies that those with access will
take advantage of it but this is not necessarily the case. Second, the definition includes
numerous subjective criteria, mentions multiple services, and requires “responsible and
sustainable delivery”. Together, these issues with the definition make it hard to measure
financial inclusion as the definition can be easily misinterpreted and measured
inconsistently. For example, it is not clear if a person would be counted if they have
access to a bank account but not insurance services. Likewise, it is not clear if a person
can be financially excluded after previously being included. Say for example, a person
does not need insurance services this year and is declared included but the following year
needs insurances services which are unavailable. The demonstrates the need for a revised
and more solid definition since clearly the benefits of financial inclusion only accrue
when people have access to financial services and also take advantage of them.
While financial inclusion is difficult to measure directly because of the way it is
currently defined, it is possible to use a different defined measure to reach essentially the
same result. In a major report by the global consulting firm McKinsey & Company,
McKinsey acknowledged that two billion people were financial excluded and added that
10 “Financial Inclusion Overview,” n.d.,
http://www.worldbank.org/en/topic/financialinclusion/overview.
12
200 million business in just emerging economies also lacked access to the financial
services they need.11 McKinsey also noted the role of digital finance in spreading
financial inclusion and the wide ranging economic benefits that are possible. In their
report, McKinsey defines digital finance as financial services delivered via mobile
phones, the internet or cards and used digital finance as a basis on which to quantify the
economic impact of financial inclusion.12 By this way, McKinsey eluded the
measurement problems caused by the World Bank’s definition of financial inclusion. The
McKinsey report also highlights numerous insights directly linking the spread of digital
finance to economic gains and even specifically to increased tax revenues. Selected
highlights listed below from the McKinsey report show how digital finance has a wide
range of macroeconomic benefits over a ten-year period in U.S dollars.13
- Digital finance has the potential to give 1.6 billion people access to a bank
account for the first time, 45% of which are the poorest 40% income earners
- The creation of 95 million new jobs, $4.2 trillion dollars of new deposits and
$2.1 trillion dollars of new credit
- A $110 billion dollar annual gain for governments around the world as a result
of reduced leakages and increased tax collection
- A $3.7 trillion dollar increase in the GDP of all emerging markets by 2025.
This represents a six percent increase compared to the status quo.
11 James Manyika et al., “Digital Finance for All: Powering Inclusive Growth in Emerging
Economies,” (McKinsey Global Institute, September 2016), 3, https://www.infine.lu/new-mckinsey-global-
institute-report-digital-finance-for-all-powering-inclusive-growth-in-emerging-economies-september-
2016/.
12 Ibid., viii.
13 Ibid., 2–11.
13
This section discussed the international commitment to bring one billion people
into the formal economy by 2020, the problems with the World Bank’s definition of
financial inclusion and the reason behind using a simplified definition in this paper. It
also demonstrated the link between financial inclusion and higher incomes and tax
revenues. Empirical examples from the field and the broad benefits of financial inclusion
were also discussed. Having established these points, the next section will show how
financial inclusion can be accelerated by leveraging digital payments along with mobile
technology. Digital payment rates around the world will be examined and research from
the field demonstrating how digital payments help to increase tax revenue will also be
shared.
14
Chapter III
Digital Payments
If financial inclusion is the road to bring people to the formal economy, then
digital payments are the vehicle that makes the journey possible. This section will explore
the concept and definition of digital payments. Then it will show how digital payment
technology plays a direct role in increasing government tax revenue. In doing so, the
current level of digital payments will be compared to what is possible and recent
examples of successful digital payment projects will be shared.
Every transaction requires an instrument, such as cash, check, mobile payment or
electronic transfer, in order to be carried out. These instruments can be broken down into
digital and non-digital instruments, depending on the definition that is used. The narrow
definition of digital payments looks at paper versus non-paper instruments. Using this
narrow definition, paper based instruments like cash, checks and money orders are non-
digital instruments while all other instruments are digital.14 In contrast, the broad
definition of digital payments differentiates digital payments between cash versus non-
cash instruments. The broad definition argues that non-cash instruments usually take a
digital form at some point, usually as a result of requiring an account to originate or
terminate.15 For the purposes of this study, we will use the broad definition of digital
14 “How to Define Digital Payments?,” Better Than Cash Alliance, accessed February 12, 2017,
https://www.betterthancash.org/tools-research/toolkits/payments-measurement/focusing-your-
measurement/introduction.
15 Ibid.
15
payments. This is because payment records and inclusion in the financial system relate
closely with measuring how government tax revenue will change, while instrument types
are of little significance.
Digital payments occur through a variety of methods such as debit cards, credit
cards, ATMs, online transactions, and mobile phones. While each method has a role to
play in fostering financial inclusion, mobile phone based solutions hold the most promise.
Leveraging cellular networks to deploy financial solutions provides a platform for
financial inclusion that is estimated to cost 80 to 90 percent less than using physical
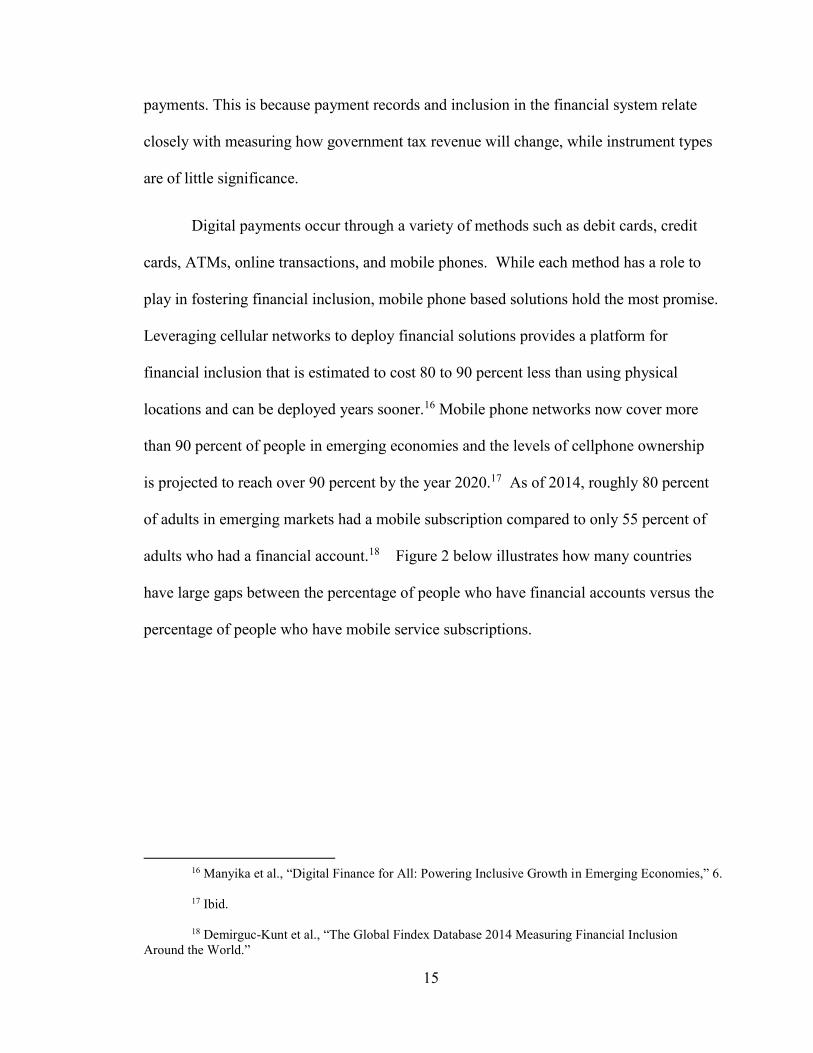
locations and can be deployed years sooner.16 Mobile phone networks now cover more
than 90 percent of people in emerging economies and the levels of cellphone ownership
is projected to reach over 90 percent by the year 2020.17 As of 2014, roughly 80 percent
of adults in emerging markets had a mobile subscription compared to only 55 percent of
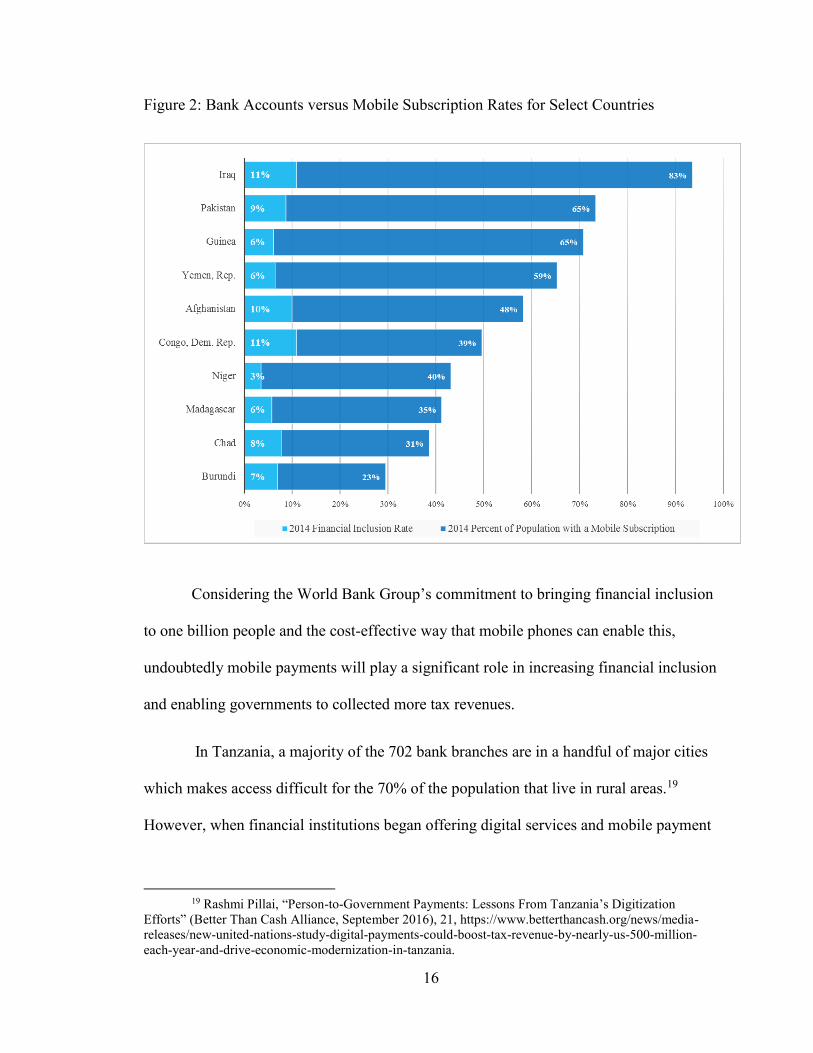
adults who had a financial account.18 Figure 2 below illustrates how many countries
have large gaps between the percentage of people who have financial accounts versus the
percentage of people who have mobile service subscriptions.
16 Manyika et al., “Digital Finance for All: Powering Inclusive Growth in Emerging Economies,” 6.
17 Ibid.
18 Demirguc-Kunt et al., “The Global Findex Database 2014 Measuring Financial Inclusion
Around the World.”
16
Figure 2: Bank Accounts versus Mobile Subscription Rates for Select Countries
Considering the World Bank Group’s commitment to bringing financial inclusion
to one billion people and the cost-effective way that mobile phones can enable this,
undoubtedly mobile payments will play a significant role in increasing financial inclusion
and enabling governments to collected more tax revenues.
In Tanzania, a majority of the 702 bank branches are in a handful of major cities
which makes access difficult for the 70% of the population that live in rural areas.19
However, when financial institutions began offering digital services and mobile payment
19 Rashmi Pillai, “Person-to-Government Payments: Lessons From Tanzania’s Digitization
Efforts” (Better Than Cash Alliance, September 2016), 21, https://www.betterthancash.org/news/media-
releases/new-united-nations-study-digital-payments-could-boost-tax-revenue-by-nearly-us-500-million-
each-year-and-drive-economic-modernization-in-tanzania.
17
solutions like M-PESA, rapid growth in terms of mobile subscribers, account holders and
digital transactions users occurred. Between 2011 and 2014, the number of people with
mobile subscriptions grew from 25.7 million (54.5% of the population) to 31.9 million
(61.5% of the population), while the percentage of adults that had a transactional account
increased from 17.3% to 39.8%. More importantly, the percent of people that used digital
payments rose from 27.7% to 44.4%.20 As of 2015, 96% of adults had a mobile
subscription and only 61% of adults were registered for mobile financial services.21 The
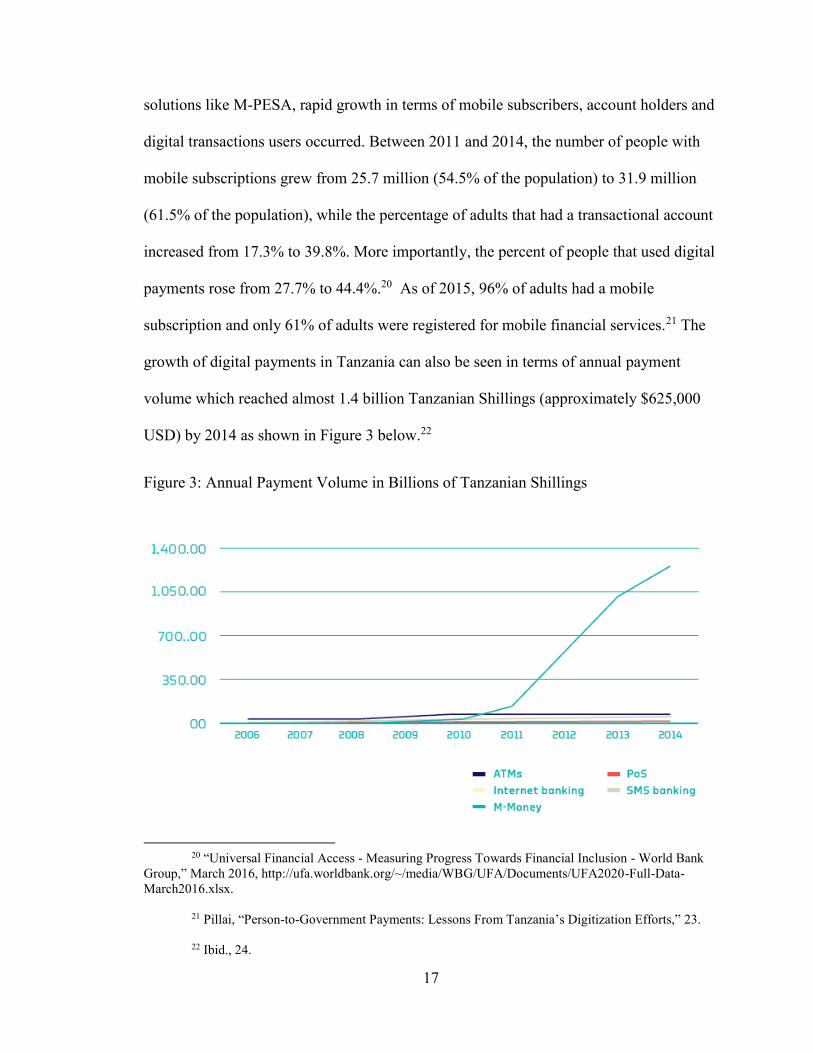
growth of digital payments in Tanzania can also be seen in terms of annual payment
volume which reached almost 1.4 billion Tanzanian Shillings (approximately $625,000
USD) by 2014 as shown in Figure 3 below.22
Figure 3: Annual Payment Volume in Billions of Tanzanian Shillings
20 “Universal Financial Access - Measuring Progress Towards Financial Inclusion - World Bank
Group,” March 2016, http://ufa.worldbank.org/~/media/WBG/UFA/Documents/UFA2020-Full-Data-
March2016.xlsx.
21 Pillai, “Person-to-Government Payments: Lessons From Tanzania’s Digitization Efforts,” 23.
22 Ibid., 24.
18
Rashmi Pillai from the Better Than Cash Alliance and author of a digital finance case
study on Tanzania states how governments in other countries can benefit from digital
payments.23
Payment digitization can deliver higher revenue collection for governments,
increased compliance, efficiency gains, higher accountability and transparency,
and risk management. For individuals and businesses, the convenience, time
savings, and reliability that come with digital payments increase the probability of
these constituents continuing to remain active digital users. Thus, connecting
them to the formal financial system, which in turn drives new economic
opportunities and supports economic growth. In Tanzania, initiatives where
certain payees (namely government-run institutions) have mandated payers to pay
digitally through either existing payment instruments or other digital payment
mechanisms have become a key channel to encourage first-time users to adopt
digital payments.
Digital payment technology has the power to not only empower people with
financial inclusion in developing economies but in every economy. Currently, only about
25 percent of countries in the world have digital payment rates greater than 50 percent.24
Singapore leads the way with digital payments capturing a 90.5 percent share of
transactions, followed by Latvia with 87.9 percent and the United Arab Emirates with
80.9 percent. For reference, the United States comes in at the 27th spot with a 64.7
percent digital payment rate.25 Since most countries have digital payment rates less than
50 percent, there is tremendous potential for digital payment technology to foster further
financial inclusion and allow countries to take part in the numerous other benefits that
23 Ibid., 28.
24 “Universal Financial Access - Measuring Progress Towards Financial Inclusion - World Bank
Group.”
25 Ibid.
19
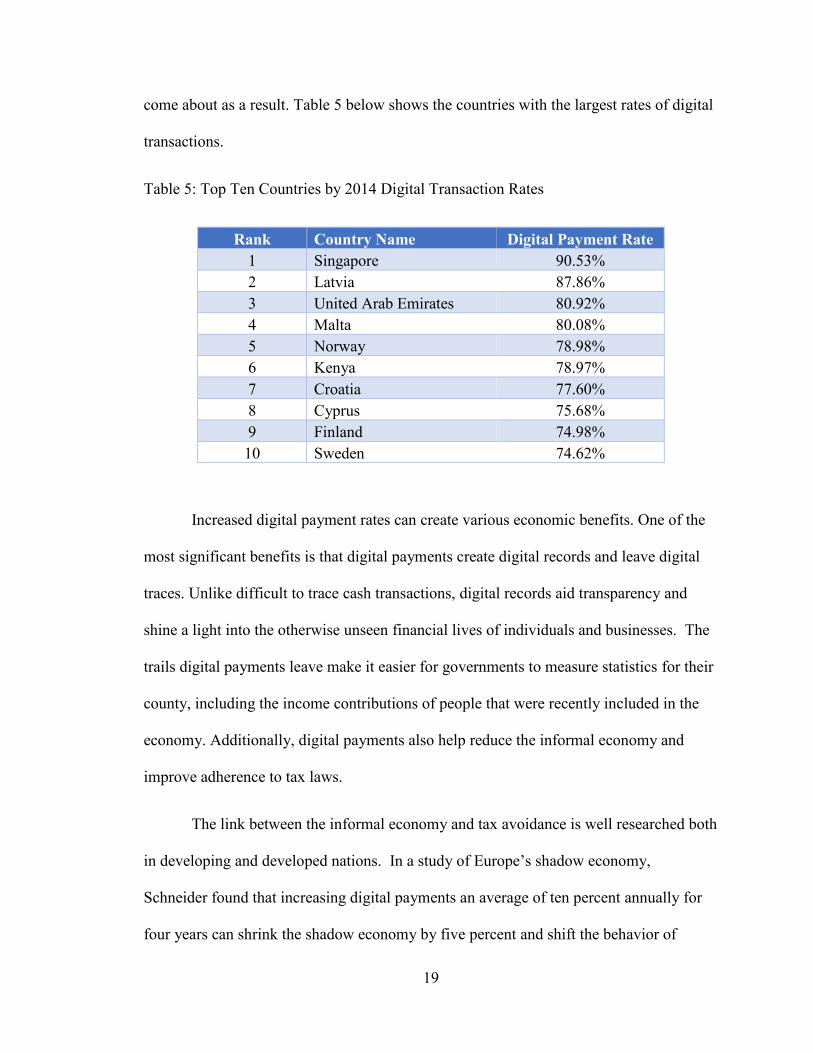
come about as a result. Table 5 below shows the countries with the largest rates of digital
transactions.
Table 5: Top Ten Countries by 2014 Digital Transaction Rates
Rank Country Name Digital Payment Rate
1 Singapore 90.53%
2 Latvia 87.86%
3 United Arab Emirates 80.92%
4 Malta 80.08%
5 Norway 78.98%
6 Kenya 78.97%
7 Croatia 77.60%
8 Cyprus 75.68%
9 Finland 74.98%
10 Sweden 74.62%
Increased digital payment rates can create various economic benefits. One of the
most significant benefits is that digital payments create digital records and leave digital
traces. Unlike difficult to trace cash transactions, digital records aid transparency and
shine a light into the otherwise unseen financial lives of individuals and businesses. The
trails digital payments leave make it easier for governments to measure statistics for their
county, including the income contributions of people that were recently included in the
economy. Additionally, digital payments also help reduce the informal economy and
improve adherence to tax laws.
The link between the informal economy and tax avoidance is well researched both
in developing and developed nations. In a study of Europe’s shadow economy,
Schneider found that increasing digital payments an average of ten percent annually for
four years can shrink the shadow economy by five percent and shift the behavior of
20
merchants who underreport sales.26 Furthermore, a United Nations report claimed that
Tanzania’s digital payment initiatives will help it generate at least $477 million dollars
annually through a variety of ways, ranging from a 42 percent increase in the collection
of vehicle taxes to a 40 percent boost in VAT collection from small businesses.27 Clearly,
as digital payment initiatives take hold, governments can expect tax revenues to increase
in most categories.
As we have discussed, digital payment technology will play a major role in
enabling financial inclusion for millions of people. In this section, the broad and narrow
definitions were reviewed and attention was drawn to the large gap between the number
of people that have bank accounts versus the number of people that have cellular
subscriptions. The opportunity to close this gap and accelerate financial inclusion through
the use of mobile networks and digital payments was described. In addition, research was
shared showing the numerous benefits that derive from digital payments such as
enhanced transparency and increased tax revenues. Building on these benefits of digital
payments, the next section takes a broader perspective by describing the benefits of
financial inclusion. It will discuss how financial inclusion plays a role in solving major
global challenges, how it can help reduce the shadow economy and the impact it has on
economic metrics such as employment and the availability of credit.
26 Friedrich Schneider, “The Shadow Economy in Europe” (AT Kearney, 2013), 18.
27 Pillai, “Person-to-Government Payments: Lessons From Tanzania’s Digitization Efforts,” 29.
21
Chapter IV
The Widespread Benefits of Financial Inclusion
While the focus of this study is how financial inclusion will impact individual tax
revenues, the vast benefits that arise in other areas are important to mention. This section
will discuss how financial inclusion and digital payments play a role in solving global
challenges, the broad impact they can have within a country and the impact they have on
the shadow economy.
The Consultative Group to Assist the Poor, better known as CGAP, claims that
financial inclusion is a key enabler to solve ten of the seventeen United Nations
Sustainable Development Goals (SDG). These high profile and global goals were
decided upon by government leaders and high representatives in September 2015 to form
the centerpiece of the 2030 Agenda for Sustainable Development.28 In a report issued by
CGAP on achieving the sustainable development goals, of the 17 goals defined by the
United Nations, CGAP presented research directly linking financial inclusion with
helping to solve SDG goals 1 to 5 and outlined how financial inclusion plays a role in
furthering another five goals.29 For example, the ability to save money or access a loan
can help overcome a health crisis and when women are given a chance to control
finances, studies show they are more likely to spend on necessities such as health,
28 “Transforming Our World: The 2030 Agenda for Sustainable Development” (United Nations,
September 21, 2013), 3.
29 Klapper, El-Zoghbi, and Hess, “Achiev ing the Sustainable Development Goals,” 2–9.
22
education and food.30 The five SDGs identified as being directly furthered through
financial inclusion are listed below.
SDG 1: End poverty in all its forms everywhere
SDG 2: End hunger, achieve food security and improved nutrition and promote
sustainable agriculture
SDG3: Ensure healthy lives and promote well-being for all at all ages
SDG 4. Ensure inclusive and equitable quality education and promote lifelong
learning opportunities for all
SDG 5: Achieve gender equality and empower all women and girls
On a national scale, the value of financial inclusion can be seen more directly and
even quantified. A comprehensive study of the benefits of digital payments to Indian
society in 2010 revealed detailed estimates of the savings various ministries could expect.
Beneficiaries ranged from the state governments, which stood to save $5.35 billion USD,
to the Ministry of Planning and Development which stood to save $5.6 billion USD.31 The
total anticipated benefits that could be seen through digital payment implementation was
calculated at $22.4 billion USD.32
In a more recent study by McKinsey and Co., focusing on the economic impact of
digital finance in select countries by 2025, significant benefits were estimated across a
range of economic indicators. These are shown in Table 6 below.33
30 Ibid., 6.
31 Tilman Ehrbeck et al., “Inclusive Growth and Financial Security” (McKinsey & Company,
November 2010), 13.
32 Ibid., 14.
33 Manyika et al., “Digital Finance for All: Powering Inclusive Growth in Emerging Economies,”
74–86.
23
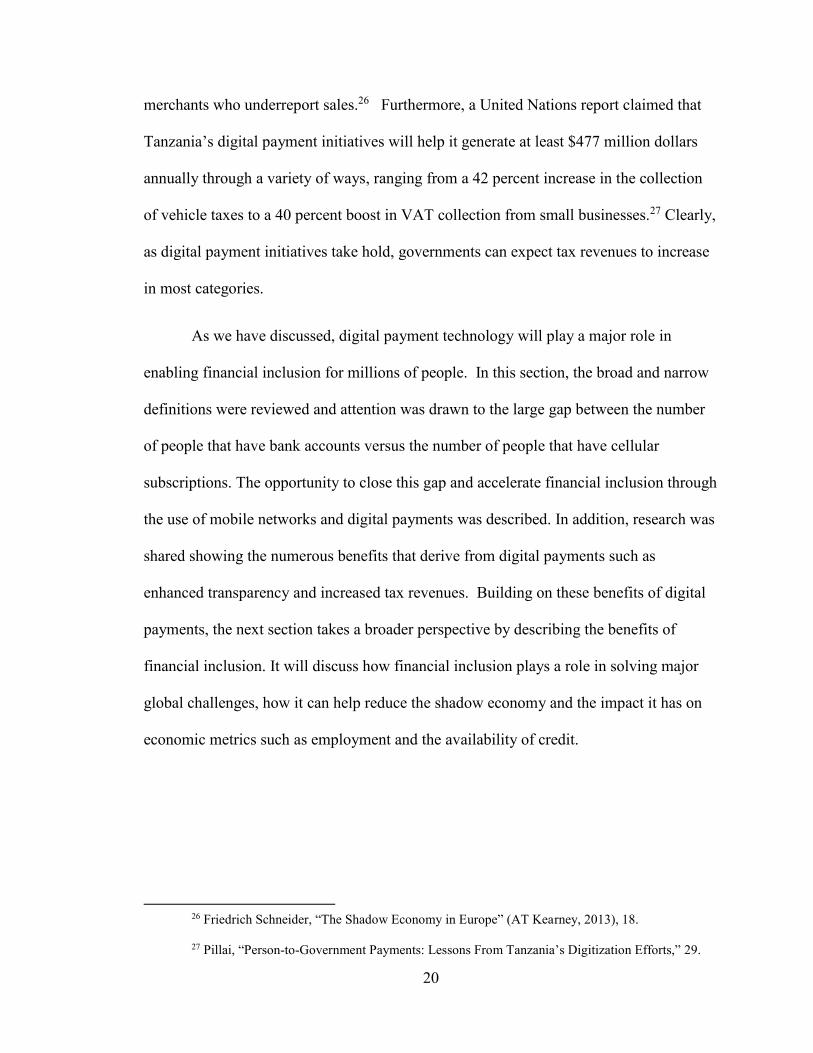
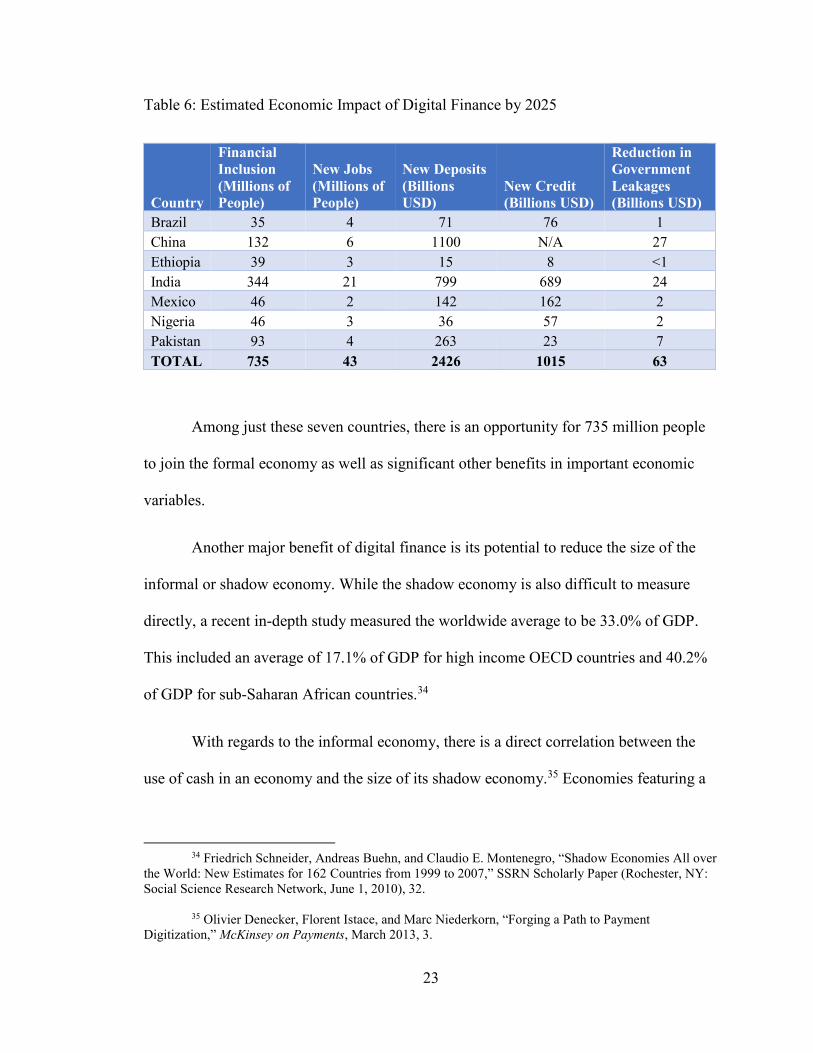
Table 6: Estimated Economic Impact of Digital Finance by 2025
Country
Financial
Inclusion
(Millions of
People)
New Jobs
(Millions of
People)
New Deposits
(Billions
USD)
New Credit
(Billions USD)
Reduction in
Government
Leakages
(Billions USD)
Brazil 35 4 71 76 1
China 132 6 1100 N/A 27
Ethiopia 39 3 15 8 <1
India 344 21 799 689 24
Mexico 46 2 142 162 2
Nigeria 46 3 36 57 2
Pakistan 93 4 263 23 7
TOTAL 735 43 2426 1015 63
Among just these seven countries, there is an opportunity for 735 million people
to join the formal economy as well as significant other benefits in important economic
variables.
Another major benefit of digital finance is its potential to reduce the size of the
informal or shadow economy. While the shadow economy is also difficult to measure
directly, a recent in-depth study measured the worldwide average to be 33.0% of GDP.
This included an average of 17.1% of GDP for high income OECD countries and 40.2%
of GDP for sub-Saharan African countries.34
With regards to the informal economy, there is a direct correlation between the
use of cash in an economy and the size of its shadow economy.35 Economies featuring a
34 Friedrich Schneider, Andreas Buehn, and Claudio E. Montenegro, “Shadow Economies All over
the World: New Estimates for 162 Countries from 1999 to 2007,” SSRN Scholarly Paper (Rochester, NY:
Social Science Research Network, June 1, 2010), 32.
35 Olivier Denecker, Florent Istace, and Marc Niederkorn, “Forging a Path to Payment
Digitization,” McKinsey on Payments, March 2013, 3.
24
high rate of cash transactions generally have large and complex informal economies.
Moreover, there are incentives for using cash for parties on both sides of the transaction.
For example, a vendor can benefit by charging cash and then avoiding paying taxes while
a purchaser can enjoy a lower price by not paying value added taxes. In addition, firms
operating in the informal economy can offer goods and services at lower prices to gain
market share from tax paying firms. In practice, this translates into cost advantages
ranging from 5 percent of the cost of goods sold for Mexican food retailers to 25 percent
in India’s apparel industry and more than 100 percent in the Russian software industry.36
Moreover, individuals operating on a cash basis knowingly or unknowing avoid having
their purchases captured in the formal economy and can easily under report income to
avoid income taxes.
Tax collection and tax law enforcement is difficult to enforce in advanced
economies and is even more difficult in less developed economies given higher cash
transaction rates. For tax year 2006, the Internal Revenue Service (IRS) estimated that
taxes not paid voluntarily totaled over $450 billion USD and remained at approximately
$385 billion USD after collection efforts.37 Similarly, the heavy use of cash in the Indian
post system has led researchers to believe that the Indian government is missing out on
$700 million USD in revenue assuming only a two percent rate of fraud and theft.38
36 “Digital Finance for All: Powering Inclusive Growth in Emerging Economies,” 28.
37 Kenneth Rogoff, “Costs and Benefits to Phasing out Paper Currency,” 2014, 7.
38 Manyika et al., “Digital Finance for All: Powering Inclusive Growth in Emerging Economies,” 26.
25
Despite these large problems, financial inclusion and digital payments enable
them to be changed into opportunities. As previously mentioned, an average increase in
digital payments of ten percent per year could shrink the shadow economy by five
percent. Moreover, studies in Argentina showed bribes reduced from 3.6% to 0.3% of
transactions when digital payments were used for government benefit payments.39 In
Tanzania, an estimated 68% of Tanzanian MSMEs (micro, small or medium enterprises)
were outside the formal economy offering an opportunity to generate the government a
minimum of $144 million USD in value added taxes when they are included.40 To put
this amount in perspective, this would be enough to fund about 30% of Tanzania’s
budgeted agricultural expenditures.
While it is outside of the scope of this study to explore all the benefits that
financial inclusion and digital payments have to offer, it is important to point out the
substantial gains that occur in a wide number of areas. This sectioned showed how
financial inclusion can directly help solve five of the United Nations SDGs, how it can
plug leakages due to the use of cash and how it plays a role in shrinking the shadow
economy. Having discussed the widespread benefits of financial inclusion, the next
section will discuss what governments and other stakeholders can do to materialize the
benefits as well as examples of nations already reaping the rewards.
39 Mark Pickens, David Porteous, and Sarah Rotman, “Banking the Poor via G2P Payments”
(Consultative Group to Assist the Poor, December 2009), 5.
40 Pillai, “Person-to-Government Payments: Lessons From Tanzania’s Digitization Efforts,” 50.
26
Strategies to Increase Digital Payments and Financial Inclusion
With the tremendous benefits that can be gained by increasing financial inclusion
and fostering digital payments, the natural question is how can these two measures be
increased. The answer to this question is not an easy one nor is there a one size fits all
solution for every country. Each nation has a unique internal dynamic that makes general
prescriptions difficult. While an in-depth review of the strategies and tactics to increase
financial inclusion and digital payments are beyond the scope of this work, this section
contains an overview of one approach (Ecosystem Acceleration Framework) that nations
can take to increase digital payment rates and thus financial inclusion. For additional
guidance, there are various organizations and resources that can provide examples, case
studies and operational guidance for implementation.
The Better Than Cash Alliance (BTCA) is a partnership between multiple
governments and organizations such as the Bill & Melinda Gates Foundation, the Ford
Foundation, Visa and MasterCard to help accelerate the transition from cash to digital
payments in order to reduce poverty and drive inclusive growth.41 Recently BTCA
developed the Ecosystem Acceleration Framework that can be used by any country at any
stage in their digital payment evolution. This framework consists of a collection of supply
side drivers, demand side stimulators and policy/regulation elements that work in concert
to accelerate digital payment usage in a given area or ecosystem.
The four supply slide drivers focus on the infrastructure, products and distribution
networks that are needed for digital payments to thrive. They include the promotion of
41 “About The Better Than Cash Alliance,” Better Than Cash Alliance, n.d.,
https://www.betterthancash.org/about.
27
merchant acceptance infrastructure, leveraging existing networks or platforms for
product/service delivery, establishing a shared digital payment infrastructure for all
stakeholders and establishing interoperability.42 Each of these supply side drivers have
the potential to bring a significant number of people into the formal economy. For
example, in Peru the government, financial institutions, telecom operators and other
stakeholders joined forces to create a separate entity called Peruvian Digital Payments
(PDP) whose main goal is to provide digital payment services to people who have
cellphones but not bank accounts.43 As a result, PDP created BIM, which claims to be the
first national fully interoperable mobile money platform. BIM has captured hundreds of
thousands of users and has a goal to reach 5 million people by the end of 2020.44
Demand side stimulators include the development of a unique identification
program, the digitalization of routine use cases, and digitization of government payments
and receipts.45 Each of these drivers cause an increase in digital payments from the
demand side by boosting end user utilization. Examples in countries like Estonia
showcase what is possible through demand side stimulators. Of the 1.3 million Estonians,
94% have digital identification cards and 95% of tax declarations are done online with an
42 “Accelerators to an Inclusive Digital Payments Ecosystem” (Better Than Cash Alliance, August
2016), 4.
43 Carol Carus, “Digital Financial Inclusion in Peru; A Promising Trend to Watch,” Center for
Financial Inclusion Blog, January 19, 2016, https://cfi-blog.org/2016/01/19/digital-financial-inclusion-in-
peru-a-promising-trend-to-watch/.
44 Ibid.
45 “Accelerators to an Inclusive Digital Payments Ecosystem,” 4.
28
average time to file of three minutes. The country also attributes a savings of 2% of GDP
to their paperless government programs.46
The policy and regulation drivers of the Ecosystem Acceleration Framework deal
with governing the system in which supply side and demand side stakeholders operate.
One driver pertains to regulation that promotes innovation especially around digital
payments and the second pertains to polices that incentivize digital payment usage.47 The
usage of policy or regulatory means to drive financial inclusion or digital payment efforts
can be extremely powerful and effective, such as the case of Uruguay’s financial
inclusion law. This law, launched in 2014, grants all works, social benefit recipients and
small businesses access to free digital finance services and mandates that all salary,
pension and social benefit payments will be digital by May 1st 2017. If well implemented,
Uruguay stands to gain tremendously from the benefits of financial inclusion and digital
payments mentioned in the previous sections and can become a benchmark for other
nations.
In addition to the supply side, demand side and regulatory drivers, the framework
outlines a five step evaluation process to help stakeholders determine what actions should
be taken. The framework, including the five step process, can be used multiple times as
part of an iterative process by any stakeholder. The steps to complete the process are
listed below.48
46 “Facts - E-Estonia,” 2017, https://e-estonia.com/facts/.
47 “Accelerators to an Inclusive Digital Payments Ecosystem,” 4.
48 Ibid., 3.
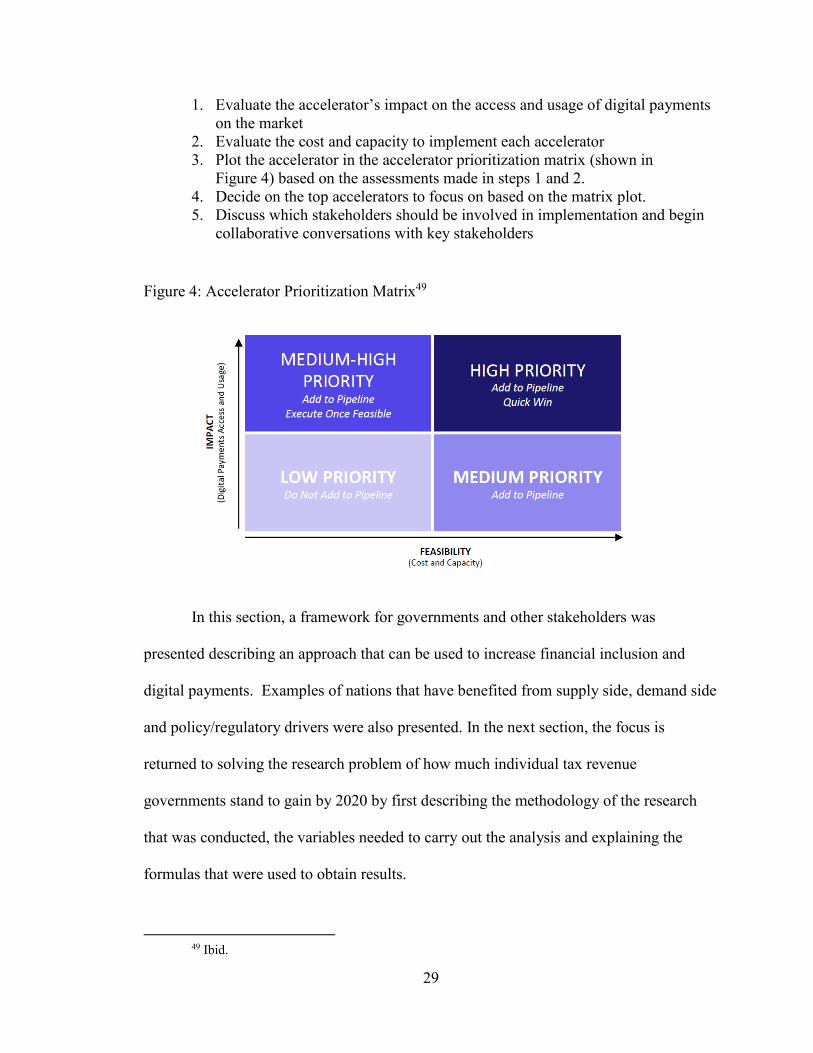
29
1. Evaluate the accelerator’s impact on the access and usage of digital payments
on the market
2. Evaluate the cost and capacity to implement each accelerator
3. Plot the accelerator in the accelerator prioritization matrix (shown in
Figure 4) based on the assessments made in steps 1 and 2.
4. Decide on the top accelerators to focus on based on the matrix plot.
5. Discuss which stakeholders should be involved in implementation and begin
collaborative conversations with key stakeholders
Figure 4: Accelerator Prioritization Matrix49
In this section, a framework for governments and other stakeholders was
presented describing an approach that can be used to increase financial inclusion and
digital payments. Examples of nations that have benefited from supply side, demand side
and policy/regulatory drivers were also presented. In the next section, the focus is
returned to solving the research problem of how much individual tax revenue
governments stand to gain by 2020 by first describing the methodology of the research
that was conducted, the variables needed to carry out the analysis and explaining the
formulas that were used to obtain results.
49 Ibid.
30
Chapter V
Methodology
This section will outline the methodology that was used to calculate how financial
inclusion affects government tax revenue. To date, only two major datasets on financial
inclusion have been released that include worldwide data and both were released by the
World Bank, called the Global Findex. The first dataset was released in 2011 and the
second was released in 2014 with some additional indicators that were not included in
2011. Although the next dataset is expected to be released in 2017, it was not available at
the time of this study. To allow for consistency in data and forecasting, 2014 was used as
the baseline year in this study and forecasts up to 2020 were extrapolated from the 2014
baseline figures. Newer actualized data was used where possible and is noted in the
methodology. In addition to the Global Findex, the second primary source of raw data
was the World Bank online database from which a number of global indicators datasets
were obtained. Data from sources other than the World Bank are also noted. A step by
step breakdown on how the results were obtained are found in the methodology details
that follow.
31
Tax Rate
The tax rates used in this study originate from the 2014 to 2017 Index of
Economic Freedom reports conducted by the Heritage Foundation.50 While the individual
tax rates provided by this report were the top marginal tax rate, which will cause
overestimates of tax revenues in some cases, this report provided the most comprehensive
and consistent dataset for individual tax rates globally.51 For years 2014 to 2017, the tax
rates were taken directly from the report. For years 2018 to 2020, for which tax rates are
not available, it was assumed that the tax rates would not change therefore the 2017 tax
rates were used for calculations.
Calculating the Financially Excluded Population in Each Country
The financially excluded population for each country was calculated as the
number of adults, defined as those ages 15 - 64, that did not have a bank account. This
metric was chosen as it is the minimum requirement for which formal transactions can
take place. To allow for consistency of measurements and comparability, the remaining
calculations in this study also focus solely on the adult demographic aged 15 to 64 years.
It should be noted that there is a strong likelihood that a portion of those aged 65
years or older may activate a bank account, join the formal economy and pay taxes.
While this segment, as well as those aged 14 years and younger, are not considered to be
50 Terry Miller and Anthony Kim, “Index of Economic Freedom Data, Maps and Book Chapters,”
December 2016, http://www.heritage.org/index/download.
51 Terry Miller and Anthony Kim, “Methodology 2017 Index of Economic Freedom Book,”
December 2016, 457, http://www.heritage.org/index/book/methodology.
32
financially excluded or included for the purpose of this study, any contributions by them
would result in even greater tax revenue for the government than was calculated below.
To calculate the number of adults that were financially excluded in each country,
the formula below was used.
For each country i, the [Financially Excluded Population for i] =
[Adult Population of i] x (1 – [percentage of Adult bank account holders in i])
Although as of 2014 there were 2 billion people considered financially excluded
worldwide, only 132 countries had the complete set of data required for all the
calculations in this study, representing a total of 1.87 billion financially excluded people.
As a result, the number of financially excluded people in this study is slightly less than
the total. Also, changes in demographic segments and population growth were not
incorporated in the calculations. This assumes that persons entering the adult
demographic would have an account and those exiting the adult demographic would no
longer have an account. This assumption is also in line with the point made above that
there are additional positive consequences of the financially included senior demographic
on tax revenues.
A recent report from the World Bank regarding their commitment towards
providing the world with universal financial access (from now on known as “Universal
Financial Access Report”) used the same formula to measure the financially excluded
population and was heavily related to the 2014 Global Findex. This report published in
mid-2015 featured slightly different adult population numbers than the Global Findex
online, resulting in a slightly different number of financially excluded people. However,

33
the Universal Financial Access Report only featured financial inclusion indicators for 112
countries; statistics regarding the most advanced economies were not included.
Financial Inclusion Factor
To perform a calculation of the number of people who become financially
included over time, a financial inclusion factor was needed. Although there is no
precedent or previous method to calculate this factor, the World Bank and its partners
have committed to bringing 1 billion people into the formal economy by 2020, which
represents about 50% of the financially excluded population as of 2014. With this point
in mind, it would be reasonable to select a factor that would result in approximately 50%
of those that were excluded in 2014 to join the formal economy. This would translate to a
simple average of 10% per year. Therefore, to calculate the number of people that are
being financially included for all countries, the financial inclusion factor was set at 10%
per year.
Number of People Financially Included
The number of people that are estimated to be financially included in a given year
is calculated by multiplying the number of financially excluded people for each country
by the financial inclusion factor. The formula used to calculate the number of people
financially included annually for the ith country and for nth year is given below.
For year n = 0 to 6, n = 0 corresponds to 2014 and n = 6 corresponds to 2020
For country i and for year n: [Annual Financial Inclusion for i in year n+1] =
[Financial Inclusion Factor] x [Financially Excluded Population for i in year n]
34
As a corollary, for any given country, after determining the number of people that
will be newly included, we can calculate the number of financially excluded people
remaining at the end of year n. This figure will then serve as the number of people
financially excluded for the following year, as required. Thus, we have the equation that
follows.
For country i and year n = 0 to 6,
[Financially Excluded Population for i in year n+1] =
[Financially Excluded Population for i in year n] x (1 - [Financial Inclusion
Factor])
Determining Average Income
Determining the average income of a financially excluded individual, or one that
newly enters the formal economy, is a challenge because by definition, the contributions
of these people were not measured. While intuitively, it would seem that the average
income of a financially excluded person would be lower than the average income of an
included individual, this may not always be the case.
For many countries, significant portions of their population are formally excluded
and of the world’s 7.26 billion people, approximately 2 billion are not a part of the formal
economy. This represents about 27.5% of the global population. Given the large number
of financially excluded people, it is assumed that the average income per capita of an
excluded person approximates the income per capita of the country to which they belong,
although it may be lower in reality, it is difficult to know by how much. This is similar to
the type of result obtained when applying the law of large numbers in which the sample
35
mean converges to the distribution mean as the sample size increases.52 Thus, the Gross
National Income per capita in US dollars calculated by the Atlas method was selected to
estimate the average income of a newly financially included person. This method is also
the World Bank’s preferred method to estimate per capita income as it better estimates
the income of the average person in the economy.
Forecasting Average Income
Once the initial average income was calculated, the average income for successive
years can be generalized to grow at the same pace as the growth rate of the economy.
This is because the economy is based on the production of the individuals and businesses
within it. Once again, because of the large population of financially included people, we
can again turn to the law of large numbers and assume the average income of newly
included people grows at the same rate as their domestic economy. The typical measure
for the growth of a country’s economy is the GDP growth rate which will be used to
model the average person’s income growth over time in this study.
For country i and year n, we have
[Average Income for i in year n+1] =
[Average income for i in year n] x [GDP growth rate for i in year n+1]
52 “The Law of Large Numbers,” n.d., http://www.math.uah.edu/stat/sample/LLN.html.
36
Digital Payments Rate
The percent of people using digital payments in each country was a measured
statistic in the Global Findex and the statistic was used directly in the calculations as
noted in the “Income Captured in the Formal Economy” section below. As a note, this
rate was only provided for adults aged 15 to 64 years which matches the demographic
used in this study. The digital payment rate for 2014 was set to the rate from the
Universal Financial Access dataset for the countries that were listed in that dataset and to
the rate from the Global Findex for the countries that were not mentioned in the
Universal Financial Access dataset. In addition, to reflect the reality that not all
transactions will occur digitally, digital payment rates were capped at 90% for all
economies. The formula for the forecasted digital payment rates from 2015 onwards is
below:
For country i and year n = 1 to 6
[Calculated Digital Payment Rate for i in year n] =
[Digital Payment Rate for i in year n-1] x (1 + [Digital Payment Growth Rate for
i in year n]) *
* The Digital Payment Growth Rate is explained in the subsequent section
[Digital Payment Rate for i in year n] =
minimum (90%, [Calculated Digital Payment Rate for i in year n])
37
Digital Payment Growth Rate
Since only two measurements were done on the percentage of people using digital
payments three years apart (2011 and 2014) and there are no future estimates of digital
payment usage, estimating the future growth of digital payment usage is difficult.
Moreover, as each country has their own starting point and internal dynamics that play a
role in digital payment adoption, a broad global average or similar measure would not be
reasonable. Since digital payments is an emerging technology, the adoption rate of
cellular service technology can provide a parallel on which to build an estimate since
cellular service was also an emerging technology in previous years.
Thus, to forecast the adoption rate of digital payments, the year over year change
in mobile subscription rates were examined for each country for the past six years. The
resulting figures will be used as a proxy for digital payment growth in each country. For
example, if the cellular subscription growth rates for county i for the years 2011 to 2016
are given by 10%, 15%, 20%, 25%, 30% and 35%, respectively, then the estimate of the
digital payments growth rates for country i for 2015 to 2020 would be 10%, 15%, 20%,
25%, 30% and 35%, respectively.
Where year n = 0 corresponds to 2014, for country i:
[Digital Payment Growth Rate for i in year n] =
([Mobile Subscription rate for i in year n-5]- [Mobile Subscription rate for i in
year n-6]) / [Mobile Subscription rate for i in year n-5]
38
Income Captured in the Formal Economy
As previously mentioned, having a bank account does not necessarily mean a
person will use it in a way in which their income is captured in the formal economy.
Individuals in both advanced and developing economies continue to transact in cash
regardless of their financial inclusion status. This is especially pertinent to those just
entering the formal economy because for many people cash was the only transaction
method they had ever used.
To model the fact that cash transactions would continue to occur for some portion
of transactions despite a person becoming financially included, the average income for
each person was multiplied by the rate of digital payment usage in their respective
country. This produced an estimate of the amount of income per capita that would be
captured in the formal economy and thus could be taxed. This formula is below.
For country i for year n = 1 to 6,
[Income Captured Per Capita for i in year n] =
[Average Income for i in year n] x [Digital payments Rate for i in year n]
For the total income captured in a given year by the newly financially included in that
year we have the formula below.
[Income Captured for i in year n] =
[Income Captured Per Capita for i in year n] x [Financially Include Population for
i in year n]
For the total income captured by those financially included since 2014 the formula is
39
[Total Income Captured for i in year n] =
[Income Captured Per Capita for i in year n] x
∑ [Financially Include Population for i in year n]𝑛1
Captured Tax Revenue
The incremental tax revenue that a government will collect from one financially
included person in a given year is a simple multiplication of the per capita income
captured in the formal economy for the year times the corresponding tax rate.
For country i and for year n = 1 to 6,
[Captured Tax Revenue Per Capita for i in year n] =
[Income Captured Per Capita for i in year n] x [Tax Rate for i in year n]
For the total tax captured in a given year by the newly financially included in that year
we have the formula below.
[Captured Tax Revenue for i in year n] =
[Income Captured for i in year n] x [Tax Rate for i in year n]
40
Total Annual Captured Tax Revenue
The total annual captured tax revenue measures the total captured taxes of all the
newly financial included people since 2014. The total annual captured tax revenue metric
shows how much governments can expect their tax revenues to increase due to financial
inclusion and digital payments since 2014. The measure is defined as:
[Total Annual Captured Tax Revenue for i year n] =
[Captured Tax Revenue Per Capita for i in year n] x
∑ [Financially Include Population for i in year n]𝑛1
Having completed a full discussion of the methodology, the variables needed for
the analysis and the formulas to determine the results, the next section will convey the
results. The analysis will show how financial exclusion decreases over time, the change
in digital payments nations will experience and the income and tax revenue that will be
captured in the formal economy. The countries that stand to gain the most in dollar terms
and percent terms for various metrics will be identified and the research question of
“How much individual tax revenue will governments gain by the year 2020 because of
financial inclusion?” will be answered.
41
Chapter VI
Results and Analysis
In completing any analysis, reliable and consistent data plays a paramount role in
the results. For the analysis in this paper, complete information was available for 132
counties. Partial information for other countries allowed for those countries to be
included in certain calculations. Therefore, for each analysis, as many countries as
possible were included based on the information available, and will be explained below.
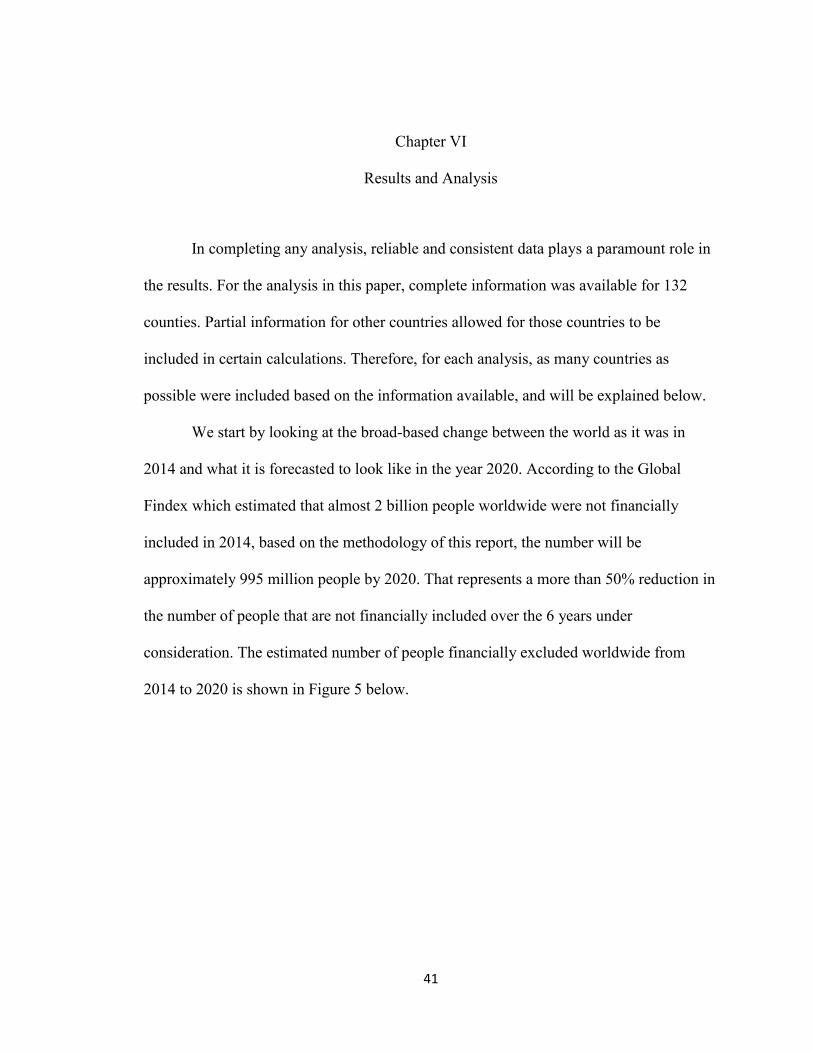
We start by looking at the broad-based change between the world as it was in
2014 and what it is forecasted to look like in the year 2020. According to the Global
Findex which estimated that almost 2 billion people worldwide were not financially
included in 2014, based on the methodology of this report, the number will be
approximately 995 million people by 2020. That represents a more than 50% reduction in
the number of people that are not financially included over the 6 years under
consideration. The estimated number of people financially excluded worldwide from
2014 to 2020 is shown in Figure 5 below.
42
Figure 5: Estimated Number of People Financially Excluded Worldwide
The preceding figure shows that the rate of financial inclusion slows over time
and as a corollary will result in diminishing marginal results. With fewer and fewer
people remaining outside the formal economy, maintaining the same pace of inclusion
will be difficult due to the challenge of reaching and convincing these remaining
individuals to join the economy. While material gains in financial inclusion can still be
expected in the 2020s, at some point a global threshold will be reached. While this
threshold will certainly be less than 100% inclusion, the hypothetical and empirical
maximum rates are difficult to forecast with any accuracy.
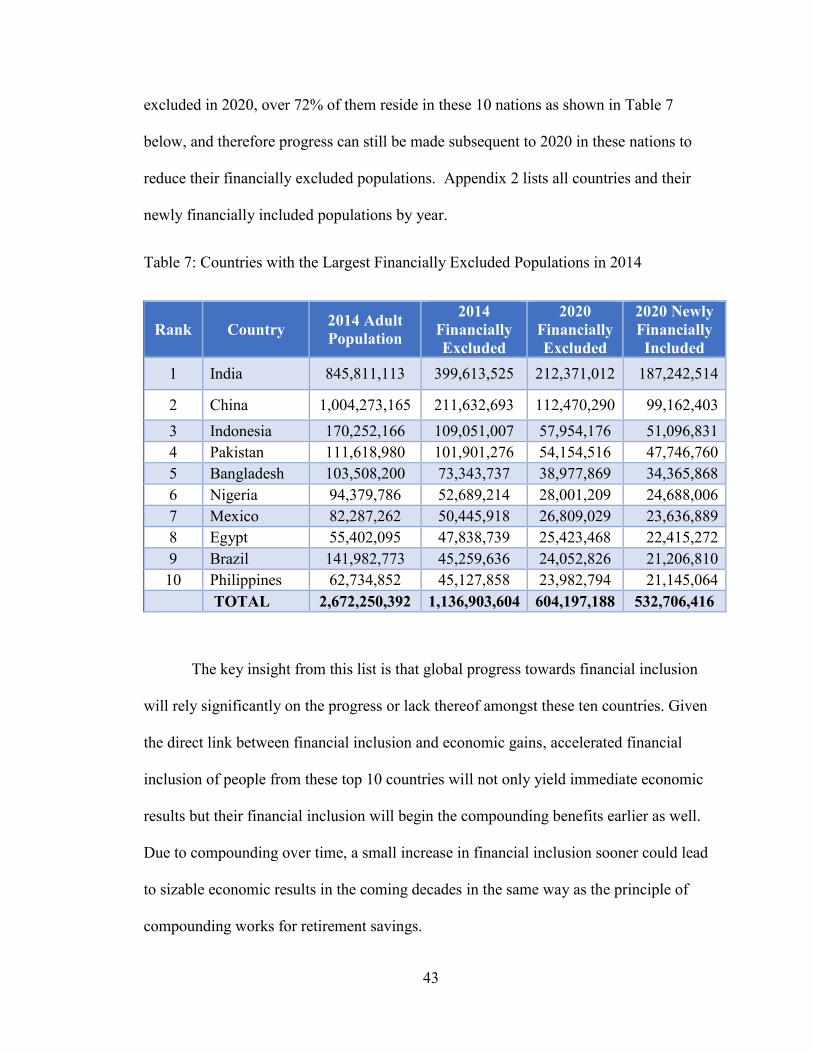
A look at the nations with the most financially excluded people in 2014 reveals
that the top 10 nations with the largest population of people that were not in the formal
economy in 2014 does not change in 2020. However, they are cumulatively responsible
for 500 million people (or just over half the number of people) that do become included
over that time. Of the approximately 1.1 billion people that will remain financially
-
200,000,000
400,000,000
600,000,000
800,000,000
1,000,000,000
1,200,000,000
1,400,000,000
1,600,000,000
1,800,000,000
2,000,000,000
2014Unbanked
Pop
2015Unbanked
Pop
2016Unbanked
Pop
2017Unbanked
Pop
2018Unbanked
Pop
2019Unbanked
Pop
2020Unbanked
Pop
43
excluded in 2020, over 72% of them reside in these 10 nations as shown in Table 7
below, and therefore progress can still be made subsequent to 2020 in these nations to
reduce their financially excluded populations. Appendix 2 lists all countries and their
newly financially included populations by year.
Table 7: Countries with the Largest Financially Excluded Populations in 2014
Rank Country 2014 Adult
Population
2014
Financially
Excluded
2020
Financially
Excluded
2020 Newly
Financially
Included
1 India 845,811,113 399,613,525 212,371,012 187,242,514
2 China 1,004,273,165 211,632,693 112,470,290 99,162,403
3 Indonesia 170,252,166 109,051,007 57,954,176 51,096,831
4 Pakistan 111,618,980 101,901,276 54,154,516 47,746,760
5 Bangladesh 103,508,200 73,343,737 38,977,869 34,365,868
6 Nigeria 94,379,786 52,689,214 28,001,209 24,688,006
7 Mexico 82,287,262 50,445,918 26,809,029 23,636,889
8 Egypt 55,402,095 47,838,739 25,423,468 22,415,272
9 Brazil 141,982,773 45,259,636 24,052,826 21,206,810
10 Philippines 62,734,852 45,127,858 23,982,794 21,145,064
TOTAL 2,672,250,392 1,136,903,604 604,197,188 532,706,416
The key insight from this list is that global progress towards financial inclusion
will rely significantly on the progress or lack thereof amongst these ten countries. Given
the direct link between financial inclusion and economic gains, accelerated financial
inclusion of people from these top 10 countries will not only yield immediate economic
results but their financial inclusion will begin the compounding benefits earlier as well.
Due to compounding over time, a small increase in financial inclusion sooner could lead
to sizable economic results in the coming decades in the same way as the principle of
compounding works for retirement savings.
44
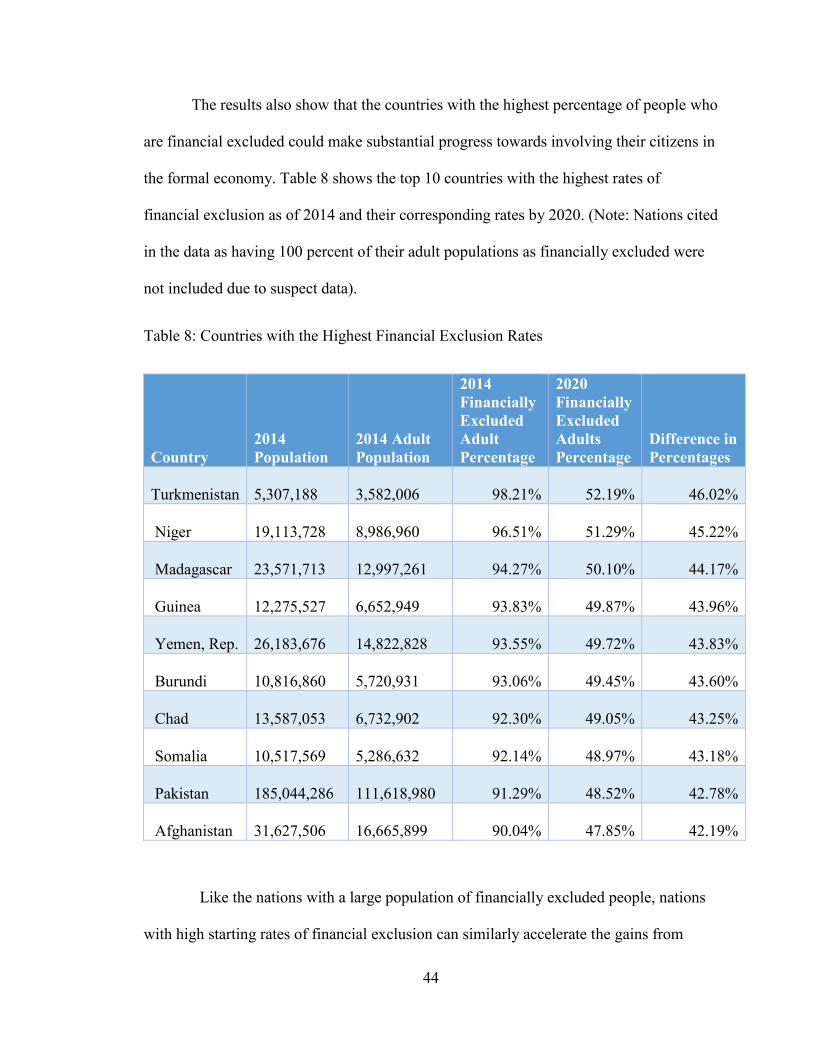
The results also show that the countries with the highest percentage of people who
are financial excluded could make substantial progress towards involving their citizens in
the formal economy. Table 8 shows the top 10 countries with the highest rates of
financial exclusion as of 2014 and their corresponding rates by 2020. (Note: Nations cited
in the data as having 100 percent of their adult populations as financially excluded were
not included due to suspect data).
Table 8: Countries with the Highest Financial Exclusion Rates
Country
2014
Population
2014 Adult
Population
2014
Financially
Excluded
Adult
Percentage
2020
Financially
Excluded
Adults
Percentage
Difference in
Percentages
Turkmenistan
5,307,188
3,582,006 98.21% 52.19% 46.02%
Niger
19,113,728
8,986,960 96.51% 51.29% 45.22%
Madagascar
23,571,713
12,997,261 94.27% 50.10% 44.17%
Guinea
12,275,527
6,652,949 93.83% 49.87% 43.96%
Yemen, Rep.
26,183,676
14,822,828 93.55% 49.72% 43.83%
Burundi
10,816,860
5,720,931 93.06% 49.45% 43.60%
Chad
13,587,053
6,732,902 92.30% 49.05% 43.25%
Somalia
10,517,569
5,286,632 92.14% 48.97% 43.18%
Pakistan
185,044,286
111,618,980 91.29% 48.52% 42.78%
Afghanistan
31,627,506
16,665,899 90.04% 47.85% 42.19%
Like the nations with a large population of financially excluded people, nations
with high starting rates of financial exclusion can similarly accelerate the gains from
45
financial inclusion by focusing on bringing people into the economy sooner rather than
later. The bottom line for countries with either high rates of financial exclusion or a large
number of people that are not economically counted is that the financial inclusion factor,
which is the rate that people join the formal economy, can matter a great deal to the
benefits the country will receive. Of the countries listed in Table 6 and Table 7, Pakistan
was the only country to be featured on both lists with over 111 million people (91.29
percent of adults) financially excluded. Therefore, Pakistan has a large amount to gain by
including their financially excluded people into the formal economy as soon as possible.
At a global level, in 2014 the average financial inclusion rate, was 52.2 percent
with 69 nations falling below the average. Fast forward to the forecast for 2020 and the
average financial inclusion rate sky rockets to 74.6% however 69 nations still fall below
the average. While the number of countries below the average is identical five years later
due to the uniform financial inclusion factor applied to every nation as part of the
methodology, the range of percentages between the nations shrinks.
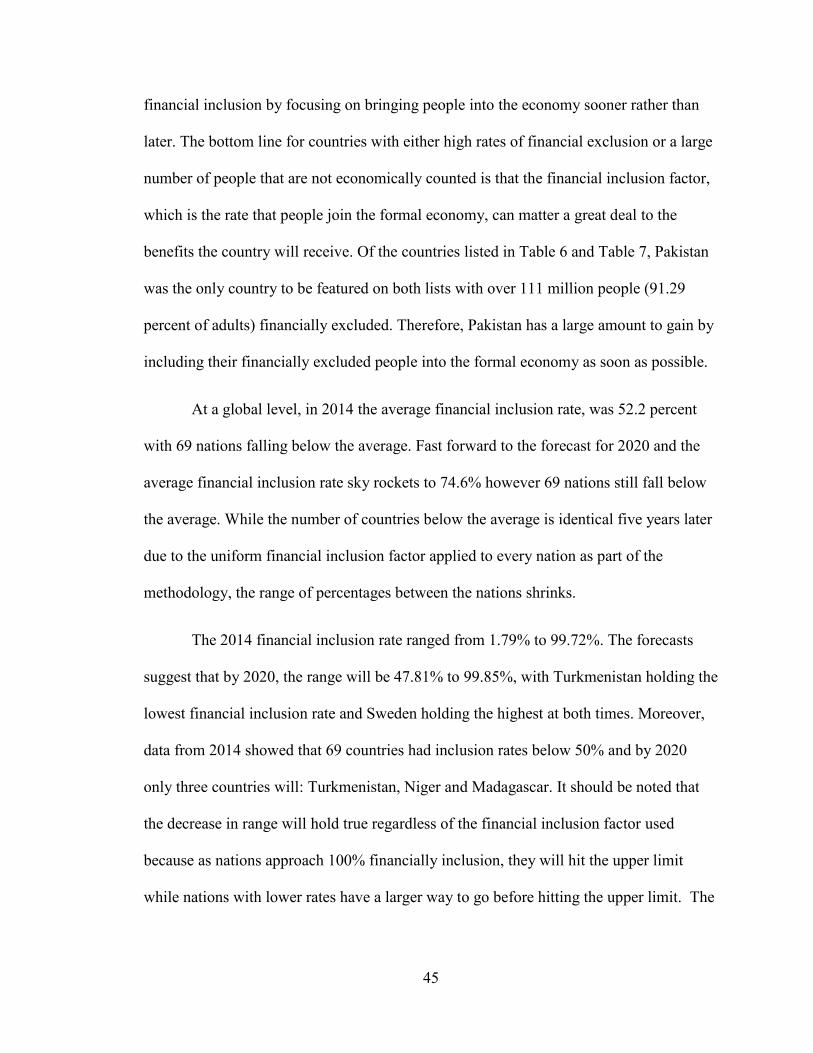
The 2014 financial inclusion rate ranged from 1.79% to 99.72%. The forecasts
suggest that by 2020, the range will be 47.81% to 99.85%, with Turkmenistan holding the
lowest financial inclusion rate and Sweden holding the highest at both times. Moreover,
data from 2014 showed that 69 countries had inclusion rates below 50% and by 2020
only three countries will: Turkmenistan, Niger and Madagascar. It should be noted that
the decrease in range will hold true regardless of the financial inclusion factor used
because as nations approach 100% financially inclusion, they will hit the upper limit
while nations with lower rates have a larger way to go before hitting the upper limit. The
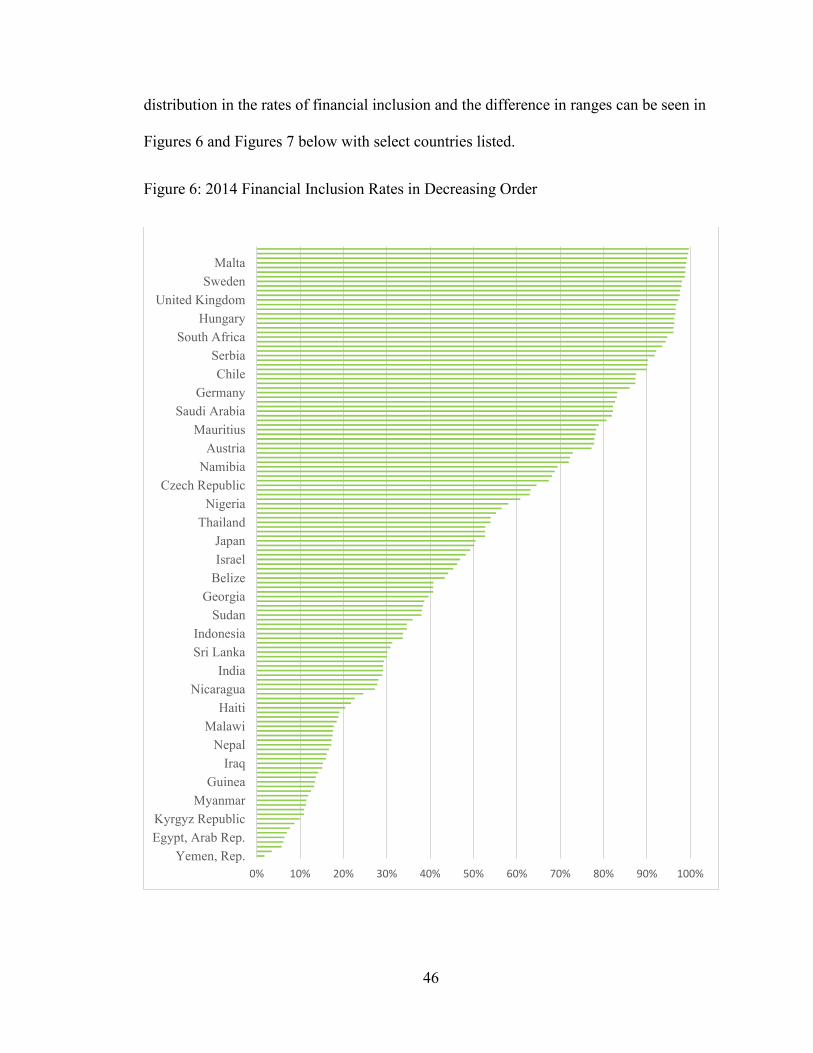
46
distribution in the rates of financial inclusion and the difference in ranges can be seen in
Figures 6 and Figures 7 below with select countries listed.
Figure 6: 2014 Financial Inclusion Rates in Decreasing Order
0% 10% 20% 30% 40% 50% 60% 70% 80% 90% 100%
Yemen, Rep.
Egypt, Arab Rep.
Kyrgyz Republic
Myanmar
Guinea
Iraq
Nepal
Malawi
Haiti
Nicaragua
India
Sri Lanka
Indonesia
Sudan
Georgia
Belize
Israel
Japan
Thailand
Nigeria
Czech Republic
Namibia
Austria
Mauritius
Saudi Arabia
Germany
Chile
Serbia
South Africa
Hungary
United Kingdom
Sweden
Malta
47
Figure 7: 2020 Financial Inclusion Rates in Decreasing Order
0% 10% 20% 30% 40% 50% 60% 70% 80% 90% 100%
Turkmenistan
Guinea
Chad
Congo, Dem. Rep.
Tajikistan
Mali
Sierra Leone
Benin
Zimbabwe
Togo
Nicaragua
Ethiopia
Tunisia
Peru
Angola
Vietnam
Nepal
Indonesia
Colombia
Uzbekistan
Panama
Ecuador
Botswana
Bosnia and Herzegovina
Kazakhstan
Turkey
Bulgaria
Russian Federation
Saudi Arabia
Kuwait
Lithuania
China
Czech Republic
Serbia
Italy
Israel
Mongolia
Korea, Rep.
Luxembourg
France
Slovenia
Switzerland
Australia
Netherlands
48
A key insight from this research is that while many states can turn to financial
inclusion to bring about dramatic gains in their economies, the gains that can be had
through this approach will diminish over time. When states discover that they no longer
can drive fast economic growth by adding to the productive population, a shift towards
efficiencies will likely be needed for continued growth. At the same time, nations that are
starting with high inclusion rates will feel further pressure to grow their economies as the
significant number of people entering the global economy will create competitive
pressures and they will not be able to react by simply increasing their financially included
population. This may in turn put a damper on the economic growth of these nations and
those nations that fail to adjust may even see their economies shrink and competitive rank
in the global context diminish.
At the regional level, in 2014 every region except North America had a
dramatically wide range of financial inclusion rates and had multiple nations with
financial inclusion rates less than 50%. However, by 2020, forecasts show that the range
within regions narrows materially and there will be five regions that have all countries
with greater than 50% financial inclusion rates. Only a handful of nations in the African
region and Europe and Central Asia region will have rates below 50%. Figures 8 and 9
show the financial inclusion rates in 2014 and 2020 by region with select nations listed
for reference. A listing of each country, their region and their income level grouping is
provided in Appendix 7.
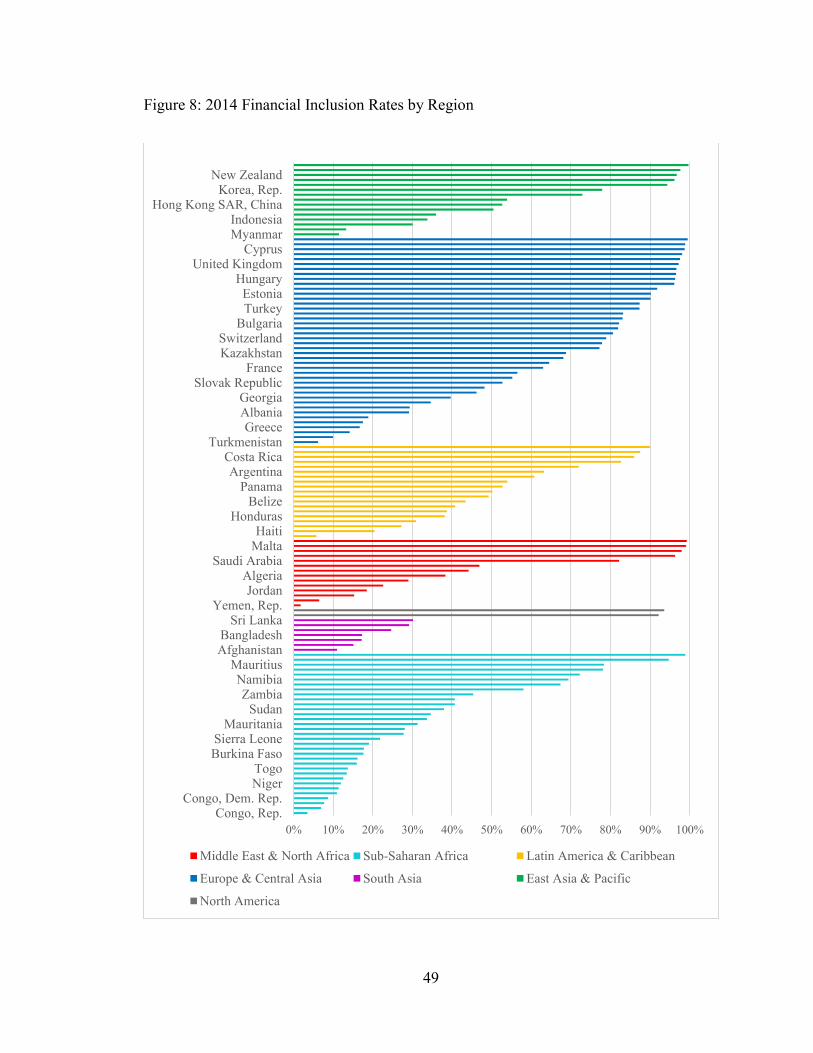
49
Figure 8: 2014 Financial Inclusion Rates by Region
0% 10% 20% 30% 40% 50% 60% 70% 80% 90% 100%
Congo, Rep.Congo, Dem. Rep.
NigerTogo
Burkina FasoSierra Leone
MauritaniaSudan
ZambiaNamibia
MauritiusAfghanistanBangladesh
Sri LankaYemen, Rep.
JordanAlgeria
Saudi ArabiaMaltaHaiti
HondurasBelize
PanamaArgentina
Costa RicaTurkmenistan
GreeceAlbaniaGeorgia
Slovak RepublicFrance
KazakhstanSwitzerland
BulgariaTurkeyEstonia
HungaryUnited Kingdom
CyprusMyanmarIndonesia
Hong Kong SAR, ChinaKorea, Rep.
New Zealand
Middle East & North Africa Sub-Saharan Africa Latin America & Caribbean
Europe & Central Asia South Asia East Asia & Pacific
North America
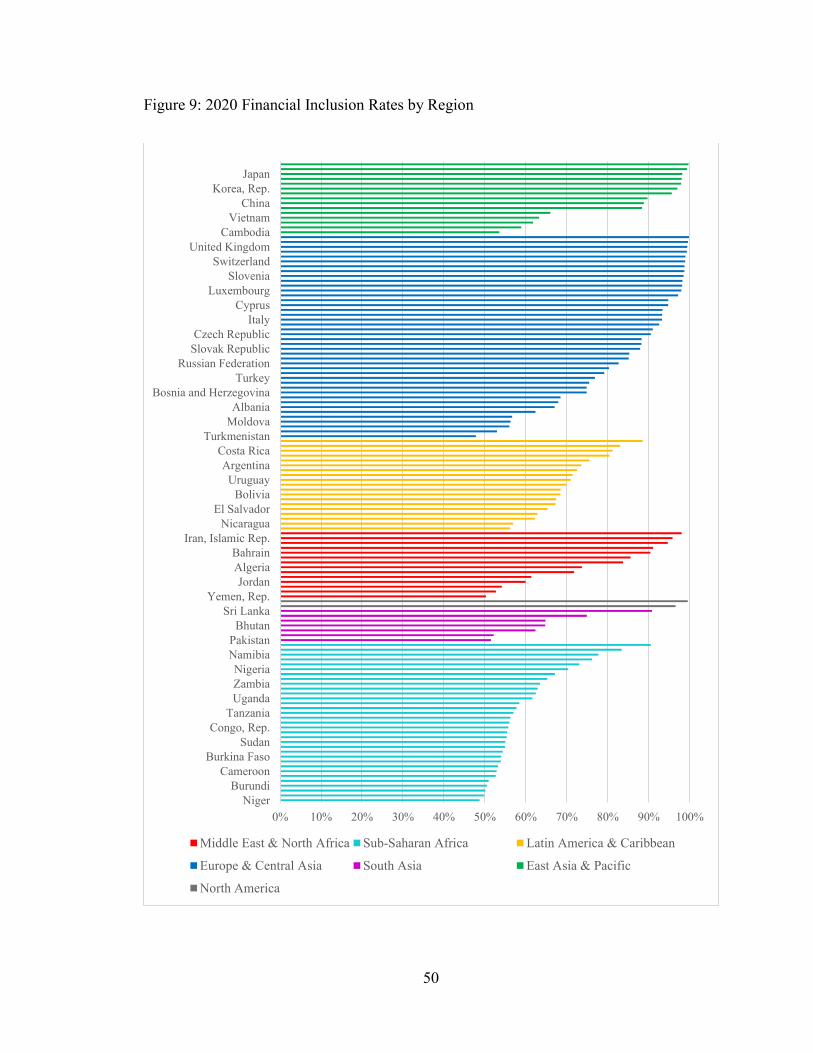
50
Figure 9: 2020 Financial Inclusion Rates by Region
0% 10% 20% 30% 40% 50% 60% 70% 80% 90% 100%
Niger
Burundi
Cameroon
Burkina Faso
Sudan
Congo, Rep.
Tanzania
Uganda
Zambia
Nigeria
Namibia
Pakistan
Bhutan
Sri Lanka
Yemen, Rep.
Jordan
Algeria
Bahrain
Iran, Islamic Rep.
Nicaragua
El Salvador
Bolivia
Uruguay
Argentina
Costa Rica
Turkmenistan
Moldova
Albania
Bosnia and Herzegovina
Turkey
Russian Federation
Slovak Republic
Czech Republic
Italy
Cyprus
Luxembourg
Slovenia
Switzerland
United Kingdom
Cambodia
Vietnam
China
Korea, Rep.
Japan
Middle East & North Africa Sub-Saharan Africa Latin America & Caribbean
Europe & Central Asia South Asia East Asia & Pacific
North America
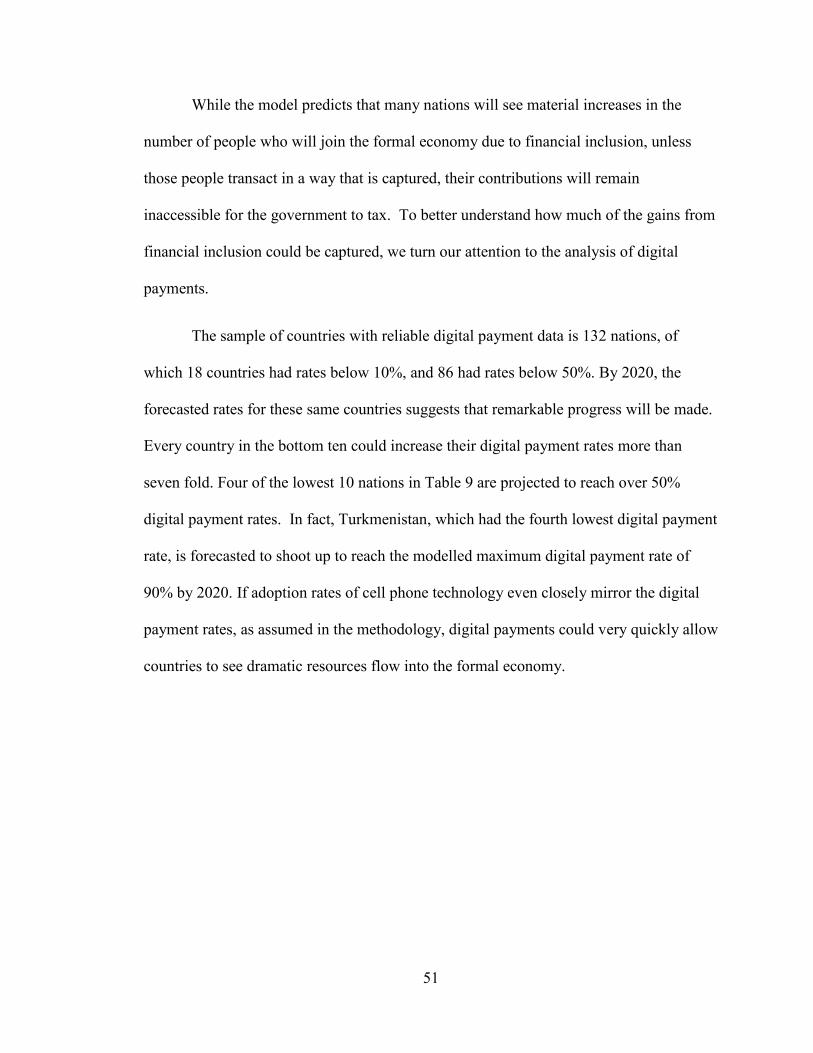
51
While the model predicts that many nations will see material increases in the
number of people who will join the formal economy due to financial inclusion, unless
those people transact in a way that is captured, their contributions will remain
inaccessible for the government to tax. To better understand how much of the gains from
financial inclusion could be captured, we turn our attention to the analysis of digital
payments.
The sample of countries with reliable digital payment data is 132 nations, of
which 18 countries had rates below 10%, and 86 had rates below 50%. By 2020, the
forecasted rates for these same countries suggests that remarkable progress will be made.
Every country in the bottom ten could increase their digital payment rates more than
seven fold. Four of the lowest 10 nations in Table 9 are projected to reach over 50%
digital payment rates. In fact, Turkmenistan, which had the fourth lowest digital payment
rate, is forecasted to shoot up to reach the modelled maximum digital payment rate of
90% by 2020. If adoption rates of cell phone technology even closely mirror the digital
payment rates, as assumed in the methodology, digital payments could very quickly allow
countries to see dramatic resources flow into the formal economy.
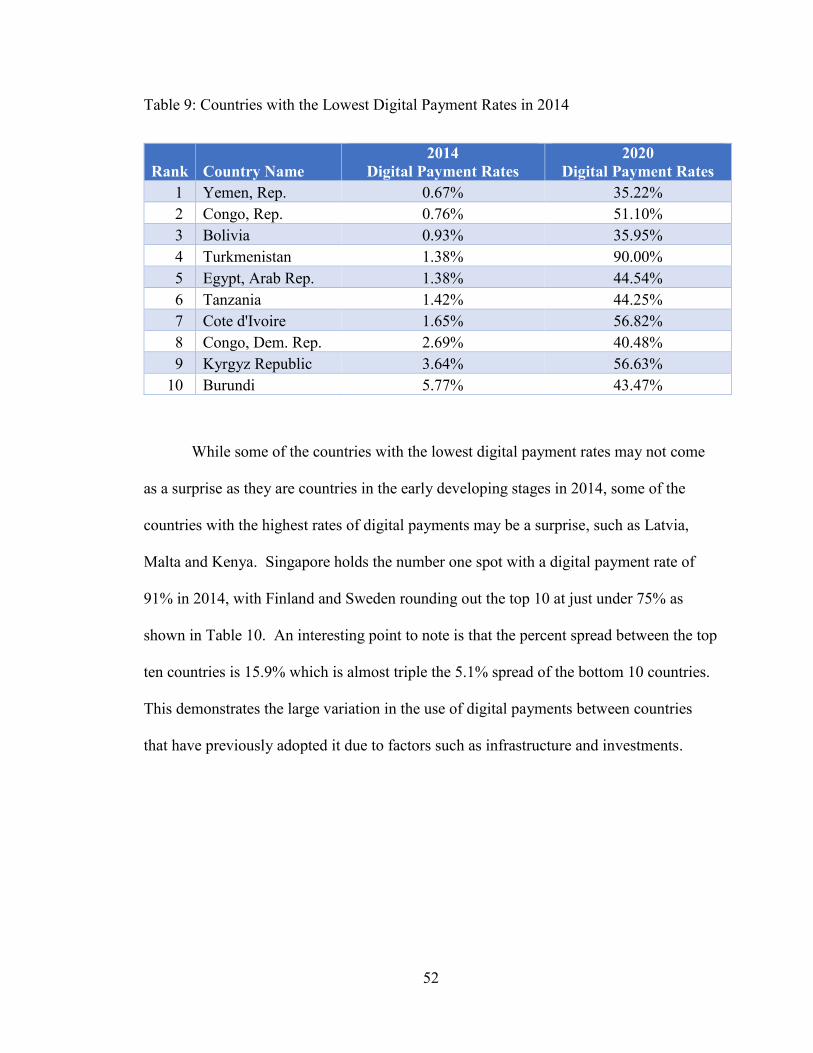
52
Table 9: Countries with the Lowest Digital Payment Rates in 2014
Rank Country Name
2014
Digital Payment Rates
2020
Digital Payment Rates
1 Yemen, Rep. 0.67% 35.22%
2 Congo, Rep. 0.76% 51.10%
3 Bolivia 0.93% 35.95%
4 Turkmenistan 1.38% 90.00%
5 Egypt, Arab Rep. 1.38% 44.54%
6 Tanzania 1.42% 44.25%
7 Cote d'Ivoire 1.65% 56.82%
8 Congo, Dem. Rep. 2.69% 40.48%
9 Kyrgyz Republic 3.64% 56.63%
10 Burundi 5.77% 43.47%
While some of the countries with the lowest digital payment rates may not come
as a surprise as they are countries in the early developing stages in 2014, some of the
countries with the highest rates of digital payments may be a surprise, such as Latvia,
Malta and Kenya. Singapore holds the number one spot with a digital payment rate of
91% in 2014, with Finland and Sweden rounding out the top 10 at just under 75% as
shown in Table 10. An interesting point to note is that the percent spread between the top
ten countries is 15.9% which is almost triple the 5.1% spread of the bottom 10 countries.
This demonstrates the large variation in the use of digital payments between countries
that have previously adopted it due to factors such as infrastructure and investments.
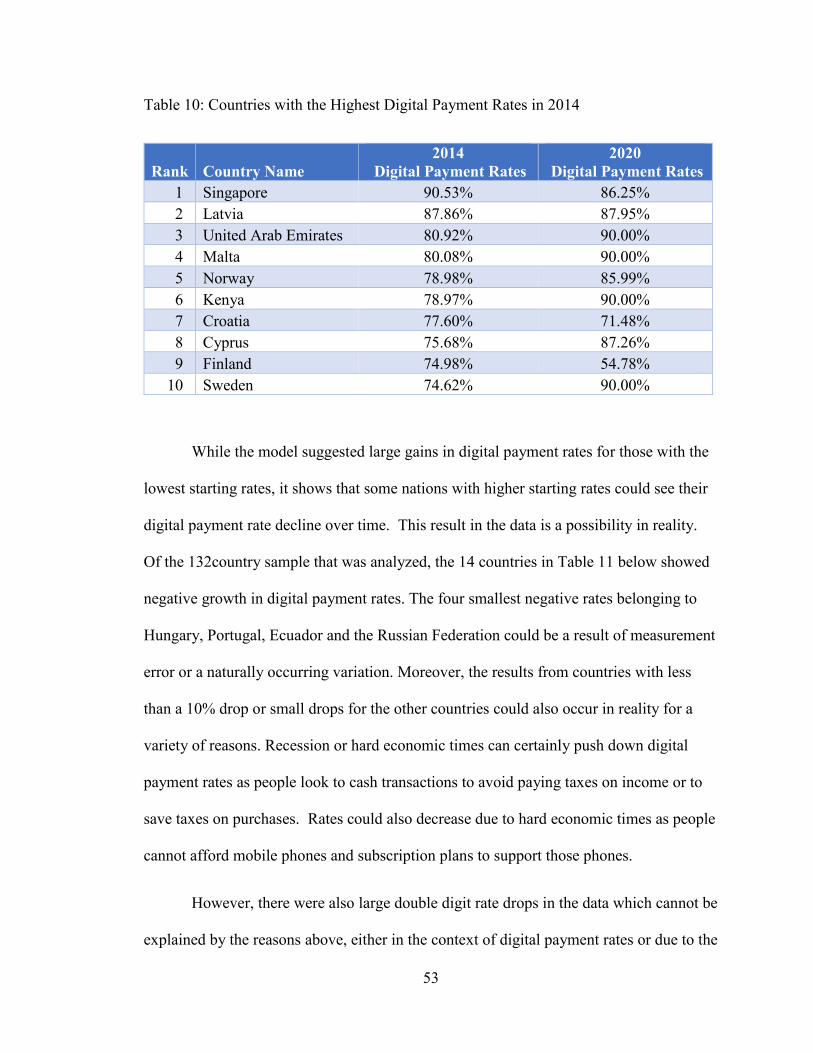
53
Table 10: Countries with the Highest Digital Payment Rates in 2014
Rank Country Name
2014
Digital Payment Rates
2020
Digital Payment Rates
1 Singapore 90.53% 86.25%
2 Latvia 87.86% 87.95%
3 United Arab Emirates 80.92% 90.00%
4 Malta 80.08% 90.00%
5 Norway 78.98% 85.99%
6 Kenya 78.97% 90.00%
7 Croatia 77.60% 71.48%
8 Cyprus 75.68% 87.26%
9 Finland 74.98% 54.78%
10 Sweden 74.62% 90.00%
While the model suggested large gains in digital payment rates for those with the
lowest starting rates, it shows that some nations with higher starting rates could see their
digital payment rate decline over time. This result in the data is a possibility in reality.
Of the 132country sample that was analyzed, the 14 countries in Table 11 below showed
negative growth in digital payment rates. The four smallest negative rates belonging to
Hungary, Portugal, Ecuador and the Russian Federation could be a result of measurement
error or a naturally occurring variation. Moreover, the results from countries with less
than a 10% drop or small drops for the other countries could also occur in reality for a
variety of reasons. Recession or hard economic times can certainly push down digital
payment rates as people look to cash transactions to avoid paying taxes on income or to
save taxes on purchases. Rates could also decrease due to hard economic times as people
cannot afford mobile phones and subscription plans to support those phones.
However, there were also large double digit rate drops in the data which cannot be
explained by the reasons above, either in the context of digital payment rates or due to the
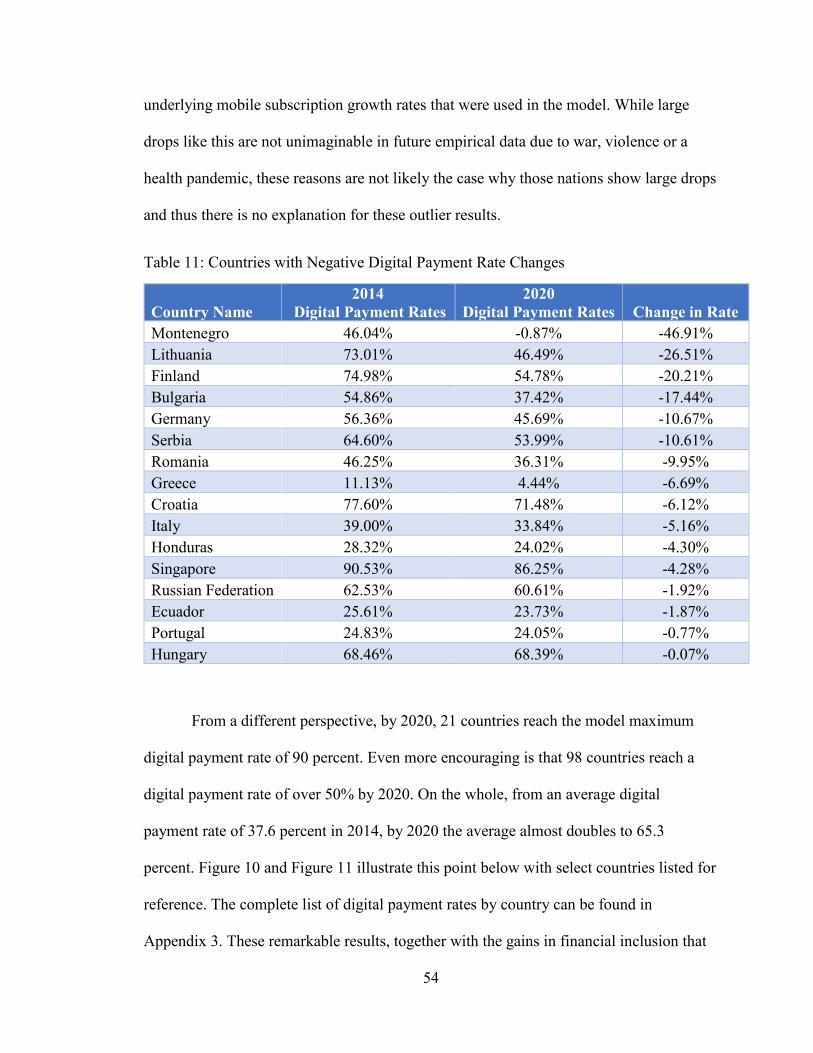
54
underlying mobile subscription growth rates that were used in the model. While large
drops like this are not unimaginable in future empirical data due to war, violence or a
health pandemic, these reasons are not likely the case why those nations show large drops
and thus there is no explanation for these outlier results.
Table 11: Countries with Negative Digital Payment Rate Changes
Country Name
2014
Digital Payment Rates
2020
Digital Payment Rates Change in Rate
Montenegro 46.04% -0.87% -46.91%
Lithuania 73.01% 46.49% -26.51%
Finland 74.98% 54.78% -20.21%
Bulgaria 54.86% 37.42% -17.44%
Germany 56.36% 45.69% -10.67%
Serbia 64.60% 53.99% -10.61%
Romania 46.25% 36.31% -9.95%
Greece 11.13% 4.44% -6.69%
Croatia 77.60% 71.48% -6.12%
Italy 39.00% 33.84% -5.16%
Honduras 28.32% 24.02% -4.30%
Singapore 90.53% 86.25% -4.28%
Russian Federation 62.53% 60.61% -1.92%
Ecuador 25.61% 23.73% -1.87%
Portugal 24.83% 24.05% -0.77%
Hungary 68.46% 68.39% -0.07%
From a different perspective, by 2020, 21 countries reach the model maximum
digital payment rate of 90 percent. Even more encouraging is that 98 countries reach a
digital payment rate of over 50% by 2020. On the whole, from an average digital
payment rate of 37.6 percent in 2014, by 2020 the average almost doubles to 65.3
percent. Figure 10 and Figure 11 illustrate this point below with select countries listed for
reference. The complete list of digital payment rates by country can be found in
Appendix 3. These remarkable results, together with the gains in financial inclusion that
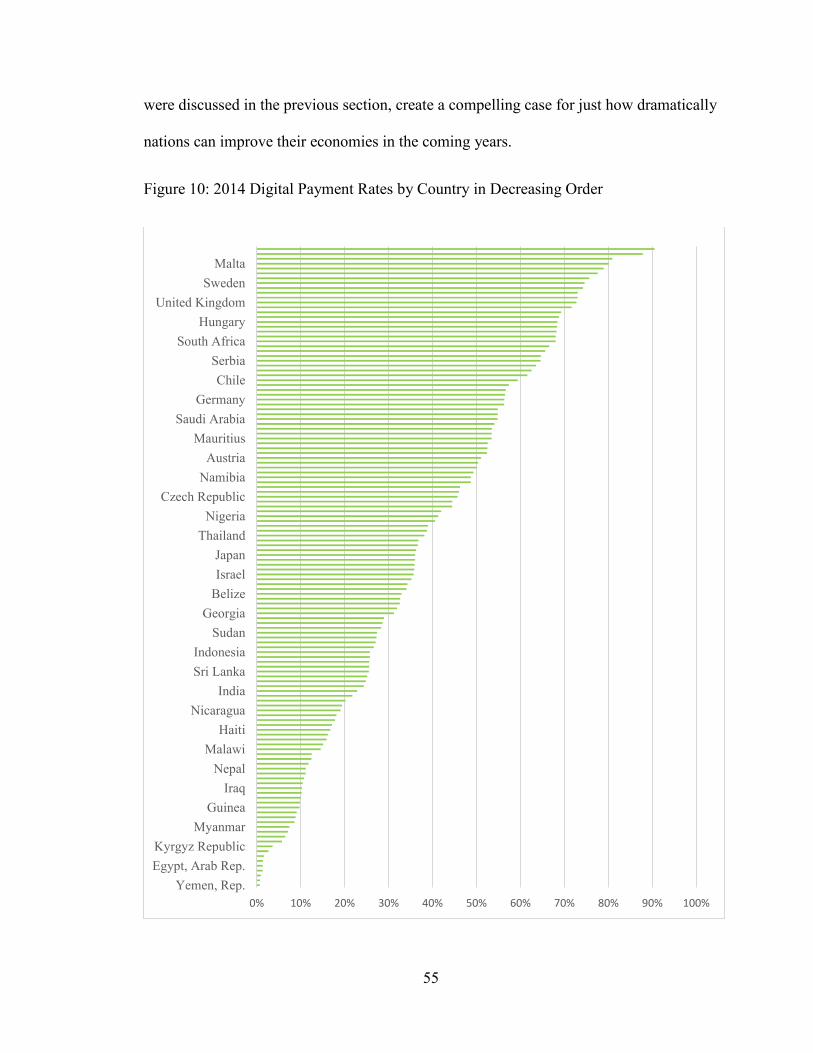
55
were discussed in the previous section, create a compelling case for just how dramatically
nations can improve their economies in the coming years.
Figure 10: 2014 Digital Payment Rates by Country in Decreasing Order
0% 10% 20% 30% 40% 50% 60% 70% 80% 90% 100%
Yemen, Rep.
Egypt, Arab Rep.
Kyrgyz Republic
Myanmar
Guinea
Iraq
Nepal
Malawi
Haiti
Nicaragua
India
Sri Lanka
Indonesia
Sudan
Georgia
Belize
Israel
Japan
Thailand
Nigeria
Czech Republic
Namibia
Austria
Mauritius
Saudi Arabia
Germany
Chile
Serbia
South Africa
Hungary
United Kingdom
Sweden
Malta
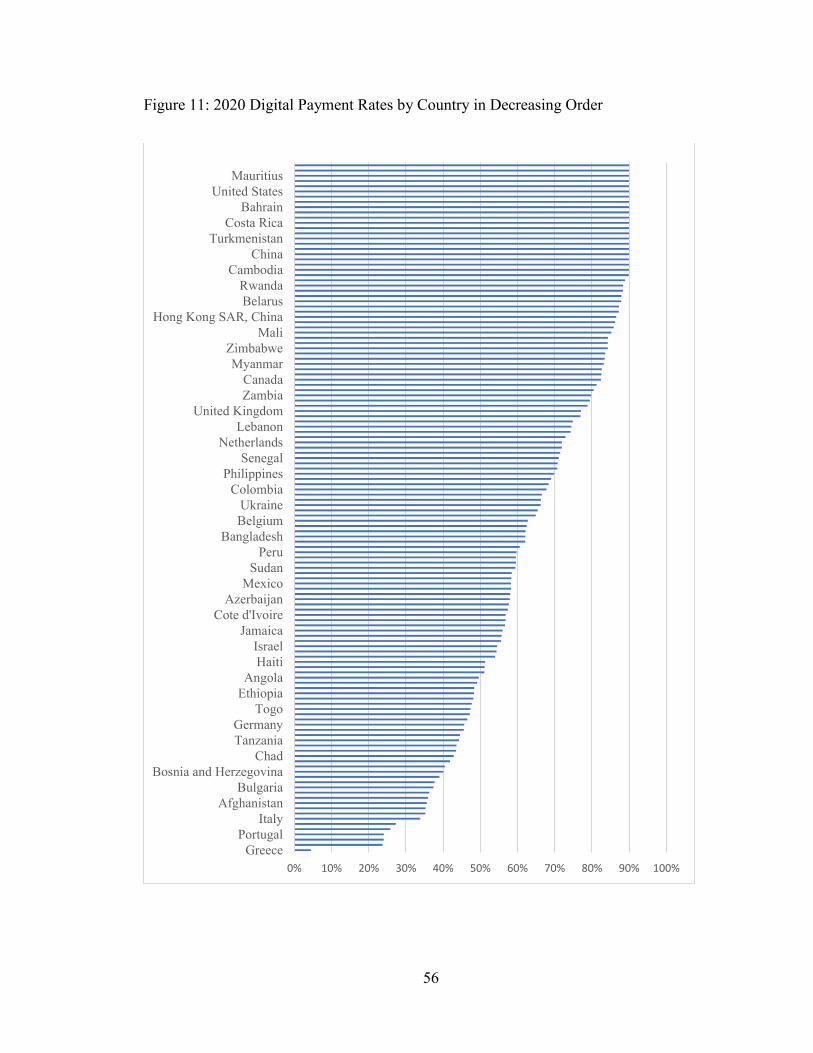
56
Figure 11: 2020 Digital Payment Rates by Country in Decreasing Order
0% 10% 20% 30% 40% 50% 60% 70% 80% 90% 100%
Greece
Portugal
Italy
Afghanistan
Bulgaria
Bosnia and Herzegovina
Chad
Tanzania
Germany
Togo
Ethiopia
Angola
Haiti
Israel
Jamaica
Cote d'Ivoire
Azerbaijan
Mexico
Sudan
Peru
Bangladesh
Belgium
Ukraine
Colombia
Philippines
Senegal
Netherlands
Lebanon
United Kingdom
Zambia
Canada
Myanmar
Zimbabwe
Mali
Hong Kong SAR, China
Belarus
Rwanda
Cambodia
China
Turkmenistan
Costa Rica
Bahrain
United States
Mauritius
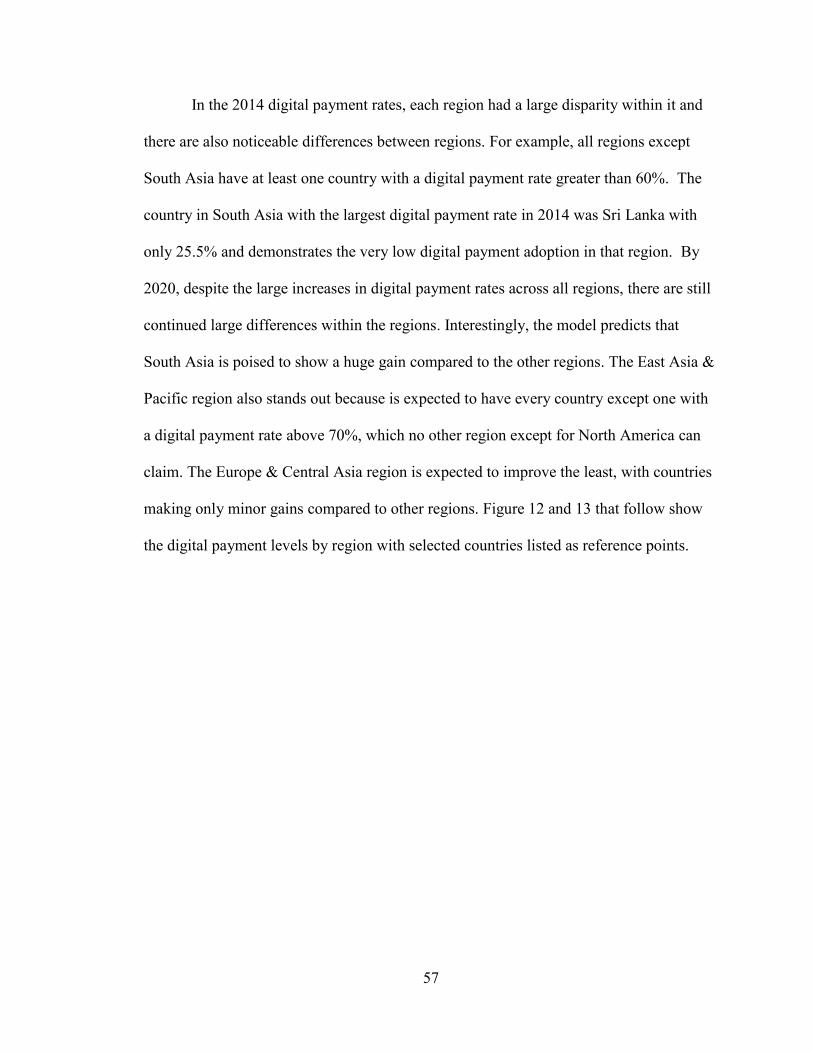
57
In the 2014 digital payment rates, each region had a large disparity within it and
there are also noticeable differences between regions. For example, all regions except
South Asia have at least one country with a digital payment rate greater than 60%. The
country in South Asia with the largest digital payment rate in 2014 was Sri Lanka with
only 25.5% and demonstrates the very low digital payment adoption in that region. By
2020, despite the large increases in digital payment rates across all regions, there are still
continued large differences within the regions. Interestingly, the model predicts that
South Asia is poised to show a huge gain compared to the other regions. The East Asia &
Pacific region also stands out because is expected to have every country except one with
a digital payment rate above 70%, which no other region except for North America can
claim. The Europe & Central Asia region is expected to improve the least, with countries
making only minor gains compared to other regions. Figure 12 and 13 that follow show
the digital payment levels by region with selected countries listed as reference points.
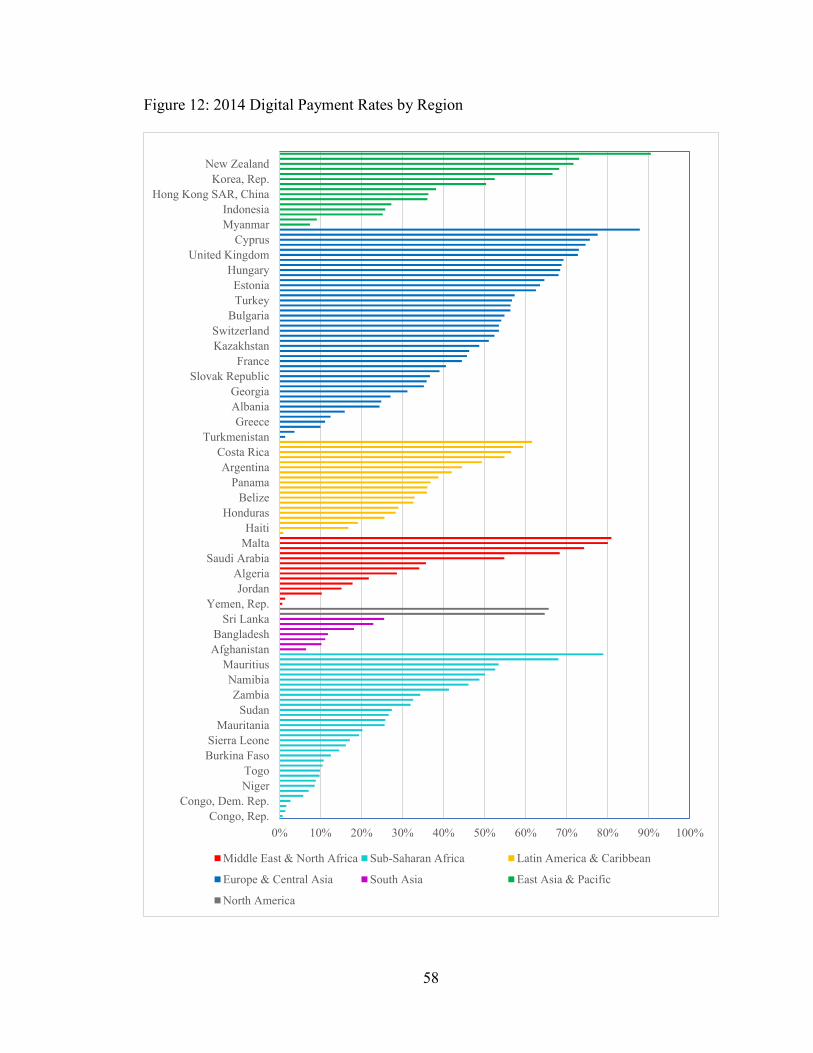
58
Figure 12: 2014 Digital Payment Rates by Region
0% 10% 20% 30% 40% 50% 60% 70% 80% 90% 100%
Congo, Rep.
Congo, Dem. Rep.
Niger
Togo
Burkina Faso
Sierra Leone
Mauritania
Sudan
Zambia
Namibia
Mauritius
Afghanistan
Bangladesh
Sri Lanka
Yemen, Rep.
Jordan
Algeria
Saudi Arabia
Malta
Haiti
Honduras
Belize
Panama
Argentina
Costa Rica
Turkmenistan
Greece
Albania
Georgia
Slovak Republic
France
Kazakhstan
Switzerland
Bulgaria
Turkey
Estonia
Hungary
United Kingdom
Cyprus
Myanmar
Indonesia
Hong Kong SAR, China
Korea, Rep.
New Zealand
Middle East & North Africa Sub-Saharan Africa Latin America & Caribbean
Europe & Central Asia South Asia East Asia & Pacific
North America
59
Figure 13: 2020 Digital Payment Rates by Region
0.0% 10.0% 20.0% 30.0% 40.0% 50.0% 60.0% 70.0% 80.0% 90.0% 100.0%
MadagascarNiger
TanzaniaCameroon
BeninMauritania
Burkina FasoNamibiaNigeria
RwandaMauritius
PakistanSri Lanka
NepalYemen, Rep.
IraqTunisiaJordanMalta
HondurasDominican Republic
JamaicaPeru
ColombiaChile
GreeceRomaniaGermanySlovenia
TajikistanSpain
UzbekistanSlovak Republic
UkraineTurkey
NetherlandsUnited Kingdom
CyprusTurkmenistan
VietnamKorea, Rep.
SingaporeCambodia
China
Middle East & North Africa Sub-Saharan Africa Latin America & Caribbean
Europe & Central Asia South Asia East Asia & Pacific
North America
60
To this point, we have shown the gains in financial inclusion by country which
will result in a large number of people gaining a transactional account that allows them to
start engaging with the formal economy. As mentioned previously, just having an account
or using it to continue to operate on a cash basis that leaves no trace of their contributions
to the economy is essentially worthless to government revenue. Digital payments offer a
solution in capturing the income and expenditure transactions that occur in the economy.
On our journey to determine the impact of financially inclusion and digital payments on
individual tax revenues, our next stop is the analysis of average incomes around the
world.
The income of those that become financially included is a critical factor in
understanding how much tax revenue governments can collect. The amount of income
captured by the formal economy represents the culmination of numerous factors. First is
the number of people that are brought into the economy as a result of financial inclusion.
Second, of the income each of these people earn, there will be a fraction that they transact
through digital payments, which is the amount that can be considered as going through
formal channels. Third, as economies grow over time, so will the incomes of the newly
financially included. Forth, digital payment rates also grow concurrently thereby
multiplying gains. Fifth, year after year, the collective impact of the newly financially
included grows exponentially. Together, these elements combine to create phenomenal
growth and economic gains. The total annual worldwide captured income is shown in
Figure 14, segmented by the contributions of each year’s financially included cohort.
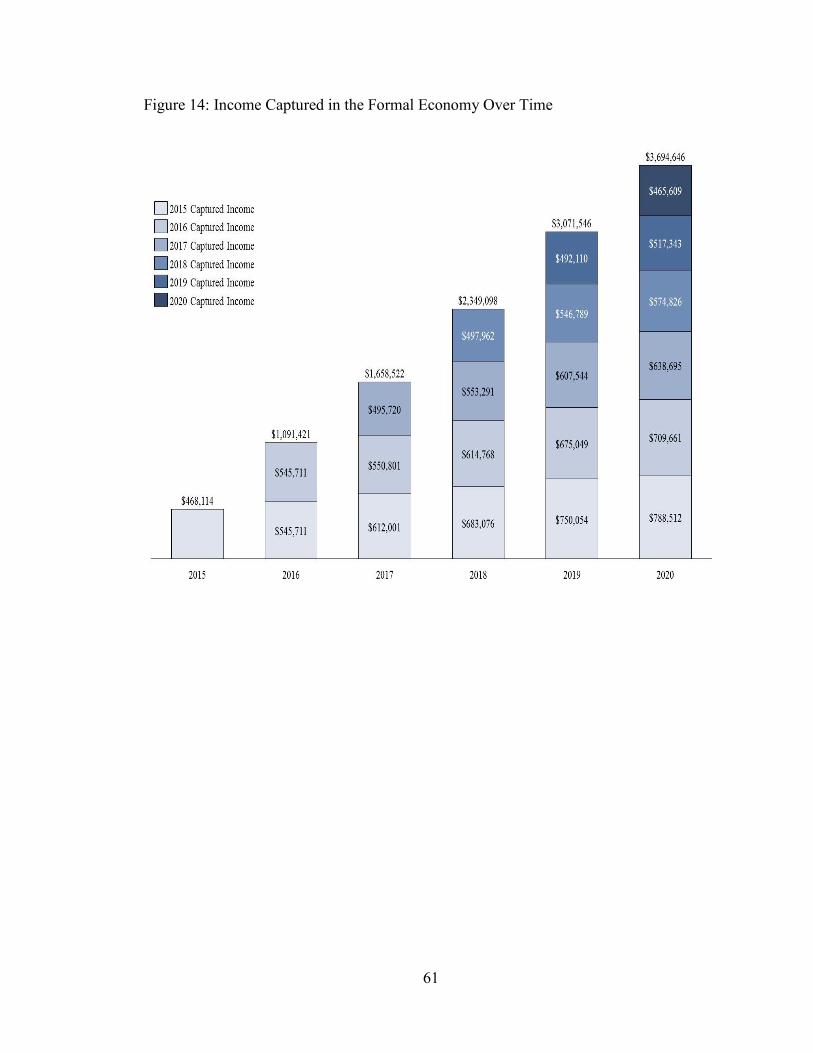
61
Figure 14: Income Captured in the Formal Economy Over Time
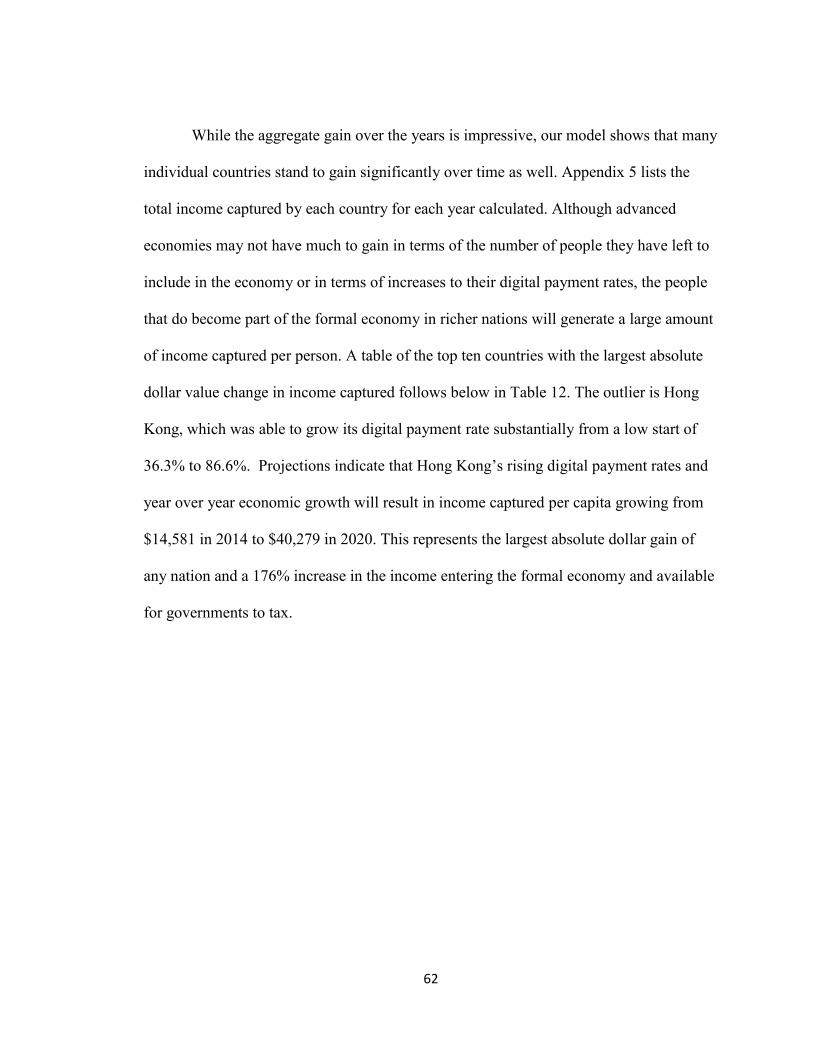
62
While the aggregate gain over the years is impressive, our model shows that many
individual countries stand to gain significantly over time as well. Appendix 5 lists the
total income captured by each country for each year calculated. Although advanced
economies may not have much to gain in terms of the number of people they have left to
include in the economy or in terms of increases to their digital payment rates, the people
that do become part of the formal economy in richer nations will generate a large amount
of income captured per person. A table of the top ten countries with the largest absolute
dollar value change in income captured follows below in Table 12. The outlier is Hong
Kong, which was able to grow its digital payment rate substantially from a low start of
36.3% to 86.6%. Projections indicate that Hong Kong’s rising digital payment rates and
year over year economic growth will result in income captured per capita growing from
$14,581 in 2014 to $40,279 in 2020. This represents the largest absolute dollar gain of
any nation and a 176% increase in the income entering the formal economy and available
for governments to tax.
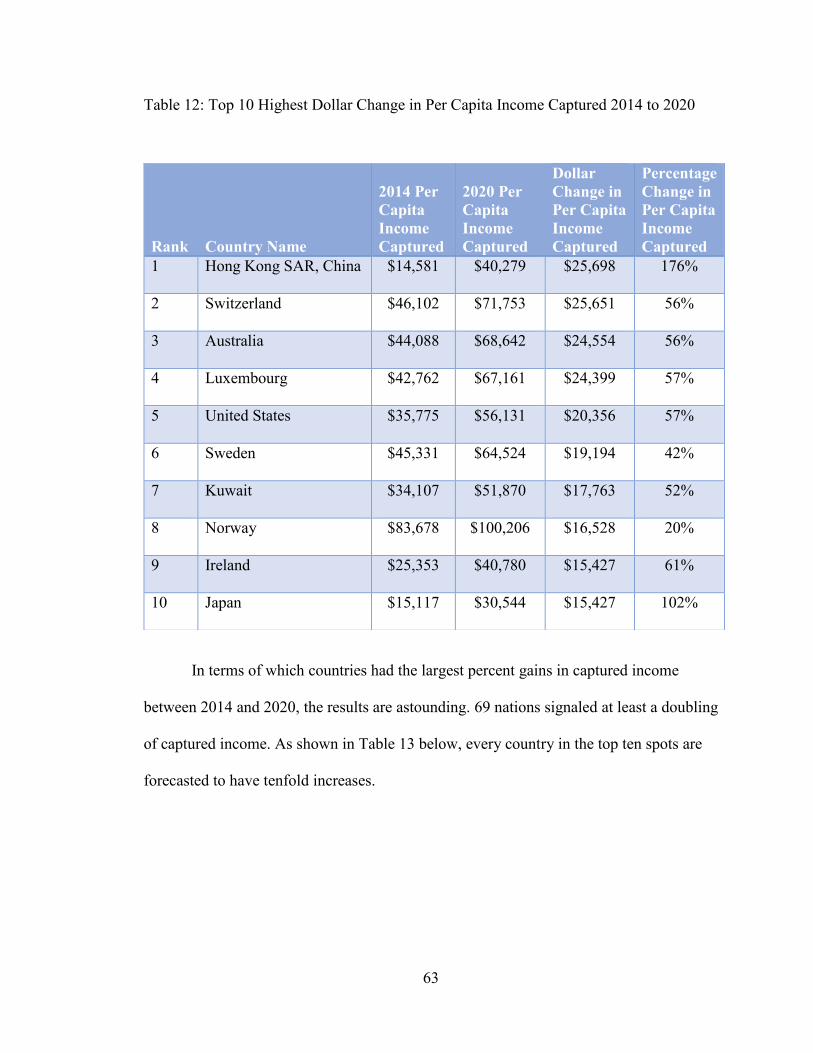
63
Table 12: Top 10 Highest Dollar Change in Per Capita Income Captured 2014 to 2020
In terms of which countries had the largest percent gains in captured income
between 2014 and 2020, the results are astounding. 69 nations signaled at least a doubling
of captured income. As shown in Table 13 below, every country in the top ten spots are
forecasted to have tenfold increases.
Rank Country Name
2014 Per
Capita
Income
Captured
2020 Per
Capita
Income
Captured
Dollar
Change in
Per Capita
Income
Captured
Percentage
Change in
Per Capita
Income
Captured
1 Hong Kong SAR, China $14,581 $40,279 $25,698 176%
2 Switzerland $46,102 $71,753 $25,651 56%
3 Australia $44,088 $68,642 $24,554 56%
4 Luxembourg $42,762 $67,161 $24,399 57%
5 United States $35,775 $56,131 $20,356 57%
6 Sweden $45,331 $64,524 $19,194 42%
7 Kuwait $34,107 $51,870 $17,763 52%
8 Norway $83,678 $100,206 $16,528 20%
9 Ireland $25,353 $40,780 $15,427 61%
10 Japan $15,117 $30,544 $15,427 102%
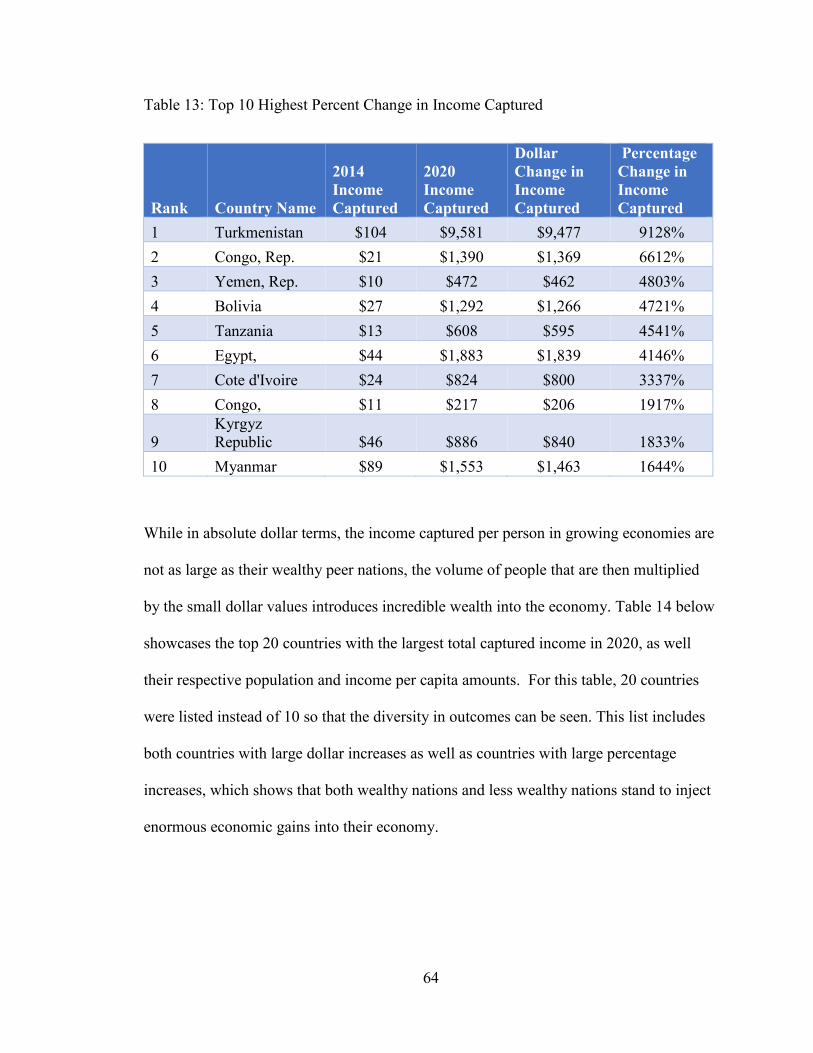
64
Table 13: Top 10 Highest Percent Change in Income Captured
Rank Country Name
2014
Income
Captured
2020
Income
Captured
Dollar
Change in
Income
Captured
Percentage
Change in
Income
Captured
1 Turkmenistan $104 $9,581 $9,477 9128%
2 Congo, Rep. $21 $1,390 $1,369 6612%
3 Yemen, Rep. $10 $472 $462 4803%
4 Bolivia $27 $1,292 $1,266 4721%
5 Tanzania $13 $608 $595 4541%
6 Egypt, $44 $1,883 $1,839 4146%
7 Cote d'Ivoire $24 $824 $800 3337%
8 Congo, $11 $217 $206 1917%
9
Kyrgyz
Republic $46 $886 $840 1833%
10 Myanmar $89 $1,553 $1,463 1644%
While in absolute dollar terms, the income captured per person in growing economies are
not as large as their wealthy peer nations, the volume of people that are then multiplied
by the small dollar values introduces incredible wealth into the economy. Table 14 below
showcases the top 20 countries with the largest total captured income in 2020, as well
their respective population and income per capita amounts. For this table, 20 countries
were listed instead of 10 so that the diversity in outcomes can be seen. This list includes
both countries with large dollar increases as well as countries with large percentage
increases, which shows that both wealthy nations and less wealthy nations stand to inject
enormous economic gains into their economy.
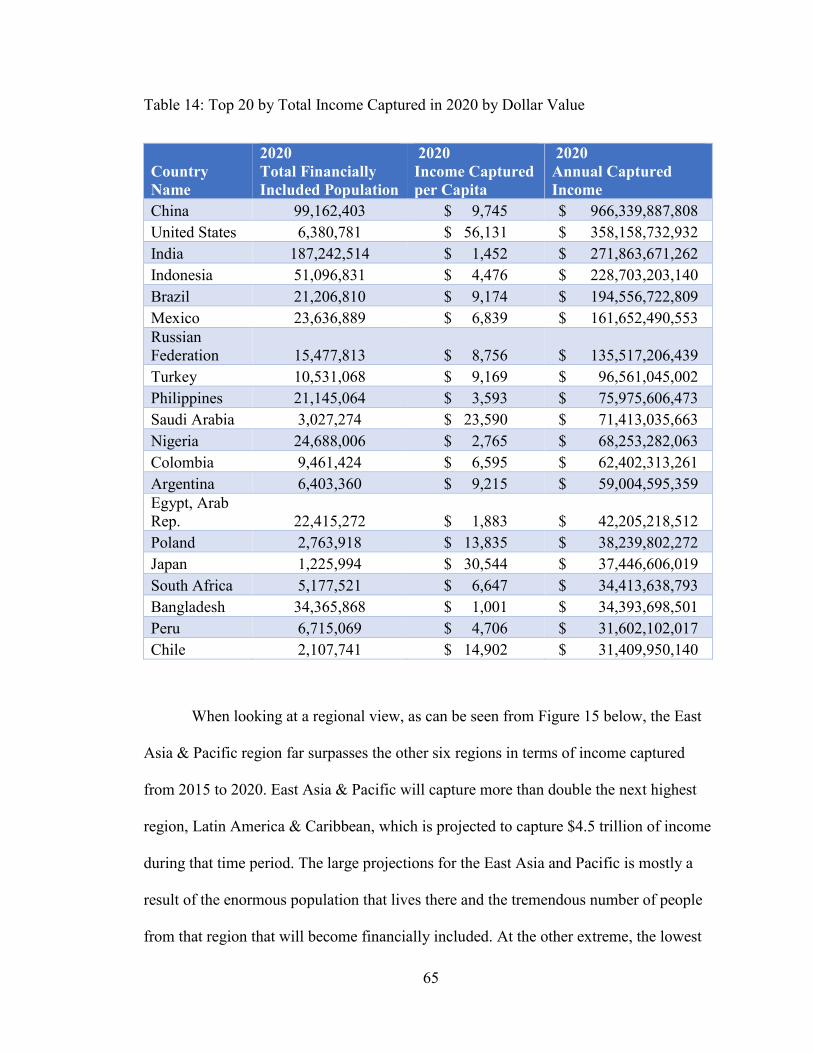
65
Table 14: Top 20 by Total Income Captured in 2020 by Dollar Value
Country
Name
2020
Total Financially
Included Population
2020
Income Captured
per Capita
2020
Annual Captured
Income
China 99,162,403 $ 9,745 $ 966,339,887,808
United States 6,380,781 $ 56,131 $ 358,158,732,932
India 187,242,514 $ 1,452 $ 271,863,671,262
Indonesia 51,096,831 $ 4,476 $ 228,703,203,140
Brazil 21,206,810 $ 9,174 $ 194,556,722,809
Mexico 23,636,889 $ 6,839 $ 161,652,490,553
Russian
Federation 15,477,813 $ 8,756 $ 135,517,206,439
Turkey 10,531,068 $ 9,169 $ 96,561,045,002
Philippines 21,145,064 $ 3,593 $ 75,975,606,473
Saudi Arabia 3,027,274 $ 23,590 $ 71,413,035,663
Nigeria 24,688,006 $ 2,765 $ 68,253,282,063
Colombia 9,461,424 $ 6,595 $ 62,402,313,261
Argentina 6,403,360 $ 9,215 $ 59,004,595,359
Egypt, Arab
Rep. 22,415,272 $ 1,883 $ 42,205,218,512
Poland 2,763,918 $ 13,835 $ 38,239,802,272
Japan 1,225,994 $ 30,544 $ 37,446,606,019
South Africa 5,177,521 $ 6,647 $ 34,413,638,793
Bangladesh 34,365,868 $ 1,001 $ 34,393,698,501
Peru 6,715,069 $ 4,706 $ 31,602,102,017
Chile 2,107,741 $ 14,902 $ 31,409,950,140
When looking at a regional view, as can be seen from Figure 15 below, the East
Asia & Pacific region far surpasses the other six regions in terms of income captured
from 2015 to 2020. East Asia & Pacific will capture more than double the next highest
region, Latin America & Caribbean, which is projected to capture $4.5 trillion of income
during that time period. The large projections for the East Asia and Pacific is mostly a
result of the enormous population that lives there and the tremendous number of people
from that region that will become financially included. At the other extreme, the lowest
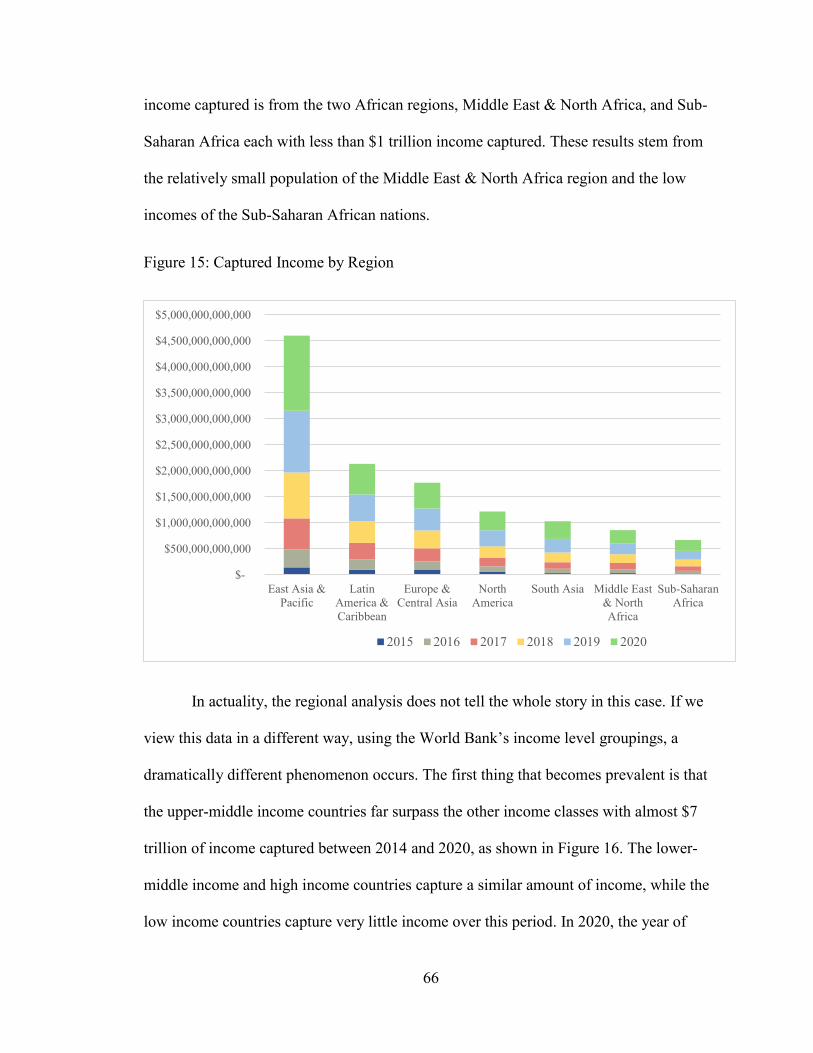
66
income captured is from the two African regions, Middle East & North Africa, and Sub-
Saharan Africa each with less than $1 trillion income captured. These results stem from
the relatively small population of the Middle East & North Africa region and the low
incomes of the Sub-Saharan African nations.
Figure 15: Captured Income by Region
In actuality, the regional analysis does not tell the whole story in this case. If we
view this data in a different way, using the World Bank’s income level groupings, a
dramatically different phenomenon occurs. The first thing that becomes prevalent is that
the upper-middle income countries far surpass the other income classes with almost $7
trillion of income captured between 2014 and 2020, as shown in Figure 16. The lower-
middle income and high income countries capture a similar amount of income, while the
low income countries capture very little income over this period. In 2020, the year of
$-
$500,000,000,000
$1,000,000,000,000
$1,500,000,000,000
$2,000,000,000,000
$2,500,000,000,000
$3,000,000,000,000
$3,500,000,000,000
$4,000,000,000,000
$4,500,000,000,000
$5,000,000,000,000
East Asia &
Pacific
Latin
America &
Caribbean
Europe &
Central Asia
North
America
South Asia Middle East
& North
Africa
Sub-Saharan
Africa
2015 2016 2017 2018 2019 2020
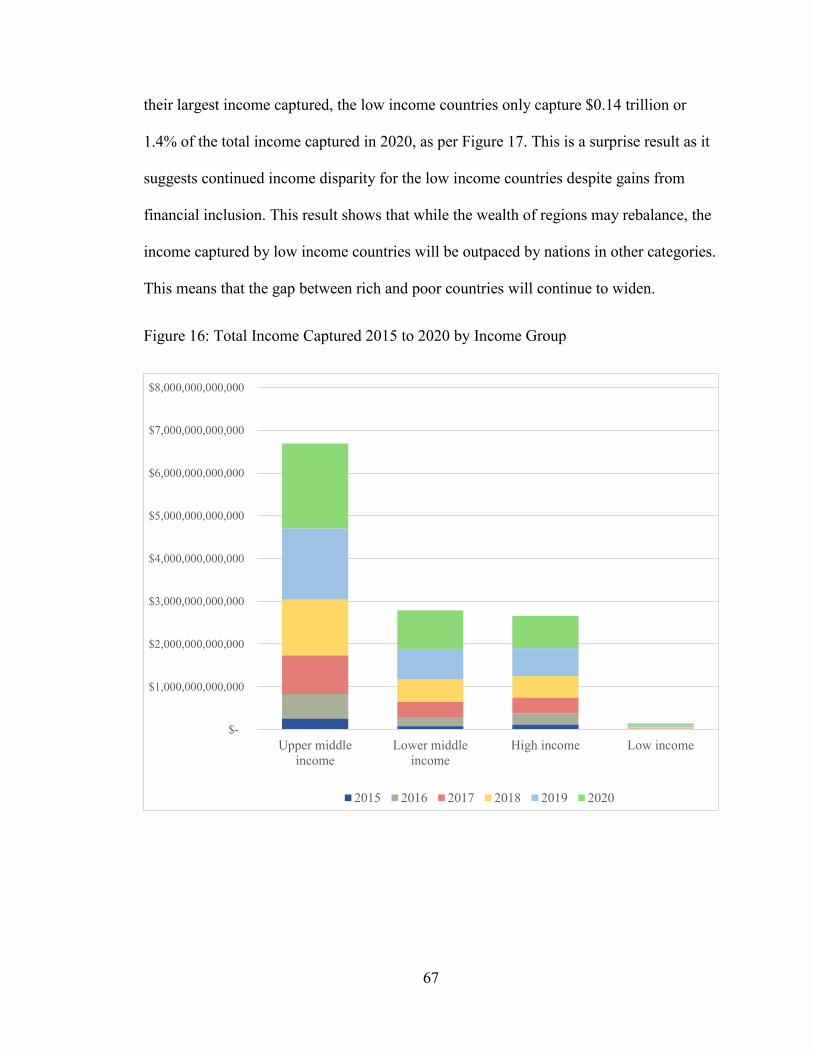
67
their largest income captured, the low income countries only capture $0.14 trillion or
1.4% of the total income captured in 2020, as per Figure 17. This is a surprise result as it
suggests continued income disparity for the low income countries despite gains from
financial inclusion. This result shows that while the wealth of regions may rebalance, the
income captured by low income countries will be outpaced by nations in other categories.
This means that the gap between rich and poor countries will continue to widen.
Figure 16: Total Income Captured 2015 to 2020 by Income Group
$-
$1,000,000,000,000
$2,000,000,000,000
$3,000,000,000,000
$4,000,000,000,000
$5,000,000,000,000
$6,000,000,000,000
$7,000,000,000,000
$8,000,000,000,000
Upper middle
income
Lower middle
income
High income Low income
2015 2016 2017 2018 2019 2020
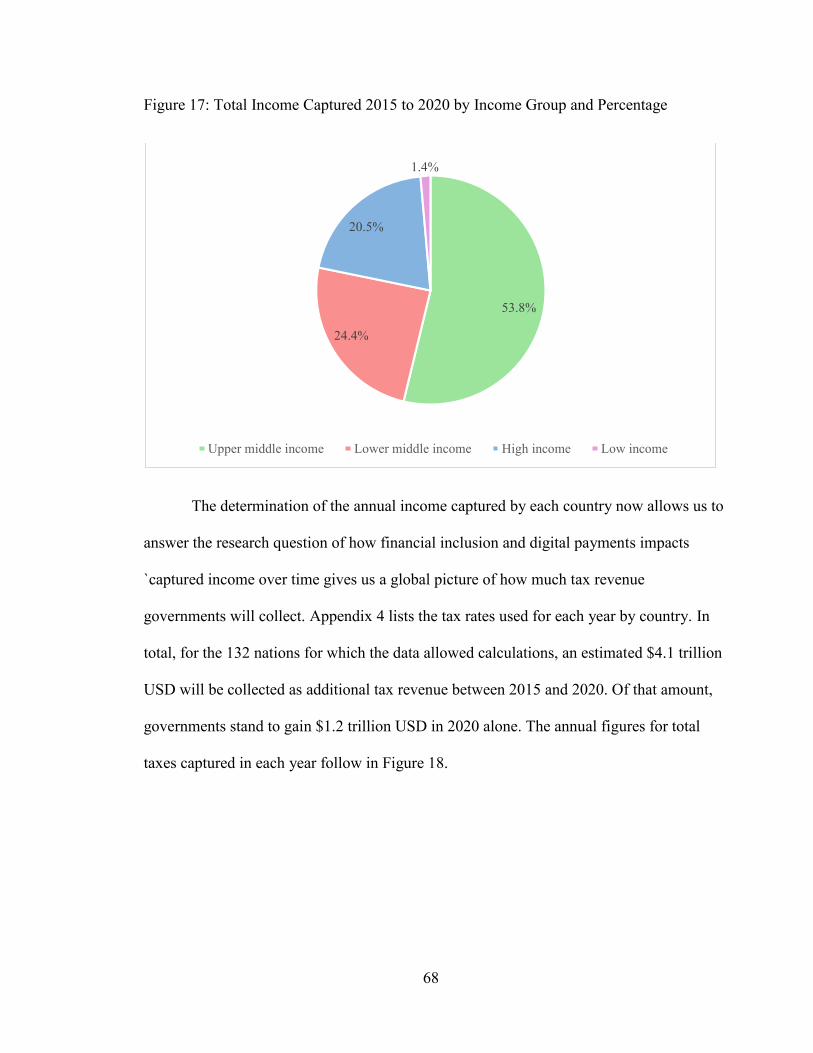
68
Figure 17: Total Income Captured 2015 to 2020 by Income Group and Percentage
The determination of the annual income captured by each country now allows us to
answer the research question of how financial inclusion and digital payments impacts
`captured income over time gives us a global picture of how much tax revenue
governments will collect. Appendix 4 lists the tax rates used for each year by country. In
total, for the 132 nations for which the data allowed calculations, an estimated $4.1 trillion
USD will be collected as additional tax revenue between 2015 and 2020. Of that amount,
governments stand to gain $1.2 trillion USD in 2020 alone. The annual figures for total
taxes captured in each year follow in Figure 18.
53.8%
24.4%
20.5%
1.4%
Upper middle income Lower middle income High income Low income

69
Figure 18: Total Annual Taxes Captured in Billions of Dollars USD
Of the countries in the sample, the governments of China and the United States
will be the largest dollar value gainers by 2020 with forecasts estimating additional tax
revenue just from newly financially included people of $435 million and $142 million,
respectively. Interestingly, the United States is the only developed nation among the top
ten, while the remaining nine nations are developing economies that are forecasted to
capture a windfall of taxes. The United States has a large increase tax revenue due to the
high average income per person in the nation, combined with the higher than average tax
rate of 40% as shown below in Table 15. Appendix 6 lists each country’s total additional
tax revenue from newly financially included individuals.
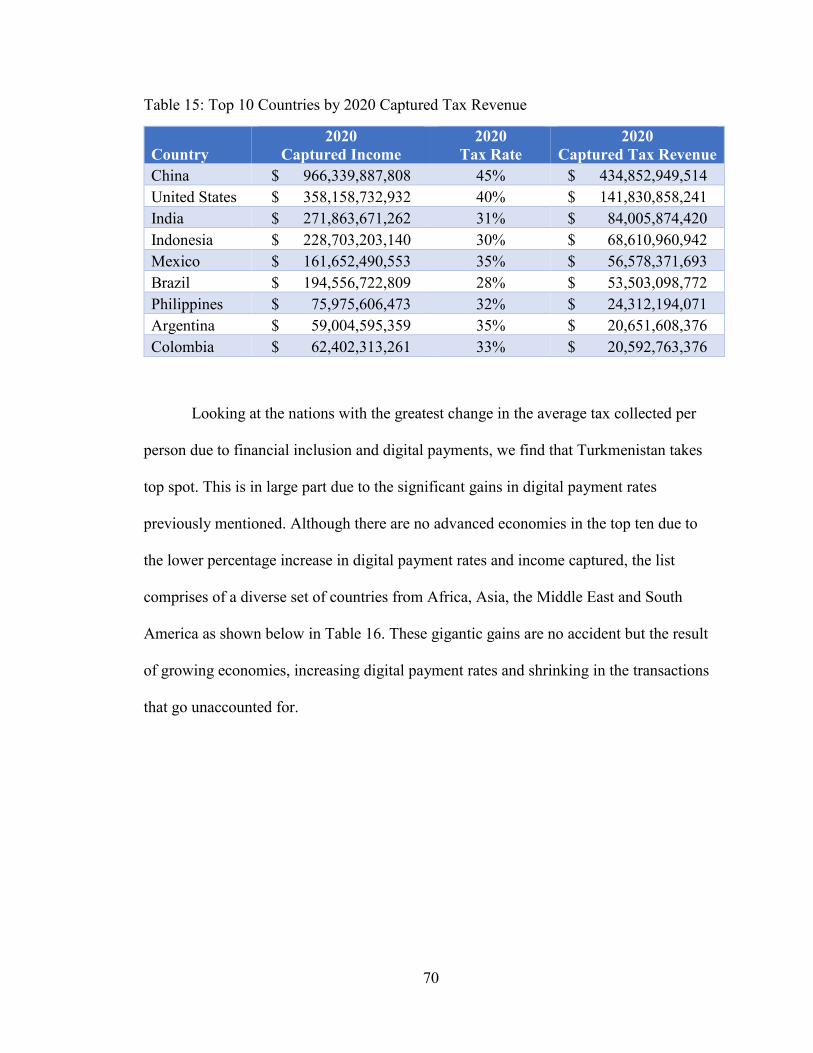
70
Table 15: Top 10 Countries by 2020 Captured Tax Revenue
Country
2020
Captured Income
2020
Tax Rate
2020
Captured Tax Revenue
China $ 966,339,887,808 45% $ 434,852,949,514
United States $ 358,158,732,932 40% $ 141,830,858,241
India $ 271,863,671,262 31% $ 84,005,874,420
Indonesia $ 228,703,203,140 30% $ 68,610,960,942
Mexico $ 161,652,490,553 35% $ 56,578,371,693
Brazil $ 194,556,722,809 28% $ 53,503,098,772
Philippines $ 75,975,606,473 32% $ 24,312,194,071
Argentina $ 59,004,595,359 35% $ 20,651,608,376
Colombia $ 62,402,313,261 33% $ 20,592,763,376
Looking at the nations with the greatest change in the average tax collected per
person due to financial inclusion and digital payments, we find that Turkmenistan takes
top spot. This is in large part due to the significant gains in digital payment rates
previously mentioned. Although there are no advanced economies in the top ten due to
the lower percentage increase in digital payment rates and income captured, the list
comprises of a diverse set of countries from Africa, Asia, the Middle East and South
America as shown below in Table 16. These gigantic gains are no accident but the result
of growing economies, increasing digital payment rates and shrinking in the transactions
that go unaccounted for.
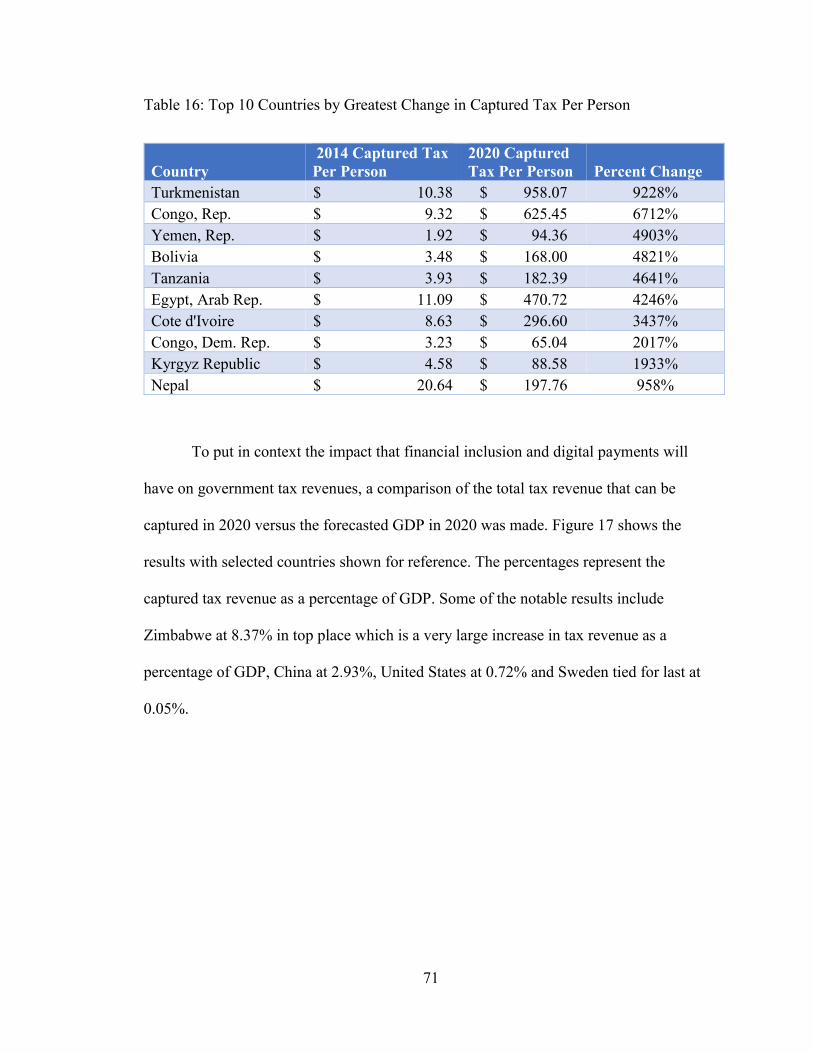
71
Table 16: Top 10 Countries by Greatest Change in Captured Tax Per Person
Country
2014 Captured Tax
Per Person
2020 Captured
Tax Per Person Percent Change
Turkmenistan $ 10.38 $ 958.07 9228%
Congo, Rep. $ 9.32 $ 625.45 6712%
Yemen, Rep. $ 1.92 $ 94.36 4903%
Bolivia $ 3.48 $ 168.00 4821%
Tanzania $ 3.93 $ 182.39 4641%
Egypt, Arab Rep. $ 11.09 $ 470.72 4246%
Cote d'Ivoire $ 8.63 $ 296.60 3437%
Congo, Dem. Rep. $ 3.23 $ 65.04 2017%
Kyrgyz Republic $ 4.58 $ 88.58 1933%
Nepal $ 20.64 $ 197.76 958%
To put in context the impact that financial inclusion and digital payments will
have on government tax revenues, a comparison of the total tax revenue that can be
captured in 2020 versus the forecasted GDP in 2020 was made. Figure 17 shows the
results with selected countries shown for reference. The percentages represent the
captured tax revenue as a percentage of GDP. Some of the notable results include
Zimbabwe at 8.37% in top place which is a very large increase in tax revenue as a
percentage of GDP, China at 2.93%, United States at 0.72% and Sweden tied for last at
0.05%.
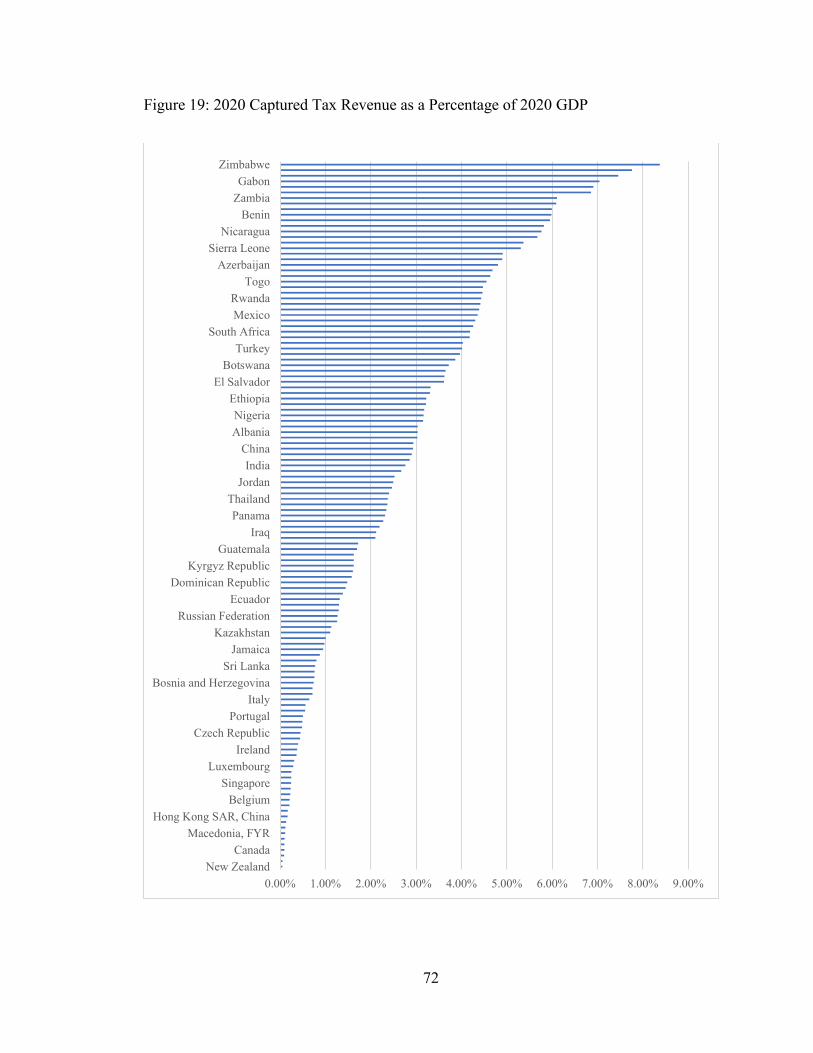
72
Figure 19: 2020 Captured Tax Revenue as a Percentage of 2020 GDP
0.00% 1.00% 2.00% 3.00% 4.00% 5.00% 6.00% 7.00% 8.00% 9.00%
New Zealand
Canada
Macedonia, FYR
Hong Kong SAR, China
Belgium
Singapore
Luxembourg
Ireland
Czech Republic
Portugal
Italy
Bosnia and Herzegovina
Sri Lanka
Jamaica
Kazakhstan
Russian Federation
Ecuador
Dominican Republic
Kyrgyz Republic
Guatemala
Iraq
Panama
Thailand
Jordan
India
China
Albania
Nigeria
Ethiopia
El Salvador
Botswana
Turkey
South Africa
Mexico
Rwanda
Togo
Azerbaijan
Sierra Leone
Nicaragua
Benin
Zambia
Gabon
Zimbabwe
73
In general, the tax revenue by region graph below mirrors the income captured by
region graph previously showed, with a few exceptions. The countries in Europe &
Central Asia get slightly less tax revenue than the North American countries despite
having higher income captured due to the slightly lower tax rates in those countries. Also,
the Middle East & North Africa countries will receive about half the tax revenue that the
Sub-Saharan Africa countries will get despite having almost $200 billion more in income
captured due to the low to no tax rates in some of those countries. The details by year
follow in Figure 20.
The analysis that was done in this section showed a number of interesting results
including that approximately 50% of the financially included individuals over the next 5
years will come from only 10 countries, the gains resulting from financial inclusion will
decrease over time and while income captured from financial inclusion will affect both
developed and developing countries, low income countries will capture a marginal
amount of this increase in income. This section also answered the research question and
determined that $4.1 trillion of tax revenue would be gained as a result of financial
inclusion. China will have the largest dollar value gain, and Turkmenistan will have the
largest percentage increase. However, in the pursuit of the research question, a number of
opportunities for future research were identified and various key insights were gained.
The opportunities for future research are discussed in the next section and the key
insights are summarized in the section that follows.
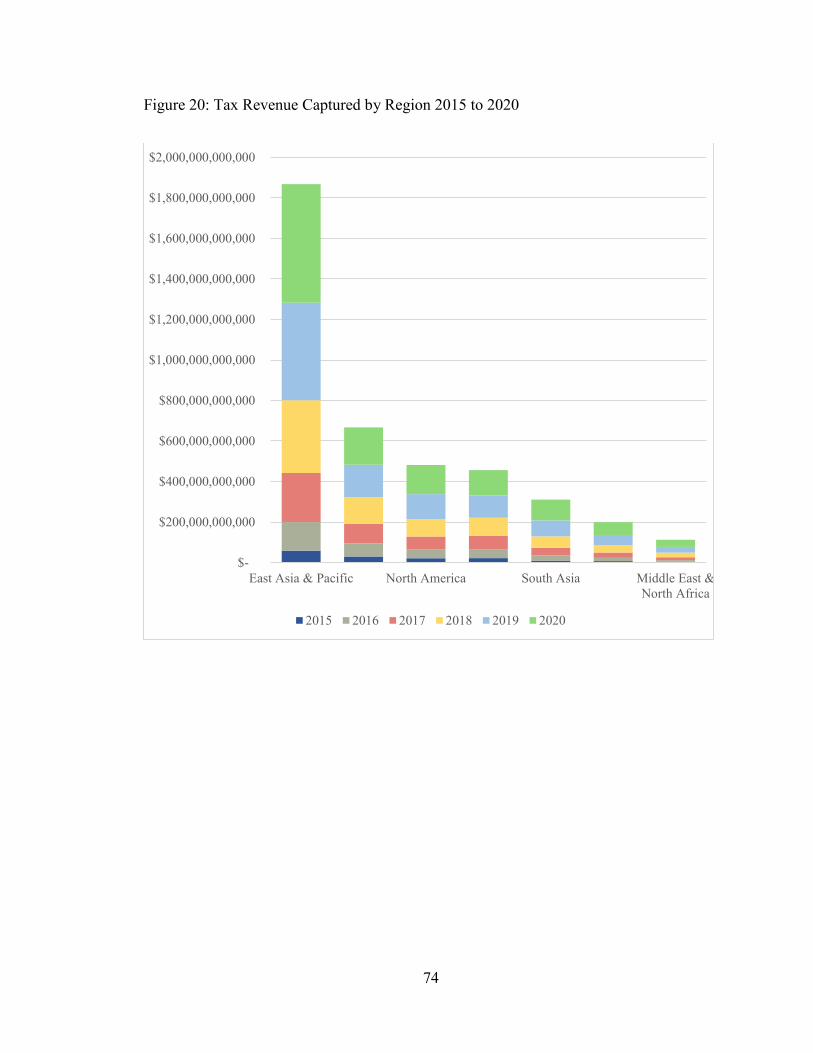
74
Figure 20: Tax Revenue Captured by Region 2015 to 2020
$-
$200,000,000,000
$400,000,000,000
$600,000,000,000
$800,000,000,000
$1,000,000,000,000
$1,200,000,000,000
$1,400,000,000,000
$1,600,000,000,000
$1,800,000,000,000
$2,000,000,000,000
East Asia & Pacific North America South Asia Middle East &
North Africa
2015 2016 2017 2018 2019 2020
75
Opportunities for Future Research
In seeking an answer to the research question, it was also the hope of this study to
inspire governments and those working in the fields of financial inclusion and digital
payments by what is possible in a few short years. However, before concluding this
paper, it is important to note the various opportunities for future research that arose as a
result of this research.
One of the greatest challenges of this study was in gathering accurate and reliable
data from around the world. There are still a number of countries that do not have a full
complement of data to perform the analysis. While this is partly due to the evolving
technical infrastructure in many nations, the fact that so many people are outside the
formal economy and therefore data is unavailable for them restricts research and studies
about those countries. Therefore, one suggested area for further research is for detailed
income statistics for all countries since datasets such as median income or income by
quintile for every country was difficult to come by.
Given the large amount of revenue that governments stand to gain as a result of
financial inclusion, another area for further research is on how governments should
manage and invest those funds. Research into the most effective uses of additional tax
revenue could further accelerate economic gains while limiting the effects of corruption
and leakage when revenue reaches the governments. Tax policy, which was assumed to
stay constant from 2017 to 2020 in this study, also plays a role in the amount of taxes
people are willing to pay and thus the amounts that governments collect. With some
nations forecasted to gain multiples of their current tax revenue, further research into the
76
best practices for tax policy and budgeting, especially geared towards developing
countries, will be invaluable to prevent over taxation and inefficient management.
Opportunities for further research also exist in areas that were outside the scope of
this study. The effect of financial inclusion on the shadow economy and government
leakages would certainly lead to interesting data and actionable insights. Another
recommendation for research is into the impact of financial inclusion and digital
payments on business tax revenue. The calculation of the impact on business tax revenue
can follow a similar methodology as this study and the results could be combined to gain
a fuller picture of additional tax revenue governments can expect. Finally, additional
research can also be done to build on this study, leverage its methodologies, revise its
forecasts and compare forecasts with actualized data as time passes.
Key Insights and Conclusion
In performing the research necessary to answer the question of how financial
inclusion and digital payments impact individual tax revenues, a number of key insights
were revealed. A summary of these key insights is below to emphasize this important
information and as a conclusion to this study.
The first key insight is that previous to 2011, there was no way to measure GDP
per capita using only the people that actually contribute towards it. However, now we can
calculate a more accurate number thanks to the data that is collected around financial
inclusion. By calculating the GDP per capita excluding the financially included
population, the findings suggest that while the change in GDP per capita for most
77
developed countries was not significantly different, the figures for the poorest nations
more than doubled.
Another key insight is that mobile phone technology will be a key enabler of
financial inclusion. This is because the large gap between the percent of people who own
a cell phone and those who do not have a bank account can quickly be closed using
mobile banking solutions. This in turn will cause many people to be financially included
while generating digital transactions that can be officially captured and taxed.
Nations with large populations of financially excluded people, low digital
payment usage rates or both have an opportunity to take advantage of the effects of
exponential compounding. As both these factors amplify exponential effects, investments
that fast track bringing people into the economy and increasing digital payment rates can
yield compounding effects that outgrow other nations over the long run.
The data also showed that the range in financial inclusion rates and digital
payment rates between the top most nations and the bottom will significantly shrink by
2020 as nations converge closer to the 100 percent maximum. Thus, as hundreds of
millions of people newly enter the global economy in developing countries, developed
nations will be subject to even more global competitive pressure and will need to find
alternative ways to sustain their growth. Moreover, while the benefits from financial
inclusion and digital payments may last for years, they will be exhausted at some point.
Thus, developing nations also cannot be complacent and will need to plan for this
eventuality.
78
In conclusion, financial inclusion and digital payments will have a large impact
on the world economy. While some nations will benefit more than others, adding people
into the formal economy has numerous positive economic benefits including growing
incomes and shrinking the shadow economy. Based on a cumulative $12 trillion of
income projected to be brought into the formal economy worldwide between 2014 and
2020, the answer to the research question of how financial inclusion and digital payments
would impact individual tax revenue was found to be an additional $4.1 trillion globally.
This represents a significant opportunity for governments around the globe to take note
of, and it is the hope of this study that the results will inspire them to materialize the
gains.
79
Bibliography
“About The Better Than Cash Alliance.” Better Than Cash Alliance, n.d.
https://www.betterthancash.org/about.
“Accelerators to an Inclusive Digital Payments Ecosystem.” Better Than Cash Alliance,
August 2016.
Carus, Carol. “Digital Financial Inclusion in Peru; A Promising Trend to Watch.” Center
for Financial Inclusion Blog, January 19, 2016. https://cfi-
blog.org/2016/01/19/digital-financial-inclusion-in-peru-a-promising-trend-to-
watch/.
Demirguc-Kunt, Asli, Leora Klapper, Dorothe Singer, and Peter Van Oudheusden. “The
Global Findex Database 2014 Measuring Financial Inclusion Around the World.”
The World Bank Group, n.d.
http://www.worldbank.org/en/programs/globalfindex.
Denecker, Olivier, Florent Istace, and Marc Niederkorn. “Forging a Path to Payment
Digitization.” McKinsey on Payments, March 2013.
Ehrbeck, Tilman, Rajiv Lochan, Naveen Tahliyani, and Adil Zainulbhai. “Inclusive
Growth and Financial Security.” McKinsey & Company, November 2010.
“Facts - E-Estonia,” 2017. https://e-estonia.com/facts/.
“Financial Inclusion Helping the Poor Manage and Grow.” Innovation for Poverty
Action, 2016. http://www.poverty-action.org/sites/default/files/publications/IPA-
Program-Area-Brief-Financial-Inclusion-Letter-Updated.pdf.
“Financial Inclusion Overview,” n.d.
http://www.worldbank.org/en/topic/financialinclusion/overview.
“How to Define Digital Payments?” Better Than Cash Alliance. Accessed February 12,
2017. https://www.betterthancash.org/tools-research/toolkits/payments-
measurement/focusing-your-measurement/introduction.
Klapper, Leora, Mayada El-Zoghbi, and Jake Hess. “Achieving the Sustainable
Development Goals.” Consultative Group to Assist the Poor, 2016.
http://www.cgap.org/sites/default/files/Working-Paper-Achieving-Sustainable-
Development-Goals-Apr-2016_0.pdf.
80
Manyika, James, Susan Lund, Olivia White, and Chris Berry. “Digital Finance for All:
Powering Inclusive Growth in Emerging Economies,.” McKinsey Global
Institute, September 2016. https://www.infine.lu/new-mckinsey-global-institute-
report-digital-finance-for-all-powering-inclusive-growth-in-emerging-economies-
september-2016/.
Miller, Terry, and Anthony Kim. “Index of Economic Freedom Data, Maps and Book
Chapters,” December 2016. http://www.heritage.org/index/download.
“Methodology 2017 Index of Economic Freedom Book,” December 2016.
http://www.heritage.org/index/book/methodology.
Pickens, Mark, David Porteous, and Sarah Rotman. “Banking the Poor via G2P
Payments.” Consultative Group to Assist the Poor, December 2009.
Pillai, Rashmi. “Person-to-Government Payments: Lessons From Tanzania’s Digitization
Efforts.” Better Than Cash Alliance, September 2016.
https://www.betterthancash.org/news/media-releases/new-united-nations-study-
digital-payments-could-boost-tax-revenue-by-nearly-us-500-million-each-year-
and-drive-economic-modernization-in-tanzania.
Rogoff, Kenneth. “Costs and Benefits to Phasing out Paper Currency,” 2014.
Schneider, Friedrich. “The Shadow Economy in Europe.” AT Kearney, 2013.
Schneider, Friedrich, Andreas Buehn, and Claudio E. Montenegro. “Shadow Economies
All over the World: New Estimates for 162 Countries from 1999 to 2007.” SSRN
Scholarly Paper. Rochester, NY: Social Science Research Network, June 1, 2010.
“The Law of Large Numbers,” n.d. http://www.math.uah.edu/stat/sample/LLN.html.
“Transforming Our World: The 2030 Agenda for Sustainable Development.” United
Nations, September 21, 2013.
“UFA2020 Overview: Universal Financial Access by 2020.” World Bank. Accessed
March 3, 2017.
http://www.worldbank.org/en/topic/financialinclusion/brief/achieving-universal-
financial-access-by-2020.
“Universal Financial Access - Measuring Progress Towards Financial Inclusion - World
Bank Group,” March 2016.
http://ufa.worldbank.org/~/media/WBG/UFA/Documents/UFA2020-Full-Data-
March2016.xlsx.
“Universal Financial Access Is Vital to Reducing Poverty, Innovation Key to
Overcoming the Enormous Challenge, Says President Jim Yong Kim.”

81
Text/HTML. World Bank. Accessed March 3, 2017.
http://www.worldbank.org/en/news/press-release/2013/10/11/universal-financial-
access-vital-reducing-poverty-innovation-jim-yong-kim.
“World Population Prospects - Population Division - United Nations,” 2015.
https://esa.un.org/unpd/wpp/.
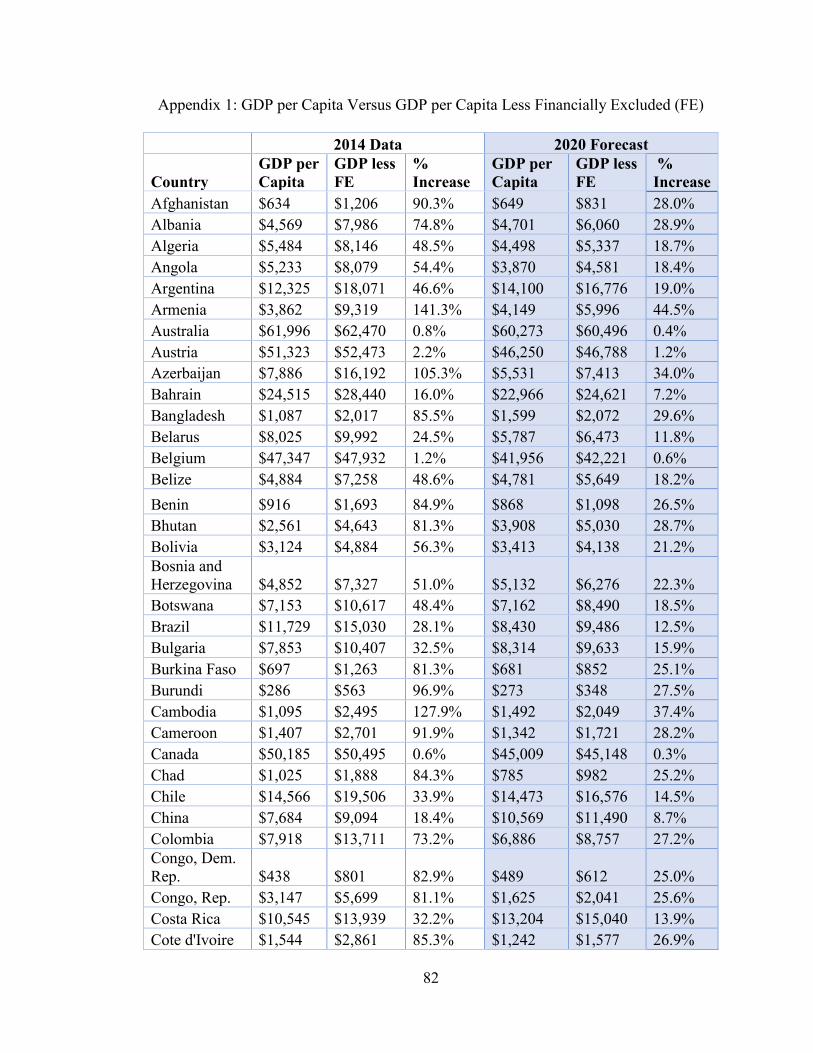
82
Appendix 1: GDP per Capita Versus GDP per Capita Less Financially Excluded (FE)
2014 Data 2020 Forecast
Country
GDP per
Capita
GDP less
FE
%
Increase
GDP per
Capita
GDP less
FE
%
Increase
Afghanistan $634 $1,206 90.3% $649 $831 28.0%
Albania $4,569 $7,986 74.8% $4,701 $6,060 28.9%
Algeria $5,484 $8,146 48.5% $4,498 $5,337 18.7%
Angola $5,233 $8,079 54.4% $3,870 $4,581 18.4%
Argentina $12,325 $18,071 46.6% $14,100 $16,776 19.0%
Armenia $3,862 $9,319 141.3% $4,149 $5,996 44.5%
Australia $61,996 $62,470 0.8% $60,273 $60,496 0.4%
Austria $51,323 $52,473 2.2% $46,250 $46,788 1.2%
Azerbaijan $7,886 $16,192 105.3% $5,531 $7,413 34.0%
Bahrain $24,515 $28,440 16.0% $22,966 $24,621 7.2%
Bangladesh $1,087 $2,017 85.5% $1,599 $2,072 29.6%
Belarus $8,025 $9,992 24.5% $5,787 $6,473 11.8%
Belgium $47,347 $47,932 1.2% $41,956 $42,221 0.6%
Belize $4,884 $7,258 48.6% $4,781 $5,649 18.2%
Benin $916 $1,693 84.9% $868 $1,098 26.5%
Bhutan $2,561 $4,643 81.3% $3,908 $5,030 28.7%
Bolivia $3,124 $4,884 56.3% $3,413 $4,138 21.2%
Bosnia and
Herzegovina $4,852 $7,327 51.0% $5,132 $6,276 22.3%
Botswana $7,153 $10,617 48.4% $7,162 $8,490 18.5%
Brazil $11,729 $15,030 28.1% $8,430 $9,486 12.5%
Bulgaria $7,853 $10,407 32.5% $8,314 $9,633 15.9%
Burkina Faso $697 $1,263 81.3% $681 $852 25.1%
Burundi $286 $563 96.9% $273 $348 27.5%
Cambodia $1,095 $2,495 127.9% $1,492 $2,049 37.4%
Cameroon $1,407 $2,701 91.9% $1,342 $1,721 28.2%
Canada $50,185 $50,495 0.6% $45,009 $45,148 0.3%
Chad $1,025 $1,888 84.3% $785 $982 25.2%
Chile $14,566 $19,506 33.9% $14,473 $16,576 14.5%
China $7,684 $9,094 18.4% $10,569 $11,490 8.7%
Colombia $7,918 $13,711 73.2% $6,886 $8,757 27.2%
Congo, Dem.
Rep. $438 $801 82.9% $489 $612 25.0%
Congo, Rep. $3,147 $5,699 81.1% $1,625 $2,041 25.6%
Costa Rica $10,545 $13,939 32.2% $13,204 $15,040 13.9%
Cote d'Ivoire $1,544 $2,861 85.3% $1,242 $1,577 26.9%
83
2014 Data 2020 Forecast
Country
GDP per
Capita
GDP less
FE
%
Increase
GDP per
Capita
GDP less
FE
%
Increase
Croatia $13,481 $14,860 10.2% $13,028 $13,717 5.3%
Cyprus $20,204 $21,716 7.5% $17,961 $18,613 3.6%
Czech
Republic $19,745 $22,450 13.7% $19,700 $21,041 6.8%
Dominican
Republic $6,269 $8,841 41.0% $7,744 $9,056 16.9%
Ecuador $6,432 $9,819 52.7% $5,383 $6,471 20.2%
Egypt, Arab
Rep. $3,366 $7,223 114.6% $4,159 $5,567 33.9%
El Salvador $4,102 $7,084 72.7% $4,635 $5,936 28.1%
Estonia $19,941 $20,251 1.6% $19,755 $19,919 0.8%
Ethiopia $574 $999 74.2% $781 $972 24.4%
France $42,697 $43,634 2.2% $39,748 $40,212 1.2%
Gabon $10,772 $18,013 67.2% $9,250 $11,392 23.2%
Georgia $4,430 $7,563 70.7% $4,423 $5,573 26.0%
Germany $47,903 $48,298 0.8% $44,903 $45,100 0.4%
Ghana $1,442 $2,314 60.5% $1,665 $2,020 21.3%
Greece $21,674 $23,571 8.8% $20,091 $20,994 4.5%
Guatemala $3,667 $5,590 52.5% $4,255 $5,081 19.4%
Guinea $540 $1,098 103.5% $582 $757 30.1%
Haiti $832 $1,682 102.2% $895 $1,193 33.3%
Honduras $2,434 $4,338 78.2% $2,836 $3,612 27.3%
Hong Kong
SAR, China $40,215 $41,389 2.9% $46,248 $46,925 1.5%
Hungary $14,118 $17,396 23.2% $14,033 $15,627 11.4%
India $1,577 $2,280 44.6% $2,190 $2,585 18.1%
Indonesia $3,500 $6,124 75.0% $4,145 $5,268 27.1%
Iraq $6,485 $12,885 98.7% $4,979 $6,399 28.5%
Ireland $55,503 $57,500 3.6% $68,706 $69,928 1.8%
Israel $37,583 $40,045 6.6% $39,622 $40,881 3.2%
Italy $35,365 $38,495 8.9% $31,901 $33,369 4.6%
Jamaica $5,108 $5,974 16.9% $5,620 $6,067 8.0%
Japan $36,153 $36,912 2.1% $33,747 $34,127 1.1%
Jordan $4,831 $8,866 83.5% $5,469 $7,008 28.1%
Kazakhstan $12,807 $18,546 44.8% $10,490 $12,381 18.0%
Kenya $1,368 $1,817 32.8% $1,650 $1,860 12.7%
Korea, Rep. $27,989 $29,191 4.3% $31,113 $31,798 2.2%
Kuwait $43,332 $54,489 25.7% $30,165 $33,317 10.4%
84
2014 Data 2020 Forecast
Country
GDP per
Capita
GDP less
FE
%
Increase
GDP per
Capita
GDP less
FE
%
Increase
Kyrgyz
Republic $1,280 $2,709 111.7% $1,235 $1,661 34.5%
Latvia $15,710 $16,796 6.9% $16,690 $17,308 3.7%
Lebanon $8,149 $12,730 56.2% $8,953 $10,948 22.3%
Lithuania $16,490 $19,352 17.4% $17,243 $18,792 9.0%
Luxembourg $116,613 $119,798 2.7% $112,021 $113,495 1.3%
Madagascar $453 $943 108.3% $440 $575 30.6%
Malawi $363 $636 75.3% $401 $495 23.5%
Malaysia $11,306 $13,044 15.4% $11,514 $12,320 7.0%
Mali $820 $1,445 76.3% $793 $981 23.8%
Malta $25,125 $25,755 2.5% $27,139 $27,500 1.3%
Mauritius $10,154 $11,623 14.5% $10,926 $11,692 7.0%
Mexico $10,353 $17,323 67.3% $9,629 $12,018 24.8%
Moldova $2,245 $5,774 157.2% $1,914 $2,685 40.3%
Mongolia $4,202 $4,450 5.9% $4,406 $4,529 2.8%
Montenegro $7,378 $10,139 37.4% $7,594 $8,869 16.8%
Myanmar $1,227 $2,536 106.7% $1,617 $2,187 35.2%
Namibia $5,349 $7,131 33.3% $5,301 $6,002 13.2%
Nepal $703 $1,181 67.9% $821 $1,028 25.1%
Netherlands $52,157 $52,400 0.5% $47,555 $47,670 0.2%
New Zealand $44,380 $44,518 0.3% $41,808 $41,874 0.2%
Nicaragua $1,960 $4,115 109.9% $2,425 $3,280 35.3%
Niger $431 $790 83.1% $395 $488 23.4%
Nigeria $3,203 $4,556 42.2% $2,501 $2,893 15.7%
Pakistan $1,321 $2,939 122.6% $1,674 $2,262 35.1%
Panama $12,712 $20,125 58.3% $16,411 $19,987 21.8%
Peru $6,490 $12,079 86.1% $6,805 $8,822 29.6%
Philippines $2,873 $5,274 83.6% $3,740 $4,802 28.4%
Poland $14,342 $16,976 18.4% $14,520 $15,811 8.9%
Portugal $22,124 $24,114 9.0% $20,691 $21,663 4.7%
Romania $10,020 $13,626 36.0% $11,322 $13,297 17.4%
Russian
Federation $14,273 $18,529 29.8% $9,742 $11,106 14.0%
Rwanda $698 $1,066 52.8% $863 $1,028 19.1%
Saudi Arabia $24,406 $30,862 26.5% $20,872 $23,189 11.1%
Senegal $1,042 $1,962 88.3% $1,088 $1,375 26.4%
Serbia $6,200 $6,991 12.8% $5,029 $5,291 5.2%
Sierra Leone $794 $1,496 88.4% $772 $990 28.2%
85
2014 Data 2020 Forecast
Country
GDP per
Capita
GDP less
FE
%
Increase
GDP per
Capita
GDP less
FE
%
Increase
Singapore $56,007 $57,541 2.7% $54,782 $55,498 1.3%
Slovak
Republic $18,595 $22,208 19.4% $19,147 $20,953 9.4%
Slovenia $24,021 $24,478 1.9% $22,540 $22,764 1.0%
Somalia $537 $1,000 86.3% $477 $603 26.3%
South Africa $6,499 $8,168 25.7% $5,945 $6,632 11.6%
Spain $29,719 $30,207 1.6% $28,883 $29,135 0.9%
Sri Lanka $3,853 $4,352 13.0% $4,994 $5,312 6.4%
Sudan $2,088 $3,963 89.8% $2,536 $3,244 27.9%
Sweden $59,180 $59,285 0.2% $55,472 $55,522 0.1%
Switzerland $85,815 $86,996 1.4% $83,181 $83,753 0.7%
Tajikistan $1,113 $2,469 121.8% $1,084 $1,460 34.6%
Tanzania $930 $1,597 71.7% $1,023 $1,255 22.6%
Thailand $5,970 $7,084 18.7% $6,724 $7,329 9.0%
Togo $630 $1,149 82.3% $622 $783 25.9%
Tunisia $4,329 $8,718 101.4% $4,270 $5,682 33.1%
Turkey $10,304 $14,511 40.8% $10,241 $11,980 17.0%
Turkmenistan $8,199 $24,318 196.6% $8,371 $12,473 49.0%
Uganda $735 $1,139 55.1% $794 $940 18.4%
Ukraine $2,943 $4,403 49.6% $2,395 $2,931 22.4%
United Arab
Emirates $44,239 $51,619 16.7% $43,665 $46,966 7.6%
United
Kingdom $46,412 $46,736 0.7% $46,499 $46,665 0.4%
United States $54,540 $56,972 4.5% $59,422 $60,740 2.2%
Uruguay $16,738 $25,751 53.9% $17,059 $20,855 22.3%
Uzbekistan $2,037 $3,374 65.7% $2,811 $3,532 25.6%
Vietnam $2,052 $3,992 94.5% $2,662 $3,496 31.3%
Yemen, Rep. $1,651 $3,510 112.6% $1,626 $2,155 32.5%
Zambia $1,727 $2,658 53.9% $1,401 $1,658 18.3%
Zimbabwe $931 $1,721 84.8% $824 $1,047 27.0%
86
Appendix 2: Newly Financially Included (FI) Population (Pop.) by Country
Country
2015
Newly FI
Population
2016
Newly FI
Population
2017
Newly FI
Population
2018
Newly FI
Population
2019
Newly FI
Population
2020
Newly FI
Population
Total
Newly FI
Population
Afghanistan
1,500,581
1,350,523
1,215,471
1,093,923
984,531
886,078
7,031,107
Albania
123,831
111,448
100,303
90,273
81,245
73,121
580,221
Algeria
1,272,426
1,145,184
1,030,665
927,599
834,839
751,355
5,962,069
Angola
853,502
768,152
691,337
622,203
559,983
503,985
3,999,161
Argentina
1,366,607
1,229,946
1,106,952
996,257
896,631
806,968
6,403,360
Armenia
176,035
158,432
142,589
128,330
115,497
103,947
824,829
Australia
17,812
16,031
14,428
12,985
11,686
10,518
83,460
Austria
18,725
16,852
15,167
13,651
12,285
11,057
87,738
Azerbaijan
489,104
440,193
396,174
356,557
320,901
288,811
2,291,740
Bahrain
18,797
16,917
15,226
13,703
12,333
11,099
88,075
Bangladesh
7,334,374
6,600,936
5,940,843
5,346,758
4,812,083
4,330,874
34,365,868
Belarus
186,634
167,971
151,174
136,056
122,451
110,206
874,492
Belgium
13,705
12,334
11,101
9,991
8,992
8,093
64,216
Belize
11,503
10,353
9,318
8,386
7,547
6,793
53,900
Benin
486,568
437,911
394,120
354,708
319,237
287,314
2,279,859
Bhutan
34,309
30,878
27,790
25,011
22,510
20,259
160,757
Bolivia
380,541
342,487
308,239
277,415
249,673
224,706
1,783,061
Bosnia and
Herzegovina
128,937
116,043
104,439
93,995
84,595
76,136
604,145
Botswana
72,414
65,172
58,655
52,790
47,511
42,760
339,301
Brazil
4,525,964
4,073,367
3,666,030
3,299,427
2,969,485
2,672,536
21,206,810
Bulgaria
177,253
159,527
143,575
129,217
116,295
104,666
830,533
Burkina
Faso
788,736
709,863
638,876
574,989
517,490
465,741
3,695,694
Burundi
532,370
479,133
431,220
388,098
349,288
314,359
2,494,468
Cambodia
860,246
774,222
696,800
627,120
564,408
507,967
4,030,762
Cameroon
1,090,582
981,524
883,372
795,034
715,531
643,978
5,110,021
87
Country
2015
Newly FI
Population
2016
Newly FI
Population
2017
Newly FI
Population
2018
Newly FI
Population
2019
Newly FI
Population
2020
Newly FI
Population
Total
Newly FI
Population
Canada
21,759
19,583
17,625
15,862
14,276
12,849
101,955
Chad
621,450
559,305
503,375
453,037
407,733
366,960
2,911,861
Chile
449,835
404,851
364,366
327,930
295,137
265,623
2,107,741
China
21,163,269
19,046,942
17,142,248
15,428,023
13,885,221
12,496,699
99,162,403
Colombia
2,019,260
1,817,334
1,635,601
1,472,040
1,324,836
1,192,353
9,461,424
Congo,
Dem. Rep.
3,393,768
3,054,392
2,748,952
2,474,057
2,226,652
2,003,986
15,901,808
Congo, Rep.
201,711
181,540
163,386
147,047
132,342
119,108
945,134
Costa Rica
115,860
104,274
93,846
84,462
76,015
68,414
542,871
Cote d'Ivoire
1,019,897
917,907
826,116
743,505
669,154
602,239
4,778,818
Croatia
39,345
35,410
31,869
28,682
25,814
23,233
184,353
Cyprus
8,033
7,230
6,507
5,856
5,271
4,743
37,640
Czech
Republic
126,821
114,139
102,725
92,452
83,207
74,887
594,231
Dominican
Republic
302,774
272,497
245,247
220,722
198,650
178,785
1,418,675
Ecuador
548,504
493,653
444,288
399,859
359,873
323,886
2,570,063
Egypt, Arab
Rep.
4,783,874
4,305,487
3,874,938
3,487,444
3,138,700
2,824,830
22,415,272
El Salvador
257,080
231,372
208,235
187,411
168,670
151,803
1,204,571
Estonia
2,009
1,808
1,628
1,465
1,318
1,186
9,415
Ethiopia
4,130,885
3,717,796
3,346,017
3,011,415
2,710,273
2,439,246
19,355,632
France
142,758
128,482
115,634
104,070
93,663
84,297
668,904
Gabon
67,842
61,057
54,952
49,456
44,511
40,060
317,878
Georgia
154,420
138,978
125,081
112,572
101,315
91,184
723,551
Germany
66,206
59,586
53,627
48,265
43,438
39,094
310,216
Ghana
1,009,809
908,828
817,945
736,151
662,535
596,282
4,731,549
Greece
87,679
78,911
71,020
63,918
57,526
51,774
410,829
Guatemala
551,131
496,018
446,416
401,775
361,597
325,437
2,582,374
Guinea
624,245
561,821
505,639
455,075
409,567
368,611
2,924,958
Haiti
534,377
480,939
432,845
389,561
350,605
315,544
2,503,870
88
Country
2015
Newly FI
Population
2016
Newly FI
Population
2017
Newly FI
Population
2018
Newly FI
Population
2019
Newly FI
Population
2020
Newly FI
Population
Total
Newly FI
Population
Honduras
349,414
314,473
283,026
254,723
229,251
206,326
1,637,213
Hong Kong
SAR, China
20,528
18,475
16,627
14,965
13,468
12,121
96,185
Hungary
185,926
167,333
150,600
135,540
121,986
109,787
871,171
India
39,961,353
35,965,217
32,368,696
29,131,826
26,218,643
23,596,779
187,242,51
4
Indonesia
10,905,101
9,814,591
8,833,132
7,949,818
7,154,837
6,439,353
51,096,831
Iran, Islamic
Rep.
437,263
393,536
354,183
318,765
286,888
258,199
2,048,834
Iraq
1,752,115
1,576,904
1,419,213
1,277,292
1,149,563
1,034,607
8,209,694
Ireland
16,034
14,431
12,988
11,689
10,520
9,468
75,131
Israel
50,513
45,462
40,916
36,824
33,142
29,828
236,684
Italy
494,290
444,861
400,375
360,337
324,303
291,873
2,316,039
Jamaica
39,406
35,465
31,919
28,727
25,854
23,269
184,640
Japan
261,652
235,487
211,938
190,744
171,670
154,503
1,225,994
Jordan
337,537
303,783
273,405
246,065
221,458
199,312
1,581,561
Kazakhstan
535,019
481,517
433,365
390,029
351,026
315,923
2,506,880
Kenya
1,107,678
996,910
897,219
807,497
726,748
654,073
5,190,126
Korea, Rep.
207,607
186,846
168,161
151,345
136,211
122,590
972,760
Kuwait
76,843
69,158
62,242
56,018
50,416
45,375
360,053
Kyrgyz
Republic
307,906
277,116
249,404
224,464
202,017
181,816
1,442,723
Latvia
12,893
11,604
10,444
9,399
8,459
7,613
60,413
Lebanon
201,974
181,776
163,599
147,239
132,515
119,263
946,365
Lithuania
43,369
39,032
35,129
31,616
28,455
25,609
203,211
Luxembourg
1,479
1,331
1,198
1,078
970
873
6,929
Madagascar
1,225,284
1,102,756
992,480
893,232
803,909
723,518
5,741,180
Malawi
717,205
645,485
580,936
522,842
470,558
423,502
3,360,529
Malaysia
398,469
358,622
322,760
290,484
261,436
235,292
1,867,064
Mali
739,644
665,680
599,112
539,201
485,281
436,753
3,465,670
89
Country
2015
Newly FI
Population
2016
Newly FI
Population
2017
Newly FI
Population
2018
Newly FI
Population
2019
Newly FI
Population
2020
Newly FI
Population
Total
Newly FI
Population
Malta
1,045
940
846
762
685
617
4,895
Mauritania
178,579
160,721
144,649
130,184
117,166
105,449
836,750
Mauritius
15,934
14,340
12,906
11,616
10,454
9,409
74,660
Mexico
5,044,592
4,540,133
4,086,119
3,677,507
3,309,757
2,978,781
23,636,889
Moldova
217,384
195,645
176,081
158,473
142,626
128,363
1,018,571
Mongolia
16,210
14,589
13,130
11,817
10,636
9,572
75,955
Myanmar
2,758,043
2,482,239
2,234,015
2,010,614
1,809,552
1,628,597
12,923,061
Namibia
60,036
54,033
48,629
43,766
39,390
35,451
281,305
Nepal
1,139,531
1,025,578
923,020
830,718
747,646
672,881
5,339,373
Netherlands
7,792
7,013
6,312
5,681
5,113
4,601
36,512
New
Zealand
1,396
1,257
1,131
1,018
916
825
6,543
Nicaragua
314,839
283,355
255,019
229,517
206,566
185,909
1,475,204
Niger
867,331
780,598
702,538
632,284
569,056
512,150
4,063,958
Nigeria
5,268,921
4,742,029
4,267,826
3,841,044
3,456,939
3,111,245
24,688,006
Pakistan
10,190,128
9,171,115
8,254,003
7,428,603
6,685,743
6,017,168
47,746,760
Panama
142,454
128,209
115,388
103,849
93,464
84,118
667,481
Peru
1,433,132
1,289,819
1,160,837
1,044,753
940,278
846,250
6,715,069
Philippines
4,512,786
4,061,507
3,655,356
3,289,821
2,960,839
2,664,755
21,145,064
Poland
589,876
530,889
477,800
430,020
387,018
348,316
2,763,918
Portugal
85,803
77,223
69,501
62,550
56,295
50,666
402,038
Romania
526,824
474,141
426,727
384,054
345,649
311,084
2,468,479
Russian
Federation
3,303,279
2,972,951
2,675,656
2,408,091
2,167,282
1,950,553
15,477,813
Rwanda
391,709
352,538
317,285
285,556
257,001
231,300
1,835,389
Saudi Arabia
646,082
581,474
523,326
470,994
423,894
381,505
3,027,274
Senegal
688,110
619,299
557,369
501,632
451,469
406,322
3,224,200
Serbia
80,648
72,584
65,325
58,793
52,913
47,622
377,886
Sierra Leone
296,408
266,767
240,090
216,081
194,473
175,026
1,388,845
90
Country
2015
Newly FI
Population
2016
Newly FI
Population
2017
Newly FI
Population
2018
Newly FI
Population
2019
Newly FI
Population
2020
Newly FI
Population
Total
Newly FI
Population
Singapore
14,577
13,120
11,808
10,627
9,564
8,608
68,303
Slovak
Republic
88,150
79,335
71,401
64,261
57,835
52,052
413,034
Slovenia
3,852
3,467
3,120
2,808
2,527
2,275
18,050
South Africa
1,104,988
994,489
895,040
805,536
724,983
652,484
5,177,521
Spain
75,156
67,640
60,876
54,789
49,310
44,379
352,149
Sri Lanka
238,375
214,538
193,084
173,776
156,398
140,758
1,116,929
Sudan
1,862,296
1,676,066
1,508,459
1,357,613
1,221,852
1,099,667
8,725,954
Sweden
1,719
1,547
1,393
1,253
1,128
1,015
8,055
Switzerland
11,117
10,006
9,005
8,105
7,294
6,565
52,092
Tajikistan
455,536
409,982
368,984
332,086
298,877
268,989
2,134,454
Tanzania
2,163,471
1,947,124
1,752,411
1,577,170
1,419,453
1,277,508
10,137,138
Thailand
1,065,331
958,798
862,918
776,626
698,963
629,067
4,991,703
Togo
321,318
289,186
260,268
234,241
210,817
189,735
1,505,565
Tunisia
553,622
498,260
448,434
403,591
363,232
326,908
2,594,047
Turkey
2,247,544
2,022,789
1,820,510
1,638,459
1,474,613
1,327,152
10,531,068
Turkmenista
n
351,786
316,608
284,947
256,452
230,807
207,726
1,648,326
Uganda
1,341,783
1,207,605
1,086,844
978,160
880,344
792,309
6,287,045
Ukraine
1,504,159
1,353,743
1,218,369
1,096,532
986,879
888,191
7,047,874
United Arab
Emirates
129,910
116,919
105,227
94,705
85,234
76,711
608,707
United
Kingdom
44,756
40,280
36,252
32,627
29,364
26,428
209,706
United
States
1,361,788
1,225,609
1,103,048
992,744
893,469
804,122
6,380,781
Uruguay
119,689
107,720
96,948
87,253
78,528
70,675
560,814
Uzbekistan
1,219,019
1,097,117
987,406
888,665
799,798
719,819
5,711,824
Vietnam
4,407,866
3,967,080
3,570,372
3,213,335
2,892,001
2,602,801
20,653,455
Yemen, Rep.
1,386,698
1,248,028
1,123,225
1,010,903
909,813
818,831
6,497,499
Zambia
550,767
495,690
446,121
401,509
361,358
325,222
2,580,667
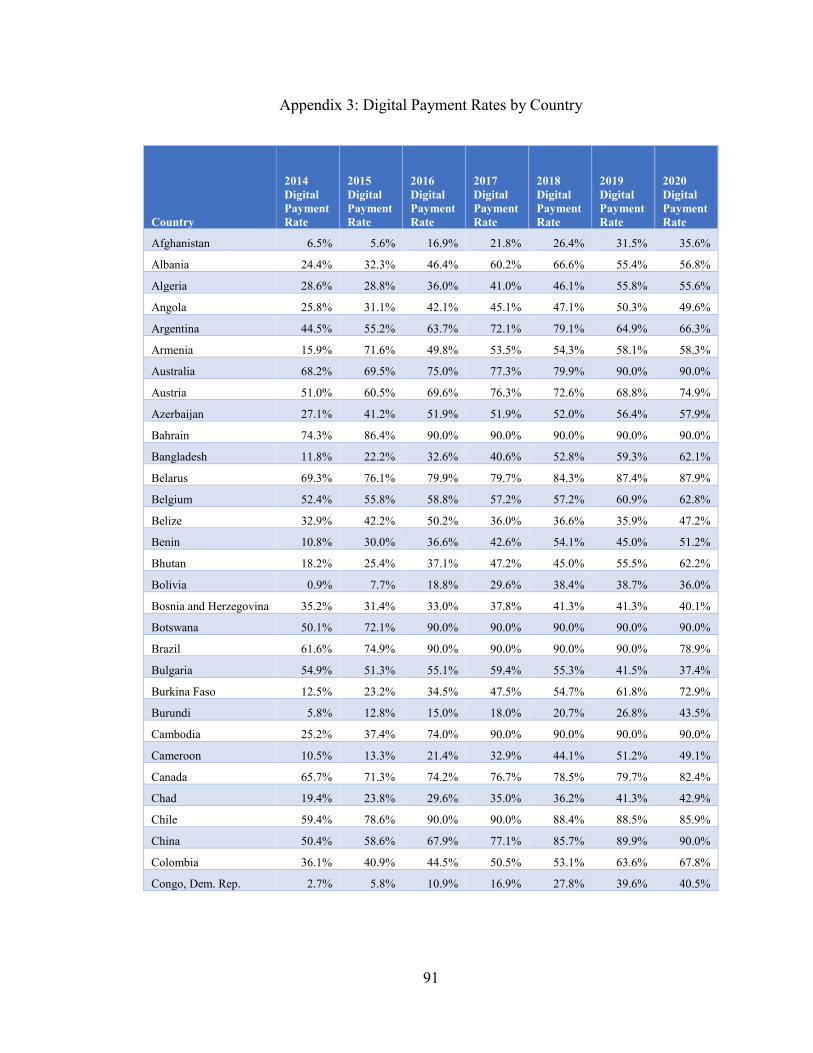
91
Appendix 3: Digital Payment Rates by Country
Country
2014
Digital
Payment
Rate
2015
Digital
Payment
Rate
2016
Digital
Payment
Rate
2017
Digital
Payment
Rate
2018
Digital
Payment
Rate
2019
Digital
Payment
Rate
2020
Digital
Payment
Rate
Afghanistan 6.5% 5.6% 16.9% 21.8% 26.4% 31.5% 35.6%
Albania 24.4% 32.3% 46.4% 60.2% 66.6% 55.4% 56.8%
Algeria 28.6% 28.8% 36.0% 41.0% 46.1% 55.8% 55.6%
Angola 25.8% 31.1% 42.1% 45.1% 47.1% 50.3% 49.6%
Argentina 44.5% 55.2% 63.7% 72.1% 79.1% 64.9% 66.3%
Armenia 15.9% 71.6% 49.8% 53.5% 54.3% 58.1% 58.3%
Australia 68.2% 69.5% 75.0% 77.3% 79.9% 90.0% 90.0%
Austria 51.0% 60.5% 69.6% 76.3% 72.6% 68.8% 74.9%
Azerbaijan 27.1% 41.2% 51.9% 51.9% 52.0% 56.4% 57.9%
Bahrain 74.3% 86.4% 90.0% 90.0% 90.0% 90.0% 90.0%
Bangladesh 11.8% 22.2% 32.6% 40.6% 52.8% 59.3% 62.1%
Belarus 69.3% 76.1% 79.9% 79.7% 84.3% 87.4% 87.9%
Belgium 52.4% 55.8% 58.8% 57.2% 57.2% 60.9% 62.8%
Belize 32.9% 42.2% 50.2% 36.0% 36.6% 35.9% 47.2%
Benin 10.8% 30.0% 36.6% 42.6% 54.1% 45.0% 51.2%
Bhutan 18.2% 25.4% 37.1% 47.2% 45.0% 55.5% 62.2%
Bolivia 0.9% 7.7% 18.8% 29.6% 38.4% 38.7% 36.0%
Bosnia and Herzegovina 35.2% 31.4% 33.0% 37.8% 41.3% 41.3% 40.1%
Botswana 50.1% 72.1% 90.0% 90.0% 90.0% 90.0% 90.0%
Brazil 61.6% 74.9% 90.0% 90.0% 90.0% 90.0% 78.9%
Bulgaria 54.9% 51.3% 55.1% 59.4% 55.3% 41.5% 37.4%
Burkina Faso 12.5% 23.2% 34.5% 47.5% 54.7% 61.8% 72.9%
Burundi 5.8% 12.8% 15.0% 18.0% 20.7% 26.8% 43.5%
Cambodia 25.2% 37.4% 74.0% 90.0% 90.0% 90.0% 90.0%
Cameroon 10.5% 13.3% 21.4% 32.9% 44.1% 51.2% 49.1%
Canada 65.7% 71.3% 74.2% 76.7% 78.5% 79.7% 82.4%
Chad 19.4% 23.8% 29.6% 35.0% 36.2% 41.3% 42.9%
Chile 59.4% 78.6% 90.0% 90.0% 88.4% 88.5% 85.9%
China 50.4% 58.6% 67.9% 77.1% 85.7% 89.9% 90.0%
Colombia 36.1% 40.9% 44.5% 50.5% 53.1% 63.6% 67.8%
Congo, Dem. Rep. 2.7% 5.8% 10.9% 16.9% 27.8% 39.6% 40.5%

92
Country
2014
Digital
Payment
Rate
2015
Digital
Payment
Rate
2016
Digital
Payment
Rate
2017
Digital
Payment
Rate
2018
Digital
Payment
Rate
2019
Digital
Payment
Rate
2020
Digital
Payment
Rate
Congo, Rep. 0.8% 17.9% 21.5% 30.4% 38.8% 44.8% 51.1%
Costa Rica 56.5% 81.2% 90.0% 90.0% 90.0% 88.1% 90.0%
Cote d'Ivoire 1.7% 12.6% 20.4% 23.8% 29.7% 41.9% 56.8%
Croatia 77.6% 83.6% 88.0% 84.6% 78.7% 72.6% 71.5%
Cyprus 75.7% 80.6% 85.5% 87.2% 86.3% 87.2% 87.3%
Czech Republic 45.7% 44.5% 46.7% 50.1% 51.9% 53.8% 47.7%
Dominican Republic 42.0% 44.5% 43.3% 44.9% 47.5% 38.8% 43.6%
Ecuador 25.6% 35.3% 38.8% 45.8% 46.9% 46.8% 23.7%
Egypt, Arab Rep. 1.4% 18.5% 32.7% 47.6% 50.9% 46.0% 44.5%
El Salvador 36.0% 38.1% 48.2% 53.7% 59.3% 62.6% 64.9%
Estonia 63.6% 69.8% 81.5% 90.0% 84.5% 82.2% 82.7%
Ethiopia 8.8% 11.7% 19.2% 25.8% 31.1% 36.1% 48.3%
France 44.5% 44.3% 47.3% 51.0% 52.6% 55.8% 57.7%
Gabon 26.6% 36.1% 81.2% 90.0% 90.0% 90.0% 83.4%
Georgia 31.2% 61.8% 74.0% 81.2% 89.1% 90.0% 90.0%
Germany 56.4% 35.9% 38.9% 40.8% 50.2% 49.6% 45.7%
Ghana 31.9% 40.6% 54.6% 71.2% 80.2% 88.9% 90.0%
Greece 11.1% 1.9% 0.4% 11.7% 4.0% 0.6% 4.4%
Guatemala 32.6% 37.4% 46.2% 54.4% 60.2% 30.2% 37.7%
Guinea 9.8% 13.9% 20.9% 26.8% 41.9% 52.1% 69.0%
Haiti 16.8% 20.1% 22.0% 39.9% 50.0% 46.3% 51.3%
Honduras 28.3% 42.3% 24.2% 15.5% 20.5% 20.0% 24.0%
Hong Kong SAR, China 36.3% 52.8% 73.5% 88.6% 90.0% 89.8% 86.6%
Hungary 68.5% 70.7% 67.4% 66.3% 66.4% 67.8% 68.4%
India 22.9% 40.4% 51.3% 49.1% 50.8% 55.2% 59.6%
Indonesia 25.8% 44.5% 59.6% 72.3% 84.5% 89.4% 90.0%
Iran, Islamic Rep. 17.8% 19.7% 22.3% 25.0% 34.1% 38.7% 45.5%
Iraq 10.3% 19.2% 25.6% 29.1% 45.3% 46.8% 48.4%
Ireland 54.1% 54.0% 58.5% 60.8% 57.9% 58.6% 58.4%
Israel 35.7% 36.8% 37.9% 38.2% 41.5% 41.5% 54.5%
Italy 39.0% 45.0% 48.9% 50.8% 50.2% 45.9% 33.8%
Jamaica 49.3% 57.6% 48.9% 40.5% 45.3% 51.2% 56.0%
Japan 36.1% 41.6% 49.0% 55.6% 60.9% 66.6% 70.8%
Jordan 15.1% 23.3% 34.9% 55.2% 73.1% 83.6% 90.0%
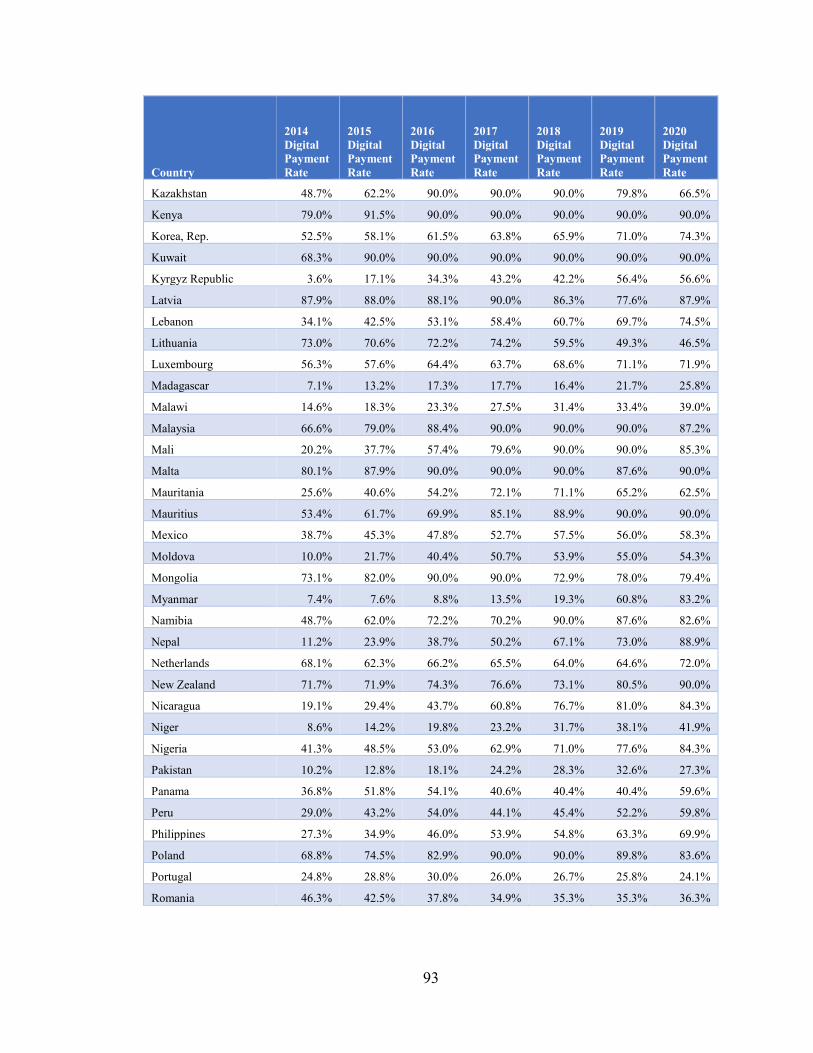
93
Country
2014
Digital
Payment
Rate
2015
Digital
Payment
Rate
2016
Digital
Payment
Rate
2017
Digital
Payment
Rate
2018
Digital
Payment
Rate
2019
Digital
Payment
Rate
2020
Digital
Payment
Rate
Kazakhstan 48.7% 62.2% 90.0% 90.0% 90.0% 79.8% 66.5%
Kenya 79.0% 91.5% 90.0% 90.0% 90.0% 90.0% 90.0%
Korea, Rep. 52.5% 58.1% 61.5% 63.8% 65.9% 71.0% 74.3%
Kuwait 68.3% 90.0% 90.0% 90.0% 90.0% 90.0% 90.0%
Kyrgyz Republic 3.6% 17.1% 34.3% 43.2% 42.2% 56.4% 56.6%
Latvia 87.9% 88.0% 88.1% 90.0% 86.3% 77.6% 87.9%
Lebanon 34.1% 42.5% 53.1% 58.4% 60.7% 69.7% 74.5%
Lithuania 73.0% 70.6% 72.2% 74.2% 59.5% 49.3% 46.5%
Luxembourg 56.3% 57.6% 64.4% 63.7% 68.6% 71.1% 71.9%
Madagascar 7.1% 13.2% 17.3% 17.7% 16.4% 21.7% 25.8%
Malawi 14.6% 18.3% 23.3% 27.5% 31.4% 33.4% 39.0%
Malaysia 66.6% 79.0% 88.4% 90.0% 90.0% 90.0% 87.2%
Mali 20.2% 37.7% 57.4% 79.6% 90.0% 90.0% 85.3%
Malta 80.1% 87.9% 90.0% 90.0% 90.0% 87.6% 90.0%
Mauritania 25.6% 40.6% 54.2% 72.1% 71.1% 65.2% 62.5%
Mauritius 53.4% 61.7% 69.9% 85.1% 88.9% 90.0% 90.0%
Mexico 38.7% 45.3% 47.8% 52.7% 57.5% 56.0% 58.3%
Moldova 10.0% 21.7% 40.4% 50.7% 53.9% 55.0% 54.3%
Mongolia 73.1% 82.0% 90.0% 90.0% 72.9% 78.0% 79.4%
Myanmar 7.4% 7.6% 8.8% 13.5% 19.3% 60.8% 83.2%
Namibia 48.7% 62.0% 72.2% 70.2% 90.0% 87.6% 82.6%
Nepal 11.2% 23.9% 38.7% 50.2% 67.1% 73.0% 88.9%
Netherlands 68.1% 62.3% 66.2% 65.5% 64.0% 64.6% 72.0%
New Zealand 71.7% 71.9% 74.3% 76.6% 73.1% 80.5% 90.0%
Nicaragua 19.1% 29.4% 43.7% 60.8% 76.7% 81.0% 84.3%
Niger 8.6% 14.2% 19.8% 23.2% 31.7% 38.1% 41.9%
Nigeria 41.3% 48.5% 53.0% 62.9% 71.0% 77.6% 84.3%
Pakistan 10.2% 12.8% 18.1% 24.2% 28.3% 32.6% 27.3%
Panama 36.8% 51.8% 54.1% 40.6% 40.4% 40.4% 59.6%
Peru 29.0% 43.2% 54.0% 44.1% 45.4% 52.2% 59.8%
Philippines 27.3% 34.9% 46.0% 53.9% 54.8% 63.3% 69.9%
Poland 68.8% 74.5% 82.9% 90.0% 90.0% 89.8% 83.6%
Portugal 24.8% 28.8% 30.0% 26.0% 26.7% 25.8% 24.1%
Romania 46.3% 42.5% 37.8% 34.9% 35.3% 35.3% 36.3%
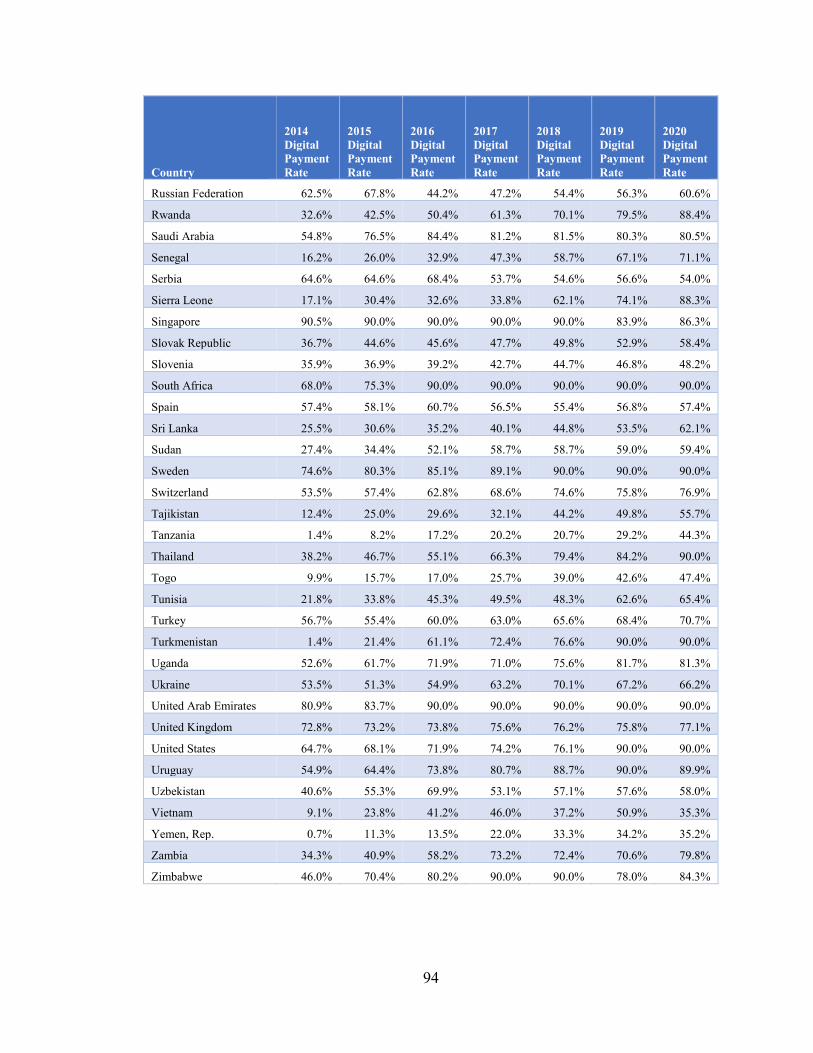
94
Country
2014
Digital
Payment
Rate
2015
Digital
Payment
Rate
2016
Digital
Payment
Rate
2017
Digital
Payment
Rate
2018
Digital
Payment
Rate
2019
Digital
Payment
Rate
2020
Digital
Payment
Rate
Russian Federation 62.5% 67.8% 44.2% 47.2% 54.4% 56.3% 60.6%
Rwanda 32.6% 42.5% 50.4% 61.3% 70.1% 79.5% 88.4%
Saudi Arabia 54.8% 76.5% 84.4% 81.2% 81.5% 80.3% 80.5%
Senegal 16.2% 26.0% 32.9% 47.3% 58.7% 67.1% 71.1%
Serbia 64.6% 64.6% 68.4% 53.7% 54.6% 56.6% 54.0%
Sierra Leone 17.1% 30.4% 32.6% 33.8% 62.1% 74.1% 88.3%
Singapore 90.5% 90.0% 90.0% 90.0% 90.0% 83.9% 86.3%
Slovak Republic 36.7% 44.6% 45.6% 47.7% 49.8% 52.9% 58.4%
Slovenia 35.9% 36.9% 39.2% 42.7% 44.7% 46.8% 48.2%
South Africa 68.0% 75.3% 90.0% 90.0% 90.0% 90.0% 90.0%
Spain 57.4% 58.1% 60.7% 56.5% 55.4% 56.8% 57.4%
Sri Lanka 25.5% 30.6% 35.2% 40.1% 44.8% 53.5% 62.1%
Sudan 27.4% 34.4% 52.1% 58.7% 58.7% 59.0% 59.4%
Sweden 74.6% 80.3% 85.1% 89.1% 90.0% 90.0% 90.0%
Switzerland 53.5% 57.4% 62.8% 68.6% 74.6% 75.8% 76.9%
Tajikistan 12.4% 25.0% 29.6% 32.1% 44.2% 49.8% 55.7%
Tanzania 1.4% 8.2% 17.2% 20.2% 20.7% 29.2% 44.3%
Thailand 38.2% 46.7% 55.1% 66.3% 79.4% 84.2% 90.0%
Togo 9.9% 15.7% 17.0% 25.7% 39.0% 42.6% 47.4%
Tunisia 21.8% 33.8% 45.3% 49.5% 48.3% 62.6% 65.4%
Turkey 56.7% 55.4% 60.0% 63.0% 65.6% 68.4% 70.7%
Turkmenistan 1.4% 21.4% 61.1% 72.4% 76.6% 90.0% 90.0%
Uganda 52.6% 61.7% 71.9% 71.0% 75.6% 81.7% 81.3%
Ukraine 53.5% 51.3% 54.9% 63.2% 70.1% 67.2% 66.2%
United Arab Emirates 80.9% 83.7% 90.0% 90.0% 90.0% 90.0% 90.0%
United Kingdom 72.8% 73.2% 73.8% 75.6% 76.2% 75.8% 77.1%
United States 64.7% 68.1% 71.9% 74.2% 76.1% 90.0% 90.0%
Uruguay 54.9% 64.4% 73.8% 80.7% 88.7% 90.0% 89.9%
Uzbekistan 40.6% 55.3% 69.9% 53.1% 57.1% 57.6% 58.0%
Vietnam 9.1% 23.8% 41.2% 46.0% 37.2% 50.9% 35.3%
Yemen, Rep. 0.7% 11.3% 13.5% 22.0% 33.3% 34.2% 35.2%
Zambia 34.3% 40.9% 58.2% 73.2% 72.4% 70.6% 79.8%
Zimbabwe 46.0% 70.4% 80.2% 90.0% 90.0% 78.0% 84.3%
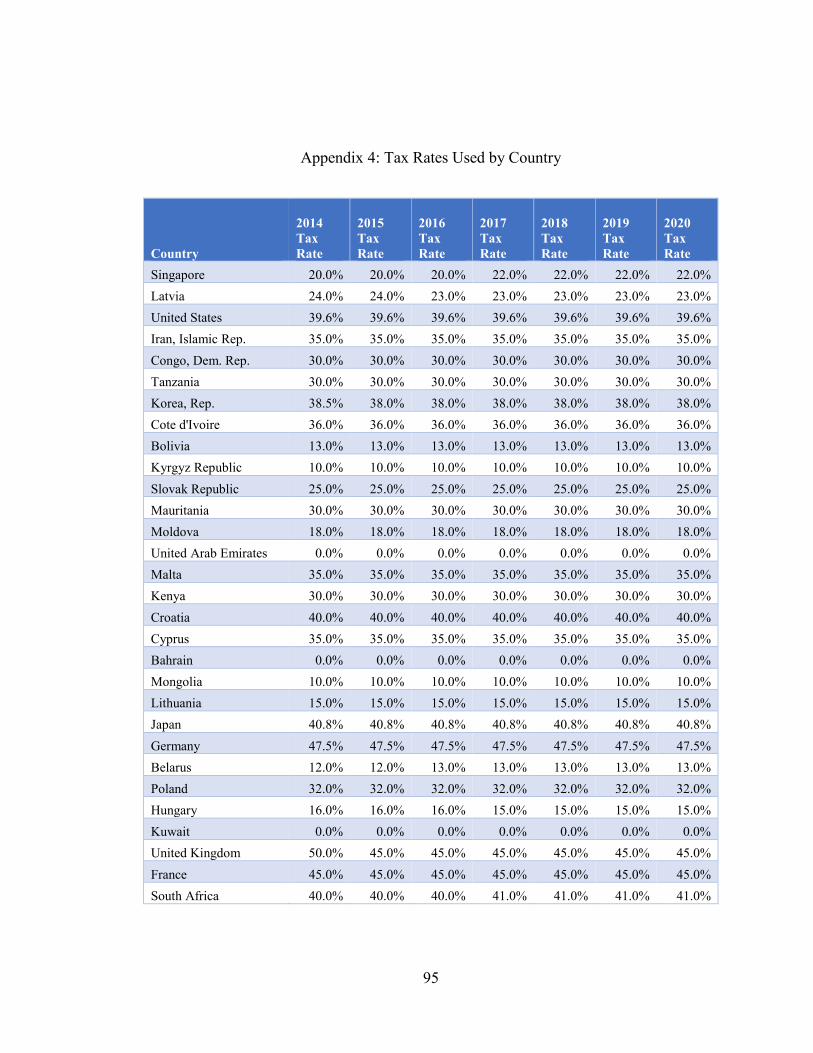
95
Appendix 4: Tax Rates Used by Country
Country
2014
Tax
Rate
2015
Tax
Rate
2016
Tax
Rate
2017
Tax
Rate
2018
Tax
Rate
2019
Tax
Rate
2020
Tax
Rate
Singapore 20.0% 20.0% 20.0% 22.0% 22.0% 22.0% 22.0%
Latvia 24.0% 24.0% 23.0% 23.0% 23.0% 23.0% 23.0%
United States 39.6% 39.6% 39.6% 39.6% 39.6% 39.6% 39.6%
Iran, Islamic Rep. 35.0% 35.0% 35.0% 35.0% 35.0% 35.0% 35.0%
Congo, Dem. Rep. 30.0% 30.0% 30.0% 30.0% 30.0% 30.0% 30.0%
Tanzania 30.0% 30.0% 30.0% 30.0% 30.0% 30.0% 30.0%
Korea, Rep. 38.5% 38.0% 38.0% 38.0% 38.0% 38.0% 38.0%
Cote d'Ivoire 36.0% 36.0% 36.0% 36.0% 36.0% 36.0% 36.0%
Bolivia 13.0% 13.0% 13.0% 13.0% 13.0% 13.0% 13.0%
Kyrgyz Republic 10.0% 10.0% 10.0% 10.0% 10.0% 10.0% 10.0%
Slovak Republic 25.0% 25.0% 25.0% 25.0% 25.0% 25.0% 25.0%
Mauritania 30.0% 30.0% 30.0% 30.0% 30.0% 30.0% 30.0%
Moldova 18.0% 18.0% 18.0% 18.0% 18.0% 18.0% 18.0%
United Arab Emirates 0.0% 0.0% 0.0% 0.0% 0.0% 0.0% 0.0%
Malta 35.0% 35.0% 35.0% 35.0% 35.0% 35.0% 35.0%
Kenya 30.0% 30.0% 30.0% 30.0% 30.0% 30.0% 30.0%
Croatia 40.0% 40.0% 40.0% 40.0% 40.0% 40.0% 40.0%
Cyprus 35.0% 35.0% 35.0% 35.0% 35.0% 35.0% 35.0%
Bahrain 0.0% 0.0% 0.0% 0.0% 0.0% 0.0% 0.0%
Mongolia 10.0% 10.0% 10.0% 10.0% 10.0% 10.0% 10.0%
Lithuania 15.0% 15.0% 15.0% 15.0% 15.0% 15.0% 15.0%
Japan 40.8% 40.8% 40.8% 40.8% 40.8% 40.8% 40.8%
Germany 47.5% 47.5% 47.5% 47.5% 47.5% 47.5% 47.5%
Belarus 12.0% 12.0% 13.0% 13.0% 13.0% 13.0% 13.0%
Poland 32.0% 32.0% 32.0% 32.0% 32.0% 32.0% 32.0%
Hungary 16.0% 16.0% 16.0% 15.0% 15.0% 15.0% 15.0%
Kuwait 0.0% 0.0% 0.0% 0.0% 0.0% 0.0% 0.0%
United Kingdom 50.0% 45.0% 45.0% 45.0% 45.0% 45.0% 45.0%
France 45.0% 45.0% 45.0% 45.0% 45.0% 45.0% 45.0%
South Africa 40.0% 40.0% 40.0% 41.0% 41.0% 41.0% 41.0%
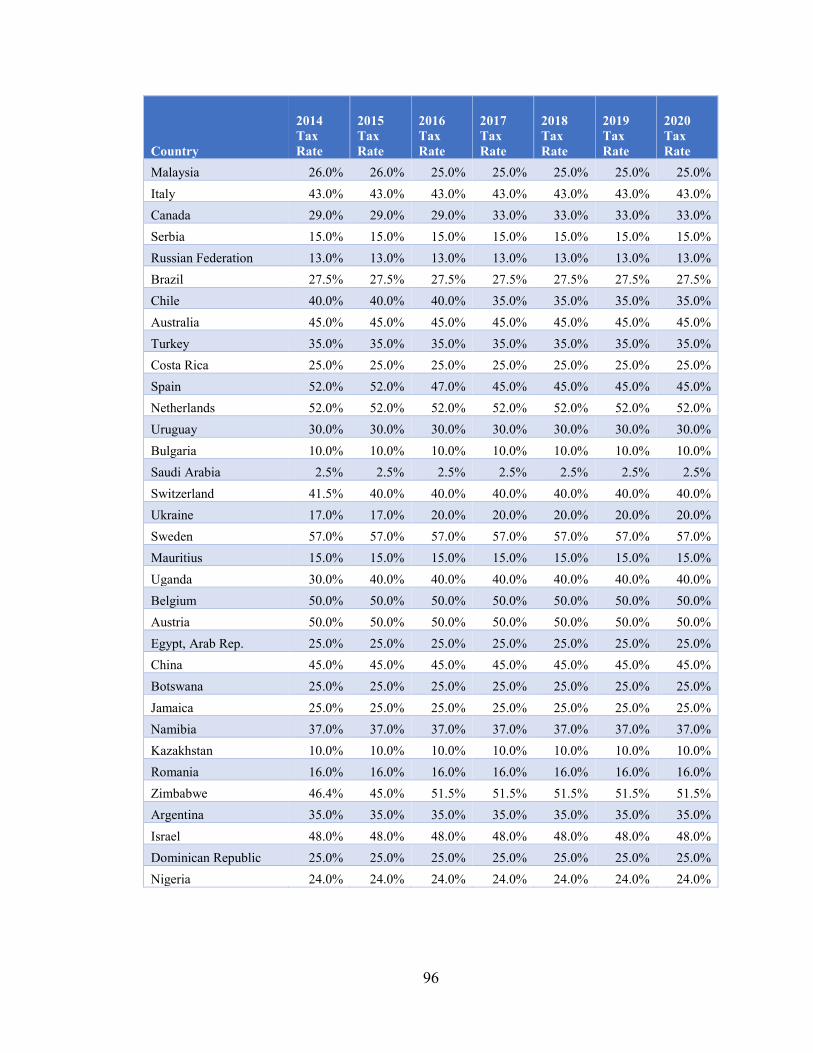
96
Country
2014
Tax
Rate
2015
Tax
Rate
2016
Tax
Rate
2017
Tax
Rate
2018
Tax
Rate
2019
Tax
Rate
2020
Tax
Rate
Malaysia 26.0% 26.0% 25.0% 25.0% 25.0% 25.0% 25.0%
Italy 43.0% 43.0% 43.0% 43.0% 43.0% 43.0% 43.0%
Canada 29.0% 29.0% 29.0% 33.0% 33.0% 33.0% 33.0%
Serbia 15.0% 15.0% 15.0% 15.0% 15.0% 15.0% 15.0%
Russian Federation 13.0% 13.0% 13.0% 13.0% 13.0% 13.0% 13.0%
Brazil 27.5% 27.5% 27.5% 27.5% 27.5% 27.5% 27.5%
Chile 40.0% 40.0% 40.0% 35.0% 35.0% 35.0% 35.0%
Australia 45.0% 45.0% 45.0% 45.0% 45.0% 45.0% 45.0%
Turkey 35.0% 35.0% 35.0% 35.0% 35.0% 35.0% 35.0%
Costa Rica 25.0% 25.0% 25.0% 25.0% 25.0% 25.0% 25.0%
Spain 52.0% 52.0% 47.0% 45.0% 45.0% 45.0% 45.0%
Netherlands 52.0% 52.0% 52.0% 52.0% 52.0% 52.0% 52.0%
Uruguay 30.0% 30.0% 30.0% 30.0% 30.0% 30.0% 30.0%
Bulgaria 10.0% 10.0% 10.0% 10.0% 10.0% 10.0% 10.0%
Saudi Arabia 2.5% 2.5% 2.5% 2.5% 2.5% 2.5% 2.5%
Switzerland 41.5% 40.0% 40.0% 40.0% 40.0% 40.0% 40.0%
Ukraine 17.0% 17.0% 20.0% 20.0% 20.0% 20.0% 20.0%
Sweden 57.0% 57.0% 57.0% 57.0% 57.0% 57.0% 57.0%
Mauritius 15.0% 15.0% 15.0% 15.0% 15.0% 15.0% 15.0%
Uganda 30.0% 40.0% 40.0% 40.0% 40.0% 40.0% 40.0%
Belgium 50.0% 50.0% 50.0% 50.0% 50.0% 50.0% 50.0%
Austria 50.0% 50.0% 50.0% 50.0% 50.0% 50.0% 50.0%
Egypt, Arab Rep. 25.0% 25.0% 25.0% 25.0% 25.0% 25.0% 25.0%
China 45.0% 45.0% 45.0% 45.0% 45.0% 45.0% 45.0%
Botswana 25.0% 25.0% 25.0% 25.0% 25.0% 25.0% 25.0%
Jamaica 25.0% 25.0% 25.0% 25.0% 25.0% 25.0% 25.0%
Namibia 37.0% 37.0% 37.0% 37.0% 37.0% 37.0% 37.0%
Kazakhstan 10.0% 10.0% 10.0% 10.0% 10.0% 10.0% 10.0%
Romania 16.0% 16.0% 16.0% 16.0% 16.0% 16.0% 16.0%
Zimbabwe 46.4% 45.0% 51.5% 51.5% 51.5% 51.5% 51.5%
Argentina 35.0% 35.0% 35.0% 35.0% 35.0% 35.0% 35.0%
Israel 48.0% 48.0% 48.0% 48.0% 48.0% 48.0% 48.0%
Dominican Republic 25.0% 25.0% 25.0% 25.0% 25.0% 25.0% 25.0%
Nigeria 24.0% 24.0% 24.0% 24.0% 24.0% 24.0% 24.0%
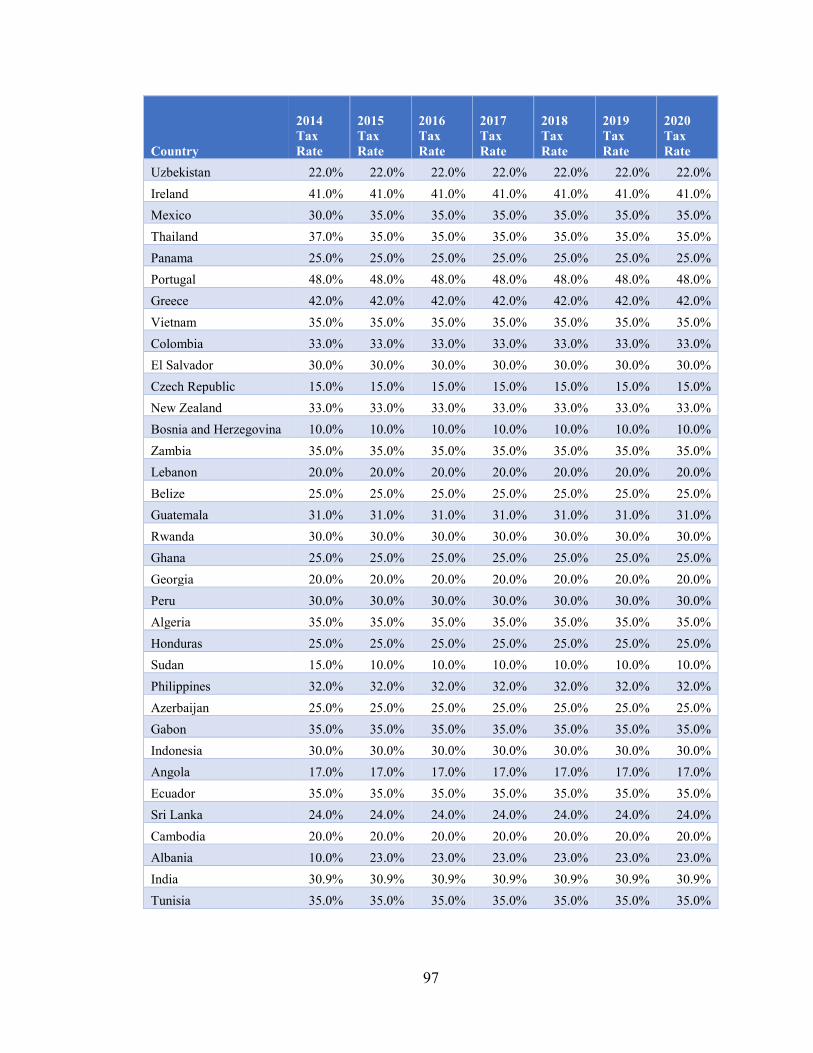
97
Country
2014
Tax
Rate
2015
Tax
Rate
2016
Tax
Rate
2017
Tax
Rate
2018
Tax
Rate
2019
Tax
Rate
2020
Tax
Rate
Uzbekistan 22.0% 22.0% 22.0% 22.0% 22.0% 22.0% 22.0%
Ireland 41.0% 41.0% 41.0% 41.0% 41.0% 41.0% 41.0%
Mexico 30.0% 35.0% 35.0% 35.0% 35.0% 35.0% 35.0%
Thailand 37.0% 35.0% 35.0% 35.0% 35.0% 35.0% 35.0%
Panama 25.0% 25.0% 25.0% 25.0% 25.0% 25.0% 25.0%
Portugal 48.0% 48.0% 48.0% 48.0% 48.0% 48.0% 48.0%
Greece 42.0% 42.0% 42.0% 42.0% 42.0% 42.0% 42.0%
Vietnam 35.0% 35.0% 35.0% 35.0% 35.0% 35.0% 35.0%
Colombia 33.0% 33.0% 33.0% 33.0% 33.0% 33.0% 33.0%
El Salvador 30.0% 30.0% 30.0% 30.0% 30.0% 30.0% 30.0%
Czech Republic 15.0% 15.0% 15.0% 15.0% 15.0% 15.0% 15.0%
New Zealand 33.0% 33.0% 33.0% 33.0% 33.0% 33.0% 33.0%
Bosnia and Herzegovina 10.0% 10.0% 10.0% 10.0% 10.0% 10.0% 10.0%
Zambia 35.0% 35.0% 35.0% 35.0% 35.0% 35.0% 35.0%
Lebanon 20.0% 20.0% 20.0% 20.0% 20.0% 20.0% 20.0%
Belize 25.0% 25.0% 25.0% 25.0% 25.0% 25.0% 25.0%
Guatemala 31.0% 31.0% 31.0% 31.0% 31.0% 31.0% 31.0%
Rwanda 30.0% 30.0% 30.0% 30.0% 30.0% 30.0% 30.0%
Ghana 25.0% 25.0% 25.0% 25.0% 25.0% 25.0% 25.0%
Georgia 20.0% 20.0% 20.0% 20.0% 20.0% 20.0% 20.0%
Peru 30.0% 30.0% 30.0% 30.0% 30.0% 30.0% 30.0%
Algeria 35.0% 35.0% 35.0% 35.0% 35.0% 35.0% 35.0%
Honduras 25.0% 25.0% 25.0% 25.0% 25.0% 25.0% 25.0%
Sudan 15.0% 10.0% 10.0% 10.0% 10.0% 10.0% 10.0%
Philippines 32.0% 32.0% 32.0% 32.0% 32.0% 32.0% 32.0%
Azerbaijan 25.0% 25.0% 25.0% 25.0% 25.0% 25.0% 25.0%
Gabon 35.0% 35.0% 35.0% 35.0% 35.0% 35.0% 35.0%
Indonesia 30.0% 30.0% 30.0% 30.0% 30.0% 30.0% 30.0%
Angola 17.0% 17.0% 17.0% 17.0% 17.0% 17.0% 17.0%
Ecuador 35.0% 35.0% 35.0% 35.0% 35.0% 35.0% 35.0%
Sri Lanka 24.0% 24.0% 24.0% 24.0% 24.0% 24.0% 24.0%
Cambodia 20.0% 20.0% 20.0% 20.0% 20.0% 20.0% 20.0%
Albania 10.0% 23.0% 23.0% 23.0% 23.0% 23.0% 23.0%
India 30.9% 30.9% 30.9% 30.9% 30.9% 30.9% 30.9%
Tunisia 35.0% 35.0% 35.0% 35.0% 35.0% 35.0% 35.0%
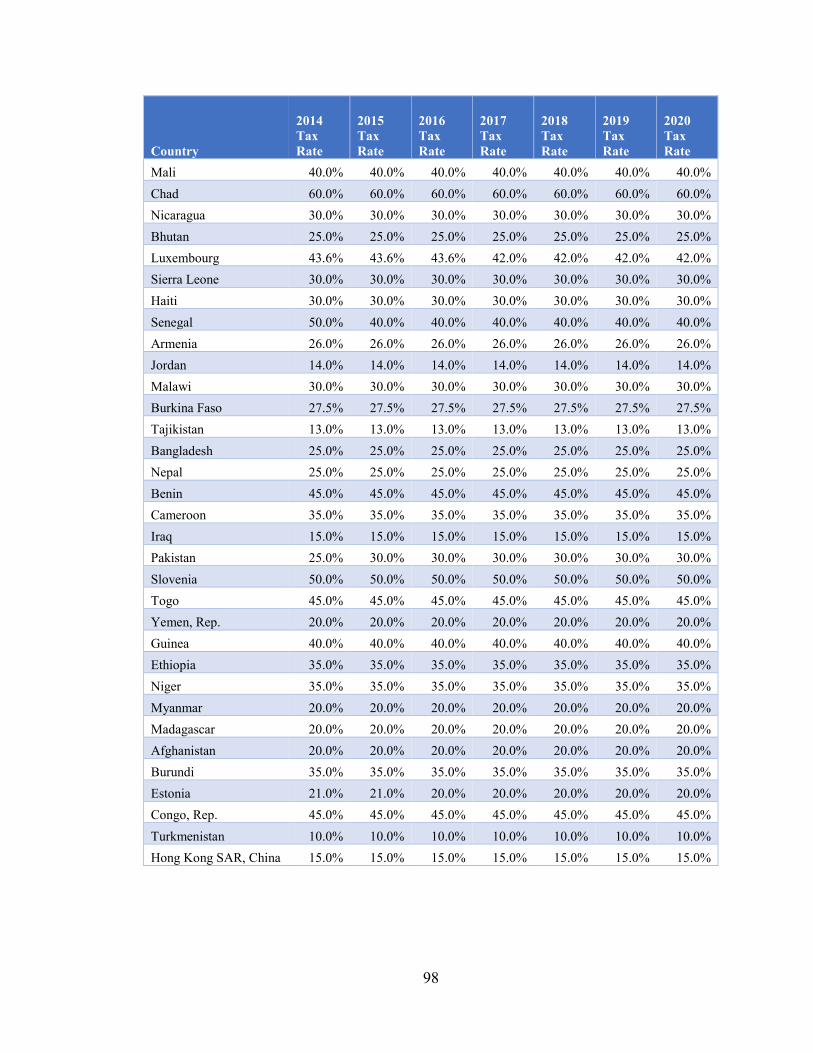
98
Country
2014
Tax
Rate
2015
Tax
Rate
2016
Tax
Rate
2017
Tax
Rate
2018
Tax
Rate
2019
Tax
Rate
2020
Tax
Rate
Mali 40.0% 40.0% 40.0% 40.0% 40.0% 40.0% 40.0%
Chad 60.0% 60.0% 60.0% 60.0% 60.0% 60.0% 60.0%
Nicaragua 30.0% 30.0% 30.0% 30.0% 30.0% 30.0% 30.0%
Bhutan 25.0% 25.0% 25.0% 25.0% 25.0% 25.0% 25.0%
Luxembourg 43.6% 43.6% 43.6% 42.0% 42.0% 42.0% 42.0%
Sierra Leone 30.0% 30.0% 30.0% 30.0% 30.0% 30.0% 30.0%
Haiti 30.0% 30.0% 30.0% 30.0% 30.0% 30.0% 30.0%
Senegal 50.0% 40.0% 40.0% 40.0% 40.0% 40.0% 40.0%
Armenia 26.0% 26.0% 26.0% 26.0% 26.0% 26.0% 26.0%
Jordan 14.0% 14.0% 14.0% 14.0% 14.0% 14.0% 14.0%
Malawi 30.0% 30.0% 30.0% 30.0% 30.0% 30.0% 30.0%
Burkina Faso 27.5% 27.5% 27.5% 27.5% 27.5% 27.5% 27.5%
Tajikistan 13.0% 13.0% 13.0% 13.0% 13.0% 13.0% 13.0%
Bangladesh 25.0% 25.0% 25.0% 25.0% 25.0% 25.0% 25.0%
Nepal 25.0% 25.0% 25.0% 25.0% 25.0% 25.0% 25.0%
Benin 45.0% 45.0% 45.0% 45.0% 45.0% 45.0% 45.0%
Cameroon 35.0% 35.0% 35.0% 35.0% 35.0% 35.0% 35.0%
Iraq 15.0% 15.0% 15.0% 15.0% 15.0% 15.0% 15.0%
Pakistan 25.0% 30.0% 30.0% 30.0% 30.0% 30.0% 30.0%
Slovenia 50.0% 50.0% 50.0% 50.0% 50.0% 50.0% 50.0%
Togo 45.0% 45.0% 45.0% 45.0% 45.0% 45.0% 45.0%
Yemen, Rep. 20.0% 20.0% 20.0% 20.0% 20.0% 20.0% 20.0%
Guinea 40.0% 40.0% 40.0% 40.0% 40.0% 40.0% 40.0%
Ethiopia 35.0% 35.0% 35.0% 35.0% 35.0% 35.0% 35.0%
Niger 35.0% 35.0% 35.0% 35.0% 35.0% 35.0% 35.0%
Myanmar 20.0% 20.0% 20.0% 20.0% 20.0% 20.0% 20.0%
Madagascar 20.0% 20.0% 20.0% 20.0% 20.0% 20.0% 20.0%
Afghanistan 20.0% 20.0% 20.0% 20.0% 20.0% 20.0% 20.0%
Burundi 35.0% 35.0% 35.0% 35.0% 35.0% 35.0% 35.0%
Estonia 21.0% 21.0% 20.0% 20.0% 20.0% 20.0% 20.0%
Congo, Rep. 45.0% 45.0% 45.0% 45.0% 45.0% 45.0% 45.0%
Turkmenistan 10.0% 10.0% 10.0% 10.0% 10.0% 10.0% 10.0%
Hong Kong SAR, China 15.0% 15.0% 15.0% 15.0% 15.0% 15.0% 15.0%
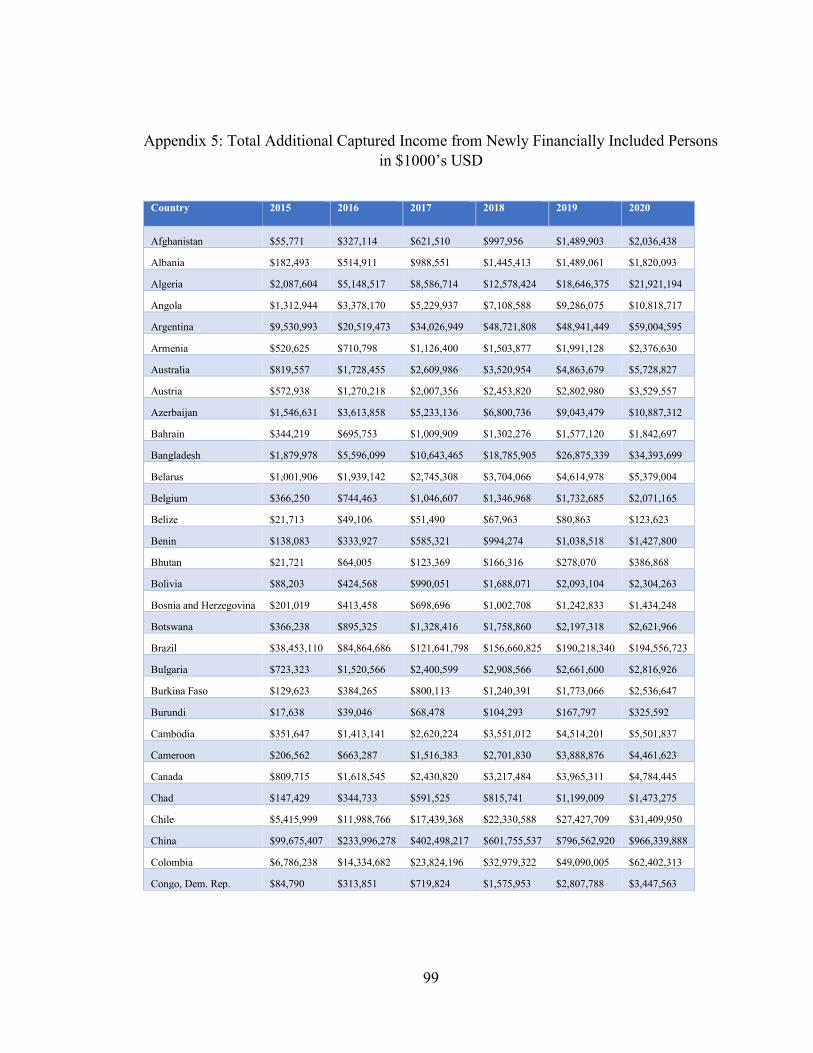
99
Appendix 5: Total Additional Captured Income from Newly Financially Included Persons
in $1000’s USD
Country
2015 2016 2017 2018 2019 2020
Afghanistan $55,771 $327,114 $621,510 $997,956 $1,489,903 $2,036,438
Albania $182,493 $514,911 $988,551 $1,445,413 $1,489,061 $1,820,093
Algeria $2,087,604 $5,148,517 $8,586,714 $12,578,424 $18,646,375 $21,921,194
Angola $1,312,944 $3,378,170 $5,229,937 $7,108,588 $9,286,075 $10,818,717
Argentina $9,530,993 $20,519,473 $34,026,949 $48,721,808 $48,941,449 $59,004,595
Armenia $520,625 $710,798 $1,126,400 $1,503,877 $1,991,128 $2,376,630
Australia $819,557 $1,728,455 $2,609,986 $3,520,954 $4,863,679 $5,728,827
Austria $572,938 $1,270,218 $2,007,356 $2,453,820 $2,802,980 $3,529,557
Azerbaijan $1,546,631 $3,613,858 $5,233,136 $6,800,736 $9,043,479 $10,887,312
Bahrain $344,219 $695,753 $1,009,909 $1,302,276 $1,577,120 $1,842,697
Bangladesh $1,879,978 $5,596,099 $10,643,465 $18,785,905 $26,875,339 $34,393,699
Belarus $1,001,906 $1,939,142 $2,745,308 $3,704,066 $4,614,978 $5,379,004
Belgium $366,250 $744,463 $1,046,607 $1,346,968 $1,732,685 $2,071,165
Belize $21,713 $49,106 $51,490 $67,963 $80,863 $123,623
Benin $138,083 $333,927 $585,321 $994,274 $1,038,518 $1,427,800
Bhutan $21,721 $64,005 $123,369 $166,316 $278,070 $386,868
Bolivia $88,203 $424,568 $990,051 $1,688,071 $2,093,104 $2,304,263
Bosnia and Herzegovina $201,019 $413,458 $698,696 $1,002,708 $1,242,833 $1,434,248
Botswana $366,238 $895,325 $1,328,416 $1,758,860 $2,197,318 $2,621,966
Brazil $38,453,110 $84,864,686 $121,641,798 $156,660,825 $190,218,340 $194,556,723
Bulgaria $723,323 $1,520,566 $2,400,599 $2,908,566 $2,661,600 $2,816,926
Burkina Faso $129,623 $384,265 $800,113 $1,240,391 $1,773,066 $2,536,647
Burundi $17,638 $39,046 $68,478 $104,293 $167,797 $325,592
Cambodia $351,647 $1,413,141 $2,620,224 $3,551,012 $4,514,201 $5,501,837
Cameroon $206,562 $663,287 $1,516,383 $2,701,830 $3,888,876 $4,461,623
Canada $809,715 $1,618,545 $2,430,820 $3,217,484 $3,965,311 $4,784,445
Chad $147,429 $344,733 $591,525 $815,741 $1,199,009 $1,473,275
Chile $5,415,999 $11,988,766 $17,439,368 $22,330,588 $27,427,709 $31,409,950
China $99,675,407 $233,996,278 $402,498,217 $601,755,537 $796,562,920 $966,339,888
Colombia $6,786,238 $14,334,682 $23,824,196 $32,979,322 $49,090,005 $62,402,313
Congo, Dem. Rep. $84,790 $313,851 $719,824 $1,575,953 $2,807,788 $3,447,563
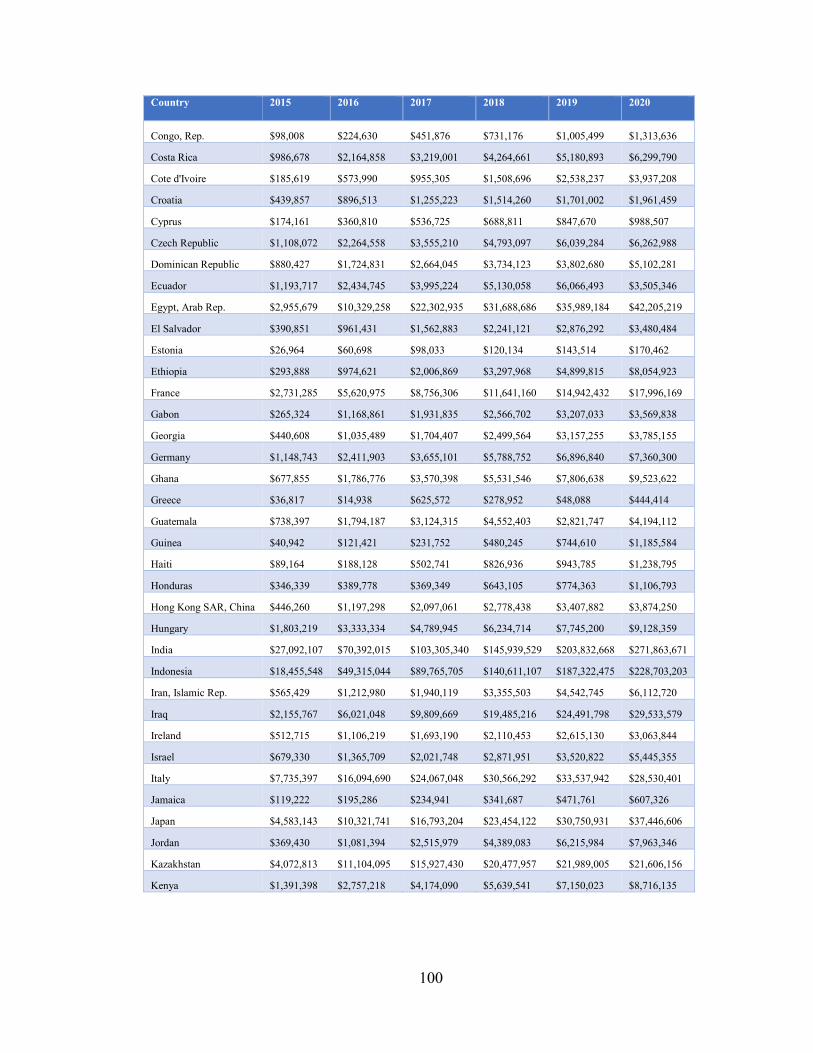
100
Country
2015 2016 2017 2018 2019 2020
Congo, Rep. $98,008 $224,630 $451,876 $731,176 $1,005,499 $1,313,636
Costa Rica $986,678 $2,164,858 $3,219,001 $4,264,661 $5,180,893 $6,299,790
Cote d'Ivoire $185,619 $573,990 $955,305 $1,508,696 $2,538,237 $3,937,208
Croatia $439,857 $896,513 $1,255,223 $1,514,260 $1,701,002 $1,961,459
Cyprus $174,161 $360,810 $536,725 $688,811 $847,670 $988,507
Czech Republic $1,108,072 $2,264,558 $3,555,210 $4,793,097 $6,039,284 $6,262,988
Dominican Republic $880,427 $1,724,831 $2,664,045 $3,734,123 $3,802,680 $5,102,281
Ecuador $1,193,717 $2,434,745 $3,995,224 $5,130,058 $6,066,493 $3,505,346
Egypt, Arab Rep. $2,955,679 $10,329,258 $22,302,935 $31,688,686 $35,989,184 $42,205,219
El Salvador $390,851 $961,431 $1,562,883 $2,241,121 $2,876,292 $3,480,484
Estonia $26,964 $60,698 $98,033 $120,134 $143,514 $170,462
Ethiopia $293,888 $974,621 $2,006,869 $3,297,968 $4,899,815 $8,054,923
France $2,731,285 $5,620,975 $8,756,306 $11,641,160 $14,942,432 $17,996,169
Gabon $265,324 $1,168,861 $1,931,835 $2,566,702 $3,207,033 $3,569,838
Georgia $440,608 $1,035,489 $1,704,407 $2,499,564 $3,157,255 $3,785,155
Germany $1,148,743 $2,411,903 $3,655,101 $5,788,752 $6,896,840 $7,360,300
Ghana $677,855 $1,786,776 $3,570,398 $5,531,546 $7,806,638 $9,523,622
Greece $36,817 $14,938 $625,572 $278,952 $48,088 $444,414
Guatemala $738,397 $1,794,187 $3,124,315 $4,552,403 $2,821,747 $4,194,112
Guinea $40,942 $121,421 $231,752 $480,245 $744,610 $1,185,584
Haiti $89,164 $188,128 $502,741 $826,936 $943,785 $1,238,795
Honduras $346,339 $389,778 $369,349 $643,105 $774,363 $1,106,793
Hong Kong SAR, China $446,260 $1,197,298 $2,097,061 $2,778,438 $3,407,882 $3,874,250
Hungary $1,803,219 $3,333,334 $4,789,945 $6,234,714 $7,745,200 $9,128,359
India $27,092,107 $70,392,015 $103,305,340 $145,939,529 $203,832,668 $271,863,671
Indonesia $18,455,548 $49,315,044 $89,765,705 $140,611,107 $187,322,475 $228,703,203
Iran, Islamic Rep. $565,429 $1,212,980 $1,940,119 $3,355,503 $4,542,745 $6,112,720
Iraq $2,155,767 $6,021,048 $9,809,669 $19,485,216 $24,491,798 $29,533,579
Ireland $512,715 $1,106,219 $1,693,190 $2,110,453 $2,615,130 $3,063,844
Israel $679,330 $1,365,709 $2,021,748 $2,871,951 $3,520,822 $5,445,355
Italy $7,735,397 $16,094,690 $24,067,048 $30,566,292 $33,537,942 $28,530,401
Jamaica $119,222 $195,286 $234,941 $341,687 $471,761 $607,326
Japan $4,583,143 $10,321,741 $16,793,204 $23,454,122 $30,750,931 $37,446,606
Jordan $369,430 $1,081,394 $2,515,979 $4,389,083 $6,215,984 $7,963,346
Kazakhstan $4,072,813 $11,104,095 $15,927,430 $20,477,957 $21,989,005 $21,606,156
Kenya $1,391,398 $2,757,218 $4,174,090 $5,639,541 $7,150,023 $8,716,135
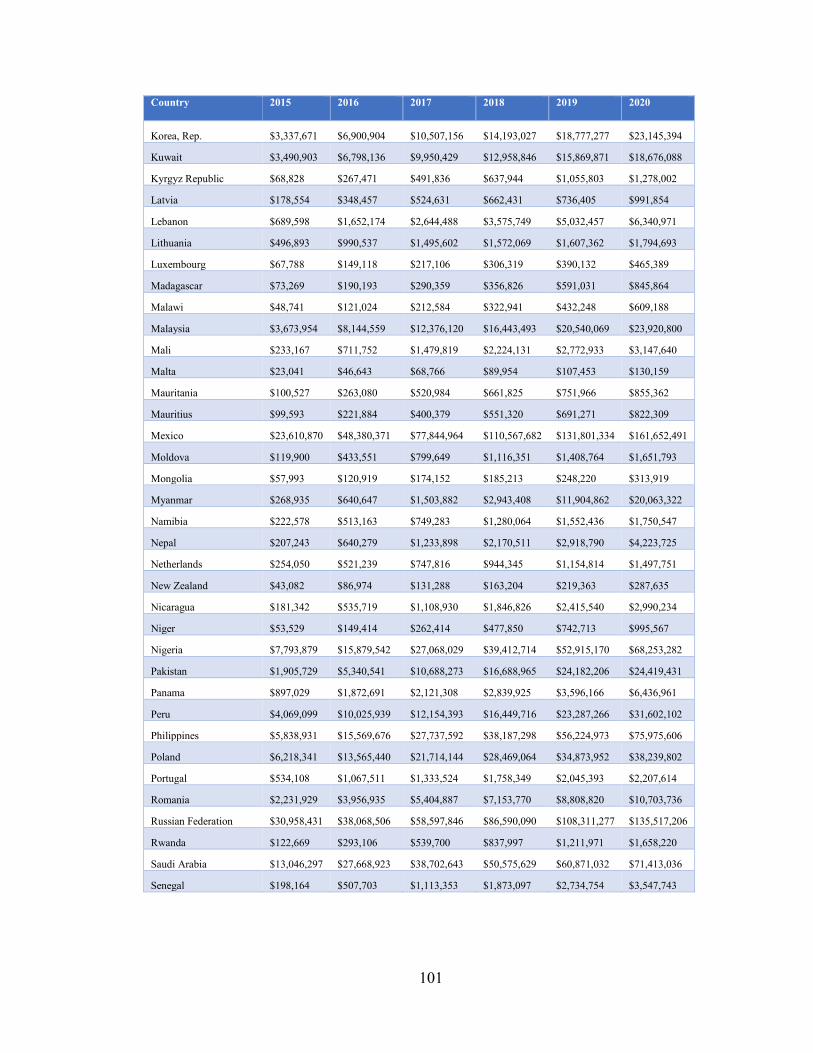
101
Country
2015 2016 2017 2018 2019 2020
Korea, Rep. $3,337,671 $6,900,904 $10,507,156 $14,193,027 $18,777,277 $23,145,394
Kuwait $3,490,903 $6,798,136 $9,950,429 $12,958,846 $15,869,871 $18,676,088
Kyrgyz Republic $68,828 $267,471 $491,836 $637,944 $1,055,803 $1,278,002
Latvia $178,554 $348,457 $524,631 $662,431 $736,405 $991,854
Lebanon $689,598 $1,652,174 $2,644,488 $3,575,749 $5,032,457 $6,340,971
Lithuania $496,893 $990,537 $1,495,602 $1,572,069 $1,607,362 $1,794,693
Luxembourg $67,788 $149,118 $217,106 $306,319 $390,132 $465,389
Madagascar $73,269 $190,193 $290,359 $356,826 $591,031 $845,864
Malawi $48,741 $121,024 $212,584 $322,941 $432,248 $609,188
Malaysia $3,673,954 $8,144,559 $12,376,120 $16,443,493 $20,540,069 $23,920,800
Mali $233,167 $711,752 $1,479,819 $2,224,131 $2,772,933 $3,147,640
Malta $23,041 $46,643 $68,766 $89,954 $107,453 $130,159
Mauritania $100,527 $263,080 $520,984 $661,825 $751,966 $855,362
Mauritius $99,593 $221,884 $400,379 $551,320 $691,271 $822,309
Mexico $23,610,870 $48,380,371 $77,844,964 $110,567,682 $131,801,334 $161,652,491
Moldova $119,900 $433,551 $799,649 $1,116,351 $1,408,764 $1,651,793
Mongolia $57,993 $120,919 $174,152 $185,213 $248,220 $313,919
Myanmar $268,935 $640,647 $1,503,882 $2,943,408 $11,904,862 $20,063,322
Namibia $222,578 $513,163 $749,283 $1,280,064 $1,552,436 $1,750,547
Nepal $207,243 $640,279 $1,233,898 $2,170,511 $2,918,790 $4,223,725
Netherlands $254,050 $521,239 $747,816 $944,345 $1,154,814 $1,497,751
New Zealand $43,082 $86,974 $131,288 $163,204 $219,363 $287,635
Nicaragua $181,342 $535,719 $1,108,930 $1,846,826 $2,415,540 $2,990,234
Niger $53,529 $149,414 $262,414 $477,850 $742,713 $995,567
Nigeria $7,793,879 $15,879,542 $27,068,029 $39,412,714 $52,915,170 $68,253,282
Pakistan $1,905,729 $5,340,541 $10,688,273 $16,688,965 $24,182,206 $24,419,431
Panama $897,029 $1,872,691 $2,121,308 $2,839,925 $3,596,166 $6,436,961
Peru $4,069,099 $10,025,939 $12,154,393 $16,449,716 $23,287,266 $31,602,102
Philippines $5,838,931 $15,569,676 $27,737,592 $38,187,298 $56,224,973 $75,975,606
Poland $6,218,341 $13,565,440 $21,714,144 $28,469,064 $34,873,952 $38,239,802
Portugal $534,108 $1,067,511 $1,333,524 $1,758,349 $2,045,393 $2,207,614
Romania $2,231,929 $3,956,935 $5,404,887 $7,153,770 $8,808,820 $10,703,736
Russian Federation $30,958,431 $38,068,506 $58,597,846 $86,590,090 $108,311,277 $135,517,206
Rwanda $122,669 $293,106 $539,700 $837,997 $1,211,971 $1,658,220
Saudi Arabia $13,046,297 $27,668,923 $38,702,643 $50,575,629 $60,871,032 $71,413,036
Senegal $198,164 $507,703 $1,113,353 $1,873,097 $2,734,754 $3,547,743
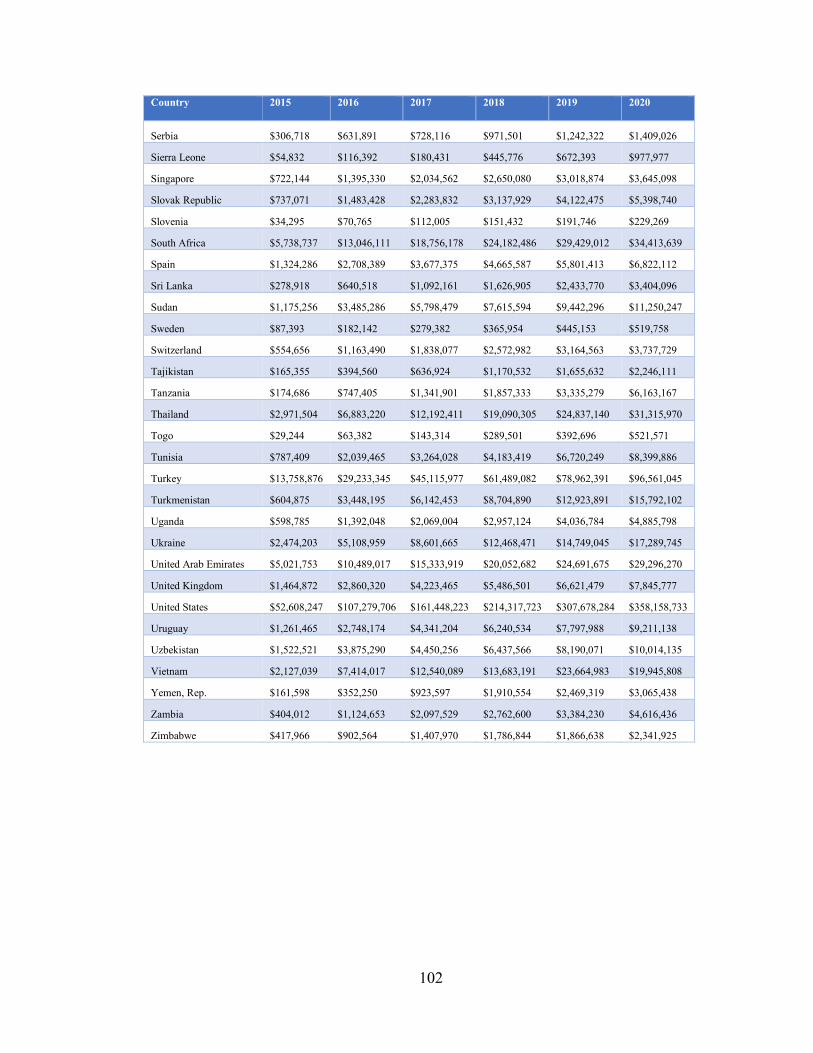
102
Country
2015 2016 2017 2018 2019 2020
Serbia $306,718 $631,891 $728,116 $971,501 $1,242,322 $1,409,026
Sierra Leone $54,832 $116,392 $180,431 $445,776 $672,393 $977,977
Singapore $722,144 $1,395,330 $2,034,562 $2,650,080 $3,018,874 $3,645,098
Slovak Republic $737,071 $1,483,428 $2,283,832 $3,137,929 $4,122,475 $5,398,740
Slovenia $34,295 $70,765 $112,005 $151,432 $191,746 $229,269
South Africa $5,738,737 $13,046,111 $18,756,178 $24,182,486 $29,429,012 $34,413,639
Spain $1,324,286 $2,708,389 $3,677,375 $4,665,587 $5,801,413 $6,822,112
Sri Lanka $278,918 $640,518 $1,092,161 $1,626,905 $2,433,770 $3,404,096
Sudan $1,175,256 $3,485,286 $5,798,479 $7,615,594 $9,442,296 $11,250,247
Sweden $87,393 $182,142 $279,382 $365,954 $445,153 $519,758
Switzerland $554,656 $1,163,490 $1,838,077 $2,572,982 $3,164,563 $3,737,729
Tajikistan $165,355 $394,560 $636,924 $1,170,532 $1,655,632 $2,246,111
Tanzania $174,686 $747,405 $1,341,901 $1,857,333 $3,335,279 $6,163,167
Thailand $2,971,504 $6,883,220 $12,192,411 $19,090,305 $24,837,140 $31,315,970
Togo $29,244 $63,382 $143,314 $289,501 $392,696 $521,571
Tunisia $787,409 $2,039,465 $3,264,028 $4,183,419 $6,720,249 $8,399,886
Turkey $13,758,876 $29,233,345 $45,115,977 $61,489,082 $78,962,391 $96,561,045
Turkmenistan $604,875 $3,448,195 $6,142,453 $8,704,890 $12,923,891 $15,792,102
Uganda $598,785 $1,392,048 $2,069,004 $2,957,124 $4,036,784 $4,885,798
Ukraine $2,474,203 $5,108,959 $8,601,665 $12,468,471 $14,749,045 $17,289,745
United Arab Emirates $5,021,753 $10,489,017 $15,333,919 $20,052,682 $24,691,675 $29,296,270
United Kingdom $1,464,872 $2,860,320 $4,223,465 $5,486,501 $6,621,479 $7,845,777
United States $52,608,247 $107,279,706 $161,448,223 $214,317,723 $307,678,284 $358,158,733
Uruguay $1,261,465 $2,748,174 $4,341,204 $6,240,534 $7,797,988 $9,211,138
Uzbekistan $1,522,521 $3,875,290 $4,450,256 $6,437,566 $8,190,071 $10,014,135
Vietnam $2,127,039 $7,414,017 $12,540,089 $13,683,191 $23,664,983 $19,945,808
Yemen, Rep. $161,598 $352,250 $923,597 $1,910,554 $2,469,319 $3,065,438
Zambia $404,012 $1,124,653 $2,097,529 $2,762,600 $3,384,230 $4,616,436
Zimbabwe $417,966 $902,564 $1,407,970 $1,786,844 $1,866,638 $2,341,925
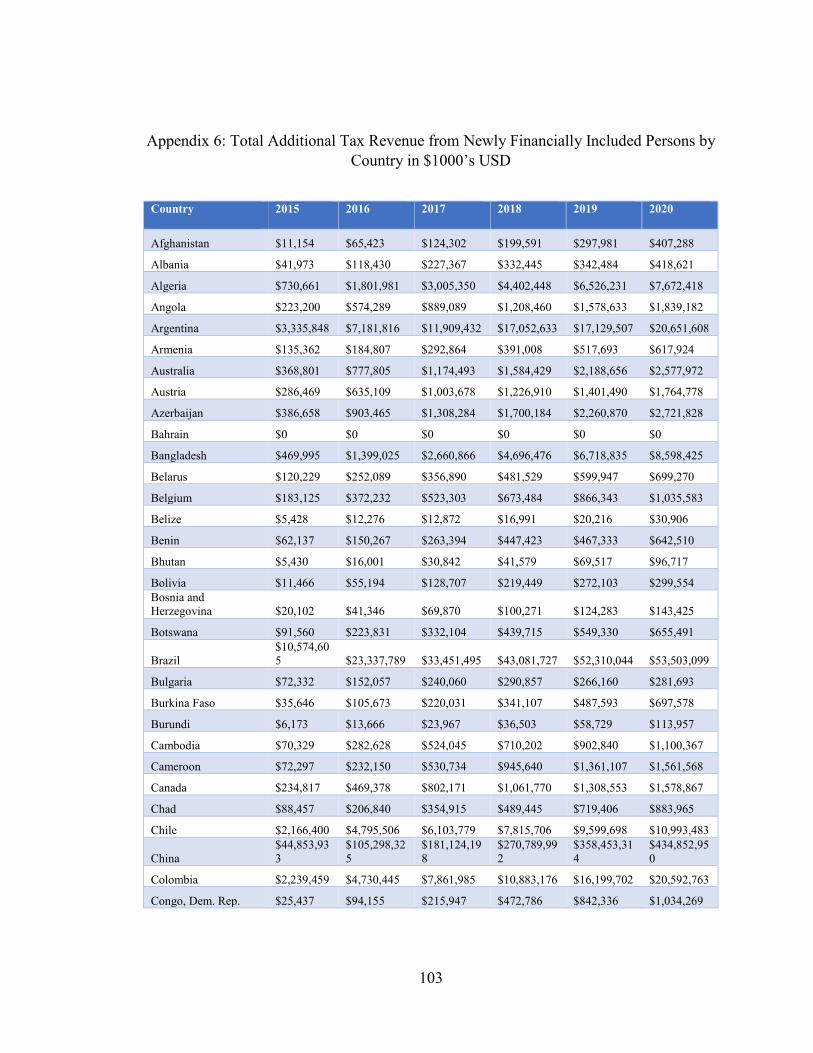
103
Appendix 6: Total Additional Tax Revenue from Newly Financially Included Persons by
Country in $1000’s USD
Country
2015 2016 2017 2018 2019 2020
Afghanistan $11,154 $65,423 $124,302 $199,591 $297,981 $407,288
Albania $41,973 $118,430 $227,367 $332,445 $342,484 $418,621
Algeria $730,661 $1,801,981 $3,005,350 $4,402,448 $6,526,231 $7,672,418
Angola $223,200 $574,289 $889,089 $1,208,460 $1,578,633 $1,839,182
Argentina $3,335,848 $7,181,816 $11,909,432 $17,052,633 $17,129,507 $20,651,608
Armenia $135,362 $184,807 $292,864 $391,008 $517,693 $617,924
Australia $368,801 $777,805 $1,174,493 $1,584,429 $2,188,656 $2,577,972
Austria $286,469 $635,109 $1,003,678 $1,226,910 $1,401,490 $1,764,778
Azerbaijan $386,658 $903,465 $1,308,284 $1,700,184 $2,260,870 $2,721,828
Bahrain $0 $0 $0 $0 $0 $0
Bangladesh $469,995 $1,399,025 $2,660,866 $4,696,476 $6,718,835 $8,598,425
Belarus $120,229 $252,089 $356,890 $481,529 $599,947 $699,270
Belgium $183,125 $372,232 $523,303 $673,484 $866,343 $1,035,583
Belize $5,428 $12,276 $12,872 $16,991 $20,216 $30,906
Benin $62,137 $150,267 $263,394 $447,423 $467,333 $642,510
Bhutan $5,430 $16,001 $30,842 $41,579 $69,517 $96,717
Bolivia $11,466 $55,194 $128,707 $219,449 $272,103 $299,554
Bosnia and
Herzegovina $20,102 $41,346 $69,870 $100,271 $124,283 $143,425
Botswana $91,560 $223,831 $332,104 $439,715 $549,330 $655,491
Brazil
$10,574,60
5 $23,337,789 $33,451,495 $43,081,727 $52,310,044 $53,503,099
Bulgaria $72,332 $152,057 $240,060 $290,857 $266,160 $281,693
Burkina Faso $35,646 $105,673 $220,031 $341,107 $487,593 $697,578
Burundi $6,173 $13,666 $23,967 $36,503 $58,729 $113,957
Cambodia $70,329 $282,628 $524,045 $710,202 $902,840 $1,100,367
Cameroon $72,297 $232,150 $530,734 $945,640 $1,361,107 $1,561,568
Canada $234,817 $469,378 $802,171 $1,061,770 $1,308,553 $1,578,867
Chad $88,457 $206,840 $354,915 $489,445 $719,406 $883,965
Chile $2,166,400 $4,795,506 $6,103,779 $7,815,706 $9,599,698 $10,993,483
China
$44,853,93
3
$105,298,32
5
$181,124,19
8
$270,789,99
2
$358,453,31
4
$434,852,95
0
Colombia $2,239,459 $4,730,445 $7,861,985 $10,883,176 $16,199,702 $20,592,763
Congo, Dem. Rep. $25,437 $94,155 $215,947 $472,786 $842,336 $1,034,269
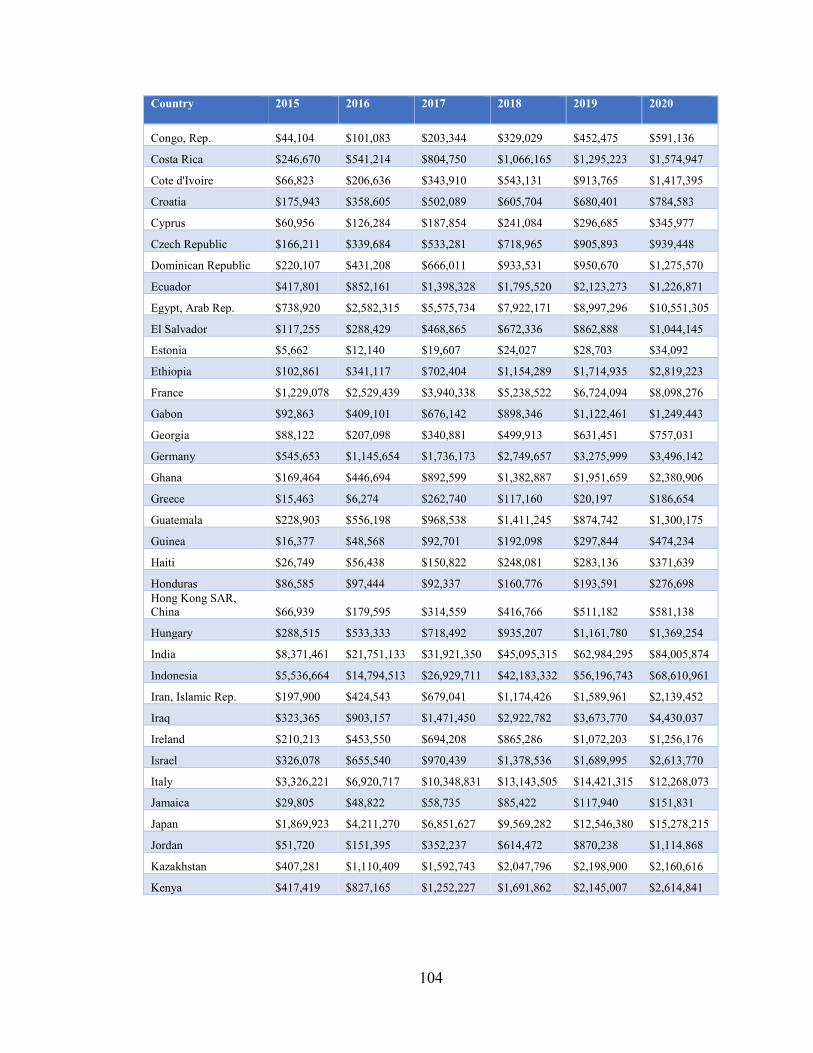
104
Country
2015 2016 2017 2018 2019 2020
Congo, Rep. $44,104 $101,083 $203,344 $329,029 $452,475 $591,136
Costa Rica $246,670 $541,214 $804,750 $1,066,165 $1,295,223 $1,574,947
Cote d'Ivoire $66,823 $206,636 $343,910 $543,131 $913,765 $1,417,395
Croatia $175,943 $358,605 $502,089 $605,704 $680,401 $784,583
Cyprus $60,956 $126,284 $187,854 $241,084 $296,685 $345,977
Czech Republic $166,211 $339,684 $533,281 $718,965 $905,893 $939,448
Dominican Republic $220,107 $431,208 $666,011 $933,531 $950,670 $1,275,570
Ecuador $417,801 $852,161 $1,398,328 $1,795,520 $2,123,273 $1,226,871
Egypt, Arab Rep. $738,920 $2,582,315 $5,575,734 $7,922,171 $8,997,296 $10,551,305
El Salvador $117,255 $288,429 $468,865 $672,336 $862,888 $1,044,145
Estonia $5,662 $12,140 $19,607 $24,027 $28,703 $34,092
Ethiopia $102,861 $341,117 $702,404 $1,154,289 $1,714,935 $2,819,223
France $1,229,078 $2,529,439 $3,940,338 $5,238,522 $6,724,094 $8,098,276
Gabon $92,863 $409,101 $676,142 $898,346 $1,122,461 $1,249,443
Georgia $88,122 $207,098 $340,881 $499,913 $631,451 $757,031
Germany $545,653 $1,145,654 $1,736,173 $2,749,657 $3,275,999 $3,496,142
Ghana $169,464 $446,694 $892,599 $1,382,887 $1,951,659 $2,380,906
Greece $15,463 $6,274 $262,740 $117,160 $20,197 $186,654
Guatemala $228,903 $556,198 $968,538 $1,411,245 $874,742 $1,300,175
Guinea $16,377 $48,568 $92,701 $192,098 $297,844 $474,234
Haiti $26,749 $56,438 $150,822 $248,081 $283,136 $371,639
Honduras $86,585 $97,444 $92,337 $160,776 $193,591 $276,698
Hong Kong SAR,
China $66,939 $179,595 $314,559 $416,766 $511,182 $581,138
Hungary $288,515 $533,333 $718,492 $935,207 $1,161,780 $1,369,254
India $8,371,461 $21,751,133 $31,921,350 $45,095,315 $62,984,295 $84,005,874
Indonesia $5,536,664 $14,794,513 $26,929,711 $42,183,332 $56,196,743 $68,610,961
Iran, Islamic Rep. $197,900 $424,543 $679,041 $1,174,426 $1,589,961 $2,139,452
Iraq $323,365 $903,157 $1,471,450 $2,922,782 $3,673,770 $4,430,037
Ireland $210,213 $453,550 $694,208 $865,286 $1,072,203 $1,256,176
Israel $326,078 $655,540 $970,439 $1,378,536 $1,689,995 $2,613,770
Italy $3,326,221 $6,920,717 $10,348,831 $13,143,505 $14,421,315 $12,268,073
Jamaica $29,805 $48,822 $58,735 $85,422 $117,940 $151,831
Japan $1,869,923 $4,211,270 $6,851,627 $9,569,282 $12,546,380 $15,278,215
Jordan $51,720 $151,395 $352,237 $614,472 $870,238 $1,114,868
Kazakhstan $407,281 $1,110,409 $1,592,743 $2,047,796 $2,198,900 $2,160,616
Kenya $417,419 $827,165 $1,252,227 $1,691,862 $2,145,007 $2,614,841
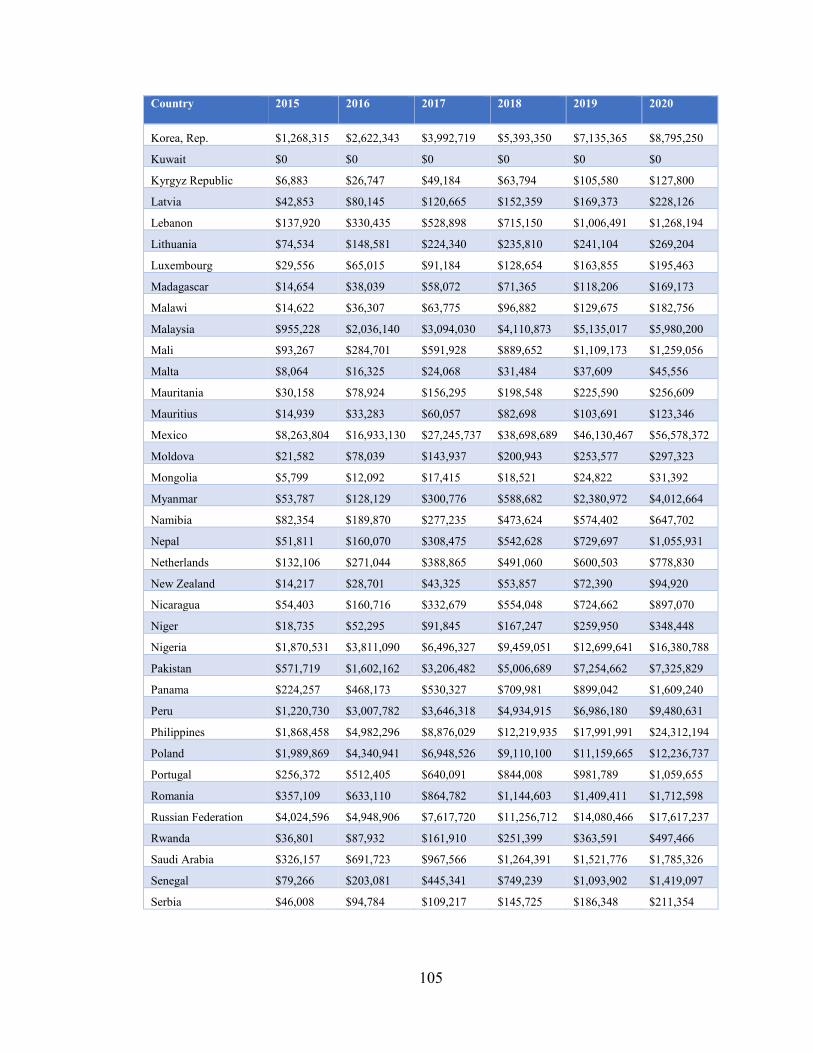
105
Country
2015 2016 2017 2018 2019 2020
Korea, Rep. $1,268,315 $2,622,343 $3,992,719 $5,393,350 $7,135,365 $8,795,250
Kuwait $0 $0 $0 $0 $0 $0
Kyrgyz Republic $6,883 $26,747 $49,184 $63,794 $105,580 $127,800
Latvia $42,853 $80,145 $120,665 $152,359 $169,373 $228,126
Lebanon $137,920 $330,435 $528,898 $715,150 $1,006,491 $1,268,194
Lithuania $74,534 $148,581 $224,340 $235,810 $241,104 $269,204
Luxembourg $29,556 $65,015 $91,184 $128,654 $163,855 $195,463
Madagascar $14,654 $38,039 $58,072 $71,365 $118,206 $169,173
Malawi $14,622 $36,307 $63,775 $96,882 $129,675 $182,756
Malaysia $955,228 $2,036,140 $3,094,030 $4,110,873 $5,135,017 $5,980,200
Mali $93,267 $284,701 $591,928 $889,652 $1,109,173 $1,259,056
Malta $8,064 $16,325 $24,068 $31,484 $37,609 $45,556
Mauritania $30,158 $78,924 $156,295 $198,548 $225,590 $256,609
Mauritius $14,939 $33,283 $60,057 $82,698 $103,691 $123,346
Mexico $8,263,804 $16,933,130 $27,245,737 $38,698,689 $46,130,467 $56,578,372
Moldova $21,582 $78,039 $143,937 $200,943 $253,577 $297,323
Mongolia $5,799 $12,092 $17,415 $18,521 $24,822 $31,392
Myanmar $53,787 $128,129 $300,776 $588,682 $2,380,972 $4,012,664
Namibia $82,354 $189,870 $277,235 $473,624 $574,402 $647,702
Nepal $51,811 $160,070 $308,475 $542,628 $729,697 $1,055,931
Netherlands $132,106 $271,044 $388,865 $491,060 $600,503 $778,830
New Zealand $14,217 $28,701 $43,325 $53,857 $72,390 $94,920
Nicaragua $54,403 $160,716 $332,679 $554,048 $724,662 $897,070
Niger $18,735 $52,295 $91,845 $167,247 $259,950 $348,448
Nigeria $1,870,531 $3,811,090 $6,496,327 $9,459,051 $12,699,641 $16,380,788
Pakistan $571,719 $1,602,162 $3,206,482 $5,006,689 $7,254,662 $7,325,829
Panama $224,257 $468,173 $530,327 $709,981 $899,042 $1,609,240
Peru $1,220,730 $3,007,782 $3,646,318 $4,934,915 $6,986,180 $9,480,631
Philippines $1,868,458 $4,982,296 $8,876,029 $12,219,935 $17,991,991 $24,312,194
Poland $1,989,869 $4,340,941 $6,948,526 $9,110,100 $11,159,665 $12,236,737
Portugal $256,372 $512,405 $640,091 $844,008 $981,789 $1,059,655
Romania $357,109 $633,110 $864,782 $1,144,603 $1,409,411 $1,712,598
Russian Federation $4,024,596 $4,948,906 $7,617,720 $11,256,712 $14,080,466 $17,617,237
Rwanda $36,801 $87,932 $161,910 $251,399 $363,591 $497,466
Saudi Arabia $326,157 $691,723 $967,566 $1,264,391 $1,521,776 $1,785,326
Senegal $79,266 $203,081 $445,341 $749,239 $1,093,902 $1,419,097
Serbia $46,008 $94,784 $109,217 $145,725 $186,348 $211,354
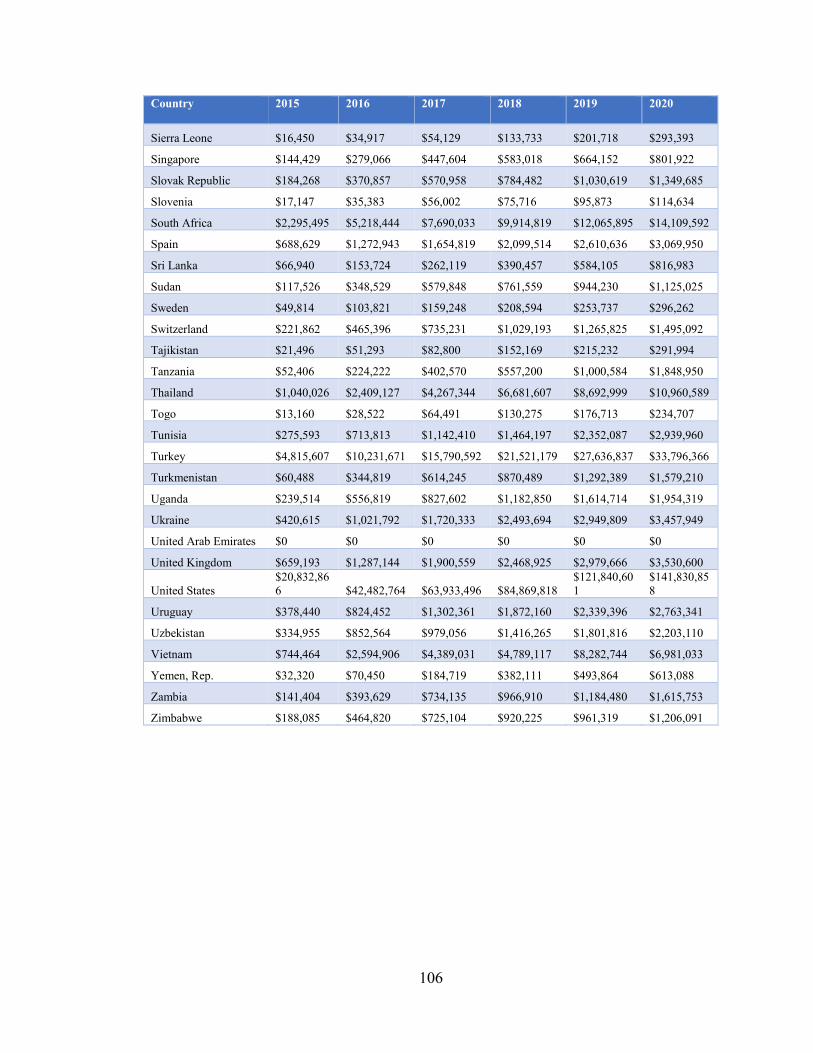
106
Country
2015 2016 2017 2018 2019 2020
Sierra Leone $16,450 $34,917 $54,129 $133,733 $201,718 $293,393
Singapore $144,429 $279,066 $447,604 $583,018 $664,152 $801,922
Slovak Republic $184,268 $370,857 $570,958 $784,482 $1,030,619 $1,349,685
Slovenia $17,147 $35,383 $56,002 $75,716 $95,873 $114,634
South Africa $2,295,495 $5,218,444 $7,690,033 $9,914,819 $12,065,895 $14,109,592
Spain $688,629 $1,272,943 $1,654,819 $2,099,514 $2,610,636 $3,069,950
Sri Lanka $66,940 $153,724 $262,119 $390,457 $584,105 $816,983
Sudan $117,526 $348,529 $579,848 $761,559 $944,230 $1,125,025
Sweden $49,814 $103,821 $159,248 $208,594 $253,737 $296,262
Switzerland $221,862 $465,396 $735,231 $1,029,193 $1,265,825 $1,495,092
Tajikistan $21,496 $51,293 $82,800 $152,169 $215,232 $291,994
Tanzania $52,406 $224,222 $402,570 $557,200 $1,000,584 $1,848,950
Thailand $1,040,026 $2,409,127 $4,267,344 $6,681,607 $8,692,999 $10,960,589
Togo $13,160 $28,522 $64,491 $130,275 $176,713 $234,707
Tunisia $275,593 $713,813 $1,142,410 $1,464,197 $2,352,087 $2,939,960
Turkey $4,815,607 $10,231,671 $15,790,592 $21,521,179 $27,636,837 $33,796,366
Turkmenistan $60,488 $344,819 $614,245 $870,489 $1,292,389 $1,579,210
Uganda $239,514 $556,819 $827,602 $1,182,850 $1,614,714 $1,954,319
Ukraine $420,615 $1,021,792 $1,720,333 $2,493,694 $2,949,809 $3,457,949
United Arab Emirates $0 $0 $0 $0 $0 $0
United Kingdom $659,193 $1,287,144 $1,900,559 $2,468,925 $2,979,666 $3,530,600
United States
$20,832,86
6 $42,482,764 $63,933,496 $84,869,818
$121,840,60
1
$141,830,85
8
Uruguay $378,440 $824,452 $1,302,361 $1,872,160 $2,339,396 $2,763,341
Uzbekistan $334,955 $852,564 $979,056 $1,416,265 $1,801,816 $2,203,110
Vietnam $744,464 $2,594,906 $4,389,031 $4,789,117 $8,282,744 $6,981,033
Yemen, Rep. $32,320 $70,450 $184,719 $382,111 $493,864 $613,088
Zambia $141,404 $393,629 $734,135 $966,910 $1,184,480 $1,615,753
Zimbabwe $188,085 $464,820 $725,104 $920,225 $961,319 $1,206,091
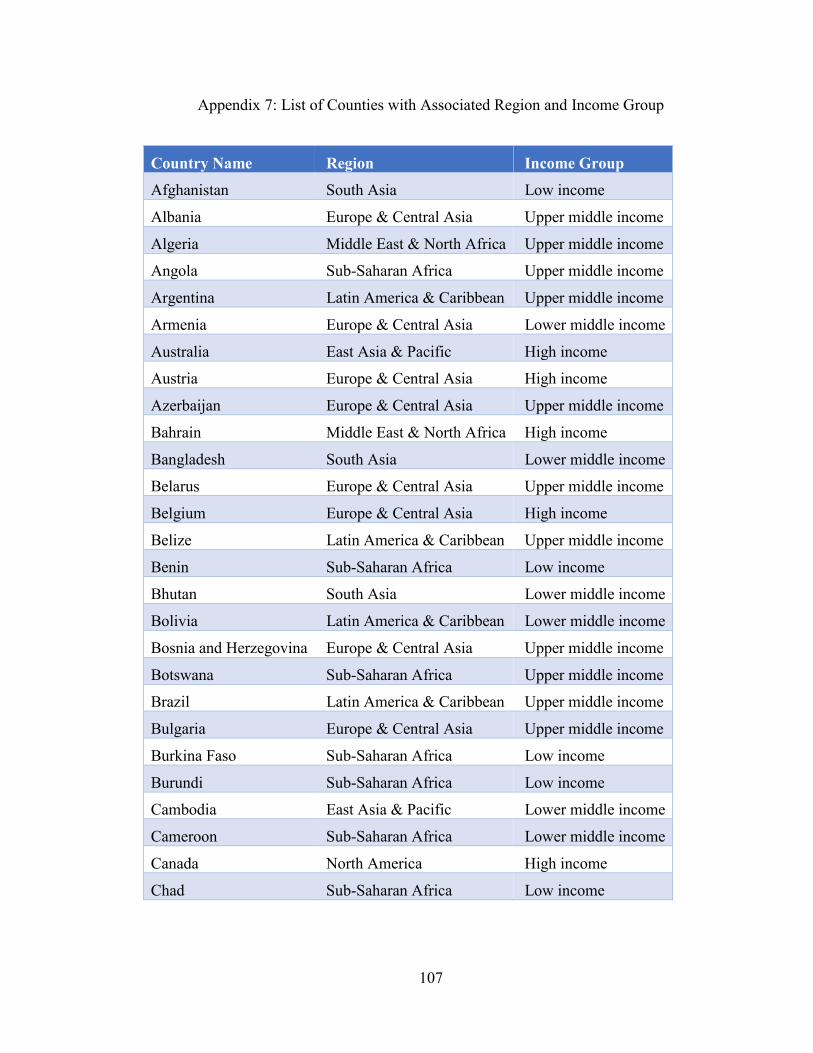
107
Appendix 7: List of Counties with Associated Region and Income Group
Country Name Region Income Group
Afghanistan South Asia Low income
Albania Europe & Central Asia Upper middle income
Algeria Middle East & North Africa Upper middle income
Angola Sub-Saharan Africa Upper middle income
Argentina Latin America & Caribbean Upper middle income
Armenia Europe & Central Asia Lower middle income
Australia East Asia & Pacific High income
Austria Europe & Central Asia High income
Azerbaijan Europe & Central Asia Upper middle income
Bahrain Middle East & North Africa High income
Bangladesh South Asia Lower middle income
Belarus Europe & Central Asia Upper middle income
Belgium Europe & Central Asia High income
Belize Latin America & Caribbean Upper middle income
Benin Sub-Saharan Africa Low income
Bhutan South Asia Lower middle income
Bolivia Latin America & Caribbean Lower middle income
Bosnia and Herzegovina Europe & Central Asia Upper middle income
Botswana Sub-Saharan Africa Upper middle income
Brazil Latin America & Caribbean Upper middle income
Bulgaria Europe & Central Asia Upper middle income
Burkina Faso Sub-Saharan Africa Low income
Burundi Sub-Saharan Africa Low income
Cambodia East Asia & Pacific Lower middle income
Cameroon Sub-Saharan Africa Lower middle income
Canada North America High income
Chad Sub-Saharan Africa Low income
108
Country Name Region Income Group
Chile Latin America & Caribbean High income
China East Asia & Pacific Upper middle income
Colombia Latin America & Caribbean Upper middle income
Congo, Dem. Rep. Sub-Saharan Africa Low income
Congo, Rep. Sub-Saharan Africa Lower middle income
Costa Rica Latin America & Caribbean Upper middle income
Cote d'Ivoire Sub-Saharan Africa Lower middle income
Croatia Europe & Central Asia High income
Cyprus Europe & Central Asia High income
Czech Republic Europe & Central Asia High income
Dominican Republic Latin America & Caribbean Upper middle income
Ecuador Latin America & Caribbean Upper middle income
Egypt, Arab Rep. Middle East & North Africa Lower middle income
El Salvador Latin America & Caribbean Lower middle income
Estonia Europe & Central Asia High income
Ethiopia Sub-Saharan Africa Low income
France Europe & Central Asia High income
Gabon Sub-Saharan Africa Upper middle income
Georgia Europe & Central Asia Upper middle income
Germany Europe & Central Asia High income
Ghana Sub-Saharan Africa Lower middle income
Greece Europe & Central Asia High income
Guatemala Latin America & Caribbean Lower middle income
Guinea Sub-Saharan Africa Low income
Haiti Latin America & Caribbean Low income
Honduras Latin America & Caribbean Lower middle income
Hong Kong SAR, China East Asia & Pacific High income
Hungary Europe & Central Asia High income
India South Asia Lower middle income
109
Country Name Region Income Group
Indonesia East Asia & Pacific Lower middle income
Iran, Islamic Rep. Middle East & North Africa Upper middle income
Iraq Middle East & North Africa Upper middle income
Ireland Europe & Central Asia High income
Israel Middle East & North Africa High income
Italy Europe & Central Asia High income
Jamaica Latin America & Caribbean Upper middle income
Japan East Asia & Pacific High income
Jordan Middle East & North Africa Upper middle income
Kazakhstan Europe & Central Asia Upper middle income
Kenya Sub-Saharan Africa Lower middle income
Korea, Rep. East Asia & Pacific High income
Kuwait Middle East & North Africa High income
Kyrgyz Republic Europe & Central Asia Lower middle income
Latvia Europe & Central Asia High income
Lebanon Middle East & North Africa Upper middle income
Lithuania Europe & Central Asia High income
Luxembourg Europe & Central Asia High income
Madagascar Sub-Saharan Africa Low income
Malawi Sub-Saharan Africa Low income
Malaysia East Asia & Pacific Upper middle income
Mali Sub-Saharan Africa Low income
Malta Middle East & North Africa High income
Mauritania Sub-Saharan Africa Lower middle income
Mauritius Sub-Saharan Africa Upper middle income
Mexico Latin America & Caribbean Upper middle income
Moldova Europe & Central Asia Lower middle income
Mongolia East Asia & Pacific Lower middle income
Myanmar East Asia & Pacific Lower middle income
110
Country Name Region Income Group
Namibia Sub-Saharan Africa Upper middle income
Nepal South Asia Low income
Netherlands Europe & Central Asia High income
New Zealand East Asia & Pacific High income
Nicaragua Latin America & Caribbean Lower middle income
Niger Sub-Saharan Africa Low income
Nigeria Sub-Saharan Africa Lower middle income
Pakistan South Asia Lower middle income
Panama Latin America & Caribbean Upper middle income
Peru Latin America & Caribbean Upper middle income
Philippines East Asia & Pacific Lower middle income
Poland Europe & Central Asia High income
Portugal Europe & Central Asia High income
Romania Europe & Central Asia Upper middle income
Russian Federation Europe & Central Asia Upper middle income
Rwanda Sub-Saharan Africa Low income
Saudi Arabia Middle East & North Africa High income
Senegal Sub-Saharan Africa Low income
Serbia Europe & Central Asia Upper middle income
Sierra Leone Sub-Saharan Africa Low income
Singapore East Asia & Pacific High income
Slovak Republic Europe & Central Asia High income
Slovenia Europe & Central Asia High income
South Africa Sub-Saharan Africa Upper middle income
Spain Europe & Central Asia High income
Sri Lanka South Asia Lower middle income
Sudan Sub-Saharan Africa Lower middle income
Sweden Europe & Central Asia High income
Switzerland Europe & Central Asia High income
111
Country Name Region Income Group
Tajikistan Europe & Central Asia Lower middle income
Tanzania Sub-Saharan Africa Low income
Thailand East Asia & Pacific Upper middle income
Togo Sub-Saharan Africa Low income
Tunisia Middle East & North Africa Lower middle income
Turkey Europe & Central Asia Upper middle income
Turkmenistan Europe & Central Asia Upper middle income
Uganda Sub-Saharan Africa Low income
Ukraine Europe & Central Asia Lower middle income
United Arab Emirates Middle East & North Africa High income
United Kingdom Europe & Central Asia High income
United States North America High income
Uruguay Latin America & Caribbean High income
Uzbekistan Europe & Central Asia Lower middle income
Vietnam East Asia & Pacific Lower middle income
Yemen, Rep. Middle East & North Africa Lower middle income
Zambia Sub-Saharan Africa Lower middle income
Zimbabwe Sub-Saharan Africa Low income