Embed Size (px)
Citation preview
Financial Liberalization and Growth: Empirical Evidence
AArrttuurroo AAlleejjaannddrroo GGuuiilllleerrmmoo GGaalliinnddoo MMiiccccoo OOrrddooññeezz11
[email protected] [email protected] [email protected]
Inter-American Development Bank
May, 2002
Abstract
This paper examines whether financial liberalization promotes economic
growth by analyzing its effects on the costs of external financing to firms. Following Rajan and Zingales’ (1998) methodology, we explore whether economic sectors that rely more on external finance grow faster than others after financial liberalization. Using this methodology and Kaminsky and Schmukler’s (2001) dataset on financial reforms, the paper shows that financial liberalization, mainly in the domestic financial sector, increases growth rates of economic sectors intensive in external funding relative to other sectors. Our results are robust to the fact that financial reform usually comes with other structural changes (e.g., trade liberalization).
1 We thank Graciela Kaminsky and Sergio Schmukler for sharing their data with us. We also thank Arturo Bris, Florencio Lopez de Silanes, Andrea Repetto and participants at the Economia Panel in Cambridge, MA, as well as participants at Banco de la República de Colombia’s brown bag seminar for useful comments and suggestions. The opinions in this paper reflect those of the authors and not necessarily those of the IADB.
2
1. - Introduction
Since the 1970s several countries have liberalized their financial systems.
Liberalization has been characterized by opening the capital account and removing
“financial repression” policies and restriction to foreign ownership. A crucial
question that deserves attention is whether these liberalizations have somehow
contributed to growth. Based on Rajan and Zingales (1998), this paper examines
whether financial liberalization reduces the cost of external finance to firms and
promotes growth. In particular, we ask whether firms that are relatively more in
need of external finance develop disproportionately faster in more liberalized
countries and during periods of high financial liberalization. We find this to be true
in our sample of 28 countries during the 1970s, 1980s and 1990s.
By the early 1970s many developing countries appeared to have slipped into
financial repression. Restrictions took the form of deposit and loan interest rate
controls, directed credit policies, and exchange and capital controls, among others.
These policies distorted the functioning of financial systems. According to Díaz-
Alejandro (1985, p. 7) financial repression leads to:
“…segmented domestic financial markets in which some obtained credit
(rationing) at very negative real interest rates, while non-favored borrowers had to
obtain funds in expensive and unstable informal credit markets. Public controls over
the banking system typically led to negative real interest rates for depositors.
Financial repression became an obstacle to domestic savings and their efficient
allocation, and financial intermediation languished.”
3
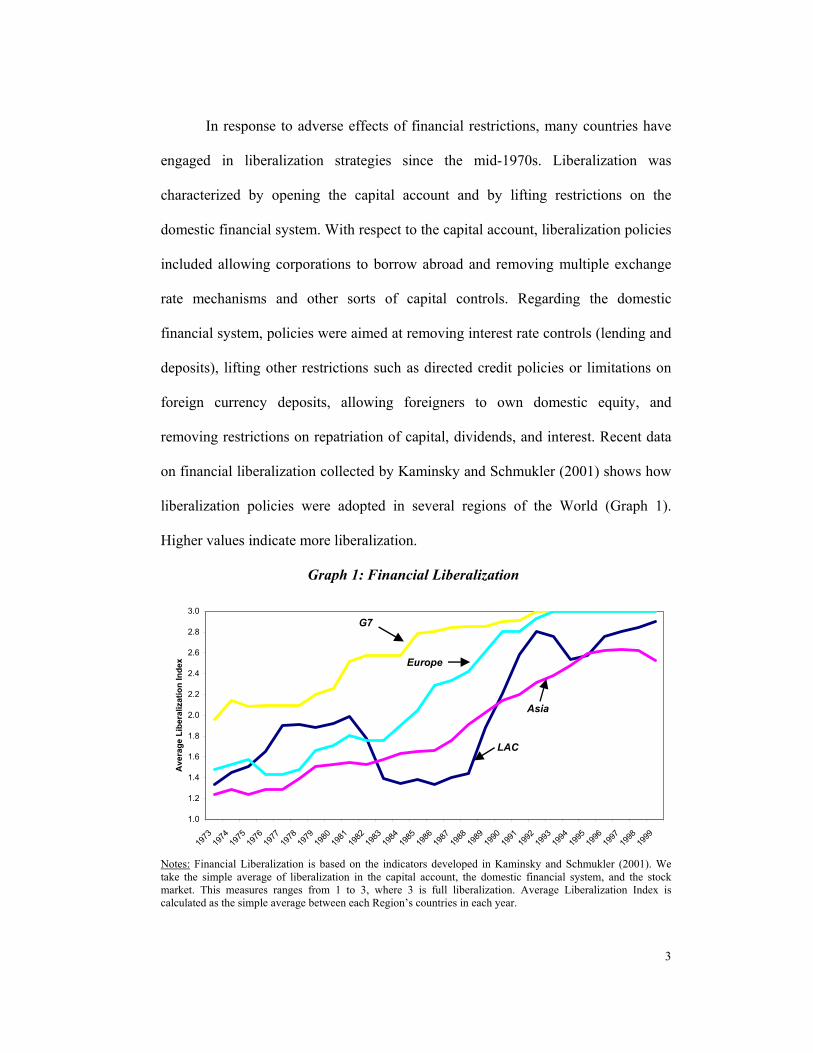
In response to adverse effects of financial restrictions, many countries have
engaged in liberalization strategies since the mid-1970s. Liberalization was
characterized by opening the capital account and by lifting restrictions on the
domestic financial system. With respect to the capital account, liberalization policies
included allowing corporations to borrow abroad and removing multiple exchange
rate mechanisms and other sorts of capital controls. Regarding the domestic
financial system, policies were aimed at removing interest rate controls (lending and
deposits), lifting other restrictions such as directed credit policies or limitations on
foreign currency deposits, allowing foreigners to own domestic equity, and
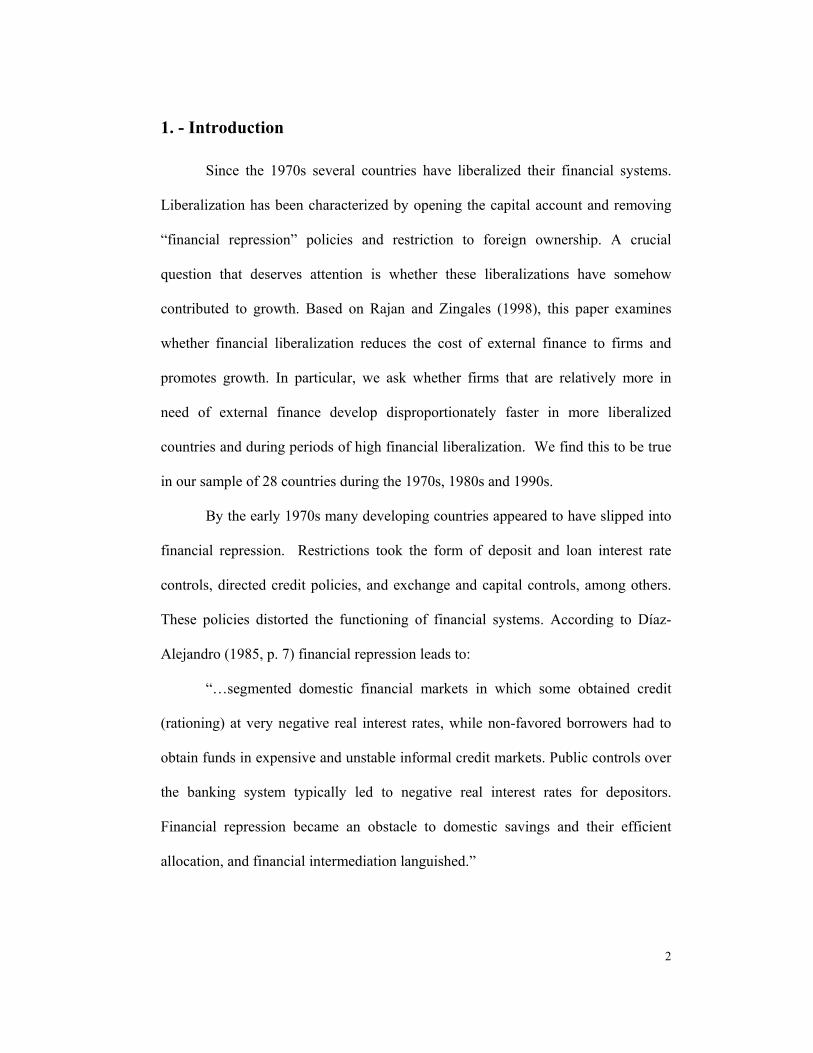
removing restrictions on repatriation of capital, dividends, and interest. Recent data
on financial liberalization collected by Kaminsky and Schmukler (2001) shows how
liberalization policies were adopted in several regions of the World (Graph 1).
Higher values indicate more liberalization.
Graph 1: Financial Liberalization
1.0
1.2
1.4
1.6
1.8
2.0
2.2
2.4
2.6
2.8
3.0
1973
1974
1975
1976
1977
1978
1979
1980
1981
1982
1983
1984
1985
1986
1987
1988
1989
1990
1991
1992
1993
1994
1995
1996
1997
1998
1999
Ave
rage
Lib
eral
izat
ion
Inde
x
G7
Europe
LAC
Asia
Notes: Financial Liberalization is based on the indicators developed in Kaminsky and Schmukler (2001). We take the simple average of liberalization in the capital account, the domestic financial system, and the stock market. This measures ranges from 1 to 3, where 3 is full liberalization. Average Liberalization Index is calculated as the simple average between each Region’s countries in each year.

4
By the early 1970s the financial sector of most developed countries was
already significantly liberalized, while in most developing countries it was highly
repressed. The liberalization process was continuous and gradual in most regions,
except in Latin America, where an important reversal was observed in the 1980s. At
the beginning of the 1970s liberalization was rapid in Latin American countries.
This was mainly driven by the southern cone countries, which had engaged in
laissez- faire financial policies that mainly supported unrestricted private
participation in financial markets without direct government regulation. As noted by
Díaz-Alejandro (1985) this led to massive bankruptcies and a generalized financial
crisis throughout the region. Countries then abandoned laissez-faire practices,
introducing tighter regulations and restrictions to their financial systems. This came
with a de facto nationalization of the banking sector. Later, at the beginning of the
1990s, Latin America engaged once again in the liberalization strategy. The main
difference with respect to the previous liberalization wave was the implementation
of regulatory and supervision mechanisms to avoid the previous type of crisis.
A crucial question that deserves attention is whether liberalization has
somehow contributed to growth and through which channels. The literature has no
clear answer to this question, either from a theoretical or an empirical point of view.
Models of perfect markets suggest that financial liberalization should benefit
both borrowers and lenders. Starting with McKinnon (1973) and Shaw (1973), some
studies have pointed out that lifting financial restrictions can exert a positive effect
on growth rates as interest rates rise toward their competitive market equilibrium
and resources are allocated efficiently. In addition, capital account liberalization
allows firms to access cheaper foreign funds and puts pressure on the domestic
5
financial system to improve its efficiency. However, some authors claim that this
efficient-markets paradigm is misleading when applied to financial sector, in
particular to capital flows. Removing one distortion need not be welfare enhancing
when other distortions are present. Financial markets are characterized by serious
problems of asymmetric information and moral hazard issues that may undermine
the case for domestic financial liberalization (see next section for a complete
discussion of these arguments).
While theory does not give us a clear answer on the effect of financial
liberalization on growth, empirical studies are not conclusive, either. This is
particularly true in the case of capital account liberalization, which remains one of
the most controversial and least understood economic policies.2 The first reason for
this disappointing result is the lack of good and homogenous measures of financial
liberalization policies across countries and over time. A second serious issue in
virtually all studies of financial liberalization is the omitted variable problem, as the
financial liberalization process tends to be imposed and removed as part of large a
package of policies. Trade liberalization and the privatization of state enterprises, for
example, have coincided with the liberalization of the financial sector in many
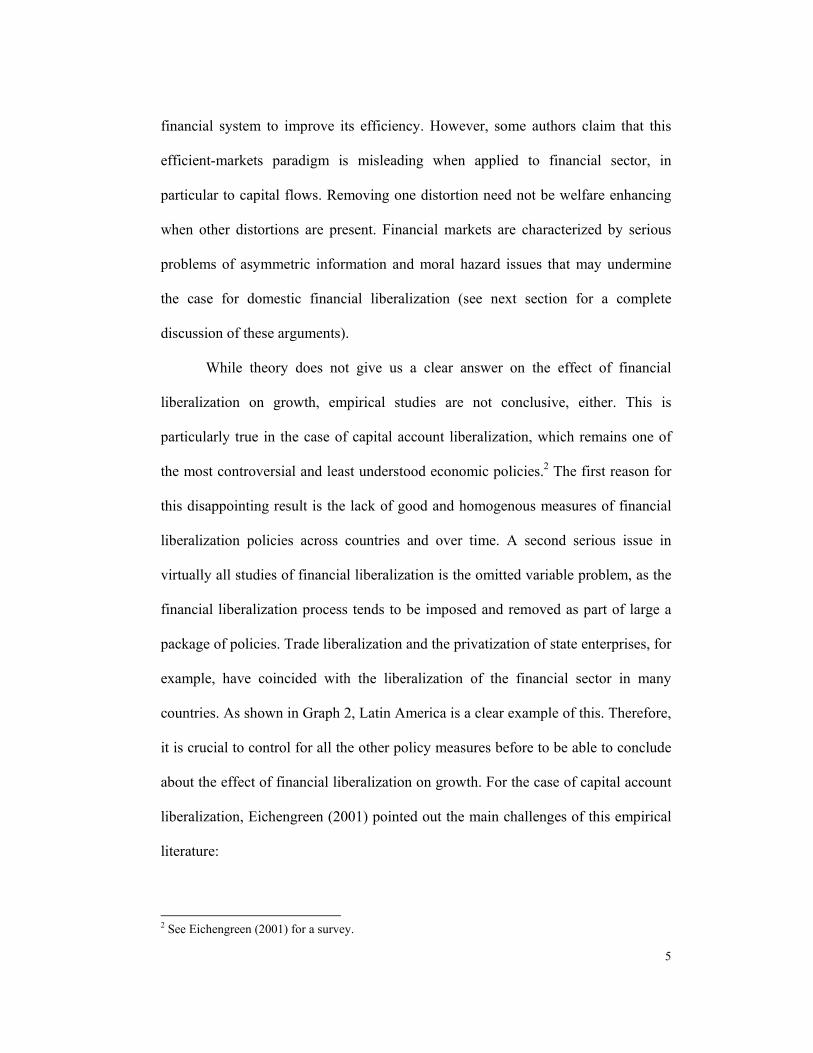
countries. As shown in Graph 2, Latin America is a clear example of this. Therefore,
it is crucial to control for all the other policy measures before to be able to conclude
about the effect of financial liberalization on growth. For the case of capital account
liberalization, Eichengreen (2001) pointed out the main challenges of this empirical
literature:
2 See Eichengreen (2001) for a survey.
6
“Developing adequate measures of capital-account restriction is a particular
problem for the literature on the causes and effects of capital controls, but the more
general problem of adequately capturing the economic, financial and political
characteristics of economies…should not be overlooked.” (Eichengreen(2001),
p.11).
Graph 2: Reforms in Latin America
0
0.05
0.1
0.15
0.2
0.25
0.3
0.35
1985 1986 1987 1988 1989 1990 1991 1992 1993 1994 1995 1996 1997 1998 1999
Tarif
fs o
n Tr
ade
and
priv
atiz
atio
ns
2
2.1
2.2
2.3
2.4
2.5
2.6
2.7
2.8
2.9
3
Fina
ncia
l Lib
eral
izat
ion
Tarif fs on Trade
Privatizations
Financial Liberalization
Notes: Financial Liberalization is based on the indicators developed in Kaminsky and Schmukler (2001). We take the simple average of liberalization in the capital account, the domestic financial system, and the stock market. This measures ranges from 1 to 3, where 3 is full liberalization. Privatizations are measured as the cumulative value of sales and transfers of public companies as a proportion of GDP for each year. Source: Lora (2001). Tariffs on Trade are referred to average tariff. Source: World Bank, WDI (2001).
Our paper is able to deal with the previous two issues. Kaminsky and
Schmukler (2001) recently produced a homogeneous dataset including several
dimensions of financial liberalization for 28 developed and developing countries
during 1972 and 1999.3 This is the ideal data not only for analyzing whether
liberalization is valuable for financial development and growth, but also for
providing specific policy recommendations. Using Rajan and Zingales’ (1998)
3 For each index, they analyze up to two dimensions of liberalization and allow for different degrees of liberalization. Unlike other dataset, theirs allows for potential reversal of liberalization policies.
7
methodology, the panel structure of the data allows us to identify the effect of
financial liberalization on growth controlling for most of the other reforms
implemented at the same time.
The theoretical underpinning of this relationship is rather simple and follows
the discussion of Rajan and Zingales (1998) on how financial development can
impact growth. They show that more developed financial systems can mitigate the
extent to which firms are affected by problems of moral hazard and adverse
selection, and hence can reduce the cost of loanable funds. This reduction in the cost
of external funds allows firms that depend more on them to grow faster. This
differential in growth across firms is the identification mechanism that allows us to
isolate the effect of financial liberalization on growth from the other reforms. In this
setup, we assume that the effect of these other reforms on firm growth is
uncorrelated with firm’ external financial dependence.
The rest of the paper is organized as follows. Section 2 presents a literature
review. Section 3 presents the data and the econometric framework. Section 4 shows
the evidence on the impact of financial liberalization on growth. Section 5 explores
the relationship between liberalization and financial sector development. Section 6
concludes.
2. - Literature Review Since the pioneering contributions of Goldsmith (1969), McKinnon (1973)
and Shaw (1973), the literature has focus on the relationship between financial
liberalization and economic growth. Financial liberalization may affect growth
through three mechanisms. First it may affect the development of the domestic
8
financial system in terms of size and efficiency, second it may affect the access of
domestic firms to foreign funds and finally it may reduce agency problems
improving corporate governance.
Several authors, starting with McKinnon (1973) and Shaw (1973), have
pointed out advantages of reducing financial repression in the domestic financial
system. They conclude that lifting financial restrictions can exert a positive effect on
growth rates as interest rates rise toward their competitive market equilibrium.
According to this tradition, ceilings on interest rates reduce savings, capital
accumulation, and discourage efficient allocation of resources. Additionally,
McKinnon points out that repression can lead to dualism in which firms that have
access to subsidized funding will tend to choose relatively capital-intensive
technologies, whereas those not favored by policy will only be able to implement
high-yield projects with short maturity.
Since then, many other authors have noted additional benefits of financial
liberalization. Foreign competition, in the form of entry of foreign institutions to the
local market (foreign banks) seems to develop the domestic financial sector and
reduces the costs of capital to domestic firms. Competition increases efficiency in
the domestic banking industry (see Claesens et al. (2001)) and allows countries to
benefit from frontier financial technologies as in Klenow and Rodríguez-Clare
(1997), and leads to increased growth. Moreover, foreign competition in the form of
access to foreign financial markets seems to reduce the costs of capital to domestic
firms (cross-listing –see Bekaert et al (2001)). This leads to higher investment and
growth (Bekaert and Harvey (2000) and Henry (2000a and 2000b)).
9
In addition, financial liberalization puts pressure to improve corporate
governance. Foreign competition may force the adoption of international accounting
and regulatory standards. These improvement may reduce the agency costs that
make it harder and more expensive for firms to raise funds in both the banking
sector and the securities market (see Claesens et al. (2001), Galindo et al (2001),
Stulz (1999) and Moel (2001)).
Laeven (2000) shows that financial liberalization can ease financial
constraints of the type described by Hubbard (1997) and Gilchrist and Himmelberg
(1998). This happens through two mechanisms. A direct one, by allowing more
capital -namely foreign- to become available, and an indirect one through an
improvement in the allocation of resources towards the sectors that were previously
more constrained. Tapping international capital markets can have significant impacts
derived from accessing a larger stock holder base, increased liquidity of stocks, and
the signaling effects of adopting international accounting standards, among other
possibilities (Sarkissian and Schill (2001)).
In summary the benefits of financial liberalization can be grouped into
increased access to domestic and international capital markets, and increased
efficiency of capital allocation.
Critics of financial liberalization policies have argued that the efficient-
markets paradigm is fundamentally misleading when applied to capital flows. In the
theory of the second best, removing one distortion need not be welfare enhancing
when other distortions are present. If capital account is liberalized while import-
competing industries are still protected for example, or if there is a downwardly-
inflexible real wage, capital may flow into sectors in which the country has a
10
comparative disadvantage, implying a reduction in welfare (Brecher and Diaz-
Alejandro (1977) and Brecher (1983).
In addition, if information asymmetries are endemic to financial markets and
transactions, in particular in countries with poor corporate governance and low legal
protections, there is no reason to think that financial liberalization, either domestic
or international, will be welfare improving (Stiglitz (2000)). Moreover, in countries
where the capacity to honor contracts and to assemble information relevant to
financial transactions is least advanced, there can be no presumption that capital will
flow into uses where its marginal product exceeds its opportunity cost.
Stiglitz (1994) argues in favor of certain forms of financial repression. He
claims that repression can have several positive effects such as: improving the
average quality of the pool of loan applicants by lowering interest rates; increasing
firm equity by lowering the price of capital; and accelerating the rate of growth if
credit is targeted towards profitable sectors such as exporters or sectors with high
technological spillovers. However, these claims can be doubtful given that they
increase the power of bureaucrats, who can be less capable than imperfect markets,
to allocate financial resources. This approach also opens doors to rent-seeking
activities.
Focusing on the development of the domestic financial sector, capital
account liberalization that allows firms to list abroad has been attributed to lead to
market fragmentation, and reduce the liquidity in the domestic market and inhibiting
its development. The inverse correlation between the amount of aggregate capital
raised by LAC corporations in the ADR market and the number of Initial Public
Offerings in Latin America seems to corroborate this argument (Moel, 2001).
11
Finally, liberalization has also been linked to macroeconomic instability. The
financial reforms carried out in several Latin American countries during the 1970s,
aimed at ending financial repression, yet led to financial crises characterized by
widespread bankruptcies, massive government interventions, nationalization of
private institutions and low domestic saving (Diaz-Alejandro (1985)). It is worth
noting that, as shown by Demirguc-Kunt and Detriagiache (1998), the likelihood of
a crisis following liberalization is decreasing in the level of institutional
development. In this sense, the arguments that Stiglitz (1994) makes in favor of
government intervention in financial markets in the form of prudential regulation
and supervision are convincing. The main argument is that the government is, de
facto, the insurer of the financial systems, and hence a financial collapse can have
significant fiscal repercussions. To the extent that regulation accompanies
liberalization, negative impacts such as those noted by Díaz-Alejandro can be
contained.
The extent to which financial liberalization affects growth remains an
empirical question. Several empirical pieces have tried to address it. Researchers
have followed two distinct empirical approaches. One proxies financial
liberalization with outcome variables, and the other focuses on explicit policy
measures. Regarding outcome variables, several measures have been posed to proxy
financial repression. Early empirical literature focused on the value of real interest
rates as an indicator of repression. The presumption was that countries with negative
real interest rates were financially repressed, while those with positive ones were
12
liberalized.4 In short they find that countries with negative real interest rates exhibit
lower growth rates than those with positive ones. However, De Gregorio and
Guidotti (1993) claim that real interest rates are not a good indicator of financial
repression, and that a better indicator of repression, or lack thereof, is the ratio of
credit to the private sector to GDP or other measures of financial development.
Several papers have analyzed the impact of this and other measures of
financial development on growth. There is consensus that financial development has
had a significant positive impact on the growth rates of countries.5 The extent to
which these results can be interpreted as being influenced by financial liberalization
is dubious. On the one hand, and as noted by Rajan and Zingales (1998) it is
unlikely that such empirical strategies are truly identifying the impact of financial
development on growth, due to the fact that financial development occurs at the
same time that economies go through significant structural transformations. In the
case of financial development, Rajan and Zingales (1998, p. 560) note “ …financial
development may simply be a leading indicator rather than a causal factor.”
On the other hand, it is not clear either that financial liberalization has a one
to one impact on financial development. Note that it can be the case that financial
liberalization has no impact on financial development. Latin America is a clear
example of this. Table 1 shows different measures of financial development and
liberalization during the past three decades for several regions of the world. As can
4 Lanyi and Saracoglu (1983), Fry (1978), Roubini and Sala-i-Martin (1991), and World Bank (1989) are examples of this approach. 5 Ghani (1992) includes financial development in a Barro type growth equations for 50 developing countries and find significant impacts. De Gregorio and Guidotti find the same for middle and low-income countries. King and Levine (1993) expand the sample to 77 countries and add several proxies of financial development and find the same results. Levine, Loayza and Beck (1999) and Beck,
13
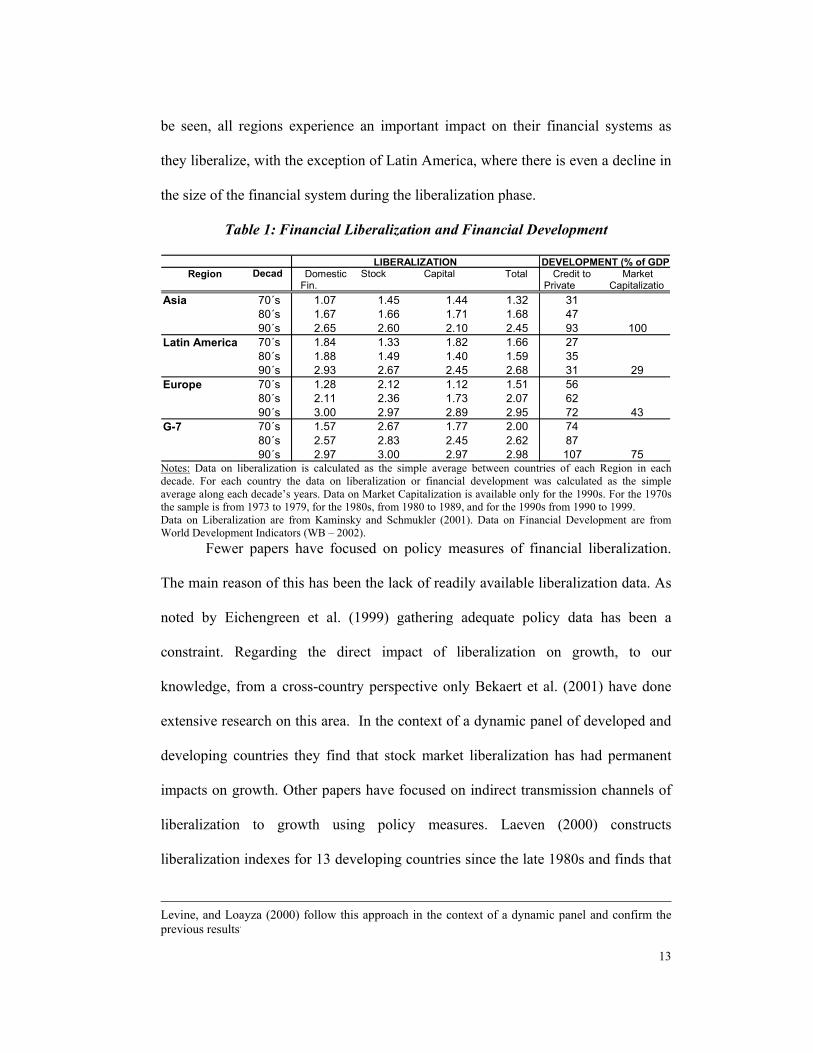
be seen, all regions experience an important impact on their financial systems as
they liberalize, with the exception of Latin America, where there is even a decline in
the size of the financial system during the liberalization phase.
Table 1: Financial Liberalization and Financial Development
Region Decad Domestic StockM k t
CapitalA t
Total Credit to MarketFin.S t
PrivateS t
CapitalizatioAsia 70´s 1.07 1.45 1.44 1.32 31
80´s 1.67 1.66 1.71 1.68 4790´s 2.65 2.60 2.10 2.45 93 100
Latin America 70´s 1.84 1.33 1.82 1.66 2780´s 1.88 1.49 1.40 1.59 3590´s 2.93 2.67 2.45 2.68 31 29
Europe 70´s 1.28 2.12 1.12 1.51 5680´s 2.11 2.36 1.73 2.07 6290´s 3.00 2.97 2.89 2.95 72 43
G-7 70´s 1.57 2.67 1.77 2.00 7480´s 2.57 2.83 2.45 2.62 8790´s 2.97 3.00 2.97 2.98 107 75
LIBERALIZATION DEVELOPMENT (% of GDP)
Notes: Data on liberalization is calculated as the simple average between countries of each Region in each decade. For each country the data on liberalization or financial development was calculated as the simple average along each decade’s years. Data on Market Capitalization is available only for the 1990s. For the 1970s the sample is from 1973 to 1979, for the 1980s, from 1980 to 1989, and for the 1990s from 1990 to 1999. Data on Liberalization are from Kaminsky and Schmukler (2001). Data on Financial Development are from World Development Indicators (WB – 2002).
Fewer papers have focused on policy measures of financial liberalization.
The main reason of this has been the lack of readily available liberalization data. As
noted by Eichengreen et al. (1999) gathering adequate policy data has been a
constraint. Regarding the direct impact of liberalization on growth, to our
knowledge, from a cross-country perspective only Bekaert et al. (2001) have done
extensive research on this area. In the context of a dynamic panel of developed and
developing countries they find that stock market liberalization has had permanent
impacts on growth. Other papers have focused on indirect transmission channels of
liberalization to growth using policy measures. Laeven (2000) constructs
liberalization indexes for 13 developing countries since the late 1980s and finds that
Levine, and Loayza (2000) follow this approach in the context of a dynamic panel and confirm the previous results.
14
the liberalization process in general has eased financial constraints faced by large
firms in these countries. Galindo et al. (2001) use Laeven’s data and find that
financial liberalization increases the allocative efficiency of investment.
As noted above, these papers are also subject to the identification critique.
According to Fry (1995, p. 179), the simultaneity of reforms appears binding for
researchers:
“… in practice, however, most clear cut cases of financial liberalization were
accompanied by other economic reforms (such as fiscal, international trade, and
foreign exchange reforms). In such cases it is virtually impossible to isolate the
effects of financial components of the reform package.”
Bekaert et al., as well as Galindo et al., try to isolate the impact of financial
liberalization by controlling for other reforms and macroeconomic events taking
place simultaneously. Even if this allows some identification it remains unclear if
the set of controls is large enough to isolate the effect of financial reform.
This paper improves substantially on these issues since it adopts a very clean
methodology that allows the isolation of impact of financial liberalization on
growth. As noted, there are several cross-country studies that find evidence of a
positive effect of various measures of financial development on growth. Rajan and
Zingales (1998) survey this literature. To our knowledge, however, no paper
addresses the issue of financial liberalization and growth directly from a cross-
industry-country panel data perspective. This is an additional contribution of this
work.
15
3. - Empirical Method and Data Rajan and Zingales (1998) faced problems similar to those mentioned in the
previous section when addressing the impact of development on growth. Namely,
identifying the true causal impact of financial development in a context of multiple
structural reforms rose as a challenge. In order to overcome these problems they
propose a test to identify the true impact of financial development on growth. The
basis of their test is the presumption that the development of financial markets and
institutions reduces the cost of external funds faced by firms by reducing the impact
of problems associated with moral hazard and adverse selection. From this
perspective the impact of financial development must differ according to the needs
of particular firms for external funds. Firms that rely more on external funds will be
more impacted by financial development than those that require little capital. Using
firm-level data, Rajan and Zingales identify the need for external finance (the
difference between investment and operating income) for several industries at the
ISIC three and four digit level. Given that the US market is relatively frictionless,
they assume that such technological demands for external capital would apply in
other countries once market distortions are removed.
Using this identification technique, they estimate whether development
affects industry growth by interacting several measures of financial development
with the industry demand for external funds proxy in a cross-country-industry
growth regression in which they control for country and industry-specific
characteristics. By controlling for these specific factors the omitted variable problem
is significantly reduced. Moreover, by estimating the interactive term they can fully
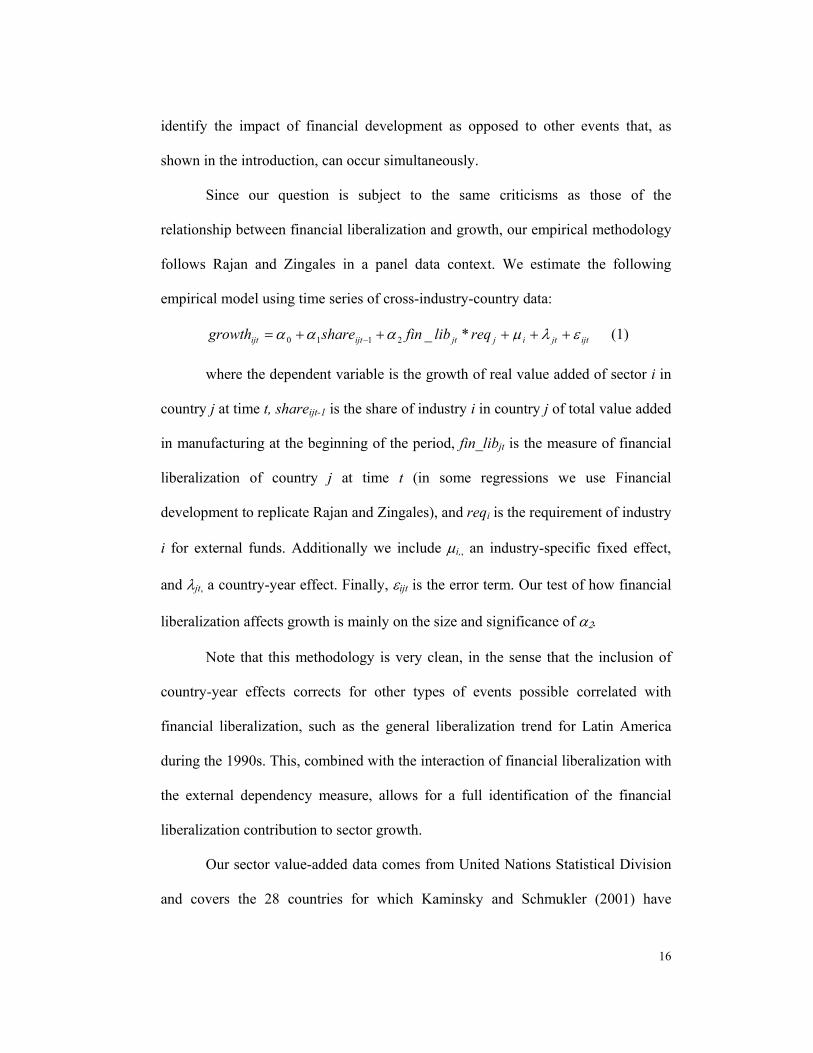
16
identify the impact of financial development as opposed to other events that, as
shown in the introduction, can occur simultaneously.
Since our question is subject to the same criticisms as those of the
relationship between financial liberalization and growth, our empirical methodology
follows Rajan and Zingales in a panel data context. We estimate the following
empirical model using time series of cross-industry-country data:
ijtjtijjtijtijt reqlibfinsharegrowth ελµααα +++++= − *_2110 (1)
where the dependent variable is the growth of real value added of sector i in
country j at time t, shareijt-1 is the share of industry i in country j of total value added
in manufacturing at the beginning of the period, fin_libjt is the measure of financial
liberalization of country j at time t (in some regressions we use Financial
development to replicate Rajan and Zingales), and reqi is the requirement of industry
i for external funds. Additionally we include µi,, an industry-specific fixed effect,
and λjt, a country-year effect. Finally, εijt is the error term. Our test of how financial
liberalization affects growth is mainly on the size and significance of α2.
Note that this methodology is very clean, in the sense that the inclusion of
country-year effects corrects for other types of events possible correlated with
financial liberalization, such as the general liberalization trend for Latin America
during the 1990s. This, combined with the interaction of financial liberalization with
the external dependency measure, allows for a full identification of the financial
liberalization contribution to sector growth.
Our sector value-added data comes from United Nations Statistical Division
and covers the 28 countries for which Kaminsky and Schmukler (2001) have
17
information about financial liberalization during the period 1972-1998. Our measure
of sector dependence on external financing is taken from Rajan and Zingales (1998).
Their dataset covers 37 industries; 28 of them correspond to three-digit ISIC codes
and 9 correspond to four-digit ISIC code (see Data Appendix).
The following section shows our empirical results using this methodology
and data.
4.- Financial Liberalization and Growth
The first two columns in Table 2 replicate Rajan and Zingales’ (1998) results
using our sample in a panel data setup. As usual in this literature, our measure of
financial development is either the ratio of private credit to GDP or the ratio of
private credit plus stock market capitalization to GDP. The first column shows that
sectors with higher external dependency grow faster in countries that have well-
developed financial sectors as measured by the ratio of the sum of private credit and
stock market capitalization to GDP. The second column redoes the same exercise
using just the ratio private credit to GDP. The signs of the coefficients are positive
and significant. The line labeled differential in growth at the bottom of the table
shows the impact, according to our estimation, on growth differentials across sectors
and countries. For example, in column 1 this differential is 0.82. This should be
interpreted as follows: the relative growth rate of an industry in the 75th percentile of
external requirements relative to an industry in the 25th percentile, in a country with
high financial development (in the 75th percentile of financial development), is 0.82
percentage points higher than that in a country with a weak financial sector (25th
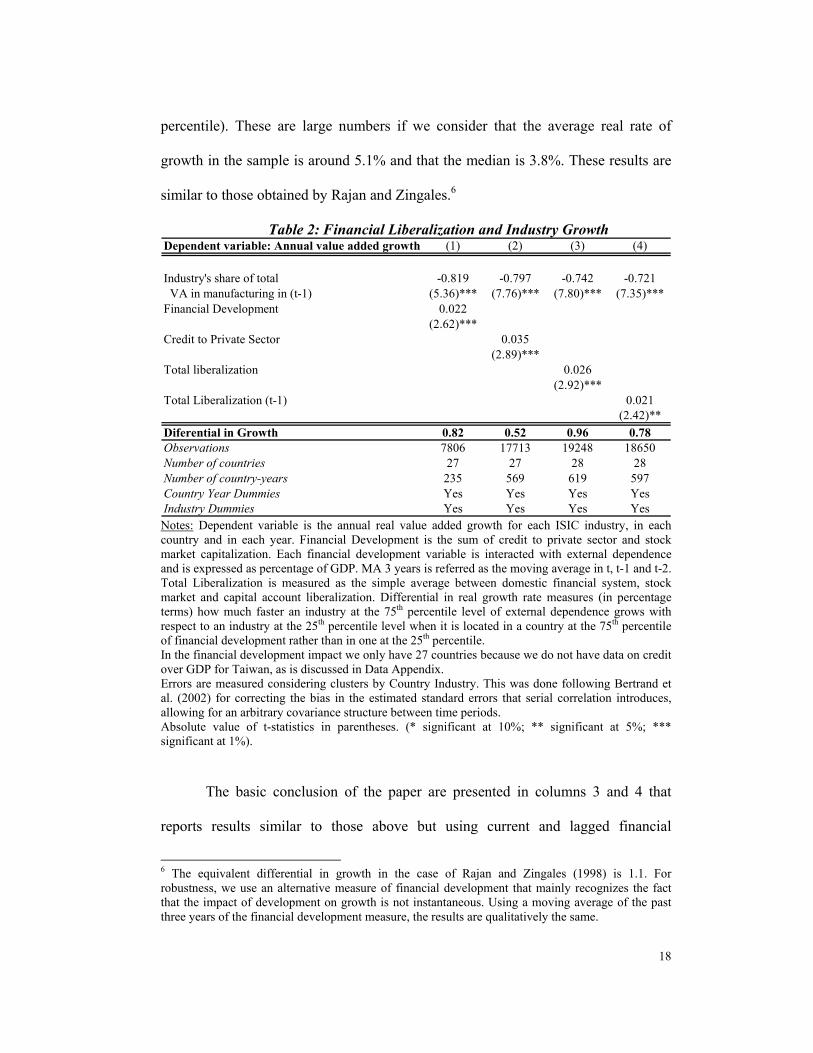
18
percentile). These are large numbers if we consider that the average real rate of
growth in the sample is around 5.1% and that the median is 3.8%. These results are
similar to those obtained by Rajan and Zingales.6
Table 2: Financial Liberalization and Industry Growth Dependent variable: Annual value added growth (1) (2) (3) (4)
Industry's share of total -0.819 -0.797 -0.742 -0.721 VA in manufacturing in (t-1) (5.36)*** (7.76)*** (7.80)*** (7.35)***Financial Development 0.022
(2.62)***Credit to Private Sector 0.035
(2.89)***Total liberalization 0.026
(2.92)***Total Liberalization (t-1) 0.021
(2.42)**Diferential in Growth 0.82 0.52 0.96 0.78Observations 7806 17713 19248 18650Number of countries 27 27 28 28Number of country-years 235 569 619 597Country Year Dummies Yes Yes Yes YesIndustry Dummies Yes Yes Yes Yes Notes: Dependent variable is the annual real value added growth for each ISIC industry, in each country and in each year. Financial Development is the sum of credit to private sector and stock market capitalization. Each financial development variable is interacted with external dependence and is expressed as percentage of GDP. MA 3 years is referred as the moving average in t, t-1 and t-2. Total Liberalization is measured as the simple average between domestic financial system, stock market and capital account liberalization. Differential in real growth rate measures (in percentage terms) how much faster an industry at the 75th percentile level of external dependence grows with respect to an industry at the 25th percentile level when it is located in a country at the 75th percentile of financial development rather than in one at the 25th percentile. In the financial development impact we only have 27 countries because we do not have data on credit over GDP for Taiwan, as is discussed in Data Appendix. Errors are measured considering clusters by Country Industry. This was done following Bertrand et al. (2002) for correcting the bias in the estimated standard errors that serial correlation introduces, allowing for an arbitrary covariance structure between time periods. Absolute value of t-statistics in parentheses. (* significant at 10%; ** significant at 5%; *** significant at 1%).
The basic conclusion of the paper are presented in columns 3 and 4 that
reports results similar to those above but using current and lagged financial
6 The equivalent differential in growth in the case of Rajan and Zingales (1998) is 1.1. For robustness, we use an alternative measure of financial development that mainly recognizes the fact that the impact of development on growth is not instantaneous. Using a moving average of the past three years of the financial development measure, the results are qualitatively the same.
19
liberalization instead of financial development as a regressor, respectively. These
results suggest that financial liberalization boost growth in sectors with higher
external dependency. Column 3 suggests that industries that depend on external
financing (75th percentile) grow 0.96% faster, relative to industries with low external
financing dependence, in periods of full liberalization compared to those of partial
liberalization. Once again this is a very significant figure given the average values of
sector growth in our sample.7
To obtain the long run effect of financial liberalization we have to divide its
coefficient by the lag sector-share coefficient multiplied by (-1). The results in
column 3 suggest that, in the long run, industries that depend more on external
financing (at the 75th percentile level) and are located in a fully liberalized economy
will have a share over total value added 1.6% higher than the same type of industries
located in a country that is only partially liberalized. This is an important effect if we
consider that the average sector-share in our sample is 3.3 %.
To identify the mechanism through which financial liberalization boosts
growth we open our measure in two components. On the one hand we study
liberalization on domestic financial system and on stock market, and on the other we
analyze the impact of capital account liberalization. As shown in Table 3, what
matters in our estimations is the liberalization of domestic financial markets.
Unreported results shows that it is a very robust result: domestic financial system
liberalization is the key component regarding the impact of liberalization on growth;
7 As robustness checks, we allow for different lag structures of the financial liberalization measures and also different constructions of the liberalization variable (principal components). Results are qualitatively the same.
20
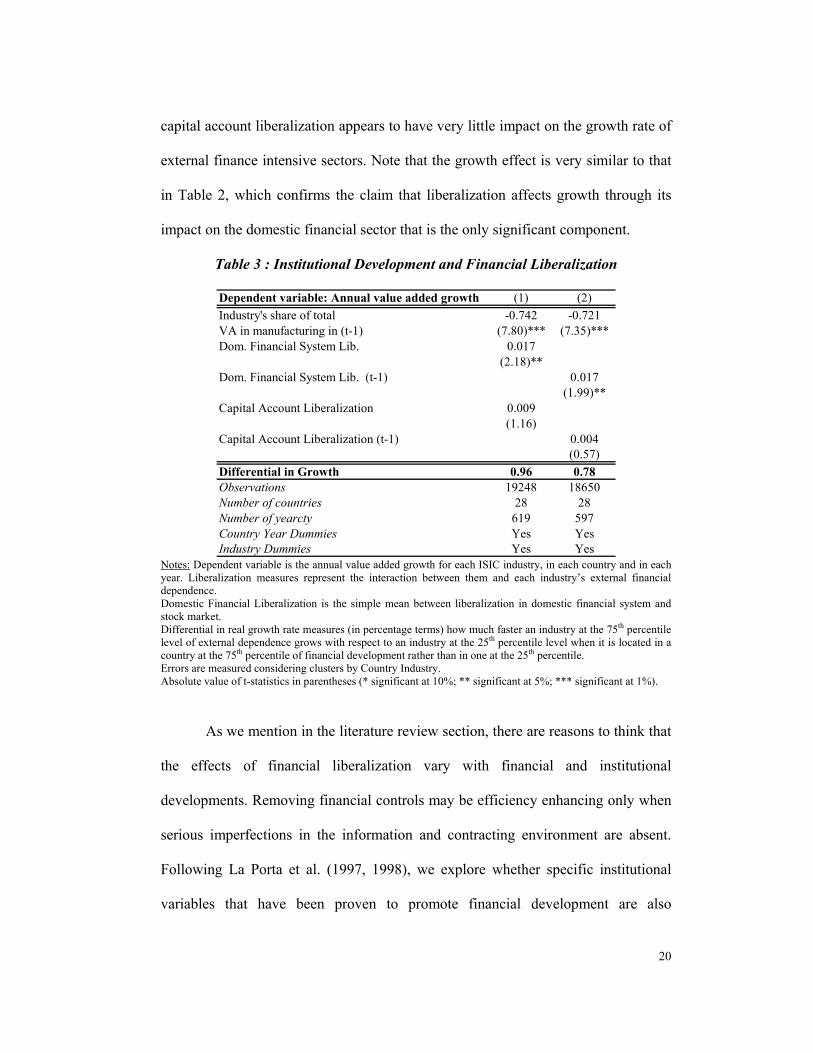
capital account liberalization appears to have very little impact on the growth rate of
external finance intensive sectors. Note that the growth effect is very similar to that
in Table 2, which confirms the claim that liberalization affects growth through its
impact on the domestic financial sector that is the only significant component.
Table 3 : Institutional Development and Financial Liberalization
Dependent variable: Annual value added growth (1) (2)Industry's share of total -0.742 -0.721VA in manufacturing in (t-1) (7.80)*** (7.35)***Dom. Financial System Lib. 0.017
(2.18)**Dom. Financial System Lib. (t-1) 0.017
(1.99)**Capital Account Liberalization 0.009
(1.16)Capital Account Liberalization (t-1) 0.004
(0.57)Differential in Growth 0.96 0.78Observations 19248 18650Number of countries 28 28Number of yearcty 619 597Country Year Dummies Yes YesIndustry Dummies Yes Yes
Notes: Dependent variable is the annual value added growth for each ISIC industry, in each country and in each year. Liberalization measures represent the interaction between them and each industry’s external financial dependence. Domestic Financial Liberalization is the simple mean between liberalization in domestic financial system and stock market. Differential in real growth rate measures (in percentage terms) how much faster an industry at the 75th percentile level of external dependence grows with respect to an industry at the 25th percentile level when it is located in a country at the 75th percentile of financial development rather than in one at the 25th percentile. Errors are measured considering clusters by Country Industry. Absolute value of t-statistics in parentheses (* significant at 10%; ** significant at 5%; *** significant at 1%).
As we mention in the literature review section, there are reasons to think that
the effects of financial liberalization vary with financial and institutional
developments. Removing financial controls may be efficiency enhancing only when
serious imperfections in the information and contracting environment are absent.
Following La Porta et al. (1997, 1998), we explore whether specific institutional
variables that have been proven to promote financial development are also
21
associated with the impact of liberalization on growth. There are several usual
suspects in this literature. The legal origin of law codes, rule of law, creditor
protection and effective creditor rights protection8 are usual candidates for
explaining cross-country differences in financial sector development.
Presumably, economies that afford weak legal protections to creditors are
less likely to benefit from liberalization. The literature has shown that these are
dominant features explaining the development of financial markets. If these
protections are not in place the liberalization of restrictions on intermediation are
dampened by the adverse effects of institutional disarrays and do not promote
financial sector development. The absence of legal protections that guarantee the
ability of creditors to minimize their financial loss in case of borrower default can
counteract the potential efficiency effects that financial liberalization can induce.
To test this hypothesis we re-estimate equation [1] including interactive
terms between the liberalization measure, and the different proxies for legal
protections. Specifically we estimate:
ijtjtijj
jjjtjjtijtijt
LegreqLegreqlibfinreqlibfinsharegrowth
ελµα
αααα
++++
+++= −
***_*_
4
32110 (2)
where Leg is any of the legal protection proxies mentioned above. α3
captures the differential effect, if any, of countries with different legal protections.
Higher values of Leg indicate greater legal protection. Hence, one would expect α3
to be positive if our claims are accurate.
8 Effective creditor rights protection is the product of the rule of law index and creditor rights. It intends to capture the extent to which creditor rights regulations can be enforced or not. See Galindo and Micco (2002) for a discussion.
22
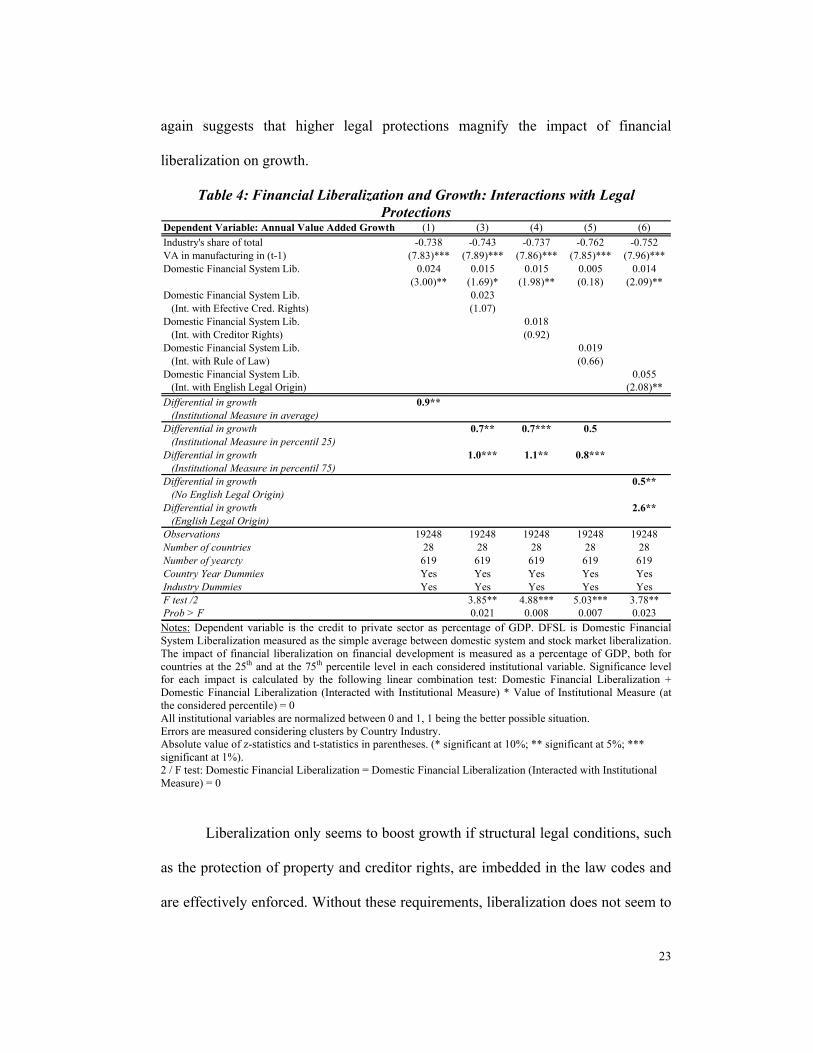
Table 4 reports our results. Column 1 reports the regression without any
interaction with the legal protections. The results are hence equivalent to those
above but now focusing only in domestic financial liberalization. Column 2 reports
the result including the interaction of the liberalization measure and effective
creditor rights. Note that the significance of both terms drops dramatically. However
this must not be interpreted as meaning that economic significance of this interaction
is lost. The loss of significance is attributed to the fact that both regressors are
importantly collinear (0.76). Hence the relevant test is one on joint significance. We
report this at the bottom of Table 4. Note that independent of the legal protection-
proxy used joint significance is always above standard level. Column 2 thus
suggests that liberalization has a greater impact in countries where creditors are
more protected. As above, we present the differential growth impact. Now we
compare this impact in countries in the 75th percentile of legal protection with those
in the 25th. The results suggest that the differential impact is higher where creditor
protections are in place. Columns 3 and 4 show the same exercises using creditor
rights and rule of law instead of effective creditor rights, respectively. The
interpretation of results follows those of effective creditor rights.
The previous three measures of legal protection have the caveat that they
could be endogenous; the need for financial development may create pressure to
improve legal protection.9 To avoid this problem, in column 5 we use legal origins
as a proxy for legal protection.10 As shown by previous research (see La Porta et al.
(1998)), common law origin countries tend to have higher protections. This result
9 In addition these measure are only available for 1998. 10 Our proxy for legal protection is a dummy variable that is one for countries with common law legal origin and zero otherwise.
23
again suggests that higher legal protections magnify the impact of financial
liberalization on growth.
Table 4: Financial Liberalization and Growth: Interactions with Legal Protections
Dependent Variable: Annual Value Added Growth (1) (3) (4) (5) (6)Industry's share of total -0.738 -0.743 -0.737 -0.762 -0.752VA in manufacturing in (t-1) (7.83)*** (7.89)*** (7.86)*** (7.85)*** (7.96)***Domestic Financial System Lib. 0.024 0.015 0.015 0.005 0.014
(3.00)** (1.69)* (1.98)** (0.18) (2.09)**Domestic Financial System Lib. 0.023 (Int. with Efective Cred. Rights) (1.07)Domestic Financial System Lib. 0.018 (Int. with Creditor Rights) (0.92)Domestic Financial System Lib. 0.019 (Int. with Rule of Law) (0.66)Domestic Financial System Lib. 0.055 (Int. with English Legal Origin) (2.08)**Differential in growth 0.9** (Institutional Measure in average)Differential in growth 0.7** 0.7*** 0.5 (Institutional Measure in percentil 25)Differential in growth 1.0*** 1.1** 0.8*** (Institutional Measure in percentil 75)Differential in growth 0.5** (No English Legal Origin)Differential in growth 2.6** (English Legal Origin)Observations 19248 19248 19248 19248 19248Number of countries 28 28 28 28 28Number of yearcty 619 619 619 619 619Country Year Dummies Yes Yes Yes Yes YesIndustry Dummies Yes Yes Yes Yes YesF test /2 3.85** 4.88*** 5.03*** 3.78**Prob > F 0.021 0.008 0.007 0.023 Notes: Dependent variable is the credit to private sector as percentage of GDP. DFSL is Domestic Financial System Liberalization measured as the simple average between domestic system and stock market liberalization. The impact of financial liberalization on financial development is measured as a percentage of GDP, both for countries at the 25th and at the 75th percentile level in each considered institutional variable. Significance level for each impact is calculated by the following linear combination test: Domestic Financial Liberalization + Domestic Financial Liberalization (Interacted with Institutional Measure) * Value of Institutional Measure (at the considered percentile) = 0 All institutional variables are normalized between 0 and 1, 1 being the better possible situation. Errors are measured considering clusters by Country Industry. Absolute value of z-statistics and t-statistics in parentheses. (* significant at 10%; ** significant at 5%; *** significant at 1%). 2 / F test: Domestic Financial Liberalization = Domestic Financial Liberalization (Interacted with Institutional Measure) = 0
Liberalization only seems to boost growth if structural legal conditions, such
as the protection of property and creditor rights, are imbedded in the law codes and
are effectively enforced. Without these requirements, liberalization does not seem to
24
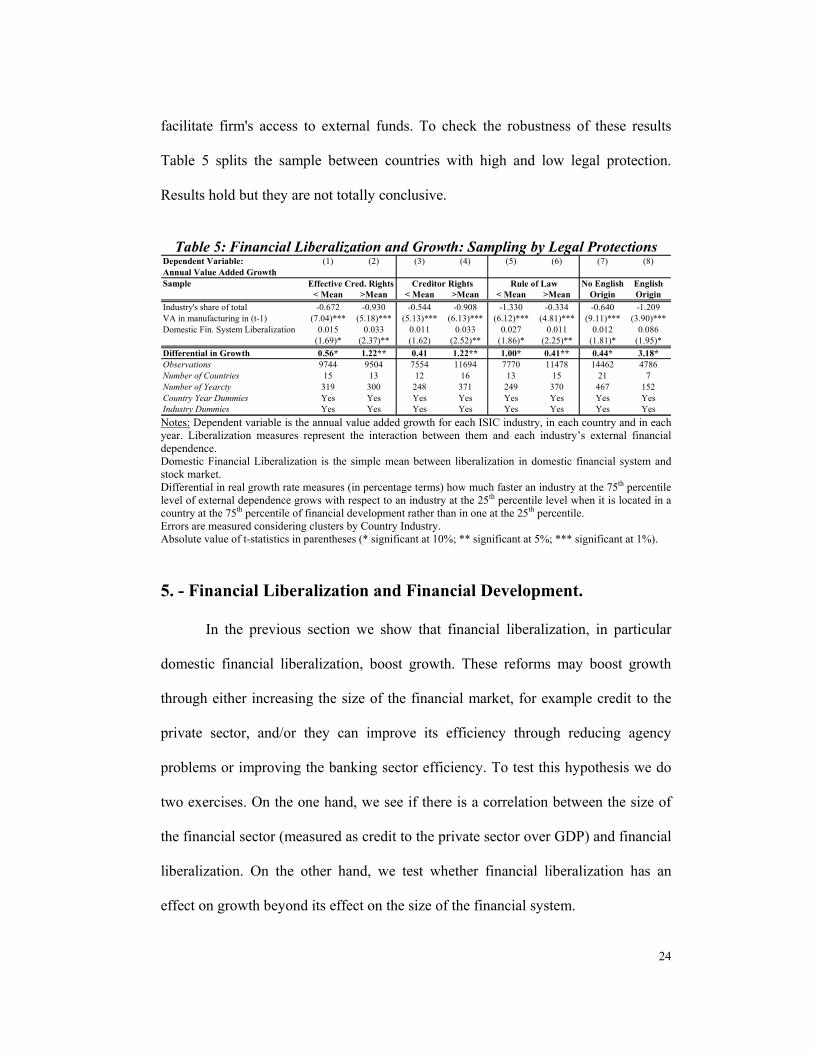
facilitate firm's access to external funds. To check the robustness of these results
Table 5 splits the sample between countries with high and low legal protection.
Results hold but they are not totally conclusive.
Table 5: Financial Liberalization and Growth: Sampling by Legal Protections
Dependent Variable: (1) (2) (3) (4) (5) (6) (7) (8)Annual Value Added GrowthSample No English English
< Mean >Mean < Mean >Mean < Mean >Mean Origin OriginIndustry's share of total -0.672 -0.930 -0.544 -0.908 -1.330 -0.334 -0.640 -1.209VA in manufacturing in (t-1) (7.04)*** (5.18)*** (5.13)*** (6.13)*** (6.12)*** (4.81)*** (9.11)*** (3.90)***Domestic Fin. System Liberalization 0.015 0.033 0.011 0.033 0.027 0.011 0.012 0.086
(1.69)* (2.37)** (1.62) (2.52)** (1.86)* (2.25)** (1.81)* (1.95)*Differential in Growth 0.56* 1.22** 0.41 1.22** 1.00* 0.41** 0.44* 3.18*Observations 9744 9504 7554 11694 7770 11478 14462 4786Number of Countries 15 13 12 16 13 15 21 7Number of Yearcty 319 300 248 371 249 370 467 152Country Year Dummies Yes Yes Yes Yes Yes Yes Yes YesIndustry Dummies Yes Yes Yes Yes Yes Yes Yes Yes
Effective Cred. Rights Creditor Rights Rule of Law
Notes: Dependent variable is the annual value added growth for each ISIC industry, in each country and in each year. Liberalization measures represent the interaction between them and each industry’s external financial dependence. Domestic Financial Liberalization is the simple mean between liberalization in domestic financial system and stock market. Differential in real growth rate measures (in percentage terms) how much faster an industry at the 75th percentile level of external dependence grows with respect to an industry at the 25th percentile level when it is located in a country at the 75th percentile of financial development rather than in one at the 25th percentile. Errors are measured considering clusters by Country Industry. Absolute value of t-statistics in parentheses (* significant at 10%; ** significant at 5%; *** significant at 1%).
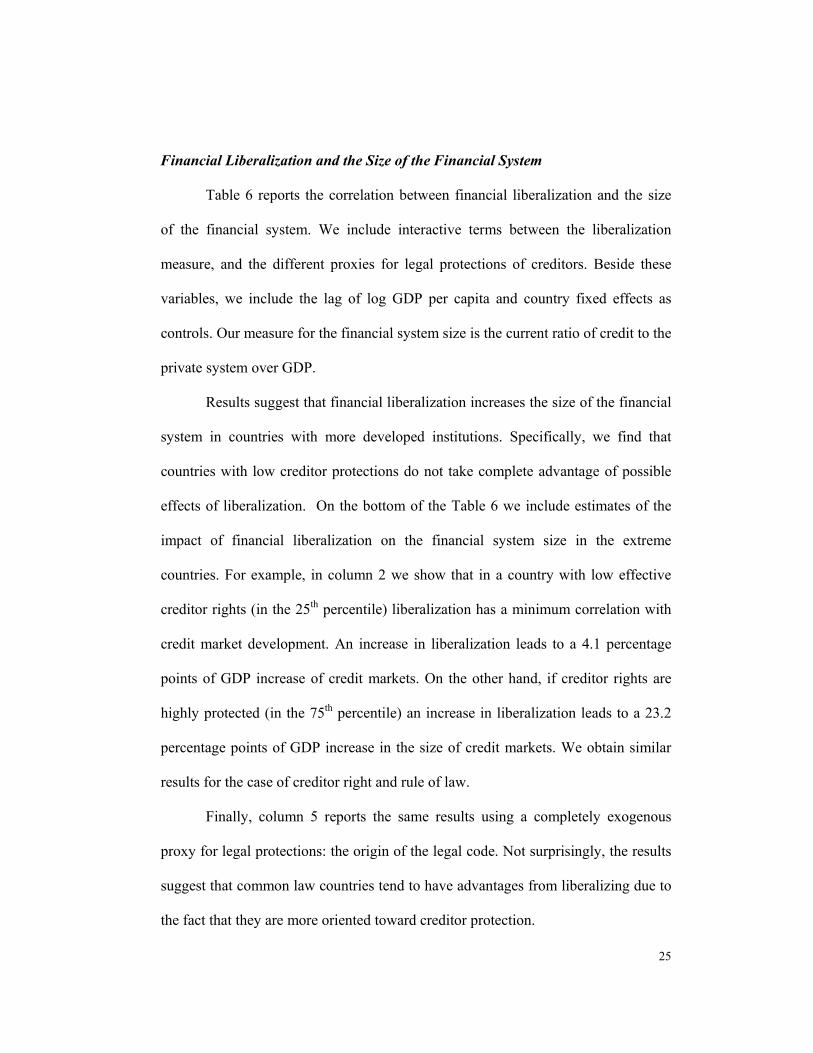
5. - Financial Liberalization and Financial Development.
In the previous section we show that financial liberalization, in particular
domestic financial liberalization, boost growth. These reforms may boost growth
through either increasing the size of the financial market, for example credit to the
private sector, and/or they can improve its efficiency through reducing agency
problems or improving the banking sector efficiency. To test this hypothesis we do
two exercises. On the one hand, we see if there is a correlation between the size of
the financial sector (measured as credit to the private sector over GDP) and financial
liberalization. On the other hand, we test whether financial liberalization has an
effect on growth beyond its effect on the size of the financial system.
25
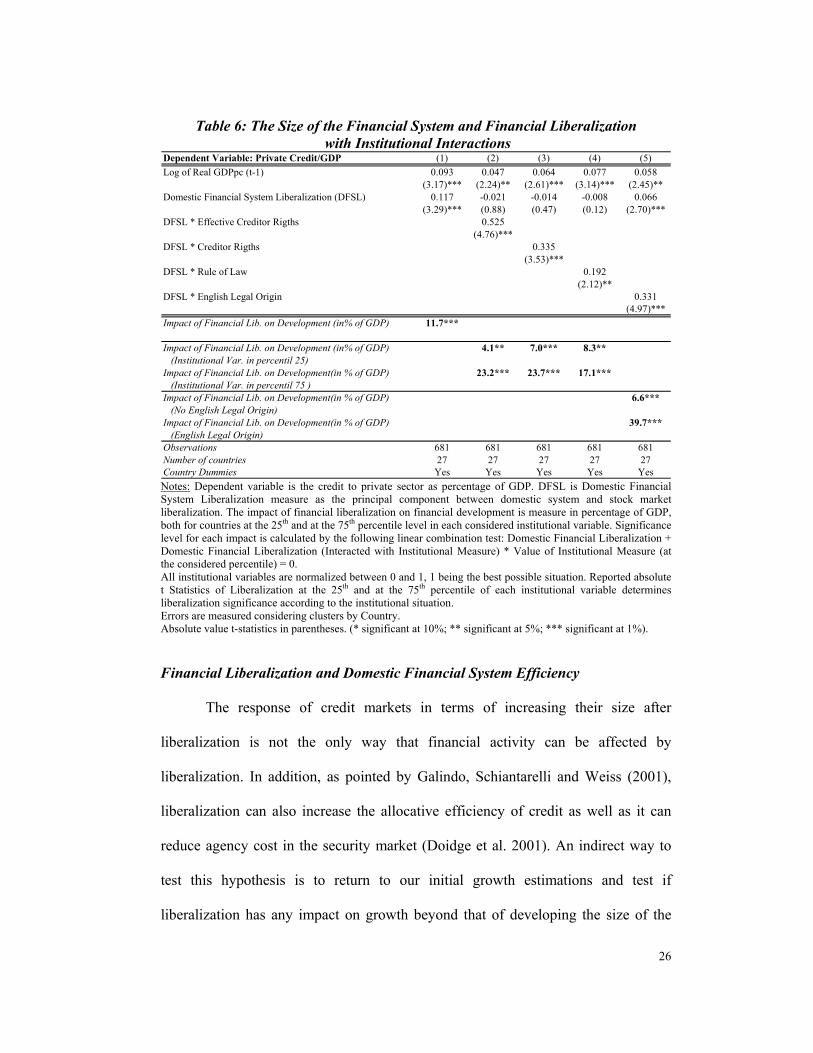
Financial Liberalization and the Size of the Financial System
Table 6 reports the correlation between financial liberalization and the size
of the financial system. We include interactive terms between the liberalization
measure, and the different proxies for legal protections of creditors. Beside these
variables, we include the lag of log GDP per capita and country fixed effects as
controls. Our measure for the financial system size is the current ratio of credit to the
private system over GDP.
Results suggest that financial liberalization increases the size of the financial
system in countries with more developed institutions. Specifically, we find that
countries with low creditor protections do not take complete advantage of possible
effects of liberalization. On the bottom of the Table 6 we include estimates of the
impact of financial liberalization on the financial system size in the extreme
countries. For example, in column 2 we show that in a country with low effective
creditor rights (in the 25th percentile) liberalization has a minimum correlation with
credit market development. An increase in liberalization leads to a 4.1 percentage
points of GDP increase of credit markets. On the other hand, if creditor rights are
highly protected (in the 75th percentile) an increase in liberalization leads to a 23.2
percentage points of GDP increase in the size of credit markets. We obtain similar
results for the case of creditor right and rule of law.
Finally, column 5 reports the same results using a completely exogenous
proxy for legal protections: the origin of the legal code. Not surprisingly, the results
suggest that common law countries tend to have advantages from liberalizing due to
the fact that they are more oriented toward creditor protection.
26
Table 6: The Size of the Financial System and Financial Liberalization with Institutional Interactions
Dependent Variable: Private Credit/GDP (1) (2) (3) (4) (5)Log of Real GDPpc (t-1) 0.093 0.047 0.064 0.077 0.058
(3.17)*** (2.24)** (2.61)*** (3.14)*** (2.45)**Domestic Financial System Liberalization (DFSL) 0.117 -0.021 -0.014 -0.008 0.066
(3.29)*** (0.88) (0.47) (0.12) (2.70)***DFSL * Effective Creditor Rigths 0.525
(4.76)***DFSL * Creditor Rigths 0.335
(3.53)***DFSL * Rule of Law 0.192
(2.12)**DFSL * English Legal Origin 0.331
(4.97)***Impact of Financial Lib. on Development (in% of GDP) 11.7***
Impact of Financial Lib. on Development (in% of GDP) 4.1** 7.0*** 8.3** (Institutional Var. in percentil 25)Impact of Financial Lib. on Development(in % of GDP) 23.2*** 23.7*** 17.1*** (Institutional Var. in percentil 75 )Impact of Financial Lib. on Development(in % of GDP) 6.6*** (No English Legal Origin)Impact of Financial Lib. on Development(in % of GDP) 39.7*** (English Legal Origin)Observations 681 681 681 681 681Number of countries 27 27 27 27 27Country Dummies Yes Yes Yes Yes Yes Notes: Dependent variable is the credit to private sector as percentage of GDP. DFSL is Domestic Financial System Liberalization measure as the principal component between domestic system and stock market liberalization. The impact of financial liberalization on financial development is measure in percentage of GDP, both for countries at the 25th and at the 75th percentile level in each considered institutional variable. Significance level for each impact is calculated by the following linear combination test: Domestic Financial Liberalization + Domestic Financial Liberalization (Interacted with Institutional Measure) * Value of Institutional Measure (at the considered percentile) = 0. All institutional variables are normalized between 0 and 1, 1 being the best possible situation. Reported absolute t Statistics of Liberalization at the 25th and at the 75th percentile of each institutional variable determines liberalization significance according to the institutional situation. Errors are measured considering clusters by Country. Absolute value t-statistics in parentheses. (* significant at 10%; ** significant at 5%; *** significant at 1%). Financial Liberalization and Domestic Financial System Efficiency
The response of credit markets in terms of increasing their size after
liberalization is not the only way that financial activity can be affected by
liberalization. In addition, as pointed by Galindo, Schiantarelli and Weiss (2001),
liberalization can also increase the allocative efficiency of credit as well as it can
reduce agency cost in the security market (Doidge et al. 2001). An indirect way to
test this hypothesis is to return to our initial growth estimations and test if
liberalization has any impact on growth beyond that of developing the size of the
27
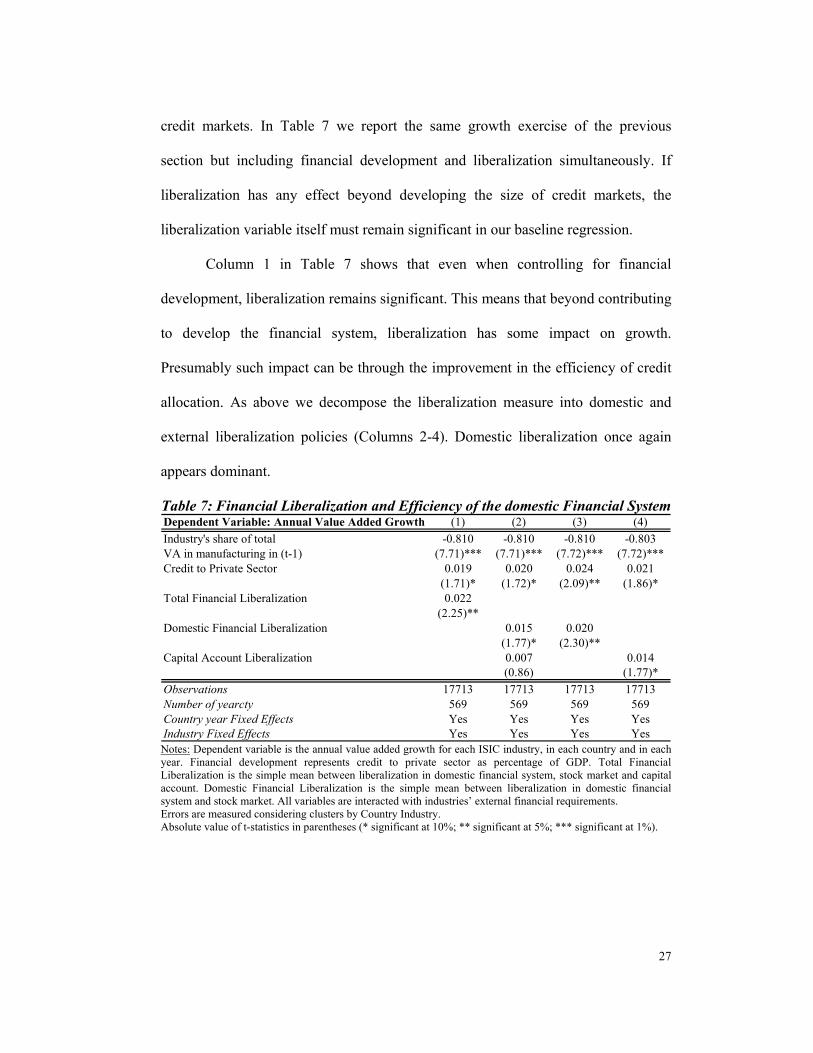
credit markets. In Table 7 we report the same growth exercise of the previous
section but including financial development and liberalization simultaneously. If
liberalization has any effect beyond developing the size of credit markets, the
liberalization variable itself must remain significant in our baseline regression.
Column 1 in Table 7 shows that even when controlling for financial
development, liberalization remains significant. This means that beyond contributing
to develop the financial system, liberalization has some impact on growth.
Presumably such impact can be through the improvement in the efficiency of credit
allocation. As above we decompose the liberalization measure into domestic and
external liberalization policies (Columns 2-4). Domestic liberalization once again
appears dominant.
Table 7: Financial Liberalization and Efficiency of the domestic Financial System Dependent Variable: Annual Value Added Growth (1) (2) (3) (4)Industry's share of total -0.810 -0.810 -0.810 -0.803VA in manufacturing in (t-1) (7.71)*** (7.71)*** (7.72)*** (7.72)***Credit to Private Sector 0.019 0.020 0.024 0.021
(1.71)* (1.72)* (2.09)** (1.86)*Total Financial Liberalization 0.022
(2.25)**Domestic Financial Liberalization 0.015 0.020
(1.77)* (2.30)**Capital Account Liberalization 0.007 0.014
(0.86) (1.77)*Observations 17713 17713 17713 17713Number of yearcty 569 569 569 569Country year Fixed Effects Yes Yes Yes YesIndustry Fixed Effects Yes Yes Yes Yes Notes: Dependent variable is the annual value added growth for each ISIC industry, in each country and in each year. Financial development represents credit to private sector as percentage of GDP. Total Financial Liberalization is the simple mean between liberalization in domestic financial system, stock market and capital account. Domestic Financial Liberalization is the simple mean between liberalization in domestic financial system and stock market. All variables are interacted with industries’ external financial requirements. Errors are measured considering clusters by Country Industry. Absolute value of t-statistics in parentheses (* significant at 10%; ** significant at 5%; *** significant at 1%).
28
6. - Conclusions As found in previous work by Rajan and Zingales, financial development
allows for the provision of cheaper funds which tend to benefit and stimulate the
growth of economic sectors that are dependent on external funding. We find that
financial liberalization is an instrument that, under certain conditions, promotes
financial sector development and through it can stimulate the relative growth rate of
sectors that rely on external funding. In order to promote development, though, other
structural reforms that support the proper behavior of financial markets have to be in
place. Hence even if systems reach full liberalization, the impact of liberalization on
domestic credit market growth can be null if rules and institutions that support
creditor rights are not in place. If the proper legal setup is in place, the impact of
liberalization on growth can be notable. Finally, it is worth to note that, like Rodrik
(1998), we find that, contrary to policies which reduce domestic “financial
repression,” capital account liberalization does not seem to boost growth.
29
Data Appendix Our sample includes the 28 countries that have data on financial liberation
from Kaminsky and Schmukler (2001) for the period 1973-1998. This data includes
information on capital account, domestic financial sector and stock market
liberalization. For capital markets liberalization they study whether corporations are
allowed to borrow abroad and if multiple exchange rate mechanisms or other sorts
of capital controls are in place. Regarding financial liberalization they explore
interest rate controls (lending and deposits) and other restrictions such as directed
credit policies or limitations on foreign currency deposits. With respect to stock
market liberalization they analyze the degree to which foreigners are allowed to own
domestic equity and restrictions on repatriation of capital, dividends, and interest.
Each area of interest has an index ranging from 1 to 3. Higher values indicate higher
liberalization. The average for different regions is reported in Table 1. The last
column in that table presents a financial liberalization index that averages the three
independent measures. The countries and regions with information are the ones
shown in Table 7 at the end of this Appendix.
Our measure of sector dependence on external financing is taken from Rajan
and Zingales (1998). Their dataset covers 37 industries; 28 of them correspond to
three-digit ISIC codes and 9 correspond to four-digit ISIC code.
Data on value added for each industry in each country were obtained from
three different sources. The first of them was the Industrial Statistics Yearbook
database put together by the United Nations Statistical Division (UNIDO, 2001). To
deflate our series we follows Rajan and Zingales (1998). The rate of growth of each
30
industry’s real value added is the difference between its rate of growth in nominal
terms minus the deflator rate of growth for the entire manufacturing sector. The
manufacturing deflator was calculated by the difference between the growth in
manufacturing nominal value added minus the rate of growth of the industrial
production index, obtained from the IMF’s International Finance Statistics (IFS)
database. Data of industrial production for Taiwan was obtained from its
Government web page http://www.stat.gov.tw/.
The second information source for value added was the “Programa de
Análisis de la Dinámica Industrial” (PADI-2000) database constructed by the
Division de Desarrollo Productivo y Empresarial - CEPAL. This database only
provides information for Latin American countries but is much more complete than
UNIDO information for these countries.
Finally, we also used the OECD STAN database for Industrial Analysis
edited by OECD in 1998. This dataset has information for all OECD countries and is
also available for our sample years.
From these three databases we constructed two different datasets. The first
dataset is just the UNIDO database that has information for all the countries in our
sample. The alternative dataset is a combination of the information of UNIDO,
PADI and OECD databases, though we used data of PADI and OECD whenever it
was possible. The databases mix was just across countries (data on each country has
only one information source for all the considered years). For this last dataset, 55%
of the observations come from the OECD database, 20% from PADI and 25% from
UNIDO.
31
Our measure of financial development is Credit to Private Sector and Market
Capitalization of listed firms (both in percent of GDP). Both variables come from
World Development Indicators CD-ROM (2001). We do not consider Taiwan in the
analysis of financial development because data on this country is not present in the
World Bank database. These measures are reported in Table 1.
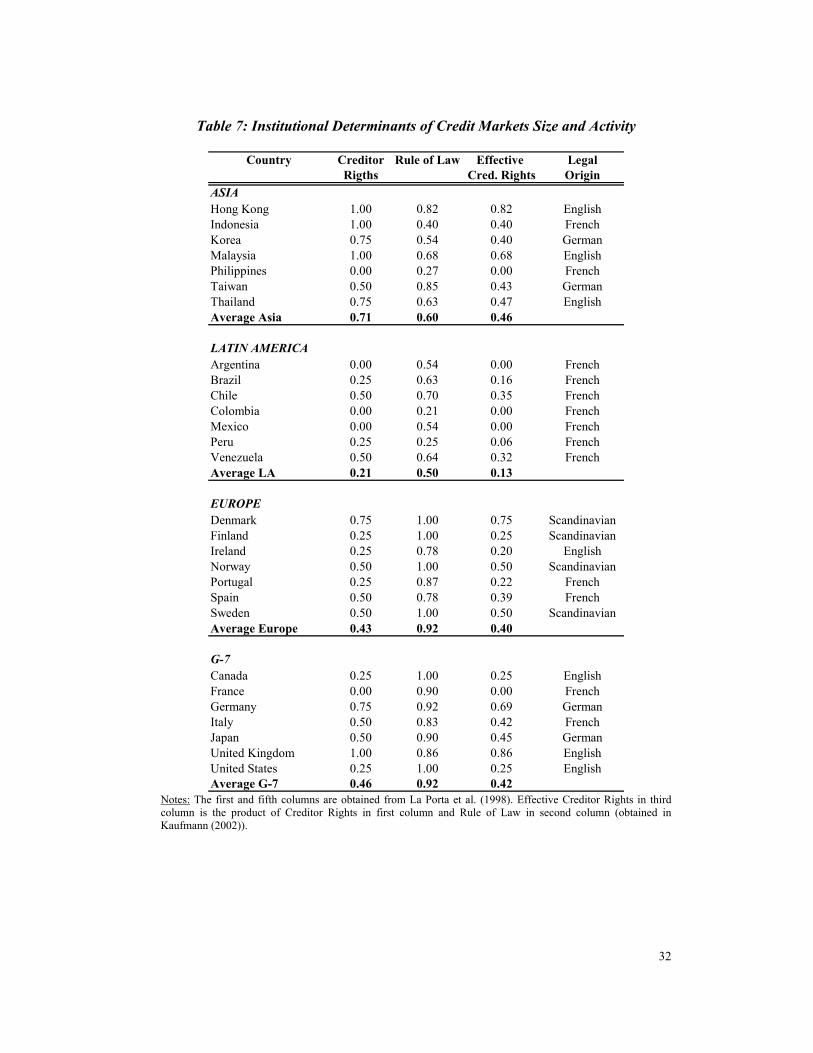
Measures of institutional development such as Creditor Rights, Rule of Law,
Risk of Expropriation and Legal Origin were obtained from La Porta et al. (1998)
and Kaufmann et al. (2002). These measures are between 0 (complete lack of those
properties) and 1 (total presence). We present these indicators in Table 7.
32
Table 7: Institutional Determinants of Credit Markets Size and Activity
Country Creditor Rule of Law Effective LegalRigths Cred. Rights Origin
ASIAHong Kong 1.00 0.82 0.82 EnglishIndonesia 1.00 0.40 0.40 FrenchKorea 0.75 0.54 0.40 GermanMalaysia 1.00 0.68 0.68 EnglishPhilippines 0.00 0.27 0.00 FrenchTaiwan 0.50 0.85 0.43 GermanThailand 0.75 0.63 0.47 EnglishAverage Asia 0.71 0.60 0.46
LATIN AMERICAArgentina 0.00 0.54 0.00 FrenchBrazil 0.25 0.63 0.16 FrenchChile 0.50 0.70 0.35 FrenchColombia 0.00 0.21 0.00 FrenchMexico 0.00 0.54 0.00 FrenchPeru 0.25 0.25 0.06 FrenchVenezuela 0.50 0.64 0.32 FrenchAverage LA 0.21 0.50 0.13
EUROPEDenmark 0.75 1.00 0.75 ScandinavianFinland 0.25 1.00 0.25 ScandinavianIreland 0.25 0.78 0.20 EnglishNorway 0.50 1.00 0.50 ScandinavianPortugal 0.25 0.87 0.22 FrenchSpain 0.50 0.78 0.39 FrenchSweden 0.50 1.00 0.50 ScandinavianAverage Europe 0.43 0.92 0.40
G-7Canada 0.25 1.00 0.25 EnglishFrance 0.00 0.90 0.00 FrenchGermany 0.75 0.92 0.69 GermanItaly 0.50 0.83 0.42 FrenchJapan 0.50 0.90 0.45 GermanUnited Kingdom 1.00 0.86 0.86 EnglishUnited States 0.25 1.00 0.25 EnglishAverage G-7 0.46 0.92 0.42
Notes: The first and fifth columns are obtained from La Porta et al. (1998). Effective Creditor Rights in third column is the product of Creditor Rights in first column and Rule of Law in second column (obtained in Kaufmann (2002)).
33
8. References Beck, T.; Levine, R. and N. Loayza (2000) "Finance and the Sources of Growth"
Journal of Financial Economics, 58, pp. 261-300. Bekaert, G, and C. Harvey (2000) “Foreign Speculators and Emerging Equity
markets”, Journal of Finance 55, pp. 565-614. Bekaert, G, Harvey, C and C. Lundblad. (2001) “Does Financial Liberalization Spur
Growth”, NBER Working Paper # 8245. Bertrand, M.; Duflo, E. and S. Mullainathan. (2002) “How Much Should We Trust
in Differences-in-Differences Estimates?” NBER Working Paper # 8841. Brecher, R. and C. Díaz-Alejandro. (1977) “ Tariffs, Foreign Capital and
Immiserizing Growth” Journal of International Economics 7, pp. 317-322. Brecher, R. (1983), “Second-Best Policy for International Trade and Investment”.
Journal of International Economics 14, pp. 313-320 CEPAL. Programa de analisis de dinamica industrial. (2000) - CD-ROM Claessens, S.; Demirguc-Kunt, A. and H. Huizinga. (2001). “How Does Foreign
Entry Affect Domestic Banking Markets?” Journal of Banking and Finance. 25, pp. 891-911.
De Gregorio, J. and P. Guidotti. (1993). “Financial Development and Economic Growth”. Washington DC. International Monetary Fund, July.
Demirguc-Kunt, A. and E. Detriagiache. (1998) "Financial Liberalization and Financial Fragility". World Bank Working Paper.
Díaz-Alejandro, C. (1985) “Good-Bye Financial Repression, Hello Financial Crash” Journal of Development Economics, 19 (1-2, September-October); pp. 1-24
Doidge, C.; Karolyi, A. and R. Stulz. (2001). “Why are Foreign Firms Listed in the US Worth More”. Ohio State University. Photocopy.
Eichengreen, B and A. Rose. (1999) “Contagious Currency Crises: Channels of Conveyance” in Takatoshi Ito and Anne Krueger (eds), Changes in Exchange Rates in Rapidly Developing Economies, Chicago: University of Chicago Press; pp. 29-56.
Eichengreen, B. (2001) “Capital Account Liberalization: What Do the Cross Country Studies Tell Us”. University of California, Berkeley, Photocopy.
Fry, M. (1978). “Money and Capital or Financial Deepening in Economic Development?” Journal of Money, Credit and Banking, 10 (4, November), pp. 464-475.
Fry, M. (1995). Money, Interest and banking in Economic Development. The Johns Hopkins University Press. Second Edition.
Galindo, A., F. Schiantarelli and A. Weiss. (2001) "Does Financial Liberalization Improve the Allocation of Investment? Micro Evidence from Developing Countries" Mimeo. IDB.
Galindo, A. and A. Micco. (2002) “ Legal Protection and Credit Cycles: Theory and Evidence”. IDB Working Paper # 443.
Ghani, E. (1992). “How Financial Markets Affect Long-Run Growth: A Cross-Country Study” Washington DC: World Bank, Country Operations, PR Working Paper WPS 843, January.
34
Gilchrist, S. and C. Himmelberg. (1998). Investment, Fundamentals and Finance. NBER Macroeconomics Annual, MIT Press.
Goldsmith, R. (1969). “Financial Structure and Development”. New Haven, CN, Yale University Press.
Henry, P. (2000a). “Stock Market Liberalization, Economic Reform and Emerging Markets Equity Prices”. Journal of Finance, 55, pp. 529-564.
Henry, P. (2000b). “Do Market Liberalization Cause Investment Booms”. Journal of Financial Economics.
Hubbard, G. (1997). “Capital Market imperfections and investment”, Journal of Economic Literature 36 (3), pp. 193-225.
International Monetary Fund. International Financial Statistics (2002). CD-ROM. Kaminsky, G. and S. Schmukler (2001). "On Booms and Crashes: Financial
Liberalization and Stock Market Cycles". World Bank Working Paper. King, R. and R. Levine. (1993). “Finance and Growth: Schumpeter Might Be Right”
Quaterly Journal of Economics, 108(3, August); pp. 717-737. Klenow, P. and A. Rodriguez-Clare. (1997). “Economic Growth: A Review Essay”,
Journal of Monetary Economics 40, pp. 597-617. La Porta, R.; Lopez-de-Silanes, F. and R. Vishny. (1997) “Legal Determinants of
External Finance”. Journal of Finance 52(3): pp. 1131-1150. La Porta, R.; Lopez-de-Silanes, F. and R. Vishny. (1998). “Law and Finance”.
Journal of Political Economy 106(6), pp. 1113-1155. Laeven, L. (2000), “Does Financial Liberalization Reduce Financial Constraints?”,
World Bank Working Paper. Lanyi, A. and R. Saracoglu (1983). “The importance of Interest Rates in Developing
Economies”. Finance and Development, 20(2), pp. 20-23. Levine, R; Loayza, N and T. Beck. (1999). “Financial Intermediation and Growth:
Causalty and Causes”. World Bank Working Papers # 2059. Lora, E. (2001). “Structural Reforms in Latin America: What has Been Reformed
and How to Measure It”. IDB Working Paper # 466. McKinnon, R (1973) Money and capital in Economic Development. Washington,
DC: Brookings Institution. Moel, A. (2001). “On American Depositary Receipts and Emerging Markets”.
Economía 2(1), pp. 209-273. OECD STAN Database for Industrial Analysis. (1999). Rajan, R. and L.Zingales (1998) "Financial Dependence and Growth". American
Economic Review. 88(3), pp. 559-586. Rodrick, D. (1998) “Who Needs Capital-Account Convertibility?” in Peter Kenen
(ed). Should the IMF Pursue Capital Account Convertibility? Essays in International Finance # 207. Princeton: Princeton University Press.
Roubini, N and X. Sala i Martin. (1991). “Financial Development, the Trade Regime and Economic Growth”. NBER Working Paper # 3876.
Sarkissian, S. and M. Schill (2001). “The Overseas Listing Decisions: New Evidence of Proximity Preference”. Photocopy.
Shaw, E. (1973) Financial Deepening in Economic Development. New York: Oxford University Press.
Stiglitz, J. (1994), “The Role of the State in Financial Markets” In Proceedings of the World Bank Annual Bank Conference on Development Economics 1993.
35
Edited by Michael Bruno and Boris Pleskovic, Washington DC, World bank, pp. 19-52.
Stiglitz, J. (2000), “Capital Market Liberalization, Economic Growth and Instability”, World Development 28, pp. 1075-1086.
Stulz, R. (1999). “Globalization of Equity Markets and the Cost of Capital”. NBER Working Paper # 7021.
UNIDO (United Nations). Industrial Statistics Database (2000) – CD-ROM World Bank (1989) World Development Report 1989. New York. Oxford University
Press for the World Bank. World Bank. World Development Indicators (2001) – CD-ROM