Embed Size (px)
Citation preview
Social Cohesion, Institutions, and Growth1
Abstract: We present evidence that measures of ‘social cohesion’, such as income inequality and ethnic fractionalization, endogenously determine institutional quality, which in turn causally determines growth.
This draft: November 2005 William Easterly2
Jozef Ritzen3
Michael Woolcock4
1 Views expressed here are those of the authors alone, and should not be attributed to the organizations with which they are affiliated. We thank participants from various conferences and seminars for valuable feedback, and Victoria Levin for excellent research assistance. Please address correspondence to Michael Woolcock, The World Bank, Mail Stop MC3-306, 1818 H Street NW, Washington, DC 20433. Email: [email protected] 2 Department of Economics, New York University, and Center for Global Development, Washington, DC. 3 Office of the President, Maastricht University. 4 Development Research Group, The World Bank, and Kennedy School of Government, Harvard University.
1
1. Introduction
Policy and institutional quality are to a large extent endogenous. While the truth of this
statement is familiar to most development scholars, the implications of it have drawn
relatively little empirical attention. Understanding more about this relationship matters,
because “poor institutional quality” and “failure to implement better policies” are so
frequently identified as the causes of growth collapses, endemic poverty, and civil
conflict. Such explanations are logically (and properly) followed by calls to improve
institutions and policies, but an implicit assumption in such calls is that realizing them is
simply a matter of choice, technocratic skill, and/or sheer political will. Seasoned
politicians and policymakers of good will, however, characteristically encounter
constraints that are at once more enduring and less tangible in nature.
In this paper we endeavor to address systematically the constraints to policy
reform in developing countries by examining the strength and direction of the
relationship between social structures, political institutions, and economic policies.
Specifically, we argue that one of the primary reasons why even good politicians in
countries all over the world, but especially in low-income countries, often enact bad
policies is that they experience significant social constraints on their efforts to bring
about reform. These constraints are shaped by the degree of ‘social cohesion’ within their
country. We show that social cohesion determines the quality of institutions, which in
turn has important impacts on whether and how pro-growth policies are devised and
implemented.
A country’s social cohesion is essential for generating the confidence and
patience needed to implement reforms: citizens have to trust the government that the
2
short-term losses inevitably arising from reform will be more than offset by long-term
gains. The inclusiveness of a country’s communities and institutions (e.g., laws and
norms against discrimination) can greatly help to build cohesion. On the other hand,
countries strongly divided along class and ethnic lines will place severe constraints on the
attempts of even the boldest, civic-minded, and well-informed politician (or interest
group) seeking to bring about policy reform. We argue that the strength of institutions
itself may be, in part, determined by social cohesion. If this is so, we propose that key
development outcomes (the most widely available being “economic growth”) should be
more likely to be associated with countries governed by effective public institutions, and
that those institutions, in turn, should be more likely to be found in socially cohesive
societies. We test this hypothesis for a sample of countries using (though well aware of
the limitations of) cross-country regressions.
In stressing the importance of social cohesion to understanding broad
development outcomes, we caution against expecting that it might be the key, given that
development is inherently complex. Moreover, our attempts to measure social cohesion
in a formal sense should not blind us to social cohesion’s analytical power—i.e., its
capacity to help us organize our thinking on the complex processes which lead to social
or political choices—which may in turn serve to help us better identify the causal
mechanisms linking social and political variables to short or long term development
outcomes.
The paper proceeds as follows. In section two we review the literature and
summarize the data that is available to investigate the central hypotheses. This is
followed in section three with our statistical analysis. While several earlier studies have
3
shown that differences in growth rates among low income countries are the result of lack
of democracy, weak rule of law, and the like, we are more interested here in the social
conditions that give rise to these institutional deficiencies. In section 3, we explore
empirically whether there is a causal sequence that goes from social divisions to weak
institutions to slow growth. The essence of our conclusion, supported by new
econometric evidence presented here, is that pro-development policies are comparatively
rare in the developing world less because of the moral fiber of politicians (though that
surely matters) than because of insufficient social cohesion that impedes the construction
of effective institutions (and thereby narrows a given policymaker’s room for maneuver).
In section four we conclude by exploring some possible extensions and implications, in
particular the need for more research on the determinants of social cohesion (focusing on
historical accidents, initial conditions, natural resource endowments) and ways in which
to foster it.
2. Social Cohesion: Definitions, Evidence, and Data
In seeking to unpack the notion of social cohesion, we concede from the outset that some
infamous historical figures with a narrow—even sectarian—agenda have invoked social
cohesion-type arguments as the basis for their actions. The desire to cultivate a sense of
national unity and “purity” brought us the Holocaust and ethnic cleansing, so we are most
surely not arguing that social cohesion equals cultural homogeneity or intolerance of
diversity; quite the opposite. On the other hand, nor are we invoking some naïve
suggestion that socially cohesive societies are always harmonious, devoid of political
conflict or dissent. Rather, we use the concept of social cohesion to make the general
4
point that the extent to which people work together when crisis strikes or opportunity
knocks is a key factor shaping economic performance. Graphic scenes on CNN during
the 1997 financial crisis in South Korea neatly illustrates social cohesion in action:
everyday citizens were shown tearfully selling their modest family treasures in the belief
that their humble contribution was somehow making a difference to the financial health
of their country. Where this sense of cohesion is lacking—as it was in, say, Indonesia—
the response to the crisis was far more sluggish and uneven, heightening a number of
other latent and manifest political tensions. Managing these tensions during crises, and
ensuring that they do not descend into outright or violent conflict, is a key political task
(Bates, 2000). Failure to do so can be disastrous for rich and poor, powerful and
powerless alike. As Rodrik (1997:1) correctly notes, “the deepening of social fissures can
harm all.”
Social cohesion has many formal definitions (for global overviews see Jensen
1998, Canadian Government 1999, and Ritzen 2001). Judith Maxwell (1996: 13), for
example, argues that social cohesion refers to the processes of
building shared values and communities of interpretation, reducing disparities in wealth and income, and generally enabling people to have a sense that they are engaged in a common enterprise, facing shared challenges, and that they are members of the same community.5
While generally sympathetic to this approach, we adopt a slightly more instrumental
definition that more readily lends itself to measurement. Accordingly, for the purposes of
this paper, we define social cohesion as the nature and extent of social and economic
divisions within society. These divisions—whether by income, ethnicity, political party,
caste, language, or other demographic variable—represent vectors around which
5 As cited by Jensen (1998).
5
politically salient societal cleavages can (though not inevitably or “naturally”) develop.
As such, socially cohesive societies (as stressed above) are not necessarily
demographically homogenous, but rather ones that have fewer potential and/or actual
leverage points for individuals, groups, or events to expose and exacerbate social fault
lines, and ones that find ways to harness the potential residing in their societal diversity
(in terms of diversity of ideas, opinions, skills, etc).
Presumably what others have defined as social capital—i.e., the resources
inhering in relationships, networks, and other related forms of social connection
(Woolcock 1998)—will be an important basis for this aptitude. Where social capital is
increasingly being defined as a micro level variable (i.e., to study kinship systems,
households, social networks, and community organizations6), however, our central
concern here is with features of society as a whole, for which the term social cohesion is
more appropriate. Some of the same empirical indicators have indeed been used for both
(see below), but we believe the concepts are most fruitfully applied at distinctive units of
analysis, and do not wish to perpetuate further confusion.7
Direct Measures of Social Cohesion
Various attempts have been made in the literature to measure social cohesion directly.
The most common are:
6 On these debates see Foley and Edwards (1999), Putnam (2000), and Woolcock (2001), among others. 7 The basic characteristics of “social cohesion” as defined here differ from those of social capital in other ways. For example, while there is a growing literature emphasizing that social capital can generate positive or negative outcomes for society (Portes and Landolt 1996; Woolcock 1998, Putnam 2000), we define social cohesion in such a way that more is generally better. In the end, however, the use of a particular term over another matters far less than that the terms be clarified for the purposes at hand, and that the issues they collectively encapsulate are brought to the table and seriously debated.
6
• Memberships rates of organizations and civic participation
Participation in social organizations have been measured in developing countries by
Deepa Narayan and her collaborators (e.g., Narayan and Pritchett, 1999; Krishna, 2002),
but mostly on a micro (community) scale. At that level they are shown to be significant
predictors of income and an aptitude for cooperation. Robert Putnam’s (1993) important
work uses membership of organizations as a measure of social cohesion (or what he calls
social capital8), and Helliwell and Putnam (1995) find that this is positively associated
with regional economic performance in Italy (see also Guiso, Sapienza, and Zingales,
2000). Obtaining the same result from a larger sample of countries has proved
problematic, however. Knack (2001), for example, shows that a ‘trust’ variable
contributes to the explanation of economic growth, but that the ‘membership of
organizations’ variable—which Knack (2003), following Olson (1983) and Putnam
(1993), argues could be either bad or good for growth, respectively—shows only a
modest positive effect. For these reasons and because of the relative small available
sample, we will not use the membership variable.
• Measures of trust
A typical measure on trust (from the World Value Survey) is the aggregate of the answers
to the question “Do you think people can be trusted?” for a random sample of
respondents. Work relating cross-country answers to this question to economic
performance was pioneered by Knack and Keefer (1995, 1997), and has since been taken
up by several others (e.g., La Porta et al 1997; Knack 2001). The new surveys being
conducted around the world, including OECD countries such as Australia and members

7
of the European Union, promise to yield significant new insights, and will allow us to
address these issues with much greater confidence. Work in the transition economies is in
its infancy, though some early promising work is starting to appear (e.g. Rose 1995).
According to the World Values Survey data, “trust” is typically high in the richer
countries (rates are around 50%) and low in developing countries. Central and Eastern
European (CEE) countries generally have higher trust rates (between 15 and 35%) than
Latin American (LA) countries (with rates as low as 5% in Peru). Turkey is remarkable in
that it had a trust rate of only 10% in 1990 and 6.5% in 1995. African countries are in-
between CEE and LA countries in trust levels, while Asian countries are in-between
developed world and CEE countries.
Indirect Measures of Social Cohesion
Proxies for social cohesion have also been sought using structural factors such as class
and ethnicity inequalities, which may undermine the capacity of different groups to work
together. Measures of these variables include:
• Income distribution measures (Gini coefficients and share of income to middle 60%)
The Gini coefficient has been used by Rodrik (1999) to address issues pertaining to
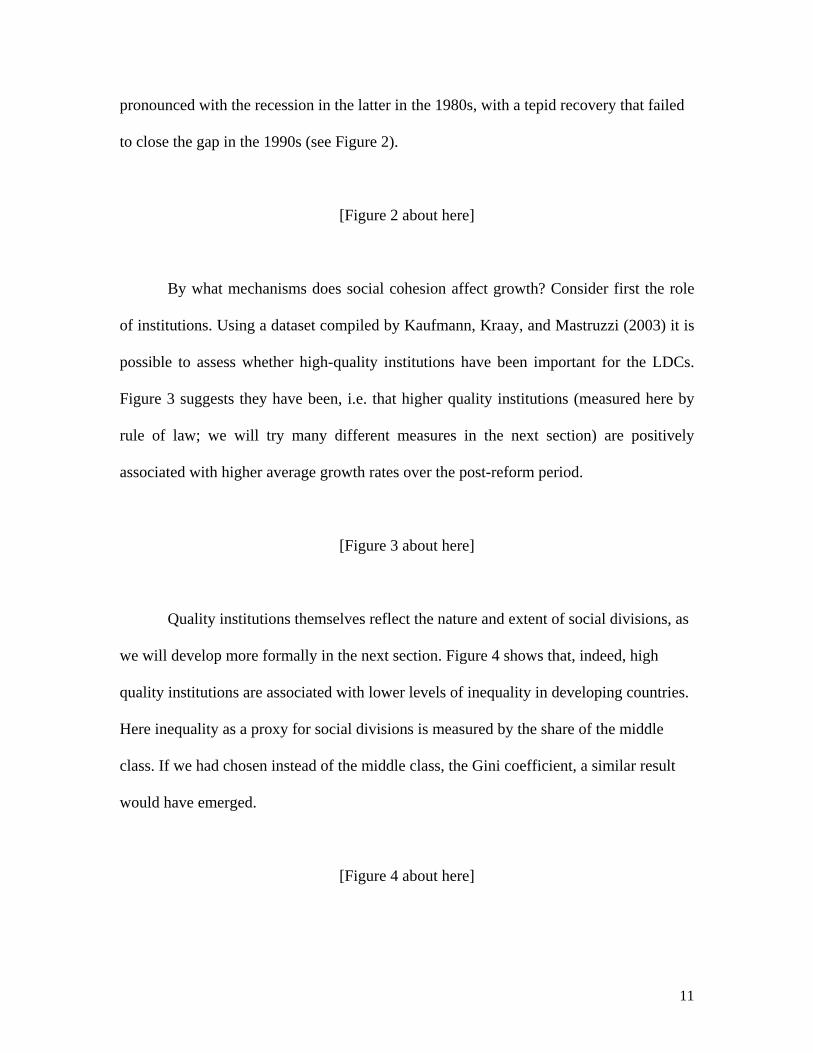
economic divisions in society. Easterly (2001a) finds that what he calls the “middle class
consensus” (i.e. a social inequality index that includes of the share of income going to the
middle 60% of the population) is a better measure. It is suggestive—we do not establish
causality here, but Easterly (2001a) addresses this issue—that countries with a middle
8 Putnam’s (2000) most recent study explicitly adopts a narrower and more ‘micro’ approach than his earlier work.
8
class share above 50 percent are rich economies (see Figure 2). While it would be
difficult to show that differences in middle class share are direct predictors of enormous
differences in aptitudes for change, a plausible case can be made that socially cohesive
countries will ensure that rich and poor alike share in both the costs and benefits of
change, and thus enjoy greater prosperity than those more divided countries, where the
benefits primarily go to the rich and the costs are borne by the poor.
It is important to note that while the simple correlation between the Gini
coefficient and the “middle class consensus” is high (0.88), there are nonetheless
important exceptions. Some countries (e.g. U.S.) have a large middle class but (for rich
countries) a high level of inequality; others have low inequality and a small middle class
(e.g. Hungary), while still others have a large middle class and low inequality (also for
rich countries) (e.g. the Netherlands).
• Ethnic heterogeneity (‘ethnolinguistic fractionalization’) measures
The most widely used measure establishes the probability that two randomly selected
individuals will not belong to the same ethnolinguistic group. India scores high on this
measure (89), but so do, for example, Cote d’Ivoire (83) and Bolivia (63). Examples of
countries with low scores are Korea (0) and Japan or the Netherlands (1).
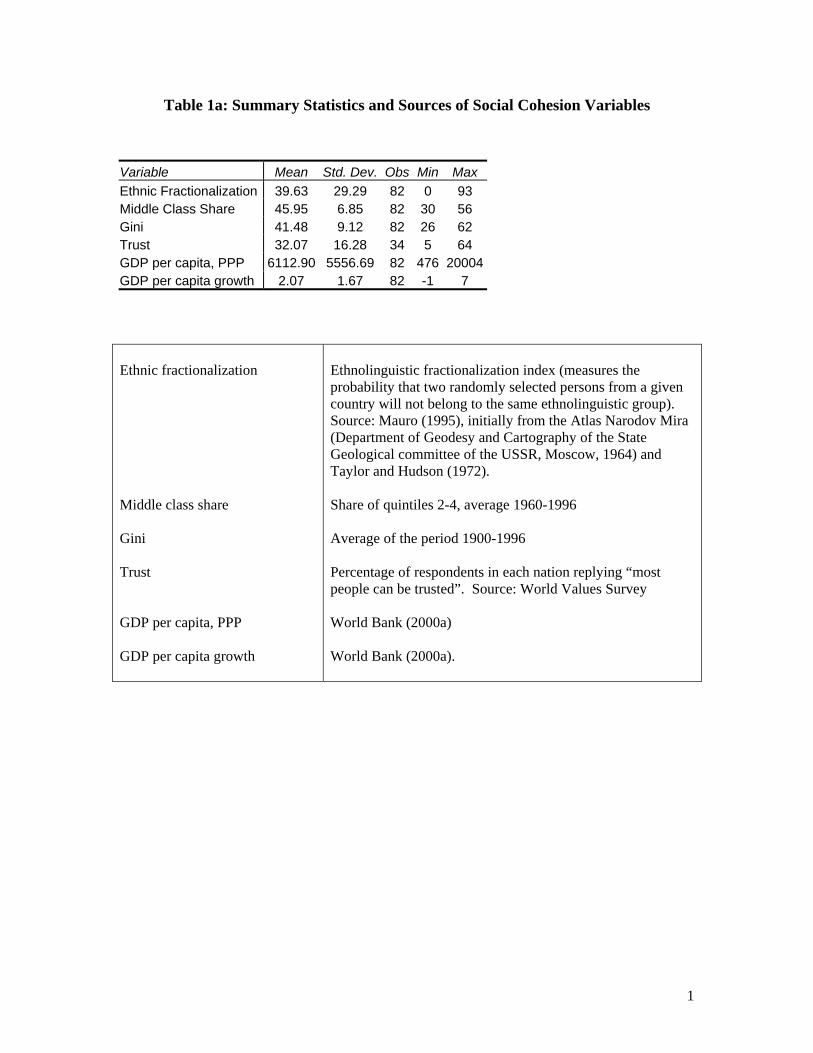
Table 1a gives an overview of the indicators used for social cohesion. For 57
developing countries and 25 high-income countries we have data available on the middle
class share and on ethnic fractionalization. Data on trust is only available for 34
countries (11 high income and 23 developing countries) for which also all the other data
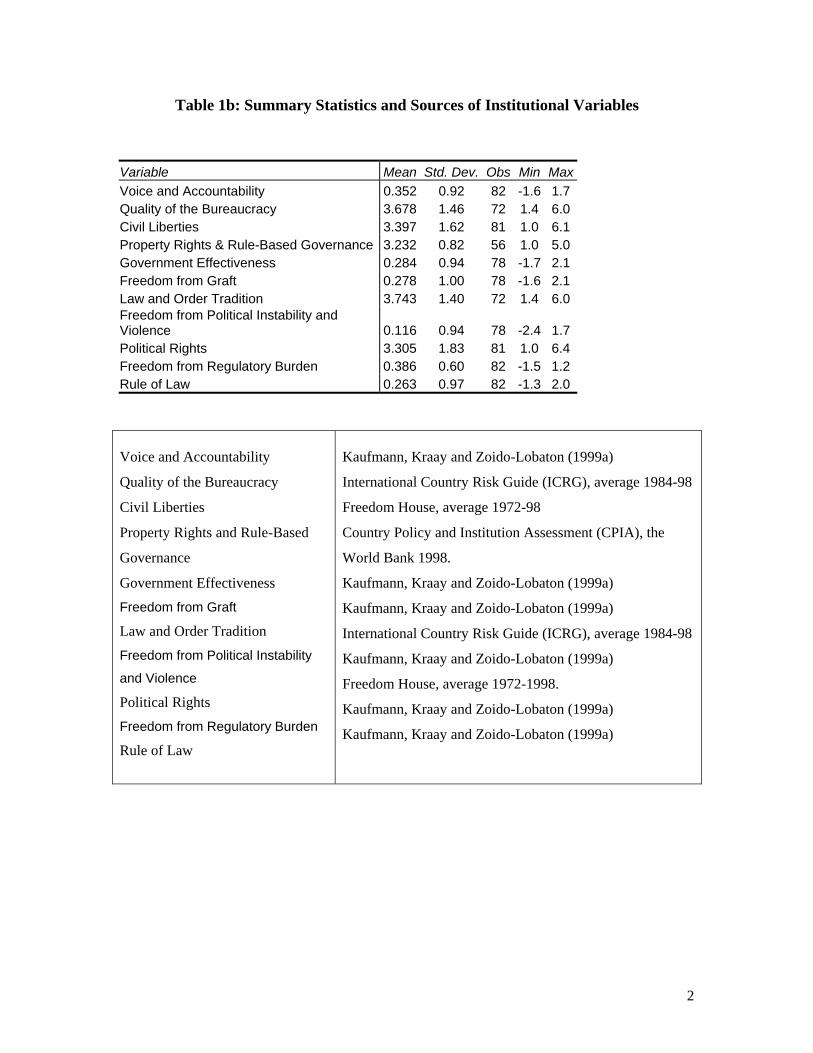
is available. Table 1b also includes our measures on institutions and their summary
statistics. Institutions have been assessed by experts from very different organizations.

9
[Tables 1a and 1b about here]
The quality of political institutions clearly will be also an important factor for
growth. Olson (2000) argues that governments with an “all-encompassing” interest in
society’s prosperity and welfare will promote growth more than governments that have a
more narrow interest. He argues that a stable autocrat will outperform an unstable
autocrat, while a stable democratic government will outperform either form of autocracy.
Best of all will be a democracy with checks and balances, enforcement of the rule of law,
and with clear rules of the game that prevent the majority from excluding or
expropriating a minority. Virtually all of the nations that are rich today fall into this latter
category. It is not too much of a stretch to see that socially cohesive societies will be
more likely to generate governments that have an “all-encompassing interest” in
promoting growth. Indeed, a central hypothesis emerging from our framework is that
high levels of social cohesion makes it easier to improve the quality of institutions.
These arguments are also supported by the recent literature on corruption (e.g.
Schleifer and Vishney 1993, Mauro 1995). Claims, for example, that corruption “greases
the wheels” of growth simply do not stand up to empirical scrutiny (Tanzi and Davoodi
1997, Kaufmann and Wei 1999).
3. New Evidence on Social Cohesion, Institutions and Economic Performance
The central story of economic growth over the last 50 years has been the contrast
between the years 1950-74 and 1975-2000. The former was a time of general prosperity,
10
in which all strategies yielded positive outcomes; rich and poor countries, open and
closed economies, large and small nations, those in temperate and tropical climates—
everyone did well. The twenty-year period between 1974 and 1994, however, was
disastrous for virtually everyone except the East Asian Tigers and India; the developing
world suffered a twenty-year growth collapse, from which it has only recently emerged
(Figure 1).
[Figure 1 about here]
While the causes of the global recession in the 1974-1994 are fairly well-known,
it is instructive to examine some of the differences between those countries that
weathered the storm, and those that did not. In his study of a large sample of developing
countries, Rodrik (1999) finds compelling evidence that weak public institutions and
(ethnically and economically) divided societies responded worse to the shock than did
those with high quality institutions and united societies.
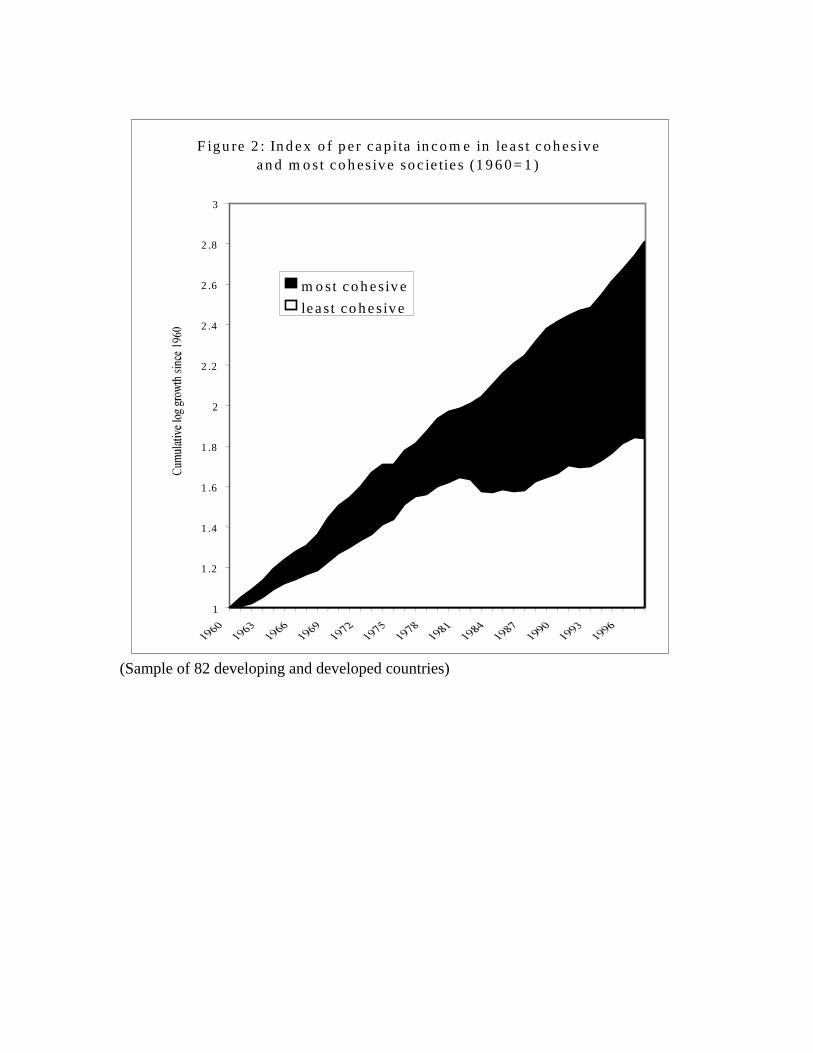
We find something similar here. We define as most cohesive those societies in the
lower half of ethnolinguistic fractionalization and in the upper half of share of the middle
class, and as least cohesive the reverse.9 We see that more cohesive societies have
always grown faster than less cohesive societies, but the difference only became
9 So defined, the least cohesive countries are: Algeria, Benin, Bolivia, Botswana, Cote d'Ivoire, Ecuador, Gabon, Guatemala, Guyana, Kenya, Malaysia, , Morocco, Myanmar, Nepal, Nigeria, Peru, Philippines, Senegal, Sierra Leone, South Africa, Sri Lanka, Sudan, Tanzania, Thailand, Uganda, Zambia, Zimbabwe. The most cohesive are: Australia, Austria, Denmark, Egypt, Arab Rep., Finland, France, Germany, Greece, Ireland, Israel, Italy, Japan, Republic of Korea, Luxembourg, Mauritania, Netherlands, New Zealand, Norway, Portugal, Rwanda, Sweden, United Kingdom.
11
pronounced with the recession in the latter in the 1980s, with a tepid recovery that failed
to close the gap in the 1990s (see Figure 2).
[Figure 2 about here]
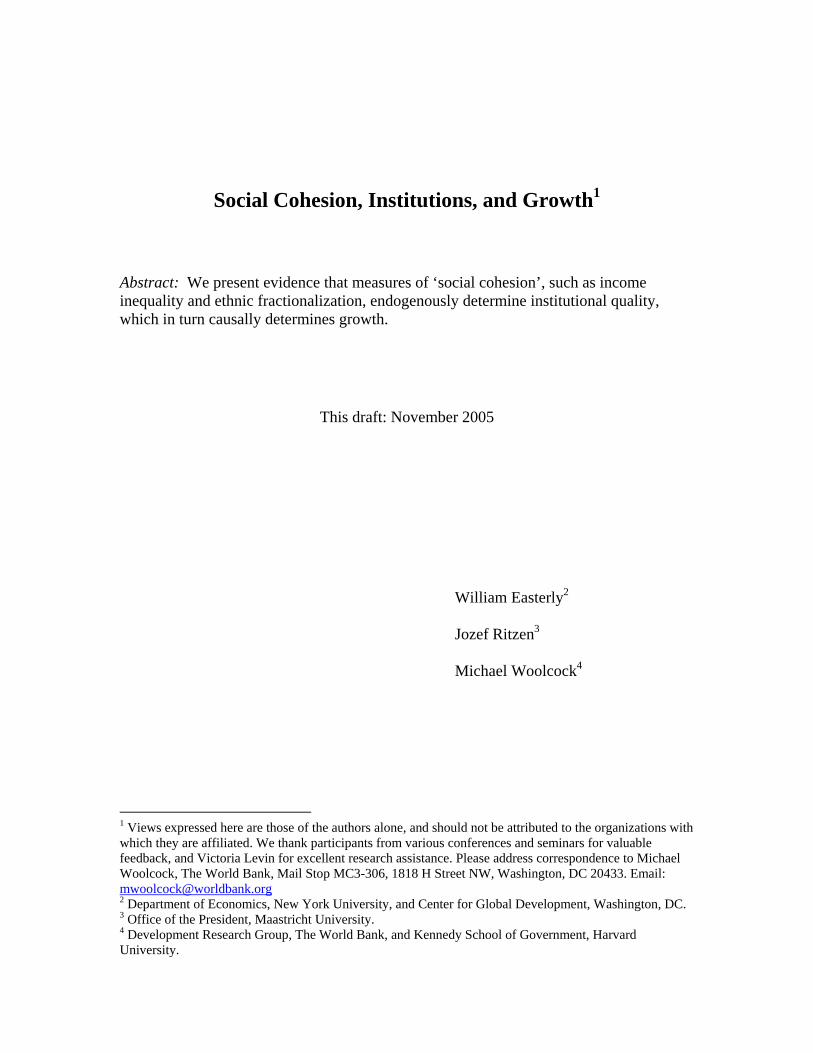
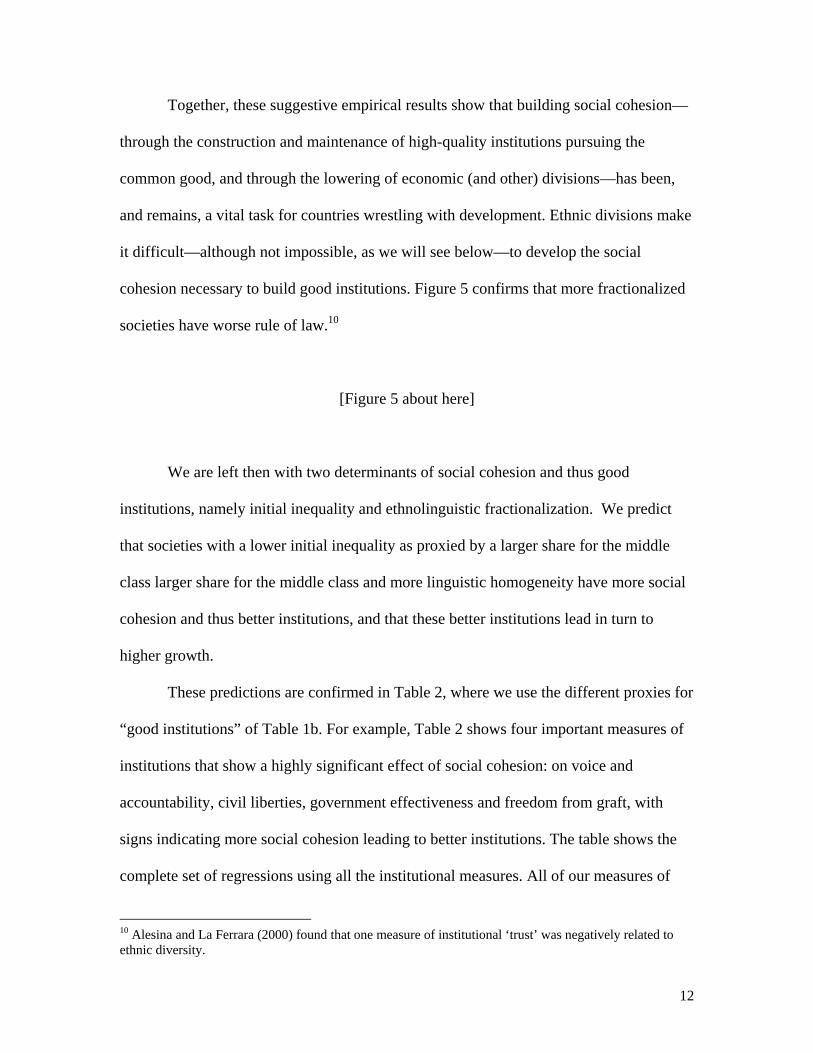
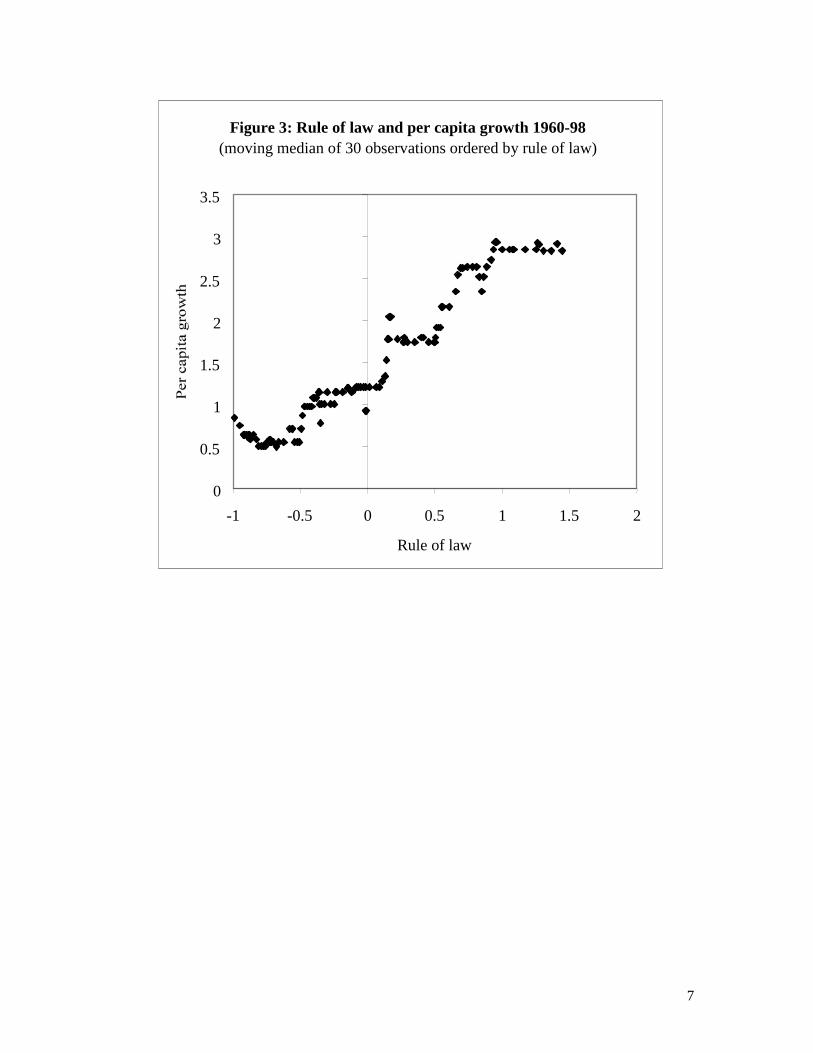
By what mechanisms does social cohesion affect growth? Consider first the role
of institutions. Using a dataset compiled by Kaufmann, Kraay, and Mastruzzi (2003) it is
possible to assess whether high-quality institutions have been important for the LDCs.
Figure 3 suggests they have been, i.e. that higher quality institutions (measured here by
rule of law; we will try many different measures in the next section) are positively
associated with higher average growth rates over the post-reform period.
[Figure 3 about here]
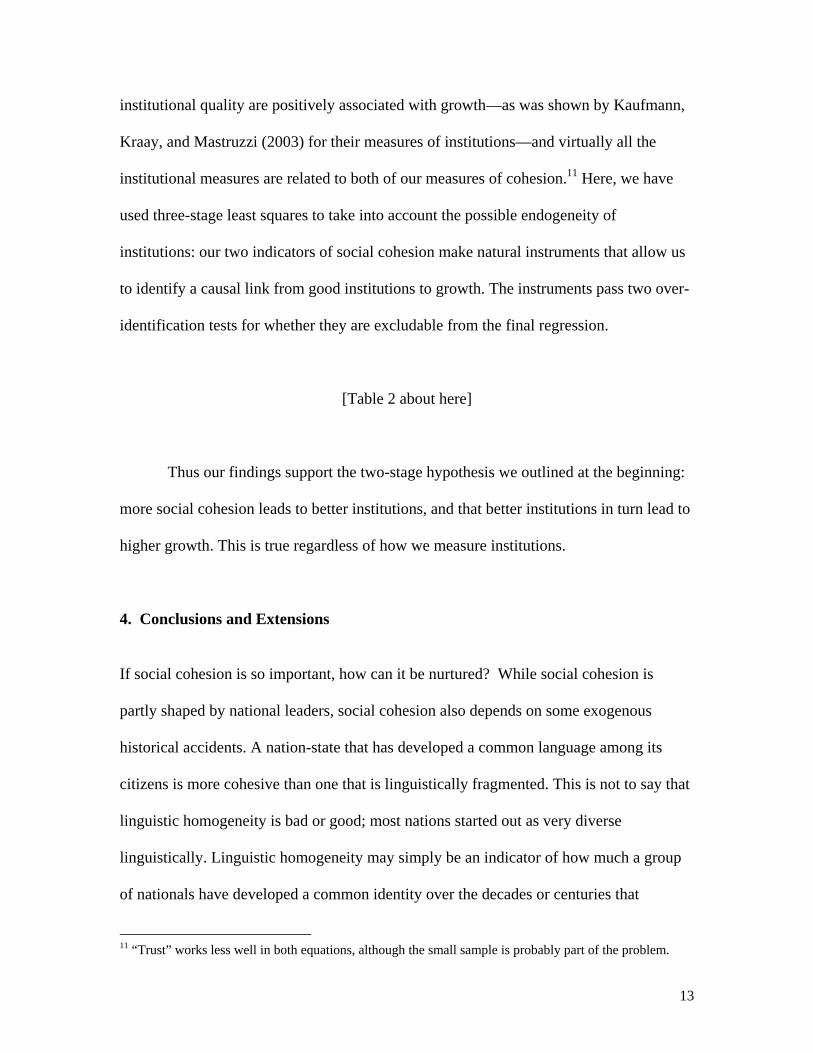
Quality institutions themselves reflect the nature and extent of social divisions, as
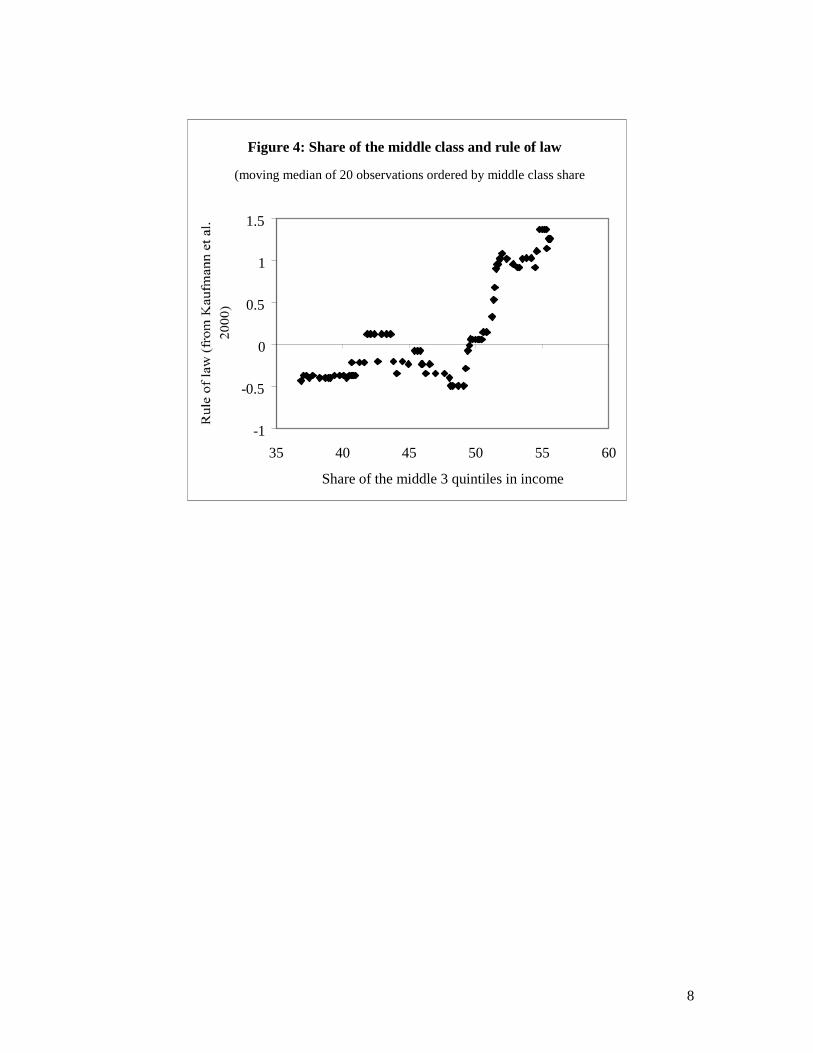
we will develop more formally in the next section. Figure 4 shows that, indeed, high
quality institutions are associated with lower levels of inequality in developing countries.
Here inequality as a proxy for social divisions is measured by the share of the middle
class. If we had chosen instead of the middle class, the Gini coefficient, a similar result
would have emerged.
[Figure 4 about here]
12
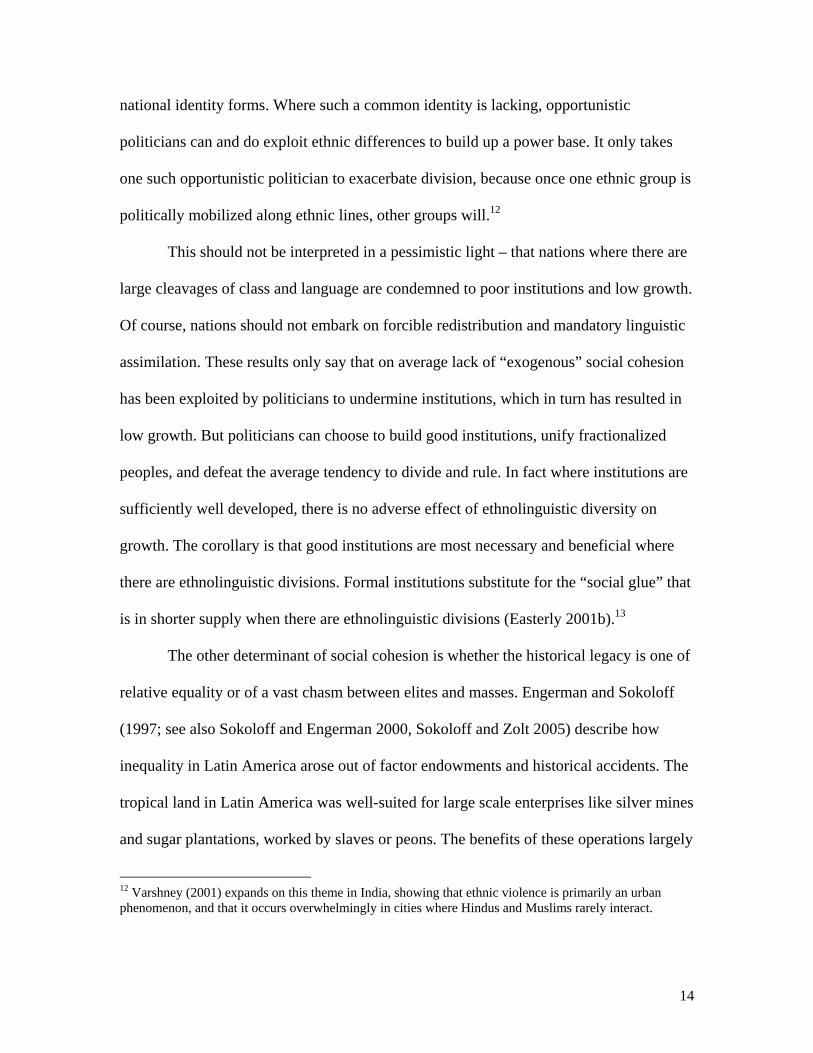
Together, these suggestive empirical results show that building social cohesion—
through the construction and maintenance of high-quality institutions pursuing the
common good, and through the lowering of economic (and other) divisions—has been,
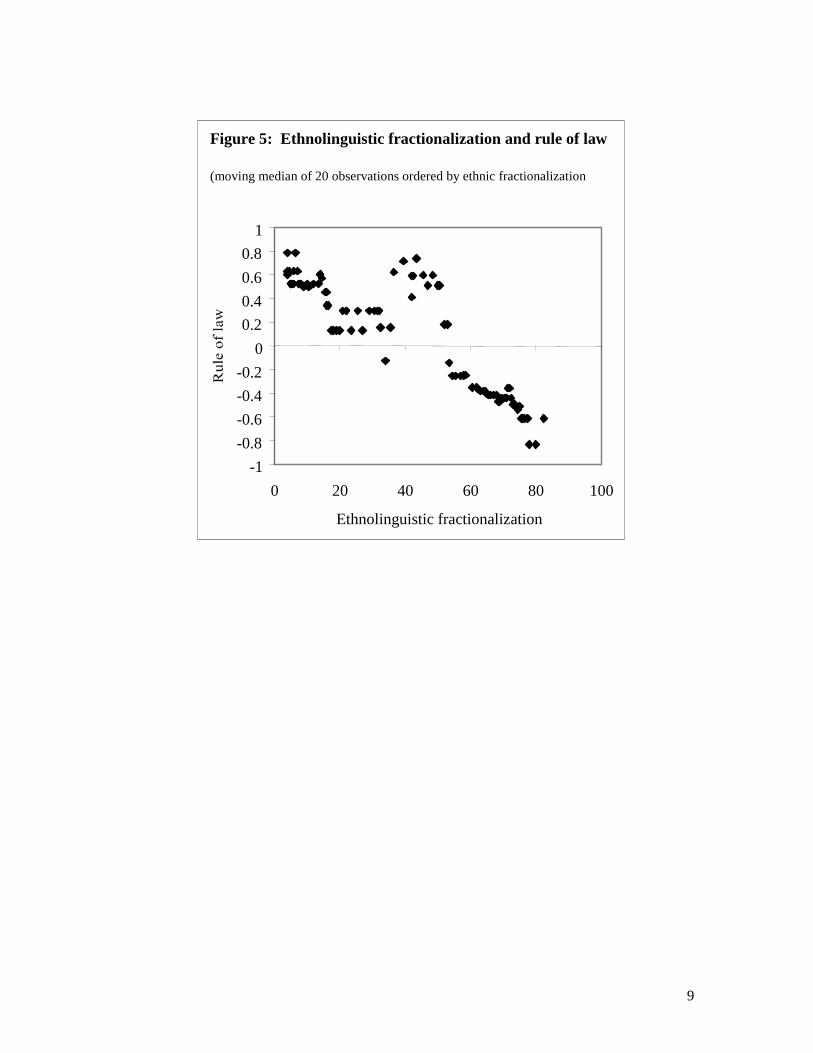
and remains, a vital task for countries wrestling with development. Ethnic divisions make
it difficult—although not impossible, as we will see below—to develop the social
cohesion necessary to build good institutions. Figure 5 confirms that more fractionalized
societies have worse rule of law.10
[Figure 5 about here]
We are left then with two determinants of social cohesion and thus good
institutions, namely initial inequality and ethnolinguistic fractionalization. We predict
that societies with a lower initial inequality as proxied by a larger share for the middle
class larger share for the middle class and more linguistic homogeneity have more social
cohesion and thus better institutions, and that these better institutions lead in turn to
higher growth.
These predictions are confirmed in Table 2, where we use the different proxies for
“good institutions” of Table 1b. For example, Table 2 shows four important measures of
institutions that show a highly significant effect of social cohesion: on voice and
accountability, civil liberties, government effectiveness and freedom from graft, with
signs indicating more social cohesion leading to better institutions. The table shows the
complete set of regressions using all the institutional measures. All of our measures of
10 Alesina and La Ferrara (2000) found that one measure of institutional ‘trust’ was negatively related to ethnic diversity.
13
institutional quality are positively associated with growth—as was shown by Kaufmann,
Kraay, and Mastruzzi (2003) for their measures of institutions—and virtually all the
institutional measures are related to both of our measures of cohesion.11 Here, we have
used three-stage least squares to take into account the possible endogeneity of
institutions: our two indicators of social cohesion make natural instruments that allow us
to identify a causal link from good institutions to growth. The instruments pass two over-
identification tests for whether they are excludable from the final regression.
[Table 2 about here]
Thus our findings support the two-stage hypothesis we outlined at the beginning:
more social cohesion leads to better institutions, and that better institutions in turn lead to
higher growth. This is true regardless of how we measure institutions.
4. Conclusions and Extensions
If social cohesion is so important, how can it be nurtured? While social cohesion is
partly shaped by national leaders, social cohesion also depends on some exogenous
historical accidents. A nation-state that has developed a common language among its
citizens is more cohesive than one that is linguistically fragmented. This is not to say that
linguistic homogeneity is bad or good; most nations started out as very diverse
linguistically. Linguistic homogeneity may simply be an indicator of how much a group
of nationals have developed a common identity over the decades or centuries that
11 “Trust” works less well in both equations, although the small sample is probably part of the problem.
14
national identity forms. Where such a common identity is lacking, opportunistic
politicians can and do exploit ethnic differences to build up a power base. It only takes
one such opportunistic politician to exacerbate division, because once one ethnic group is
politically mobilized along ethnic lines, other groups will.12
This should not be interpreted in a pessimistic light – that nations where there are
large cleavages of class and language are condemned to poor institutions and low growth.
Of course, nations should not embark on forcible redistribution and mandatory linguistic
assimilation. These results only say that on average lack of “exogenous” social cohesion
has been exploited by politicians to undermine institutions, which in turn has resulted in
low growth. But politicians can choose to build good institutions, unify fractionalized
peoples, and defeat the average tendency to divide and rule. In fact where institutions are
sufficiently well developed, there is no adverse effect of ethnolinguistic diversity on
growth. The corollary is that good institutions are most necessary and beneficial where
there are ethnolinguistic divisions. Formal institutions substitute for the “social glue” that
is in shorter supply when there are ethnolinguistic divisions (Easterly 2001b).13
The other determinant of social cohesion is whether the historical legacy is one of
relative equality or of a vast chasm between elites and masses. Engerman and Sokoloff
(1997; see also Sokoloff and Engerman 2000, Sokoloff and Zolt 2005) describe how
inequality in Latin America arose out of factor endowments and historical accidents. The
tropical land in Latin America was well-suited for large scale enterprises like silver mines
and sugar plantations, worked by slaves or peons. The benefits of these operations largely
12 Varshney (2001) expands on this theme in India, showing that ethnic violence is primarily an urban phenomenon, and that it occurs overwhelmingly in cities where Hindus and Muslims rarely interact.
15
accrued to the small criollo class. The elite was kept small by restrictions on immigration
from Iberia or elsewhere to the Iberian colonies. The labor force had to be forcibly
recruited through the import of African-American slaves and the encomienda system that
tied the indigenous people to the elite’s land.
In Canada and in the North of the US, by contrast, the factor endowments were
conducive to small-scale production of food grains. A middle class of family farmers
developed. Practically unrestricted immigration and abundant available land (once the
tragic process of despoiling the native inhabitants was completed) swelled the size of the
middle class. Immigrants voluntarily assimilated into (and actively contributed to) the
dominant middle class culture. The American South was a kind of intermediate case
between North and South America, with a mixture of free family farmers, elite slave-
owners, and African-American slaves.14
One potentially important policy lever for enhancing social cohesion is education.
Heyneman (2000) identifies three ways in which education contributes to social cohesion.
First, it helps provide public knowledge about the very idea of social contracts among
individuals and between individuals and the state. Second, schools help provide the
context within which students learn the appropriate behavior for upholding social
contracts, by providing students with a range of experiences in which they learn how to
negotiate with people, problems, and opportunities they might not otherwise encounter.
As Heyneman (2000: 177) puts it, “the principle rationale, and the reasons nations invest
in public education, have traditionally been the social purpose of schooling... The
13 The notion of (ethno)linguistic fractionalization definitely begs operations on social cohesion within the European Union. Extra institutional efforts are required to overcome this disadvantage of different languages.

16
principle task of public schooling, properly organized and delivered, has traditionally
been to create harmony within a nation of divergent peoples.” Third, education helps
provide an understanding of the expected consequences of breaking social contracts;
indeed, it helps citizens understand and appreciate the very idea of a social contract.
Given the vital role the state has in shaping the context and climate within which
civil society is organized (Bunce 1999), it can, in some cases, also actively help to create
social cohesion by ensuring that public services are provided fairly and efficiently (i.e.
treating all citizens equally), and by actively redressing overt forms of discrimination and
other social barriers. These happy outcomes are most likely to come about through the
empowerment of domestic constituencies rather than via “conditionalities” imposed by
external donors and development agencies (Collier and Dollar 2004). This is one of the
conclusions of two recent World Development Reports (World Bank 2000b, 2001).
We have pointed to the importance of a research agenda that looks into the
cohesiveness of societies and the quality of public institutions, and their relationship to
sustained growth. We need to know a lot more about how equitable and fairly to manage
the costs and benefits associated with the transformation of society (Bates 2000),
especially how to foster a greater sense of cooperation and inclusion in environments
where there is (actual and potential) division, exclusion, and disaffection.
14 For an application of this general argument to understanding growth collapses in LDCs, see Woolcock, Pritchett, and Isham (2001).

17
References
Alesina, A. and E. La Ferrara, 2000, The determinants of trust, NBER Working Paper
#7621, Cambridge, MA
Bates, R., 2000, Prosperity and violence: The political economy of development (New
York: Norton)
Bunce, V., 1999, The political economy of postsocialism, Slavic Review 58(4): 756-93.
Canadian Government, 1999, Final report on social cohesion (Ottawa: The Standing
Senate Committee on Social Affairs, Science, and Technology)
Collier, P. and D. Dollar, 2004, Development effectiveness: What have we learnt?,
Economic Journal 114(496): F244-71
Easterly, W., 2001a, The middle class consensus and economic development, Journal of
Economic Growth 6(4): 317-35.
Easterly, W., 2001b, Can institutions resolve ethnic conflict?, Economic Development
and Cultural Change 49(4): 687-706.
Engerman, S. and K. Sokoloff, 1997, Factor endowments, institutions, and differential
paths of growth among New World economies, in S. Haber (ed.) How Latin
America fell behind: Essays on the economic history of Brazil and Mexico, 1800-
1914 (Stanford, CA: Stanford University Press)
Foley, M. and B. Edwards, 1999, Is it time to disinvest in social capital?, Journal of
Public Policy 19: 141-73.
Glaeser, E., 2001, The formation of social capital, Canadian Journal of Policy Research
2(1): 34-40.
Guiso, L., P. Sapienza, and L. Zingales, 2000, The role of social capital in financial
development, NBER Working Paper No. W7563, Cambridge, MA
Helliwell, J. and R. Putnam, 1995, Economic growth and social capital in Italy, Eastern
Economic Journal 21: 295-307.
Heyneman, S.P., 2000, From the party/state to multi-ethnic democracy: Education and
social cohesion in Europe and Central Asia, Educational Evaluation and Policy
Analysis 22(2): 173-191.
18
Jensen, J., 1998, Mapping social cohesion, Paper presented to the Policy Research
Secretariat’s Conference on ‘Policy Research: Creating Linkages’ (Ottawa,
Canada, October 1)
Kaufmann, D., A. Kraay, and P. Zoido-Lobaton, 1999, Aggregating governance
indicators” Policy Research Paper No. 2195, Washington, DC: The World Bank
Kaufmann, D., A. Kraay, and M. Mastruzzi, 2003, Governance matters III: Governance
indicators for 1996–2002, Policy Research Working Paper No. 3106. Washington,
DC: The World Bank
Kaufmann, D. and S. Wei, 1999, Does ‘grease money’ speed up the wheels of
commerce?, National Bureau of Economic Research Working Paper 7093,
Cambridge, MA
Knack, S., 2001, Trust, associational life and economic performance in the OECD, in J.
Helliwell (ed.), The contribution of human and social capital to sustained
economic growth and well-being (Ottawa: Human Resources Development
Canada)
Knack, S., 2003, Groups, growth, and trust: Cross-country evidence on the Olson and
Putnam hypotheses, Public Choice 117: 341-355.
Knack, S. and P. Keefer, 1995, Institutions and economic performance: Cross-country
tests using alternative institutional measures, Economics and Politics 7: 207-227.
Knack, S. and P. Keefer, 1997, Does social capital have an economic payoff? A cross-
country investigation, Quarterly Journal of Economics 112(4): 1251-88.
Krishna, A., 2002, Active social capital: Tracing the roots of development and
democracy (New York: Columbia University Press)
La Porta, R., F. Lopez-de-Silanes, A. Shleifer, and R. Vishney, 1997, Trust in large
organizations, American Economic Review 87: 333-38
Mauro, P., 1995, Corruption and growth, Quarterly Journal of Economics 110(3): 681-
712.
Maxwell, J., 1996, Social dimensions of economic growth, Eric John Hanson Memorial
Lecture Series, Volume 8, University of Alberta
19
Milanovic, B., 1998, Income, inequality, and poverty during the transition from planned
to market economy (Washington, DC: World Bank Regional and Sectoral Studies)
Narayan, D., and L. Pritchett, 1999, Cents and sociability: Household income and social
capital in rural Tanzania, Economic Development and Cultural Change 47(4):
871-97.
Norris, P., 1999, Critical citizens: Global support for democratic governance (New
York: Oxford University Press)
Olson, M., 1983, The rise and decline of nations: Economic growth, stagflation, and
social rigidities (New Haven: Yale University Press)
Olson, M., 2000, Power and prosperity: Outgrowing communist and capitalist
dictatorships (New York: Basic Books)
Osberg, L. and A. Sharpe, 2000, Comparisons of trends in GDP and economic well-
being: The impact of social capital, in J. Helliwell (ed.), The contribution of
human and social capital to sustained economic growth and well-being (Ottawa:
Human Resources Development Canada)
Portes, A. and P. Landolt, 1996, The downside of social capital, The American Prospect
26 (May-June): 18-21, 94.
Pritchett, L., 1997, Divergence, big time, Journal of Economic Perspectives 11(3): 3-17.
Putnam, R., 1993, Making democracy work (Princeton, NJ: Princeton University Press)
Putnam, R., 2000, Bowling alone: The collapse and renewal of American community
(New York: Simon and Schuster)
Ritzen, J., 2001, Social cohesion, public policy and economic growth: Implications for
OECD countries, in J. Helliwell (ed.), The contribution of human and social
capital to sustained economic growth and well-being (Ottawa: Human Resources
Development Canada)
Rodrik, D., 1997, Has globalization gone too far? (Washington, DC: Institute for
International Economics)
Rodrik, D., 1999, Where did all the growth go? External shocks, social conflicts, and
growth collapses, Journal of Economic Growth 4(4): 385-412.
Rose, R., 1995, Russia as a hour-glass society: A constitution without citizens, East
European Constitutional Review 4(3): 34-42.
20
Schleifer, A. and R. Vishney, 1993, Corruption, Quarterly Journal of Economics 58(3):
599-617.
Sokoloff, K. and S. Engerman, 2000, Institutions, factor endowments, and paths of
development in the New World, Journal of Economic Perspectives 14(3): 217-32.
Sokoloff, K. and E. Zolt, 2005, Inequality and the evolution of institutions of taxation:
Evidence from the economic history of the Americas, Paper presented at NBER
Political Economy workshop
Stark, D. and L. Bruszt, 1998, Postsocialist pathways: Transforming politics and
property in East Central Europe (New York: Cambridge University Press)
Tanzi, V. and H. Davoodi, 1997, Corruption, public investment and growth, IMF
Working Paper #97/139, Washington DC
Taylor, C. and M. Hudson, 1972, World handbook of political and social indicators (New
Haven: Yale University Press)
Varshney, A., 2001, Ethnic conflict and civil society: India and beyond, World Politics
53(April): 362-98.
Woolcock, M., 1998, Social capital and economic development: Toward a theoretical
synthesis and policy framework, Theory and Society 27(2): 151-208.
Woolcock, M., 2001, The place of social capital in understanding social and economic
outcomes, Canadian Journal of Policy Research 2(1): 11-17.
Woolcock, M., L. Pritchett and J. Isham, 2001, The social foundations of poor economic
growth in resource-rich countries, in R. Auty (ed.) Natural resources and
economic growth (New York: Oxford University Press) 76-92.
World Bank, 1999, World development report 1999/2000 (New York: Oxford University
Press)
World Bank, 2000a, World development indicators (Washington, DC: The World Bank)
World Bank, 2000b, World development report 2000/01 (New York: Oxford University
Press)
World Bank, 2001, World development report 2001/02 (New York: Oxford University
Press)
World Bank, 2003, World development indicators (Washington, DC: The World Bank)

1
Table 1a: Summary Statistics and Sources of Social Cohesion Variables
Variable Mean Std. Dev. Obs Min Max Ethnic Fractionalization 39.63 29.29 82 0 93 Middle Class Share 45.95 6.85 82 30 56 Gini 41.48 9.12 82 26 62 Trust 32.07 16.28 34 5 64 GDP per capita, PPP 6112.90 5556.69 82 476 20004GDP per capita growth 2.07 1.67 82 -1 7 Ethnic fractionalization Middle class share Gini Trust GDP per capita, PPP GDP per capita growth
Ethnolinguistic fractionalization index (measures the probability that two randomly selected persons from a given country will not belong to the same ethnolinguistic group). Source: Mauro (1995), initially from the Atlas Narodov Mira (Department of Geodesy and Cartography of the State Geological committee of the USSR, Moscow, 1964) and Taylor and Hudson (1972). Share of quintiles 2-4, average 1960-1996 Average of the period 1900-1996 Percentage of respondents in each nation replying “most people can be trusted”. Source: World Values Survey World Bank (2000a) World Bank (2000a).
2
Table 1b: Summary Statistics and Sources of Institutional Variables
Variable Mean Std. Dev. Obs Min Max Voice and Accountability 0.352 0.92 82 -1.6 1.7Quality of the Bureaucracy 3.678 1.46 72 1.4 6.0Civil Liberties 3.397 1.62 81 1.0 6.1Property Rights & Rule-Based Governance 3.232 0.82 56 1.0 5.0Government Effectiveness 0.284 0.94 78 -1.7 2.1Freedom from Graft 0.278 1.00 78 -1.6 2.1Law and Order Tradition 3.743 1.40 72 1.4 6.0Freedom from Political Instability and Violence 0.116 0.94 78 -2.4 1.7Political Rights 3.305 1.83 81 1.0 6.4Freedom from Regulatory Burden 0.386 0.60 82 -1.5 1.2Rule of Law 0.263 0.97 82 -1.3 2.0 Voice and Accountability
Quality of the Bureaucracy
Civil Liberties
Property Rights and Rule-Based
Governance
Government Effectiveness Freedom from Graft
Law and Order Tradition Freedom from Political Instability
and Violence
Political Rights Freedom from Regulatory Burden
Rule of Law
Kaufmann, Kraay and Zoido-Lobaton (1999a)
International Country Risk Guide (ICRG), average 1984-98
Freedom House, average 1972-98
Country Policy and Institution Assessment (CPIA), the
World Bank 1998.
Kaufmann, Kraay and Zoido-Lobaton (1999a)
Kaufmann, Kraay and Zoido-Lobaton (1999a)
International Country Risk Guide (ICRG), average 1984-98
Kaufmann, Kraay and Zoido-Lobaton (1999a)
Freedom House, average 1972-1998.
Kaufmann, Kraay and Zoido-Lobaton (1999a)
Kaufmann, Kraay and Zoido-Lobaton (1999a)


4

5
Figure 1: Smoothed Median Growth, 1960-2002
Smoothed Median Growth, 1960-2002
0
1
2
3
4
5
1960
1963
1966
1969
1972
1975
1978
1981
1984
1987
1990
1993
1996
1999
2002
Low Income (N=124)High Income (N=30)
Source: Calculated from World Bank (2003)
(Sample of 82 developing and developed countries)
F igu re 2 : In d e x o f p e r c a p ita in c o m e in le a s t c o h e siv ea n d m o s t c o h es iv e so c ie tie s (1 9 6 0 = 1 )
1
1 .2
1 .4
1 .6
1 .8
2
2 .2
2 .4
2 .6
2 .8
3
m o s t c o h e siv ele a st co h e siv e
7
Figure 3: Rule of law and per capita growth 1960-98 (moving median of 30 observations ordered by rule of law)
0
0.5
1
1.5
2
2.5
3
3.5
-1 -0.5 0 0.5 1 1.5 2
Rule of law
8
Figure 4: Share of the middle class and rule of law
(moving median of 20 observations ordered by middle class share
-1
-0.5
0
0.5
1
1.5
35 40 45 50 55 60
Share of the middle 3 quintiles in income
9
Figure 5: Ethnolinguistic fractionalization and rule of law
(moving median of 20 observations ordered by ethnic fractionalization
-1-0.8-0.6-0.4-0.2
00.20.40.60.8
1
0 20 40 60 80 100
Ethnolinguistic fractionalization
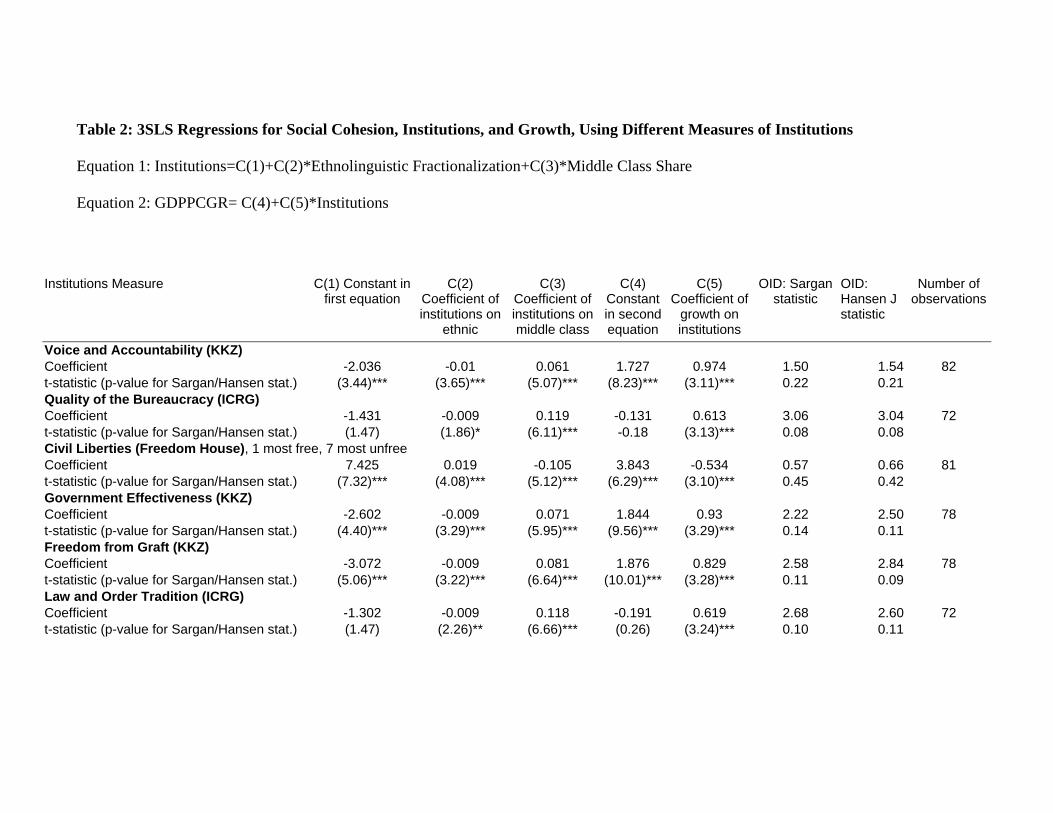
Table 2: 3SLS Regressions for Social Cohesion, Institutions, and Growth, Using Different Measures of Institutions Equation 1: Institutions=C(1)+C(2)*Ethnolinguistic Fractionalization+C(3)*Middle Class Share Equation 2: GDPPCGR= C(4)+C(5)*Institutions
Institutions Measure C(1) Constant in
first equation C(2)
Coefficient of institutions on
ethnic
C(3) Coefficient of institutions on middle class
C(4) Constant in second equation
C(5) Coefficient of
growth on institutions
OID: Sargan statistic
OID: Hansen J statistic
Number of observations
Voice and Accountability (KKZ) Coefficient -2.036 -0.01 0.061 1.727 0.974 1.50 1.54 82 t-statistic (p-value for Sargan/Hansen stat.) (3.44)*** (3.65)*** (5.07)*** (8.23)*** (3.11)*** 0.22 0.21 Quality of the Bureaucracy (ICRG) Coefficient -1.431 -0.009 0.119 -0.131 0.613 3.06 3.04 72 t-statistic (p-value for Sargan/Hansen stat.) (1.47) (1.86)* (6.11)*** -0.18 (3.13)*** 0.08 0.08 Civil Liberties (Freedom House), 1 most free, 7 most unfree Coefficient 7.425 0.019 -0.105 3.843 -0.534 0.57 0.66 81 t-statistic (p-value for Sargan/Hansen stat.) (7.32)*** (4.08)*** (5.12)*** (6.29)*** (3.10)*** 0.45 0.42 Government Effectiveness (KKZ) Coefficient -2.602 -0.009 0.071 1.844 0.93 2.22 2.50 78 t-statistic (p-value for Sargan/Hansen stat.) (4.40)*** (3.29)*** (5.95)*** (9.56)*** (3.29)*** 0.14 0.11 Freedom from Graft (KKZ) Coefficient -3.072 -0.009 0.081 1.876 0.829 2.58 2.84 78 t-statistic (p-value for Sargan/Hansen stat.) (5.06)*** (3.22)*** (6.64)*** (10.01)*** (3.28)*** 0.11 0.09 Law and Order Tradition (ICRG) Coefficient -1.302 -0.009 0.118 -0.191 0.619 2.68 2.60 72 t-statistic (p-value for Sargan/Hansen stat.) (1.47) (2.26)** (6.66)*** (0.26) (3.24)*** 0.10 0.11

11
Table 2, continued Institutions Measure C(1) Constant in
first equation C(2)
Coefficient of institutions on
ethnic
C(3) Coefficient of institutions on middle class
C(4) Constant in second equation
C(5) Coefficient of
growth on institutions
OID: Sargan statistic
OID: Hansen J
statistic
Number of observations
Institutions Measure C(1) Constant in first equation
C(2) Coefficient of institutions on
ethnic
C(3) Coefficient of institutions on middle class
C(4) Constant in second equation
C(5) Coefficient of
growth on institutions
OID: Sargan statistic
OID: Hansen J statistic
Number of observations
Freedom from Political Instability and Violence (KKZ)
Coefficient -2.462 -0.009 0.064 1.991 1.001 1.90 1.93 78 t-statistic (p-value for Sargan/Hansen stat.) (4.05)*** (3.27)*** (5.24)*** (11.05)*** (3.31)*** 0.17 0.16 Political Rights (Freedom House), 1 most free, 7 most unfree Coefficient 7.395 0.022 -0.109 3.67 -0.497 0.39 0.45 81 t-statistic (p-value for Sargan/Hansen stat.) (6.25)*** (4.01)*** (4.56)*** (6.76)*** (3.19)*** 0.53 0.50 Freedom from Regulatory Burden (KKZ) Coefficient -0.278 -0.007 0.02 1.216 2.212 0.13 0.14 82 t-statistic (p-value for Sargan/Hansen stat.) (0.67) (3.32)*** (2.39)** (3.89)*** (3.33)*** 0.72 0.70 Rule of Law (KKZ) Coefficient -2.989 -0.008 0.077 1.848 0.843 3.11 3.28 82 t-statistic (p-value for Sargan/Hansen stat.) (4.87)*** (2.67)*** (6.27)*** (10.95)*** (3.40)*** 0.08 0.07 Trust Coefficient -54.111 -0.067 1.805 1.25 0.033 8.45 7.32 34 t-statistic (p-value for Sargan/Hansen stat.) (4.32)*** (1.17) (7.36)*** (2.16)** (2.00)** 0.00 0.01