Embed Size (px)
Citation preview

Financial Managementfor Managers2nd Edition
Forecasting i
Inventory
Production Records
MealEquivalents
Labor Costs
Menu Item Costs
ProductScreening
Financial Managementfor Managers2nd Edition
Participant’s Workbook


Financial Management for Managers
Participant’s Workbook
PROJECT COORDINATOR Theresa Stretch, MS, RDN, CP-FS
EXECUTIVE DIRECTOR Aleshia Hall-Campbell, PhD, MPH
Institute of Child Nutrition The University of Mississippi, School of Applied Sciences
www.theicn.org
Key Area: Administration USDA Professional Standards: 3300
2017


Participant’s Workbook Financial Management for Managers
Institute of Child Nutrition i
Institute of Child Nutrition :: The University of Mississippi :: School of Applied Sciences
:: Building the Future Through Child Nutrition :: The Institute of Child Nutrition was authorized by Congress in 1989 and established in 1990 at The University of Mississippi in Oxford and is operated in collaboration with The University of Southern Mississippi in Hattiesburg. The Institute operates under a grant agreement with the United States Department of Agriculture, Food and Nutrition Service. ________
PURPOSE
The purpose of the Institute of Child Nutrition is to improve the operation of Child Nutrition Programs through research, education and training, and information dissemination. _______
MISSION The mission of the Institute of Child Nutrition is to provide information and services that promote the continuous improvement of Child Nutrition Programs. ______
VISION The vision of the Institute of Child Nutrition is to be the leader in providing education, research, and resources to promote excellence in Child Nutrition Programs. This project has been funded at least in part with Federal funds from the U.S. Department of Agriculture, Food and Nutrition Service through an agreement with Institute of Child Nutrition at The University of Mississippi. The contents of this publication do not necessarily reflect the views or policies of the U.S. Department of Agriculture, nor does mention of trade names, commercial products, or organizations imply endorsement by the U.S. government. The University of Mississippi is an EEO/AA/Title VI/Title IX/Section 504/ADA/ADEA Employer. In accordance with Federal law and U.S. Department of Agriculture policy, this institution is prohibited from discriminating on the basis of race, color, national origin, sex, age, or disability. To file a complaint of discrimination, write USDA, Director, Office of Civil Rights; Room 326-W, Whitten Building, 1400 Independence Avenue, SW, Washington, DC 20250-9410 or call (202) 720-5964 (voice and TDD). USDA is an equal opportunity provider and employer. © 2017, Institute of Child Nutrition, The University of Mississippi, School of Applied Sciences Except as provided below, you may freely use the text and information contained in this document for non-profit or educational use with no cost to the participant for the training providing the following credit is included. These materials may not be incorporated into other websites or textbooks and may not be sold. Suggested Reference Citation: Institute of Child Nutrition. (2017). Financial management for managers participant’s workbook. University, MS:
Author. The photographs and images in this document may be owned by third parties and used by The University of Mississippi under a licensing agreement. The University cannot, therefore, grant permission to use these images. For more information, please contact [email protected]. October 2017

Financial Management for Managers Participant’s Workbook
Intro—ii Institute of Child Nutrition

Participant’s Workbook Financial Management for Managers
Institute of Child Nutrition iii
Table of Contents
Introduction Intro—1
Lesson 1: Financial Management Lesson 1—1
Lesson 2: Production Records Lesson 2—1
Lesson 3: Forecasting Lesson 3—1
Lesson 4: Menu Item Costs Lesson 4—1
Lesson 5: Product Screening Lesson 5—1
Lesson 6: Inventory Control Lesson 6—1
Lesson 7: Meal Equivalents Lesson 7—1
Lesson 8: Labor Costs Lesson 8—1
References Reference—1
Appendix Appendix—1

Financial Management for Managers Participant’s Workbook
Intro—iv Institute of Child Nutrition

Participant’s Workbook Financial Management for Managers
Institute of Child Nutrition Intro—1
Introduction
Financial Management: A Course for School Nutrition Managers
This course is designed for site-based managers. Controlling costs during food production is a
critical part of financial management. Efficient scheduling of personnel and equipment, in
addition to forecasting the right amount of food to produce at a designated time, will result in
greater financial control.
Training
The purpose of this training is to identify resources for an effective financial management
system in the School Nutrition Program (SNP). The intended audiences for this training are
school nutrition site-based managers and supervisors. While we cannot teach new managers
and supervisors everything they need to know about financial management, we can introduce
the importance of sound financial management practices.
To help guide you through this training, the Institute of Child Nutrition has provided each of you
with a Participant’s Workbook. The workbook contains important information and activities
developed specifically for this training. On the upper right corner of the slides, you will see a
reference to the corresponding lesson in the Participant’s Workbook.

Financial Management for Managers Participant’s Workbook
Intro—2 Institute of Child Nutrition
Training Overview
This training will discuss the following topics:
Financial Management
Production Records
Forecasting
Menu Item Costs
Product Screening
Inventory Control
Meal Equivalents
Labor Costs
Each topic will include a number of sub-topics, many of which will include a number of activities
to reinforce the concept.
This training will cover a variety of topics, and questions are highly encouraged. Because all of
your questions are important, please write them on a self-adhesive note and post it to the Bike
Rack. Sometimes questions may require research or a longer answer than time allows at that
point.
Comfort Level
During this training, we encourage you to determine your level of participation based on your
individual needs.
Pre-Assessment
A pre-assessment is a training tool that provides the participants’ baseline knowledge of the
training topic.
(Activity): Pre-Assessment
Place a unique identifier on the top right corner of the pre-assessment. The same identifier will
be used at the conclusion of the training on the post-assessment. It is not necessary for you to
write your name on the pre-/post-assessments.

Participant’s Workbook Financial Management for Managers
Institute of Child Nutrition Intro—3
Icebreaker
We are going to do a quick icebreaker activity. On an index card, write your name and where
you work. On the other side of the card, write what you believe is the greatest training need
when understanding financial management principles. We will collect the cards and randomly
distribute them.
(Activity): Icebreaker
Locate the individual whose name appears on the card. Introduce yourself, and briefly discuss
what you would like to learn from this training. At the end of the activity, you will introduce
each other to the rest of the group and state what each of you would like to learn from this
training.
USDA Professional Standards and Learning Objectives
A key provision of the Healthy, Hunger-Free Kids Act of 2010 (HHFKA) includes professional
standards for school nutrition professionals. The rule requires a minimum amount of annual
training hours for all state directors of school nutrition programs, state directors of distributing
agencies, school nutrition program directors, managers, and staff. Required training topic areas
will vary according to position and job requirements. There are also minimum hiring standards
for new state directors of school nutrition programs, state directors of distributing agencies
that oversee USDA Foods, and school nutrition program directors. The USDA Professional
Standards and Learning Objectives serve as a foundation for this training
(Workbook Handout): USDA Professional Standards and Learning Objectives
Take a few minutes to review the following USDA Professional Standards and Learning
Objectives handout for this training.

Financial Management for Managers Participant’s Workbook
Intro—4 Institute of Child Nutrition

Participant’s Workbook Financial Management for Managers
Institute of Child Nutrition Intro—5
USDA Professional Standards and Learning Objectives
USDA Professional Standards
Key Area
Administration – 3300
USDA Professional Standard – Financial Management
3300 – Financial Management
Learning Objectives
Using the information provided in this training, participants will:
Identify key elements of financial management.
Identify the required elements of a production record.
Recognize key information when forecasting usage of menu items.
Calculate the cost of a menu item.
Create a sample product screening evaluation tool.
Identify inventory controls that contribute to a financially sound school nutrition
program.
Calculate the meal equivalents for different scenarios.
Calculate labor costs.

Financial Management for Managers Participant’s Workbook
Intro—6 Institute of Child Nutrition

Participant’s Workbook Financial Management for Managers
Institute of Child Nutrition Intro—7
Terms and Definitions
Terms and definitions are included in the discussion of this training. Some of the terms and
definitions listed may not be included in the training but may serve as a reference at another
time.
(Workbook Handout): Terms and Definitions
Review the following Terms and Definitions handout.

Financial Management for Managers Participant’s Workbook
Intro—8 Institute of Child Nutrition

Participant’s Workbook Financial Management for Managers
Institute of Child Nutrition Intro—9
Terms and Definitions
Batch Cooking
Batch cooking, or just-in-time preparation, is cooking frequently and in small quantities to
maintain high quality throughout the serving period.
Budget
A budget is a business entity’s financial management plan for a specified future period of time,
generally a fiscal year. The budget systematically considers the entity’s planned activities and
objectives for that period, forecasts the costs the entity must incur in carrying out those
activities, and identifies the revenues projected to cover those costs. Formulating and
executing a budget enables a School Nutrition Program (SNP) to achieve its objectives of
providing quality meals while living within its means.
First-In, First-Out (FIFO)
First-in, first-out (FIFO) is the process of rotating the older product to the front and the newer
items to the back of the shelf. The age of the item is based on the manufacturer’s pack date
and not the date on the receipt.
Food Cost
Food cost is the cost of food used in school nutrition service to prepare meals and other food
items such as a la carte. One calculates the monthly cost of food used by subtracting the food
inventory on hand at the end of the month from the sum of the beginning food inventory and
food purchases during the month.

Financial Management for Managers Participant’s Workbook
Intro—10 Institute of Child Nutrition
Terms and Definitions, continued
Forecasting
Forecasting is the process of analyzing current and historical data to determine future trends.
In the case of school nutrition programs (SNPs), forecasting involves predicting and estimating
the goods, works, and services needed in specified areas for the coming year, and/or assessing
needs by reviewing current procurement activities. Forecasting allows procurement plans to
evolve each fiscal year.
FTE
Full-Time Equivalent (FTE) is a measure used to translate the number of hours worked into full-
time equivalents hours. Generally, an FTE of 1.0 is equivalent to one full-time employee.
Indirect Expenses
Indirect expenses are overhead costs that cannot be directly related to a business entity’s
principal activities without exerting effort disproportional to the results achieved. In a school
district, indirect costs may include the costs of the Superintendent’s office, human resources,
payroll, accounting, budgeting, purchasing, utilities (light, heat, etc.), building maintenance and
repair, auditing, etc. Such costs benefit all activities of the school district, and the portion that
benefits any specific activity, such as food service, is generally determined through a
mathematical allocation process.
Institute of Child Nutrition (ICN)
Formerly the National Food Service Management Institute, the Institute of Child Nutrition (ICN)
is located at The University of Mississippi, Oxford campus. The mission of ICN is to provide
information and services that promote the continuous improvement of child nutrition
programs.

Participant’s Workbook Financial Management for Managers
Institute of Child Nutrition Intro—11
Terms and Definitions, continued
Meal Equivalents (ME)
A meal equivalent is a statistical tool used in the school nutrition program to understand food
production costs and productivity based on a per unit expense. It is calculated by converting
differing types of meals (breakfasts, lunches, and snacks) and nonprogram revenue to a
standard reimbursable student lunch. Please note the Food and Nutrition Service (FNS);
Department of Agriculture (USDA) does not prescribe one particular method in order to
calculate meal equivalency. Meal equivalencies are often used in contracted school nutrition
operations to determine the number of meals for which the school nutrition management
company (FSMC) will be paid. Also, a la carte and other sales are typically converted into
lunch/meal equivalents by assigning a dollar value to a reimbursable lunch (lunch/meal
equivalent rate) and dividing the sales revenue by this dollar value factor (lunch/meal
equivalent rate). However, the most accurate method for developing a lunch/meal equivalent
rate is based on the full cost of producing a reimbursable lunch. The lunch/meal equivalent rate
must be set no lower than the free lunch reimbursement rate plus the value of USDA foods.
Meals Per Labor Hour (MPLH)
Meals per labor hour is the most common measure of productivity in school nutrition,
calculated by dividing the number of meal equivalents produced and served in a day by the
number of labor hours.
Meal Reimbursement
Meal reimbursement is a federal cash payment received from the State agency for meals that
meet federal standards and are served to school children.
Par Stock
Par stock is a predetermined inventory quantity for a particular item and serves as an indicator
of when to reorder the product.

Financial Management for Managers Participant’s Workbook
Intro—12 Institute of Child Nutrition
Terms and Definitions, continued
School Nutrition Programs (SNPs)
School nutrition programs (SNPs) are federally funded programs and include School Breakfast
Program (SBP), National School Lunch Program (NSLP), After School Snack Program (ASSP),
Fresh Fruit and Vegetable Program (FFVP), Special Milk Program, Seamless Summer Option
(SSO), and Summer Food Service Program (SFSP).
Specification
A specification is a concise statement of a set of requirements to be satisfied by a product,
material, or process.
Standardized Recipe
A standardized recipe is a recipe that has been tried, adapted, and retried several times for use
by a given school nutrition operation. The tested recipe produces the same good results and
yield every time when using the exact procedures the same type of equipment and the same
quantity and quality of ingredients.
Stock Keeping Unit (SKU)/Product code
A stock keeping unit (SKU) or product code is a unique identifier for each unit of product. The
SKU is usually the product code.
United States Department of Agriculture (USDA)
The USDA is the federal department responsible for administration of the nation’s child
nutrition and USDA Foods distribution programs. The Food Distribution Division of USDA’s
Food and Nutrition Service (FNS) is responsible for coordinating the distribution of USDA Foods
to State agencies that oversee the SNP in their states.

Participant’s Workbook Financial Management for Managers
Institute of Child Nutrition Intro—13
Terms and Definitions, continued
USDA Foods
USDA Foods are available to any school that participates in a USDA school nutrition program.
USDA Foods account for 15% to 20% of the foods in SNPs and are 100% American grown.
Yield Factors (AP and EP)
Yield factors can vary depending on factors such as product quality, preparation techniques,
and cooking times and temperatures. When verifying a recipe, the AP (as purchased) quantity
needed to yield the necessary EP (edible portion) quantity of an ingredient must be
determined. The Food Buying Guide for Child Nutrition Programs contains ingredient yield
information.
Importance of Financial Management
School nutrition programs (SNPs) are federally assisted meal programs operating in public and
nonprofit private schools. The Food and Nutrition Service (FNS), United States Department of
Agriculture (USDA) administers the school meals programs at the Federal level. At the state
level, programs are usually administered by state agencies, which operate the program through
agreements with school food authorities (SFA). The SNP regulations are constantly changing.
Increasing program costs and growing operating demands are a reality in today’s world.
Greater control and more informed decisions are possible when all costs of the program are
understood.
What financial management tools or processes contribute to a financially sound school
nutrition program?

Financial Management for Managers Participant’s Workbook
Intro—14 Institute of Child Nutrition

Participant’s Workbook Financial Management for Managers
Institute of Child Nutrition Lesson 1—1
Lesson 1: Financial Management
Objective: Identify key elements of financial management.
Budget Manager’s Role
The school nutrition budget includes input from the school nutrition management staff.
The school nutrition management staff is involved in the budget preparation and review
process.
A copy of the budget is on file at the school site.
School level income and expenditure projections are evaluated regularly, and the
budget is amended as needed to accommodate increases or decreases in participation,
costs, etc.
Financial Management Practices
Financial management practices are reviewed on a continuing basis:
Meals per labor hour or other established indicators of productivity are analyzed
regularly.
Meal and a la carte prices are determined based on program relations including paid
lunch equity and established criteria that recover costs and promote affordable, healthy
choices.
Financial records are submitted regularly to district administration and are cross-
referenced against program records.
A profit and loss statement categorizes income and expense data by district and school
sites, and is used to compare expenditures to revenues.
The average percent of participation is analyzed regularly (not less frequently than
monthly) and are based on program relations including paid lunch equity.

Financial Management for Managers Participant’s Workbook
Lesson 1—2 Institute of Child Nutrition
Expenditures
The cost of producing a meal is a critical piece of information for the school nutrition manager.
In school nutrition operations, the production of meals is the unit of measurement used to
gauge effectiveness and efficiency. Some other allowable school nutrition expenses include:
food costs (e.g., purchased foods and value of USDA Foods);
labor costs (e.g., salaries, wages, and employee benefits);
supply costs (e.g., general operating costs, food production supplies, expendable
equipment);
purchased services (e.g., data processing);
transportation (e.g., fuel and oil) and;
indirect costs (e.g., repairs, professional development, maintenance, electricity, fuel,
water overhead, and other appropriate costs as defined by state guidelines).
Internal Controls
Internal controls increase financial accountability and provide benchmarks to objectively
measure progress toward achieving program goals:
Written policies and procedures for handling cash and credit are well defined and
properly implemented.
Authorized individuals should handle cash, monitor accounting, and oversee control
procedures.
Cash handling procedures are limited to authorized personnel and are monitored by
independent review.
Employees are trained to report discrepancies or suspicious activity. (e.g., forecasting,
monitoring meals, food and labor costs, labor hours).

Participant’s Workbook Financial Management for Managers
Institute of Child Nutrition Lesson 1—3
Financial Management Skills
In order to make financial management decisions, SNP directors must have competencies,
knowledge, and skills of basic financial management principles. In the next activity, you are
going to have the opportunity to assess your financial management skills.
(Workbook Activity): Self-Assessment
Take a few moments and complete the Self-Assessment. Share the financial management skills
that you will incorporate into your operations.

Financial Management for Managers Participant’s Workbook
Lesson 1—4 Institute of Child Nutrition

Participant’s Workbook Financial Management for Managers
Institute of Child Nutrition Lesson 1—5
Self-Assessment
Directions: Evaluate your current skill level for each item listed. You will notice there is a place to indicate whether your skills are good, okay, or could be better for each item.
Skills Good Okay Could be
Better Knows importance of operating a cost-effective program.
Knows relationship of program cost and program revenue.
Knows methods and purposes of calculating program costs, such as food, supplies, labor, operating, and special events.
Knows standard security practices and importance of protecting the financial integrity of the program.
Knows financial goals and objectives of the school district’s Board of Education.
Knows the purpose and components of the school’s budget and the importance of operating within district guidelines.
Knows the elements of budget management justification according to district guidelines.
Implements methods for increasing productivity and decreasing waste.
Implements a system of checks and balances to ensure accuracy and to prevent fraud.
Implements security measures at all times when handling cash or meal benefit identifiers.

Financial Management for Managers Participant’s Workbook
Lesson 1—6 Institute of Child Nutrition
Self-Assessment, continued
Skills Good Okay Could Be Better
Ensures that all accounting procedures are documented and comply with federal, state, and local regulations and policies.
Ensures that all personnel responsible for meal count and cash collection operations are properly trained and authorized.
Adjusts expenditures in relation to income.
Identifies factors that influence variable costs and practices effective measures for cost containment.
Identifies and calculates the production and operation portion of the meal cost.
Provides accurate information for establishing a pricing structure in all meal categories and a la carte items that follow federal, state, and local guidelines.
Pre-costs menus and a la carte items.
Uses a team approach to encourage staff members to incorporate sound financial management practices as a part of their responsibility.
Participates in the budget process by providing information for forecasting participation, labor and equipment needs, and other costs such as repair jobs.
Maintains effective labor cost controls through training and employee development according to district standards.
Implements effective cost controls using established financial standards for all phases of the SNP.

Participant’s Workbook Financial Management for Managers
Institute of Child Nutrition Lesson 1—7
Menus
The menu is the driving force that begins the procurement process. The menu must meet all
federal guidelines and be appealing to the customer. A well-planned menu includes:
all meal pattern components and subgroups;
whole grain-rich foods;
fruits and vegetables;
a variety of shapes, textures, colors, and temperatures; and
a blend of flavors.
Other factors to consider in menu planning include equipment, food cost, cultural food
preferences, labor costs, skill levels, environmental friendliness, and the availability of USDA
Foods.
How far in advance do you plan your menus?
What are the benefits of planning menus well in advance?
Stock Keeping Units (SKUs)/ Product Codes
Good menu planning also includes optimizing stock keeping units (SKUs). A SKU is a unique
identifier for each unit of product and is often the product code. Identifying multiple uses for
an inventory item is cost efficient for both the district and the vendor. Think of all the menu
items you can create with diced chicken, brown rice, or chopped fresh onions.
In many cases, school districts burden themselves with too many different products or SKUs.
For instance, each flavor of juice has a separate SKU with its own product code number.

Financial Management for Managers Participant’s Workbook
Lesson 1—8 Institute of Child Nutrition
What are some benefits of reducing SKUs or the number of products that are in your
inventory?
Reducing SKUs
Reducing the number of SKUs is a best practice. A few ways to reduce SKUs include
using the same product for more than one menu item, such as one type of chicken patty
for chicken on a bun, chicken parmesan, and grilled chicken salad; and
accepting only substitutions that have been approved by the school nutrition director or
central office person responsible for purchasing.
Recipes
Standardized recipes are required in school nutrition programs and identify the specific
quantity for each ingredient, the number of servings, and the portion size for the recipe. A
standardized recipe is a recipe that has been tried, adapted, and retried several times for use by
a given school nutrition operation. The tested recipe produces the same good results and yield
every time when using the exact procedures, the same type of equipment, and the same
quantity and quality of ingredients.
In the next activity, we identify the benefits of utilizing standardized recipes.
(Workbook Activity): Standardized Recipes List the benefits of utilizing Standardized Recipes

Participant’s Workbook Financial Management for Managers
Institute of Child Nutrition Lesson 1—9
USDA Foods
In addition to the purchased food, schools obtain additional food through the USDA Foods
Program. The USDA Foods Program helps schools stretch tight budgets and helps connect the
people who grow good food with those who need it. The USDA Foods Program provides about
15–20% of all food served by schools. It is important to include the value of the USDA Foods
when determining the cost of foods used.
USDA Foods keep pace with current nutrition standards in the meal pattern and coincide with
the principles established in the Dietary Guidelines for Americans. USDA offers frozen, fresh,
and refrigerated products, more package sizes, and more varieties of healthy new options. It is
critically important to determine during the planning stage how and when USDA Foods will be
incorporated into the menu.

Financial Management for Managers Participant’s Workbook
Lesson 1—10 Institute of Child Nutrition

Participant’s Workbook Financial Management for Managers
Institute of Child Nutrition Lesson 2—1
Lesson 2: Production Records
Objective: Identify the required elements of a production record.
SHOW SLIDE: Menu
Food Production Records
Food production and menu records are a requirement of SNPs, and must be maintained to
demonstrate the required food components and food or menu items offered on a given day.
Production records are necessary to support the claim for reimbursable meals. In addition,
these records
must demonstrate that reimbursable school meals comply with program requirements;
must be available for state or federal review; and
must be available for three years plus the current year or in accordance to state and
local policies.
must include enough information to evaluate how menu items contributed to meeting
nutrition standards and whether the menu offered appropriate levels of nutrients and
calories.
Production Record Value
Production estimates must be completed in advance so scheduling of personnel and purchasing
can be more accurate. Production records are typically used to complete forecasting. The well-
developed food production record is a valuable kitchen tool for forecasting future food
preparations when the same or a similar menu is planned. Production records assist in
adjusting menu choices,
removing unpopular menu items, or
increasing or decreasing the quantity of a menu item to be produced.

Financial Management for Managers Participant’s Workbook
Lesson 2—2 Institute of Child Nutrition
Production Record Required Elements
Production records include
date, menu type, meal service
menu items
recipes and/or products code numbers
grade group for students served
If meal service is Offer Versus Serve (OVS)
planned number of servings
portion or serving sizes for each grade group and adults
planned quantity of food to be prepared
vegetable subgroups
total amount of food prepared
amount of food used
condiments
actual number of meals served
substitutions and leftovers
total reimbursable meals served
(Workbook Handout): Required Elements of a Food Production Record Review the Required Elements of a Food Production Record handout
(Workbook Activity): Lunch Production Record Worksheet Determine if all the elements of the production record are included on the production record.
If not, identify the missing information.

Participant’s Workbook Financial Management for Managers
Institute of Child Nutrition Lesson 2—3
Required Elements of a Food Production Record
Accurate, complete production records are required in the school nutrition program. The elements identified in the chart are e included for each reimbursable meal. Additional elements such as vegetable subgroup and food temperatures may be included on the production record.
Elements Description
Date, menu type, meal service A production record includes the site and meal date,
the menu type, and the meal service such as breakfast
Menu items All planned items, including all choices, types of milk,
dessert, and substitutions: all condiments served as
part of the reimbursable meal, including gravy, butter,
margarine, mayonnaise, relish, ketchup, mustard, and
salad dressing
Recipes and/or products code numbers Specific recipes and food products; name of food and
form; recipe number if USDA; if processed, brand
name and code number
Grade group for students served
Identifies the grade group being served. Adjusted
portion sizes for age or grade groups specified must be
shown for menu item, recipes, and products
Offer Versus Serve (OVS) Identify if the meal service is Offer Versus Serve (OVS)
Planned number of servings
Forecasted or predicted approximate number of
servings needed for each menu item; projected
number of portions and serving sizes for each menu
item for a la carte sales; projected number of student
servings for each menu item; projected number of
total servings
Portions or serving sizes for each grade group or
adults.
Portion size served must be the same as planned: if
portion size is adjusted for age, a separate line should
be used
Vegetable sub groups Vegetable identified by vegetable subgroup and
quantity for meal pattern contribution
Total amount of food prepared Total amount of food prepared (e.g., the number of
servings, and cans)
Amount of food used Verifies the planned menu was actually prepared and
served
Condiments Identify condiments and the serving size
Actual number of meal served Actual number of reimbursable meals served (indicate
this information for each age/grade group); actual
number of nonreimbursable meals served (i.e., to
adults or as á la carte sales)
Substitutions and Leftovers A record of leftovers and how the leftovers will be
used; substitutions are noted
Total Reimbursable meals served Identify the total number of reimbursable meals
served.

Financial Management for Managers Participant’s Workbook
Lesson 2—4 Institute of Child Nutrition

Participant’s Workbook Financial Management for Managers
Institute of Child Nutrition Lesson 2—5
Lunch Production Record Worksheet
Directions: Review the menu. Determine if all the elements of the production record are included on the production record. If not, identify the missing information.
Menu: Chicken & Cheese Fajita with Roasted Peppers and Onions, (1 oz eq chicken + ½ oz eq cheese ¼ cup veg) Pinto beans, (¼ cup) Whole Wheat Roll, (1 oz eq) Chilled Pineapple, (½ cup) Variety of Milk (1 cup)
School/Site Name: Eagles Nest Elementary Date: Monday, October 7, 20xx Grade Group: Offer vs. Serve: Yes No Planned # Students to be served: 120 Actual # Students Served: 118 Planned # Adults to be served: 15 Actual # Adults Served:
Component/Item Recipe or
Product #
Planned #
Servings
Planned
Portion
Size
Total
Planned
Quantity
Actual #
Servings
Actual
Quantity
Used
Leftovers
Milk
1% plain 70 8 oz. 70 70 70 0
Fat-free, chocolate 65 8 oz. 65 62 62 3
Meat/Meat Alternate
Chicken & Cheese
Fajita w/ Roasted
Peppers and Onions
(1 oz eq chicken +
½ oz eq cheese)
E-6
135
2 oz.
270 oz.
130
130 5
Grain
Whole Wheat
Tortilla
135 1 135 135 130 5
Vegetable Subgroups
Dark Green
Spinach/Romaine S-1 135 1 C 135 C 67.5 C 65 C 2 ½ C
Red/Orange
Tomato Salsa C-1 135 ¼ C 33 ¾ C 130 32 ½ C 1 ¼ C
Legumes
Black Beans L-5 135 ¼ C 33 ¾ C 130 32 ½ C 1 ¼ C
Starchy
Other
Fruit
Peach Cup 135 ½ C 67 ½ C 135 65 2 ½ C
Diced Pears 135 ½ C 67 ½ C 135 65 2 ½ C
Condiment/Other
Ranch Dressing D-1 135 1 Tbsp 135 135 135 0

Financial Management for Managers Participant’s Workbook
Lesson 2—6 Institute of Child Nutrition

Participant’s Workbook Financial Management for Managers
Institute of Child Nutrition Lesson 3—1
Lesson 3: Forecasting
Objective: Recognize key information when forecasting the usage of menu items.
Forecasting
Forecasting is the process of determining future needs by evaluating past performance, present
conditions, and future indicators. Regardless of the average daily participation (ADP) of the
district, accurate forecasting provides critical and valuable information. This information
benefits both the school district and potential distributors who are considering bidding on the
items in the solicitation. For the purpose of this training we will focus on forecasting as it
relates to meal preparation.
What does forecasting include?
Write your responses here.
Have you ever noticed a situation where the production record identified a particular
quantity to be prepared and the staff produced just a “little extra”? What are some possible
implications of this action?

Financial Management for Managers Participant’s Workbook
Lesson 3—2 Institute of Child Nutrition
Financial Control in Food Preparation y
Some ways to enhance financial control during food preparation include
utilize batch cooking,
improve food preparation techniques and processes, and
focus on portion control, and
reduce waste.
(Workbook Activity): Forecasting Worksheet Review different forecasting scenarios. Complete the calculations.
Scenario: Number of Servings to Prepare
Scenario: Extra Servings
Scenario: Batch Cooking
Scenario: Portion Control—Tilapia Garnished with Citrus Sauce

Participant’s Workbook Financial Management for Managers
Institute of Child Nutrition Lesson 3—3
Forecasting Worksheet
Scenario: Number of Servings to Prepare
Directions: Complete the calculations.
After reviewing the production records and ADP for the past 3 months, your estimated meal
count is 750. This estimated count is increased because the school nutrition department has
implemented nutrition education into the classroom and students are helping to plan healthier
options. The weather is still very warm. The menu will be served on a Monday.
The estimate serving percentages for each item is as follows:
50% (.50) Grilled Teriyaki Chicken Breast on Whole Grain Bun
40% (.40) Fish Tacos with a Whole Grain Tortilla
10% (.10) Chef Salad with Multi Grain Roll
To calculate the number of servings needed for each menu item, multiply the estimated
percentage by the estimated total meal count to determine the number of servings to prepare.
Estimated Percentage x Estimated Total Meal Count = Number of Servings to Prepare
Forecast how much of these items will be prepared to meet the estimated 750 meal
count.
Sample Forecasting Number of Servings to Prepare
Estimated Percentage
x Estimated Total Meal Count
= Number of Servings to
Prepare
Meal Count
x
Chicken Breast
=
Prepare
Meal Count
x
Fish Tacos
=
Prepare
Meal Count
x
Chef Salad
=
Prepare

Financial Management for Managers Participant’s Workbook
Lesson 3—4 Institute of Child Nutrition

Participant’s Workbook Financial Management for Managers
Institute of Child Nutrition Lesson 3—5
Forecasting Worksheet, continued
Scenario: Extra Servings
Directions: Complete the calculations and answer the question(s) at the end of the activity.
Whole grain-rich pasta served with turkey marinara is a popular menu item. The production
record indicates to prepare 300 servings of the turkey marinara sauce and the whole grain-rich
pasta. The staff determines there must be a mistakes and prepares 500 servings. You are
concerned about food cost and want to illustrate the cost of over-production of the whole
wheat pasta served with turkey marinara sauce.
A serving of turkey marinara sauce cost is $0.37 and whole grain-rich pasta is $0.08 for a
total cost of $ 0.45.
The menu item will be served 36 times throughout the school year.
Determine the Extra Servings Produced
Actual Quantity Prepared
- Estimated Quantity
= Extra Servings Produced
Servings -
Servings
=
Servings
Determine Cost of Extra Servings Produced
Extra Servings Produced
x Cost per Serving = Cost of Extra Servings
Produced
Servings
x
Cost
=
Extra Cost
Total Cost of Extra Servings
Cost of Extra Servings
Produced
x Number of Times Served
= Total Cost of Extra
Extra Cost
x
Times Served
=
Total Cost

Financial Management for Managers Participant’s Workbook
Lesson 3—6 Institute of Child Nutrition
Forecasting Worksheet, continued
Scenario: Batch Cooking
Directions: Complete the calculations.
Batch cooking and “just-in-time” (JIT) cooking are terms often used interchangeably. These
terms refer to cooking in small quantities to maintain high quality throughout the serving
period. The amount prepared at a given time should not exceed what can be served or is
needed on the line in an established amount of time (15–30 minutes). Batch cooking ideally
takes place continuously throughout the meal service period to guarantee quality.
To ensure the highest quality product and reduce waste, batch cooking is the standard
procedure in the school meals operation. The first meal service begins at 10:50 a.m., and the
second meal service begins at 11:20 a.m. Each pan of vegetable pizza takes 10 minutes to cook
and 5 minutes to record temperatures.
Pizza appears on the menu 30 times throughout the school year.
Before the employees practiced batch cooking, the production records indicated 20
individual pizzas left at the conclusion of meal service.
After implementing batch cooking, only 3 individual pizzas are left.
The individual cost of a pizza is $0.79.
Pizza Savings
Leftover Pizza Count Before Batch Cooking
- Leftover Pizza After Batch
Cooking
= Extra Pizzas Produced prior
to Batch Cooking
Extra Pizzas
-
Extra Pizzas
=
Extra Pizzas
Total Reduced Pizza Count
Extra Pizzas Produced
x Number of Times Served
= Total Reduced Pizza Count
Extra Pizzas
x
Times Served
=
Pizzas

Participant’s Workbook Financial Management for Managers
Institute of Child Nutrition Lesson 3—7
Forecasting Worksheet, continued
Total Savings
Total Reduced Pizza Count
x Cost per Pizza = Total Savings
Pizzas
x
Cost
=
Savings

Financial Management for Managers Participant’s Workbook
Lesson 3—8 Institute of Child Nutrition
Forecasting Worksheet, continued
Scenario: Portion Control—Tilapia Garnished with Citrus Sauce
Portion control is essential for controlling and maintaining food costs. Serving portions larger
than planned will negate any savings achieved through controlled purchasing and food
production. Portion control is also essential to maintaining the integrity of production records,
standardized recipes, and nutritional analysis. Portion control also helps teach customers about
age-appropriate portion sizes.
Directions: Complete the calculations.
Tilapia with citrus sauce is on the menu. Each 2-oz portion is neatly placed in the steam table
pan and the students can’t wait to select this favorite menu item.
The line server gives the first 250 students an additional 1-oz portion of the tilapia every
time the menu item is served.
Tilapia is on the menu 30 times throughout the school year.
A 2-oz portion of tilapia cost $0.46.
Cost of Extra Portion Tilapia Per Meal
Cost per Tilapia
x Students = Cost of Extra Portion Tilapia
per Meal
Cost
x Students
= Cost
Total Extra Cost
Cost of Extra Tilapia per Meal
x Number of Times on the
Menu During the Year
= Cost of Extra Portion Tilapia
per Meal
Cost
x
Times
=
Extra Cost

Participant’s Workbook Financial Management for Managers
Institute of Child Nutrition Lesson 4—1
Lesson 4: Menu Item Costs
Objective: Calculate the cost of a menu item. .
Menu Item Cost
Calculating the amount of food to purchase is an important part of financial management. It is
important to buy enough to meet the needs of a recipe or service for the portion sizes required,
but attention should be paid to not purchase too much. For example, some fresh vegetables,
such as celery and lettuce, have a much lower yield after peeling, trimming, and discarding
outer leaves. Also, the cooked weight of meat is less than the purchased weight when
purchased raw. In determining purchase quantities, the school nutrition manager should be
aware of these losses and purchase accordingly.
Food Buying Guide
The Food Buying Guide Calculator for Child Nutrition Programs is a very useful tool to assist with
determining the amount of food to purchase. Remember, the Food Buying Guide only provides
an estimate of the amount of food to purchase. The Food Buying Guide calculator can be
accessed via the following link: http://fbg.theicn.org.
As Purchased (AP) and Edible Portion (EP)
Information provided in the recipe determines the type and quantity of food to purchase. For
example, if a recipe contains chopped, fresh, onions the quantity to purchase or the As
Purchased (AP) amount can differ tremendously from the Edible Portion (EP) amount.

Financial Management for Managers Participant’s Workbook
Lesson 4—2 Institute of Child Nutrition
As Purchased and Edible Portion are key concepts to understand in inventory management.
AP refers to the weight of the product as it exists when purchased.
EP refers to the part of the product that can be consumed. The AP weight is greater
than the EP weight.
Many factors contribute to calculating the amount of food needed to purchase to equal the
amount of food needed for a recipe or service. In the next activity, we are going determine
whether to order untrimmed fresh broccoli or trimmed fresh broccoli florets. Both products
are acceptable.
(Workbook Activity): Purchasing Decisions Worksheet Complete the steps to calculate the cost of a product.

Participant’s Workbook Financial Management for Managers
Institute of Child Nutrition Lesson 4—3
Purchasing Decisions Worksheet Directions: Complete the steps to calculate the cost of a product.
Scenario: Purchasing Decision: Broccoli
For an upcoming menu, the manager is determining whether to order untrimmed fresh broccoli
or trimmed fresh broccoli florets. Both products are acceptable.
Broccoli, fresh, untrimmed
100–½ cup EP servings will require 19.75 lb of AP product
Cost per pound is $1.29 lb
Requires 60 minutes of labor before portioning into ½ cup serving size
Labor cost $11.70/60 minutes
Cost of Broccoli, Fresh, Untrimmed
Amount of Broccoli to Purchase
x Cost per Pound = Purchase Cost of Broccoli, fresh,
untrimmed
19.75 lb x $1.29 per lb =
Purchase Cost
Cost of Broccoli, Fresh, Untrimmed with Labor
Purchase Cost of Broccoli, fresh,
untrimmed + Labor Cost =
Total Cost of Broccoli, fresh,
untrimmed
$25.48 Purchase Cost
+ $11.70 per 60 Minutes
= Total Cost

Financial Management for Managers Participant’s Workbook
Lesson 4—4 Institute of Child Nutrition

Participant’s Workbook Financial Management for Managers
Institute of Child Nutrition Lesson 4—5
Purchasing Decisions Worksheet, continued Broccoli, fresh, florets, trimmed, ready-to-use
100–½ cup EP servings will require 7 lb of AP product
Cost per pound is $2.08 lb
Requires 15 minutes of labor before portioning into ½ cup serving size.
Labor cost $11.70/60 minutes or $2.93/15 minutes
Cost of Broccoli, Fresh, Florets, Trimmed, Ready-to-Use
Amount of Broccoli to Purchase
x Cost per Pound = Purchase Cost of Broccoli, fresh,
florets, trimmed
7 lb x $2.08 per lb = Purchase Cost
Cost of Broccoli, Fresh, Florets, Trimmed with Labor
Purchase Cost of Broccoli, fresh,
trimmed + Labor Cost =
Total Cost of Broccoli, fresh,
florets, trimmed
$14.56 Cost + $2.93 per
15 Minutes =
Total Cost
Which product is less expensive?
Answer:
What are the factors to consider before deciding to purchase one product over the other?
Example responses

Financial Management for Managers Participant’s Workbook
Lesson 4—6 Institute of Child Nutrition

Participant’s Workbook Financial Management for Managers
Institute of Child Nutrition Lesson 5—1
Lesson 5: Product Screening
Objective: Create a sample product screening evaluation tool.
Screening Products
Some schools may find that their customers prefer certain brands, which increases the number
of meals served. The purpose of conducting a screening is to provide a list of preapproved,
equal product brands in the solicitation document. Federal regulations clearly forbid specifying
only a brand name product instead of allowing a preapproved equal product to be offered.
(Workbook Handout): Product Screening Chart
Review and discuss the following Product Screening Chart.

Financial Management for Managers Participant’s Workbook
Lesson 5—2 Institute of Child Nutrition
Product Screening Chart
The purpose of conducting a screening is to provide a list of preapproved, equal product brands
in the solicitation document. The procurement procedures must ensure maximum full and
open competition. Federal regulations clearly forbid specifying only a brand name product
instead of allowing a preapproved equal product to be offered.
General Information Criteria Quantifier
Screening products is not required. SFAs
should be careful to ensure they do not
inadvertently exclude potential vendors.
Before beginning the screening process,
determine quantifiers of what is wanted or
expected for the product.
The three ways of screening products
include paper, appearance, and taste
screenings.
Establishing the evaluation criteria in
advance may reduce the possibilities of
future bid protests.
Conduct paper, appearance, and taste
screening separately and establish the
criteria for an acceptable product. Each
type of screening will have a different
evaluation process.
Determine a method to review brands for
prior approval.
o All screening evaluations should allow
for all potential vendors to provide a
product for screening during the
solicitation period (e.g., public
advertisement).
Establish procedures to review brands for
prior approval
o even doing so during the solicitation
process,
o after the solicitation is published, and
o before bids/responses are due.
Provide all interested potential
respondents with a copy of the screening
procedure.
Log all samples received from vendors.
o Keep accurate records of all three
screenings. You may be asked to
justify your choices.
Participant’s Workbook Financial Management for Managers
Institute of Child Nutrition Lesson 5—3
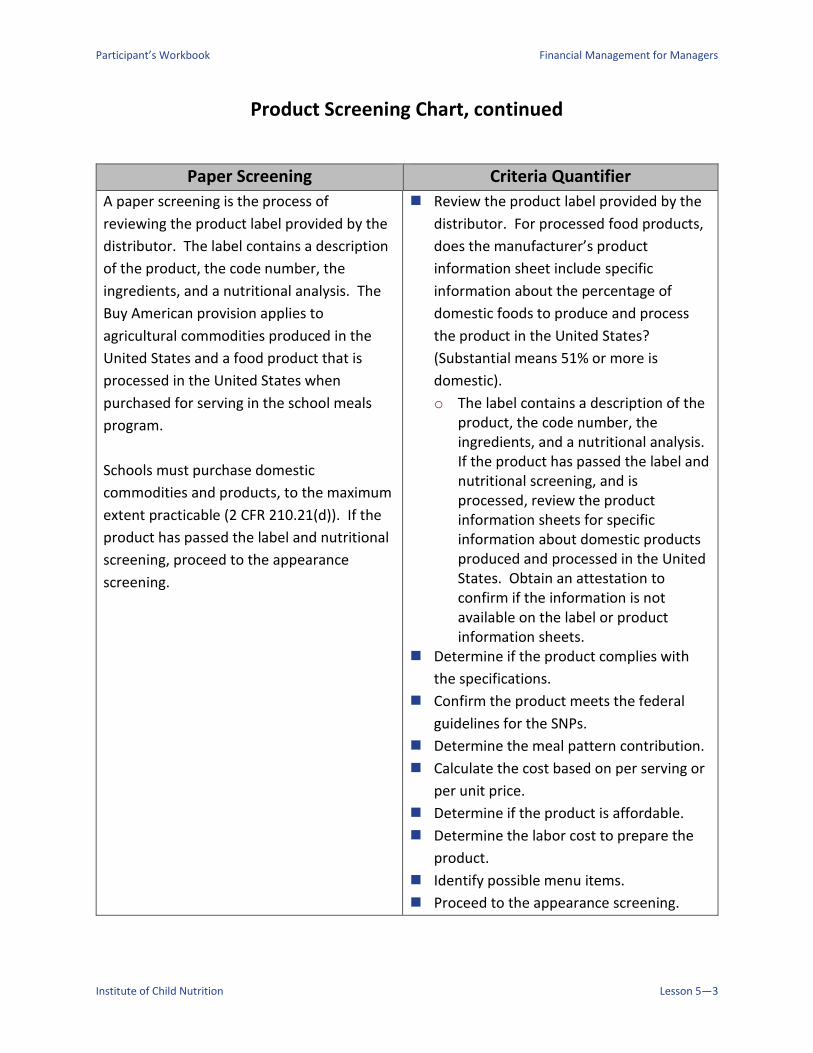
Product Screening Chart, continued
Paper Screening Criteria Quantifier
A paper screening is the process of
reviewing the product label provided by the
distributor. The label contains a description
of the product, the code number, the
ingredients, and a nutritional analysis. The
Buy American provision applies to
agricultural commodities produced in the
United States and a food product that is
processed in the United States when
purchased for serving in the school meals
program.
Schools must purchase domestic
commodities and products, to the maximum
extent practicable (2 CFR 210.21(d)). If the
product has passed the label and nutritional
screening, proceed to the appearance
screening.
Review the product label provided by the
distributor. For processed food products,
does the manufacturer’s product
information sheet include specific
information about the percentage of
domestic foods to produce and process
the product in the United States?
(Substantial means 51% or more is
domestic).
o The label contains a description of the product, the code number, the ingredients, and a nutritional analysis. If the product has passed the label and nutritional screening, and is processed, review the product information sheets for specific information about domestic products produced and processed in the United States. Obtain an attestation to confirm if the information is not available on the label or product information sheets.
Determine if the product complies with
the specifications.
Confirm the product meets the federal
guidelines for the SNPs.
Determine the meal pattern contribution.
Calculate the cost based on per serving or
per unit price.
Determine if the product is affordable.
Determine the labor cost to prepare the
product.
Identify possible menu items.
Proceed to the appearance screening.

Financial Management for Managers Participant’s Workbook
Lesson 5—4 Institute of Child Nutrition
Product Screening Chart, continued
Appearance Screening Criteria Quantifier
An appearance screening is the process of
examining the appearance of the sample.
The most important aspect of the
appearance screening is the product itself.
Before beginning the appearance screening,
determine evaluation quantifiers of what is
wanted or expected for the appearance of
the product. For instance, the roll should be
golden brown with a slightly crunchy crust; a
baguette would be long and thin and would
not pass appearance screening if it looked
like a Kaiser roll.
If a consensus cannot be agreed upon what
the product should look like, it will be
impossible to determine if the product
passes this screening.
Purchase the products for the appearance
screening. Not only is purchasing the
product a good business practice it will
ensure the product SKU/code will be the
actually product used for the appearance
screening.
Determine minimal acceptable and
unacceptable attributes
Include sample quantifiers such as:
o Consistent in shape
o Light brown in color
o Even color
o Even cut pieces
o Topping evenly spread
o Minimal leaves
o Fill ratio
Determine the attributes of the package.
For example
o Does it come in an individually
wrapped package? If so, is it easy to
open?
o Is the packaging attractive?
o Does it come layered in a case with
parchment between the layers?
o Does the packaging maintain the
integrity of the product during
shipping and handling?

Participant’s Workbook Financial Management for Managers
Institute of Child Nutrition Lesson 5—5
Product Screening Chart, continued
Taste Screening Criteria Quantifier
A taste screening is the process of
conducting a taste test with your customers.
Some products are too highly seasoned, too
greasy, too salty, or too sweet. The goal is to
offer customers good tasting, high quality
products.
Once the product(s) have gone through the
adult taste screening, it is time for the
student customers to give their opinion.
Taste testing is the final screen and
determines whether the brand or the
product will be preapproved to be placed on
the bid.
A simple method for taste testing with
elementary students involves using two
containers, one labeled with a smiley face
and one with a frown. The students vote by
placing a small piece of color paper in the
appropriate container—smiley for
acceptable and frown for unacceptable.
In the same manner, at the junior and high
school levels, the containers can be labeled
either acceptable or unacceptable.
Determine in advance the criteria for
documenting the results of the taste test.
Purchase the products for the taste test.
Not only is purchasing the product a good
business practice it will ensure the
product SKU/code will be the actually
product tested.
Create an evaluation tool. Consider
including a description for the texture,
flavor, seasoning, how the product holds
after cooking, and overall acceptance of
the product.
Determine in advance an acceptability
percentage such as 85% approval for
products to be placed on the bid.
Prepare the product according to
manufacturer’s direction.
Do not identify the brand name of the
product.
Prepare similar products for tasting at
approximately the same time and hold
product at proper temperatures.
Set up taste test area. Remember to
include napkins, plates, spoons, forks,
knives, and water to rinse mouth between
tastings.
Conduct a taste test with adults and
students.
Source: Institute of Child Nutrition. (2017). Forecasting the procurement of foods instructor’s manual. University, MS: Author.

Financial Management for Managers Participant’s Workbook
Lesson 5—6 Institute of Child Nutrition
Sample Screening Evaluation Tool
We are now going to take a few minutes to apply the concepts for screening products. To do
this, we will divide into small groups. Each group will create an evaluation tool for hummus
using one of the following methods:
Paper screening
Appearance screening
Taste screening
(Activity): Hummus Screening Evaluation Tool
Place your group’s assigned topic as a header on your flip chart paper, and create a screening
evaluation tool. At the conclusion of this activity, groups will take turns reporting out.

Participant’s Workbook Financial Management for Managers
Institute of Child Nutrition Lesson 6—1
Lesson 6: Inventory Control
Objective: Identify inventory controls that contribute to a financially sound school nutrition
program.
Inventory
An important financial management principle is minimizing the total dollar investment in
inventory. This can be analyzed by calculating inventory turnover. Inventory turnover is
calculated by dividing the value of the average inventory for the period into the cost of food
used during the period. A general guideline is that inventory should turn over three to five
times per month.
The inventory system includes effective procedures for: receiving, storage, accounting for items
removed from inventory, counting of items in stock, and calculating the financial value of the
inventory.
Inventory Methods
There are two methods of recording the foods and supplies in stock: perpetual inventory and
physical inventory. Perpetual inventory is an up-to-date, running record of each item in stock
based on tracking items as they are received and used. This information may be maintained by
using computers, scanners, and universal bar codes. Perpetual inventories must be checked
occasionally with a physical inventory. Physical inventory is an actual count of the goods on
hand, usually taken at the end of each month.

Financial Management for Managers Participant’s Workbook
Lesson 6—2 Institute of Child Nutrition
Single Inventory Concepts
When calculating the costs of food used, the value of USDA Foods must be considered. USDA
has recently taken steps to more fully integrate USDA Foods with other commercial foods
utilized by school nutrition programs. This has resulted in purchased items and USDA Foods
being accounted for as one single inventory. The intent is to reduce costs and provide more
timely deliveries. Under the single inventory concept, cost of food used may include the value
of USDA Foods.
USDA Foods and purchased items do not need to be separate inventories.
Most USDA Foods are packed with commercial labels instead of USDA labels.
Procedures may differ from state to state in USDA Foods inventories.
Some states continue to provide pre-case value for USDA Foods. The USDA Foods value
is entered into the district accounting records separately from the cost of purchased
food. This allows the school district to calculate both the cost of purchased food used
and the value of USDA Foods used in the reporting period.
Receiving Foods
Receiving is an important part of inventory management and quality and cost control. The
entire receiving process requires consistent control. Part of the consistent control is ensuring
food products received are the actual food products ordered. Some receiving tips include the
following best practices:
Develop Standard Operating Procedures.
Provide a copy of the order to the person receiving the delivery.
Check the products delivered against the products ordered. Do not accept unapproved
product substitutions.
Use a two-wheel truck and/or carts to move products from the receiving dock.
Follow the hazard analysis and critical control points (HACCP)-based food safety plan.
Keep a clipboard or other flat surface available to assist in the receiving process.

Participant’s Workbook Financial Management for Managers
Institute of Child Nutrition Lesson 6—3
Communicate product shortages and quality concerns to the delivery person and the
appropriate SFA staff member.
Each school district has a system for communicating the brand and code numbers of products
preapproved during the contract award. This information is key for monitoring contractor
performance, a requirement of 2 CFR 200.318(b). When school districts do not provide brands
and code numbers on their resulting contract, the site receiver must check the products against
the specifications. The most effective approach to improving the ordering and receiving
process is to award the brand and code number in the resulting contract.
One method of ensuring products solicited and awarded are the products ordered and received
is to provide the staff with an Ordering and Receiving Guide of Approved Products.
Staff with responsibilities of ordering and receiving products can use the guide to ensure
the correct products are ordered, and
the correct product, brand, code, and pack is received at the right price.
(Workbook Handout): Inventory Good Practices
(Workbook Handout): Storage Area Good Practices
Review the Inventory Good Practices and Storage Area Good Practices handouts

Financial Management for Managers Participant’s Workbook
Lesson 6—4 Institute of Child Nutrition
Inventory Good Practices
Perpetual inventory is an up-to-date, running record of each item in stock based on tracking
items as they are received and used. This information may be maintained manually or
electronically by using computers, scanners and universal bar codes. Perpetual inventories
must be checked occasionally with a physical inventory.
Physical inventory is an actual count of the goods on hand, usually taken at the end of each
month. The following are good practices for inventory:
Train employees on how and when to take inventory.
For security purposes and whenever possible, the person who is responsible for day-to-
day management of the inventory should not participate in counting the inventory.
One person should count and another should record.
Items should be inventoried by location and in the order the products are located in the
storage area. Depending on the operation, it may be standard practice to open cases
and count items individually. Some operations will only track counts of unopened cases.
The important point is whichever system is used, be consistent each time you are taking
inventory.
Determine the date the inventory will be counted, such as the close of business at the
end of the month, and schedule dates regularly. Most operations count and value
inventory monthly.
Record all inventory delivered in the accounts payable for the month.

Participant’s Workbook Financial Management for Managers
Institute of Child Nutrition Lesson 6—5
Storage Area Good Practices
Optimal Storage Organization
Ensure accessibility to both receiving and food production to reduce transport time and
corresponding labor costs.
Develop policies and procedures addressing security, and theft.
Determine adequate space, appropriate shelving, ventilation, and lighting.
Keep accurate, working thermometers in cold holding and dry storage areas.
Assigned spaces for each item
Store fast-moving items close to the storage entrance.
Consider high-density shelving to increase shelf space in a limited space “footprint.”
Consider storing items by category (e.g., canned juices) and then alphabetically (e.g.,
apple juice, cranberry juice, grape juice).
Assign space for each type of food item. An organized storeroom requires less space
than if foods are placed haphazardly in an empty area. A great deal of time is saved by
not having to hunt for items.
Consider arranging the storeroom in the same order as major vendor order guides. This
will increase your efficiency in placing orders, completing inventory, and tracking
inventory value by category. If par levels have been established, there should be a
consistent inventory value in each category. A significant increase or decrease will be
cause for review.
Include appropriate food-grade shelving in all storage areas. This will allow proper air
circulation and keeps food sufficient distances from the floor, walls, and ceiling.
Require the “first in, first out” (FIFO) method of storage be implemented.
Date products as they are received and store newly delivered products behind products
already in stock. An exception to this guideline occurs when a newly delivered product
has an earlier expiration date than previously received product.

Financial Management for Managers Participant’s Workbook
Lesson 6—6 Institute of Child Nutrition
Storage Area Good Practices, continued
Food Safety Guidelines for Storage
Follow local health department regulations for temperature guidelines. Recommended
temperature guidelines include:
Dry storage area kept at 50°–70 °F;
Refrigerated storage kept at 32–39 °F; and
Freezer storage kept at or below 0 °F.
Storage Areas
Arrange your storage area by product category.
Beverages, Milk Products, Water
Cereals (prepared)
Cereals and flour
Sugar (granulated, brown, confectioners)
Crackers, Snacks
Baking/Cooking Supplies (extracts, spices, herbs, baking powder, baking soda)
Oils and Shortening
Condiments (bulk and individual)
Fats and Oils
Fruit (canned)
Fruit (dried)
Fruit Juices
Vegetables (canned)
Specialty Items

Participant’s Workbook Financial Management for Managers
Institute of Child Nutrition Lesson 6—7
Value of Inventory
The value of the inventory can be assigned based on three methods: actual purchase price,
replacement cost or the weighted average of all inventory in stock.
The actual purchase price is the invoice price for the product at the time it was
purchased. Although this is a good method, if you have a newer product at a different
price, maintaining accurate records and costs can be challenging.
Replacement cost is the most recent price paid for the product. This is the least
confusing method of calculating inventory price.
Weighted average is the average price paid for each product. Calculate average price by
multiplying the number of units of each product in the beginning inventory plus any
purchased during the month by the actual purchase price. Add prices for all units and
divide by total number of units available. This is time consuming and may not be
significantly more accurate.
Each method requires data management and record keeping. Whichever method is used,
school nutrition managers should consistently use the same method.
Inventory Turnover
An important tool in inventory management is calculating inventory turnover. The greater the
inventory turnover, the more efficient the operation is in controlling the amount of product
held in inventory. Additional benefits of inventory turnover include:
ordering quantities to ensure items are available for projected menus,
reducing risk of theft because items missing are easily identified, and
rotating inventory can help to reduce waste, and ensure higher quality products.

Financial Management for Managers Participant’s Workbook
Lesson 6—8 Institute of Child Nutrition
Food Costs
Food cost is controlled by:
following standard operating procedures,
maintaining the correct inventory level,
having needed product on hand,
preventing the need for a more expensive substitution for the missing product, an
ensuring food is used in a timely manner
(Activity): Inventory Turnover Worksheet Complete the calculations.

Participant’s Workbook Financial Management for Managers
Institute of Child Nutrition Lesson 6—9
Inventory Turnover Worksheet
Directions: Complete the calculations.
April Purchases
Company Purchase Foods
XYZ Foods $20,000.00
ABC Dairy $ 3,000.00
GH Bakery $ 2,000.00
USDA Foods Received Value $ 5,000.00
Add the XYZ Foods, ABC Dairy, and GH Bakery purchase to determine the Total
Purchased Foods.
Add the Total Purchased Foods and the USDA Foods Value Received to determine the
Value of April Foods available.
Total of Food Purchased for April
XYZ Purchases
+ ABC Dairy Purchases
+ GH Bakery
Purchases
= Purchased Foods Total
Purchases
+
Purchases
+
Purchases
=
April Purchases
Value of April Foods
Purchased Foods Total
+ USDA Foods Received Value
= Value of April Foods Total
April Purchases
+
USDA Foods
=
Value of April Foods

Financial Management for Managers Participant’s Workbook
Lesson 6—10 Institute of Child Nutrition
Inventory Turnover Worksheet
Total Value of April Foods $30,000.00
March Ending Inventory $10,000.00
April Ending Inventory $12,000.00
Add the Value of April Foods to the March ending inventory and then subtract the April
ending inventory to determine the April Cost of Food Used.
Divide the April Cost of Food Used by the average of March and April inventories to
determine Inventory Turnover. The average inventory is determined by dividing the
combined dollar amount of the beginning inventory and ending inventory by two.
April Cost of Food Used
Value of April Foods
+ March Inventory
- April Inventory
= Cost of Food Used
April Total Value
+
March Inventory
-
April Inventory
=
Cost of Food Used
Average Inventory
Ending Inventory
+ Ending Inventory
÷ 2
= Average Inventory
March
Inventory
+
April
Inventory
÷
2
=
Average
Inventory
Inventory Turnover
April Cost of Food Used
÷ Average March/April
Inventory
= Inventory Turnover
Cost of Food
Used
÷
Average
Inventory
=
Inventory Turnover
Participant’s Workbook Financial Management for Managers
Institute of Child Nutrition Lesson 6—11
Par Stock
Par stock is a predetermined inventory quantity for a particular item and serves as an indicator
on when to reorder the product. A par stock is established through a thorough evaluation of
product use over the amount of time between deliveries. For example, if there are weekly
deliveries and production records show three cases of fresh, sliced onions are used each week,
the school-based operation should keep three cases of onions in inventory.
For high-use items with a long shelf life, it is sometimes beneficial to keep an extra case on
hand. The quantity to keep on hand will be reflected in the par stock number. This provides
“cushion” for emergencies but sets a suggested limit to reduce the total dollars tied up in
stored product.
Theft and Fraud Prevention
A key component of financial management is reviewing practices and procedures to minimize
the risk of fraud or theft. These systems are not only related to accounting and reporting, but
also relate to the organization’s communication processes, internal and external policies, and
procedures for handling funds received and expended by the organization.
Preventing theft is another aspect of financial management. Whether the theft is money or
food, the impact of theft affects the operation’s financial performance. Let’s take about 10
minutes and identify some ways to prevent customer and employee theft in the school
nutrition operation.
(Workbook Handout): Theft Prevention Measures Handout
(Workbook Handout): Cash handling Procedures Good practices Review the Theft Prevention Measures handout and Cash Handling Procedures Good Practices
handout.

Financial Management for Managers Participant’s Workbook
Lesson 6—12 Institute of Child Nutrition

Participant’s Workbook Financial Management for Managers
Institute of Child Nutrition Lesson 6—13
Theft Prevention Measures
Train staff to watch customers.
Locate cashier at exit where she or he can see the entire line.
Do not cash checks. Accept checks only for amount of purchase or in amount of
prepayment.
Request heavy coats remain outside the serving area.
Make sure food items are attended at all times.
Install security cameras.
Do not allow leftovers to be taken home. The practice of allowing leftovers to be taken
home is a violation of federal regulations.
Do not allow employees to bring backpacks or large bags into the school nutrition
operation.
Distribute keys sparingly and keep a key distribution log/chart. Stamp keys with a
notation to indicate keys cannot be duplicated. Periodically inventory keys to ensure all
keys are accounted for and distributed to the intended user. If key is lost or not
returned, re-key locks.
Maintain and monitor school nutrition inventory in warehouse and at local school.
Date products as delivered to warehouse and at local school.
Keep storeroom and back door locked.
Check food and supplies when delivered. Weigh items sold by pound; count items sold
by count. Check products against specifications to determine whether correct products
are being delivered. Do not allow for early morning drop-offs or unattended deliveries.
Require delivery tickets to be signed by an authorized person before they will be paid
and require all deliveries to be checked before signing.
Check prices charged to determine if they are correct. Check the multiplication in
extending prices and addition on the delivery tickets. Compare delivery tickets and bills.
Do not give keys to delivery people.

Financial Management for Managers Participant’s Workbook
Lesson 6—14 Institute of Child Nutrition
Cash Handling Procedures Good Practices
Define responsibilities for handling cash. Those who actually handle cash should not
have access to or be responsible for the cash records.
Designate a limited number of employees who are each responsible for cash handling
during a designated period.
Have money counted by two or more people in an enclosed place and deposit money
daily.
Watch for signs of non-recorded transactions such as piles of coins or invoices in an odd
location.
Take individual register readings after each meal period. A manager or other
supervisory member who does not handle cash should do this. The cashier should not
have access to the reading until after he/she has counted the cash drawer.
If possible, assign separate cash drawers to different cashiers for each shift.
Train supervisory staff to operate the cash register so they can substitute for operators
taken ill or other such emergencies.
Rotate all cashiers to non-cash handling responsibilities for a period of time (about a
week) to ensure accountability.
Keep all monies locked in a safe or designated area until deposited.
Train cashiers on how to give change, handle cash, and process checks and other types
of payment.
Determine the beginning balance for each cashier’s drawer and establish policies and
procedures to verify the balance before each shift.
Ensure all sales are entered into the register at the point of sale.
Verify cash sales through meal counts, inventory records, or production records.
Retain deposit receipts and send duplicate deposit tickets to another office.
Review cash handling policies and update as needed.
Establish specific policies for reconciling vending sales.

Participant’s Workbook Financial Management for Managers
Institute of Child Nutrition Lesson 7—1
Lesson 7: Meal Equivalents
Objective: Calculate the meal equivalents for different scenarios.
Food Costs
One of the most important aspects of administering the SNP is managing food cost. It is
important for school nutrition managers and directors to monitor food costs on a regular basis.
High food costs are often the problem when a school or school district nutrition program is
experiencing a financial loss. Calculating the cost of food is vital in order to:
determine whether costs are within guidelines;
ascertain if there are sufficient funds to pay expenditures;
establish the cost for each meal equivalent served; and
prevent waste and food theft through monitoring food use
What are some ways to reduce food cost?
Meal Equivalents
Determining meal costs begins with calculating meal equivalents. Please note that FNS does
not prescribe one particular method in order to calculate meal equivalency. However, the most
accurate method for developing a lunch/meal equivalent rate is based on the full cost of
producing a reimbursable lunch. The lunch/meal equivalent rate must be set no lower than the
free lunch reimbursement rate plus the value of USDA Foods.
It is important to recognize not all states and school districts convert adult meals to meal
equivalents using the same method. Check with your State agency for guidance.

Financial Management for Managers Participant’s Workbook
Lesson 7—2 Institute of Child Nutrition
Equate Meals to a Standard
The student reimbursable lunch is the standard unit of measurement most often used.
Counting meal and food sales other than lunches is not as clear-cut as counting the traditional
lunch. Thus, a method for converting operational data for all food sales, including student
lunches, must be used to determine the equivalent of a meal. It is important to remember a
meal equivalent is not a unit of production but a calculation which allows the operator to
equate all meals to a standard: the student reimbursable lunch.
By converting all food sales to meal equivalents, the school nutrition manager can determine a
per meal cost and productivity ratios such as meals per labor hour.
Meal Cost Meal Equivalent Calculation
Meal costs based on meal equivalents allow school nutrition administrators to better
benchmark financial performance, both internally and externally. The number of meal
equivalents served is determined by converting breakfasts, lunches, afterschool snacks, and
nonprogram revenue such as a la carte, to a reimbursable student lunch standard for the
purpose of financial reports, including productivity measurement reports.
(Workbook Activity): Meal Equivalent Worksheet Complete the calculations.

Participant’s Workbook Financial Management for Managers
Institute of Child Nutrition Lesson 7—3
Meal Equivalents Worksheet
Scenario: Breakfast Meal Equivalents
Directions: Complete the calculations. It is important to recognize not all states and school
districts convert adult meals to meal equivalents using the same method. For this reason,
check with your State agency for guidance
For this example, a SNP served 239 students reimbursable breakfasts. For this activity please
round to the next whole number and use the following as a conversion factor.
1 lunch = 1 lunch meal equivalent
0.67 Conversion Factor = (3 breakfasts for every 2 lunches or 2 ÷ 3 = 0.67)
3 snacks = 1 lunch (1 divided by 3 = 0.33)
Nonprogram food sales = Revenue from food sales ÷ (Current free lunch reimbursement
+ current USDA Foods value/lunch)
Breakfast Meal Equivalents
Total Number of Breakfasts
Served
x Breakfast Conversion
Factor
= Meal Equivalents
Breakfast Served
x
Conversion Factor
=
Meal Equivalents
Note: Round Meal Equivalents Other Foods to nearest whole number.

Financial Management for Managers Participant’s Workbook
Lesson 7—4 Institute of Child Nutrition
Meal Equivalents Worksheet, continued
Scenario: After School Snacks
Directions: Complete the calculations. It is important to recognize not all states and school
districts convert adult meals to meal equivalents using the same method. For this reason,
check with your State agency for guidance
Afterschool snacks give children a nutritional boost and draw them into supervised activities
that are safe, fun, and filled with learning opportunities. Using this equivalency, snacks can be
converted to meal equivalents.
Conversion Factor
For this example, the SNP served 450 reimbursable afterschool snacks. For this activity please
round to the next whole number and use the following as a conversion factor.
1 lunch = 1 lunch meal equivalent
0.67 Conversion Factor = (3 breakfasts for every 2 lunches or 2 ÷ 3 = 0.67)
3 snacks = 1 lunch (1 divided by 3 = 0.33)
Nonprogram food sales = Revenue from food sales ÷ (Current free lunch reimbursement
+ current USDA Foods value/lunch)
Calculating Meal Equivalents for Afterschool Snacks
Number of Snacks Served
x Afterschool Snack
Conversion Factor
= Meal Equivalents
Snacks Served
x
Conversion Factor
=
Meal Equivalents
Note: Round Meal Equivalents Other Foods to nearest whole number.

Participant’s Workbook Financial Management for Managers
Institute of Child Nutrition Lesson 7—5
Meal Equivalents Worksheet, continued
Scenario: NonProgram Food Sales
Directions: Complete the calculations. It is important to recognize not all states and school
districts convert adult meals to meal equivalents using the same method. For this reason,
check with your State agency for guidance.
Nonprogram food sales are all foods and beverages sold in the school nutrition operation other
than reimbursable meals. Examples of nonprogram foods are a la carte, second student meals,
and special function meals. Meal equivalent calculations for all nonprogram food sales are
based on the annual federal reimbursement rate for students eligible for free lunch plus the
entitlement USDA Foods value. The revenue from nonprogram food sales can be converted to
meal equivalents.
The school nutrition operation sold nonprogram food items on a given day that totaled
$434.00 in revenue
SY 2016-2017 NSLP $ 3.22 (Free Lunch Reimbursement plus 6 cents)
SY 2016-2017 USDA (Entitlement) Foods Value $0.23
Convert the revenue from nonprogram food sales to meal equivalents.
Calculating Meal Equivalents for Nonprogram Food Sales
Free Lunch
+
USDA Food Value
=
Revenue
Nonprogram Food Sales
÷
Revenue
=
Meal Equivalents Other Foods
Note: Round Meal Equivalents Other Foods to nearest whole number.

Financial Management for Managers Participant’s Workbook
Lesson 7—6 Institute of Child Nutrition
Per Meal Costs
One of the best benchmarks SNPs can use to evaluate the effectiveness of the nutrition
operation in managing expenditures is the cost per meal or meal equivalent served. Calculating
the cost of producing a meal or meal equivalent is essential to good financial analysis of the
SNP. The calculation must be determined on a regular basis, preferably monthly. Examples of
benchmarks are 40-43% food cost, 40-43% labor cost, and supply cost 4-6%, etc. against which
monthly monitoring can be evaluated. This allows the school district to take action to correct
the situation in a timelier manner when the costs to produce a meal exceed the revenue to
cover those costs. Remember, cost may be higher at the beginning of the year when inventory
levels are being built-up and forecasted participation estimates are being evaluated. Costs
should be reduced but must be monitored to ensure this reduction occurs to achieve financial
goals.
In order to determine meal costs, you must calculate the total expenditures for a given period,
and the total meal/meal equivalents served for the same period. Meal cost should be
determined for each expenditure category and for the total expenditures.
(Workbook Activity): Per Meal Cost Worksheet Complete the calculations.

Participant’s Workbook Financial Management for Managers
Institute of Child Nutrition Lesson 7—7
Per Meal Cost Worksheet
Scenario: Determine the Expenditures for Period.
Directions: Complete the calculations. It is important to recognize not all states and school
districts calculate per meal cost using the same method. For this reason, check with your State
agency for guidance.
Calculating Per Meal Cost
Meal cost is determined by dividing total expenditures by total meal equivalents. Meal cost can
be calculated for any accounting period the school nutrition manager wishes to analyze. The
example below provides an explanation of the total process for calculating the cost to produce
a meal for a given period of time. To calculate Per Meal Cost
Determine the expenditures.
Calculate all meals and meal equivalents.
Total all meal equivalents and lunches together.
Divide total expenditures by total meal equivalents.
Calculations made at the school level serve as a tool for evaluating expenditures at that site.
They may not necessarily reflect all costs associated with the district’s school nutrition
operation. Expenses may go beyond food and labor. Some other allowable school nutrition
expenses include: supplies, equipment, purchased services, property repair and maintenance,
electricity, fuel, water, transportation (e.g., fuel and oil), professional development, and
indirect costs.

Financial Management for Managers Participant’s Workbook
Lesson 7—8 Institute of Child Nutrition
Per Meal Cost Worksheet Answer Key, continued
For this example, the staff gathered all the daily cost information, including the following:
Food Costs $ 1,089.00
Labor Costs $ 1,189.50
Professional Development (PD) Costs $ 18.00
General Supplies Cost $ 80.20
Indirect Costs $ 217.15
Determine the Expenditures for Period
Food Costs
+ Labor Cost
+ PD Cost
+ General Supplies
+ Overhead Costs
= Total Expenditures
Food Cost
+
Labor Cost
+
Professional
Development Cost
+
General Supplies
+
Indirect
Cost
=
Total
Expenditures
Scenario: Calculate all Meals and Meal Equivalents.
After the total expenditures were calculated, the number of meal equivalents for each type of
service was determined.
In ABC Elementary School, school nutrition staff members concerned about plate costs in their
school decided to analyze meal costs on a daily basis.
On this particular day, the school nutrition operation served
700 student lunches
$93.00 in adult lunch sales
239 breakfasts
54 snacks in the afterschool care program

Participant’s Workbook Financial Management for Managers
Institute of Child Nutrition Lesson 7—9
Per Meal Cost Worksheet, continued
Conversion Factor
For this example, a school nutrition program served 239 student reimbursable breakfasts. For
this activity please round to the next whole number and use the following as a conversion
factor.
1 lunch = 1 lunch meal equivalent
0.67 Conversion Factor = (3 breakfasts for every 2 lunches or 2 ÷ 3 = 0.67)
3 snacks = 1 lunch (1 divided by 3 = 0.33)
Nonprogram food sales = Revenue from food sales ÷ (Current free lunch reimbursement
+ current USDA Foods value/lunch)
Lunch Meal Equivalents
Total Number of Lunches Served
x Lunch Conversion
Factor
= Meal Equivalents
Lunch Served
x
Conversion Factor
=
MEs Lunches

Financial Management for Managers Participant’s Workbook
Lesson 7—10 Institute of Child Nutrition
Per Meal Cost Worksheet, continued
Nonprogram Food Sales Meal Equivalents Adult Sales (MEs)
Nonprogram Foods
÷ (Free Lunch Reimbursement
+ USDA Foods Value)
= Meal Equivalents
Adult Lunch Sales
÷
Free Lunch
+
USDA Foods Value
=
MEs Adult Sale
Breakfast Meal Equivalents
Total Number of Breakfasts Served
x Breakfast Conversion Factor
= Meal Equivalents
Breakfast Served
x
Conversion Factor
=
MEs Breakfast
Afterschool Snacks Meal Equivalents (MEs)
Number of Snacks Served
x Afterschool Snack
Conversion Factor
= Meal Equivalents
Snacks Served
x
Conversion Factor
=
MEs
Afterschool Snacks

Participant’s Workbook Financial Management for Managers
Institute of Child Nutrition Lesson 7—11
Per Meal Cost Worksheet, continued
Total Meal Equivalents (MEs)
Lunch + Adult Lunch Sale
+ Breakfast + After School Snacks
= Total Meal Equivalents
MEs
Lunches
+
MEs
Adult Sales
+
MEs
Breakfast
+
MEs
Afterschool Snacks
=
Total MEs
Scenario: Calculating Per Plate Meal Cost
Based on the staff’s daily cost information, the manager determined that expenditures totaled
$2593.85 and the total meal equivalents totaled 908 for the period. To find the per meal cost,
divide the total expenditures for the period by the total meal equivalents. This tells the school
nutrition manager the cost of producing a meal equivalent on a per-plate basis for the period of
time being analyzed.
Per Meal Cost
Total Expenditures
÷ Total Meal Equivalents
= Meal Cost
Total Expenditures
÷
Total MEs
=
Meal Cost

Financial Management for Managers Participant’s Workbook
Lesson 7—12 Institute of Child Nutrition

Participant’s Workbook Financial Management for Managers
Institute of Child Nutrition Lesson 8—1
Lesson 8: Labor Costs
Objective: Calculate labor costs.
Labor Costs
Some labor costs, such as raises for employees or increases in the costs of health care, may be
beyond control of the school nutrition manager or director. However, the use of labor hours
and the number of employees hired at each school site is most often a decision that can be
made by the school nutrition department. Most SNPs use the productivity index of meals per
labor hour to monitor the efficiency of an operation and as a guide to determine staffing.
What are some ways to control labor costs in a school nutrition operation?
Staffing
The school district’s success in keeping labor and food costs within the established guidelines
depends on the financial management skills of the entire SNP department, including the school
nutrition program director, the site level managers, and the kitchen staff.
Managing scheduling and staffing is a critical part of financial management. Scheduling
involves having the proper number of workers on duty to complete all tasks and at peak
demand within the established time frames. Staffing is the determination of the appropriate
number of workers needed for the operation to do the work that needs to be accomplished.
Scheduling
The most important factor in controlling labor costs is the scheduling of employees. In addition
to excessive labor costs, poor scheduling has other implications.

Financial Management for Managers Participant’s Workbook
Lesson 8—2 Institute of Child Nutrition
What are some implications of poor scheduling?
Workbook Handout): Production Task Schedule Example Discuss the production task schedule as a group.

Participant’s Workbook Financial Management for Managers
Institute of Child Nutrition Lesson 8—3
Production Task Schedule Example
Utilizing a production task schedule can be helpful in assigning responsibilities and workload for
meal preparation. The production task schedule can be quite simple, with a daily list of specific
responsibilities for food preparation items by employees.
Employee 1
Serve breakfast.
Complete production records and clean-up serving line.
Prepare Romaine salad blend.
Prepare fresh vegetables for the garden bar.
Wash fresh fruit.
Fill dressing and condiment containers.
Set up garden bar by 10:45 a.m. and record temperatures.
Monitor, fill, and refresh garden bar through the meal service.
Assist others as needed.
Employee 2
Pan three-bean burritos and refrigerate.
Pan pizza and refrigerate.
Bake three-bean burritos at 10:40 a.m. and record temperatures.
Bake pizza at 10:40 a.m. and record temperatures.
Continue with batch cooking through the lunch period.
Complete production records and clean-up serving line.
Assist others as needed.

Financial Management for Managers Participant’s Workbook
Lesson 8—4 Institute of Child Nutrition
Production Task Schedule Example, continued
Position Time
6:00
a.m.
6:30
a.m.
7:00
a.m.
7:30 a.m. 8:00
a.m.
8:30
a.m.
9:00
a.m.
9:30
a.m.
10:00
a.m.
10:30
a.m.
11:00
a.m.
11:30
a.m.
Noon 12:30
p.m.
1:00
p.m.
1:30
p.m.
Employee
1
Serve
breakfast.
Complete
production
records
and
clean-up
serving
line.
Prepare Romaine salad blend.
Prepare fresh vegetables for garden
bar.
Wash fresh fruit.
Fill dressing and condiment
containers.
Set up garden
bar and record
temperatures.
Replenish
garden bar
and record
temperatures.
Complete production
records and clean-up
serving line.
Employee
2
Pan
three-bean
burrito and
refrigerate.
Pan pizza and
refrigerate.
Bake
three-bean
burritos and
record
temperatures.
Bake pizza and
record
temperatures.
Bake
three-bean
burritos and
record
temperatures.
Bake pizza and
record
temperatures.
Complete production
records and clean-up
serving line.
Full-Time Equivalent (FTE)
Full-Time Equivalent (FTE) is a measure used to translate the number of hours worked into full-
time equivalent hours. Generally, an FTE of 1.0 is equivalent to one full-time employee.
Holidays, sick leave, vacation, and other paid time off are not considered in FTE since that is
time paid for but not worked.
(Workbook Activity): FTE Calculations Worksheet Complete the calculations.

Participant’s Workbook Financial Management for Managers
Institute of Child Nutrition Lesson 8—5
FTE Calculations Worksheet
Directions: Complete the calculations.
You have been asked to determine the total FTEs for your school nutrition operation. You have
various work schedules for your employees. For this example, full-time equivalents are
calculated using 40 hours a week as the standard. There are currently 12 employees on staff:
Group A: 3 employees work 8 hours per day, 5 days per week
Group B: 3 employees work 4 hours per day, 5 days per week
Group C: 3 employees work 6 hours per day, 3 days per week
Group D: 3 employees work 2 hours per day, 5 days per week
Scenario: Total Hours Worked Per Day
Number of Employees
x Hours Worked per Day
= Total Hours per Day
Group A
x
Hours/Day
=
Total
Hours/Day Group A
Group B
x Hours/Day
=
Total
Hours/Day Group B
Group C
x
Hours/Day
=
Total Hours/Day
Group C
Group D
x
Hours/Day
=
Total
Hours/Day Group D
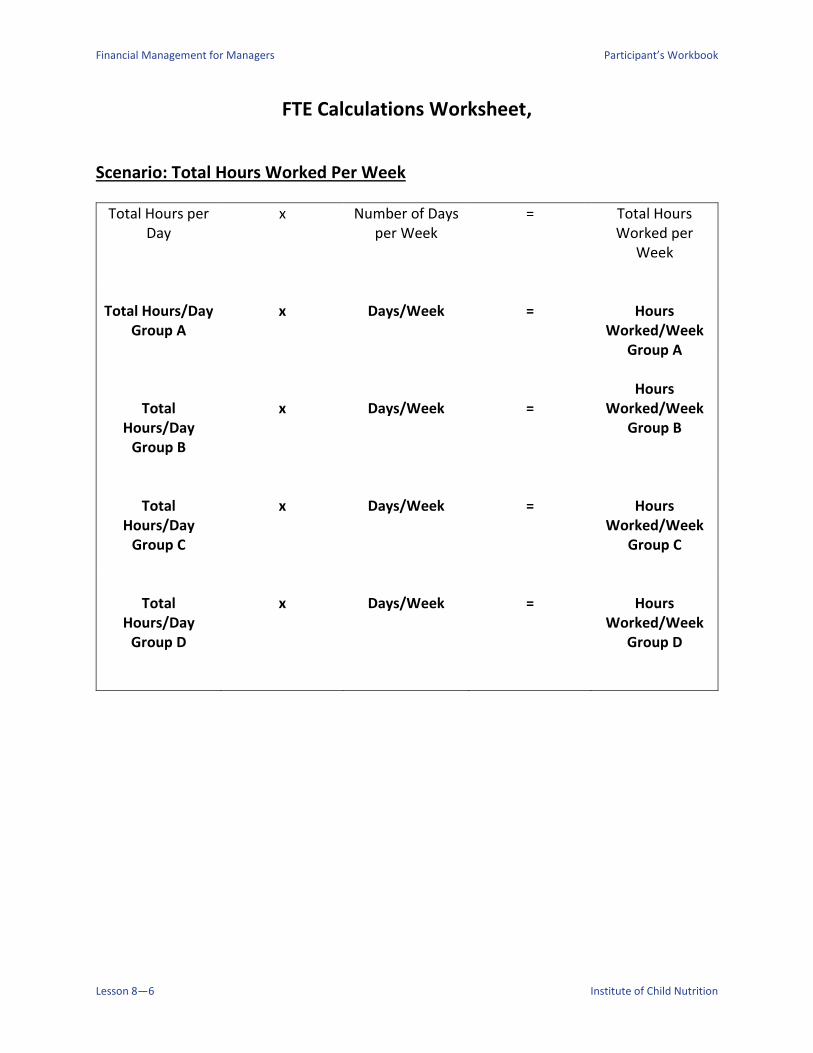
Financial Management for Managers Participant’s Workbook
Lesson 8—6 Institute of Child Nutrition
FTE Calculations Worksheet,
Scenario: Total Hours Worked Per Week
Total Hours per Day
x Number of Days per Week
= Total Hours Worked per
Week
Total Hours/Day
Group A
x
Days/Week
=
Hours
Worked/Week Group A
Total Hours/Day
Group B
x
Days/Week
=
Hours
Worked/Week Group B
Total
Hours/Day Group C
x
Days/Week
=
Hours
Worked/Week Group C
Total Hours/Day
Group D
x
Days/Week
=
Hours
Worked/Week Group D

Participant’s Workbook Financial Management for Managers
Institute of Child Nutrition Lesson 8—7
FTE Calculations Worksheet, continued
Scenario: Total Hours Worked Per Week (All Groups)
Group A
Hours Worked/Week
Group A
+
+
Group B
Hours Worked/Week
Group B
+
+
Group C
Hours Worked/Week
Group C
+
+
Group D
Hours Worked/Week
Group D
=
=
Total Hours
Worked /Week
Total Hours
Worked Week
(All Groups)
Scenario: Total FTEs
Total Hours Worked
per/Week
÷ Hours FTE = Total FTEs
Total Hours Worked /Week
All Groups
÷
Hours FTE
=
Total FTEs
Financial Management for Managers Participant’s Workbook
Lesson 8—8 Institute of Child Nutrition
Meals Per Labor Hour
Meals per labor hour (MPLH) is a productivity index that is measured by dividing the total meal
equivalents for a given period of time by the total number of productive paid labor hours for
the same period. Meal equivalent calculations may vary from state to state based upon
established standards. Check with your State agency for guidelines.
Productive labor hours are the actual hours assigned to a local school site and include all labor
charged to and paid for by the SNP for work performed. If workers are paid for sick leave and a
substitute is paid, then only the substitute labor should be included in the formula. While this
may be difficult to calculate, sick leave should not be considered productive labor as it will
distort the picture.
What are some reasons for reducing labor cost?
What are some ways to increase participation or MPLHs?
(Workbook Activity): Meals Per Labor Hour Worksheet Complete the calculations.

Participant’s Workbook Financial Management for Managers
Institute of Child Nutrition Lesson 8—9
Meals Per Labor Hour Worksheet
Scenario: ABC Elementary
Directions: Complete the calculation.
The school nutrition manager at ABC Elementary School and the district school nutrition
administrator agreed that there is a need to increase productivity at the SNP site. The school
nutrition manager reviewed the following information to analyze the existing productivity
index.
ABC Elementary School set a goal of 17 MPLH based on the type of meal service offered.
Based on lunch, breakfast, snacks, and other sales, your calculations indicate 667 Meal
Equivalents for this day.
For this example, the current productive labor is 49 hours for a day. This includes all
school nutrition employees including the manager.
Round your answers to the nearest whole number.
Desired Meal Per Labor Hours
ME
÷ Desired MPLH
= Desired Total Number of Labor Hours Day
Total ME Day
÷
Total Labor Hours Day
=
Desired Total Number of
Labor Hours Day

Financial Management for Managers Participant’s Workbook
Lesson 8—10 Institute of Child Nutrition
Meals Per Labor Hour Worksheet, continued
Labor Hours to Reduce
Current Labor Hours Day
- Desired MPLH
= Labor Hours to Reduce
Current Labor Hours Day
-
Desired Total Number of
Labor Hours Day
=
Labor Hours to Reduce

Participant’s Workbook Financial Management for Managers
Institute of Child Nutrition Lesson 8—11
Conclusion
Look at all the take-home messages you can utilize to forecasting accurate quantities of food.
Topics covered in this training included:
Financial Management
Production Records
Forecasting
Menu Item Costs
Product Screening
Inventory Control
Meal Equivalents
Labor Costs
In addition, by completing the activities and networking with your peers, you have gained
valuable information that will contribute to your effectiveness as a trainer. Remember,
successful trainers plan objectives, practice activities, and evaluate the outcomes. This
concludes today’s training.
(Activity): Post-Assessment and Evaluation Complete the post-assessment and the evaluation form.
Thank You
Thank you for your active participation and attention in the Forecasting the Procurement of
Foods training.

Financial Management for Managers Participant’s Workbook
Lesson 8—12 Institute of Child Nutrition

Participant’s Workbook Financial Management for Managers
Institute of Child Nutrition Reference—1
References
Institute of Child Nutrition. (2017). Foundations for training excellence: Basics instructor’s
manual. University, MS: Author.
Institute of Child Nutrition. (2017). Forecasting the procurement of foods instructor’s manual.
University, MS: Author.
United States Department of Agriculture. (2016). National school lunch, special milk, and school
breakfast programs, national average payments/maximum reimbursement rates (July 1,
2016 - June 30, 2017). Retrieved from https://www.fns.usda.gov/school-meals/fr-
080516
United States Department of Agriculture. (2015). Professional standards for school nutrition
professionals. Retrieved from http://professionalstandards.nal.usda.gov
United States Department of Agriculture. (2016). USDA foods product information sheets.
Retrieved from https://www.fns.usda.gov/fdd/nslp-usda-foods-fact-sheets
United States Department of Agriculture. (2016). Value of donated foods notices. Retrieved
from https://www.fns.usda.gov/fdd/value-donated-foods-notices

Financial Management for Managers Participant’s Workbook
Reference—2 Institute of Child Nutrition

Participant’s Workbook Financial Management for Managers
Institute of Child Nutrition Appendix—1
Appendix
Standardized Recipes Sample Answer Key
3
Lunch Production Record Missing Elements Worksheet Answer Key
Forecasting Worksheet Answer Key
5
Purchasing Decision Worksheet Answer Key
Inventory Turnover Worksheet Answer Key 7
Meal Equivalents Worksheet Answer Key 11
Per Meal Cost Worksheet Answer Key 13
FTE Calculations Worksheet Answer Key 13
Meals Per Labor Hour Worksheet Answer Key 13

Financial Management for Managers Participant’s Workbook
Appendix—2 Institute of Child Nutrition

Participant’s Workbook Financial Management for Managers
Institute of Child Nutrition Appendix—3
Standardized Recipes Sample Answer Key
Directions: List the benefits of utilizing Standardized Recipes
Promote uniform quality of menu items. All products should be the same high quality.
Promote uniform quantity of menu items. Recipes should produce a specific designated
quantity.
Increase productivity of food preparation staff. Clarifying procedures through written
instructions on recipes improves efficiency and will contribute to improved financial
management.
Increase managerial productivity. Recipes eliminate guesswork in food ordering and
questions. Save money by controlling overproduction. Waste is controlled by producing
only the estimated number of portions needed. Save money by controlling inventory
levels. More “just-in-time” purchasing is possible.
Simplify menu item costing. Precise calculation of serving costs is very important.
Simplify training of production staff. Recipes with detailed procedures provide an
individualized training program for new staff.
Introduce a feeling of job satisfaction. Staff knows menu items will always be the same
quality.
Help insure the nutrient analysis of a recipe will be accurate provided the ingredients,
preparation methods, and serving size remain consistent.

Financial Management for Managers Participant’s Workbook
Appendix—4 Institute of Child Nutrition

Participant’s Workbook Financial Management for Managers
Institute of Child Nutrition Appendix—5
Lunch Production Record Missing Elements Worksheet Answer Key
Directions: Review the menu. Determine if all the elements of the production record are accurate and complete. If not, identify the missing information.
Menu: Chicken & Cheese Fajita with Roasted Peppers and Onions, (1 oz eq chicken + ½ oz eq cheese ¼ cup veg) Pinto beans, (¼ cup) Whole Wheat Roll, (1 oz eq) Chilled Pineapple, (½ cup) Variety of Milk (1 cup)
School/Site Name: Eagles Nest Elementary Date: Monday, October 7, 20xx Grade Group: *Answer: Not Completed Offer vs. Serve: Yes No *Answer: Not Completed Planned # Students to be served: 120 Actual # Students Served: 118 Planned # Adults to be served: 15 Actual # Adults Served: *Answer: Not Completed
Component/Item Recipe or Product #
Planned # Servings
Planned Portion
Size
Total Planned Quantity
Actual # Servings
Actual Quantity
Used Leftovers
Milk
1% plain 70 8 oz. 70 70 70 0
Fat-free, chocolate 65 8 oz. 65 62 62 3
Meat/Meat Alternate
Chicken & Cheese Fajita w/ Roasted Peppers and Onions (1 oz eq chicken + ½ oz eq cheese)
E-6
135
2 oz.
270 oz.
130
130 5
*Answer: Items for grain, vegetable subgroups, and fruit does not match menu.
Grain
Whole Wheat Tortilla
135 1 135 135 130 5
Vegetable Subgroups
Dark Green
Spinach/Romaine S-1 135 1 C 135 C 67.5 C 65 C 2 ½ C
Red/Orange
Tomato Salsa C-1 135 ¼ C 33 ¾ C 130 32 ½ C 1 ¼ C
Legumes
Black Beans L-5 135 ¼ C 33 ¾ C 130 32 ½ C 1 ¼ C
Starchy
Other
*Answer: Missing information on peppers & onions served with fajitas.
Fruit
Peach Cup 135 ½ C 67 ½ C 135 65 2 ½ C
Diced Pears 135 ½ C 67 ½ C 135 65 2 ½ C
*Answer: Actual servings do not match the actual quantity used and leftovers.
Condiment/Other
Ranch Dressing D-1 135 1 Tbsp 135 135 135 0
*Answer: No condiments noted on menu.
Answers are in bold, italic font, and marked with an asterisk.

Financial Management for Managers Participant’s Workbook
Appendix—6 Institute of Child Nutrition

Participant’s Workbook Financial Management for Managers
Institute of Child Nutrition Appendix—7
Forecasting Worksheet Answer Key
Scenario: Number of Servings to Prepare
Directions: Complete the calculations.
After reviewing the production records and ADP for the past 3 months, your estimated meal count is 750. This estimated count is increased because the school nutrition department has implemented nutrition education into the classroom and students are helping to plan healthier options. The weather is still very warm. The menu will be served on a Monday. The estimate serving percentages for each item is as follows:
50% (.50) Grilled Teriyaki Chicken Breast on Whole Grain Bun 40% (.40) Fish Tacos with a Whole Grain Tortilla 10% (.10) Chef Salad with Multi Grain Roll
To calculate the number of servings needed for each menu item, multiply the estimated percentage by the estimated total meal count to determine the number of servings to prepare. Estimated Percentage x Estimated Total Meal Count = Number of Servings to Prepare Forecast how much of these items will be prepared to meet the estimated 750 meal count.
Sample Forecasting Number of Servings to Prepare
Estimated Percentage
x Estimated Total Meal Count
= Number of Servings to
Prepare
750 Meal Count
x
50% Chicken Breast
=
375 Prepare
750
Meal Count
x 40%
Fish Tacos
= 300
Prepare
750 Meal Count
x
10% Chef Salad
=
75 Prepare

Financial Management for Managers Participant’s Workbook
Appendix—8 Institute of Child Nutrition
Forecasting Worksheet Answer Key, continued
Scenario: Extra Servings
Directions: Complete the calculations and answer the question(s) at the end of the activity. Whole grain-rich pasta served with turkey marinara is a popular menu item. The production record indicates to prepare 300 servings of the turkey marinara sauce and the whole grain-rich pasta. The staff determines there must be a mistakes and prepares 500 servings. You are concerned about food cost and want to illustrate the cost of over-production of the whole wheat pasta served with turkey marinara sauce.
A serving of turkey marinara sauce cost is $0.37 and whole grain-rich pasta is $0.08 for a total cost of $ 0.45.
The menu item will be served 36 times throughout the school year. Determine the Extra Servings Produced
Actual Quantity Prepared
- Estimated Quantity
= Extra Servings Produced
500
Servings -
300 Servings
=
200 Servings
Determine Cost of Extra Servings Produced
Extra Servings Produced
x Cost per Serving = Cost of Extra Servings
Produced
200 Servings
x
$ 0.45 Cost
=
$90.00 Extra Cost
Total Cost of Extra Servings
Cost of Extra Servings
Produced
x Number of Times Served
= Total Cost of Extra
$90.00 Extra Cost
x
36 Times Served
=
$3,240.00 Total Cost

Participant’s Workbook Financial Management for Managers
Institute of Child Nutrition Appendix—9
Forecasting Worksheet Answer Key, continued
Scenario: Batch Cooking
Batch cooking and “just-in-time” (JIT) cooking are terms often used interchangeably. These terms
refer to cooking in small quantities to maintain high quality throughout the serving period. The
amount prepared at a given time should not exceed what can be served or is needed on the line
in an established amount of time (15–30 minutes). Batch cooking ideally takes place continuously
throughout the meal service period to guarantee quality.
Directions: Complete the calculations.
To ensure the highest quality product and reduce waste, batch cooking is the standard procedure
in the school meals operation. The first meal service begins at 10:50 a.m., and the second meal
service begins at 11:20 a.m. Each pan of vegetable pizza takes 10 minutes to cook and 5 minutes
to record temperatures.
Pizza appears on the menu 30 times throughout the school year. Before the employees practiced batch cooking, the production records indicated 20
individual pizzas left at the conclusion of meal service. After implementing batch cooking, only 3 individual pizzas are left. The individual cost of a pizza is $0.79.
Pizza Savings
Leftover Pizza Count Before Batch Cooking
- Leftover Pizza After Batch
Cooking
= Extra Pizzas Produced prior
to Batch Cooking
20 Extra Pizzas
-
3 Extra Pizzas
=
17 Extra Pizzas
Total Reduced Pizza Count
Extra Pizzas Produced
x Number of Times Served
= Total Reduced Pizza Count
17
Extra Pizzas
x
30
Times Served
=
510
Pizzas
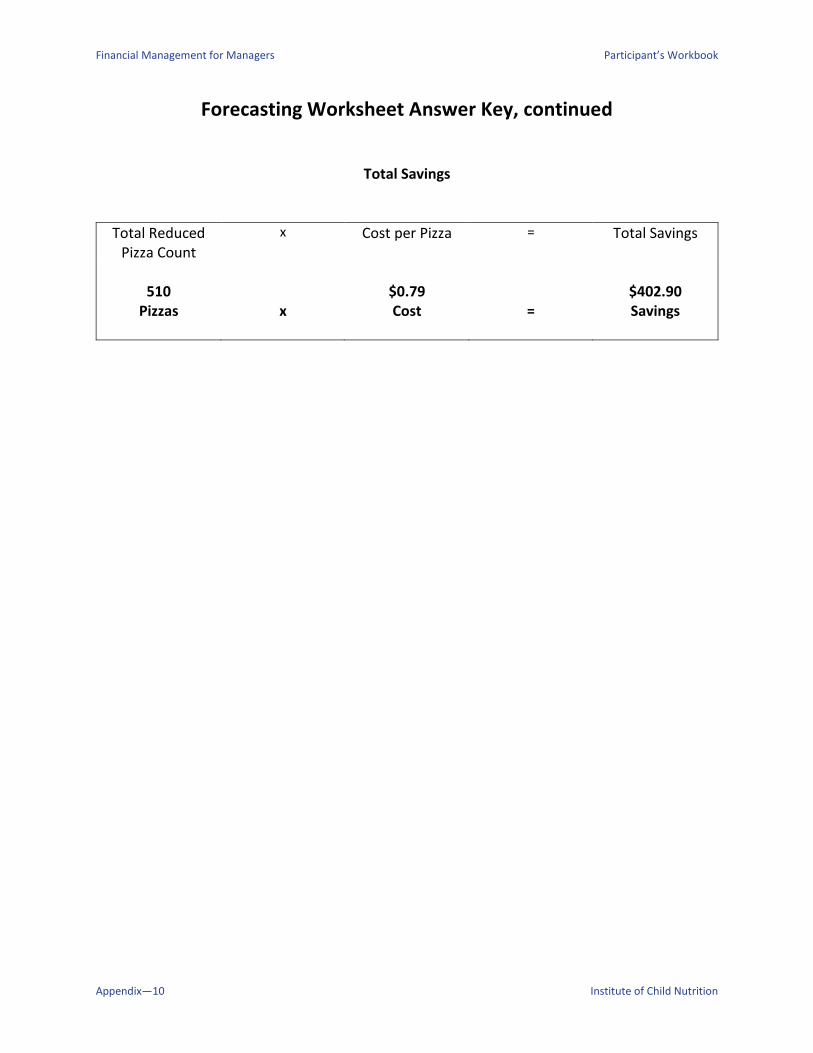
Financial Management for Managers Participant’s Workbook
Appendix—10 Institute of Child Nutrition
Forecasting Worksheet Answer Key, continued
Total Savings
Total Reduced Pizza Count
x Cost per Pizza = Total Savings
510
Pizzas
x
$0.79 Cost
=
$402.90 Savings
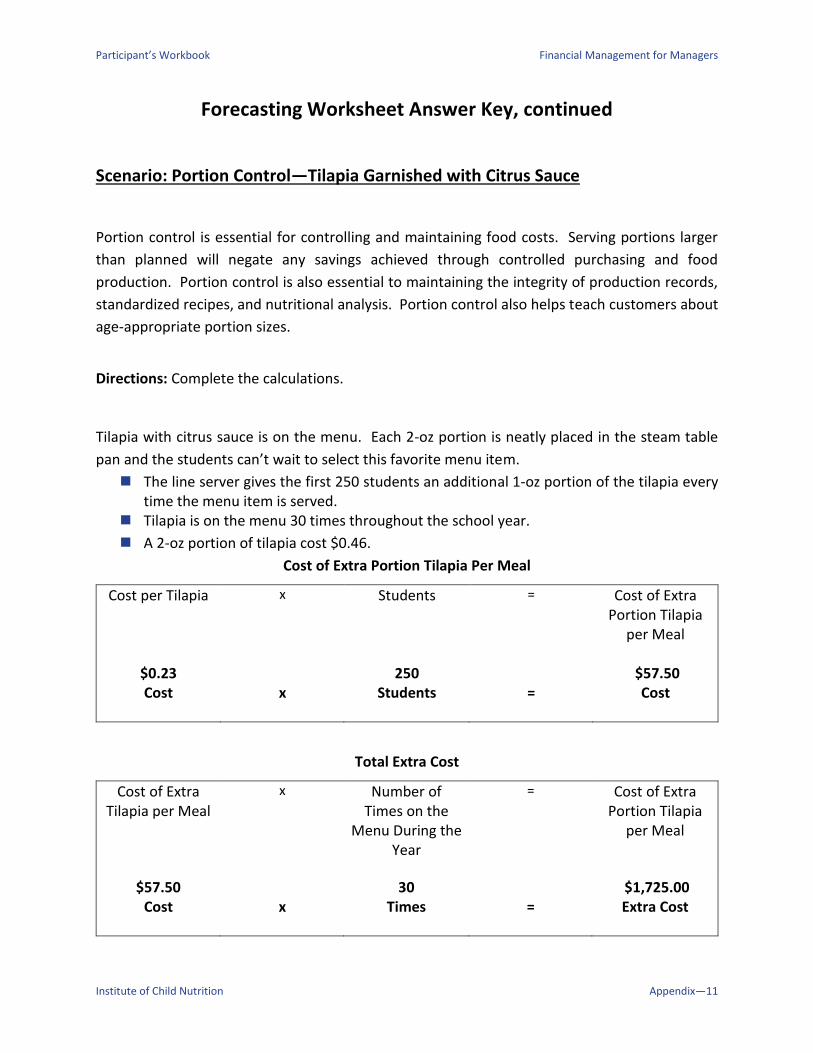
Participant’s Workbook Financial Management for Managers
Institute of Child Nutrition Appendix—11
Forecasting Worksheet Answer Key, continued
Scenario: Portion Control—Tilapia Garnished with Citrus Sauce
Portion control is essential for controlling and maintaining food costs. Serving portions larger
than planned will negate any savings achieved through controlled purchasing and food
production. Portion control is also essential to maintaining the integrity of production records,
standardized recipes, and nutritional analysis. Portion control also helps teach customers about
age-appropriate portion sizes.
Directions: Complete the calculations.
Tilapia with citrus sauce is on the menu. Each 2-oz portion is neatly placed in the steam table
pan and the students can’t wait to select this favorite menu item.
The line server gives the first 250 students an additional 1-oz portion of the tilapia every time the menu item is served.
Tilapia is on the menu 30 times throughout the school year.
A 2-oz portion of tilapia cost $0.46.
Cost of Extra Portion Tilapia Per Meal
Cost per Tilapia
x Students = Cost of Extra Portion Tilapia
per Meal
$0.23 Cost
x
250 Students
=
$57.50 Cost
Total Extra Cost
Cost of Extra Tilapia per Meal
x Number of Times on the
Menu During the Year
= Cost of Extra Portion Tilapia
per Meal
$57.50 Cost
x
30 Times
=
$1,725.00 Extra Cost

Financial Management for Managers Participant’s Workbook
Appendix—12 Institute of Child Nutrition

Participant’s Workbook Financial Management for Managers
Institute of Child Nutrition Appendix—13
Purchasing Decisions Answer Key
Directions: Complete the steps to calculate the cost of a product.
Scenario: Purchasing Decision: Broccoli
For an upcoming menu, the manager is determining whether to order untrimmed fresh broccoli
or trimmed fresh broccoli florets. Both products are acceptable.
Broccoli, fresh, untrimmed
100–½ cup EP servings will require 19.75 lb of AP product
Cost per pound is $1.29 lb
Requires 60 minutes of labor before portioning into ½ cup serving size
Labor cost $11.70/60 minutes
Cost of Broccoli, Fresh, Untrimmed
Amount of Broccoli to Purchase
x Cost per Pound = Purchase Cost of Broccoli, fresh,
untrimmed
19.75 lb x $1.29 per lb = $25.48
Purchase Cost
Cost of Broccoli, Fresh, Untrimmed with Labor
Cost of Broccoli, fresh,
untrimmed + Labor Cost =
Total Cost of Broccoli, fresh,
untrimmed
$25.48 Purchase Cost
+
$11.70 per 60 Minutes
=
$37.18 Total Cost

Financial Management for Managers Participant’s Workbook
Appendix—14 Institute of Child Nutrition
Purchasing Decisions Worksheet Answer Key, continued
Broccoli, fresh, florets, trimmed, ready-to-use
100–½ cup EP servings will require 7 lb of AP product
Cost per pound is $2.08 lb
Requires 15 minutes of labor before portioning into ½ cup serving size.
Labor cost $11.70/60 minutes or $2.93/15 minutes
Cost of Broccoli, Fresh, Florets, Trimmed, Ready-to-Use
Amount of Broccoli to Purchase
x Cost per Pound = Purchase Cost of Broccoli, fresh,
florets, trimmed
7 lb x $2.08 per lb = $14.56
Purchase Cost
Cost of Broccoli, Fresh, Florets, Trimmed with Labor
Cost of Broccoli, fresh, trimmed
+ Labor Cost = Total Cost of
Broccoli, fresh, florets, trimmed
$14.56 Cost + $2.93 per
15 Minutes =
$17.49 Total Cost
Which product is less expensive?
Answer:
Broccoli, fresh, florets, trimmed, ready-to-use
What are the factors to consider before deciding to purchase one product over the other?
Example responses
Labor cost Storage space

Participant’s Workbook Financial Management for Managers
Institute of Child Nutrition Appendix—15
Inventory Turnover Worksheet Answer Key
Directions: Complete the calculations.
April Purchases
Company Purchase Foods
XYZ Foods $20,000.00
ABC Dairy $ 3,000.00
GH Bakery $ 2,000.00
USDA Foods Received Value $ 5,000.00
Add the XYZ Foods, ABC Dairy, and GH Bakery purchase to determine the Total
Purchased Foods.
Add the Total Purchased Foods and the USDA Foods Value Received to determine the
Value of April Foods available.
Total of Food Purchased for April
XYZ Purchases
+ ABC Dairy Purchases
+ GH Bakery Purchases
= Purchased Foods Total
$20,000.00 Purchases
+
$ 3,000.00 Purchases
+
$ 2,000.00 Purchases
=
$25,000.00 April
Purchases
Value of April Foods
Purchased Foods Total
+ USDA Foods Received Value
= Value of April Foods Total
$25,000.00
April Purchases
+
$5,000.00
USDA Foods
=
$30,000.00
Value of April Foods
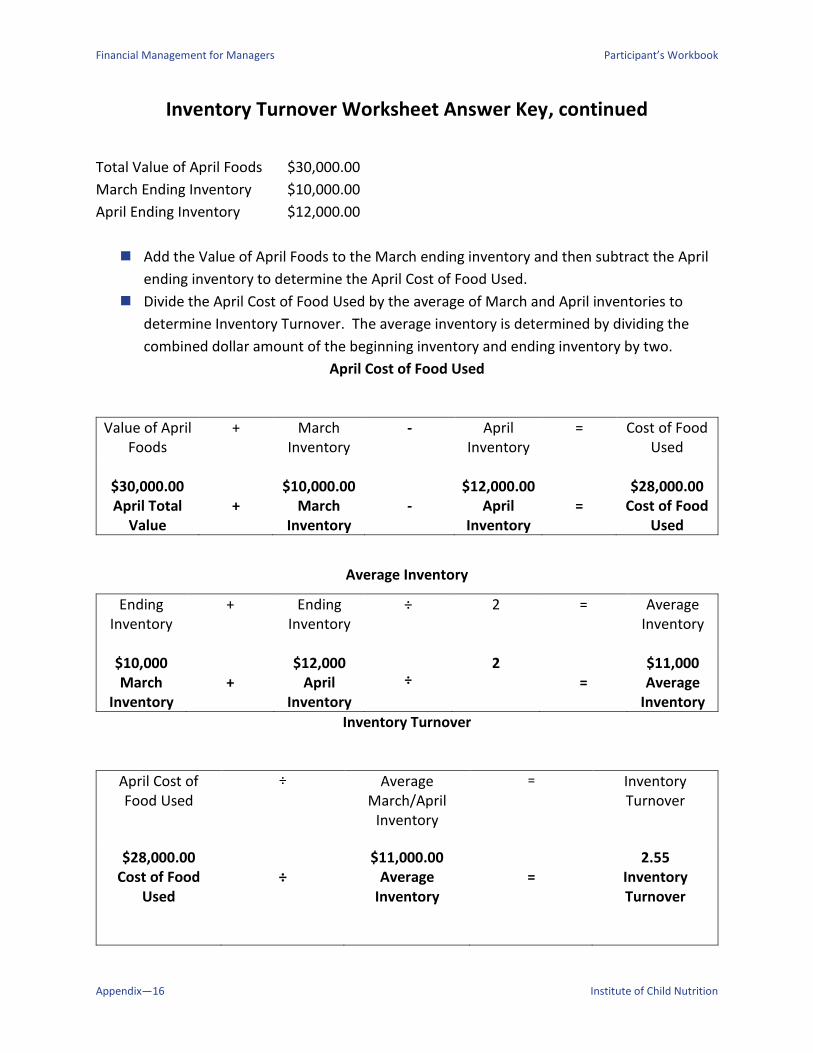
Financial Management for Managers Participant’s Workbook
Appendix—16 Institute of Child Nutrition
Inventory Turnover Worksheet Answer Key, continued
Total Value of April Foods $30,000.00
March Ending Inventory $10,000.00
April Ending Inventory $12,000.00
Add the Value of April Foods to the March ending inventory and then subtract the April
ending inventory to determine the April Cost of Food Used.
Divide the April Cost of Food Used by the average of March and April inventories to
determine Inventory Turnover. The average inventory is determined by dividing the
combined dollar amount of the beginning inventory and ending inventory by two.
April Cost of Food Used
Value of April Foods
+ March Inventory
- April Inventory
= Cost of Food Used
$30,000.00 April Total
Value
+
$10,000.00
March Inventory
-
$12,000.00
April Inventory
=
$28,000.00
Cost of Food Used
Average Inventory
Ending Inventory
+ Ending Inventory
÷ 2
= Average Inventory
$10,000 March
Inventory
+
$12,000 April
Inventory
÷
2
=
$11,000 Average
Inventory
Inventory Turnover
April Cost of Food Used
÷ Average March/April
Inventory
= Inventory Turnover
$28,000.00 Cost of Food
Used
÷
$11,000.00 Average
Inventory
=
2.55 Inventory Turnover

Participant’s Workbook Financial Management for Managers
Institute of Child Nutrition Appendix—17
Meal Equivalents Worksheet Answer Key
Scenario: Breakfast Meal Equivalents
Directions: Complete the calculations. It is important to recognize not all states and school
districts convert adult meals to meal equivalents using the same method. For this reason, check
with your State agency for guidance
For this example, a SNP served 239 students reimbursable breakfasts. For this activity please
round to the next whole number and use the following as a conversion factor.
1 lunch = 1 lunch meal equivalent
0.67 Conversion Factor = (3 breakfasts for every 2 lunches or 2 ÷ 3 = 0.67)
3 snacks = 1 lunch (1 divided by 3 = 0.33)
Nonprogram food sales = Revenue from food sales ÷ (Current free lunch reimbursement
+ current USDA Foods value/lunch)
Breakfast Meal Equivalents
Total Number of Breakfasts
Served
x Breakfast Conversion
Factor
= Meal Equivalents
239
Breakfast Served
x
0.67
Conversion Factor
=
160
Meal Equivalents
Note: Round Meal Equivalents Other Foods to nearest whole number.

Financial Management for Managers Participant’s Workbook
Appendix—18 Institute of Child Nutrition
Meal Equivalents Worksheet Answer Key, continued
Scenario: After School Snacks
Directions: Complete the calculations. It is important to recognize not all states and school
districts convert adult meals to meal equivalents using the same method. For this reason, check
with your State agency for guidance
Afterschool snacks give children a nutritional boost and draw them into supervised activities that
are safe, fun, and filled with learning opportunities. Using this equivalency, snacks can be
converted to meal equivalents.
Conversion Factor
For this example, the SNP served 450 reimbursable afterschool snacks. For this activity please
round to the next whole number and use the following as a conversion factor.
1 lunch = 1 lunch meal equivalent
0.67 Conversion Factor = (3 breakfasts for every 2 lunches or 2 ÷ 3 = 0.67)
3 snacks = 1 lunch (1 divided by 3 = 0.33)
Nonprogram food sales = Revenue from food sales ÷ (Current free lunch reimbursement
+ current USDA Foods value/lunch)
Calculating Meal Equivalents for Afterschool Snacks
Number of Snacks Served
x Afterschool Snack
Conversion Factor
= Meal Equivalents
450
Snacks Served
x
0.33
Conversion Factor
=
149
Meal Equivalents
Note: Round Meal Equivalents Other Foods to nearest whole number.

Participant’s Workbook Financial Management for Managers
Institute of Child Nutrition Appendix—19
Meal Equivalents Worksheet Answer Key, continued
Scenario: NonProgram Food Sales
Directions: Complete the calculations. It is important to recognize not all states and school
districts convert adult meals to meal equivalents using the same method. For this reason, check
with your State agency for guidance.
Nonprogram food sales are all foods and beverages sold in the school nutrition operation other
than reimbursable meals. Examples of nonprogram foods are a la carte, second student meals,
and special function meals. Meal equivalent calculations for all nonprogram food sales are based
on the annual federal reimbursement rate for students eligible for free lunch plus the entitlement
USDA Foods value. The revenue from nonprogram food sales can be converted to meal
equivalents.
The school nutrition operation sold nonprogram food items on a given day that totaled
$434.00 in revenue
SY 2016-2017 NSLP $ 3.22 (Free Lunch Reimbursement plus 6 cents)
SY 2016-2017 USDA (Entitlement) Foods Value $0.23
Convert the revenue from nonprogram food sales to meal equivalents.
Calculating Meal Equivalents for Nonprogram Food Sales
3.22 Free Lunch
+
$0.23
USDA Food Value
=
$3.45
Revenue
$434.00 Nonprogram Food Sales
÷
$3.45
Revenue
=
126
Meal Equivalents Other Foods
Note: Round Meal Equivalents Other Foods to nearest whole number.

Financial Management for Managers Participant’s Workbook
Appendix—20 Institute of Child Nutrition
Per Meal Cost Worksheet Answer Key
Scenario: Determine the Expenditures for Period.
Directions: Complete the calculations. It is important to recognize not all states and school
districts calculate per meal cost using the same method. For this reason, check with your State
agency for guidance.
Calculating Per Meal Cost
Meal cost is determined by dividing total expenditures by total meal equivalents. Meal cost can
be calculated for any accounting period the school nutrition manager wishes to analyze. The
example below provides an explanation of the total process for calculating the cost to produce
a meal for a given period of time. To calculate Per Meal Cost
Determine the expenditures.
Calculate all meals and meal equivalents.
Total all meal equivalents and lunches together.
Divide total expenditures by total meal equivalents.
Calculations made at the school level serve as a tool for evaluating expenditures at that site.
They may not necessarily reflect all costs associated with the district’s school nutrition
operation. Expenses may go beyond food and labor. Some other allowable school nutrition
expenses include: supplies, equipment, purchased services, property repair and maintenance,
electricity, fuel, water, transportation (e.g., fuel and oil), professional development, and
indirect costs.

Participant’s Workbook Financial Management for Managers
Institute of Child Nutrition Appendix—21
Per Meal Cost Worksheet Answer Key, continued
For this example, the staff gathered all the daily cost information, including the following:
Food Costs $ 1,089.00
Labor Costs $ 1,189.50
Professional Development (PD) Costs $ 18.00
General Supplies Cost $ 80.20
Indirect Costs $ 217.15
Determine the Expenditures for Period
Food Costs
+ Labor Cost
+ PD Cost
+ General Supplies
+ Overhead Costs
= Total Expenditures
$1,089.00 Food Cost
+
$1,189.50 Labor Cost
+
$18.00 Professional
Development Cost
+
$80.20 General Supplies
+
$217.15 Indirect
Cost
=
$2,593.85 Total
Expenditures
Scenario:
Calculate all Meals and Meal Equivalents.
After the total expenditures were calculated, the number of meal equivalents for each type of
service was determined.
In ABC Elementary School, school nutrition staff members concerned about plate costs in their
school decided to analyze meal costs on a daily basis.
On this particular day, the school nutrition operation served
700 student lunches
$93.00 in adult lunch sales
239 breakfasts
54 snacks in the afterschool care program

Financial Management for Managers Participant’s Workbook
Appendix—22 Institute of Child Nutrition
Per Meal Cost Worksheet Answer Key, continued
Conversion Factor
For this example, a school nutrition program served 358 student reimbursable breakfasts. For
this activity please round to the next whole number and use the following as a conversion
factor.
1 lunch = 1 lunch meal equivalent
0.67 Conversion Factor = (3 breakfasts for every 2 lunches or 2 ÷ 3 = 0.67)
3 snacks = 1 lunch (1 divided by 3 = 0.33)
Nonprogram food sales = Revenue from food sales ÷ (Current free lunch reimbursement
+ current USDA Foods value/lunch)
Lunch Meal Equivalents
Total Number of Lunches Served
x Lunch Conversion
Factor
= Meal Equivalents
700
Lunch Served
x
1.00
Conversion Factor
=
700 MEs
Lunches

Participant’s Workbook Financial Management for Managers
Institute of Child Nutrition Appendix—23
Per Meal Cost Worksheet Answer Key, continued
Nonprogram Food Sales Meal Equivalents Adult Sales (MEs)
Nonprogram Foods
÷ (Free Lunch Reimbursement
+ USDA Foods Value)
= Meal Equivalents
$93.00 Adult Lunch
Sales
÷
($3.22 Free Lunch
+
$0.23) USDA Foods Value
=
27 MEs
Adult Sale
Breakfast Meal Equivalents
Total Number of Breakfasts Served
x Breakfast Conversion Factor
= Meal Equivalents
239
Breakfast Served
x
0.67
Conversion Factor
=
160 MEs
Breakfast
Afterschool Snacks Meal Equivalents (MEs)
Number of Snacks Served
x Afterschool Snack
Conversion Factor
= Meal Equivalents
54
Snacks Served
x
0.33
Conversion Factor
=
18
MEs Afterschool
Snacks

Financial Management for Managers Participant’s Workbook
Appendix—24 Institute of Child Nutrition
Per Meal Cost Worksheet Answer Key, continued
Total Meal Equivalents (MEs)
Lunch + Adult Lunch Sale
+ Breakfast + After School Snacks
= Total Meal Equivalents
700 MEs
Lunches
+
27 MEs
Adult Sales
+
160 MEs
Breakfast
+
18 MEs
Afterschool Snacks
=
905 Total MEs
Scenario: Calculating Per Plate Meal Cost
Based on the staff’s daily cost information, the manager determined that expenditures totaled
$2593.85 and the total meal equivalents totaled 908 for the period. To find the per meal cost,
divide the total expenditures for the period by the total meal equivalents. This tells the school
nutrition manager the cost of producing a meal equivalent on a per-plate basis for the period of
time being analyzed.
Per Meal Cost
Total Expenditures
÷ Total Meal Equivalents
= Meal Cost
$2, 593.85 Total
Expenditures
÷
905 Total MEs
=
$2.87 Meal Cost

Participant’s Workbook Financial Management for Managers
Institute of Child Nutrition Appendix—25
FTE Calculations Worksheet Answer Key
Directions: Complete the calculations.
You have been asked to determine the total FTEs for your school nutrition operation. You have
various work schedules for your employees. For this example, full-time equivalents are
calculated using 40 hours a week as the standard. There are currently 12 employees on staff:
Group A: 3 employees work 8 hours per day, 5 days per week
Group B: 3 employees work 4 hours per day, 5 days per week
Group C: 3 employees work 6 hours per day, 3 days per week
Group D: 3 employees work 2 hours per day, 5 days per week
Scenario: Total Hours Worked Per Day
Number of Employees
x Hours Worked per Day
= Total Hours per Day
3
Group A
x
8 Hours/Day
=
24 Total
Hours/Day Group A
3
Group B
x 4 Hours/Day
=
12 Total
Hours/Day Group B
3 Group C
x
6
Hours/Day
=
18
Total Hours/Day
Group C
3 Group D
x 2 Hours/Day
=
6 Total
Hours/Day Group D
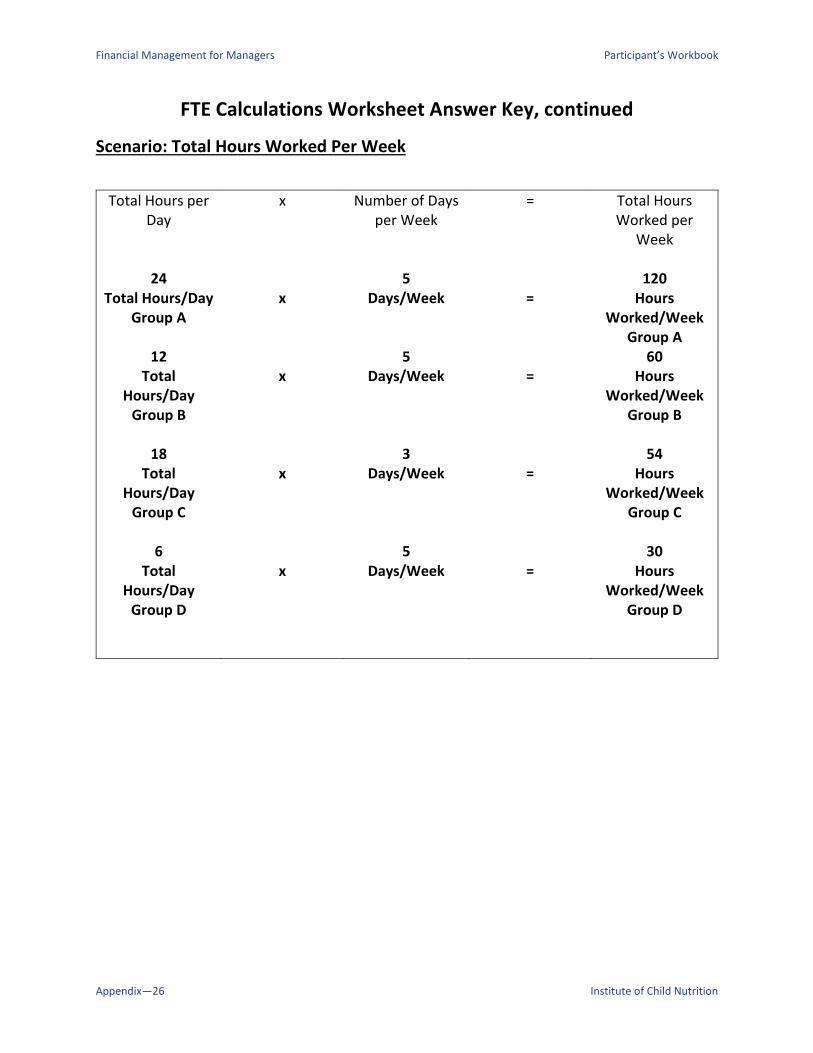
Financial Management for Managers Participant’s Workbook
Appendix—26 Institute of Child Nutrition
FTE Calculations Worksheet Answer Key, continued
Scenario: Total Hours Worked Per Week
Total Hours per Day
x Number of Days per Week
= Total Hours Worked per
Week
24 Total Hours/Day
Group A
x
5 Days/Week
=
120 Hours
Worked/Week Group A
12 Total
Hours/Day Group B
x
5 Days/Week
=
60 Hours
Worked/Week Group B
18
Total Hours/Day
Group C
x
3 Days/Week
=
54 Hours
Worked/Week Group C
6
Total Hours/Day
Group D
x
5 Days/Week
=
30 Hours
Worked/Week Group D

Participant’s Workbook Financial Management for Managers
Institute of Child Nutrition Appendix—27
FTE Calculations Worksheet Answer Key, continued
Scenario: Total Hours Worked Per Week (All Groups)
Group A
120 Hours
Worked/Week Group A
+
+
Group B
60 Hours
Worked/Week Group B
+
+
Group C
54 Hours
Worked/Week Group C
+
+
Group D
30 Hours
Worked/Week Group D
=
=
Total Hours
Worked /Week
264
Total Hours
Worked Week
(All Groups)
Scenario: Total FTEs
Total Hours Worked
per/Week
÷ Hours FTE = Total FTEs
264
Total Hours Worked /Week
All Groups
÷
40
Hours FTE
=
6.6
Total FTEs

Financial Management for Managers Participant’s Workbook
Appendix—28 Institute of Child Nutrition
Meals Per Labor Hour Worksheet Answer Key
Scenario: ABC Elementary
Directions: Complete the calculation.
The school nutrition manager at ABC Elementary School and the district school nutrition
administrator agreed that there is a need to increase productivity at the SNP site. The school
nutrition manager reviewed the following information to analyze the existing productivity
index.
ABC Elementary School set a goal of 17 MPLH based on the type of meal service offered.
Based on lunch, breakfast, snacks, and other sales, your calculations indicate 667 Meal
Equivalents for this day.
For this example, the current productive labor is 49 hours for a day, which includes all
school nutrition employees and the manager.
Round your answers to the nearest whole number.
Desired Meal Per Labor Hours
ME
÷ Desired MPLH
= Desired Total Number of Labor Hours Day
667 Total ME
Day
÷
17
Total Labor Hours Day
=
39
Desired Total Number of
Labor Hours Day

Participant’s Workbook Financial Management for Managers
Institute of Child Nutrition Appendix—29
Meals Per Labor Hour Worksheet Answer Key, continued
Labor Hours to Reduce
Current Labor Hours Day
- Desired MPLH
= Labor Hours to Reduce
49 Current Labor
Hours Day
-
39
Desired Total Number of
Labor Hours Day
=
10
Labor Hours to Reduce

Financial Management for Managers Participant’s Workbook
Appendix—30 Institute of Child Nutrition

Participant’s Workbook Financial Management for Managers
Institute of Child Nutrition
Financial Management for Managers Participant’s Workbook
The University of Mississippi
School of Applied Sciences
800-321-3054
www.theicn.org