Embed Size (px)
Citation preview

Financial Overview for Fiscal Year Ended March 31, 2013
Yutaka KobayashiPresident & Chief Operating OfficerKobayashi Pharmaceutical Co., Ltd.
May 2, 2013

2
Highlights of Consolidated Financial Results
FY ended March 2012 FY ended March 2013 Increase (decrease)Amount Margin Amount Margin Amount Percentage
SalesMillion yen
131,166%
-
Million yen
121,532%
-
Million yen
△9,634%
△7.3
Gross profit 76,531 58.3 69,799 57.4 △6,731 △8.8
Operating income 19,298 14.7 16,903 13.9 △2,394 △12.4
Ordinary income 20,092 15.3 18,677 15.4 △1,415 △7.0
Net income 11,726 8.9 12,176 10.0 450 3.8
EPS (yen) 286.36 - 297.37 - 11.01 3.8
Dividends (yen) 78 - 82 - 4 5.1
Net income increased for the 15th consecutive fiscal year. Dividend per share grew for the 14th consecutive fiscal year in real terms.
Both sales and profit decreased due to share transfer of a medical devices subsidiary and stagnant domestic sales.

193169
14.7
13.9
0
50
100
150
200
250
FY endedMarch 2009
FY endedMarch 2010
FY endedMarch 2011
FY endedMarch 2012
FY endedMarch 2013
9
12
15OperatingincomeOperatingmargin
1,2151,311
0
500
1,000
1,500
FY endedMarch 2009
FY endedMarch 2010
FY endedMarch 2011
FY endedMarch 2012
FY endedMarch 2013
3
Changes in Consolidated Results
Due to share transfer of a medical devices subsidiary (now Japan Medicalnext Co., Ltd.) and stagnant sales of cooling products, etc. during the 1st half in domestic consumer product business, both sales and profit decreased.
Sales Operating income(100 million yen) (100 million yen) (%)
Down 12.4%
Down 7.3%
188169
0
50
100
150
200
250
FY endedMarch 2009
FY endedMarch 2010
FY endedMarch 2011
FY endedMarch 2012
FY endedMarch 2013
1,2151,236
0
500
1,000
1,500
FY endedMarch 2009
FY endedMarch 2010
FY endedMarch 2011
FY endedMarch 2012
FY endedMarch 2013
4
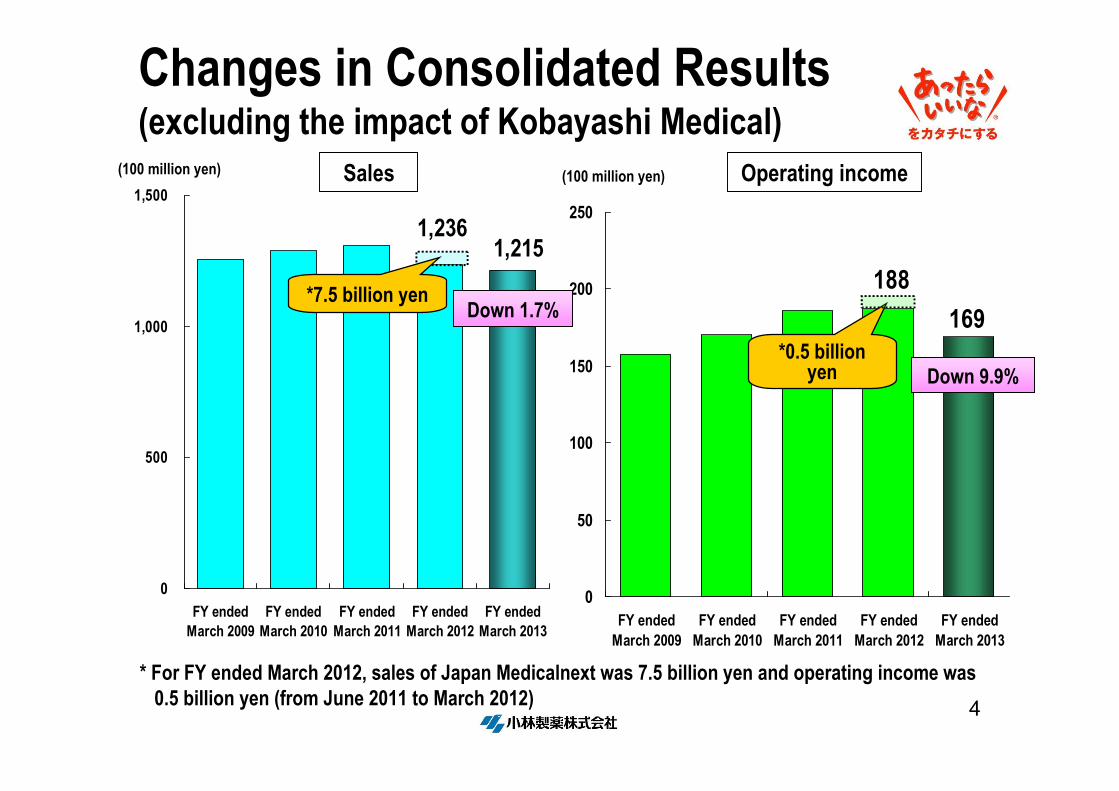
Changes in Consolidated Results (excluding the impact of Kobayashi Medical)
Sales Operating income(100 million yen) (100 million yen)
* For FY ended March 2012, sales of Japan Medicalnext was 7.5 billion yen and operating income was 0.5 billion yen (from June 2011 to March 2012)
*7.5 billion yen
*0.5 billion yen Down 9.9%
Down 1.7%

5
11528
5
193
12 8
169
0
50
100
150
200
9
Factor for decreaseFactor for increase
Impa
ct o
f sha
re tr
ansf
er o
f Ja
pan
Medi
caln
ext
Decr
ease
in o
pera
ting
inco
me a
long
with
sales
de
crea
se
Cost
redu
ctio
n
Rise
in ra
w m
ater
ial
price
s
Loss
on
disp
osal
of
inve
ntor
y
Sales
pro
mot
ion
& ad
verti
sing
expe
nses
Othe
r SGA
expe
nses
Oper
atin
g in
com
e for
FY
ende
d Ma
rch
2013
GP SGA expenses
Increase (Decrease) in Operating Income(100 million yen)
Oper
atin
g in
com
e for
FY
ende
d Ma
rch
2012
6
Consumer Products Business

7
Changes in Sales and Operating Income
1,1081,124
0
500
1,000
1,500
FY endedMarch 2009
FY endedMarch 2010
FY endedMarch 2011
FY endedMarch 2012
FY endedMarch 2013
183160
16.314.5
0
50
100
150
200
250
300
FY endedMarch 2009
FY endedMarch 2010
FY endedMarch 2011
FY endedMarch 2012
FY endedMarch 2013
0
5
10
15
20Operating incomeOperating margin
Sales Operating income(100 million yen) (100 million yen) (%)
Both sales and profit decreased due to stagnant sales of cooling products, etc. Overseas sales, mainly for body warmers, expanded.
Down 12.4%
Down 1.4%

8
Sales by Product Category
161
82
42
298
134
164
226
155
91
45
297
143
162
229
0 50 100 150 200 250 300 350
Body warmers
Food products
Household sundries
Deodorizing airfresheners
Sanitary products
Oral hygiene products
Pharmaceuticalproducts
FY endedMarch 2012FY endedMarch 2013
Up 1.1%
Up 3.7%
Down 8.5%
Up 0.3%
Down 1.4%
(100 million yen)
Down 6.2%
Down 9.3%
Sales of sanitary products decreased due to stagnant sales of cooling products, while sales of body warmers increased due to strong overseas performance.

9
Breakdown of Pharmaceutical Product Sales
11
15
23
30
36
41
11
14
26
26
39
46
0 10 20 30 40 50
Feminina Nanko
Nodonuru Spray
Inochi-no-Haha
External anti-inflammation analgesic
Nicitol
Eyebon
FY endedMarch 2012FY endedMarch 2013
(100 million yen)
Figures in brackets indicate shares in previous fiscal year.
Up 9.0%
Down 11.9%
Up 10.8%
Up 11.1%
Down 2.4%
Down 1.8%
61.9%(62.1%)
Eyewash
Sales volume: 22.6 billion yen(98.6% of previous fiscal year)
37.8%(35.1%)
Anti-obesity drugs
Steady sales of Eyebon and Inochi-no-Haha continued. Launch of Nicitol G increased the share for anti-obesity drugs.

10
Breakdown of Oral Hygiene Product Sales
16
24
34
35
55
14
26
33
38
54
0 10 20 30 40 50 60 70
Denture stabilizer
Interdental cleaner
Denture cleaner
Shoyo
Breath Care
FY endedMarch 2012FY endedMarch 2013
(100 million yen)
80.9%(81.4%)
26.1%(27.3%)
Up 10.7%
Up 8.8%
Mouth freshener
Denture cleaner
Figures in brackets indicate shares in previous fiscal year.
Sales volume: 16.4 billion yen(101.1% of previous fiscal year)
Down 1.2%
Down 3.4%
Down 13.4%
Due to improved awareness of the importance of oral care, stable sales continued for oral hygiene products.
11
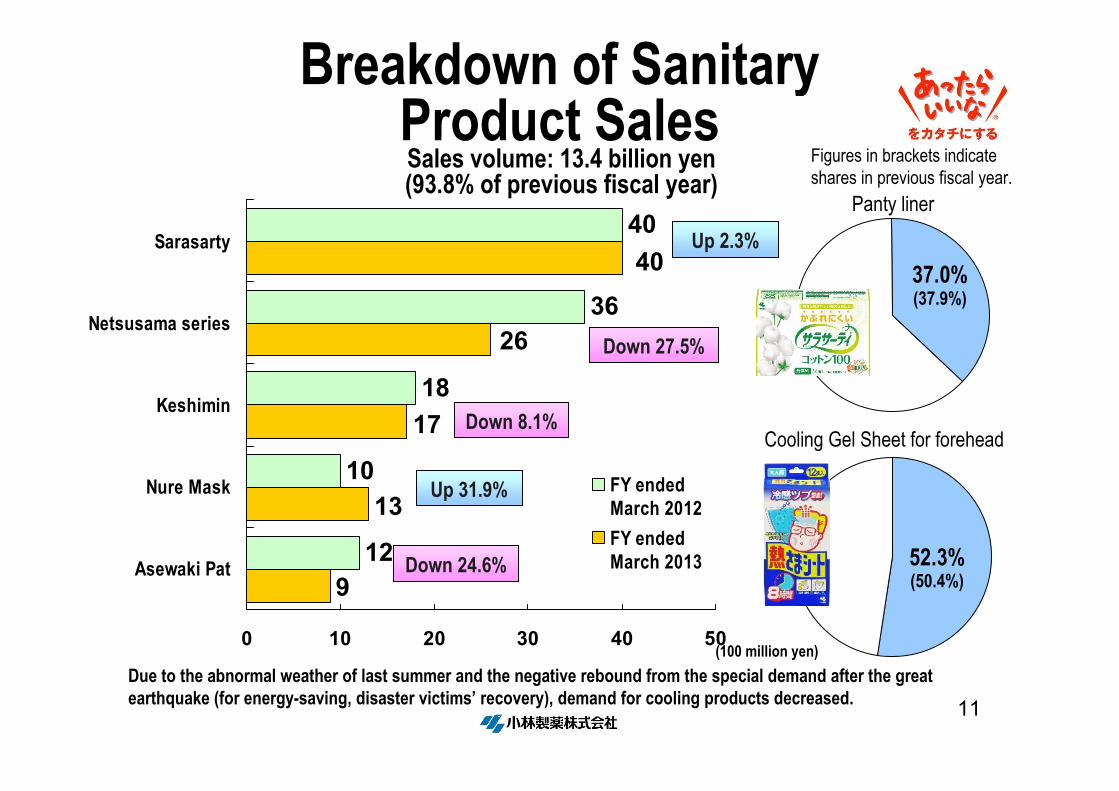
Breakdown of Sanitary Product Sales
12
10
18
36
40
9
13
17
26
40
0 10 20 30 40 50
Asewaki Pat
Nure Mask
Keshimin
Netsusama series
Sarasarty
FY endedMarch 2012FY endedMarch 2013
(100 million yen)
37.0%(37.9%)
52.3%(50.4%)
Down 24.6%
Down 8.1%
Due to the abnormal weather of last summer and the negative rebound from the special demand after the great earthquake (for energy-saving, disaster victims’ recovery), demand for cooling products decreased.
Cooling Gel Sheet for forehead
Figures in brackets indicate shares in previous fiscal year.
Panty liner
Sales volume: 13.4 billion yen (93.8% of previous fiscal year)
Up 2.3%
Up 31.9%
Down 27.5%

12
Breakdown of Deodorizing Air Freshener Sales
9
11
19
127
132
10
10
11
17
131
131
0 30 60 90 120 150
Toilet Sono Atoni
Sawaday Happy
Muko-kukan
Sawaday
Shoshugen
Bluelet
FY endedMarch 2012
FY endedMarch 2013
(100 million yen)
77.8%(76.0%)
31.2%(32.2%)
Up 2.7%
Down 13.6%
Deodorizing air freshener
Figures in brackets indicate shares in previous fiscal year.
Tank cleaner
Sales volume: 29.8 billion yen(100.3% of previous fiscal year)
Down 1.7%
Down 0.8%
Up 4.5%
Sales in the entire deodorizing air freshener market showed a rising trend in the 2nd half of the year.Shipment of Sawaday Happy and Shoshugen Kaoru Stick exceeded 1 billion yen.

13
Breakdown of Body Warmer Sales
7
4
11
27
106
4
5
12
38
102
0 30 60 90 120
Other
UK
China
US
Kiribai
FY endedMarch 2012FY endedMarch 2013
(100 million yen)
Up 40.6%
Down 4.4%
Up 12.0%
Up 16.1%28.0%(27.6%)
Sales of body warmers were stagnant in Japan due to the weather while overseas sales were good (due to contribution by Grabber Inc. in US)
Body warmers (Japan)
Figures in brackets indicate shares in previous fiscal year.
Sales volume: 16.1 billion yen (103.7% of previous fiscal year)

14
New Product Contribution Rate
25
21
5.17.5
15.317.5
0
10
20
30
40
FY endedMarch 2006
FY endedMarch 2007
FY endedMarch 2008
FY endedMarch 2009
FY endedMarch 2010
FY endedMarch 2011
FY endedMarch 2012
FY endedMarch 2013
0
10
20
30
40New products First yearFirst 4 years total
(Number of product items) (%)
25 new products were launched and their contribution rate increased for both first year and first four years total.

15
Promoting Reduction of Return Rate/Loss on Disposal
27
18
2.92.5
0
20
40
60
FY endedMarch 2006
FY endedMarch 2007
FY endedMarch 2008
FY endedMarch 2009
FY endedMarch 2010
FY endedMarch 2011
FY endedMarch 2012
FY endedMarch 2013
0
1
2
3
4
5Loss on disposalReturn rate
(%)(100 million yen)
Despite enhanced control of returns, inventory and disposal, returns/disposal of products for summer (cooling products) increased.

16
Changes in Overseas Business Results
81
95
0
20
40
60
80
100
FY endedMarch 2009
FY endedMarch 2010
FY endedMarch 2011
FY endedMarch 2012
FY endedMarch 2013
1.91
-6
-4
-2
0
2
4
6
FY endedMarch 2009
FY endedMarch 2010
FY endedMarch 2011
FY endedMarch 2012
FY endedMarch 2013
Sales Operating income/loss(after goodwill amortization)(100 million yen) (100 million yen)
Up 17.2%
Contribution by Grabber Inc. in US and sales expansion primarily of body warmers boosted overall sales.

17
• Sales increased through acquisition of Grabber Inc. (Jan. 2012), a company boasting robust distribution channels with sporting goods stores.
• Value packs and Disney design packages were launched for major mass retailers to promote daily consumer use.
• HeatMax, Inc.’s new plant started operation, increasing production capacity. (Aug. 2012)
North America
China • An economical type body warmer Nuan Bao Bao was launched for inland areas.
• TV advertisement using Dong Jie, famous Chinese actress, was launched nationwide.
• Sales promotion using “baozhu” (package columns) at stores and sales through recommendations expanded public recognition.Dong Jie Baozhu
To promote further sales of body warmers overseas, a product originating from Japanese traditional culture, steady progress was made through area-based marketing strategies.
Overseas Business: Body Warmers

18
By adopting integrated package designs, the brand’s basic concept was stabilized. Efforts began to establish usage for cooling fever in children and to propose other usages.
Southeast Asia• Modified, integrated package designs were adopted in phases throughout
the area to clearly indicate the features of “cooling well,” “effect lasting for a long time,” and “a gel product,” aiming to enhance the brand appeal.
• TV advertising was launched to encourage use for children who have a fever.
• In the growing markets of Hong Kong, Malaysia, etc., promotion for cooling in hot weather began, along with usage for cooling a fever.
CM featuring cooling fever
CM featuring cooling in hot weather
Overseas Business: Cooling Gel Sheet

19
Mail Order Business

20
Changes in Sales and Operating Income/Loss
103 101
0
30
60
90
120
FY endedMarch 2009
FY endedMarch 2010
FY endedMarch 2011
FY endedMarch 2012
FY endedMarch 2013
1.61.3
-5
0
5
FY endedMarch 2010
FY endedMarch 2011
FY endedMarch 2012
FY endedMarch 2013
1
Sales Operating income/Loss(100 million yen) (100 million yen)
Up 23.5%
Despite steady growth in sales of skin care products, including Hifmid, income decreased due to stagnant sales of nutritional supplements.
Down 1.9%

21
Hifmid series Up 10.0% from previous year
Glucosamine & Collagen Down 4.2% from previous year
• Slowdown in acquisition of new triers along with market expansion
• Intensifying competition is making product differentiation difficult.
• Offered trial and monitoring services to demonstrate product performance, succeeding in product differentiation and acquisition of new customers.
• Enhanced the series lineup from basic skin care products to lucent powder, to encourage use of a full lineup.
Status of Top 2 Selling Products

22
Medical Devices Business

23
Changes in Sales and Operating Income/Loss
24
104
0
50
100
150
FY endedMarch 2009
FY endedMarch 2010
FY endedMarch 2011
FY endedMarch 2012
FY endedMarch 2013
2.9
0.1
-6
-4
-2
0
2
4
6
FY endedMarch 2009
FY endedMarch 2010
FY endedMarch 2011
FY endedMarch 2012
FY endedMarch 2013
Sales Operating income/Loss(100 million yen) (100 million yen)
Income decreased due to transfer of shares of a medical devices subsidiary (now Japan Medicalnext Co., Ltd.)
*Transfer of the remaining shares owned is planned for May 20, 2013.

24
Policy and Forecasts for Fiscal Year Ending March 2014

25
Basic Policy for Current Fiscal YearUnder the principle of “Duty First, Profit Later,”
we aim to create value that can be achieved only by ourselves, and provide excellent customer satisfaction across the globe.
(1) Becoming a development-based company with infinite creativity
(2) Developing human resources and business culture that keep on trying
(3) Enhancing systems to take actions leading to results, based on speedy PDCA.

26
Highlights of Consolidated Financial Results
FY ended March 2013 FY ending March 2014 Increase (decrease)Amount Margin Amount Margin Amount Percentage
SalesMillion yen
121,532
%
-
Million yen
127,000%
-
Million yen
5,467
%
4.5
Gross profit 69,799 57.4 73,400 57.8 3,600 5.2
Operating income 16,903 13.9 17,700 13.9 796 4.7
Ordinary income 18,677 15.4 19,400 15.3 722 3.9
Net income 12,176 10.0 12,600 9.9 423 3.5
EPS (yen) 297.37 - 307.70 - 10.33 3.5
Dividends (yen) 82 - 82 - 0 0.0

27
Changes in Consolidated Results
1,215 1,270
0
500
1,000
1,500
2,000
FY endedMarch 2010
FY endedMarch 2011
FY endedMarch 2012
FY endedMarch 2013
FY endingMarch 2014
estimate
169 177
14.7 15.2
0
50
100
150
200
250
FY endedMarch 2010
FY endedMarch 2011
FY endedMarch 2012
FY endedMarch 2013
FY endingMarch 2014
estimate
0
5
10
15
20Operating income
Operating margin
Sales Operating income(100 million yen) (100 million yen) (%)
Up 4.5%Up 4.7%

28
Sales/Operating Income of Major Businesses
Sales Operating incomeFY ended
March 2013
FY ending March 2014
Compared with previous
year
FY ended March 2013
FY ending March 2014
Compared with previous
year
Consumer products 110,833 116,700 105.3 16.040 16,800 104.7
Overseas 9,557 12,000 125.6 98 150 153.1
Mail Order 10,180 11,000 108.1 163 300 183.0
(Amount: million yen Compared with previous year: %)

29
Business Strategies for Fiscal Year Ending March 2014

30
Improving quality/quantity of both purely new products and in-brand new products
Major new products for spring 2013
Health care products Household productsPurely new
products
SomethingNew
In-brand new
products
SomethingDifferent
Effects are expected from creating purely new products by establishing a new product development group and developing in-brand new products.
Enhancing New Product Development Capabilities

31
Along with the trend of searching not for “countermeasures” after getting ill but for the root “cause” to prevent illness, needs for Kampo to tackle the cause will increase.
<Kobayashi Pharmaceutical’s Kampo Medicines>
Enhancing Approaches for Kampo Herbal Medicine
*Products for limited areas included

32Offering high-quality, natural scent-oriented deodorizing air fresheners
Shoshugen Ki-no-aru Seikatsu
Shoshugen Kaoru Flower
• Interior deodorizing air freshener to diffuse sweet scent of natural hinoki/hiba cedar, in a warm wooden-touch case
• Presenting a relaxing living atmosphere that makes users feel like being surrounded by trees
• Interior deodorizing air freshener to diffuse sophisticated scent of natural sola flower perfume oil
• Together with Shoshugen Kaoru Stick, launched with the aim of expanding the market share of reasonable interior fragrance products.
Enhancing Approaches for Deodorizing Air Fresheners

33
Deodorizing Air Fresheners
8 9
8
31
19
39
24
9
21 26
Garigari-kun
CurrentShoshugen
10’s or younger 20’s 30’s 40’s 50’s 60’s or older
<Ages of Garigari-kun purchasers> Expanding users and usage scenarios
Products featuring characters succeeded in acquiring younger customers.Shoshugen Kaoru Stick has been accepted as a reasonably-priced
interior fragrance diffuser.
Products featuring characters
Shoshugen Kaoru Stick series(Customer survey by Kobayashi)
(Usage scenario)

34
Aiming to create a completely new market of deodorizers for clothes
Deo Inner
Men’s Asewaki Pat Riff
Anti-perspirants
Body
Preventingsweat/odor
Clothes
Newmarket
Body padsAftercare forsweat/odor
Clothesdeodorizing
spray
<Market for sweat/odor-related products> • Deodorizing spray for clothes,
with deodorizing effect lasting all day just by a spray in the morning• Containing ingredients that
remove odor-generating bacteria and germs
•A pad to be put on underwear, to prevent sweat stains and odors•Expanding the conventionally
female-dominated market to men.
Creating a market for men’s odor care

35
Efforts for 3 key regions to enhance sales of body warmers/cooling gel sheets
Through increasing dealerships and promoting collaboration between TV advertising and shop displays, encourage usage as a “habit.”
North America
China
Southeast Asia
•To promote daily use, make efforts to display products not only in sporting shop floors but also in places “visible” to customers, such as in front of cashiers.•Enhance cross-selling between HeatMax, Inc. and Grabber, Inc.
• Increase dealerships in inland cities (from pinpoint to widespread approach)•Expand recognition through offering samples and
recommendation services at stores.
•Enhance extended lineups for cooling gel sheets.•Enhance distribution of products for children and babies, through
presenting shop displays in line with TV advertising.
Approaches in Overseas Businesses

36
Through a shift in focus from brand management to customer management, encourage continuous purchasing of several items.
Customer services
Advertising/sales promotion
•A dedicated customer center with full-time pharmacists and skin care advisor offers total health support.•The order-receiving desk not only receives orders but also
serves as a call center offering consultations based on dialogues with customers.
Approaches in Mail Order Business
•Enhance sales promotion for existing customers by direct mail, offering products appropriate for their age and gender.•For the Hifmid series, employ web-based advertising such as
a Yahoo! brand panel.
Enhancing customer management to grasp each customer’s needs

37
Shareholder ReturnsShareholder Returns

38
Changes in Dividends and Payout Ratios
828278
26.627.627.2
0
20
40
60
80
100
FY endedMarch1999
FY endedMarch2001
FY endedMarch2003
FY endedMarch2005
FY endedMarch2007
FY endedMarch2009
FY endedMarch2011
FY endedMarch2013
0
10
20
30
40Dividend amount (left-hand scale)
Dividend payout ratio (right-hand scale)
(Yen) (%)
Dividend per share continues to increase in real terms.

39