Embed Size (px)
Citation preview
© 2012, NIIT Technologies Limited 1
January 15, 2013
NIIT Technologies
Financial Performance – Q3FY13
© 2012, NIIT Technologies Limited 2 © 2012, NIIT Technologies Limited
Outline
Financial Highlights
Business Update
Financial Statements
• Income Statement
• Balance Sheet
Business Analysis
Shareholding Pattern

© 2012, NIIT Technologies Limited 3 © 2012, NIIT Technologies Limited
Financial Highlights for Q3 FY13
• Consolidated Revenues at INR 5144 Mn – Up 2.9% QoQ, Up 18.8% YoY
– Constant currency growth at 4.4%
– Hedge loss of INR 22.5 Mn (LQ hedge loss of INR 90.2 Mn)
• Operating profits at INR 812 Mn – Down 4.2% QoQ, Up 4.1% YoY
– Operating Margins at 15.8%, Down 117 bps QoQ, Down 222 bps YoY
– Constant currency Operating Margin – 15.8%
• Net Profits at INR 560 Mn – Up 30% QoQ, Down 12.5% YoY
– Net Margins at 10.9%, Up 227 bps QoQ, Down 389 bps YoY
– Effective Tax Rate at 28.9% of PBT
• Order intake of $ 83Mn

© 2012, NIIT Technologies Limited 4 © 2012, NIIT Technologies Limited
Business Highlights for Q3 FY13
• BFSI Down 5.1% QoQ, Contributes 31% (LQ 33%)
• Decline in NITL revenues
• Transport Up 1.8% QoQ, Contributes 42% (LQ 42%)
• Scale up in top accounts
• $ 10 Mn+ renewal from existing client
• 1 new client added
• Manufacturing & Distt Up 4.9% QoQ, Contributes 6% (LQ 6%)
• Revenue up due to increase in revenues in accounts added in recent Qtrs.
• 2 new client added
• Government Up 56.2% QoQ, Contributes 8% (LQ 5%)
• CCTNS execution on track
• 1 new client added with order intake of $10 Mn

© 2012, NIIT Technologies Limited 5
Acknowledgements during the Quarter
• NIIT Technologies ranked No. 6 in DQ-CMR Best IT Employer Survey
2012

© 2012, NIIT Technologies Limited 6
Consolidated Quarterly Income Statement
Particulars Q3FY13 Q2FY13 QoQ% Q3FY11 YoY%
Gross Revenues 5,144 5,001 2.9% 4,330 18.8%
Direct Cost 3,383 3,203 5.6% 2,736 23.6%
Gross Profit 1,761 1,798 -2.1% 1,594 10.5%
GM% 34.2% 36.0% -173 Bps 36.8% -258 Bps
Selling / General And Administration 948 950 -0.2% 814 16.5%
SG&A to Revenue % 18.4% 19.0% -57 Bps 18.8% -36 Bps
Operating Profit 812 848 -4.3% 780 4.1%
OM% 15.8% 17.0% -117 Bps 18.0% -222 Bps
Depreciation and Amortization 142 138 2.6% 92 54.0%
Other Income (net) 126 (115) -209.2% 174 -27.9%
Profit Before Tax 796 595 33.8% 863 -7.7%
PBT % 15.5% 11.9% 358 Bps 19.9% -444 Bps
Provision for Tax 230 146 57.6% 224 2.7%
Minority Interest 6 18 -66.2% (2) -457.4%
Profit After Tax (after Minority Int.) 560 431 29.9% 640 -12.5%
PAT% 10.9% 8.6% 203 Bps 14.8% -389 Bps
EPS - INR
Basic 9.31 7.18 29.7% 10.77 -13.5%
• Lower QoQ operating margin due to slowdown in GIS, NITL and transition of new project in Morris.
• QoQ increase in other income as a result of gain on revaluation of current assets and liabilities resulting in higher net margins.
© 2012, NIIT Technologies Limited 7
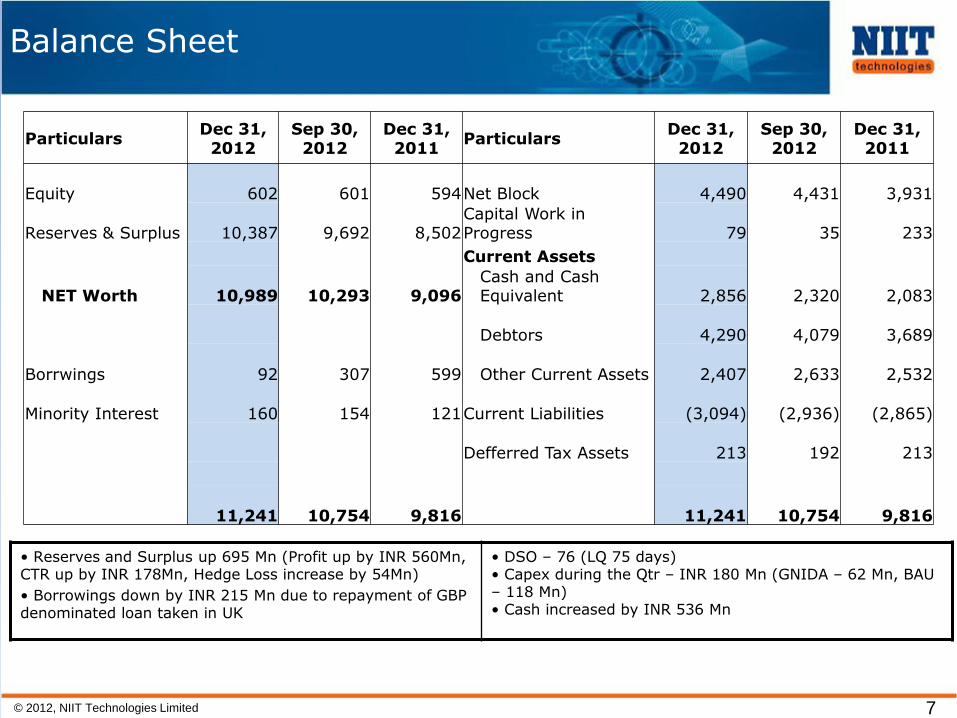
Balance Sheet
• Reserves and Surplus up 695 Mn (Profit up by INR 560Mn, CTR up by INR 178Mn, Hedge Loss increase by 54Mn)
• Borrowings down by INR 215 Mn due to repayment of GBP denominated loan taken in UK
• DSO – 76 (LQ 75 days) • Capex during the Qtr – INR 180 Mn (GNIDA – 62 Mn, BAU – 118 Mn) • Cash increased by INR 536 Mn
Particulars Dec 31, 2012
Sep 30, 2012
Dec 31, 2011
Particulars Dec 31, 2012
Sep 30, 2012
Dec 31, 2011
Equity
602
601
594 Net Block
4,490
4,431
3,931
Reserves & Surplus
10,387
9,692
8,502 Capital Work in Progress
79
35
233
Current Assets
NET Worth
10,989
10,293
9,096 Cash and Cash Equivalent
2,856
2,320
2,083
Debtors
4,290
4,079
3,689
Borrwings
92
307
599 Other Current Assets
2,407
2,633
2,532
Minority Interest
160
154
121 Current Liabilities
(3,094)
(2,936)
(2,865)
Defferred Tax Assets
213
192
213
11,241
10,754
9,816
11,241
10,754
9,816

© 2012, NIIT Technologies Limited 8
Geographic Revenue Mix
Americas, 38%
EMEA, 39%
APAC, 13%
India, 10%
Q2 FY'13
Americas, 37%
EMEA, 40%
APAC, 11%
India, 12%
Q3 FY'13
• Strong growth in domestic business • Growth in EMEA & US • Decline in APAC due to projects going live

© 2012, NIIT Technologies Limited 9
Vertical Mix
• Continued traction in Transport vertical • BFSI segment continues to be soft • Strong traction in domestic government business
BFSI, 33%
Transportation, 42%
Mfg & Dist, 6%
GOVT, 5% Others, 14%
Q2 FY'13
BFSI, 31%
Transportation, 42%
Mfg & Dist, 6%
GOVT, 8%
Others, 13%
Q3 FY'13

© 2012, NIIT Technologies Limited 10
Service Mix
• Reduction in IP asset revenue due to lower NITL revenues • MS revenues increase due to new business execution in Morris
ADM, 64%
IP Asset Based, 10%
Managed Services, 11%
SI & PI , 9%
BPO, 6%
Q2 FY’13
ADM, 63% IP Asset Based, 9%
Managed Services,
12%
SI & PI , 10%
BPO, 6%
Q3 FY’13

© 2012, NIIT Technologies Limited 11 © 2012, NIIT Technologies Limited
Order Intake
•4 new customers added during the quarter (Travel – 1; Manuf – 2, Govt – 1) •$83 Mn order intake in the quarter leading to $242 Mn of firm business executable over next 12 months
•Geographical breakdown of order intake – US (31 Mn), EMEA (34 Mn), ROW (18 Mn)
75
92
83
93
83
-
10
20
30
40
50
60
70
80
90
100
Q3'12 Q4'12 Q1'13 Q2'13 Q3'13
Order Intake ($ Mn.)
© 2012, NIIT Technologies Limited 12 © 2012, NIIT Technologies Limited
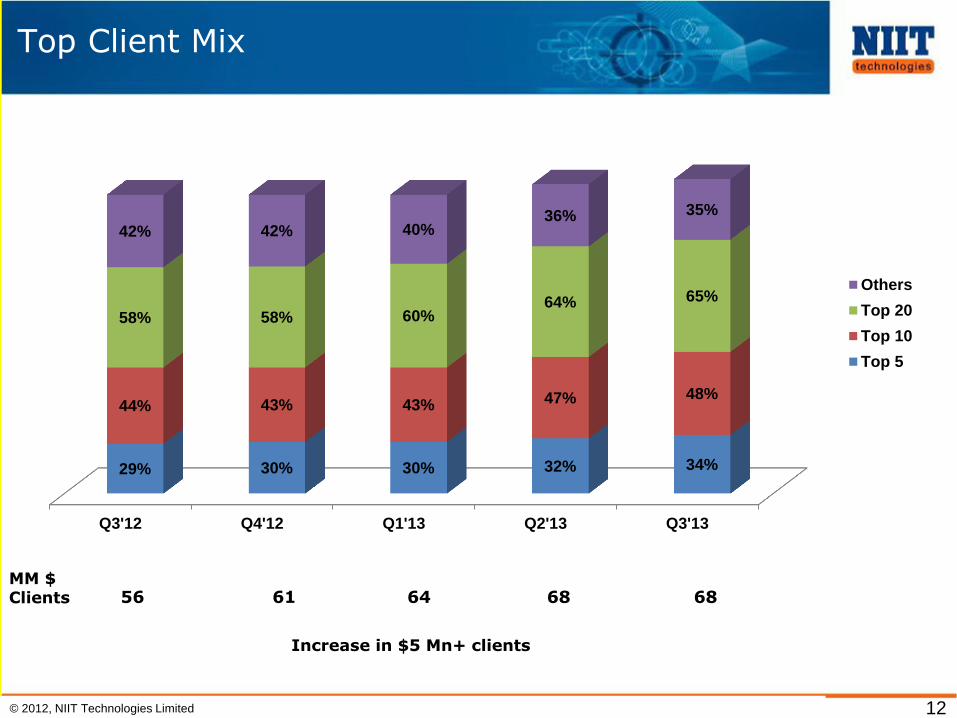
Top Client Mix
MM $ Clients 56 61 64 68 68
Q3'12 Q4'12 Q1'13 Q2'13 Q3'13
29% 30% 30% 32% 34%
44% 43% 43% 47% 48%
58% 58% 60% 64% 65%
42% 42% 40% 36% 35%
Others
Top 20
Top 10
Top 5
Increase in $5 Mn+ clients

© 2012, NIIT Technologies Limited 13
People Resources
6978
7362 7444
7617
7882
Dec'11 Mar'12 Jun'12 Sep'12 Dec'12
People Data
Dec'11 Mar'12 Jun'12 Sep'12 Dec'12
Net Additions 245 384 82 173 265
Attrition% 12.46% 12.08% 12.36% 12.67% 12.51%
Utilization 80.17% 79.00% 78.54% 79.80% 78.40%

© 2012, NIIT Technologies Limited 14
Shareholding Pattern
25 24 24 25 24
39 39 39 31 31
12 13 14
17 18
23 24 23 27 27
Dec'11 Mar'12 Jun'12 Sep'12 Dec'12
FIIs
Banks/MF/FI's
Promoters
Others

© 2012, NIIT Technologies Limited 15
Thank You