Embed Size (px)
Citation preview

1
Financial performance analysis: a case study of Nike
In Partial Fulfillment of the Requirements
for the Bachelor of Science in Finance
by
CHEN Minghan
1025564
May, 2020
2
Abstract
Sports industry is closely related to people's life. The paper studies financial performance
analysis among the sports industry in a case study of Nike and puts forward improvement
suggestions to increase cash flow, increase stock dividends, reduce debts. NKE stock price and
annualized dividend in 2015 to 2019 are graphed in the introduction and dividend prediction is
conducted by using dividend discount model with the historical average growth rate. The primary
analysis is based on the fiscal years 2015 to 2019, which ended each year on May 31, including
applying horizontal analysis, trend analysis on Nike. The deeper analysis conducts ratio analysis
comparing with Nike’s biggest market competitor Adidas.
The income statement of Nike in recent 5 years are selected and analyzed, of which the
horizontal analysis is based on the last two years, while the trend analysis is based on the data of
the last five years. The ratio analysis concentrates on ROE.
Key words: Nike, stock price and dividend, financial analysis, ROE
TABLE OF CONTENTS
Abstract ----------------------------------------------------------------------------------------------------- 1
Introduction ------------------------------------------------------------------------------------------------- 3
Background of Nike ----------------------------------------------------------------------------------------- 3
Stock Price Changes ---------------------------------------------------------------------------------------- 3
Dividend discount model ----------------------------------------------------------------------------------- 5
Literature Review ------------------------------------------------------------------------------------------ 7
Horizontal Analysis ----------------------------------------------------------------------------------------- 7
Trend Analysis ------------------------------------------------------------------------------------------------7
Customer Comparison ------------------------------------------------------------------------------------- 10
Research Design: Financial Performance Analysis ------------------------------------------------- 9
Findings: Financial Performance of Nike ----------------------------------------------------------- 10
3
Horizontal Analysis ---------------------------------------------------------------------------------------- 10
Trend Analysis --------------------------------------------------------------------------------------------- 11
Ratio Analysis ---------------------------------------------------------------------------------------------- 12
Nike Stock Drop -------------------------------------------------------------------------------------------- 14
Conclusion ------------------------------------------------------------------------------------------------- 15
Summary -----------------------------------------------------------------------------------------------------15
Limitation --------------------------------------------------------------------------------------------------- 16
Further Research ------------------------------------------------------------------------------------------- 16
Introduction
Background of Nike
Nike is one of the most outstanding sports industries today. Nike is an American sports company
specializing in the design and sale of sneakers, sports wearing, and sports-related products which
are sold under its own brand, including Nike, Air Jordan, converse, etc. Fortune magazine ranks
340th on the list of the world’s top 500 in 2019. Operating income is $36397 million. Nike's
market rivals include adidas, New Balance, Puma, Under Armour and so on.
Stock Price Change
We can see from the figure that from July 2015 to July 2017, the stock price of Nike hardly
changed, and from the end of 2015 to July 2017, it expressed that the stock price almost showed
a downward trend, which is worth noting and bring attention. Nike's stock price didn't rise until
October 2017, the stock price keeps increase and then fell again until September 2018. It is worth
mentioning that the overall trend of stock prices in 2019 is good and bring a good return.

4
Figure 1. The graph reports time series of semi-annual stock price, 2015-2019.
Year
According to CNN’s report, NKE is one of the worst performing Dow stock in 2016. After the
company reported its revenue below than Wall Street's forecasts, its price continues to fell more
than 3% in early trading. During 2016 and 2017, Nike's biggest problem is a continued falling
sales in its local market. The data shows that sales in North America fell 3% from a year earlier,
while sales in China rose 9% from a year earlier. But North America accounts for 40 percent of
Nike's total sales. As a result, sales growth in China was not enough to offset the decline in the us
(Monica, 2017).
5
Dividend discount model
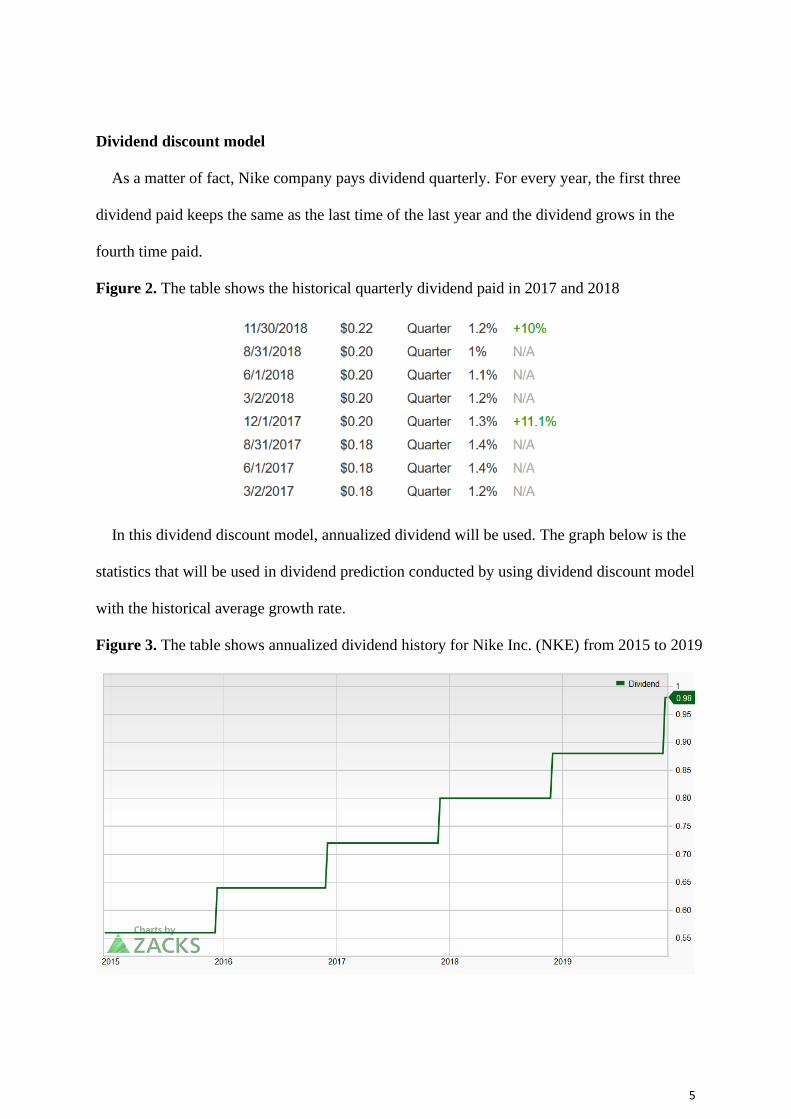
As a matter of fact, Nike company pays dividend quarterly. For every year, the first three
dividend paid keeps the same as the last time of the last year and the dividend grows in the
fourth time paid.
Figure 2. The table shows the historical quarterly dividend paid in 2017 and 2018
In this dividend discount model, annualized dividend will be used. The graph below is the
statistics that will be used in dividend prediction conducted by using dividend discount model
with the historical average growth rate.
Figure 3. The table shows annualized dividend history for Nike Inc. (NKE) from 2015 to 2019
6
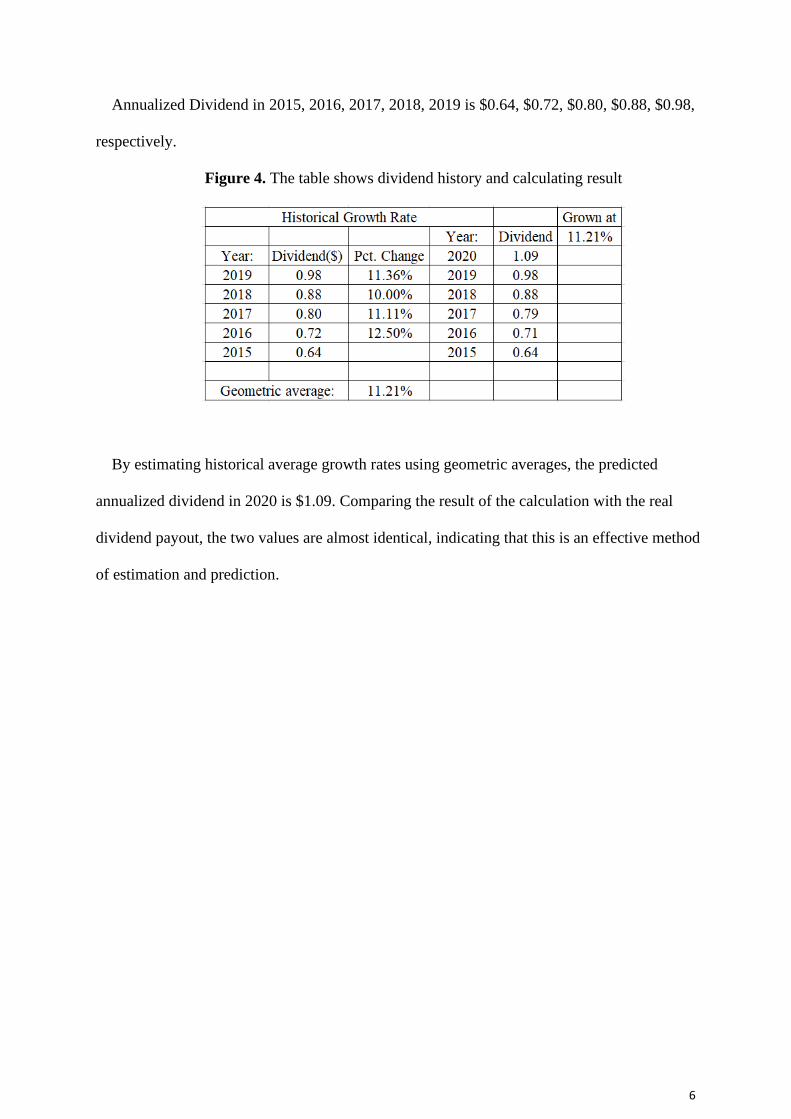
Annualized Dividend in 2015, 2016, 2017, 2018, 2019 is $0.64, $0.72, $0.80, $0.88, $0.98,
respectively.
Figure 4. The table shows dividend history and calculating result
By estimating historical average growth rates using geometric averages, the predicted
annualized dividend in 2020 is $1.09. Comparing the result of the calculation with the real
dividend payout, the two values are almost identical, indicating that this is an effective method
of estimation and prediction.

7
Literature Review
Horizontal Analysis
Horizontal analysis is used to compare the amount of change of financial statement items over
a particular period (Gibson, 2010).
Horizontal analysis helps understand the impact of operating results on the company's financial
position during the period under review. However, a common problem is that the summary of
information in the financial statements may change over time due to continuous changes in the
accounts (Fridson & Alvarez, 2011).
Trend Analysis
Trend analysis is like horizontal analysis but also evaluates an organization’s financial state
over more than two period of time (Fridson & Alvarez, 2011).
Return on Equity
ROE, as a measure of company performance, the company with higher ROE has significant
higher return than other competitors(Dermol, 2012).
Customer Comparison
Nike and adidas are two of the most outstanding and popular sports industries all over the world.
One thing they have in common is that they are both liked by people who play sports. (Marketing
Strategy for Adidas vs. Nike. , 2015)
Nike and adidas are the world's largest sellers of sports cloth and sneakers (Aaker &
Joachimsthaler, 2000). Nike has the largest market share in sports industry while Adidas is the
second largest after Nike, both are the competitors of each other. Nike is the market pioneer and
market leader in the sports industry, with sales of more than $22.2 billion in 2018, while adidas

8
shoes revenue was $12.8 billion (Liam O'Connell, 2019). The two companies target different
audiences around the world; Adidas's target customers are sports professionals, aged between 12
and 34. Adidas concentrates sports like tennis and soccer first, then considers other sports. Nike,
meanwhile, targets customers between the ages of 18 and 35.Nike is more popular than adidas
because it has a lot of celebrity sponsorships, mainly targeting basketball players. The United
States is the initial main market of both these two company, but in the last decade, their target
market has expanded to international market. Besides, Adidas targets soccer and tennis players,
who have a big market in Europe.

9
Research Design: Financial Performance Analysis
In this study, financial performance analysis will be used. The analysis is based on three types
of analysis methods which are horizontal analysis, trend analysis and ratio analysis. All data
analysis is based on the items on the financial statement. A financial statement is a written record
of a company's business activities and financial performance. Financial statements are usually
audited by government agencies, accounting firms, etc., to ensure accuracy and are used for tax,
financing, or investment purposes. Income statement is selected and analyzed in this case study.
All secondary data comes from the Internet.
The primary analysis includes applying horizontal analysis and trend analysis. Horizontal
analysis is used to compare the amount of change of financial statement items over a particular
period. Horizontal analysis concentrates on the changes rate and generates bar charts with changes
rate curve on different items of income statement. Trend analysis is like horizontal analysis but
also evaluates an organization’s financial state over more than two period of time. More historical
statistics will be used to find the trend. Trend analysis is helpful for forecasting.
The deeper analysis conducts ratio analysis comparing with Nike’s biggest market competitor
Adidas. Ratio usually becomes key indicators of financial performance of a company and ratio
analysis will help to understand the performance of a particular company in its industry over time.
By drawing the ROE change curve to measure the return of stock investors.
The impact of news in 2019 on Nike's stock price is record at the end of findings.

10
Findings: Financial Performance of Nike
Horizontal Analysis
The horizontal analysis is useful to see the impact of operational results on a company's
financial condition over the review period.
Figure 5. The table below conducts horizontal analysis

11
Figure 6. Horizontal Analysis results presets in graph
Horizontal analysis has been done for income statement in fiscal year 2018 and 2019 above.
According to the data and charts, from 2018 to 2019, Nike's sales increased, EBIT increased,
and income tax greatly decreased, so as to achieve a relatively large increase in net income.
Moreover, EPS increased from $1.17 in 2018 to $2.48 in 2019, that is an increase of 111.97%,
indicating that Nike's financial performance improved greatly from 2018 to 2019. This change
corresponds to the rise in stock prices in the introduction part.
Trend Analysis
Trend analysis is similar to horizontal analysis, but evaluates an organization’s financial
information more over two period of time, statistics in recent five years from 2015 to 2019 are
selected and compared to show the trend.

12
Figure 7. Trend Analysis
This trend of income statement illustrates the analysis on the different period of net sales,
gross profit, operating profit and net income assuming performance in 2015 as base. Comparing
with sales, gross profit and operating income, net income has a significant change in 2018 and
2019. The other three items grew by about 4% a year. The 4% level is not a big increase, which
only means that Nike's sales and market share are not going downwards. From 2017 to 2018, the
stock price of Nike increased greatly, but net income decreased. It can be known from horizontal
analysis that the income tax in 2018 was relatively high.
Key Ratio Analysis
Return on shareholders' equity, or ROE, is a measure of the return on stock investors. It also
evaluates the performance of corporate management, as reflected in profitability, asset
management and financial control.

13
Figure 8. This figure indicates the continuous changing ROE of Nike in recent five years
Figure 9. This figure indicates the continuous changing ROE of Adidas in recent five years
Return on Equity = Net Income / Equity
Net income is the profit generated by the company during the fiscal year, while shareholders'
equity represents the total investment of investors in the company. In the balance sheet,
shareholders' equity is the shareholder's ownership of the value of the company's assets after the
deduction of all liabilities, or directly equivalent to the net assets (NAV). Generally speaking, the
higher the ROE, the better corporate it is. ROE above 15% is ideal, while above 20% is excellent.
Companies that have a continuing competitive advantage, and whose competitors are difficult
to compete with, usually have a common specialty, which is a high ROE. A successful stock
investment depends on the ability of a company's business to consistently generate growing

14
revenue, because the company profits will increase with time, the company's stock price will also
increase due to reflect the intrinsic value of the company and continue to rise, in one word, ROE
is a good indicator to choose a stock.
Nike's ROE increased steadily from 2015 to 2017 and was at a high level in the industry. From
this point of view, NKE is a good stock. However, in fact, the stock price fluctuated and did not
increase from 2015 to 2017. In 2019, Nike's ROE was as high as 44.57, which is consistent with
its volatile and growing stock price. The analysis concludes that in 2019 and 2020, Nike will be a
good stock, will bring high return.
Nike Stock Drop
In Feb, 2019, there is a much-anticipated college basketball competed between Duke and North
Carolina University. The game was being broadcast on the Internet the nationally televised game
at the time, but surprisingly it had a huge impact on Nike. (GIBSON, 2019) Less than a minute
into the game, Zion Williamson, a duke freshman and rising star in the sports world, was forced
off the court with a sprained knee after his Nike sneakers broke and even President Barack Obama
pointed out from his seat, "his sneakers are broken."
Later on, Nike states that the quality and performance of their products are the most important.
Although the long-term influence for Nike need to be seen, but in the short term, many investors
reacted by shorting Nike stock. The stock price drops 1.7 percent on Thursday and closed with
dropping down 1.1% at $83.95, losing roughly $1.1 billion from the sporting clothing company's
market capitalization since Wednesday's close.
15
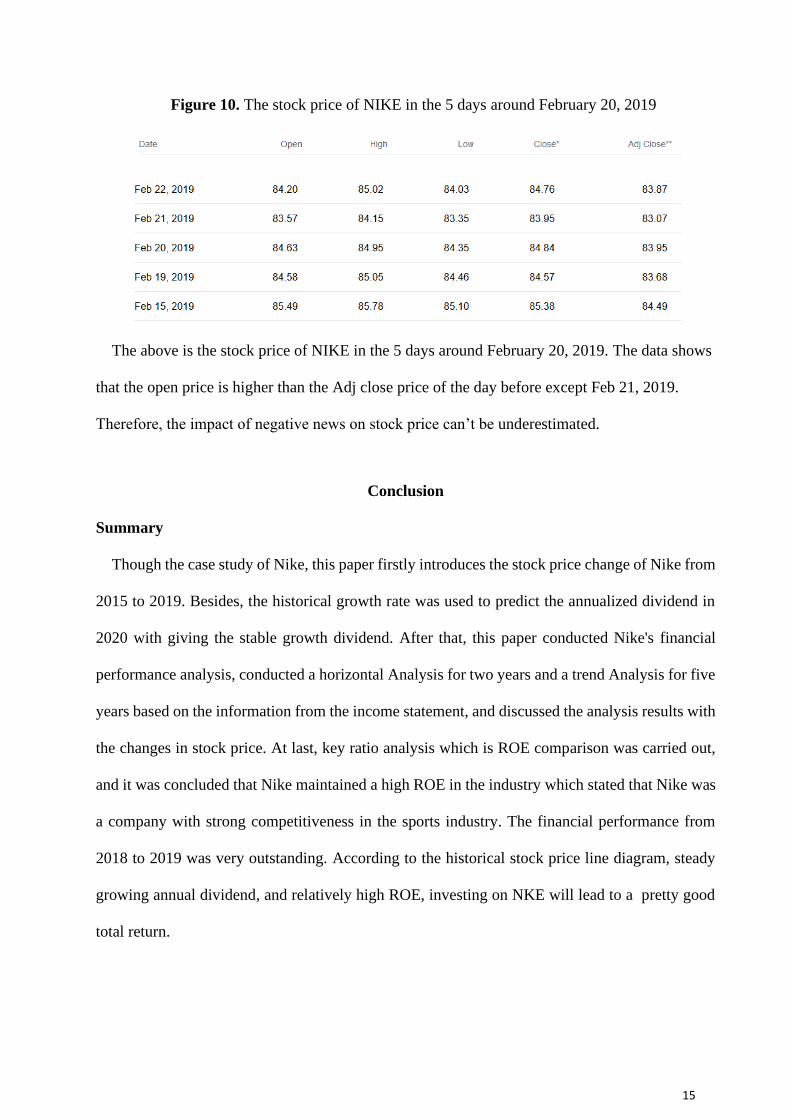
Figure 10. The stock price of NIKE in the 5 days around February 20, 2019
The above is the stock price of NIKE in the 5 days around February 20, 2019. The data shows
that the open price is higher than the Adj close price of the day before except Feb 21, 2019.
Therefore, the impact of negative news on stock price can’t be underestimated.
Conclusion
Summary
Though the case study of Nike, this paper firstly introduces the stock price change of Nike from
2015 to 2019. Besides, the historical growth rate was used to predict the annualized dividend in
2020 with giving the stable growth dividend. After that, this paper conducted Nike's financial
performance analysis, conducted a horizontal Analysis for two years and a trend Analysis for five
years based on the information from the income statement, and discussed the analysis results with
the changes in stock price. At last, key ratio analysis which is ROE comparison was carried out,
and it was concluded that Nike maintained a high ROE in the industry which stated that Nike was
a company with strong competitiveness in the sports industry. The financial performance from
2018 to 2019 was very outstanding. According to the historical stock price line diagram, steady
growing annual dividend, and relatively high ROE, investing on NKE will lead to a pretty good
total return.
16
Limitation
The stock price statistics and income statement used in this study are all from the Internet. Both
horizontal and trend analysis are based on historical data. Therefore, investment forecasting can
only be adopted without unexpected circumstances. There are many factors that affect the stock
price, such as Nike has negative news in 2020, the replacement of the CEO, the emerging of new
market strategies, the change of interest rates, etc. The conclusions and forecasting obtained by
this study are only for reference, and they can't fully meet Nike's 2020 financial performance.
Further Research
This study focuses on the analysis of whether Nike's financial performance has the same
performance as the change in its stock price from 2015 to 2019. In fact, it may be possible to
find more data to do correlational research. Secondary data is sufficient online, so further
research can be done.
The dividend in 2020 can be used to compare with the predicted dividend getting from
calculation by dividend model to test if Nike’s next year dividend yield is steady.

17
References
NKE annualized dividend 2015-2019 from
https://www.zacks.com/stock/chart/NKE/fundamental/dividend-ttm
NKE Everyday Stock Price | NKE Available at
https://finance.yahoo.com/quote/NKE/history/
NKE Historical Stock Price 2015-2019 from
https://www.macrotrends.net/stocks/charts/NKE/nike/stock-price-history
NIKE Income Statement 2005-2019 | NKE Available at
https://www.macrotrends.net/stocks/charts/NKE/nike/income-statement
Aaker, D.A. and Joachimsthaler, F. (2000) Brand Leadership: Building Assets in the
Information Society. Free Press, New York.
Barnes, P. (1987). The analysis and use of financial ratios: A review article. Journal of Business
Finance & Accounting, 14(4), 449-461.
Brigham, E., & Ehrhardt, M. (2013). Financial management: theory & practice. Cengage
Learning.
CCTV. (2017, March 15). Nike's response to CCTV's 315 party revealed that it still refused to
pay three times the compensation. Retrieved from NetEase Finance:
http://money.163.com/17/0315/22/CFJQQHD2002580SL.html
Dermol, Valerij. "Relationship between mission statement and company performance." Analele
Ştiinţifice ale Universităţii» Alexandru Ioan Cuza «din Iaşi. Ştiinţe economice 59.1
(2012): 325-341.
Du Toit, E., Erasmus, P., Kotze, L., Ngwenya, S., Thomas, K., & Viviers, S. (2014). Corporate
Finance: A South African Perspective. OUP Catalogue.
Fridson, M. S., & Alvarez, F. (2011). Financial statement analysis: a practitioner's guide (Vol.
597). John Wiley& Sons.
GIBSON, K. (2019, FEBRUARY 21). Nike's high-profile shoe fail costs $1.1 billion in stock
value. Retrieved from https://www.cbsnews.com: https://www.cbsnews.com/news/nike-
stock-drop-zion-williamson-shoe-incident-and-injury-costs-1-1-billion-in-stock-value/
Jayawardhana, A. (2016). Financial Performance Analysis of Adidas AG. European Journal of
Business and Management, 8(11), 74-82.
Lund-Thomsen, P., & Coe, N. M. (2013). Corporate social responsibility and labour agency: the
case of Nike in Pakistan. Journal of Economic Geography, 15(2), 275-296.
Mahdi, H. A. A., Abbas, M., Mazar, T. I., & George, S. (2015). A Comparative Analysis of
Strategies and Business Models of Nike, Inc. and Adidas Group with special reference to
Competitive Advantage in the context of a Dynamic and Competitive

18
Environment. International Journal of Business Management and Economic
Research, 6(3), 167-177.
Marketing Strategy for Adidas vs. Nike. (2015, March). Retrieved March 28, 2015, from
quality-essay.com:https://quality-essay.com/essay-samples/business/marketing-strategy-
for-adidas-vs-nike.html
Monica, P. R. (2017, September 27). money.cnn.com. Retrieved from Fumble! Nike's U.S. sales
drop again: https://money.cnn.com/2017/09/27/investing/nike-earnings/index.html
Murphy, C. B. (2019, May 30). Financial Statements. Retrieved from investopedia.com:
https://www.investopedia.com/terms/f/financial-statements.asp
O'Connell, L. (2019, Mar 21). Footwear segment revenue of Nike, Adidas & Puma 2010-2018.
Retrieved from https://www.statista.com:
https://www.statista.com/statistics/278834/revenue-nike-adidas-puma-footwear-segment/