Embed Size (px)
Citation preview
1
Financial Report 2017
For the Fiscal Year Ended March 31, 2017
NTT URBAN DEVELOPMENT CORPORATION
4-14-1, Sotokanda, Chiyoda-ku, Tokyo
2
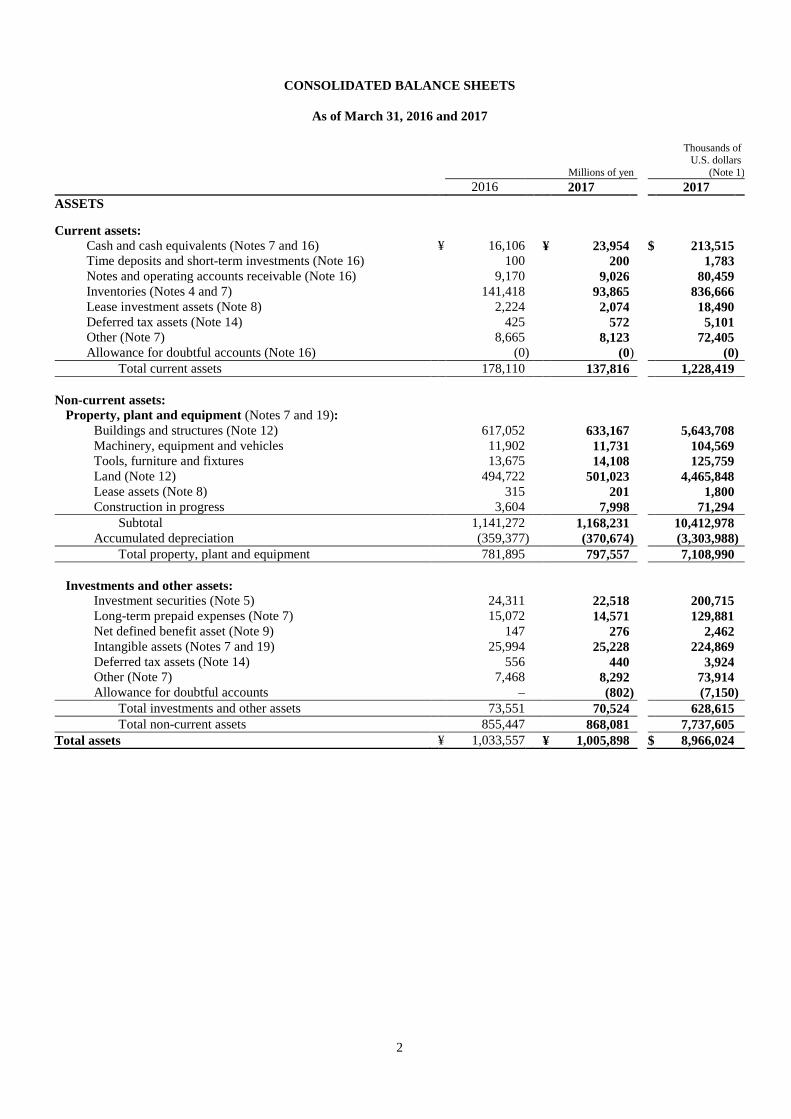
CONSOLIDATED BALANCE SHEETS
As of March 31, 2016 and 2017
Millions of yen
Thousands of U.S. dollars
(Note 1) 2016 2017 2017
ASSETS
Current assets: Cash and cash equivalents (Notes 7 and 16) ¥ 16,106 ¥ 23,954 $ 213,515 Time deposits and short-term investments (Note 16) 100 200 1,783 Notes and operating accounts receivable (Note 16) 9,170 9,026 80,459 Inventories (Notes 4 and 7) 141,418 93,865 836,666 Lease investment assets (Note 8) 2,224 2,074 18,490 Deferred tax assets (Note 14) 425 572 5,101 Other (Note 7) 8,665 8,123 72,405 Allowance for doubtful accounts (Note 16) (0 ) (0 ) (0 )
Total current assets 178,110 137,816 1,228,419 Non-current assets:
Property, plant and equipment (Notes 7 and 19): Buildings and structures (Note 12) 617,052 633,167 5,643,708 Machinery, equipment and vehicles 11,902 11,731 104,569 Tools, furniture and fixtures 13,675 14,108 125,759 Land (Note 12) 494,722 501,023 4,465,848 Lease assets (Note 8) 315 201 1,800 Construction in progress 3,604 7,998 71,294
Subtotal 1,141,272 1,168,231 10,412,978 Accumulated depreciation (359,377 ) (370,674 ) (3,303,988 )
Total property, plant and equipment 781,895 797,557 7,108,990
Investments and other assets: Investment securities (Note 5) 24,311 22,518 200,715 Long-term prepaid expenses (Note 7) 15,072 14,571 129,881 Net defined benefit asset (Note 9) 147 276 2,462 Intangible assets (Notes 7 and 19) 25,994 25,228 224,869 Deferred tax assets (Note 14) 556 440 3,924 Other (Note 7) 7,468 8,292 73,914 Allowance for doubtful accounts – (802 ) (7,150 )
Total investments and other assets 73,551 70,524 628,615 Total non-current assets 855,447 868,081 7,737,605
Total assets ¥ 1,033,557 ¥ 1,005,898 $ 8,966,024
3
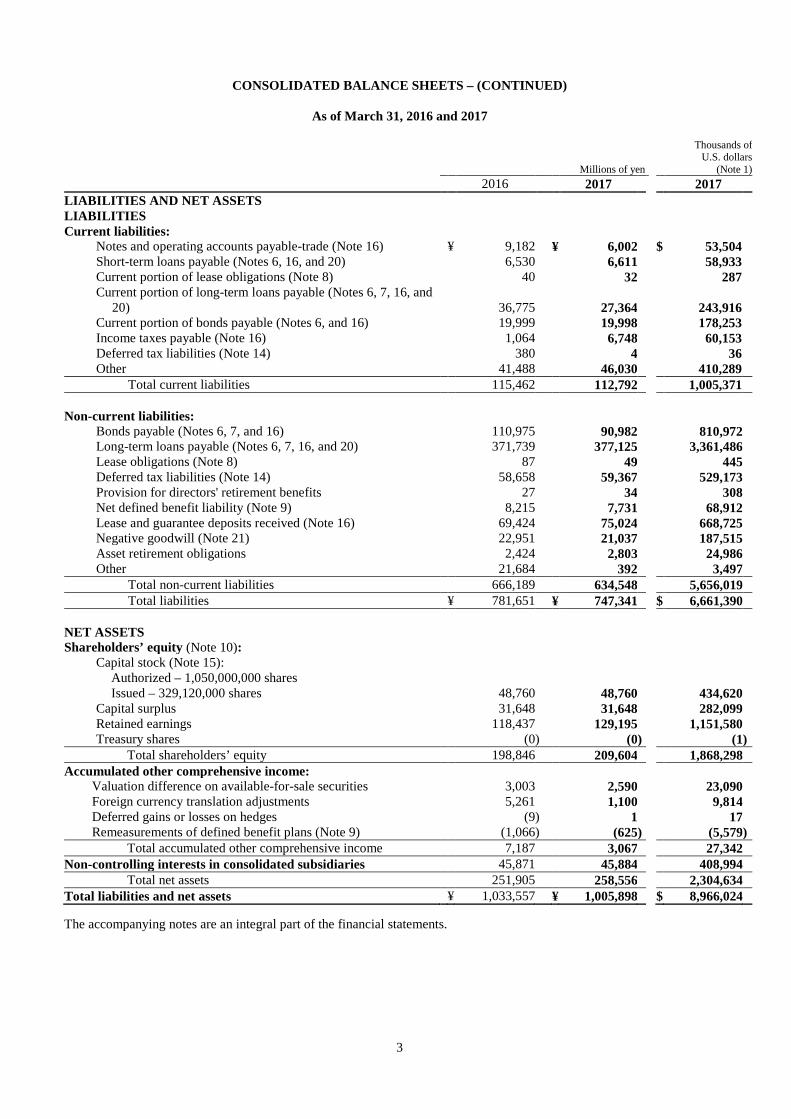
CONSOLIDATED BALANCE SHEETS – (CONTINUED)
As of March 31, 2016 and 2017
Millions of yen
Thousands of U.S. dollars
(Note 1) 2016 2017 2017
LIABILITIES AND NET ASSETS
LIABILITIES
Current liabilities:
Notes and operating accounts payable-trade (Note 16) ¥ 9,182 ¥ 6,002 $ 53,504 Short-term loans payable (Notes 6, 16, and 20) 6,530 6,611 58,933 Current portion of lease obligations (Note 8) 40 32 287 Current portion of long-term loans payable (Notes 6, 7, 16, and
20) 36,775 27,364 243,916
Current portion of bonds payable (Notes 6, and 16) 19,999 19,998 178,253 Income taxes payable (Note 16) 1,064 6,748 60,153 Deferred tax liabilities (Note 14) 380 4 36 Other 41,488 46,030 410,289
Total current liabilities 115,462 112,792 1,005,371
Non-current liabilities: Bonds payable (Notes 6, 7, and 16) 110,975 90,982 810,972 Long-term loans payable (Notes 6, 7, 16, and 20) 371,739 377,125 3,361,486 Lease obligations (Note 8) 87 49 445 Deferred tax liabilities (Note 14) 58,658 59,367 529,173 Provision for directors' retirement benefits 27 34 308 Net defined benefit liability (Note 9) 8,215 7,731 68,912 Lease and guarantee deposits received (Note 16) 69,424 75,024 668,725 Negative goodwill (Note 21) 22,951 21,037 187,515 Asset retirement obligations 2,424 2,803 24,986 Other 21,684 392 3,497
Total non-current liabilities 666,189 634,548 5,656,019 Total liabilities ¥ 781,651 ¥ 747,341 $ 6,661,390
NET ASSETS Shareholders’ equity (Note 10):
Capital stock (Note 15): Authorized – 1,050,000,000 shares Issued – 329,120,000 shares 48,760 48,760 434,620
Capital surplus 31,648 31,648 282,099 Retained earnings 118,437 129,195 1,151,580 Treasury shares (0 ) (0 ) (1 )
Total shareholders’ equity 198,846 209,604 1,868,298 Accumulated other comprehensive income:
Valuation difference on available-for-sale securities 3,003 2,590 23,090 Foreign currency translation adjustments 5,261 1,100 9,814 Deferred gains or losses on hedges (9 ) 1 17 Remeasurements of defined benefit plans (Note 9) (1,066 ) (625 ) (5,579 )
Total accumulated other comprehensive income 7,187 3,067 27,342 Non-controlling interests in consolidated subsidiaries 45,871 45,884 408,994
Total net assets 251,905 258,556 2,304,634 Total liabilities and net assets ¥ 1,033,557 ¥ 1,005,898 $ 8,966,024 The accompanying notes are an integral part of the financial statements.
4
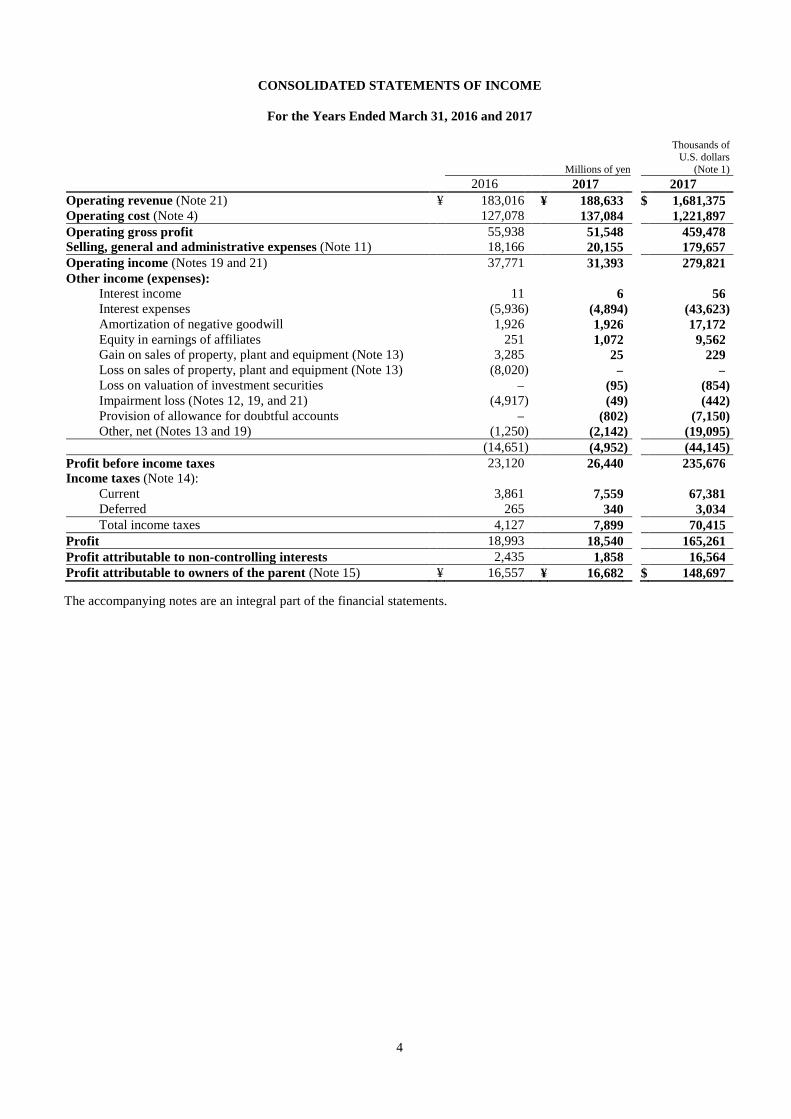
CONSOLIDATED STATEMENTS OF INCOME
For the Years Ended March 31, 2016 and 2017
Millions of yen
Thousands of U.S. dollars
(Note 1) 2016 2017 2017
Operating revenue (Note 21) ¥ 183,016 ¥ 188,633 $ 1,681,375 Operating cost (Note 4) 127,078 137,084 1,221,897 Operating gross profit 55,938 51,548 459,478 Selling, general and administrative expenses (Note 11) 18,166 20,155 179,657 Operating income (Notes 19 and 21) 37,771 31,393 279,821 Other income (expenses):
Interest income 11 6 56 Interest expenses (5,936 ) (4,894 ) (43,623 ) Amortization of negative goodwill 1,926 1,926 17,172 Equity in earnings of affiliates 251 1,072 9,562 Gain on sales of property, plant and equipment (Note 13) 3,285 25 229 Loss on sales of property, plant and equipment (Note 13) (8,020 ) – – Loss on valuation of investment securities – (95 ) (854 ) Impairment loss (Notes 12, 19, and 21) (4,917 ) (49 ) (442 ) Provision of allowance for doubtful accounts – (802 ) (7,150 ) Other, net (Notes 13 and 19) (1,250 ) (2,142 ) (19,095 )
(14,651 ) (4,952 ) (44,145 ) Profit before income taxes 23,120 26,440 235,676 Income taxes (Note 14):
Current 3,861 7,559 67,381 Deferred 265 340 3,034 Total income taxes 4,127 7,899 70,415
Profit 18,993 18,540 165,261 Profit attributable to non-controlling interests 2,435 1,858 16,564 Profit attributable to owners of the parent (Note 15) ¥ 16,557 ¥ 16,682 $ 148,697 The accompanying notes are an integral part of the financial statements.
5
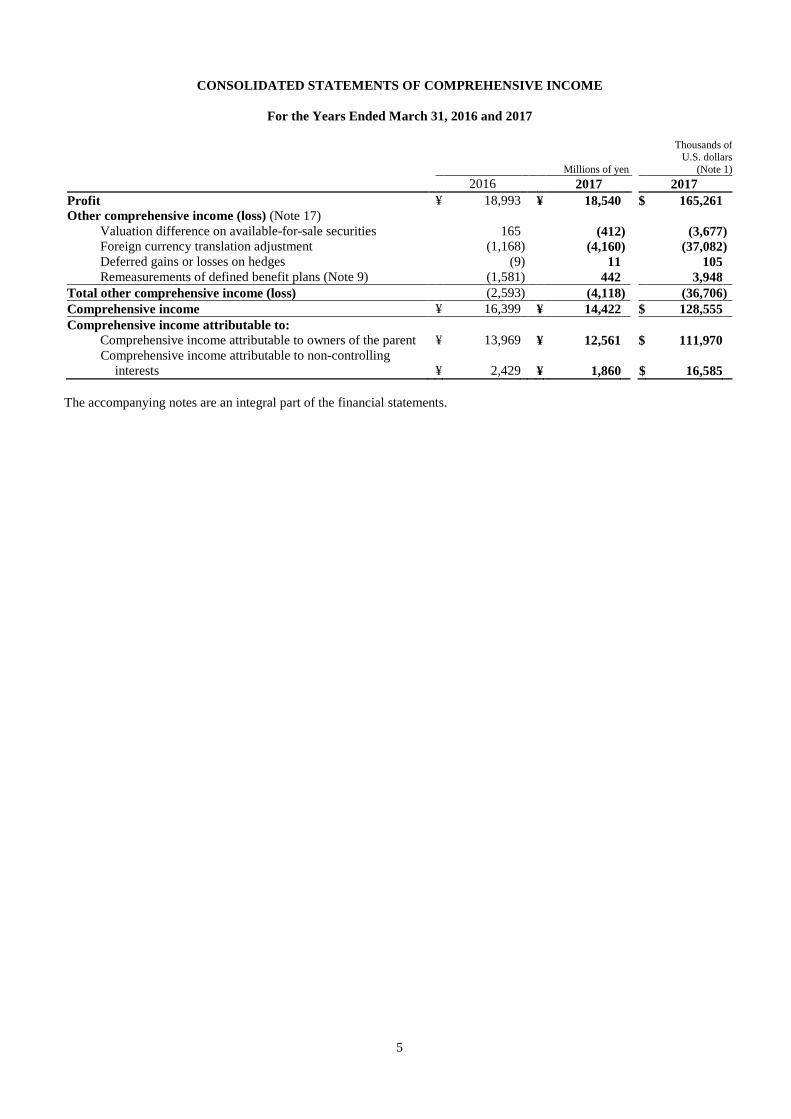
CONSOLIDATED STATEMENTS OF COMPREHENSIVE INCOME
For the Years Ended March 31, 2016 and 2017
Millions of yen
Thousands of U.S. dollars
(Note 1) 2016 2017 2017 Profit ¥ 18,993 ¥ 18,540 $ 165,261 Other comprehensive income (loss) (Note 17)
Valuation difference on available-for-sale securities 165 (412 ) (3,677 ) Foreign currency translation adjustment (1,168 ) (4,160 ) (37,082 ) Deferred gains or losses on hedges (9 ) 11 105 Remeasurements of defined benefit plans (Note 9) (1,581 ) 442 3,948
Total other comprehensive income (loss) (2,593 ) (4,118 ) (36,706 ) Comprehensive income ¥ 16,399 ¥ 14,422 $ 128,555 Comprehensive income attributable to:
Comprehensive income attributable to owners of the parent ¥ 13,969 ¥ 12,561 $ 111,970 Comprehensive income attributable to non-controlling
interests ¥ 2,429 ¥ 1,860 $ 16,585 The accompanying notes are an integral part of the financial statements.
6
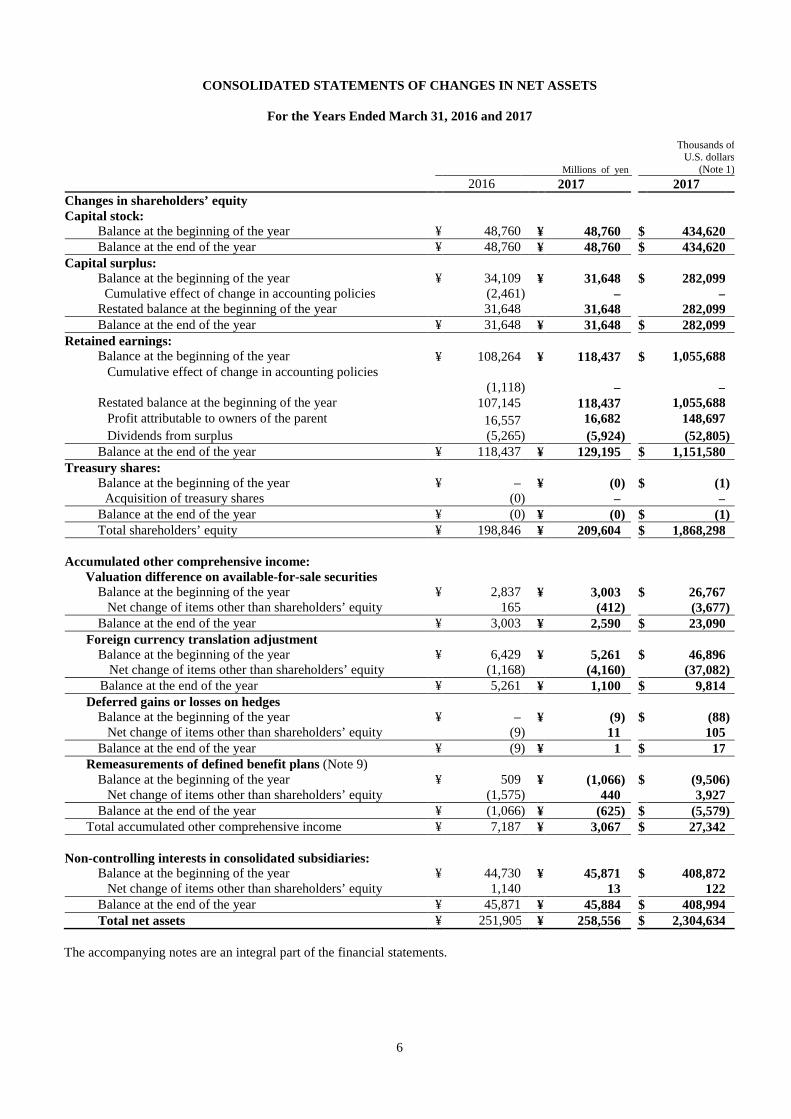
CONSOLIDATED STATEMENTS OF CHANGES IN NET ASSETS
For the Years Ended March 31, 2016 and 2017
Millions of yen
Thousands of U.S. dollars
(Note 1) 2016 2017 2017
Changes in shareholders’ equity Capital stock:
Balance at the beginning of the year ¥ 48,760 ¥ 48,760 $ 434,620 Balance at the end of the year ¥ 48,760 ¥ 48,760 $ 434,620
Capital surplus: Balance at the beginning of the year ¥ 34,109 ¥ 31,648 $ 282,099
Cumulative effect of change in accounting policies (2,461 ) – – Restated balance at the beginning of the year 31,648 31,648 282,099 Balance at the end of the year ¥ 31,648 ¥ 31,648 $ 282,099
Retained earnings: Balance at the beginning of the year ¥ 108,264 ¥ 118,437 $ 1,055,688
Cumulative effect of change in accounting policies (1,118
) – –
Restated balance at the beginning of the year 107,145 118,437 1,055,688 Profit attributable to owners of the parent 16,557 16,682 148,697 Dividends from surplus (5,265 ) (5,924 ) (52,805 )
Balance at the end of the year ¥ 118,437 ¥ 129,195 $ 1,151,580 Treasury shares:
Balance at the beginning of the year ¥ – ¥ (0 ) $ (1 ) Acquisition of treasury shares (0 ) – –
Balance at the end of the year ¥ (0 ) ¥ (0 ) $ (1 ) Total shareholders’ equity ¥ 198,846 ¥ 209,604 $ 1,868,298
Accumulated other comprehensive income: Valuation difference on available-for-sale securities
Balance at the beginning of the year ¥ 2,837 ¥ 3,003 $ 26,767 Net change of items other than shareholders’ equity 165 (412 ) (3,677 )
Balance at the end of the year ¥ 3,003 ¥ 2,590 $ 23,090 Foreign currency translation adjustment
Balance at the beginning of the year ¥ 6,429 ¥ 5,261 $ 46,896 Net change of items other than shareholders’ equity (1,168 ) (4,160 ) (37,082 )
Balance at the end of the year ¥ 5,261 ¥ 1,100 $ 9,814 Deferred gains or losses on hedges
Balance at the beginning of the year ¥ – ¥ (9 ) $ (88 ) Net change of items other than shareholders’ equity (9 ) 11 105
Balance at the end of the year ¥ (9 ) ¥ 1 $ 17 Remeasurements of defined benefit plans (Note 9)
Balance at the beginning of the year ¥ 509 ¥ (1,066 ) $ (9,506 ) Net change of items other than shareholders’ equity (1,575 ) 440 3,927
Balance at the end of the year ¥ (1,066 ) ¥ (625 ) $ (5,579 ) Total accumulated other comprehensive income ¥ 7,187 ¥ 3,067 $ 27,342
Non-controlling interests in consolidated subsidiaries: Balance at the beginning of the year ¥ 44,730 ¥ 45,871 $ 408,872
Net change of items other than shareholders’ equity 1,140 13 122 Balance at the end of the year ¥ 45,871 ¥ 45,884 $ 408,994 Total net assets ¥ 251,905 ¥ 258,556 $ 2,304,634
The accompanying notes are an integral part of the financial statements.
7
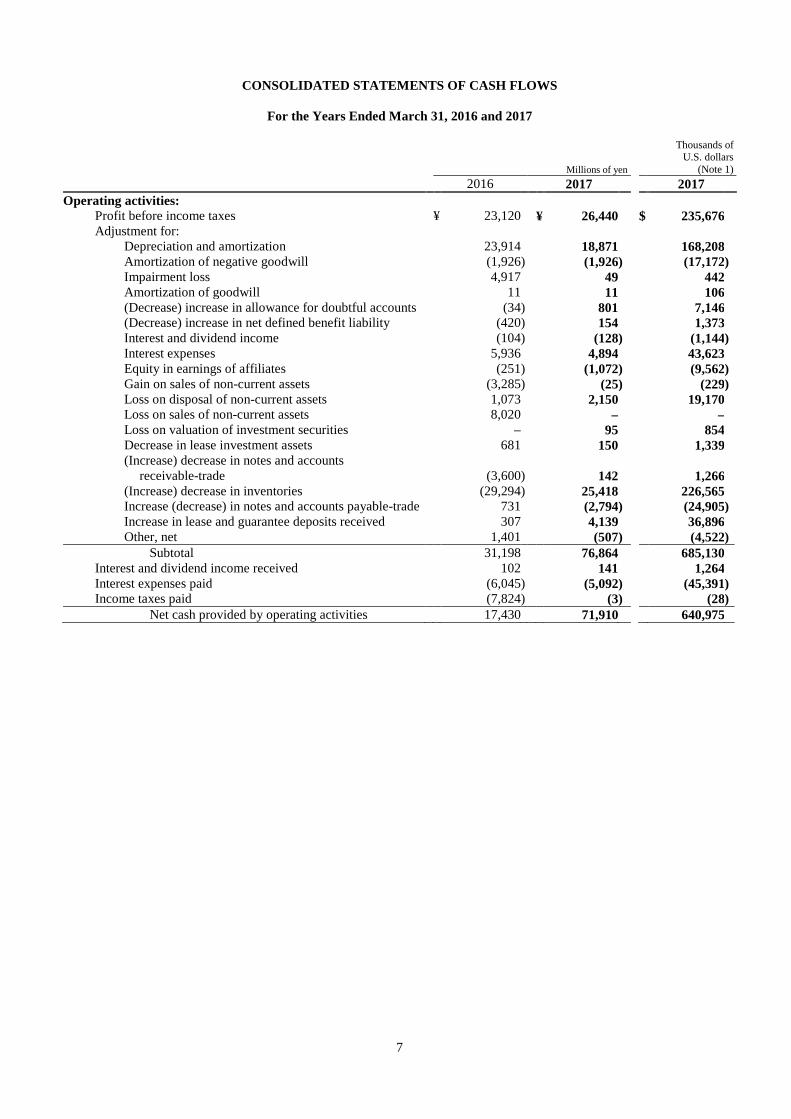
CONSOLIDATED STATEMENTS OF CASH FLOWS
For the Years Ended March 31, 2016 and 2017
Millions of yen
Thousands of U.S. dollars
(Note 1) 2016 2017 2017 Operating activities:
Profit before income taxes ¥ 23,120 ¥ 26,440 $ 235,676 Adjustment for:
Depreciation and amortization 23,914 18,871 168,208 Amortization of negative goodwill (1,926 ) (1,926 ) (17,172 ) Impairment loss 4,917 49 442 Amortization of goodwill 11 11 106 (Decrease) increase in allowance for doubtful accounts (34 ) 801 7,146 (Decrease) increase in net defined benefit liability (420 ) 154 1,373 Interest and dividend income (104 ) (128 ) (1,144 ) Interest expenses 5,936 4,894 43,623 Equity in earnings of affiliates (251 ) (1,072 ) (9,562 ) Gain on sales of non-current assets (3,285 ) (25 ) (229 ) Loss on disposal of non-current assets 1,073 2,150 19,170 Loss on sales of non-current assets 8,020 – – Loss on valuation of investment securities – 95 854 Decrease in lease investment assets 681 150 1,339 (Increase) decrease in notes and accounts
receivable-trade (3,600 ) 142 1,266 (Increase) decrease in inventories (29,294 ) 25,418 226,565 Increase (decrease) in notes and accounts payable-trade 731 (2,794 ) (24,905 ) Increase in lease and guarantee deposits received 307 4,139 36,896 Other, net 1,401 (507 ) (4,522 )
Subtotal 31,198 76,864 685,130 Interest and dividend income received 102 141 1,264 Interest expenses paid (6,045 ) (5,092 ) (45,391 ) Income taxes paid (7,824 ) (3 ) (28 )
Net cash provided by operating activities 17,430 71,910 640,975
8
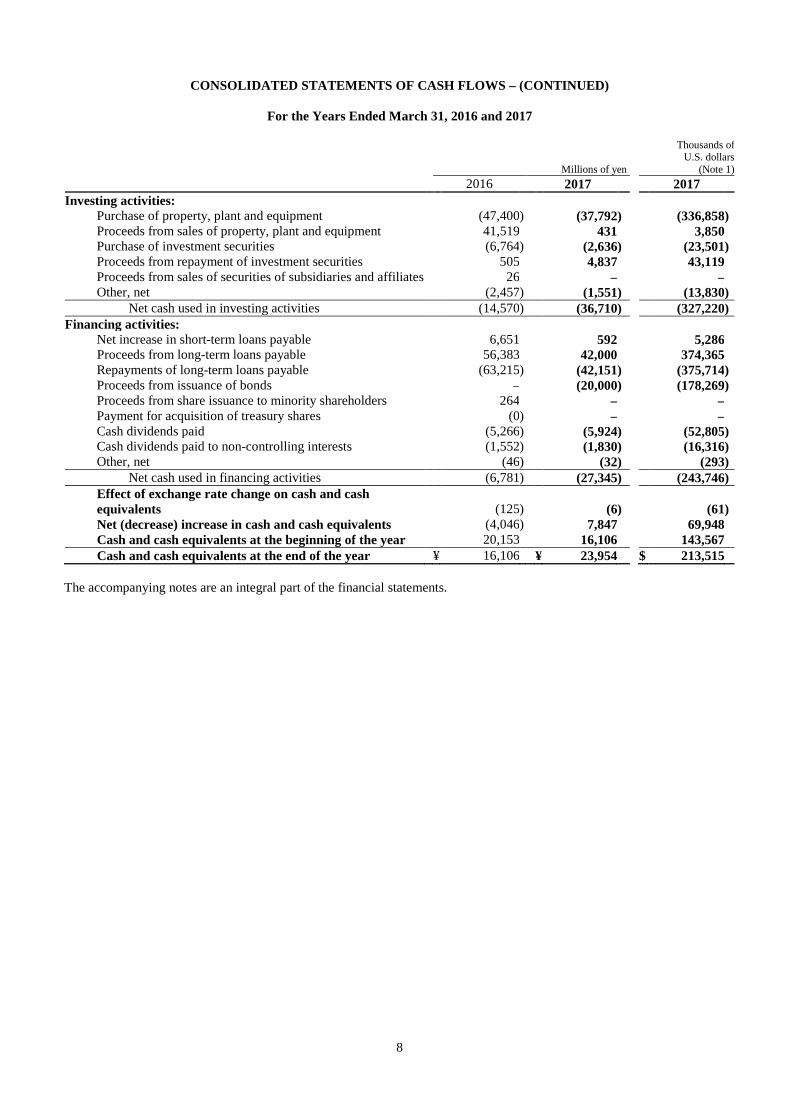
CONSOLIDATED STATEMENTS OF CASH FLOWS – (CONTINUED)
For the Years Ended March 31, 2016 and 2017
Millions of yen
Thousands of U.S. dollars
(Note 1) 2016 2017 2017
Investing activities: Purchase of property, plant and equipment (47,400 ) (37,792 ) (336,858 ) Proceeds from sales of property, plant and equipment 41,519 431 3,850 Purchase of investment securities (6,764 ) (2,636 ) (23,501 ) Proceeds from repayment of investment securities 505 4,837 43,119 Proceeds from sales of securities of subsidiaries and affiliates 26 – – Other, net (2,457 ) (1,551 ) (13,830 )
Net cash used in investing activities (14,570 ) (36,710 ) (327,220 ) Financing activities:
Net increase in short-term loans payable 6,651 592 5,286 Proceeds from long-term loans payable 56,383 42,000 374,365 Repayments of long-term loans payable (63,215 ) (42,151 ) (375,714 ) Proceeds from issuance of bonds – (20,000 ) (178,269 ) Proceeds from share issuance to minority shareholders 264 – – Payment for acquisition of treasury shares (0 ) – – Cash dividends paid (5,266 ) (5,924 ) (52,805 ) Cash dividends paid to non-controlling interests (1,552 ) (1,830 ) (16,316 ) Other, net (46 ) (32 ) (293 )
Net cash used in financing activities (6,781 ) (27,345 ) (243,746 ) Effect of exchange rate change on cash and cash equivalents (125 ) (6 ) (61 ) Net (decrease) increase in cash and cash equivalents (4,046 ) 7,847 69,948 Cash and cash equivalents at the beginning of the year 20,153 16,106 143,567 Cash and cash equivalents at the end of the year ¥ 16,106 ¥ 23,954 $ 213,515
The accompanying notes are an integral part of the financial statements.
9
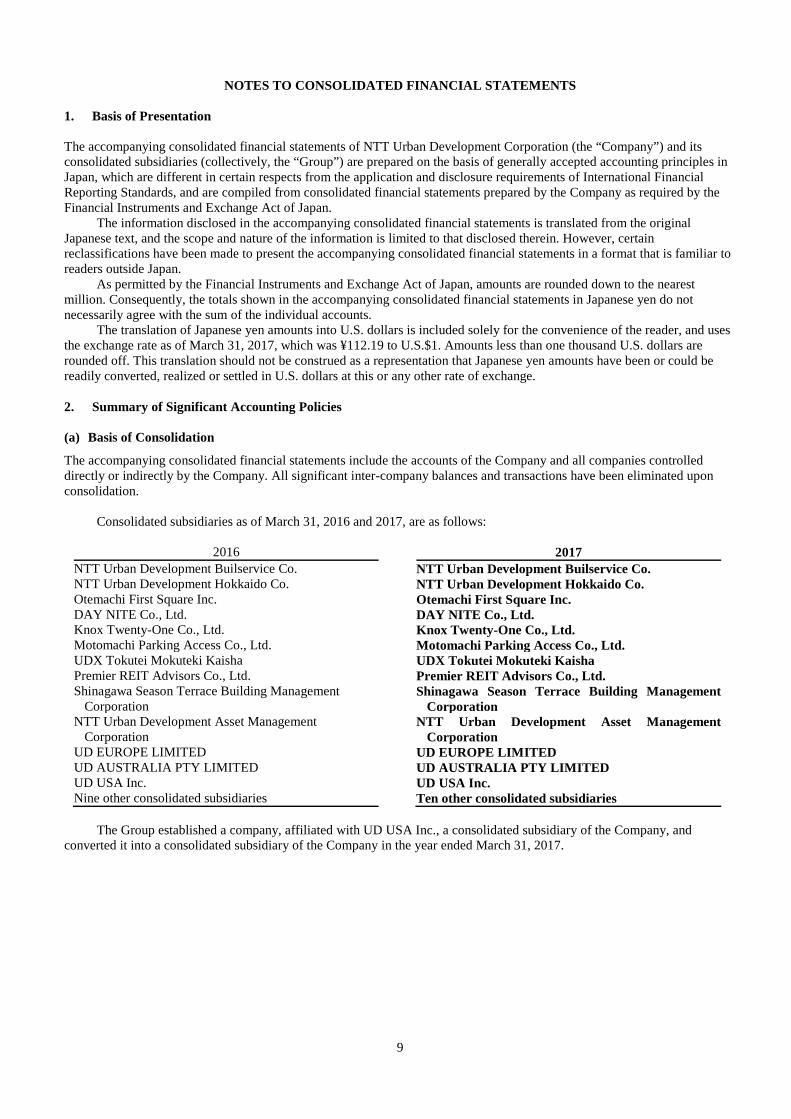
NOTES TO CONSOLIDATED FINANCIAL STATEMENTS 1. Basis of Presentation The accompanying consolidated financial statements of NTT Urban Development Corporation (the “Company”) and its consolidated subsidiaries (collectively, the “Group”) are prepared on the basis of generally accepted accounting principles in Japan, which are different in certain respects from the application and disclosure requirements of International Financial Reporting Standards, and are compiled from consolidated financial statements prepared by the Company as required by the Financial Instruments and Exchange Act of Japan.
The information disclosed in the accompanying consolidated financial statements is translated from the original Japanese text, and the scope and nature of the information is limited to that disclosed therein. However, certain reclassifications have been made to present the accompanying consolidated financial statements in a format that is familiar to readers outside Japan.
As permitted by the Financial Instruments and Exchange Act of Japan, amounts are rounded down to the nearest million. Consequently, the totals shown in the accompanying consolidated financial statements in Japanese yen do not necessarily agree with the sum of the individual accounts.
The translation of Japanese yen amounts into U.S. dollars is included solely for the convenience of the reader, and uses the exchange rate as of March 31, 2017, which was ¥112.19 to U.S.$1. Amounts less than one thousand U.S. dollars are rounded off. This translation should not be construed as a representation that Japanese yen amounts have been or could be readily converted, realized or settled in U.S. dollars at this or any other rate of exchange. 2. Summary of Significant Accounting Policies (a) Basis of Consolidation
The accompanying consolidated financial statements include the accounts of the Company and all companies controlled directly or indirectly by the Company. All significant inter-company balances and transactions have been eliminated upon consolidation.
Consolidated subsidiaries as of March 31, 2016 and 2017, are as follows:
2016 2017 NTT Urban Development Builservice Co. NTT Urban Development Builservice Co. NTT Urban Development Hokkaido Co. NTT Urban Development Hokkaido Co. Otemachi First Square Inc. Otemachi First Square Inc. DAY NITE Co., Ltd. DAY NITE Co., Ltd. Knox Twenty-One Co., Ltd. Knox Twenty-One Co., Ltd. Motomachi Parking Access Co., Ltd. Motomachi Parking Access Co., Ltd. UDX Tokutei Mokuteki Kaisha UDX Tokutei Mokuteki Kaisha Premier REIT Advisors Co., Ltd. Premier REIT Advisors Co., Ltd. Shinagawa Season Terrace Building Management
Corporation Shinagawa Season Terrace Building Management
Corporation NTT Urban Development Asset Management
Corporation NTT Urban Development Asset Management
Corporation UD EUROPE LIMITED UD EUROPE LIMITED UD AUSTRALIA PTY LIMITED UD AUSTRALIA PTY LIMITED UD USA Inc. UD USA Inc. Nine other consolidated subsidiaries Ten other consolidated subsidiaries
The Group established a company, affiliated with UD USA Inc., a consolidated subsidiary of the Company, and
converted it into a consolidated subsidiary of the Company in the year ended March 31, 2017.
10
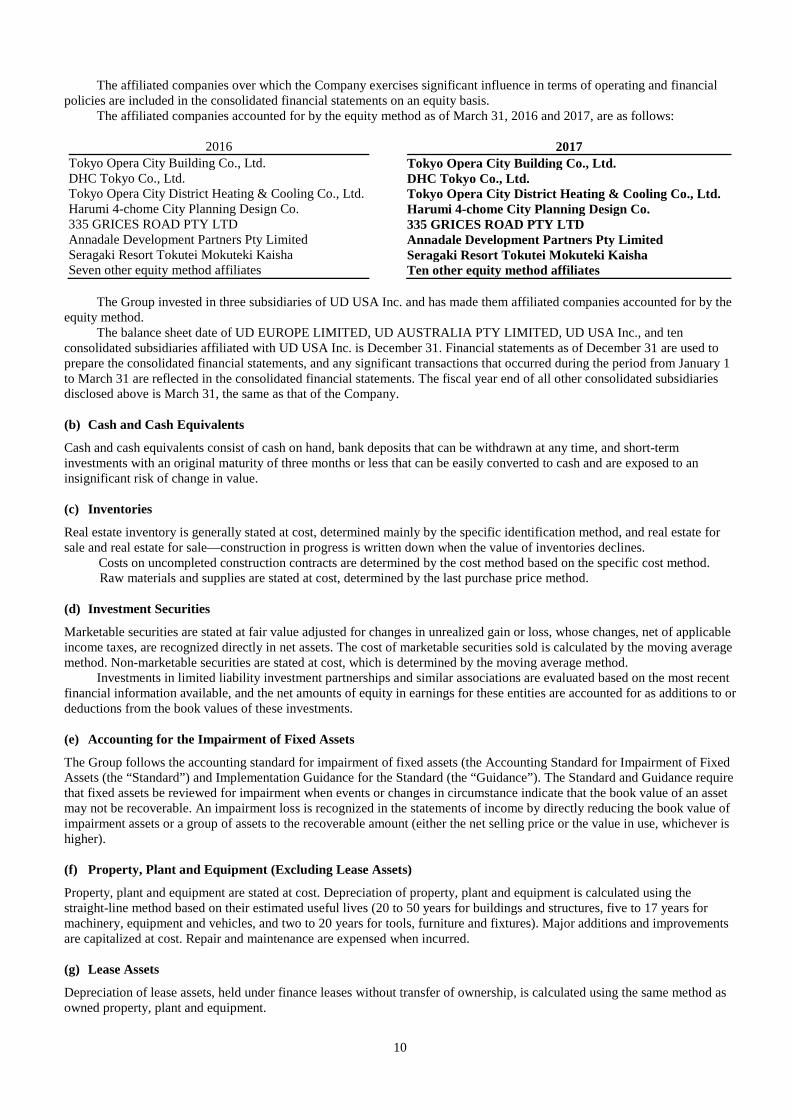
The affiliated companies over which the Company exercises significant influence in terms of operating and financial policies are included in the consolidated financial statements on an equity basis.
The affiliated companies accounted for by the equity method as of March 31, 2016 and 2017, are as follows:
2016 2017 Tokyo Opera City Building Co., Ltd. Tokyo Opera City Building Co., Ltd. DHC Tokyo Co., Ltd. DHC Tokyo Co., Ltd. Tokyo Opera City District Heating & Cooling Co., Ltd. Tokyo Opera City District Heating & Cooling Co., Ltd. Harumi 4-chome City Planning Design Co. Harumi 4-chome City Planning Design Co. 335 GRICES ROAD PTY LTD 335 GRICES ROAD PTY LTD Annadale Development Partners Pty Limited Annadale Development Partners Pty Limited Seragaki Resort Tokutei Mokuteki Kaisha Seragaki Resort Tokutei Mokuteki Kaisha Seven other equity method affiliates Ten other equity method affiliates
The Group invested in three subsidiaries of UD USA Inc. and has made them affiliated companies accounted for by the
equity method. The balance sheet date of UD EUROPE LIMITED, UD AUSTRALIA PTY LIMITED, UD USA Inc., and ten
consolidated subsidiaries affiliated with UD USA Inc. is December 31. Financial statements as of December 31 are used to prepare the consolidated financial statements, and any significant transactions that occurred during the period from January 1 to March 31 are reflected in the consolidated financial statements. The fiscal year end of all other consolidated subsidiaries disclosed above is March 31, the same as that of the Company.
(b) Cash and Cash Equivalents
Cash and cash equivalents consist of cash on hand, bank deposits that can be withdrawn at any time, and short-term investments with an original maturity of three months or less that can be easily converted to cash and are exposed to an insignificant risk of change in value. (c) Inventories
Real estate inventory is generally stated at cost, determined mainly by the specific identification method, and real estate for sale and real estate for sale—construction in progress is written down when the value of inventories declines.
Costs on uncompleted construction contracts are determined by the cost method based on the specific cost method. Raw materials and supplies are stated at cost, determined by the last purchase price method.
(d) Investment Securities
Marketable securities are stated at fair value adjusted for changes in unrealized gain or loss, whose changes, net of applicable income taxes, are recognized directly in net assets. The cost of marketable securities sold is calculated by the moving average method. Non-marketable securities are stated at cost, which is determined by the moving average method.
Investments in limited liability investment partnerships and similar associations are evaluated based on the most recent financial information available, and the net amounts of equity in earnings for these entities are accounted for as additions to or deductions from the book values of these investments. (e) Accounting for the Impairment of Fixed Assets
The Group follows the accounting standard for impairment of fixed assets (the Accounting Standard for Impairment of Fixed Assets (the “Standard”) and Implementation Guidance for the Standard (the “Guidance”). The Standard and Guidance require that fixed assets be reviewed for impairment when events or changes in circumstance indicate that the book value of an asset may not be recoverable. An impairment loss is recognized in the statements of income by directly reducing the book value of impairment assets or a group of assets to the recoverable amount (either the net selling price or the value in use, whichever is higher).
(f) Property, Plant and Equipment (Excluding Lease Assets)
Property, plant and equipment are stated at cost. Depreciation of property, plant and equipment is calculated using the straight-line method based on their estimated useful lives (20 to 50 years for buildings and structures, five to 17 years for machinery, equipment and vehicles, and two to 20 years for tools, furniture and fixtures). Major additions and improvements are capitalized at cost. Repair and maintenance are expensed when incurred. (g) Lease Assets
Depreciation of lease assets, held under finance leases without transfer of ownership, is calculated using the same method as owned property, plant and equipment.
11
(h) Intangible Assets (Excluding Lease Assets)
Intangible assets are stated at cost. Amortization of intangible assets is calculated using the straight-line method. Capitalized software for internal use is amortized over its estimated useful life of five years.
(i) Long-term Prepaid Expenses
Amortization of long-term prepaid expenses is calculated using the straight-line method. (j) Allowance for Doubtful Accounts
The Group provides for an allowance for doubtful accounts to cover estimated probable losses on collection. The allowance consists of a general reserve calculated based on the historical write-off rate, and a specific reserve that is the estimated uncollectible amount with respect to identified doubtful accounts. (k) Retirement Benefits
Net defined benefit liability and net defined benefit asset have been provided mainly at an amount calculated based on the retirement benefit obligations and the fair value of pension plan assets as of the balance sheet date, adjusted for unrecognized actuarial gains and losses, and unrecognized prior service costs. The retirement benefit obligations are attributed, using the benefit formula method, to each period over the estimated years of service of eligible employees.
When actuarial gains and losses are recognized, they are amortized using the straight-line method over the average remaining service period (eight to 13 years) for eligible employees from the following year.
Prior service costs are amortized using the straight-line method over the average remaining service period (10 to 13 years) for eligible employees from the fiscal year in which cost is incurred.
Unrecognized actuarial gains and losses and unrecognized prior service costs are recorded in the remeasurements of defined benefit plans within the net asset section (accumulated other comprehensive income), after adjusting for tax effects.
Directors and corporate auditors of certain subsidiaries are entitled to lump-sum payments under their respective unfunded severance benefit plans. Provision for directors’ retirement benefits represents the estimated amounts that would be payable if all such beneficiaries were to retire on the balance sheet date. (l) Goodwill and Negative Goodwill
Negative goodwill represents the excess of the fair value of the identifiable net assets acquired over the cost of acquisition. The Company amortizes goodwill and negative goodwill that were recognized on or before March 31, 2010, over 20 years using the straight-line method.
Negative goodwill recognized on or before March 31, 2010, is offset by goodwill on the consolidated balance sheets. The amounts of goodwill before offsetting as of March 31, 2016 and 2017, are ¥166 million and ¥154 million ($1,375 thousand), respectively. The amounts of negative goodwill before offsetting as of March 31, 2016 and 2017, are ¥23,118 million and ¥21,191 million ($188,890 thousand), respectively.
(m) Income Taxes
Deferred income taxes are accounted for using the asset and liability method. Deferred tax assets and liabilities are recognized for estimated future tax consequences attributable to temporary differences between the financial statement book values and the tax bases of respective assets and liabilities.
Deferred tax assets and liabilities are measured using the enacted tax rates applicable to taxable income for the years in which those temporary differences are expected to be recovered or settled.
(n) Revenue Recognition
Revenues from the sale of land and residential homes are recognized when ownership is transferred to and accepted by customers.
Revenues from leasing land and buildings are recognized as rent and are accrued over the lease term. Revenues from finance lease transactions and their costs are recognized when corresponding lease payments are made by customers.
Revenue from construction contracts is recognized based on the percentage-of-completion method, based on the percentage of cost incurred in relation to the estimated total cost, as long as the activity is expected to be profitable. Otherwise, the completed-contract method is applied. (o) Consumption Tax
Transactions subject to the consumption tax are recorded at amounts exclusive of the tax. (p) Derivatives
The Company and certain subsidiaries conduct derivative transactions in order to manage certain risks arising from adverse fluctuations in interest rates. Derivative financial instruments are stated at fair value, with changes in unrealized gains or
12
losses charged to income, except for those that meet the criteria for deferral hedge accounting, in which case unrealized gains or losses are deferred as a component of net assets. The hedge effectiveness is assessed based on the changes in either accumulated fluctuations of the market or cash flows of a hedged item, and either accumulated fluctuations of the market or cash flows of a hedging instrument. Interest rate swaps that meet the specific criteria are not re-measured at fair value but the net amount of money received or paid under swap agreements is recognized as interest expenses or income.
(q) Appropriation of Retained Earnings
In accordance with the Companies Act of Japan, distribution of capital surplus and retained earnings can be made at any time by resolution of the shareholders or by the Board of Directors provided that certain conditions are met. (r) Additional Information
(1) Application of Implementation Guidance on Recoverability of Deferred Tax Assets The Company and its consolidated subsidiaries in Japan adopted the “Revised Implementation Guidance on Recoverability of Deferred Tax Assets” (Accounting Standards Board of Japan (ASBJ) Guidance No. 26, March 28, 2016) in the fiscal year ended March 31, 2017.
(2) Application of consolidated taxation system In the fiscal year ended March 31, 2017, the Company and certain consolidated subsidiaries applied for the approval of application of the consolidated taxation system and will apply the consolidated taxation system from the next consolidated fiscal year. Thus, in the fiscal year ended March 31, 2017, the Company and certain consolidated subsidiaries adopted accounting treatments on the assumption of the application of the consolidated taxation system in accordance with the Practical Solution on Tentative Treatment of Tax Effect Accounting under Consolidated Taxation System (Part 1) (ASBJ PITF No. 5, January 16, 2015) and the Practical Solution on Tentative Treatment of Tax Effect Accounting under Consolidated Taxation System (Part 2) (ASBJ PITF No. 7, January 16, 2015).
(s) Reclassification
Certain amounts in the prior year’s financial statements have been reclassified to conform to the current year’s presentation. 3. Changes in Accounting Principles (Changes of the depreciation method and useful life) The Company and its consolidated subsidiaries in Japan previously applied mainly the declining-balance method to depreciate property, plant and equipment; however, they have changed the depreciation method to the straight-line method from the fiscal year ended March 31, 2017. The Group has reviewed its business strategies as stated in the “Revision of the Medium-Term Vision 2018” to respond to changes in the environment surrounding the Group. The Group believes that occupancy rates of its own office buildings would be more stable for the foreseeable future through greater investment in the strategic improvement of existing flagship buildings and continuous investment in property development to maintain demand for its properties including focusing resources in the office building business in central Tokyo. As such, the Group believes that the straight-line method is a more suitable depreciation method and has changed the depreciation method as a result of the review in the expectation of stable use of property, plant and equipment over the useful lives. From the fiscal year ended March 31, 2017, the Company and its consolidated subsidiaries in Japan also revised the useful life for certain property, plant and equipment based on their actual use. As a result, operating income and profit before income taxes for the fiscal year ended March 31, 2017, each increased by ¥2,655 million ($23,673 thousand).. The impact of this change on segment information is stated in Note 21.
13
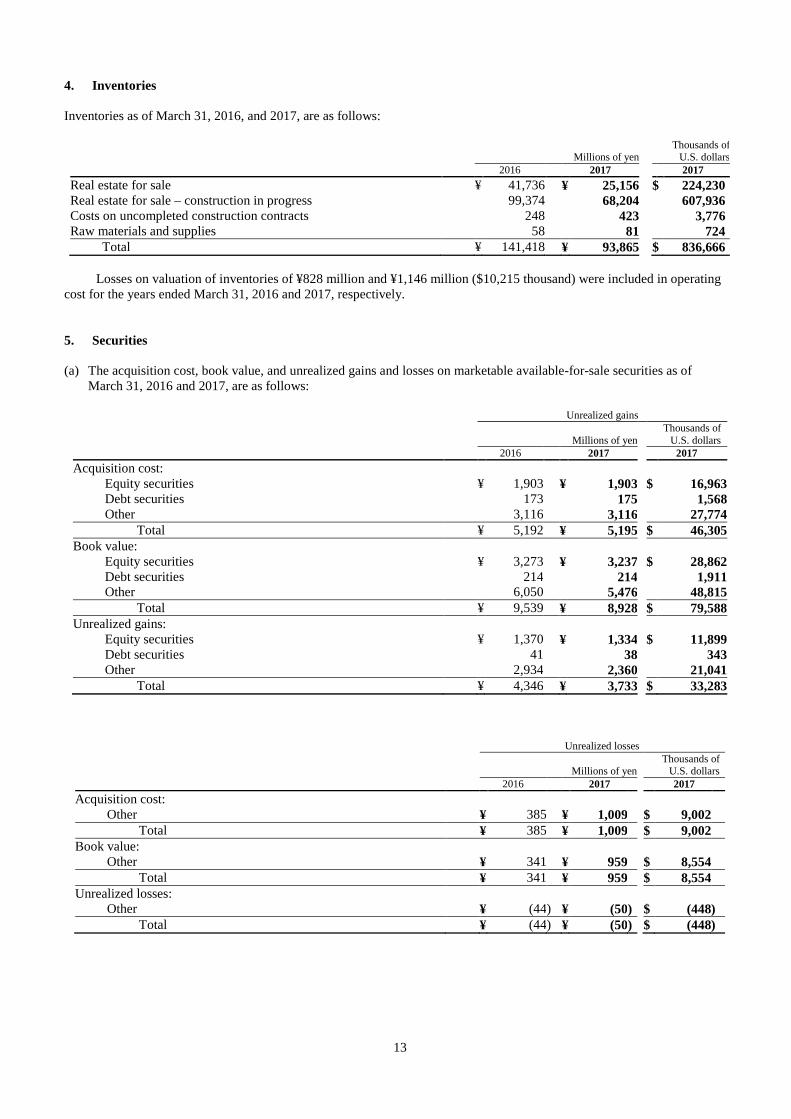
4. Inventories Inventories as of March 31, 2016, and 2017, are as follows:
Millions of yen Thousands of
U.S. dollars 2016 2017 2017 Real estate for sale ¥ 41,736 ¥ 25,156 $ 224,230 Real estate for sale – construction in progress 99,374 68,204 607,936 Costs on uncompleted construction contracts 248 423 3,776 Raw materials and supplies 58 81 724
Total ¥ 141,418 ¥ 93,865 $ 836,666
Losses on valuation of inventories of ¥828 million and ¥1,146 million ($10,215 thousand) were included in operating cost for the years ended March 31, 2016 and 2017, respectively. 5. Securities (a) The acquisition cost, book value, and unrealized gains and losses on marketable available-for-sale securities as of
March 31, 2016 and 2017, are as follows:
Unrealized gains
Millions of yen Thousands of
U.S. dollars 2016 2017 2017 Acquisition cost:
Equity securities ¥ 1,903 ¥ 1,903 $ 16,963 Debt securities 173 175 1,568 Other 3,116 3,116 27,774
Total ¥ 5,192 ¥ 5,195 $ 46,305 Book value:
Equity securities ¥ 3,273 ¥ 3,237 $ 28,862 Debt securities 214 214 1,911 Other 6,050 5,476 48,815
Total ¥ 9,539 ¥ 8,928 $ 79,588 Unrealized gains:
Equity securities ¥ 1,370 ¥ 1,334 $ 11,899 Debt securities 41 38 343 Other 2,934 2,360 21,041
Total ¥ 4,346 ¥ 3,733 $ 33,283
Unrealized losses
Millions of yen Thousands of
U.S. dollars 2016 2017 2017 Acquisition cost:
Other ¥ 385 ¥ 1,009 $ 9,002 Total ¥ 385 ¥ 1,009 $ 9,002
Book value: Other ¥ 341 ¥ 959 $ 8,554
Total ¥ 341 ¥ 959 $ 8,554 Unrealized losses:
Other ¥ (44 ) ¥ (50 ) $ (448 ) Total ¥ (44 ) ¥ (50 ) $ (448 )
14
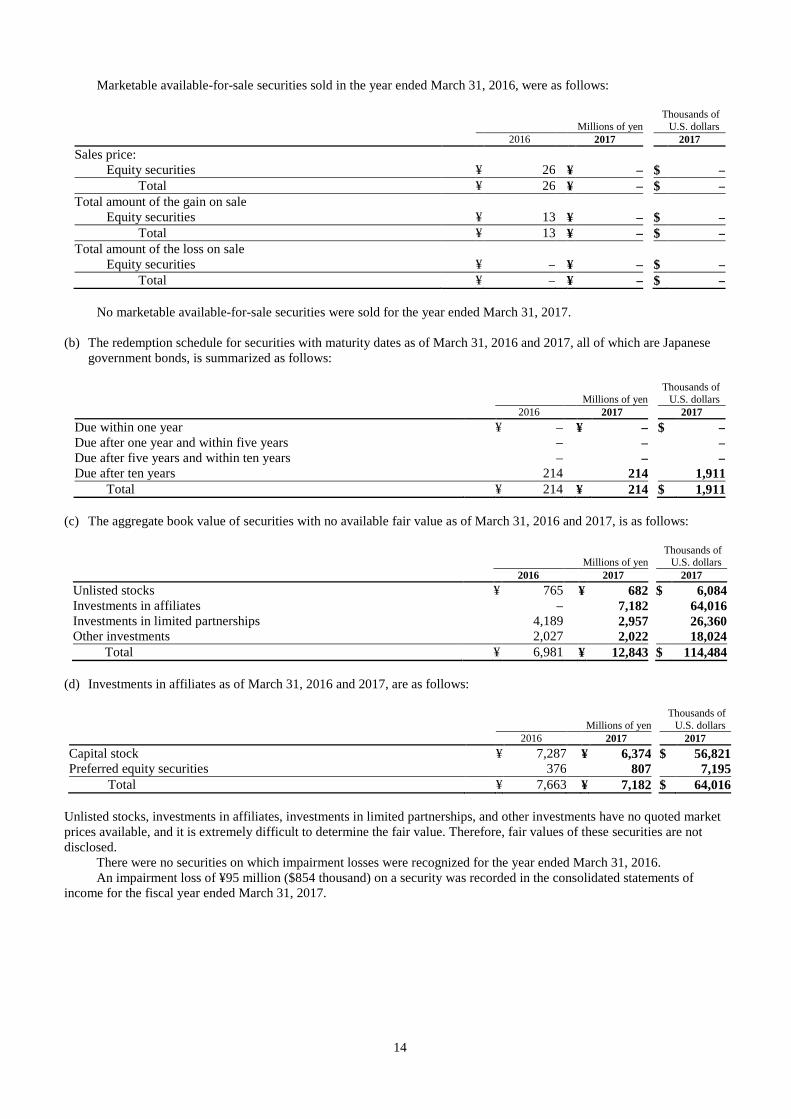
Marketable available-for-sale securities sold in the year ended March 31, 2016, were as follows:
Millions of yen Thousands of
U.S. dollars 2016 2017 2017 Sales price:
Equity securities ¥ 26 ¥ – $ – Total ¥ 26 ¥ – $ –
Total amount of the gain on sale Equity securities ¥ 13 ¥ – $ –
Total ¥ 13 ¥ – $ – Total amount of the loss on sale
Equity securities ¥ – ¥ – $ – Total ¥ – ¥ – $ –
No marketable available-for-sale securities were sold for the year ended March 31, 2017.
(b) The redemption schedule for securities with maturity dates as of March 31, 2016 and 2017, all of which are Japanese government bonds, is summarized as follows:
Millions of yen Thousands of
U.S. dollars 2016 2017 2017 Due within one year ¥ – ¥ – $ – Due after one year and within five years – – – Due after five years and within ten years – – – Due after ten years 214 214 1,911
Total ¥ 214 ¥ 214 $ 1,911
(c) The aggregate book value of securities with no available fair value as of March 31, 2016 and 2017, is as follows:
Millions of yen Thousands of
U.S. dollars 2016 2017 2017 Unlisted stocks ¥ 765 ¥ 682 $ 6,084 Investments in affiliates – 7,182 64,016 Investments in limited partnerships 4,189 2,957 26,360 Other investments 2,027 2,022 18,024
Total ¥ 6,981 ¥ 12,843 $ 114,484 (d) Investments in affiliates as of March 31, 2016 and 2017, are as follows:
Millions of yen Thousands of
U.S. dollars 2016 2017 2017 Capital stock ¥ 7,287 ¥ 6,374 $ 56,821 Preferred equity securities 376 807 7,195
Total ¥ 7,663 ¥ 7,182 $ 64,016 Unlisted stocks, investments in affiliates, investments in limited partnerships, and other investments have no quoted market prices available, and it is extremely difficult to determine the fair value. Therefore, fair values of these securities are not disclosed.
There were no securities on which impairment losses were recognized for the year ended March 31, 2016. An impairment loss of ¥95 million ($854 thousand) on a security was recorded in the consolidated statements of
income for the fiscal year ended March 31, 2017.
15
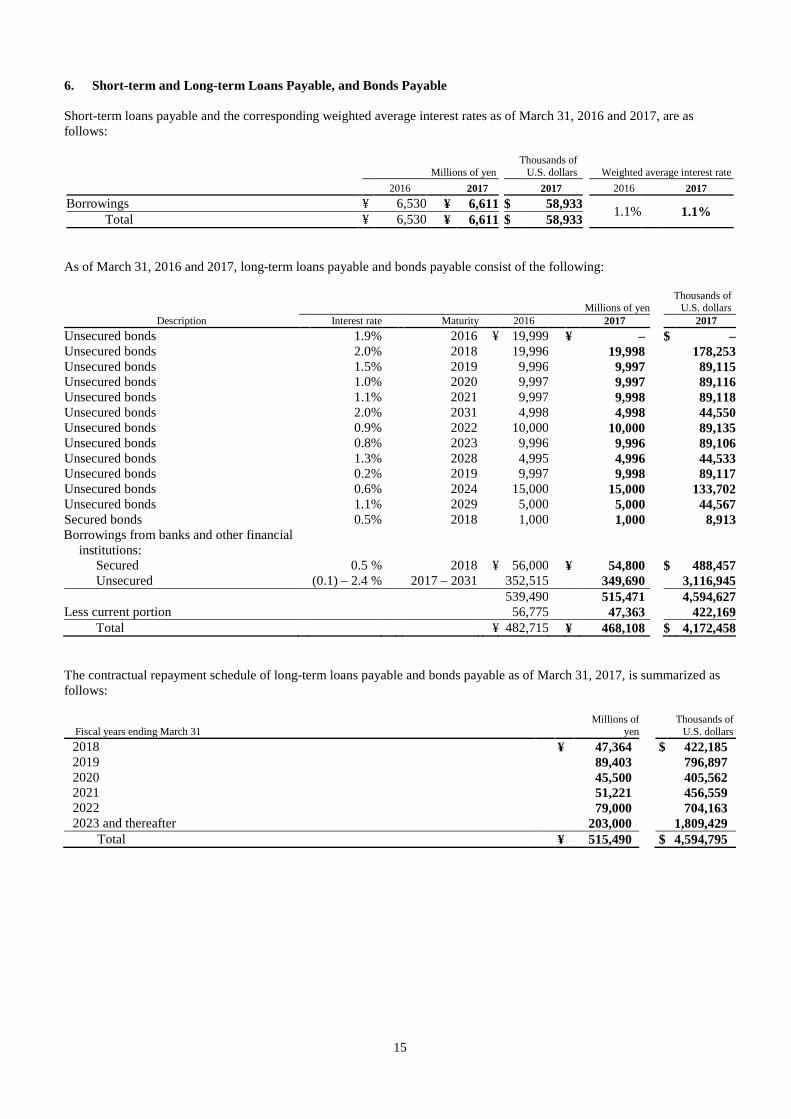
6. Short-term and Long-term Loans Payable, and Bonds Payable Short-term loans payable and the corresponding weighted average interest rates as of March 31, 2016 and 2017, are as follows:
Millions of yen Thousands of
U.S. dollars
Weighted average interest rate 2016 2017 2017 2016 2017 Borrowings ¥ 6,530 ¥ 6,611 $ 58,933 1.1% 1.1%
Total ¥ 6,530 ¥ 6,611 $ 58,933 As of March 31, 2016 and 2017, long-term loans payable and bonds payable consist of the following:
Millions of yen Thousands of
U.S. dollars Description Interest rate Maturity 2016 2017 2017
Unsecured bonds 1.9% 2016 ¥ 19,999 ¥ – $ – Unsecured bonds 2.0% 2018 19,996 19,998 178,253 Unsecured bonds 1.5% 2019 9,996 9,997 89,115 Unsecured bonds 1.0% 2020 9,997 9,997 89,116 Unsecured bonds 1.1% 2021 9,997 9,998 89,118 Unsecured bonds 2.0% 2031 4,998 4,998 44,550 Unsecured bonds 0.9% 2022 10,000 10,000 89,135 Unsecured bonds 0.8% 2023 9,996 9,996 89,106 Unsecured bonds 1.3% 2028 4,995 4,996 44,533 Unsecured bonds 0.2% 2019 9,997 9,998 89,117 Unsecured bonds 0.6% 2024 15,000 15,000 133,702 Unsecured bonds 1.1% 2029 5,000 5,000 44,567 Secured bonds 0.5% 2018 1,000 1,000 8,913 Borrowings from banks and other financial
institutions:
Secured 0.5 % 2018 ¥ 56,000 ¥ 54,800 $ 488,457 Unsecured (0.1) – 2.4 % 2017 – 2031 352,515 349,690 3,116,945
539,490 515,471 4,594,627 Less current portion 56,775 47,363 422,169
Total ¥ 482,715 ¥ 468,108 $ 4,172,458 The contractual repayment schedule of long-term loans payable and bonds payable as of March 31, 2017, is summarized as follows:
Fiscal years ending March 31 Millions of
yen Thousands of
U.S. dollars 2018 ¥ 47,364 $ 422,185 2019 89,403 796,897 2020 45,500 405,562 2021 51,221 456,559 2022 79,000 704,163 2023 and thereafter 203,000 1,809,429
Total ¥ 515,490 $ 4,594,795
16
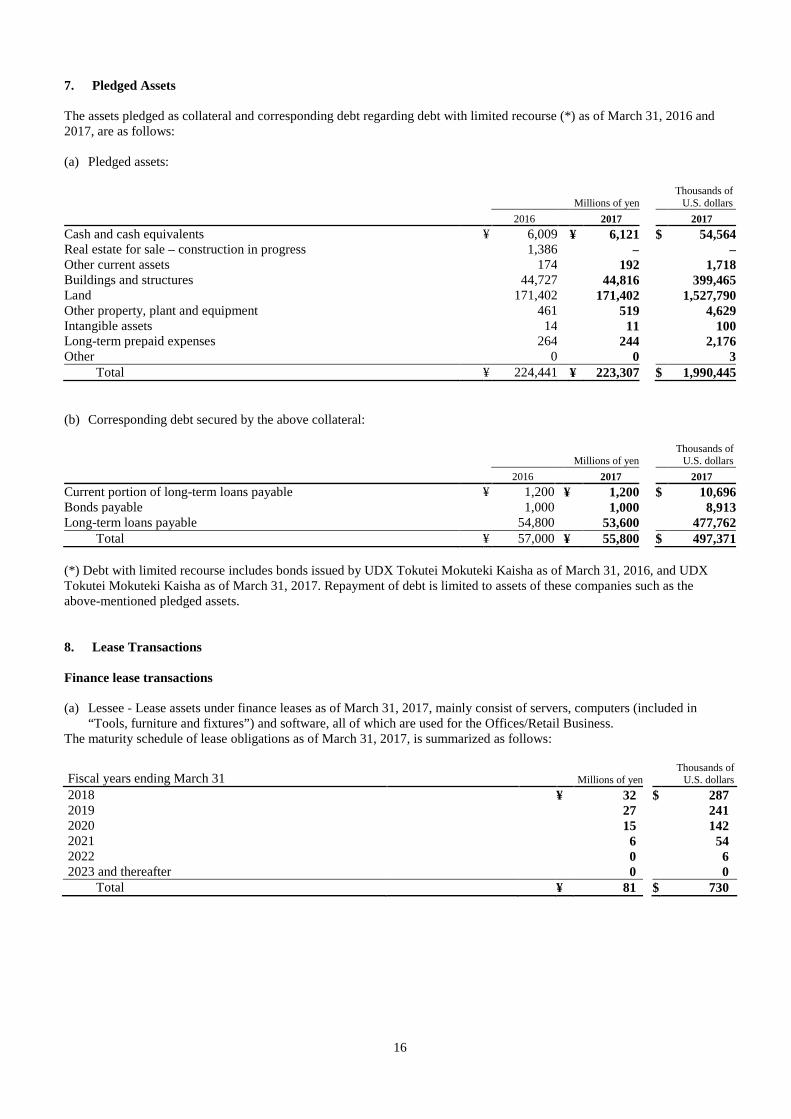
7. Pledged Assets The assets pledged as collateral and corresponding debt regarding debt with limited recourse (*) as of March 31, 2016 and 2017, are as follows:
(a) Pledged assets:
Millions of yen Thousands of
U.S. dollars 2016 2017 2017 Cash and cash equivalents ¥ 6,009 ¥ 6,121 $ 54,564 Real estate for sale – construction in progress 1,386 – – Other current assets 174 192 1,718 Buildings and structures 44,727 44,816 399,465 Land 171,402 171,402 1,527,790 Other property, plant and equipment 461 519 4,629 Intangible assets 14 11 100 Long-term prepaid expenses 264 244 2,176 Other 0 0 3
Total ¥ 224,441 ¥ 223,307 $ 1,990,445 (b) Corresponding debt secured by the above collateral:
Millions of yen Thousands of
U.S. dollars 2016 2017 2017 Current portion of long-term loans payable ¥ 1,200 ¥ 1,200 $ 10,696 Bonds payable 1,000 1,000 8,913 Long-term loans payable 54,800 53,600 477,762
Total ¥ 57,000 ¥ 55,800 $ 497,371 (*) Debt with limited recourse includes bonds issued by UDX Tokutei Mokuteki Kaisha as of March 31, 2016, and UDX Tokutei Mokuteki Kaisha as of March 31, 2017. Repayment of debt is limited to assets of these companies such as the above-mentioned pledged assets. 8. Lease Transactions Finance lease transactions (a) Lessee - Lease assets under finance leases as of March 31, 2017, mainly consist of servers, computers (included in
“Tools, furniture and fixtures”) and software, all of which are used for the Offices/Retail Business. The maturity schedule of lease obligations as of March 31, 2017, is summarized as follows:
Fiscal years ending March 31
Millions of yen Thousands of
U.S. dollars 2018 ¥ 32 $ 287 2019 27 241 2020 15 142 2021 6 54 2022 0 6 2023 and thereafter 0 0
Total ¥ 81 $ 730
17
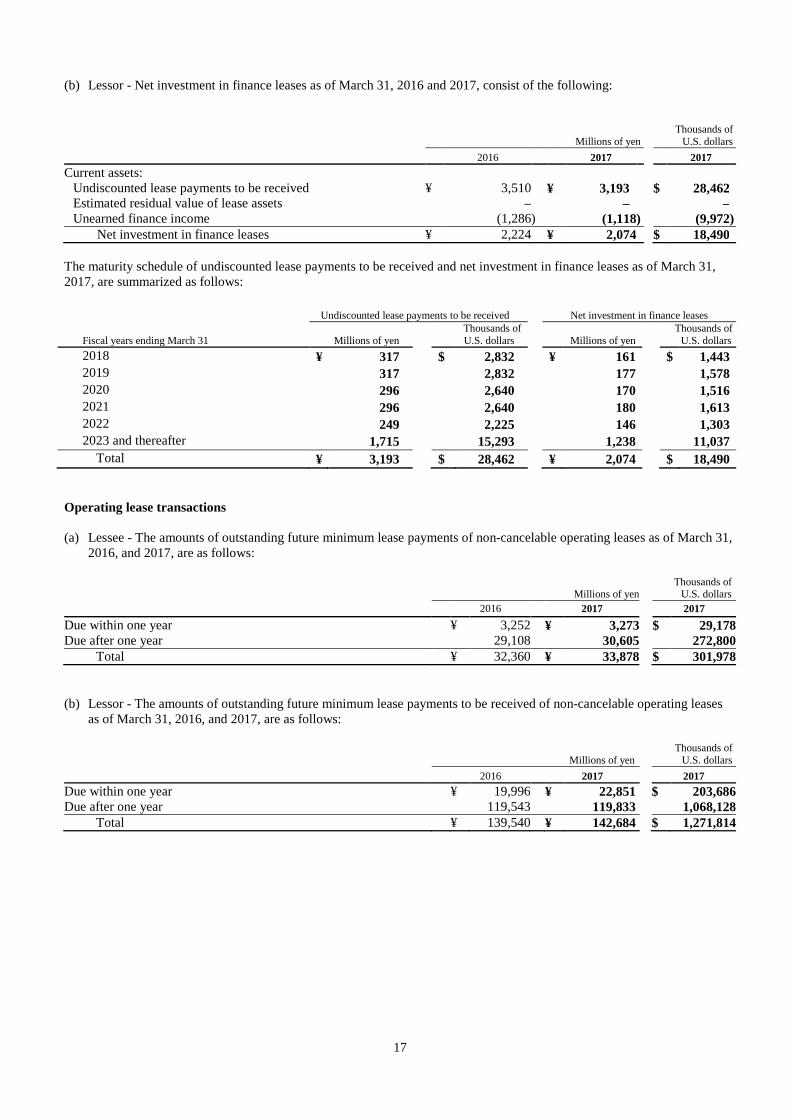
(b) Lessor - Net investment in finance leases as of March 31, 2016 and 2017, consist of the following:
Millions of yen Thousands of
U.S. dollars 2016 2017 2017
Current assets: Undiscounted lease payments to be received ¥ 3,510 ¥ 3,193 $ 28,462 Estimated residual value of lease assets – – – Unearned finance income (1,286 ) (1,118 ) (9,972 )
Net investment in finance leases ¥ 2,224 ¥ 2,074 $ 18,490 The maturity schedule of undiscounted lease payments to be received and net investment in finance leases as of March 31, 2017, are summarized as follows:
Undiscounted lease payments to be received Net investment in finance leases
Fiscal years ending March 31 Millions of yen Thousands of U.S. dollars Millions of yen
Thousands of U.S. dollars
2018 ¥ 317 $ 2,832 ¥ 161 $ 1,443 2019 317 2,832 177 1,578 2020 296 2,640 170 1,516 2021 296 2,640 180 1,613 2022 249 2,225 146 1,303 2023 and thereafter 1,715 15,293 1,238 11,037
Total ¥ 3,193 $ 28,462 ¥ 2,074 $ 18,490 Operating lease transactions
(a) Lessee - The amounts of outstanding future minimum lease payments of non-cancelable operating leases as of March 31,
2016, and 2017, are as follows:
Millions of yen Thousands of
U.S. dollars 2016 2017 2017 Due within one year ¥ 3,252 ¥ 3,273 $ 29,178 Due after one year 29,108 30,605 272,800
Total ¥ 32,360 ¥ 33,878 $ 301,978 (b) Lessor - The amounts of outstanding future minimum lease payments to be received of non-cancelable operating leases
as of March 31, 2016, and 2017, are as follows:
Millions of yen Thousands of
U.S. dollars 2016 2017 2017 Due within one year ¥ 19,996 ¥ 22,851 $ 203,686 Due after one year 119,543 119,833 1,068,128
Total ¥ 139,540 ¥ 142,684 $ 1,271,814
18
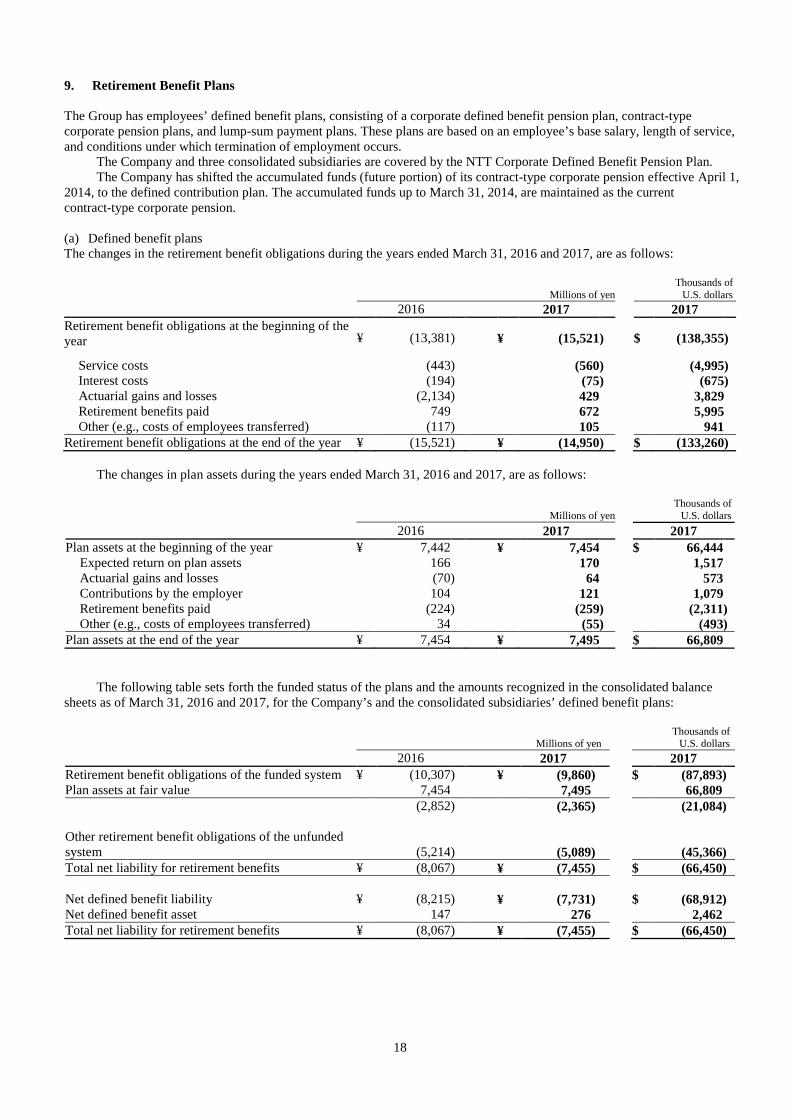
9. Retirement Benefit Plans The Group has employees’ defined benefit plans, consisting of a corporate defined benefit pension plan, contract-type corporate pension plans, and lump-sum payment plans. These plans are based on an employee’s base salary, length of service, and conditions under which termination of employment occurs.
The Company and three consolidated subsidiaries are covered by the NTT Corporate Defined Benefit Pension Plan. The Company has shifted the accumulated funds (future portion) of its contract-type corporate pension effective April 1,
2014, to the defined contribution plan. The accumulated funds up to March 31, 2014, are maintained as the current contract-type corporate pension. (a) Defined benefit plans The changes in the retirement benefit obligations during the years ended March 31, 2016 and 2017, are as follows:
Millions of yen Thousands of
U.S. dollars 2016 2017 2017 Retirement benefit obligations at the beginning of the year ¥ (13,381 ) ¥ (15,521 ) $ (138,355 )
Service costs (443 ) (560 ) (4,995 ) Interest costs (194 ) (75 ) (675 ) Actuarial gains and losses (2,134 ) 429 3,829 Retirement benefits paid 749 672 5,995 Other (e.g., costs of employees transferred) (117 ) 105 941
Retirement benefit obligations at the end of the year ¥ (15,521 ) ¥ (14,950 ) $ (133,260 )
The changes in plan assets during the years ended March 31, 2016 and 2017, are as follows:
Millions of yen Thousands of
U.S. dollars 2016 2017 2017 Plan assets at the beginning of the year ¥ 7,442 ¥ 7,454 $ 66,444
Expected return on plan assets 166 170 1,517 Actuarial gains and losses (70 ) 64 573 Contributions by the employer 104 121 1,079 Retirement benefits paid (224 ) (259 ) (2,311 ) Other (e.g., costs of employees transferred) 34 (55 ) (493 )
Plan assets at the end of the year ¥ 7,454 ¥ 7,495 $ 66,809
The following table sets forth the funded status of the plans and the amounts recognized in the consolidated balance sheets as of March 31, 2016 and 2017, for the Company’s and the consolidated subsidiaries’ defined benefit plans:
Millions of yen Thousands of
U.S. dollars 2016 2017 2017 Retirement benefit obligations of the funded system ¥ (10,307 ) ¥ (9,860 ) $ (87,893 ) Plan assets at fair value 7,454 7,495 66,809 (2,852 ) (2,365 ) (21,084 ) Other retirement benefit obligations of the unfunded system (5,214 )
(5,089 )
(45,366 )
Total net liability for retirement benefits ¥ (8,067 ) ¥ (7,455 ) $ (66,450 ) Net defined benefit liability ¥ (8,215 ) ¥ (7,731 ) $ (68,912 ) Net defined benefit asset 147 276 2,462 Total net liability for retirement benefits ¥ (8,067 ) ¥ (7,455 ) $ (66,450 )
19
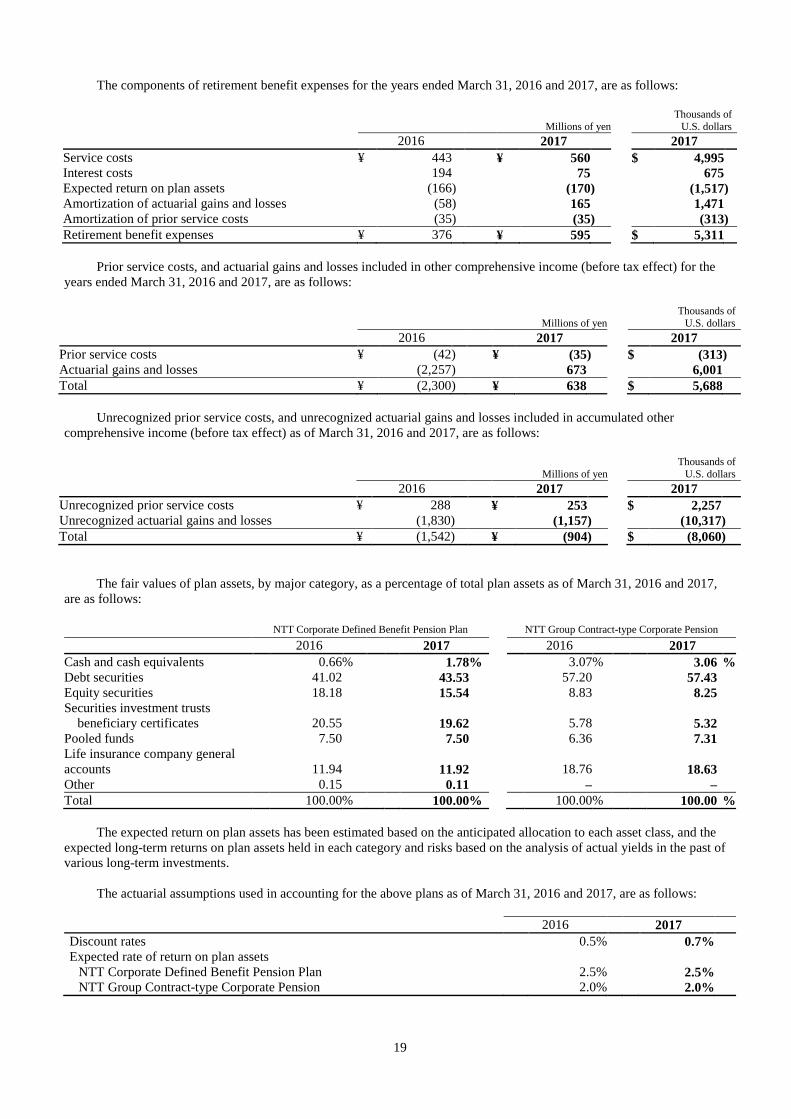
The components of retirement benefit expenses for the years ended March 31, 2016 and 2017, are as follows:
Millions of yen Thousands of U.S. dollars
2016 2017 2017 Service costs ¥ 443 ¥ 560 $ 4,995 Interest costs 194 75 675 Expected return on plan assets (166 ) (170 ) (1,517 ) Amortization of actuarial gains and losses (58 ) 165 1,471 Amortization of prior service costs (35 ) (35 ) (313 ) Retirement benefit expenses ¥ 376 ¥ 595 $ 5,311
Prior service costs, and actuarial gains and losses included in other comprehensive income (before tax effect) for the years ended March 31, 2016 and 2017, are as follows:
Millions of yen Thousands of U.S. dollars
2016 2017 2017 Prior service costs ¥ (42 ) ¥ (35 ) $ (313 ) Actuarial gains and losses (2,257 ) 673 6,001 Total ¥ (2,300 ) ¥ 638 $ 5,688
Unrecognized prior service costs, and unrecognized actuarial gains and losses included in accumulated other comprehensive income (before tax effect) as of March 31, 2016 and 2017, are as follows:
Millions of yen Thousands of U.S. dollars
2016 2017 2017 Unrecognized prior service costs ¥ 288 ¥ 253 $ 2,257 Unrecognized actuarial gains and losses (1,830 ) (1,157 ) (10,317 ) Total ¥ (1,542 ) ¥ (904 ) $ (8,060 )
The fair values of plan assets, by major category, as a percentage of total plan assets as of March 31, 2016 and 2017, are as follows: NTT Corporate Defined Benefit Pension Plan NTT Group Contract-type Corporate Pension 2016 2017 2016 2017 Cash and cash equivalents 0.66 % 1.78 % 3.07 % 3.06 % Debt securities 41.02 43.53 57.20 57.43 Equity securities 18.18 15.54 8.83 8.25 Securities investment trusts
beneficiary certificates 20.55 19.62 5.78
5.32
Pooled funds 7.50 7.50 6.36 7.31 Life insurance company general accounts 11.94 11.92 18.76
18.63
Other 0.15 0.11 – – Total 100.00 % 100.00 % 100.00 % 100.00 %
The expected return on plan assets has been estimated based on the anticipated allocation to each asset class, and the expected long-term returns on plan assets held in each category and risks based on the analysis of actual yields in the past of various long-term investments.
The actuarial assumptions used in accounting for the above plans as of March 31, 2016 and 2017, are as follows: 2016 2017
Discount rates 0.5% 0.7% Expected rate of return on plan assets
NTT Corporate Defined Benefit Pension Plan 2.5% 2.5% NTT Group Contract-type Corporate Pension 2.0% 2.0%
20
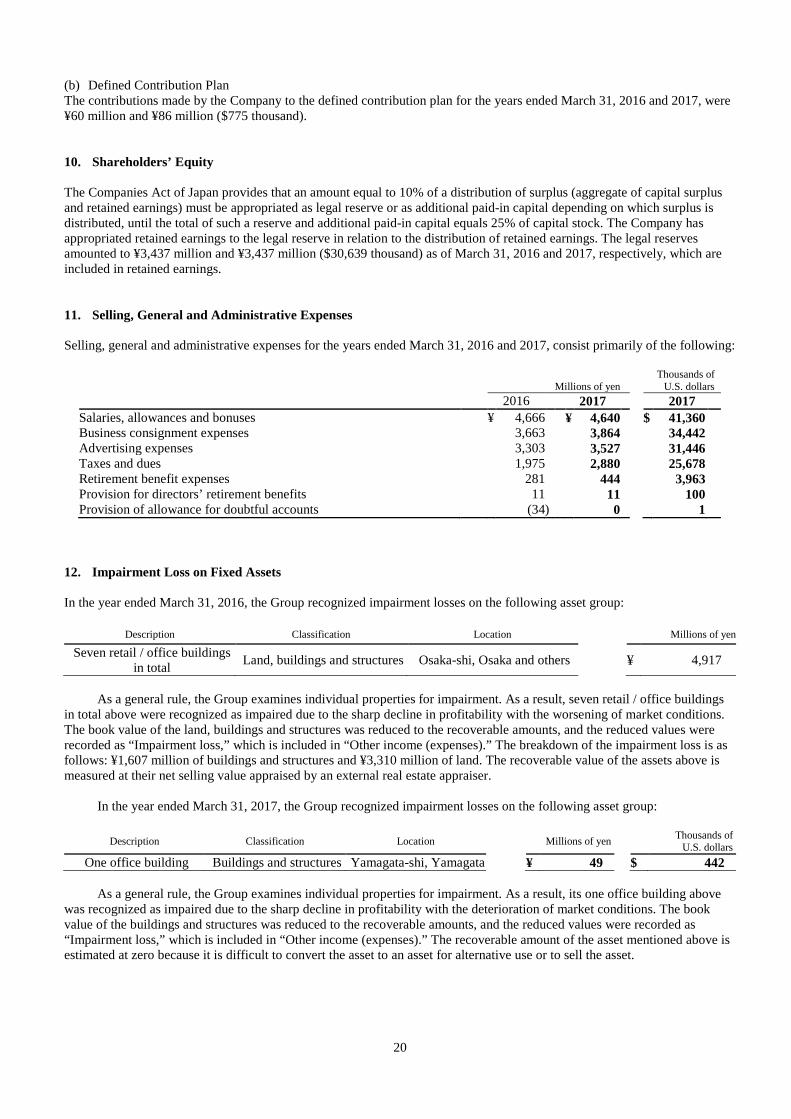
(b) Defined Contribution Plan The contributions made by the Company to the defined contribution plan for the years ended March 31, 2016 and 2017, were ¥60 million and ¥86 million ($775 thousand).
10. Shareholders’ Equity The Companies Act of Japan provides that an amount equal to 10% of a distribution of surplus (aggregate of capital surplus and retained earnings) must be appropriated as legal reserve or as additional paid-in capital depending on which surplus is distributed, until the total of such a reserve and additional paid-in capital equals 25% of capital stock. The Company has appropriated retained earnings to the legal reserve in relation to the distribution of retained earnings. The legal reserves amounted to ¥3,437 million and ¥3,437 million ($30,639 thousand) as of March 31, 2016 and 2017, respectively, which are included in retained earnings. 11. Selling, General and Administrative Expenses Selling, general and administrative expenses for the years ended March 31, 2016 and 2017, consist primarily of the following:
Millions of yen Thousands of
U.S. dollars 2016 2017 2017 Salaries, allowances and bonuses ¥ 4,666 ¥ 4,640 $ 41,360 Business consignment expenses 3,663 3,864 34,442 Advertising expenses 3,303 3,527 31,446 Taxes and dues 1,975 2,880 25,678 Retirement benefit expenses 281 444 3,963 Provision for directors’ retirement benefits 11 11 100 Provision of allowance for doubtful accounts (34 ) 0 1
12. Impairment Loss on Fixed Assets In the year ended March 31, 2016, the Group recognized impairment losses on the following asset group:
Description Classification Location Millions of yen
Seven retail / office buildings in total Land, buildings and structures Osaka-shi, Osaka and others
¥ 4,917
As a general rule, the Group examines individual properties for impairment. As a result, seven retail / office buildings
in total above were recognized as impaired due to the sharp decline in profitability with the worsening of market conditions. The book value of the land, buildings and structures was reduced to the recoverable amounts, and the reduced values were recorded as “Impairment loss,” which is included in “Other income (expenses).” The breakdown of the impairment loss is as follows: ¥1,607 million of buildings and structures and ¥3,310 million of land. The recoverable value of the assets above is measured at their net selling value appraised by an external real estate appraiser.
In the year ended March 31, 2017, the Group recognized impairment losses on the following asset group:
Description Classification Location Millions of yen
Thousands of U.S. dollars
One office building Buildings and structures Yamagata-shi, Yamagata ¥ 49 $ 442
As a general rule, the Group examines individual properties for impairment. As a result, its one office building above was recognized as impaired due to the sharp decline in profitability with the deterioration of market conditions. The book value of the buildings and structures was reduced to the recoverable amounts, and the reduced values were recorded as “Impairment loss,” which is included in “Other income (expenses).” The recoverable amount of the asset mentioned above is estimated at zero because it is difficult to convert the asset to an asset for alternative use or to sell the asset.
21
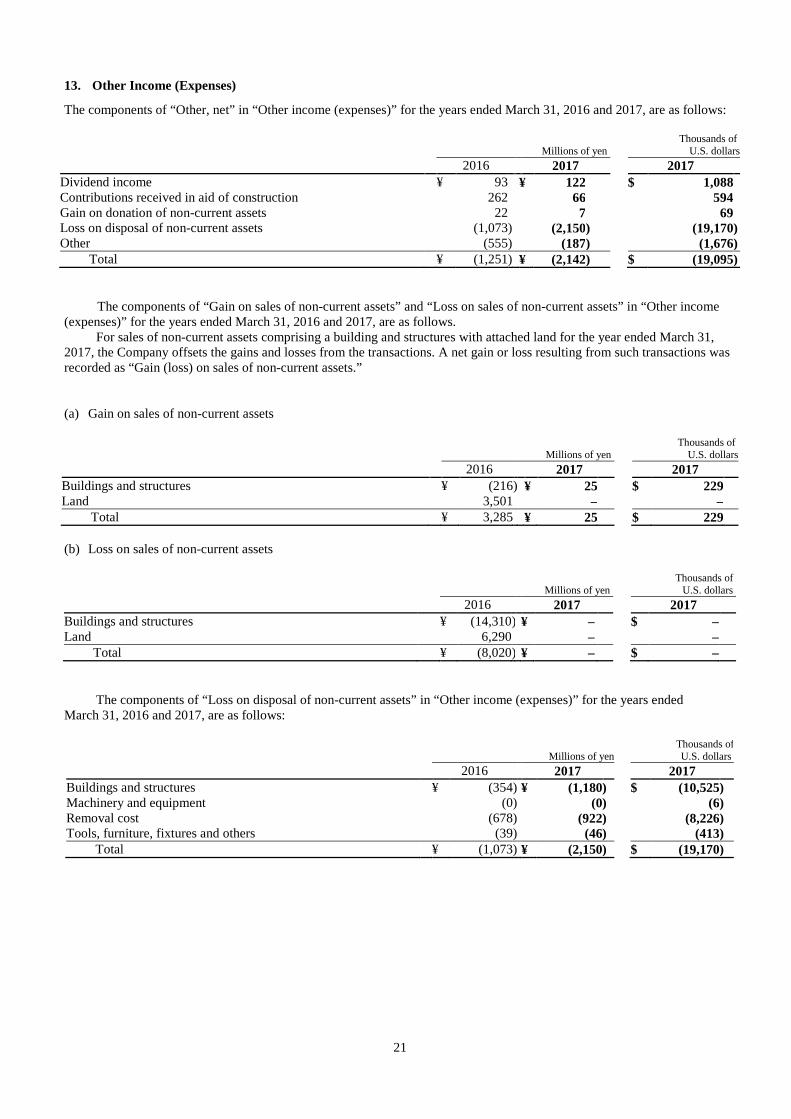
13. Other Income (Expenses)
The components of “Other, net” in “Other income (expenses)” for the years ended March 31, 2016 and 2017, are as follows:
Millions of yen Thousands of
U.S. dollars 2016 2017 2017 Dividend income ¥ 93 ¥ 122 $ 1,088 Contributions received in aid of construction 262 66 594 Gain on donation of non-current assets 22 7 69 Loss on disposal of non-current assets (1,073 ) (2,150 ) (19,170 ) Other (555 ) (187 ) (1,676 )
Total ¥ (1,251 ) ¥ (2,142 ) $ (19,095 ) The components of “Gain on sales of non-current assets” and “Loss on sales of non-current assets” in “Other income
(expenses)” for the years ended March 31, 2016 and 2017, are as follows. For sales of non-current assets comprising a building and structures with attached land for the year ended March 31,
2017, the Company offsets the gains and losses from the transactions. A net gain or loss resulting from such transactions was recorded as “Gain (loss) on sales of non-current assets.”
(a) Gain on sales of non-current assets
Millions of yen Thousands of
U.S. dollars 2016 2017 2017 Buildings and structures ¥ (216 ) ¥ 25 $ 229 Land 3,501 – –
Total ¥ 3,285 ¥ 25 $ 229 (b) Loss on sales of non-current assets
Millions of yen Thousands of
U.S. dollars 2016 2017 2017 Buildings and structures ¥ (14,310 ) ¥ – $ – Land 6,290 – –
Total ¥ (8,020 ) ¥ – $ –
The components of “Loss on disposal of non-current assets” in “Other income (expenses)” for the years ended March 31, 2016 and 2017, are as follows:
Millions of yen Thousands of U.S. dollars
2016 2017 2017 Buildings and structures ¥ (354 ) ¥ (1,180 ) $ (10,525 ) Machinery and equipment (0 ) (0 ) (6 ) Removal cost (678 ) (922 ) (8,226 ) Tools, furniture, fixtures and others (39 ) (46 ) (413 )
Total ¥ (1,073 ) ¥ (2,150 ) $ (19,170 )
22
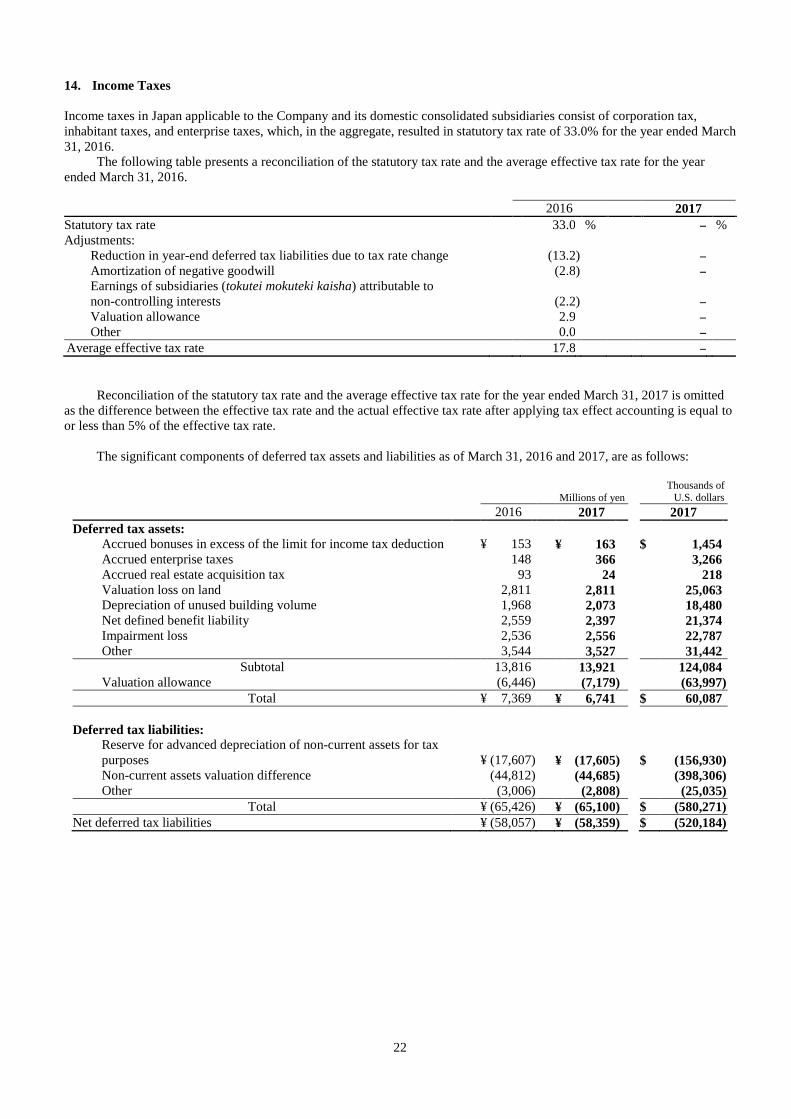
14. Income Taxes Income taxes in Japan applicable to the Company and its domestic consolidated subsidiaries consist of corporation tax, inhabitant taxes, and enterprise taxes, which, in the aggregate, resulted in statutory tax rate of 33.0% for the year ended March 31, 2016.
The following table presents a reconciliation of the statutory tax rate and the average effective tax rate for the year ended March 31, 2016. 2016 2017 Statutory tax rate 33.0 % – % Adjustments:
Reduction in year-end deferred tax liabilities due to tax rate change (13.2 ) – Amortization of negative goodwill (2.8 ) – Earnings of subsidiaries (tokutei mokuteki kaisha) attributable to non-controlling interests (2.2 )
–
Valuation allowance 2.9 – Other 0.0 –
Average effective tax rate 17.8 –
Reconciliation of the statutory tax rate and the average effective tax rate for the year ended March 31, 2017 is omitted as the difference between the effective tax rate and the actual effective tax rate after applying tax effect accounting is equal to or less than 5% of the effective tax rate.
The significant components of deferred tax assets and liabilities as of March 31, 2016 and 2017, are as follows:
Millions of yen Thousands of
U.S. dollars 2016 2017 2017 Deferred tax assets:
Accrued bonuses in excess of the limit for income tax deduction ¥ 153 ¥ 163 $ 1,454 Accrued enterprise taxes 148 366 3,266 Accrued real estate acquisition tax 93 24 218 Valuation loss on land 2,811 2,811 25,063 Depreciation of unused building volume 1,968 2,073 18,480 Net defined benefit liability 2,559 2,397 21,374 Impairment loss 2,536 2,556 22,787 Other 3,544 3,527 31,442
Subtotal 13,816 13,921 124,084 Valuation allowance (6,446 ) (7,179 ) (63,997 )
Total ¥ 7,369 ¥ 6,741 $ 60,087 Deferred tax liabilities:
Reserve for advanced depreciation of non-current assets for tax purposes ¥ (17,607 ) ¥ (17,605 ) $ (156,930 ) Non-current assets valuation difference (44,812 ) (44,685 ) (398,306 ) Other (3,006 ) (2,808 ) (25,035 )
Total ¥ (65,426 ) ¥ (65,100 ) $ (580,271 ) Net deferred tax liabilities ¥ (58,057 ) ¥ (58,359 ) $ (520,184 )
23
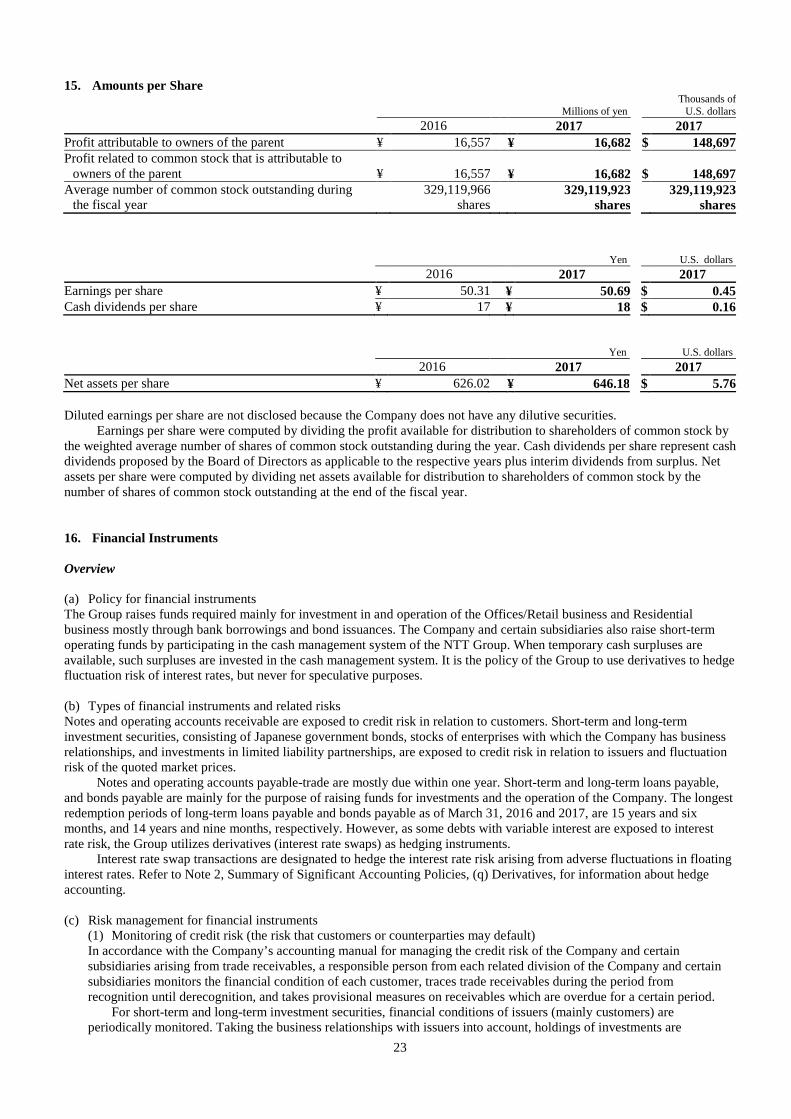
15. Amounts per Share
Millions of yen Thousands of
U.S. dollars 2016 2017 2017 Profit attributable to owners of the parent ¥ 16,557 ¥ 16,682 $ 148,697 Profit related to common stock that is attributable to
owners of the parent ¥ 16,557 ¥ 16,682 $ 148,697 Average number of common stock outstanding during
the fiscal year 329,119,966
shares 329,119,923
shares 329,119,923
shares
Yen U.S. dollars 2016 2017 2017 Earnings per share ¥ 50.31 ¥ 50.69 $ 0.45 Cash dividends per share ¥ 17 ¥ 18 $ 0.16 Yen U.S. dollars 2016 2017 2017 Net assets per share ¥ 626.02 ¥ 646.18 $ 5.76
Diluted earnings per share are not disclosed because the Company does not have any dilutive securities.
Earnings per share were computed by dividing the profit available for distribution to shareholders of common stock by the weighted average number of shares of common stock outstanding during the year. Cash dividends per share represent cash dividends proposed by the Board of Directors as applicable to the respective years plus interim dividends from surplus. Net assets per share were computed by dividing net assets available for distribution to shareholders of common stock by the number of shares of common stock outstanding at the end of the fiscal year. 16. Financial Instruments Overview (a) Policy for financial instruments The Group raises funds required mainly for investment in and operation of the Offices/Retail business and Residential business mostly through bank borrowings and bond issuances. The Company and certain subsidiaries also raise short-term operating funds by participating in the cash management system of the NTT Group. When temporary cash surpluses are available, such surpluses are invested in the cash management system. It is the policy of the Group to use derivatives to hedge fluctuation risk of interest rates, but never for speculative purposes. (b) Types of financial instruments and related risks Notes and operating accounts receivable are exposed to credit risk in relation to customers. Short-term and long-term investment securities, consisting of Japanese government bonds, stocks of enterprises with which the Company has business relationships, and investments in limited liability partnerships, are exposed to credit risk in relation to issuers and fluctuation risk of the quoted market prices.
Notes and operating accounts payable-trade are mostly due within one year. Short-term and long-term loans payable, and bonds payable are mainly for the purpose of raising funds for investments and the operation of the Company. The longest redemption periods of long-term loans payable and bonds payable as of March 31, 2016 and 2017, are 15 years and six months, and 14 years and nine months, respectively. However, as some debts with variable interest are exposed to interest rate risk, the Group utilizes derivatives (interest rate swaps) as hedging instruments.
Interest rate swap transactions are designated to hedge the interest rate risk arising from adverse fluctuations in floating interest rates. Refer to Note 2, Summary of Significant Accounting Policies, (q) Derivatives, for information about hedge accounting. (c) Risk management for financial instruments
(1) Monitoring of credit risk (the risk that customers or counterparties may default) In accordance with the Company’s accounting manual for managing the credit risk of the Company and certain subsidiaries arising from trade receivables, a responsible person from each related division of the Company and certain subsidiaries monitors the financial condition of each customer, traces trade receivables during the period from recognition until derecognition, and takes provisional measures on receivables which are overdue for a certain period.
For short-term and long-term investment securities, financial conditions of issuers (mainly customers) are periodically monitored. Taking the business relationships with issuers into account, holdings of investments are
24
continuously reviewed for all investments other than Japanese government bonds. Credit risk is not usually recognized for Japanese government bonds.
The Company’s management believes that credit risk arising from derivative transactions would be immaterial because the counterparties of such transactions are limited to banks with high credit ratings.
(2) Monitoring of market risk (the risk arising from fluctuations in exchange rates and interest rates) The Company and certain consolidated subsidiaries raise funds mainly through fixed-rate bank borrowings. For some borrowings with variable interest, interest rate swaps are utilized to reduce the risk related to adverse fluctuations in the interest expenses.
For short-term and long-term investment securities, their quoted market prices, market conditions, and the financial conditions of issuers are periodically monitored.
Derivatives are executed by the Accounting and Finance Department of the Company with approval of an authorized person in accordance with the risk management guidelines related to financial instruments, which prescribe hedging instruments, authorized persons, and limits for transaction amounts.
(3) Monitoring of liquidity risk (the risk that the Group may not be able to meet their obligations on scheduled payment
due dates) The Company and certain consolidated subsidiaries manage liquidity risk by securing flexibility in liquidity, using a cash flow plan, which is timely prepared and updated by the Accounting and Finance Department of the Company based on related reports from each relevant division and participating in the cash management system of the NTT Group.
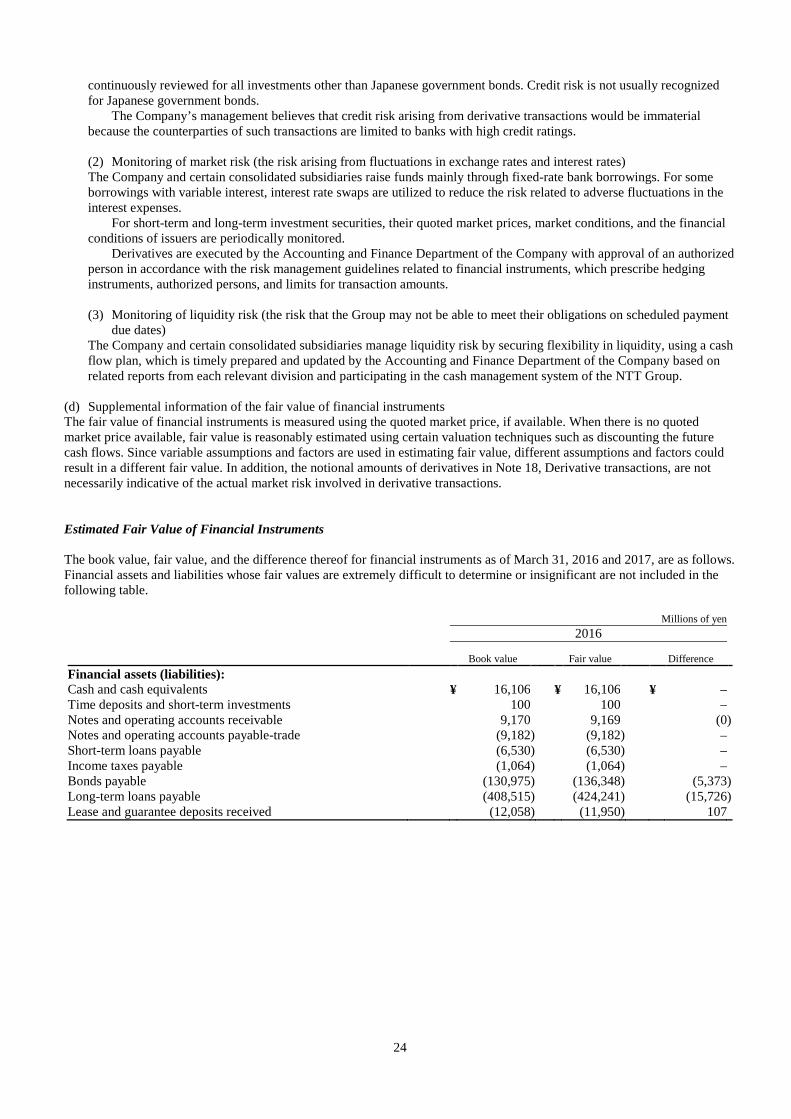
(d) Supplemental information of the fair value of financial instruments The fair value of financial instruments is measured using the quoted market price, if available. When there is no quoted market price available, fair value is reasonably estimated using certain valuation techniques such as discounting the future cash flows. Since variable assumptions and factors are used in estimating fair value, different assumptions and factors could result in a different fair value. In addition, the notional amounts of derivatives in Note 18, Derivative transactions, are not necessarily indicative of the actual market risk involved in derivative transactions. Estimated Fair Value of Financial Instruments The book value, fair value, and the difference thereof for financial instruments as of March 31, 2016 and 2017, are as follows. Financial assets and liabilities whose fair values are extremely difficult to determine or insignificant are not included in the following table.
Millions of yen
2016
Book value Fair value Difference Financial assets (liabilities): Cash and cash equivalents ¥ 16,106 ¥ 16,106 ¥ – Time deposits and short-term investments 100 100 – Notes and operating accounts receivable 9,170 9,169 (0 ) Notes and operating accounts payable-trade (9,182 ) (9,182 ) – Short-term loans payable (6,530 ) (6,530 ) – Income taxes payable (1,064 ) (1,064 ) – Bonds payable (130,975 ) (136,348 ) (5,373 ) Long-term loans payable (408,515 ) (424,241 ) (15,726 ) Lease and guarantee deposits received (12,058 ) (11,950 ) 107
25
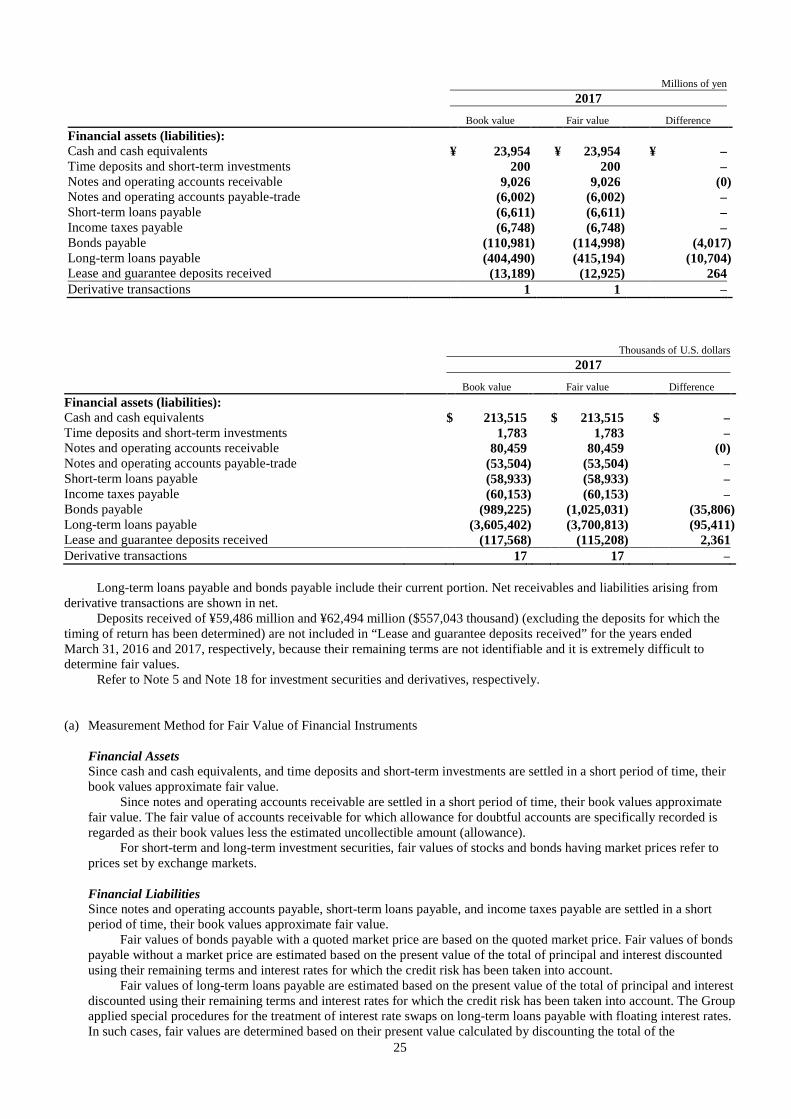
Millions of yen
2017
Book value Fair value Difference Financial assets (liabilities): Cash and cash equivalents ¥ 23,954 ¥ 23,954 ¥ – Time deposits and short-term investments 200 200 – Notes and operating accounts receivable 9,026 9,026 (0 ) Notes and operating accounts payable-trade (6,002 ) (6,002 ) – Short-term loans payable (6,611 ) (6,611 ) – Income taxes payable (6,748 ) (6,748 ) – Bonds payable (110,981 ) (114,998 ) (4,017 ) Long-term loans payable (404,490 ) (415,194 ) (10,704 ) Lease and guarantee deposits received (13,189 ) (12,925 ) 264 Derivative transactions 1 1 ‒
Thousands of U.S. dollars
2017
Book value Fair value Difference Financial assets (liabilities): Cash and cash equivalents $ 213,515 $ 213,515 $ – Time deposits and short-term investments 1,783 1,783 – Notes and operating accounts receivable 80,459 80,459 (0) Notes and operating accounts payable-trade (53,504 ) (53,504 ) ‒ Short-term loans payable (58,933 ) (58,933 ) ‒ Income taxes payable (60,153 ) (60,153 ) ‒ Bonds payable (989,225 ) (1,025,031 ) (35,806 ) Long-term loans payable (3,605,402 ) (3,700,813 ) (95,411 ) Lease and guarantee deposits received (117,568 ) (115,208 ) 2,361 Derivative transactions 17 17 ‒
Long-term loans payable and bonds payable include their current portion. Net receivables and liabilities arising from derivative transactions are shown in net.
Deposits received of ¥59,486 million and ¥62,494 million ($557,043 thousand) (excluding the deposits for which the timing of return has been determined) are not included in “Lease and guarantee deposits received” for the years ended March 31, 2016 and 2017, respectively, because their remaining terms are not identifiable and it is extremely difficult to determine fair values.
Refer to Note 5 and Note 18 for investment securities and derivatives, respectively.
(a) Measurement Method for Fair Value of Financial Instruments Financial Assets Since cash and cash equivalents, and time deposits and short-term investments are settled in a short period of time, their book values approximate fair value.
Since notes and operating accounts receivable are settled in a short period of time, their book values approximate fair value. The fair value of accounts receivable for which allowance for doubtful accounts are specifically recorded is regarded as their book values less the estimated uncollectible amount (allowance).
For short-term and long-term investment securities, fair values of stocks and bonds having market prices refer to prices set by exchange markets. Financial Liabilities Since notes and operating accounts payable, short-term loans payable, and income taxes payable are settled in a short period of time, their book values approximate fair value.
Fair values of bonds payable with a quoted market price are based on the quoted market price. Fair values of bonds payable without a market price are estimated based on the present value of the total of principal and interest discounted using their remaining terms and interest rates for which the credit risk has been taken into account.
Fair values of long-term loans payable are estimated based on the present value of the total of principal and interest discounted using their remaining terms and interest rates for which the credit risk has been taken into account. The Group applied special procedures for the treatment of interest rate swaps on long-term loans payable with floating interest rates. In such cases, fair values are determined based on their present value calculated by discounting the total of the
26
outstanding principal and interest on the principal amount outstanding that are accounted for together with the corresponding interest rate swap at a discount rate that reflects the remaining term of the long-term loans payable and credit risk.
Fair value of lease and guarantee deposits received are estimated based on the present value of deposits received (for which the timing of return has been determined) and guarantee deposits discounted using their remaining term and interest rates for which the credit risk has been taken into account.
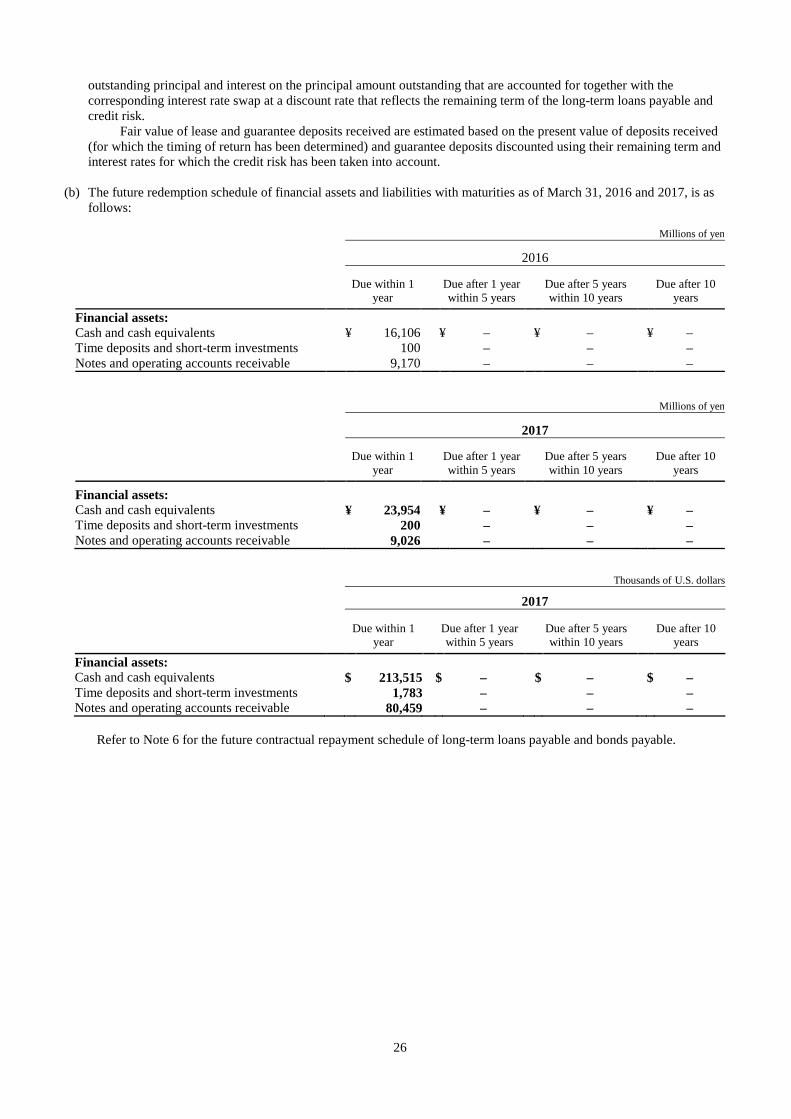
(b) The future redemption schedule of financial assets and liabilities with maturities as of March 31, 2016 and 2017, is as follows:
Millions of yen
2016
Due within 1 year Due after 1 year
within 5 years Due after 5 years within 10 years Due after 10
years Financial assets: Cash and cash equivalents ¥ 16,106 ¥ – ¥ – ¥ – Time deposits and short-term investments 100 – – – Notes and operating accounts receivable 9,170 – – –
Millions of yen
2017
Due within 1 year Due after 1 year
within 5 years Due after 5 years within 10 years Due after 10
years
Financial assets: Cash and cash equivalents ¥ 23,954 ¥ – ¥ – ¥ – Time deposits and short-term investments 200 – – – Notes and operating accounts receivable 9,026 – – –
Thousands of U.S. dollars
2017
Due within 1 year Due after 1 year
within 5 years Due after 5 years within 10 years Due after 10
years Financial assets: Cash and cash equivalents $ 213,515 $ – $ – $ – Time deposits and short-term investments 1,783 – – – Notes and operating accounts receivable 80,459 – – –
Refer to Note 6 for the future contractual repayment schedule of long-term loans payable and bonds payable.
27
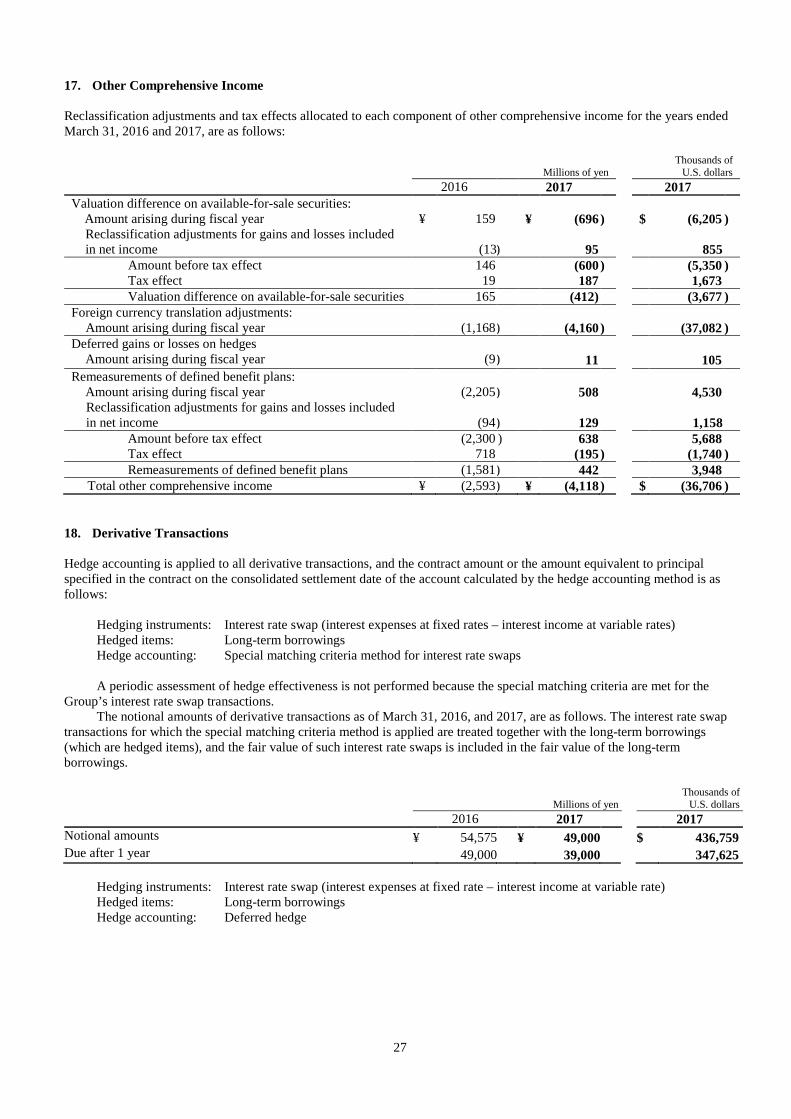
17. Other Comprehensive Income Reclassification adjustments and tax effects allocated to each component of other comprehensive income for the years ended March 31, 2016 and 2017, are as follows:
Millions of yen
Thousands of U.S. dollars
2016 2017 2017 Valuation difference on available-for-sale securities:
Amount arising during fiscal year ¥ 159 ¥ (696 ) $ (6,205 ) Reclassification adjustments for gains and losses included in net income
(13
)
95
855 Amount before tax effect 146 (600 ) (5,350 ) Tax effect 19 187 1,673 Valuation difference on available-for-sale securities 165 (412) (3,677 )
Foreign currency translation adjustments: Amount arising during fiscal year (1,168 ) (4,160 ) (37,082 )
Deferred gains or losses on hedges Amount arising during fiscal year (9 ) 11 105
Remeasurements of defined benefit plans: Amount arising during fiscal year (2,205 ) 508 4,530 Reclassification adjustments for gains and losses included in net income
(94
) 129
1,158 Amount before tax effect (2,300 ) 638 5,688 Tax effect 718 (195 ) (1,740 ) Remeasurements of defined benefit plans (1,581 ) 442 3,948
Total other comprehensive income ¥ (2,593 ) ¥ (4,118 ) $ (36,706 ) 18. Derivative Transactions Hedge accounting is applied to all derivative transactions, and the contract amount or the amount equivalent to principal specified in the contract on the consolidated settlement date of the account calculated by the hedge accounting method is as follows:
Hedging instruments: Interest rate swap (interest expenses at fixed rates – interest income at variable rates) Hedged items: Long-term borrowings Hedge accounting: Special matching criteria method for interest rate swaps
A periodic assessment of hedge effectiveness is not performed because the special matching criteria are met for the
Group’s interest rate swap transactions. The notional amounts of derivative transactions as of March 31, 2016, and 2017, are as follows. The interest rate swap
transactions for which the special matching criteria method is applied are treated together with the long-term borrowings (which are hedged items), and the fair value of such interest rate swaps is included in the fair value of the long-term borrowings.
Millions of yen Thousands of
U.S. dollars 2016 2017 2017 Notional amounts ¥ 54,575 ¥ 49,000 $ 436,759 Due after 1 year 49,000 39,000 347,625
Hedging instruments: Interest rate swap (interest expenses at fixed rate – interest income at variable rate) Hedged items: Long-term borrowings Hedge accounting: Deferred hedge
28
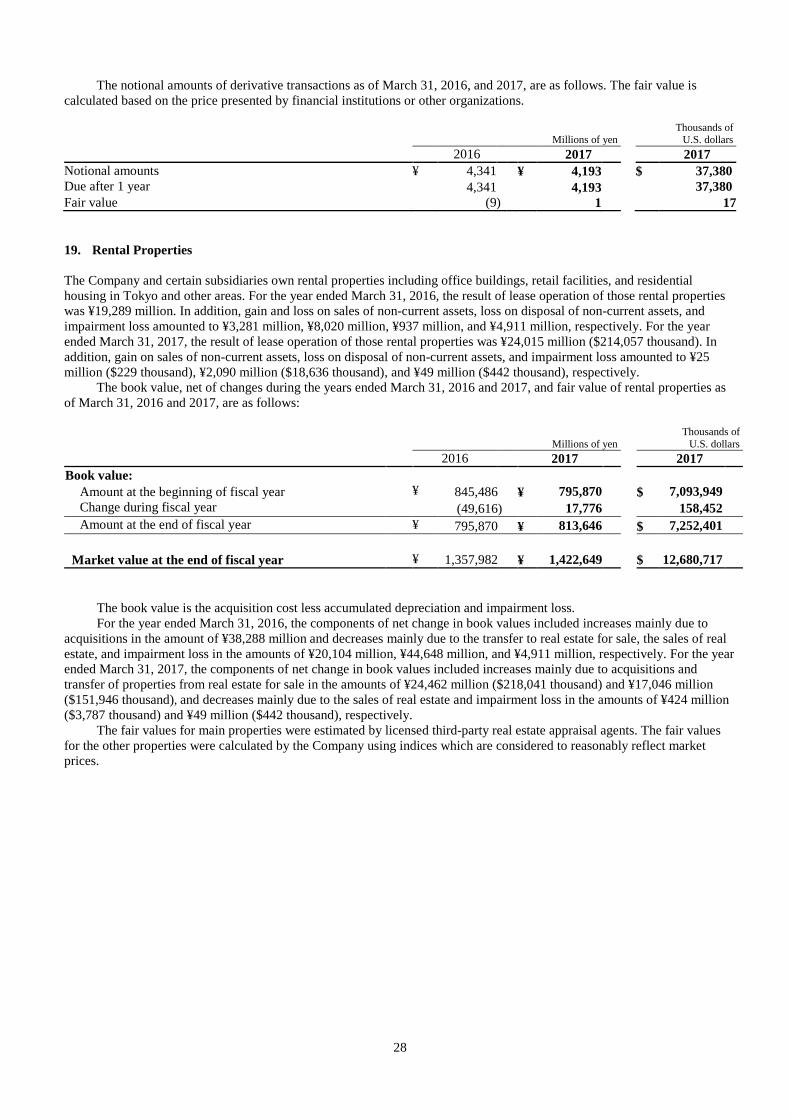
The notional amounts of derivative transactions as of March 31, 2016, and 2017, are as follows. The fair value is calculated based on the price presented by financial institutions or other organizations.
19. Rental Properties The Company and certain subsidiaries own rental properties including office buildings, retail facilities, and residential housing in Tokyo and other areas. For the year ended March 31, 2016, the result of lease operation of those rental properties was ¥19,289 million. In addition, gain and loss on sales of non-current assets, loss on disposal of non-current assets, and impairment loss amounted to ¥3,281 million, ¥8,020 million, ¥937 million, and ¥4,911 million, respectively. For the year ended March 31, 2017, the result of lease operation of those rental properties was ¥24,015 million ($214,057 thousand). In addition, gain on sales of non-current assets, loss on disposal of non-current assets, and impairment loss amounted to ¥25 million ($229 thousand), ¥2,090 million ($18,636 thousand), and ¥49 million ($442 thousand), respectively.
The book value, net of changes during the years ended March 31, 2016 and 2017, and fair value of rental properties as of March 31, 2016 and 2017, are as follows:
Millions of yen Thousands of
U.S. dollars 2016 2017 2017 Book value:
Amount at the beginning of fiscal year ¥ 845,486 ¥ 795,870 $ 7,093,949 Change during fiscal year (49,616 ) 17,776 158,452 Amount at the end of fiscal year ¥ 795,870 ¥ 813,646 $ 7,252,401
Market value at the end of fiscal year ¥ 1,357,982 ¥ 1,422,649 $ 12,680,717
The book value is the acquisition cost less accumulated depreciation and impairment loss. For the year ended March 31, 2016, the components of net change in book values included increases mainly due to
acquisitions in the amount of ¥38,288 million and decreases mainly due to the transfer to real estate for sale, the sales of real estate, and impairment loss in the amounts of ¥20,104 million, ¥44,648 million, and ¥4,911 million, respectively. For the year ended March 31, 2017, the components of net change in book values included increases mainly due to acquisitions and transfer of properties from real estate for sale in the amounts of ¥24,462 million ($218,041 thousand) and ¥17,046 million ($151,946 thousand), and decreases mainly due to the sales of real estate and impairment loss in the amounts of ¥424 million ($3,787 thousand) and ¥49 million ($442 thousand), respectively.
The fair values for main properties were estimated by licensed third-party real estate appraisal agents. The fair values for the other properties were calculated by the Company using indices which are considered to reasonably reflect market prices.
Millions of yen Thousands of
U.S. dollars 2016 2017 2017 Notional amounts ¥ 4,341 ¥ 4,193 $ 37,380 Due after 1 year 4,341 4,193 37,380 Fair value (9 ) 1 17
29
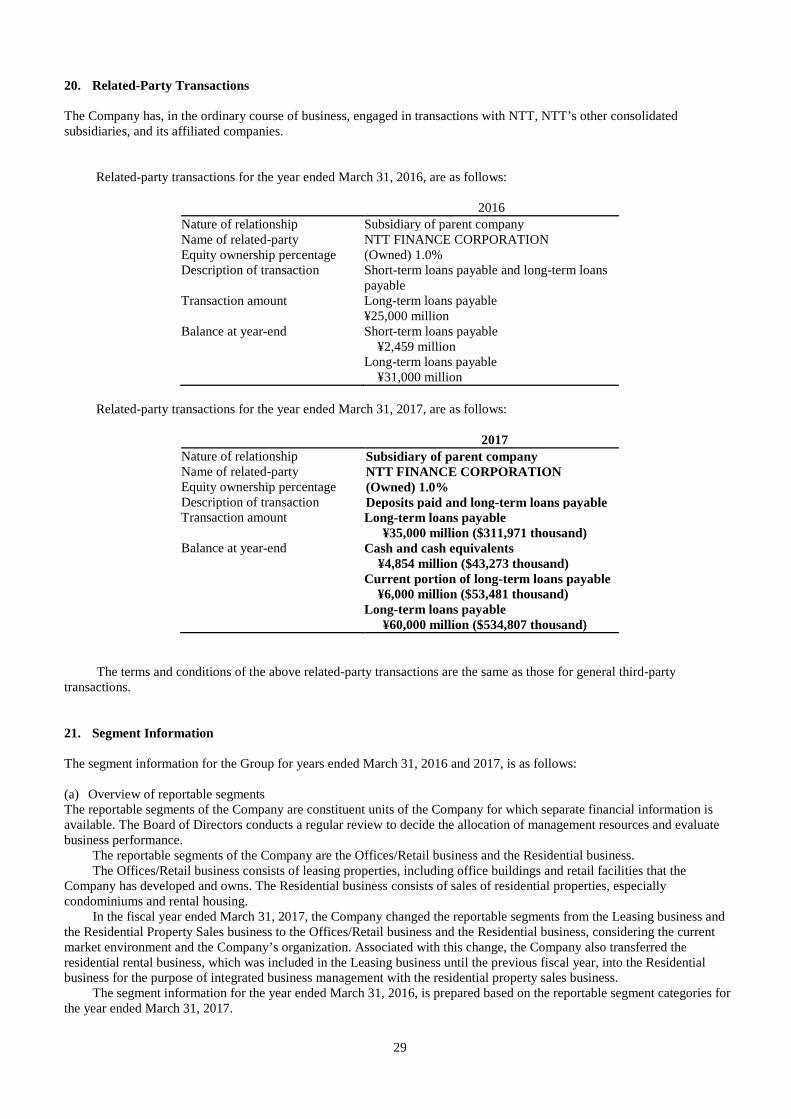
20. Related-Party Transactions The Company has, in the ordinary course of business, engaged in transactions with NTT, NTT’s other consolidated subsidiaries, and its affiliated companies.
Related-party transactions for the year ended March 31, 2016, are as follows:
2016 Nature of relationship Subsidiary of parent company Name of related-party NTT FINANCE CORPORATION Equity ownership percentage (Owned) 1.0% Description of transaction Short-term loans payable and long-term loans
payable Transaction amount Long-term loans payable
¥25,000 million Balance at year-end Short-term loans payable
¥2,459 million Long-term loans payable
¥31,000 million Related-party transactions for the year ended March 31, 2017, are as follows:
2017 Nature of relationship Subsidiary of parent company Name of related-party NTT FINANCE CORPORATION Equity ownership percentage (Owned) 1.0% Description of transaction Deposits paid and long-term loans payable Transaction amount Long-term loans payable
¥35,000 million ($311,971 thousand) Balance at year-end Cash and cash equivalents
¥4,854 million ($43,273 thousand) Current portion of long-term loans payable
¥6,000 million ($53,481 thousand) Long-term loans payable
¥60,000 million ($534,807 thousand) The terms and conditions of the above related-party transactions are the same as those for general third-party
transactions. 21. Segment Information The segment information for the Group for years ended March 31, 2016 and 2017, is as follows: (a) Overview of reportable segments The reportable segments of the Company are constituent units of the Company for which separate financial information is available. The Board of Directors conducts a regular review to decide the allocation of management resources and evaluate business performance.
The reportable segments of the Company are the Offices/Retail business and the Residential business. The Offices/Retail business consists of leasing properties, including office buildings and retail facilities that the
Company has developed and owns. The Residential business consists of sales of residential properties, especially condominiums and rental housing.
In the fiscal year ended March 31, 2017, the Company changed the reportable segments from the Leasing business and the Residential Property Sales business to the Offices/Retail business and the Residential business, considering the current market environment and the Company’s organization. Associated with this change, the Company also transferred the residential rental business, which was included in the Leasing business until the previous fiscal year, into the Residential business for the purpose of integrated business management with the residential property sales business.
The segment information for the year ended March 31, 2016, is prepared based on the reportable segment categories for the year ended March 31, 2017.
30
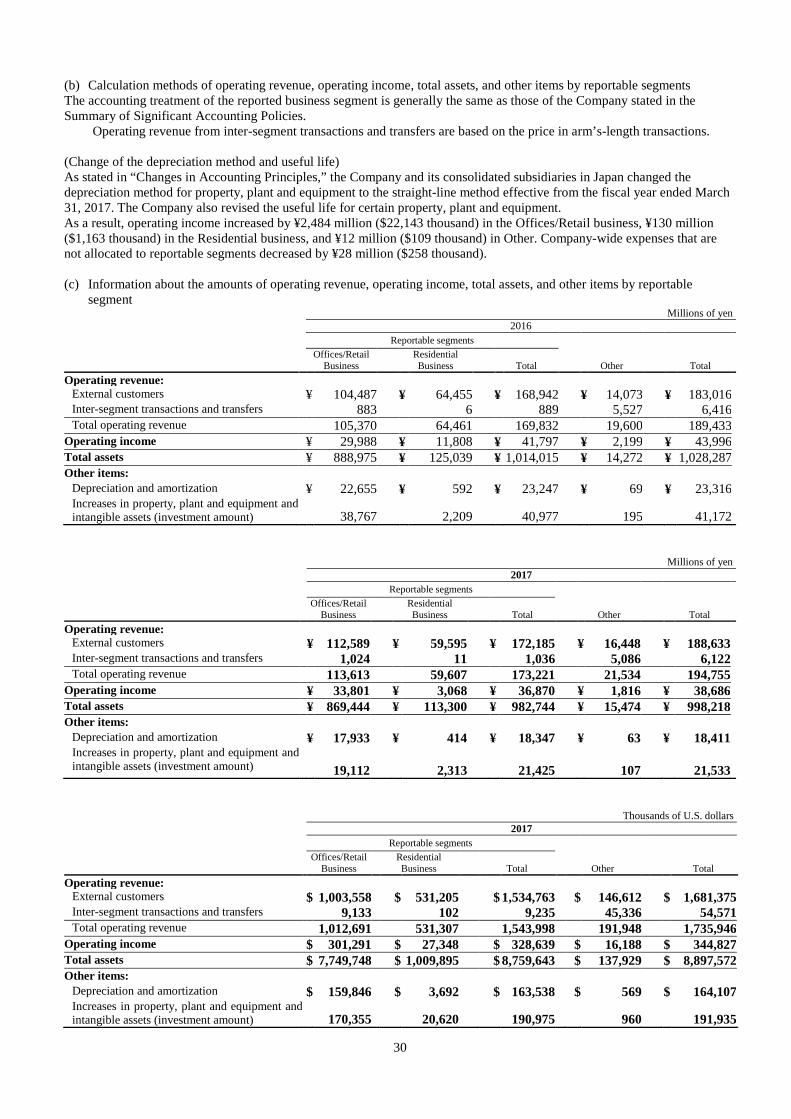
(b) Calculation methods of operating revenue, operating income, total assets, and other items by reportable segments The accounting treatment of the reported business segment is generally the same as those of the Company stated in the Summary of Significant Accounting Policies.
Operating revenue from inter-segment transactions and transfers are based on the price in arm’s-length transactions.
(Change of the depreciation method and useful life) As stated in “Changes in Accounting Principles,” the Company and its consolidated subsidiaries in Japan changed the depreciation method for property, plant and equipment to the straight-line method effective from the fiscal year ended March 31, 2017. The Company also revised the useful life for certain property, plant and equipment. As a result, operating income increased by ¥2,484 million ($22,143 thousand) in the Offices/Retail business, ¥130 million ($1,163 thousand) in the Residential business, and ¥12 million ($109 thousand) in Other. Company-wide expenses that are not allocated to reportable segments decreased by ¥28 million ($258 thousand). (c) Information about the amounts of operating revenue, operating income, total assets, and other items by reportable
segment Millions of yen 2016 Reportable segments
Offices/Retail
Business Residential Business Total Other Total
Operating revenue: External customers ¥ 104,487 ¥ 64,455 ¥ 168,942 ¥ 14,073 ¥ 183,016 Inter-segment transactions and transfers 883 6 889 5,527 6,416 Total operating revenue 105,370 64,461 169,832 19,600 189,433
Operating income ¥ 29,988 ¥ 11,808 ¥ 41,797 ¥ 2,199 ¥ 43,996 Total assets ¥ 888,975 ¥ 125,039 ¥ 1,014,015 ¥ 14,272 ¥ 1,028,287 Other items:
Depreciation and amortization ¥ 22,655 ¥ 592 ¥ 23,247 ¥ 69 ¥ 23,316 Increases in property, plant and equipment and intangible assets (investment amount) 38,767 2,209 40,977 195 41,172
Millions of yen 2017 Reportable segments
Offices/Retail
Business Residential Business Total Other Total
Operating revenue: External customers ¥ 112,589 ¥ 59,595 ¥ 172,185 ¥ 16,448 ¥ 188,633 Inter-segment transactions and transfers 1,024 11 1,036 5,086 6,122 Total operating revenue 113,613 59,607 173,221 21,534 194,755
Operating income ¥ 33,801 ¥ 3,068 ¥ 36,870 ¥ 1,816 ¥ 38,686 Total assets ¥ 869,444 ¥ 113,300 ¥ 982,744 ¥ 15,474 ¥ 998,218 Other items:
Depreciation and amortization ¥ 17,933 ¥ 414 ¥ 18,347 ¥ 63 ¥ 18,411 Increases in property, plant and equipment and intangible assets (investment amount) 19,112 2,313 21,425 107 21,533
Thousands of U.S. dollars 2017 Reportable segments
Offices/Retail
Business Residential Business Total Other Total
Operating revenue: External customers $ 1,003,558 $ 531,205 $ 1,534,763 $ 146,612 $ 1,681,375 Inter-segment transactions and transfers 9,133 102 9,235 45,336 54,571 Total operating revenue 1,012,691 531,307 1,543,998 191,948 1,735,946
Operating income $ 301,291 $ 27,348 $ 328,639 $ 16,188 $ 344,827 Total assets $ 7,749,748 $ 1,009,895 $ 8,759,643 $ 137,929 $ 8,897,572 Other items:
Depreciation and amortization $ 159,846 $ 3,692 $ 163,538 $ 569 $ 164,107 Increases in property, plant and equipment and intangible assets (investment amount) 170,355 20,620 190,975 960 191,935
31
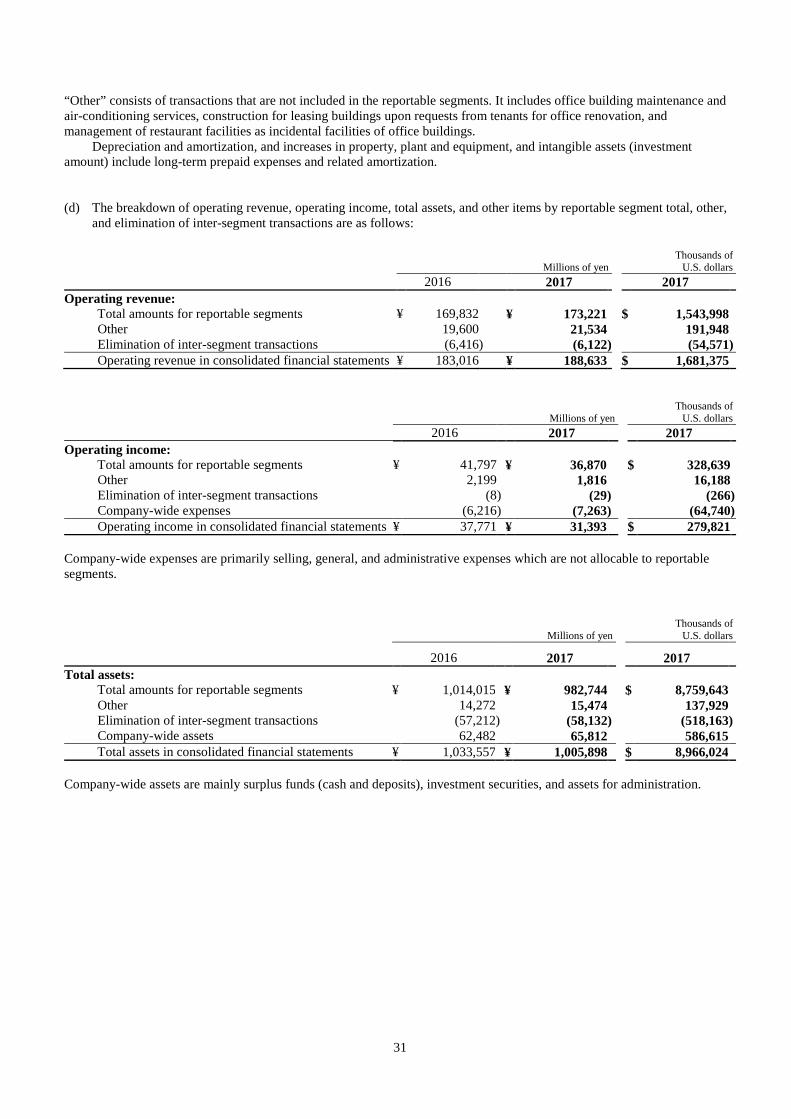
“Other” consists of transactions that are not included in the reportable segments. It includes office building maintenance and air-conditioning services, construction for leasing buildings upon requests from tenants for office renovation, and management of restaurant facilities as incidental facilities of office buildings.
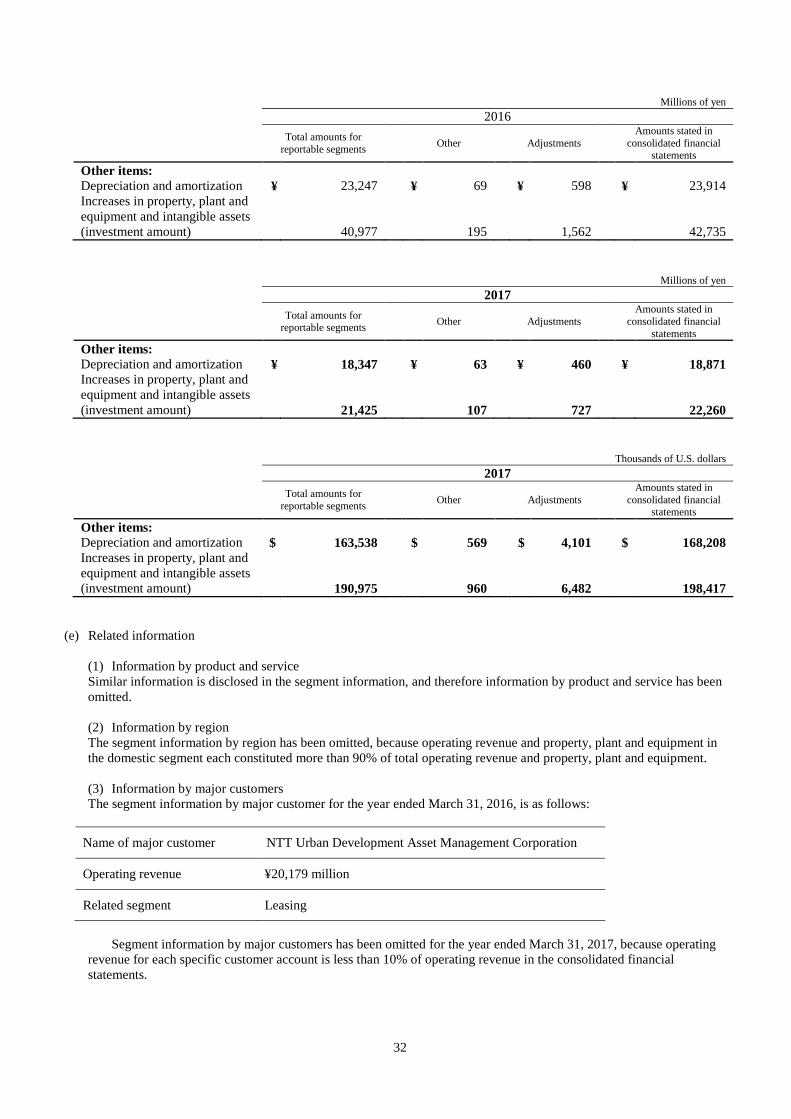
Depreciation and amortization, and increases in property, plant and equipment, and intangible assets (investment amount) include long-term prepaid expenses and related amortization. (d) The breakdown of operating revenue, operating income, total assets, and other items by reportable segment total, other,
and elimination of inter-segment transactions are as follows:
Company-wide expenses are primarily selling, general, and administrative expenses which are not allocable to reportable segments.
Company-wide assets are mainly surplus funds (cash and deposits), investment securities, and assets for administration.
Millions of yen Thousands of
U.S. dollars 2016 2017 2017 Operating revenue: Total amounts for reportable segments ¥ 169,832 ¥ 173,221 $ 1,543,998 Other 19,600 21,534 191,948 Elimination of inter-segment transactions (6,416 ) (6,122 ) (54,571 ) Operating revenue in consolidated financial statements ¥ 183,016 ¥ 188,633 $ 1,681,375
Millions of yen Thousands of
U.S. dollars 2016 2017 2017 Operating income: Total amounts for reportable segments ¥ 41,797 ¥ 36,870 $ 328,639 Other 2,199 1,816 16,188 Elimination of inter-segment transactions (8 ) (29 ) (266 ) Company-wide expenses (6,216 ) (7,263 ) (64,740 ) Operating income in consolidated financial statements ¥ 37,771 ¥ 31,393 $ 279,821
Millions of yen Thousands of
U.S. dollars 2016 2017 2017
Total assets: Total amounts for reportable segments ¥ 1,014,015 ¥ 982,744 $ 8,759,643 Other 14,272 15,474 137,929 Elimination of inter-segment transactions (57,212 ) (58,132 ) (518,163 ) Company-wide assets 62,482 65,812 586,615 Total assets in consolidated financial statements ¥ 1,033,557 ¥ 1,005,898 $ 8,966,024
32
Millions of yen 2016 Total amounts for
reportable segments Other Adjustments
Amounts stated in consolidated financial
statements
Other items: Depreciation and amortization ¥ 23,247 ¥ 69 ¥ 598 ¥ 23,914 Increases in property, plant and equipment and intangible assets (investment amount) 40,977
195
1,562
42,735
Millions of yen 2017 Total amounts for
reportable segments Other Adjustments
Amounts stated in consolidated financial
statements
Other items: Depreciation and amortization ¥ 18,347 ¥ 63 ¥ 460 ¥ 18,871 Increases in property, plant and equipment and intangible assets (investment amount) 21,425 107 727 22,260
Thousands of U.S. dollars 2017 Total amounts for
reportable segments Other Adjustments
Amounts stated in consolidated financial
statements
Other items: Depreciation and amortization $ 163,538 $ 569 $ 4,101 $ 168,208 Increases in property, plant and equipment and intangible assets (investment amount) 190,975 960 6,482 198,417
(e) Related information
(1) Information by product and service Similar information is disclosed in the segment information, and therefore information by product and service has been omitted.
(2) Information by region The segment information by region has been omitted, because operating revenue and property, plant and equipment in the domestic segment each constituted more than 90% of total operating revenue and property, plant and equipment.
(3) Information by major customers The segment information by major customer for the year ended March 31, 2016, is as follows:
Name of major customer NTT Urban Development Asset Management Corporation
Operating revenue ¥20,179 million
Related segment Leasing
Segment information by major customers has been omitted for the year ended March 31, 2017, because operating
revenue for each specific customer account is less than 10% of operating revenue in the consolidated financial statements.
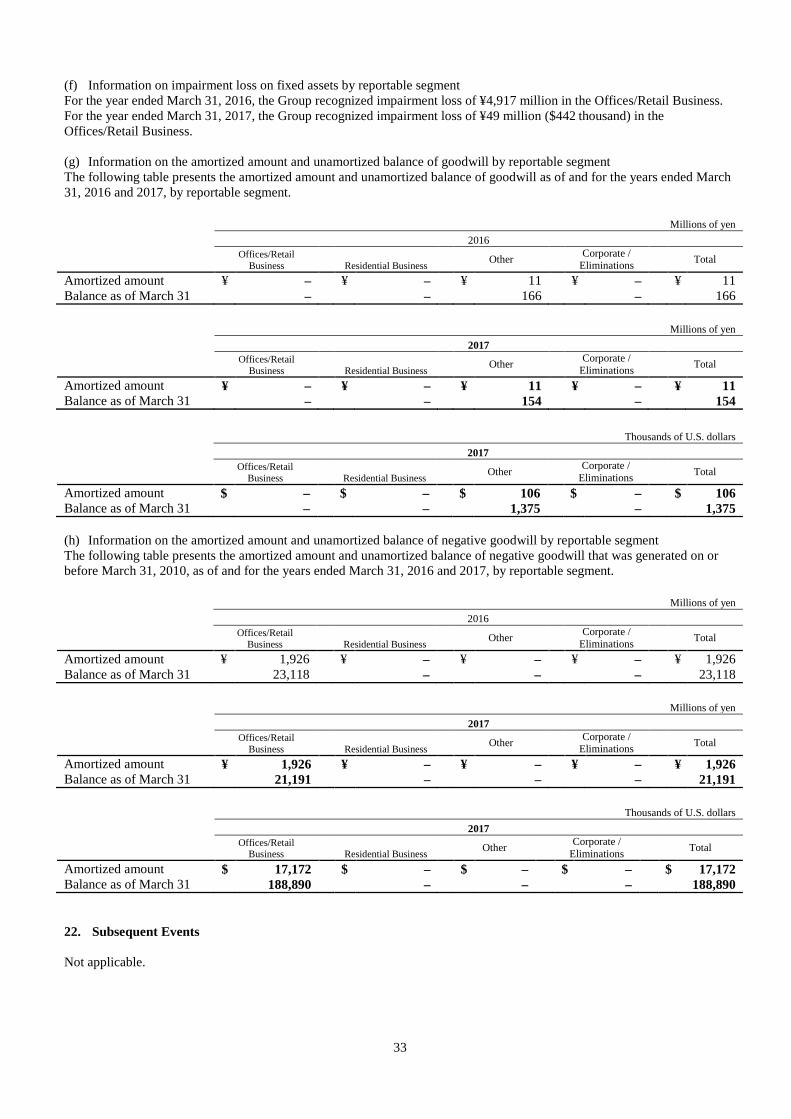
33
(f) Information on impairment loss on fixed assets by reportable segment For the year ended March 31, 2016, the Group recognized impairment loss of ¥4,917 million in the Offices/Retail Business. For the year ended March 31, 2017, the Group recognized impairment loss of ¥49 million ($442 thousand) in the Offices/Retail Business. (g) Information on the amortized amount and unamortized balance of goodwill by reportable segment The following table presents the amortized amount and unamortized balance of goodwill as of and for the years ended March 31, 2016 and 2017, by reportable segment. Millions of yen 2016 Offices/Retail
Business Residential Business Other Corporate /
Eliminations Total
Amortized amount ¥ – ¥ – ¥ 11 ¥ – ¥ 11 Balance as of March 31 – – 166 – 166 Millions of yen 2017 Offices/Retail
Business Residential Business Other Corporate /
Eliminations Total
Amortized amount ¥ – ¥ – ¥ 11 ¥ – ¥ 11 Balance as of March 31 – – 154 – 154
(h) Information on the amortized amount and unamortized balance of negative goodwill by reportable segment The following table presents the amortized amount and unamortized balance of negative goodwill that was generated on or before March 31, 2010, as of and for the years ended March 31, 2016 and 2017, by reportable segment. Millions of yen 2016 Offices/Retail
Business Residential Business Other Corporate /
Eliminations Total
Amortized amount ¥ 1,926 ¥ – ¥ – ¥ – ¥ 1,926 Balance as of March 31 23,118 – – – 23,118 Millions of yen 2017 Offices/Retail
Business Residential Business Other Corporate /
Eliminations Total
Amortized amount ¥ 1,926 ¥ – ¥ – ¥ – ¥ 1,926 Balance as of March 31 21,191 – – – 21,191 Thousands of U.S. dollars 2017 Offices/Retail
Business Residential Business Other Corporate /
Eliminations Total
Amortized amount $ 17,172 $ – $ – $ – $ 17,172 Balance as of March 31 188,890 – – – 188,890 22. Subsequent Events Not applicable.
Thousands of U.S. dollars 2017 Offices/Retail
Business Residential Business Other Corporate /
Eliminations Total
Amortized amount $ – $ – $ 106 $ – $ 106 Balance as of March 31 – – 1,375 – 1,375