Embed Size (px)
Citation preview

1
Financial report
Half-year
As of 30 September 2020

2
Table of contents
This document is a free translation of the French language original version
Management report on condensed interim consolidated financial statements,
half-year ended 30 September 2020
Page 3
Condensed interim consolidated financial statements,
half-year ended 30 September 2020
Page 19
Report of independent auditors on the half-year financial information
Page 54
Responsibility statement of the person responsible for the half-year financial report
Page 57
Société anonyme with a share capital of €1,588,222,755
48, rue Albert Dhalenne
93400 Saint-Ouen-sur-Seine (France)
Tel. : +33 (0)1 57 06 90 00
Fax : +33 (0)1 57 06 96 66
RCS : 389 058 447 Bobigny
www.alstom.com

3
Management report on condensed interim consolidated financial statements,
Half-year ended 30 September 2020
4
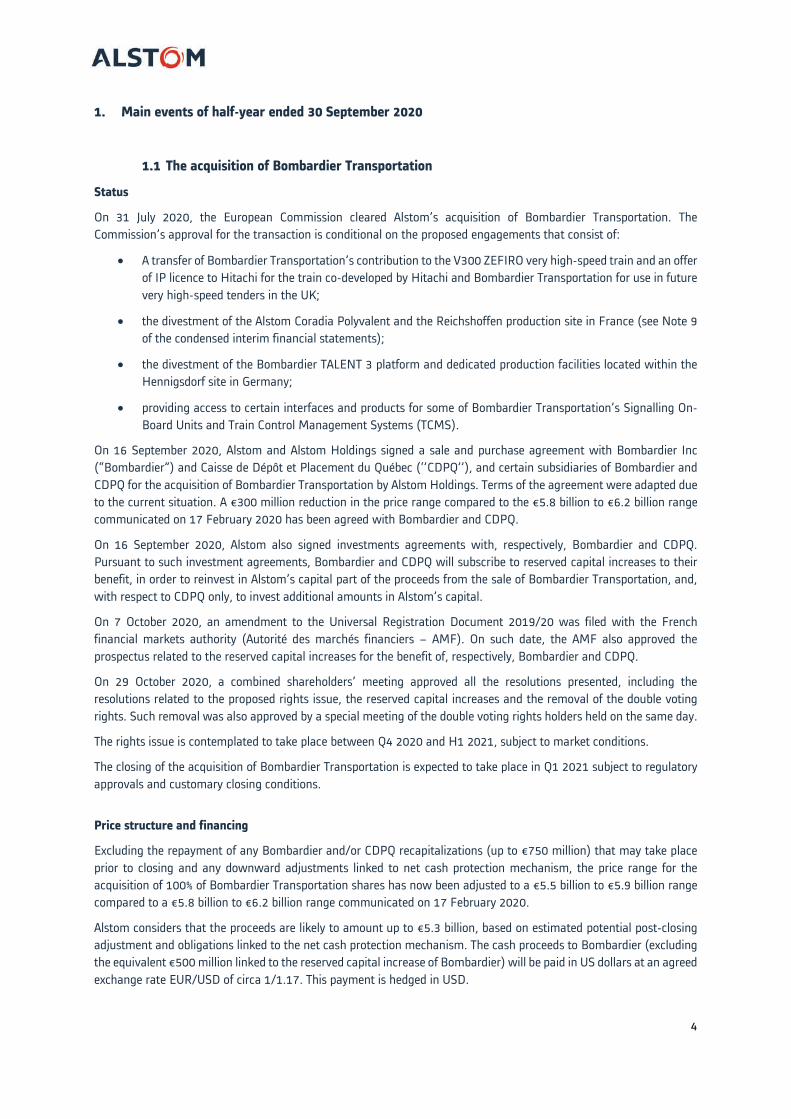
1. Main events of half-year ended 30 September 2020
1.1 The acquisition of Bombardier Transportation
Status
On 31 July 2020, the European Commission cleared Alstom’s acquisition of Bombardier Transportation. The
Commission’s approval for the transaction is conditional on the proposed engagements that consist of:
A transfer of Bombardier Transportation’s contribution to the V300 ZEFIRO very high-speed train and an offer
of IP licence to Hitachi for the train co-developed by Hitachi and Bombardier Transportation for use in future
very high-speed tenders in the UK;
the divestment of the Alstom Coradia Polyvalent and the Reichshoffen production site in France (see Note 9
of the condensed interim financial statements);
the divestment of the Bombardier TALENT 3 platform and dedicated production facilities located within the
Hennigsdorf site in Germany;
providing access to certain interfaces and products for some of Bombardier Transportation’s Signalling On-
Board Units and Train Control Management Systems (TCMS).
On 16 September 2020, Alstom and Alstom Holdings signed a sale and purchase agreement with Bombardier Inc
(“Bombardier”) and Caisse de Dépôt et Placement du Québec (‘’CDPQ’’), and certain subsidiaries of Bombardier and
CDPQ for the acquisition of Bombardier Transportation by Alstom Holdings. Terms of the agreement were adapted due
to the current situation. A €300 million reduction in the price range compared to the €5.8 billion to €6.2 billion range
communicated on 17 February 2020 has been agreed with Bombardier and CDPQ.
On 16 September 2020, Alstom also signed investments agreements with, respectively, Bombardier and CDPQ.
Pursuant to such investment agreements, Bombardier and CDPQ will subscribe to reserved capital increases to their
benefit, in order to reinvest in Alstom’s capital part of the proceeds from the sale of Bombardier Transportation, and,
with respect to CDPQ only, to invest additional amounts in Alstom’s capital.
On 7 October 2020, an amendment to the Universal Registration Document 2019/20 was filed with the French
financial markets authority (Autorité des marchés financiers – AMF). On such date, the AMF also approved the
prospectus related to the reserved capital increases for the benefit of, respectively, Bombardier and CDPQ.
On 29 October 2020, a combined shareholders’ meeting approved all the resolutions presented, including the
resolutions related to the proposed rights issue, the reserved capital increases and the removal of the double voting
rights. Such removal was also approved by a special meeting of the double voting rights holders held on the same day.
The rights issue is contemplated to take place between Q4 2020 and H1 2021, subject to market conditions.
The closing of the acquisition of Bombardier Transportation is expected to take place in Q1 2021 subject to regulatory
approvals and customary closing conditions.
Price structure and financing
Excluding the repayment of any Bombardier and/or CDPQ recapitalizations (up to €750 million) that may take place
prior to closing and any downward adjustments linked to net cash protection mechanism, the price range for the
acquisition of 100% of Bombardier Transportation shares has now been adjusted to a €5.5 billion to €5.9 billion range
compared to a €5.8 billion to €6.2 billion range communicated on 17 February 2020.
Alstom considers that the proceeds are likely to amount up to €5.3 billion, based on estimated potential post-closing
adjustment and obligations linked to the net cash protection mechanism. The cash proceeds to Bombardier (excluding
the equivalent €500 million linked to the reserved capital increase of Bombardier) will be paid in US dollars at an agreed
exchange rate EUR/USD of circa 1/1.17. This payment is hedged in USD.

5
The financing structure is as follows:
CDPQ will reinvest the proceeds from the purchase price in a total subscribed amount of between €1.9 billion
and €2.1 billion through a reserved capital increase, plus an additional amount of €700 million.
Bombardier will subscribe for a capital increase of Alstom in a fixed amount of €500 million (up to €650
million under certain circumstances).
A €2.4 billion syndicated bridge loan, to be refinanced by:
o the capital increase of Alstom with preservation of the preferential subscription rights for an amount,
including issuance premium, of approximately €2 billion;
o a contemplated bond issuance of approximately €400 million.
The balance, if any, will be paid with Alstom’s existing cash resources including Bombardier Transportation
net cash at closing.
1.2 Shareholdership and stock market index
The Steering Committee of the Euronext Indices has decided to include Alstom in the list of the 40 stocks making up
the French CAC40 index. This inclusion is effective since 21 September 2020.
On 30 September 2020, Bouygues announced the successful placement of around 4.8% of Alstom’s share capital.
Following the transaction, the settlement of which occurred on 3 November 2020, Bouygues’ shareholding in Alstom
stands at approximately 9.7%.
1.3 Key figures for Alstom in the first half of fiscal year 2020/21
Group’s key performance indicators for the first half of fiscal year 2020/21:
Half-Year ended Half-Year ended
(in € million)
30 Sep temb er
2020
30 Sep temb er
2019Actual Organic
Orders Received 2,652 4,618 (43%) (42%)
Orders Backlog 40,001 41,330 (3%) 2%
Sales 3,518 4,140 (15%) (13%)
aEBIT 263 319 (18%)
aEBIT % 7.5% 7.7%
EBIT 190 281
Net Profit - Group share 170 227
Free Cash Flow (253) (19)
Capital Employed 2,881 2,469
Net Cash/(Debt) 843 991
Equity 3,341 3,135
% Variation
Sep. 20/ Sep. 19

6
Covid-19 crisis impacts
The Alstom Group does business in numerous countries that have significantly been affected by the Covid-19 epidemic
and is carefully monitoring the situation while taking all necessary actions to protect its employees, suppliers and
subcontractors, as well as to reduce the economic and financial impacts of this unprecedented crisis.
The identified incremental costs relating to Covid-19 incurred during the first half of fiscal year 2020/21, amounted to
€68 million, stemming both from inefficiencies and expenses dedicating specifically to Covid-19 matters. These costs
were all incurred in the first quarter of this fiscal year. Inefficiencies are costs induced by the inability of certain
employees to come to the workplace in the wake of Covid-19 lockdowns. Alstom considers dedicated expenses to be
costs mainly related to cleaning and purchase of equipment to protect its employees from the virus. These costs are
not included in the percentage of completion formula of the project and have not generated revenue. They have been
recognized in the primary statement of the income statement under the caption Cost of sales.
At the end of September, operations were running at a pace in line with the pre-existing Covid-19 crisis conditions.
Impairment tests have been performed on goodwill (see Note 11 of the condensed interim financial statements),
tangible assets, intangible assets and deferred taxes (see Note 8 of the condensed interim financial statements) with
no impairment risks identified as of end of September 2020.
The Group’s response to the crisis focused on resuming production in a sanitary safe environment to ensure continuity
of project execution while implementing company-wide cost saving measures. Alstom adapted the ways of working of
its employees and limited non-essential travels and events. The Group also promoted salary moderation and kept a
tight control over additional recruitments. The company has re-assessed investment priorities to rationalise cash spend
while ensuring that R&D investments remained at the level that was deemed required to deliver on the Alstom in
Motion strategy roadmap.
1.4 Organic growth
The above-mentioned figures are adjusted as follows for foreign exchange variation resulting from the translation of
the original currency to Euro, as well as for change in scope.
The below table shows how the prior year actual figures are converted into a like-for-like set of numbers for comparison
purposes:
The actual figures for the first half of fiscal year 2019/20 (orders backlog, orders received and sales) are restated to
reflect September 2020 exchange rates.
(in € million)
Actual
figures
Actual
figures
Exchange
rate
Comparab le
Figures% Var Act. % Var Org.
Orders Backlog 40,001 41,330 (2,180) 39,150 (3%) 2%
Orders Received 2,652 4,618 (44) 4,574 (43%) (42%)
Sales 3,518 4,140 (104) 4,036 (15%) (13%)
Half-Year ended 30 September 2019
Half-Year ended
30 Sep tember
2020 Sep. 20/ Sep. 19

7
Orders backlog were significantly impacted by an unfavourable translation effect driven by the depreciation
of the South African Rand (ZAR), the Indian Rupee (INR), the Canadian Dollar (CAD) and the US Dollar (USD)
against the Euro (EUR).
Orders received were marginally impacted by foreign exchange variations, and mostly driven by the
depreciation of the Chilean Peso (CLP) against the Euro (EUR).
Sales were mainly impacted by the depreciation of the South African Rand (ZAR) and the Brazilian Real (BRL)
against the Euro (EUR).
1.5 Acquisitions and partnerships
SpeedInnov
Through its affiliate SpeedInnov, a joint-venture created in 2015 with ADEME, Alstom focused on its ‘Very high-speed
train of the future’ project, aiming to promote a new generation of very high-speed trainset which will reduce
acquisition and operating costs by at least 20% (compared to the previous train generation), optimise the environmental
footprint and broaden commercial offer to improve passenger experience. In this context, Alstom subscribed to a capital
increase in this joint-venture in an amount of €27 million in June 2020, increasing its stake from 71.0% to 74.0% with
no change in the consolidation method (Joint control).
IBRE Acquisition
On 30 June 2020, Alstom acquired 100% of IBRE (International Braking & Railway Equipment) shares, a company
based in France and renamed “Alstom IBRE”. This company is specialized in the development, the manufacturing and
the supply of railway brake discs. Their reliable high-quality products are recognized by the most important European
railway administrations. The entity is fully consolidated in the Group’s accounts. Preliminary goodwill amounts to €8
million. The purchase price allocation is not fully completed and will be finalized within twelve months after the
acquisition date. The sales of the period are not material.
2. 2020/21 fiscal year outlook
The Covid-19 crisis has negatively affected financial performance to date in the 2020/21 fiscal year. However,
anticipating a strong pipeline for the second semester 2020/21 and based on the production pick-up that was observed
during the second quarter 2020/21, Alstom has the following forecasts for the full 2020/21 fiscal year:
Sales will reach between €7.6 billion and €7.9 billion, while the adjusted EBIT margin will be within a 7.7%
to 8.0% range.
The company will generate a break-even to positive cash flow.
The second semester commercial performance will support a book-to-bill ratio above 1.0x for the Group this
fiscal year.
Underlying outlook assumptions
The forecasts for the fiscal year ending 31 March 2021 presented below have been prepared in accordance with the
accounting policies applied in the consolidated financial statements of the Company for the fiscal year ended 31 March
2020 and the interim six-month period ended 30 September 2020. The definition of adjusted EBIT margin is the same
as the definition used at 31 March 2020 and September 30, 2020. The adjusted EBIT margin excludes Covid-19
incremental and related inefficiencies costs.

8
These forecasts are based on Alstom’s scope of consolidation at the end of September 2020, therefore
exclude any scope impacts from the expected Bombardier Transportation acquisition. They are mainly based on the
following assumptions:
Alstom internal assumptions
The sales improvement in the second semester as compared to the first semester will primarily come from a
decrease in the Covid-19 related disruptions that affected Alstom during the first half of this fiscal year, and
from the execution of its orders backlog.
The adjusted EBIT margin improvement compared to the first semester will primarily come from additional
volume, rigorous project execution, and the delivery of projected sourcing savings.
Standardisation of engineering tools and processes together with design to cost, and optimisation of our
footprint both for engineering and manufacturing, will also support the improvement of Alstom performance.
In addition, digital transformation, combined with efficient discipline in overhead cost management, will
contribute to the improvement of the adjusted EBIT margin.
Improved cash generation over the second semester as compared to the first semester will mainly come
from accelerated deliveries and commercial performance. It remains subject to usual short-term volatility in
down- and progress payments from clients.
Macro-economic assumptions
They have been established excluding any major variations in exchange rates of the currencies of the main
countries outside of Euro-zone in which the Group generates its revenues, compared to the rates in effect as
at 30 September 2020.
They assume an overall stable political environment in areas where Alstom operates or delivers products.
They assume the absence of Covid-19 crisis-related production slowdowns, arising from partial
or full lockdown situations, that would exceed the lockdown measures in place on the date of this document
and affecting either Alstom or its key suppliers. In addition, they assume that customer tenders scheduled for
the second semester will not considerably shift to later periods and that train mileage for purposes of
calculating indexed payments under maintenance contracts will not decrease very significantly during the
remainder of the second semester due to the ongoing health crisis.
Disclaimer
The above-described outlook contains forward-looking statements which are based on current plans and forecasts of
Alstom’s management. Such forward-looking statements are relevant to the current scope of activity and are by their
nature subject to a number of important risks and uncertainty factors (such as those described in the documents filed
by Alstom with the French AMF) that could cause actual results to differ from the plans, objectives and expectations
expressed in such forward-looking statements. These forward-looking statements speak only as of the date on which
they are made, and Alstom undertakes no obligation to update or revise any of them, whether as a result of new
information, future events or otherwise.

9
3. Commercial performance
Alstom’s order intake amounted to €2.7 billion during the first half of fiscal year 2020/21, against €4.6 billion for the
same period last year.
In Europe, Alstom recorded €1.1 billion order intake during the first half of fiscal year 2020/21, as compared to €3.9
billion over the same period last year, mainly fuelled by an order to supply 49 tramways for Nantes, an additional order
for 11 CitadisTM DualisTM trains under the conditions of the SNCF framework contract TTNG, and a Signalling contract
of the ARGOS partnership with SNCF to develop the new generation interlocking solution in France. Alstom also
secured an order to provide digital train control, traffic management and electrification infrastructure as part of the
rehabilitation and modernisation of the Sighisoara-Brasov section of the European Rhine-Danube rail corridor in
Romania.
Last year, the order intake in Europe included additional CoradiaTM Polyvalent regional trains and AveliaTM Euroduplex
trains in France, additional PendolinoTM high-speed trains along with maintenance service, and Smart CoradiaTM POP
regional trains in Italy, and CoradiaTM iLint trains and associated maintenance in Germany.
In Americas, Alstom continues to stabilise its footprint in Latin America for Services and to secure further Signalling
products orders in North America. The Group reported €0.2 billion of orders for the first half of fiscal year 2020/21,
notably with the renewal of a full maintenance contract for 158 locomotives of Ferrosur fleet in Mexico, down by 40%
as compared to the same period of last year, which stood at €0.4 billion.
In Asia/Pacific, the order intake stood at €0.4 billion, up by 70% as compared to the same period of the last fiscal year,
mainly thanks to the extension project of Taipei Metro Line 7 in Taiwan. Alstom will be responsible for the design,
manufacturing, testing and commissioning of 16 additional fully automated, four-car Metropolis trains, Urbalis 400
Communication Based Train Control (CBTC) signalling system, Supervisory Control and Data Acquisition (SCADA)
system, as well as platform screen doors. The Group was also awarded a 6-year Services contract in China to overhaul
180 locomotives.
In Africa/Middle East/Central Asia, the Group reported €0.9 billion order intake thanks to the securing of rolling stock
and maintenance follow-on orders of currently active projects.
Geograp hic b reakdown
Actual figures Half-Year ended % of Half-Year ended % of
(in € million)
30 Sep temb er
2020contrib
30 Sep temb er
2019contrib
Europe 1,088 41% 3,900 84% (72%) (72%)
Americas 249 10% 413 9% (40%) (34%)
Asia/Pacific 432 16% 255 6% 70% 72%
Africa/Middle East/Central Asia 883 33% 50 1% 1664% 1663%
ORDERS BY DESTINATION 2,6 52 100% 4,6 18 100% (43%) (42%)
% Variation
Actual Organ ic
Sep . 20/ Sep . 19
Product b reakdown
Actual figures Half-Year ended % of Half-Year ended % of
(in € million)
30 September
2020contrib
30 Sep temb er
2019contrib
Rolling stock 890 34% 2,435 53% (63%) (63%)
Services 820 31% 1,453 31% (44%) (42%)
Systems 374 14% 51 1% 634% 638%
Signalling 568 21% 679 15% (16%) (16%)
ORDERS BY DESTINATION 2,652 100% 4,6 18 100% (43%) (42%)
Actual Organic
Sep . 20/ Sep . 19
% Variation
10
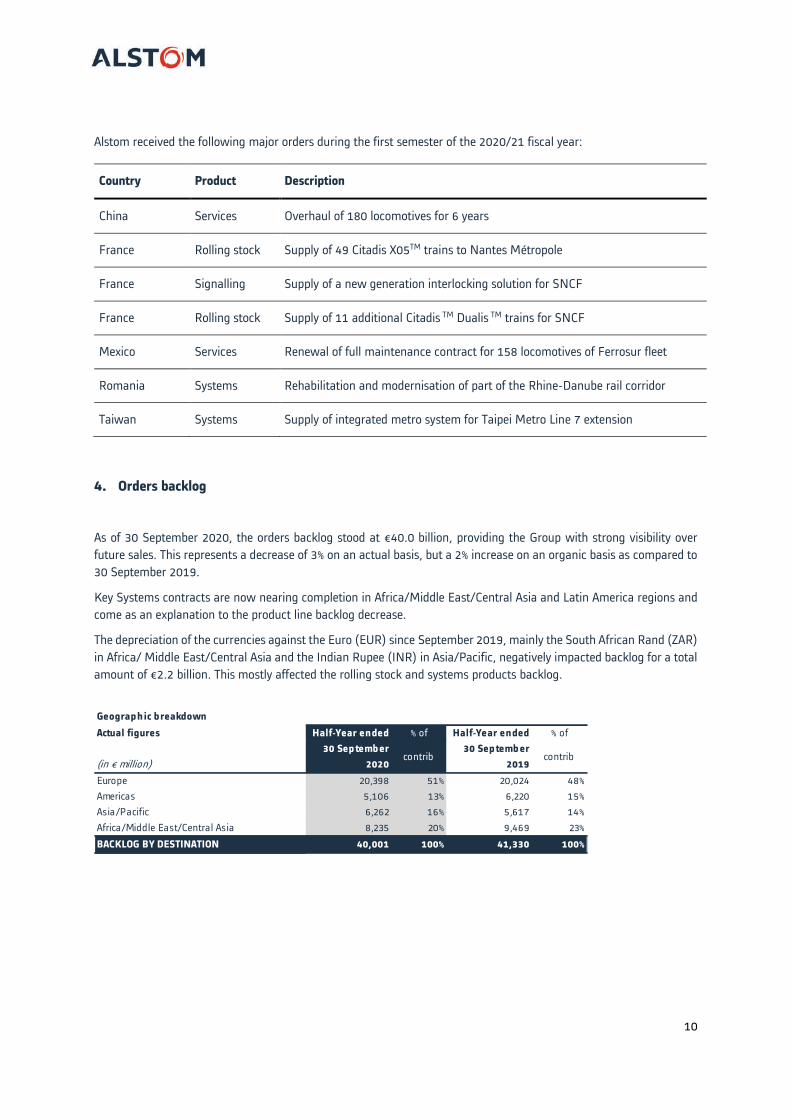
Alstom received the following major orders during the first semester of the 2020/21 fiscal year:
Country Product Description
China Services Overhaul of 180 locomotives for 6 years
France Rolling stock Supply of 49 Citadis X05TM trains to Nantes Métropole
France Signalling Supply of a new generation interlocking solution for SNCF
France Rolling stock Supply of 11 additional Citadis TM Dualis TM trains for SNCF
Mexico Services Renewal of full maintenance contract for 158 locomotives of Ferrosur fleet
Romania Systems Rehabilitation and modernisation of part of the Rhine-Danube rail corridor
Taiwan Systems Supply of integrated metro system for Taipei Metro Line 7 extension
4. Orders backlog
As of 30 September 2020, the orders backlog stood at €40.0 billion, providing the Group with strong visibility over
future sales. This represents a decrease of 3% on an actual basis, but a 2% increase on an organic basis as compared to
30 September 2019.
Key Systems contracts are now nearing completion in Africa/Middle East/Central Asia and Latin America regions and
come as an explanation to the product line backlog decrease.
The depreciation of the currencies against the Euro (EUR) since September 2019, mainly the South African Rand (ZAR)
in Africa/ Middle East/Central Asia and the Indian Rupee (INR) in Asia/Pacific, negatively impacted backlog for a total
amount of €2.2 billion. This mostly affected the rolling stock and systems products backlog.
Geograph ic breakdown
Actual figures Half-Year ended % of Half-Year ended % of
(in € million)
30 Sep temb er
2020contrib
30 Sep temb er
2019contrib
Europe 20,398 51% 20,024 48%
Americas 5,106 13% 6,220 15%
Asia/Pacific 6,262 16% 5,617 14%
Africa/Middle East/Central Asia 8,235 20% 9,469 23%
BACKLOG BY DESTINATION 40,001 100% 41,330 100%

11
5. Income statement
5.1 Sales
Alstom’s sales amounted to €3.5 billion for the first half of fiscal year 2020/21, decreasing by 15% on an actual basis
and by 13% organically compared to the same period of last year.
The Covid-19 crisis has mostly affected rolling stock sales due to the production slowdown during the lockdown period
and, to a lesser extent, services due to the train traffic reduction.
In Europe, sales reached just above €2.0 billion, accounting for 57% of the Group’s total sales. It was mainly driven by
the continued execution of large rolling stock contracts, including the Coradia StreamTM trains in Italy and the
Netherlands, the CoradiaTM Polyvalent regional trains in France, as well as the CoradiaTM Continental and CoradiaTM
LintTM train in Germany. In addition, Alstom carried on with the maintenance of PendolinoTM in the United Kingdom,
which generated further sales.
In Americas, sales stood at €0.6 billion for the first half of fiscal year 2020/21, accounting for 16% of the Group’s sales,
down €0.1 billion compared to the same period of last year. The projects of Amtrak high-speed trains in the United
Product b reakdown
Actual figures Half-Year ended % of Half-Year ended % of
(in € million)
30 September
2020contrib
30 Sep tember
2019contrib
Rolling stock 19,838 50% 21,340 52%
Services 13,899 35% 13,273 32%
Systems 2,218 5% 2,961 7%
Signalling 4,046 10% 3,756 9%
BACKLOG BY DESTINATION 40,001 100% 41,330 100%
Geograp hic b reakdown
Actual figures Half-Year ended % of Half-Year ended % of
(in € million)
30 Sep temb er
2020contrib
30 Sep temb er
2019contrib
Europe 2,017 57% 2,269 54% (11%) (11%)
Americas 557 16% 687 17% (19%) (13%)
Asia/Pacific 424 12% 458 11% (8%) (4%)
Africa/Middle East/Central Asia 520 15% 726 18% (28%) (25%)
SALES BY DESTINATION 3,518 100% 4,140 100% (15%) (13%)
% Variation
Actual Organ ic
Sep . 20/ Sep . 19
Product b reakdown
Actual figures Half-Year ended % of Half-Year ended % of
(in € million)
30 Sep temb er
2020contrib
30 Sep temb er
2019contrib
Rolling stock 1,713 49% 1,898 46% (10%) (8%)
Services 662 19% 718 17% (8%) (5%)
Systems 452 13% 801 19% (44%) (42%)
Signalling 691 19% 723 18% (4%) (2%)
SALES BY DESTINATION 3,518 100% 4,140 100% (15%) (13%)
Actual Organ ic
Sep . 20/ Sep . 19
% Variation

12
States and the light metro system for REM in Canada remain the top sales contributors within the region. In Latin
America, sales were driven by the delivery of Guadalajara Line 3 metro system in Mexico. During last fiscal year, the
systems contracts for Line 1 and Line 2 in Panama reached completion, generating an expected decrease in sales this
year.
In Asia/Pacific, sales amounted to €0.4 billion, accounting for 12% of the Group’s sales, slightly decreasing as compared
to last year. These sales were driven by the ramp-up of the production of electric locomotives in India, the continued
execution of subway contract in Singapore, and further sustained by the production ramp-up for Hanoi metro Line 3
system in Vietnam.
In Africa/Middle East/Central Asia, sales stood at €0.5 billion, contributing 15% to the Group’s total sales, down €0.2
billion compared to the same period of last year. Systems contracts for the Dubai metro in the United Arab Emirates
and the Riyadh metro in Saudi Arabia both come closer to the final completion stage, and the CoradiaTM Polyvalent
trains project for Senegal reached completion at the end of last fiscal year, generating an expected decrease in sales of
the region comparing to the same period last year. The ramp-up on the rolling stock contracts of the X’trapolisTM trains
for PRASA in South Africa, and the PrimaTM freight locos for Kazakhstan and Morocco partly offset this decline.
5.2 Research & development
During the first half of fiscal year 2020/21, research and development gross costs amounted to €178 million, i.e. 5.1%
of sales, reflecting the Group’s continuous investments in innovation to develop smarter and greener mobility solutions,
supporting Alstom In Motion strategy.
(*) €15 million impairment reversal to the CoradiaTM Polyvalent technology and €(15) million corresponding amortization have not been reported in
this table.
Alstom notably continued its research and development effort on the very high-speed trains Avelia HorizonTM range,
which is funded by the SpeedInnov joint-venture, marked by the first delivery for test on tracks on Amtrak project in
the United States.
In application of the Alstom In Motion strategy, the Group further invested in green solutions to offer zero carbon
emission alternatives to diesel. The portfolio has been enlarged by BEMU battery powered trains solution in Germany,
along with hydrogen fuel cell trains Coradia iLintTM already running in Austria, Germany and the Netherlands.
The Group also invested in HealthHubTM, an innovative condition-monitoring solution used for trains, infrastructure
and signalling assets. This solution builds upon advanced data analytics to predict assets remaining useful life. It is now
positioned as a backbone for Rolling Stock and Infrastructures maintenance solutions.
Alstom has continued the development of CBTC solutions, Urbalis FluenceTM and Urbalis 400TM for metros and
tramways, with the launch of Fluence Baseline 2 now addressing a worldwide market.
Half-Year ended Half-Year ended
(in € million)
30 Septemb er
2020*
30 Septemb er
2019
R&D Gross costs (178) (192)
R&D Gross costs (in % of Sales) 5.1% 4.6%
Funding received 45 56
Net R&D spending (133) (136)
Development costs capitalised during the period 39 32
Amortisation expense of capitalised development costs (31) (28)
R&D expen ses (in P&L) (125) (132)
R&D expenses (in % of Sales) 3.6% 3.2%

13
In addition, Alstom carried on investing into the ICONISTM suite for Operation Control Centers, allowing to maximize
traffic fluidity and remotely orchestrate operations. Further developments have been achieved with the cyber security
framework of Alstom solutions through a partnership with Airbus signed in 2017, including a new generation of
interlocking solution deployed for the ARGOS partnership with SNCF signed in September 2020.
5.3 Operational performance
In the first half of fiscal year 2020/21, Alstom’s adjusted EBIT reached €263 million, equivalent to a 7.5% operational
margin, as compared to €319 million or 7.7% during same period of last year.
The adjusted EBIT was impacted by the Covid-19 related production slowdown. Operating margin expressed as a
percentage of sales improved however thanks to a reduction in cost of sales. Cost of sales at Alstom are primarily, but
not only, made up of raw material procurement, applicative and system engineering, manufacturing and supply chain
labour costs, as well as subcontracted services. The cost of sales ratio improvement was achieved across all product
lines thanks to more efficient project execution. The increased signalling share within the overall company sales mix
has also contributed to improving the cost of sales ratio.
Selling and Administrative costs as a percentage of sales marginally increased to 7.7%, as compared to 6.9% in the
previous period, but decreased in absolute value terms, thus reflecting the Group’s response to the sanitary crisis-driven
volume drop.
Over the period, the CASCO contribution amounted to €24 million, increasing from the previous year’s €19 million
contribution. Alstom owns 49% of CASCO Signal Limited, a joint-venture operating the Chinese railway market. It was
established with the China Railway Signal & Communication Corporation and it is based in Shanghai. CASCO provides
signalling systems and services for subway, tramway and mainlines.
5.4 From adjusted EBIT to net profit
During the first half of fiscal year 2020/21, Alstom recorded restructuring and rationalization charges of €(7) million
linked to small initiatives in Brazil and in the United States.
Over the period, Covid-19 incremental costs and related inefficiencies costs amounted to €(68) million.
Impairment loss and other non-operating items amounted to €26 million, consisting of the reversal of asset
impairments linked to the sale of the Reichshoffen site for €47 million, legal proceedings provision adjustment for €30
million, costs related to the Bombardier Transportation acquisitions in an amount of €(44) million and amortisation of
intangible assets and integration costs related to business combinations for €(7) million (see Note 6 of the condensed
interim financial statements).
The EBIT stood at €190 million as compared to €281 million during the same period last year, with the Covid-19 crisis
slowing down most activities across the world.
Net financial expenses of the period amounted to €(23) million, as compared to €(40) million in the previous year. This
is due to a reduction of financing expenses incurred at the holding level following the repayment of bonds that matured
during the previous fiscal year.
The Group recorded an income tax charge of €(38) million in the first half of fiscal year 2020/21 corresponding to an
effective tax rate of 23%, compared to €(61) million for the same period last year and an effective tax rate of 25%. This
year’s effective tax rate is primarily driven by a lower pre-tax income to which projected tax rate is applied and takes
into consideration discrete items for €4 million.
The share in net income from equity investments amounted to €37 million, mainly thanks to improved results of both
Transmashholding Limited (TMH) and CASCO Signal Limited joint-ventures.

14
The net profit from discontinued operations stood at €9 million.
As a result, the Net profit (Group share) stood at €170 million for the first half of fiscal year 2020/21 compared to
€227 million for the same period last fiscal year.
6. Free cash-flow
The Group’s Free Cash Flow stands at €(253) million for the first half of fiscal year 2020/21 as compared to
€(19) million during the same period of previous fiscal year.
Cash generation was notably impacted by an unfavourable €(433) million change in working capital compared to
€(323) million during the same period last year as a result of delayed deliveries arising from the sanitary situation,
combined with the ramp-up of major projects including Coradia StreamTM for the Netherlands and Amtrak high-speed
trains project in the USA, as well as an order intake shift from the first to the second semester resulting in lower
customer down payments received.
Depreciation and amortisation amounted to €101 million, compared to €145 million last year, this €(44) million
decrease being driven by re-evaluation of asset impairments. Right-of-use assets amortisation this semester, amounted
to €33 million compared to €38 million for the first semester of fiscal year 2019/20.
Financial cash-out has decreased by €16 million mainly due to last year’s repayment of senior bonds.
During the first half of fiscal year 2020/21, Alstom spent €54 million in capital expenditures notably on capacity
development for Coradia StreamTM in Poland. Other investments included production capabilities build-up for projects
such as Mumbai Line 3, E-Loco in India, Amtrak high-speed trains in the USA and Avelia HorizonTM in France.
“Other” Free Cash Flow items as listed above reached €48 million this semester and included mainly dividends from
Casco Signal Limited and Transmashholding (TMH) joint-ventures.
7. Net Cash/(debt)
At 30 September 2020, the Group recorded a net cash position of €843 million, compared to the €1,178 million net
cash balance that the group reported on 31 March 2020. This €(335) million decrease is driven by Free Cash Flow
consumption.
Half-Year ended Half-Year ended
(in € million)
30 Sep temb er
2020
30 Sep temb er
2019
EBIT 190 281
Depreciation and amortisation 101 145
Restructuring variation (15) (9)
Capital expenditure (54) (60)
R&D capitalisation (39) (32)
Change in working capital (433) (323)
Financial cash-out (21) (37)
Tax cash-out (30) (54)
Other 48 70
FREE CASH FLOW (253) (19)

15
In addition to its available cash and cash equivalents, amounting to €1,953 million as of 30 September 2020, the Group
can access a €400 million Revolving Credit Facility (RCF), maturing in June 2022, together with a €1,750 million short
term Revolving Credit Facility maturing in April 2021 with a 6-month extension option at the borrower’s discretion and
another 6-month extension at the lender’s discretion. They are fully undrawn at 30 September 2020.
This resulted in a liquidity position as of 30 September 2020 of €4,103 million.
8. Equity
The Group Equity on 30 September 2020 amounted to €3,341 million (including non-controlling interests), from €3,328
million on 31 March 2020, mostly impacted by:
- net profit from the first half of fiscal year 2020/21 of €170 million (Group share);
- actuarial hypothesis variation on pensions (recorded in equity) of €(46) million net of tax;
- currency translation adjustment of €(120) million.
9. Non-GAAP financial indicators definitions
This section presents financial indicators used by the Group that are not defined by accounting standard setters.
9.1 Orders received
A new order is recognised as an order received only when the contract creates enforceable obligations between the
Group and its customer.
When this condition is met, the order is recognised at the contract value.
If the contract is denominated in a currency other than the functional currency of the reporting unit, the Group requires
the immediate elimination of currency exposure using forward currency sales. Orders are then measured using the spot
rate at inception of hedging instruments.
9.2 Order backlog
Order backlog represents sales not yet recognised from orders already received.
Order backlog at the end of a financial year is computed as follows:
- order backlog at the beginning of the year;
- plus new orders received during the year;
- less cancellations of orders recorded during the year;
- less sales recognised during the year.
The order backlog is also subject to changes in the scope of consolidation, contract price adjustments and foreign
currency translation effects.
Order backlog corresponds to the transaction price allocated to the remaining performance obligations, as per IFRS 15
quantitative and qualitative disclosures requirement.
9.3 Book-to-bill
The book-to-bill ratio is the ratio of orders received to the amount of sales traded for a specific period.

16
9.4 Adjusted EBIT
Adjusted EBIT (“aEBIT”) is the Key Performance Indicator to present the level of recurring operational performance.
This indicator is also aligned with market practice and comparable to direct competitors.
Starting September 2019, Alstom has opted for the inclusion of the share in net income of the equity-accounted
investments into the aEBIT when these are considered to be part of the operating activities of the Group (because there
are significant operational flows and/or common project execution with these entities), namely the CASCO Joint
Venture. The company believes that bringing visibility over a key contributor to the Alstom signalling strategy will
provide a fairer and more accurate picture of the overall commercial & operational performance of the Group. This
change will also enable more comparability with what similar market players define as being part of their main non-
GAAP profit aggregate disclosure.
aEBIT corresponds to Earning Before Interests and Tax adjusted for the following elements:
- net restructuring expenses (including rationalization costs);
- tangibles and intangibles impairment;
- capital gains or loss/revaluation on investments disposals or controls changes of an entity;
- any other non-recurring items, such as some costs incurred to realize business combinations and amortization
of an asset exclusively valued in the context of business combination, as well as litigation costs that have
arisen outside the ordinary course of business;
- and including the share in net income of the operational equity-accounted investments.
A non-recurring item is a “one-off” exceptional item that is not supposed to occur again in following years and that is
significant.
Adjusted EBIT margin corresponds to Adjusted EBIT expressed as a percentage of sales.
The non-GAAP measure adjusted EBIT (aEBIT hereafter) indicator reconciles with the GAAP measure EBIT as follows:
Half-Year ended Half-Year ended
(in € million)
30 Sep temb er
2020
30 Sep temb er
2019
Adjusted Earn ings Before Interest and Taxes (aEBIT) 263 319
aEBIT (in % of Sales) 7.5% 7.7%
Restructuring and rationalisation costs (7) (7)
Impairment loss and other 26 (12)
Covid-19 inefficiencies & incremental costs (68) -
CASCO contribution reversal (24) (19)
EARNING BEFORE INTEREST AND TAXES (EBIT) 190 281
17
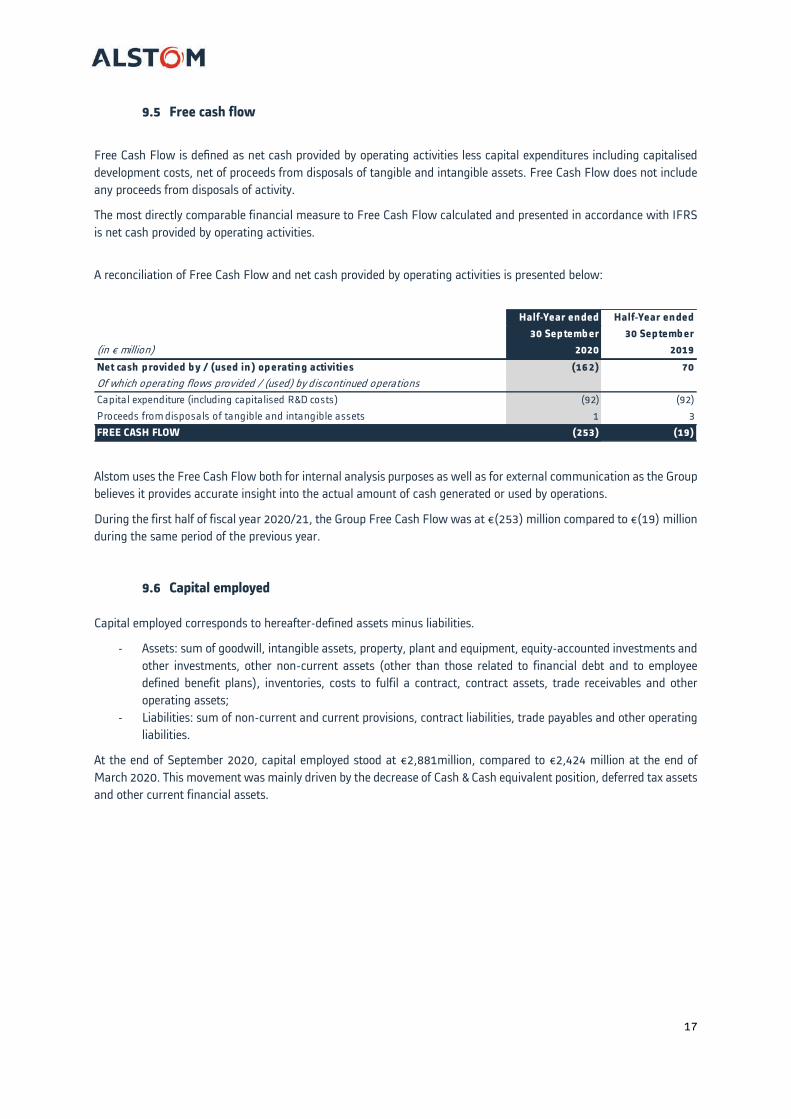
9.5 Free cash flow
Free Cash Flow is defined as net cash provided by operating activities less capital expenditures including capitalised
development costs, net of proceeds from disposals of tangible and intangible assets. Free Cash Flow does not include
any proceeds from disposals of activity.
The most directly comparable financial measure to Free Cash Flow calculated and presented in accordance with IFRS
is net cash provided by operating activities.
A reconciliation of Free Cash Flow and net cash provided by operating activities is presented below:
Alstom uses the Free Cash Flow both for internal analysis purposes as well as for external communication as the Group
believes it provides accurate insight into the actual amount of cash generated or used by operations.
During the first half of fiscal year 2020/21, the Group Free Cash Flow was at €(253) million compared to €(19) million
during the same period of the previous year.
9.6 Capital employed
Capital employed corresponds to hereafter-defined assets minus liabilities.
- Assets: sum of goodwill, intangible assets, property, plant and equipment, equity-accounted investments and
other investments, other non-current assets (other than those related to financial debt and to employee
defined benefit plans), inventories, costs to fulfil a contract, contract assets, trade receivables and other
operating assets;
- Liabilities: sum of non-current and current provisions, contract liabilities, trade payables and other operating
liabilities.
At the end of September 2020, capital employed stood at €2,881million, compared to €2,424 million at the end of
March 2020. This movement was mainly driven by the decrease of Cash & Cash equivalent position, deferred tax assets
and other current financial assets.
Half-Year ended Half-Year ended
(in € million)
30 Sep temb er
2020
30 Sep temb er
2019
Net cash p rovided b y / (used in) op erating activities (162) 70
Of which operating flows provided / (used) by discontinued operations
Capital expenditure (including capitalised R&D costs) (92) (92)
Proceeds from disposals of tangible and intangible assets 1 3
FREE CASH FLOW (253) (19)

18
9.7 Net cash/(debt)
The net cash/(debt) is defined as cash and cash equivalents, marketable securities and other current financial asset,
less borrowings. On 30 September 2020, the Group recorded a net cash level of €843 million, as compared to the net
cash position of €1,178 million on 31 March 2020.
9.8 Organic basis
Figures presented in this section include performance indicators presented on an actual basis and on an organic basis.
Figures given on an organic basis eliminate the impact of changes in scope of consolidation and changes resulting from
the translation of the accounts into Euro following the variation of foreign currencies against the Euro.
The Group uses figures prepared on an organic basis both for internal analysis and for external communication, as it
believes they provide means to analyse and explain variations from one period to another. However, these figures are
not measurements of performance under IFRS.
Half-Year ended Year en ded
(in € million)
30 Septemb er
2020
31 March
2020
Non current assets 4,470 4,628
less deferred tax assets (226) (234)
less non-current assets directly associated to financial debt (163) (177)
less prepaid pension benefits - -
Capital employed - non current assets (A) 4,081 4,217
Current assets 8,234 8,380
less cash & cash equivalents (1,953) (2,175)
less other current financial assets (25) (45)
Capital employed - current assets (B) 6,256 6,160
Current liabilities 7,407 7,775
less current financial debt (384) (270)
plus non current lease obligations 458 465
less other obligations associated to financial debt (163) (177)
plus non current provisions 137 160
Capital employed - liabilities (C) 7,456 7,953
CAPITAL EMPLOYED (A)+(B)-(C) 2,881 2,424
Half-Year ended Year ended
(in € million)
30 Septemb er
2020
31 March
2020
Cash and cash equivalents 1,953 2,175
Other current financial assets 25 45
less:
Current financial debt 384 270
Non current financial debt 751 772
NET CASH/(DEBT) AT THE END OF THE PERIOD 843 1,178

19
Condensed interim consolidated financial statements,
As of September 30, 2020
20
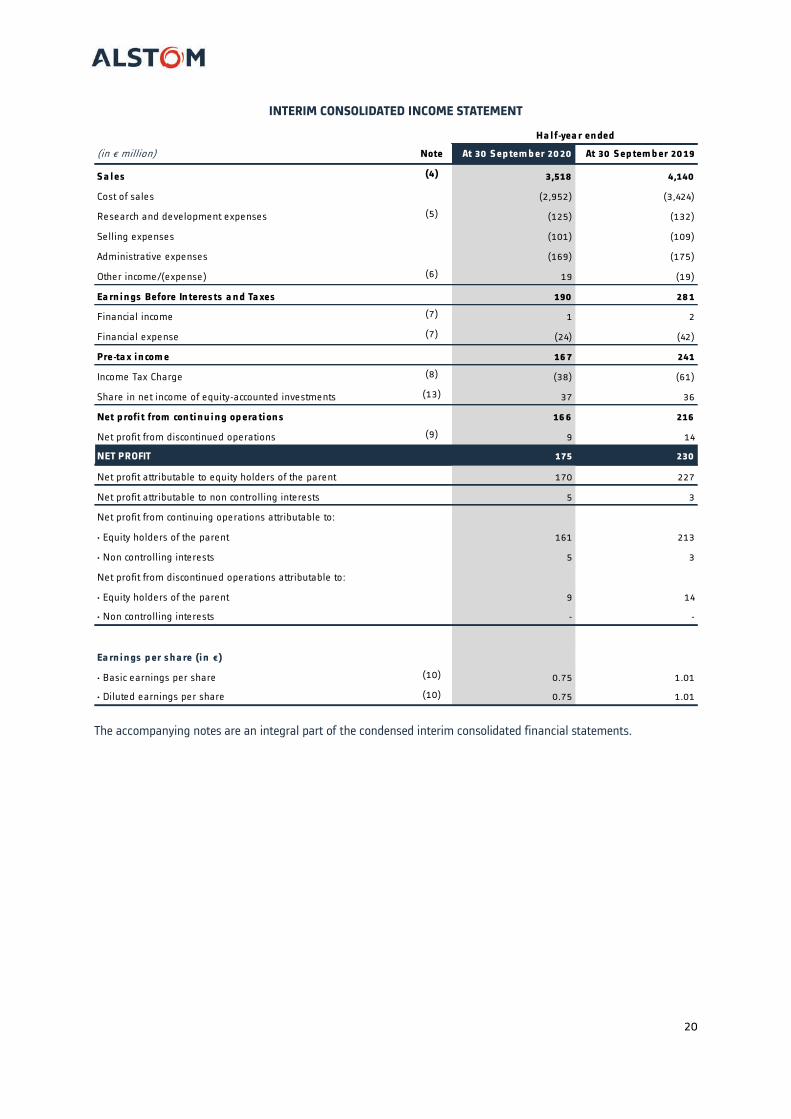
INTERIM CONSOLIDATED INCOME STATEMENT
The accompanying notes are an integral part of the condensed interim consolidated financial statements.
(in € million) Note At 30 S ep tem b er 20 20 At 30 S ep tem b er 20 19
S a l es (4) 3,518 4,140
Cost of sales (2,952) (3,424)
Research and development expenses (5) (125) (132)
Se lling expenses (101) (109)
Administrative expenses (169) (175)
Other income/(expense) (6) 19 (19)
Ea rn i n gs Before In teres ts a n d Ta xes 190 28 1
Financial income (7) 1 2
Financial expense (7) (24) (42)
Pre-ta x i n com e 16 7 241
Income Tax Charge (8) (38) (61)
Share in net income of equity-accounted investments (13) 37 36
Net p rofi t from con ti n u i n g op era ti on s 16 6 216
Net profit from discontinued operations (9) 9 14
NET PROFIT 175 230
Net profit attributable to equity holders of the parent 170 227
Net profit attributable to non controlling inte rests 5 3
Net profit from continuing operations attributable to:
• Equity holders of the parent 161 213
• Non controlling inte rests 5 3
Net profit from discontinued operations attributable to:
• Equity holders of the parent 9 14
• Non controlling inte rests - -
Ea rn i n gs p er s h a re (i n €)
• Basic earnings per share (10) 0.75 1.01
• Diluted earnings per share (10) 0.75 1.01
Ha l f-yea r en ded

21
INTERIM CONSOLIDATED STATEMENT OF COMPREHENSIVE INCOME
(*) Includes currency translation adjustments on actuarial gains and losses for €3 million as of 30 September 2020 (€2 million as of 30 September
2019)
The accompanying notes are an integral part of the condensed interim consolidated financial statements.
(in € million) Note At 30 Sep temb er 2020 At 30 Septemb er 2019
Net profit recognised in income statement 175 230
Remeasurement of post-employment benefits obligations (22) (50) (59)
Equity investments at FVOCI 4 4
Income tax relating to items that will not be reclassified to profit or loss - 13
Items that will not b e reclassified to profit or loss (46 ) (42)
of which from equity-accounted investments - -
Fair value adjustments on cash flow hedge derivatives 24 (3)
Costs of hedging reserve (25) (1)
Currency translation adjustments (*) (16) (119) 24
Income tax relating to items that may be reclassified to profit or loss - -
Items that may b e reclassified to profit or loss (120) 20
of which from equity-accounted investments (35) 10
TOTAL COMPREHENSIVE INCOME 9 208
Attributable to:
• Equity holders of the parent 5 206
• Non controlling interests 4 2
Total comprehensive income attributable to equity shareholders arises from :
• Continuing operations (4) 192
• Discontinued operations 9 14
Total comprehensive income attributable to non controlling interests arises from :
• Continuing operations 4 2
• Discontinued operations - -
Half-year ended

22
INTERIM CONSOLIDATED BALANCE SHEET
Assets
Equity and Liabilities
The accompanying notes are an integral part of the condensed interim consolidated financial statements.
(in € million) Note At 30 S ep tem b er 20 20 At 31 M a rch 20 20
Goodwill (11) 1,507 1,567
Intangible asse ts (11) 439 470
Property, plant and equipment (12) 1,330 1,371
Investments in joint-venture and associates (13) 687 693
Non consolidated investments 66 60
Other non-current asse ts (14) 215 233
Deferred Tax 226 234
Tota l n on -cu rren t a s s ets 4,470 4,6 28
Inventories (15) 1,737 1,743
Contract asse ts (15) 1,927 1,644
Trade rece ivables 1,382 1,581
Other current operating asse ts (15) 1,210 1,192
Other current financial asse ts (18) 25 45
Cash and cash equivalents (19) 1,953 2,175
Tota l cu rren t a s s ets 8 ,234 8 ,38 0
Assets he ld for sale (9) 240 -
TOTAL AS S ETS 12,944 13,0 0 8
(in € million) Note At 30 S ep tem b er 20 20 At 31 M a rch 20 20
Equity attributable to the equity holders of the parent (16) 3,281 3,271
Non controlling interests 60 57
Tota l equ i ty 3,341 3,328
Non current provisions (15) 137 160
Accrued pensions and other employee bene fits (22) 531 491
Non-current borrowings (20) 751 772
Non-current lease obligations (20) 458 465
Defe rred Tax 24 17
Tota l n on -cu rren t l i a b i l i ti es 1,90 1 1,90 5
Current provisions (15) 765 853
Current borrowings (20) 384 270
Current lease obligations (20) 111 131
Contract liabilitie s (15) 2,568 3,148
Trade payables 1,849 1,653
Other current liabilitie s (15) 1,730 1,720
Tota l cu rren t l i a b i l i ti es 7,40 7 7,775
Liabilitie s re lated to assets he ld for sale (9) 295 -
TOTAL EQUITY AND LIABILITIES 12,944 13,0 0 8

23
INTERIM CONSOLIDATED STATEMENT OF CASH FLOWS
The accompanying notes are an integral part of the condensed interim consolidated financial statements.
(in € million) Note At 30 S ep tem b er 20 20 At 30 S ep tem b er 20 19
Net p rofi t 175 230
Depreciation, amortisation and impairment (11)/(12) 101 144
Expense arising from share-based payments 7 11
Cost of net financial debt and costs of fore ign exchange hedging, ne t of inte rest paid
and rece ived (a) , and other change in provisions(4) (2)
Post-employment and other long-term defined employee benefits 7 9
Net (gains)/losses on disposal of asse ts 1 (2)
Share of net income (loss) of equity-accounted investments (net of dividends rece ived) (13) (2) 19
De ferred taxes charged to income statement 14 19
Net ca s h p rovi ded b y op era ti n g a cti vi ti es - b efore ch a n ges i n worki n g ca p i ta l 299 428
Ch a n ges i n worki n g ca p i ta l res u l ti n g from op era ti n g a cti vi ti es (b ) (15) (46 1) (358 )
Net ca s h p rovi ded b y/(u sed i n ) op era ti n g a cti vi ti es (16 2) 70
Of which operating flows provided / (used) by discontinued operations - -
Proceeds from disposals of tangible and intangible asse ts 1 3
Capital expenditure (including capitalised R&D costs) (92) (92)
Increase/(decrease) in other non-current asse ts (14) 12 (8)
Acquisitions of businesses, net of cash acquired (2) (39) (38)
Disposals of businesses, net of cash sold (6) (9)
Net ca s h p rovi ded b y/(u sed i n ) i n ves ti n g a cti vi ti es (124) (144)
Of which investing flows provided / (used) by discontinued operations (9) (6) (9)
Capital increase/(decrease) including non controlling inte rests 1 3
Dividends paid including payments to non controlling inte rests - (1,238)
Repayments of bonds & notes issued (20) - (283)
Changes in current and non-current borrowings (20) 154 30
Changes in lease obligations (20) (52) (50)
Changes in other current financial asse ts and liabilities (46) (11)
Net ca s h p rovi ded b y/(u sed i n ) fi n a n ci n g a cti vi ti es 57 (1,549)
Of which financing flows provided / (used) by discontinued operations - -
NET INCREAS E/(DECREAS E) IN CAS H AND CAS H EQUIVALENTS (229) (1,6 23)
Cash and cash equivalents at the beginning of the period 2,175 3,432
Net e ffect of exchange rate variations 7 14
Transfer to asse ts he ld for sale - 3
CAS H AND CAS H EQUIVALENTS AT THE END OF THE PERIOD (19) 1,953 1,8 26
(a) Net of inte rests paid & rece ived (13) (19)
(b) Income tax paid (30) (54)
Ha l f-yea r en ded
(in € million) At 30 Sep tember 2020 At 30 Sep temb er 2019
Net cash/(deb t) variation analysis
Changes in cash and cash equivalents (229) (1 623)
Changes in other current financia l assets and liabilities 46 11
Changes in bonds and notes - 283
Changes in current and non-current borrowings (154) (30)
Net debt of acquired/disposed entities at acquisition/disposal date and other variations 2 25
Decrease/(increase) in net debt (335) (1 334)
Net cash(deb t) at the beginn ing of the period 1 178 2 325
NET CASH/(DEBT) AT THE END OF THE PERIOD 843 991
Half-year ended

24
INTERIM CONSOLIDATED STATEMENT OF CHANGES IN EQUITY
The accompanying notes are an integral part of the condensed interim consolidated financial statements.
(in € million, except for number of share s)
Nu m b er of
ou ts ta n di n g
s h a res Ca p i ta l
Addi ti on a l
p a i d-in
ca p i ta l
Reta i n ed
ea rn i n gs
Actu a ri a l
ga in s a n d
l os s es
Ca s h -fl ow
h edge
Cu rren cy
tra n s l a ti on
a dj u s tm en t
Equ i ty
a ttri b u ta b l e
to th e equ i ty
h ol ders of
th e p a ren t
Non
con trol l i n g
i n teres ts
Tota l
equ i ty
At 31 Ma rch 20 19 223,572,313 1,56 5 931 2,36 6 (311) - (46 0 ) 4,0 91 6 8 4,159
Movements in other compre hensive income - - - 2 (43) (3) 23 (21) (1) (22)
Ne t income for the pe riod - - - 227 - - - 227 3 230
Tota l com p reh en s i ve i n com e - - - 229 (43) (3) 23 20 6 2 20 8
Change in controlling interests and others - - - (5) - - - (5) (3) (8)
Dividends - - - (1,234) - - - (1,234) (4) (1,238)
Issue of ordinary shares unde r long te rm
ince ntive plans732,073 5 - (5) - - - - - -
Recognition of equity settled share-base d
payments135,062 1 2 11 - - - 14 - 14
At 30 Sep tem b er 20 19 224,439,448 1,571 933 1,36 2 (354) (3) (437) 3,0 72 6 3 3,135
Movements in other compre hensive income - - - (11) 79 - (185) (117) (2) (119)
Ne t income for the pe riod - - - 240 - - - 240 4 244
Tota l com p reh en s i ve i n com e - - - 229 79 - (18 5) 123 2 125
Change in controlling interests and others - - - 5 - - - 5 (6) (1)
Dividends - - - - - - - - (2) (2)
Issue of ordinary shares unde r long te rm
ince ntive plans1,449,668 10 45 - - - - 55 - 55
Recognition of equity settled share-base d
payments84,666 - 2 14 - - - 16 - 16
At 31 Ma rch 20 20 225,973,78 2 1,58 1 98 0 1,6 10 (275) (3) (6 22) 3,271 57 3,328
Movements in other compre hensive income - - - (22) (46) 23 (120) (165) (1) (166)
Ne t income for the pe riod - - - 170 - - - 170 5 175
Tota l com p reh en s i ve i n com e - - - 148 (46 ) 23 (120 ) 5 4 9
Change in controlling interests and others - - - (3) - - - (3) (1) (4)
Dividends - - - - - - - - - -
Issue of ordinary shares unde r long te rm
ince ntive plans862,298 7 - (7) - - - - - -
Recognition of equity settled share-base d
payments33,682 - 1 7 - - - 8 - 8
At 30 Sep tem b er 20 20 226 ,8 6 9,76 2 1,58 8 98 1 1,755 (321) 20 (742) 3,28 1 6 0 3,341

25
NOTES TO THE INTERIM CONSOLIDATED FINANCIAL STATEMENTS
A. MAJOR EVENTS AND CHANGES IN SCOPE OF CONSOLIDATION 26
Note 1. Major events 26
Note 2. Changes in consolidation scope 28
B. ACCOUNTING POLICIES AND USE OF ESTIMATES 28
Note 3. Accounting policies 28
C. SEGMENT INFORMATION 30
Note 4. Segment information 30
D. OTHER INCOME STATEMENT 31
Note 5. Research and development expenditure 31
Note 6. Other income and expense 31
Note 7. Financial income and expense 32
Note 8. Taxation 32
Note 9. Financial statements of discontinued operations and assets held for sale 32
Note 10. Earnings per share 34
E. NON-CURRENT ASSETS 34
Note 11. Goodwill and intangible assets 34
Note 12. Property, plant and equipment 35
Note 13. Investments in Joint Ventures and Associates 36
Note 14. Other non-current assets 37
F. WORKING CAPITAL 38
Note 15. Working Capital 38
G. EQUITY AND DIVIDENDS 40
Note 16. Equity 40
Note 17. Distribution of dividends 40
H. FINANCING AND FINANCIAL RISK MANAGEMENT 41
Note 18. Other current financial assets 41
Note 19. Cash and cash equivalents 41
Note 20. Financial debt 41
Note 21. Financial instruments and financial risk management 42
I. POST-EMPLOYMENT AND OTHER LONG-TERM DEFINED EMPLOYEE BENEFITS 43
Note 22. Post-employment and other long-term defined employee benefits 43
J. CONTINGENT LIABILITIES AND DISPUTES 44
Note 23. Disputes 44
K. OTHER NOTES 48
Note 24. Related parties 48
Note 25. Subsequent events 48
Note 26. Scope of consolidation 49

26
Alstom is a leading player in the world rail transport industry. As such, the Company offers a complete range of
solutions, including rolling stock, systems, services as well as signalling for passenger and freight railway
transportation. It benefits from a growing market with solid fundamentals. The key market drivers are urbanisation,
environmental concerns, economic growth, governmental spending and digital transformation.
In this context, Alstom has been able to develop both a local and global presence that sets it apart from many of its
competitors, while offering proximity to customers and great industrial flexibility. Its range of solutions, one of the most
complete and integrated on the market, and its position as a technological leader, place Alstom in a unique situation
to benefit from the worldwide growth in the rail transport market. Lastly, in order to generate profitable growth, Alstom
focuses on operational excellence and its product mix evolution.
The condensed interim consolidated financial statements are presented in euro and have been authorized for issue by
the Board of Directors held on 10 November 2020.
A. MAJOR EVENTS AND CHANGES IN SCOPE OF CONSOLIDATION
NOTE 1. MAJOR EVENTS
1.1 The acquisition of Bombardier Transportation
Status
On 31 July 2020, the European Commission cleared Alstom’s acquisition of Bombardier Transportation. The
Commission’s approval for the transaction is conditional on the proposed engagements that consist of:
a transfer of Bombardier Transportation’s contribution to the V300 ZEFIRO very high-speed train and an offer
of IP licence to Hitachi for the train co-developed by Hitachi and Bombardier Transportation for use in future
very high-speed tenders in the UK;
the divestment of the Alstom Coradia Polyvalent and the Reichshoffen production site in France (see note 9);
the divestment of the Bombardier TALENT 3 platform and dedicated production facilities located within the
Hennigsdorf site in Germany;
providing access to certain interfaces and products for some of Bombardier Transportation’s Signalling On-
Board Units and Train Control Management Systems (TCMS).
On 16 September 2020, Alstom and Alstom Holdings signed a sale and purchase agreement with Bombardier Inc.
(‘’Bombardier’’), Caisse de Dépôt et Placement du Québec (‘’CDPQ’’), and certain subsidiaries of Bombardier and
CDPQ for the acquisition of Bombardier Transportation by Alstom Holdings. The terms of the agreement were adapted
due to the current situation. A €300 million reduction in the price range compared to the €5.8 billion to €6.2 billion
range communicated on 17 February 2020 has been agreed with Bombardier and CDPQ.
On 16 September 2020, Alstom also signed investments agreements with, respectively, Bombardier and CDPQ.
Pursuant to such investment agreements, Bombardier and CDPQ will subscribe to reserved capital increases to their
benefit, in order to reinvest in Alstom’s capital part of the proceeds from the sale of Bombardier Transportation, and,
with respect to CDPQ only, to invest additional amounts in Alstom’s capital.
On 7 October 2020, an amendment to the Universal Registration Document 2019/20 was filed with the French
financial markets authority (Autorité des marchés financiers – AMF). On such date, the AMF also approved the
prospectus related to the reserved capital increases for the benefit of, respectively, Bombardier and CDPQ.
On 29 October 2020, a combined shareholders’ meeting approved all the resolutions presented, including the
resolutions related to the proposed rights issue, the reserved capital increases and the removal of the double voting
rights. Such removal was also approved by a special meeting of the double voting rights holders held on the same day.

27
The rights issue is contemplated to take place between Q4 2020 and H1 2021, subject to market conditions.
The closing of the acquisition of Bombardier Transportation is expected to take place in Q1 2021 subject to regulatory
approvals and customary closing conditions.
Price structure and financing
Excluding the repayment of any Bombardier and/or CDPQ recapitalizations (up to €750 million) that may take place
prior to closing and any downward adjustments linked to net cash protection mechanism, the price range for the
acquisition of 100% of Bombardier Transportation shares has now been adjusted to a €5.5 billion to €5.9 billion range
compared to a €5.8 billion to €6.2 billion range communicated on 17 February 2020.
The cash proceeds to Bombardier (excluding the equivalent of €500m linked to the reserved capital increase of
Bombardier) will be paid in US dollars at an agreed exchange rate EUR/USD of circa 1/1.17. This payment is hedged
in USD.
The financing structure is as follows:
CDPQ will reinvest the proceeds from the purchase price in a total subscribed amount of between €1.9 billion
and €2.1 billion through a reserved capital increase, plus an additional amount of €700 million.
Bombardier will subscribe for a capital increase of Alstom in a fixed amount of €500 million (up to
€650 million under certain circumstances).
A €2.4 billion syndicated bridge loan, to be refinanced by:
o the capital increase of Alstom with preservation of preferential subscription rights in an amount,
including issuance premium, of approximately €2 billion;
o and a contemplated bond issuance of approximately €400million.
The balance, if any, will be paid with Alstom’s existing cash resources including Bombardier Transportation
net cash at closing.
1.2 Covid-19 crisis impacts
The Alstom Group does business in numerous countries that have significantly been affected by the Covid-19 epidemic
and is carefully monitoring the situation while taking all necessary actions to protect its employees, suppliers and
subcontractors, as well as to reduce the economic and financial impacts of this unprecedented crisis.
The identified incremental costs relating to Covid-19 incurred during the first half of fiscal year 2020/21, amounted to
€68 million, stemming both from inefficiencies and expenses dedicating specifically to Covid-19 matters. These costs
were all incurred in the first quarter of this fiscal year. Inefficiencies are costs induced by the inability of certain
employees to come to the workplace in the wake of Covid-19 lockdowns. Alstom considers dedicated expenses to be
costs mainly related to cleaning and purchase of equipment to protect its employees from the virus. These costs are
not included in the percentage of completion formula of the project and have not generated revenue. They have been
recognized in the primary statement of the income statement under the caption Cost of sales.
At the end of September, operations were running at a pace in line with the pre-existing Covid-19 crisis conditions.
Impairment tests have been performed on goodwill (see Note 11), tangible assets, intangible assets and deferred taxes
(see Note 8) with no impairment risks identified as of end of September 2020.
The Group’s response to the crisis focused on resuming production in a sanitary safe environment to ensure continuity
of project execution while implementing company-wide cost saving measures. Alstom adapted the ways of working of
its employees and limited non-essential travels and events. The Group also promoted salary moderation and kept a
tight control over additional recruitments. The company has re-assessed investment priorities to rationalise cash spend

28
while ensuring that R&D investments remained at the level that was deemed required to deliver on the Alstom in
Motion strategy roadmap.
1.3 Shareholdership and stock market index
The Steering Committee of the Euronext Indices has decided to include Alstom in the list of the 40 stocks making up
the French CAC40 index. This inclusion is effective since Monday 21 September 2020.
On 30 September 2020, Bouygues announced the successful placement of around 4.8% of Alstom’s share capital.
Following the transaction, the settlement of which occurred on 3 November 2020, Bouygues shareholding in Alstom
stands at approximately 9.7%.
NOTE 2. CHANGES IN CONSOLIDATION SCOPE
2.1 SpeedInnov
Through its affiliate SpeedInnov, a joint-venture created in 2015 with ADEME, Alstom focused on its ‘Very high-speed
train of the future’ project, aiming to promote a new generation of very high-speed trainset which will reduce
acquisition and operating costs by at least 20%, optimise the environmental footprint and develop the commercial offer
to improve passenger experience. In this context, Alstom subscribed to a capital increase in this joint-venture in an
amount of €27 million in June 2020 increasing its stake from 71.0% to 74.0% with no change in the consolidation
method (Joint control).
2.2 IBRE Acquisition
On 30 June 2020, Alstom acquired the totality of IBRE (International Braking & Railway Equipment) shares, a company
based in France and renamed “Alstom IBRE”. This company is specialized in the development, the manufacturing and
the supply of railway brake discs. Their reliable high-quality products are recognized by the most important European
railway administrations. The entity is fully consolidated in the Group’s accounts.
Preliminary Goodwill amounts to €8 million. The purchase price allocation is not fully completed and will be finalized
within twelve months after the acquisition date. The sales of the period are not material.
B. ACCOUNTING POLICIES AND USE OF ESTIMATES
NOTE 3. ACCOUNTING POLICIES
3.1 Basis of preparation of the condensed interim consolidated financial statements
Alstom (“the Group”) condensed interim consolidated financial statements for the half-year ended 30 September 2020
are presented and have been prepared in accordance with the International Financial Reporting Standards (IFRS) and
interpretations published by the International Accounting Standards Board (IASB), endorsed by the European Union
and which application was mandatory at 1 April 2020, and in accordance with IAS 34, Interim Financial Reporting.
This standard provides that condensed interim financial statements do not include all the information required under
IFRS for the preparation of annual consolidated financial statements. These condensed interim consolidated financial
statements must therefore be read in conjunction with the Group’s consolidated financial statements at 31 March
2020.

29
The accounting policies and measurement methods used to prepare these condensed interim consolidated financial
statements are identical to those applied by the Group at 31 March 2020 and described in Note 2 to the consolidated
financial statements for the year ended 31 March 2020, except:
new standards and interpretations mandatorily applicable presented in paragraph 3.2 below;
the specific measurement methods of IAS 34 applied for the preparation of condensed interim consolidated
financial statements regarding estimate of tax expense (as described in Note 8) and Post-employment and
other long term employee defined benefits valuations (as described in Note 22).
3.2 New standards and interpretations mandatorily applicable for financial periods beginning on 1 April 2020
3.2.1 Other new standards and interpretations mandatorily applicable for financial periods beginning on 1 April
2020
Several amendments are applicable at 1 April 2020:
amendments to References to IFRS 9, IAS 39 & IFRS7: Interest Rate Benchmark Reform; the Group has
elected to early adopt these amendments as expressed within the Group’s consolidated financial statements
at 31 March 2020
amendments to References to the Conceptual Framework in IFRS Standards;
amendments to IFRS 3 Business Combinations;
amendments to IAS 1 and IAS 8: Definition of material.
The last three amendments effective at 1 April 2020 for Alstom have no material impact on the Group’s consolidated
financial statements.
Moreover, Amendment to IFRS 16 Leases Covid 19-Related Rent Concessions is applicable starting 1 June 2020 and is
now endorsed by the European Union with no material impact on the condensed interim consolidated financial
statements.
3.3 New standards and interpretations not yet mandatorily applicable
New standards and interpretations endorsed by the European Union not yet mandatorily applicable
There are no new standards and interpretations endorsed by the European Union and not yet applicable on 1 April
2020.
New standards and interpretations not yet approved by the European Union:
amendments to IFRS 9, IAS 39, IFRS 7, IFRS 4 and IFRS 16 Interest Rate Benchmark Reform – Phase 2. The
amendments will be applicable for annual periods beginning after 1 January 2021.
several amendments to IFRS 3 Business Combinations, IAS 16 Property, Plant and Equipment, IAS 37
Provisions, Contingent Liabilities and Contingent Assets and Annual Improvements 2018-2020. All these
amendments will be applicable for annual periods beginning after 1 January 2022;
amendments to IAS 1 Presentation of Financial Statements: Classification of Liabilities as Current or Non-
current. The amendments will be applicable for annual periods beginning after 1 January 2023.
The potential impacts of these new pronouncements are currently being analyzed.
30
C. SEGMENT INFORMATION
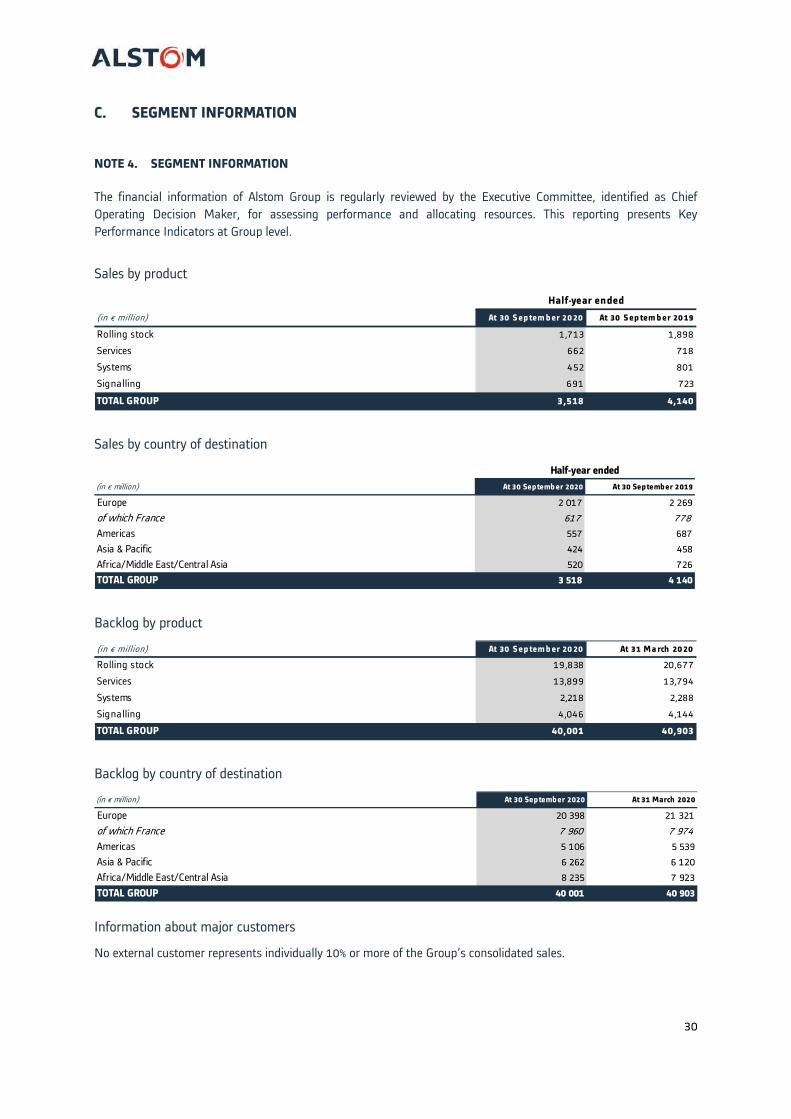
NOTE 4. SEGMENT INFORMATION
The financial information of Alstom Group is regularly reviewed by the Executive Committee, identified as Chief
Operating Decision Maker, for assessing performance and allocating resources. This reporting presents Key
Performance Indicators at Group level.
Sales by product
Sales by country of destination
Backlog by product
Backlog by country of destination
Information about major customers
No external customer represents individually 10% or more of the Group’s consolidated sales.
(in € million) At 30 S ep tem b er 20 20 At 30 Sep tem b er 20 19
Rolling stock 1,713 1,898
Services 662 718
Systems 452 801
Signalling 691 723
TOTAL GROUP 3,518 4,140
Half-year ended
(in € million) At 30 Septemb er 2020 At 30 September 2019
Europe 2 017 2 269
of which France 617 778
Americas 557 687
Asia & Pacific 424 458
Africa/Middle East/Central Asia 520 726
TOTAL GROUP 3 518 4 140
Half-year ended
(in € million) At 30 Sep tem b er 20 20 At 31 Ma rch 20 20
Rolling stock 19,838 20,677
Services 13,899 13,794
Systems 2,218 2,288
Signalling 4,046 4,144
TOTAL GROUP 40,001 40,903
(in € million) At 30 September 2020 At 31 March 2020
Europe 20 398 21 321
of which France 7 960 7 974
Americas 5 106 5 539
Asia & Pacific 6 262 6 120
Africa/Middle East/Central Asia 8 235 7 923
TOTAL GROUP 40 001 40 903

31
D. OTHER INCOME STATEMENT
NOTE 5. RESEARCH AND DEVELOPMENT EXPENDITURE
(*) €15 million impairment reversal to the Coradia™ Polyvalent technology and €(15) million corresponding amortization have not been reported in
this table.
As of end of September 2020, Alstom Group invested €178 million in Research and Development, notably to develop:
its very high-speed trains Avelia Horizon™, fully re-invoiced to SpeedInnov, with the first delivery for test on
tracks in the US on Amtrack project (final validation ongoing), while the development of the French market
version is still ongoing;
its BEMU battery train, for which a first contract has been awarded in Germany, complementing Alstom
portfolio of green solutions, along with Hydrogen trains;
its HealthHub™ predictive maintenance solution, which is now the backbone for Rolling Stock and
Infrastructures maintenance solutions;
its new generation interlocking solution, with the ARGOS partnership with SNCF signed in September 2020;
its ERTMS level 2 on-board solution, in particular to equip the entire Norwegian railway fleet with ATLAS™
on-board train control solution;
its CBTC solutions Urbalis Fluence™ and Urbalis 400™ for metros and tramways, with the launch of Fluence
Baseline 2 addressing worldwide market;
its ICONIST™ suite for Operational Control Centers, maximizing traffic fluidity and orchestrating operations
from distance;
the continuous development of innovative solutions, based on three pillars: Autonomous mobility, Data
factory and Mobility orchestration.
NOTE 6. OTHER INCOME AND EXPENSE
In the 6 months period ended 30 September 2020, restructuring and rationalisation costs are mainly related to the
adaptation of the means of production. Over the period ended at 30 September 2020, Impairment loss and other
represent mainly:
(in € million) At 30 S ep tem b er 20 20 (*) At 30 S ep tem b er 20 19
Research and deve lopment gross cost (178) (192)
Funding rece ive d 45 56
Res ea rch a n d devel op m en t s p en di n g, n et (133) (136 )
Deve lopment costs capitalised during the period 39 32
Amortisation expense of capitalised deve lopment costs (31) (28)
Res ea rch a n d devel op m en t exp en s es (125) (132)
Ha l f-yea r en ded
(in € million)At 30 S ep tem b er 20 20 At 30 S ep tem b er 20 19
Restructuring and rationalisation costs (7) (7)
Impairment loss and other 26 (12)
Other i n com e / (exp en s e) 19 (19)
Ha l f-yea r en ded

32
€(7) million of amortisation of intangible assets and integration costs related to business combinations, such
as GE Signalling, EKZ and Nomad;
€(44) million of deal costs related to Bombardier Transportation acquisition;
€47 million related to reversal of impairments (see Note 9);
€30 million related to some legal proceedings (see Note 23) and other risks, arisen outside of the ordinary
course of business.
NOTE 7. FINANCIAL INCOME AND EXPENSE
Over the period ended at 30 September 2020, interest expenses linked to accrued interest on financial debt amount to
€(1) million (compared to €(16) million at 30 September 2019 ) and those linked to lease obligations are €(4) millions.
Other Financial expenses include amortization of expenses linked to the implementation of a Revolving Credit Facility
in the context of the Covid-19 crisis (see note 21) and Bridge Facilities related to Bombardier acquisition financing.
NOTE 8. TAXATION
In accordance with IAS 34, income tax charge of €(38) million as of 30 September 2020, corresponding to an effective
tax rate of 23.2%, is recognized based on management’s estimate of the projected effective tax rate for the whole
financial year applied to the pre-tax income of the interim period and takes into consideration discrete items for €4
million.
The decrease of the tax charge as compared to the amount of €(61) million booked as at September 30, 2019 is
primarily driven by a lower pre-tax income to which projected tax rate is applied.
The recoverability of deferred tax assets has been assessed in light of the global economic context, based on business
plans prepared as at March 31, 2020 and revised for the current fiscal year 2020/21. This assessment confirms the
recoverability of deferred tax assets recognized on the balance sheet; consequently, no change of estimate in relation
with deferred tax assets recognition has been taken into account in Group’s projected and effective tax charge as at
September 30, 2020.
NOTE 9. FINANCIAL STATEMENTS OF DISCONTINUED OPERATIONS AND ASSETS HELD FOR SALE
Discontinued Operations
Accounting methods and principles applicable to discontinued operations are identical to those used at 30 September
2019 and 31 March 2020.
The Group has no Assets Held For Sale at 30 September 2020 linked to the General Electric transaction.
(in € million) At 30 S ep tem b er 20 20 At 30 Sep tem b er 20 19
Interest income 1 2
Interest expense on borrowings and on lease obligations (15) (29)
NET FINANCIAL INCOME/(EXPENSES) ON DEBT (14) (27)
Net cost of foreign exchange hedging 3 (10)
Net financial expense from employee defined benefit plans (5) (5)
Financial component on contracts 6 6
Other financial income/(expense) (13) (4)
NET FINANCIAL INCOME/(EXPENSES) (23) (40)
Half-year ended

33
The line “Net profit from discontinued operations”, recognized in the Interim Consolidated Income Statement, includes
the reassessment of liabilities related to the disposal of activities. Over the period ending 30 September 2020, Alstom
recognized a €9 million profit.
Alstom’s Interim Consolidated Statement of Cash Flows takes into account the cash flows of staggered and delayed
transferred assets, and costs directly related to the sale of Energy activities. Cash flows arising from discontinued
operations for the fiscal year amount to €(6) million.
In the context of the General Electric transaction, the release of some conditional and unconditional parent company
guarantees formerly issued, mainly by Alstom Holdings SA, to cover obligations of the former Energy affiliates amount
of €5.6 billion. The Group benefits from a general indemnification from General Electric in these matters.
Assets held for sale
The amounts presented in Assets and Liabilities held for sale correspond to the divestment of the Reichshoffen
production site in France and related businesses. As mentioned in Note 1, Alstom considers that the conditions for the
application of IFRS5 are met with respect to the plan to acquire Bombardier Transportation, even if this disposal is not
yet finalized at 30 September 2020.
All group assets with directly associated liabilities of Reichshoffen site and related businesses are disposed of together
in a single transaction and considered as a disposal group.
Immediately before initial classification as held for sales as well as on subsequent remeasurements of this disposal
group, carrying amounts of assets and liabilities are remeasured according to applicable IFRSs. These considerations
induced a reversal of a previously recognized (IAS 36) impairment for €47 million.
Additionally, the group of assets held for sale is measured at the lower of its carrying amount and fair value less costs
to sell. A non-current asset, while part of disposal classified as held for sale, is neither depreciated nor amortized.
At 30 September 2020, no impairment loss of this disposal group is deemed necessary and the impacts reclassified on
financial statements are as follows:
(*) of which €27 million of goodwill.
As this disposal group does not meet the definition of discontinued operations, Profit and Loss is presented within the
current activities of the Group. The costs to sell this disposal group amount to €3 million at 30 September 2020.
(in € million) At 30 S ep tem b er 20 20
Goodwill & Intangible asse ts (*) 65
Property, plant and equipment 45
Tota l n on -cu rrent a s s ets 110
Inventories & Contract asse ts 70
Trade rece ivables & other current asse ts 60
Tota l cu rren t a s s ets 130
TOTAL AS S ETS HELD FOR SALE 240
(in € million) At 30 S ep tem b er 20 20
Tota l n on -cu rren t l i a b i l i ti es 15
Current provisions & contract liabilities 194
Trade payables & Other current liabilities 85
Tota l cu rrent l i a b i l i ti es 279
TOTAL LIABILITIES HELD FOR S ALE 295

34
NOTE 10. EARNINGS PER SHARE
E. NON-CURRENT ASSETS
NOTE 11. GOODWILL AND INTANGIBLE ASSETS
11.1 Goodwill
(*) of which €27 million concerning the reclassification of Reichshoffen goodwill in Asset held for sale.
Movements between 31 March 2020 and 30 September 2020 mainly arose from the acquisition of IBRE SAS and the
reclassification of Reichshoffen site in non-current assets held for sale (see Notes 1 and 9).
Goodwill is reviewed for impairment at least annually and whenever events or circumstances indicate that it might be
impaired.
The events linked to Covid-19 led the Group to take into consideration the global economy downturn and recent market
conditions and to update some of the assumptions used for the impairment test performed in the frame of the
preparation of the Group’s consolidated financial statements at 31 March 2020.
(in € million) At 30 S ep tem b er 20 20 At 30 S ep tem b er 20 19
Net Profit attributable to equity holders of the parent :
• From continuing operations 161 213
• From discontinued operations 9 14
EARNINGS ATTRIBUTABLE TO EQUITY HOLD ERS OF THE PARENT 170 227
Ha l f-yea r en ded
number of sharesAt 30 S ep tem b er 20 20 At 30 S ep tem b er 20 19
Wei gh ted a vera ge nu m b er of ordin a ry s h a res u s ed to ca l cu la te b a s i c
ea rn i n gs p er s h a re226 ,576 ,921 224,238 ,795
Effect of dilutive instruments other than bonds re imbursable with shares:
• Stock options and performance share s (LTI plan) 1,500,745 1,501,787
WEIGHTED AVERAGE NUMBER OF ORD INARY S HARES US ED TO CALCULATE
D ILUTED EARNINGS PER S HARES228 ,0 77,6 6 6 225,740 ,58 2
Ha l f-yea r en ded
(in €) At 30 S ep tem b er 20 20 At 30 Sep tem b er 20 19
Basic earnings per share 0.75 1.01
Diluted earnings per share 0.75 1.01
Basic earnings per share from continuing operations 0.71 0.95
Diluted earnings per share from continuing operations 0.71 0.95
Basic earnings per share from discontinued operations 0.04 0.06
Diluted earnings per share from discontinued operations 0.04 0.06
Ha l f-yea r ended
(in € million) At 31 M a rch 20 20
Acqu i s i ti on s a nd
a dj u s tm ents on
p rel i m i n a ry
goodwi l l D i s p os a l s
Tra ns l a ti on
a dj u s tm en ts a nd
other ch a n ges (*)
At 30 S ep tem b er
20 20
GOODWILL 1,56 7 8 - (6 8 ) 1,50 7
Of which:
Gross value 1,567 8 - (68) 1,507
Impairment - - - - -

35
The impairment tests confirmed that the recoverable amount comfortably exceeds its carrying value at 30 September
2020. The Group carried out these tests using business plans drawn up at 31 March 2020, and revised for the current
fiscal year 2020/21, based on its best estimates and the visibility available for its operations at 30 September 2020.
11.2 Intangible assets
(*) includes IFRS5 reclassification (see Note 9)
NOTE 12. PROPERTY, PLANT AND EQUIPMENT
(*) includes IFRS5 reclassification (see Note 9)
The renewal of Trains product range in France & Europe (TGV du Futur, Coradia Stream, …) together with the increased
rates of production for largest contracts (E-Loco in India, Prasa in South Africa, KZ locos in Kazakhstan, …) confirmed
investment programs across various geographies at a lower but close level to September 2019 and March 2020 (despite
Covid-19).
The commitments of fixed assets which are mainly composed of property, plant and equipment and intangible assets
amount to €34 million at 30 September 2020 (€56 million at 31 March 2020).
(in € million) At 31 Ma rch 20 20
Addi ti on s / di s p os a l s
/ a m orti s a tion /
im p a i rm en t
Oth er ch a n ges
in clu din g CTA & s cop e
(*) At 30 S ep tem b er 20 20
Development costs 1,361 39 (96) 1,304
Other intangible assets 460 2 (9) 453
Gros s va lu e 1,8 21 41 (10 5) 1,757
Development costs (1,054) (16) 58 (1,012)
Other intangible assets (297) (14) 5 (306)
Am orti s a tion a n d im p a i rm en t (1,351) (30 ) 6 3 (1,318 )
Development costs 307 23 (38) 292
Other intangible assets 163 (12) (4) 147
NET VALUE 470 11 (42) 439
(in € million) At 31 Ma rch 20 20
Addi ti on s /
a m orti s a ti on /
im p a i rm en t Di s p os a l s
Oth er ch a n ges of
wh i ch tra n s l a ti on
a dju s tm en ts a n d
s cop e (*)
At 30 S ep tem b er
20 20
Land 95 - - (4) 91
Buildings 1,445 38 (1) (72) 1,410
Machinery and e quipment 907 17 (8) (29) 887
Constructions in progress 135 31 - (52) 114
Tools, furniture , fixtures and other 225 5 (1) - 229
Gros s va lu e 2,8 0 7 91 (10 ) (157) 2,731
Land (6) - - - (6)
Buildings (600) (29) 1 45 (583)
Machinery and e quipment (664) (25) 8 35 (646)
Constructions in progress (3) 1 - - (2)
Tools, furniture , fixtures and other (163) (18) 1 16 (164)
Am orti s a ti on a n d im p a i rm en t (1,436 ) (71) 10 96 (1,40 1)
Land 89 - - (4) 85
Buildings 845 9 - (27) 827
Machinery and e quipment 243 (8) - 6 241
Constructions in progress 132 32 - (52) 112
Tools, furniture , fixtures and other 62 (13) - 16 65
NET VALUE 1,371 20 - (6 1) 1,330

36
Right-of-Use
Property, Plant and Equipment balances include Right-of-Use related to Leased Assets for the following amounts:
NOTE 13. INVESTMENTS IN JOINT VENTURES AND ASSOCIATES
Financial information
Movements during the period
At 30 September 2020, Alstom invested into an increase in capital in SpeedInnov for €27 million during June 2020 (see
Note 2).
13.1 TMH Limited
For practical reason, to be able to get timely and accurate information, data as of 30 June 2020 and 31 December 2019
are retained and booked within Alstom’s 30 September 2020 and 31 March 2020 accounts. The length of the reporting
periods and any difference between the ends of the reporting periods remain the same from period to period to allow
comparability and consistency. The summarized financial information (at 100%) presented below are the figures
disclosed in the financial statements of TMH Limited at 30 June 2020 and 31 December 2019 and are established in
(in € million) At 31 M a rch 20 20
Addi ti on s /
a m orti s a ti on /
i m p a i rm ent D i s p os a l s
Other ch a nges of
wh i ch
tra n s l a ti on
a dju s tm en ts a n d
s cop e
At 30 S ep tem b er
20 20
Land 6 - - - 6
Buildings 463 29 - (13) 479
Machinery and equipment 20 3 - (1) 22
Tools, furniture , fixtures and other 33 2 - (1) 34
Gros s va l u e 522 34 - (15) 541
Buildings (98) (37) - 9 (126)
Machinery and equipment (8) (2) - 1 (9)
Tools, furniture , fixtures and other (12) (5) - 1 (16)
Am orti s a tion a nd i m p a i rm ent (118 ) (44) - 11 (151)
Land 6 - - - 6
Buildings 365 (8) - (4) 353
Machinery and equipment 12 1 - - 13
Tools, furniture , fixtures and other 21 (3) - - 18
NET VALUE 40 4 (10 ) - (4) 390
(in € million)At 30 S ep tem b er 20 20 At 31 Ma rch 20 20
Ha l f-yea r ended At 30
Sep tem b er 20 20
Ha l f-yea r en ded At 30
S ep tem b er 20 19
TMH Limited 454 469 18 17
Other Associates 128 137 24 20
As s ocia tes 58 2 6 0 6 42 37
SpeedInnov JV 104 86 (5) (1)
Other Joint ventures 1 1 - -
Joi n t ven tu res 10 5 8 7 (5) (1)
TOTAL 6 8 7 6 93 37 36
S h a re i n equ i ty Sh a re of n et i n com e
(in € million) At 30 September 2020 At 31 March 2020
Op en ing balance 693 711
Share in net income of equity-accounted investments after impairment 37 102
Dividends (36) (80)
Acquisitions 27 56
Translation adjustments and other (34) (95)
CLOSING BALANCE 687 6 93
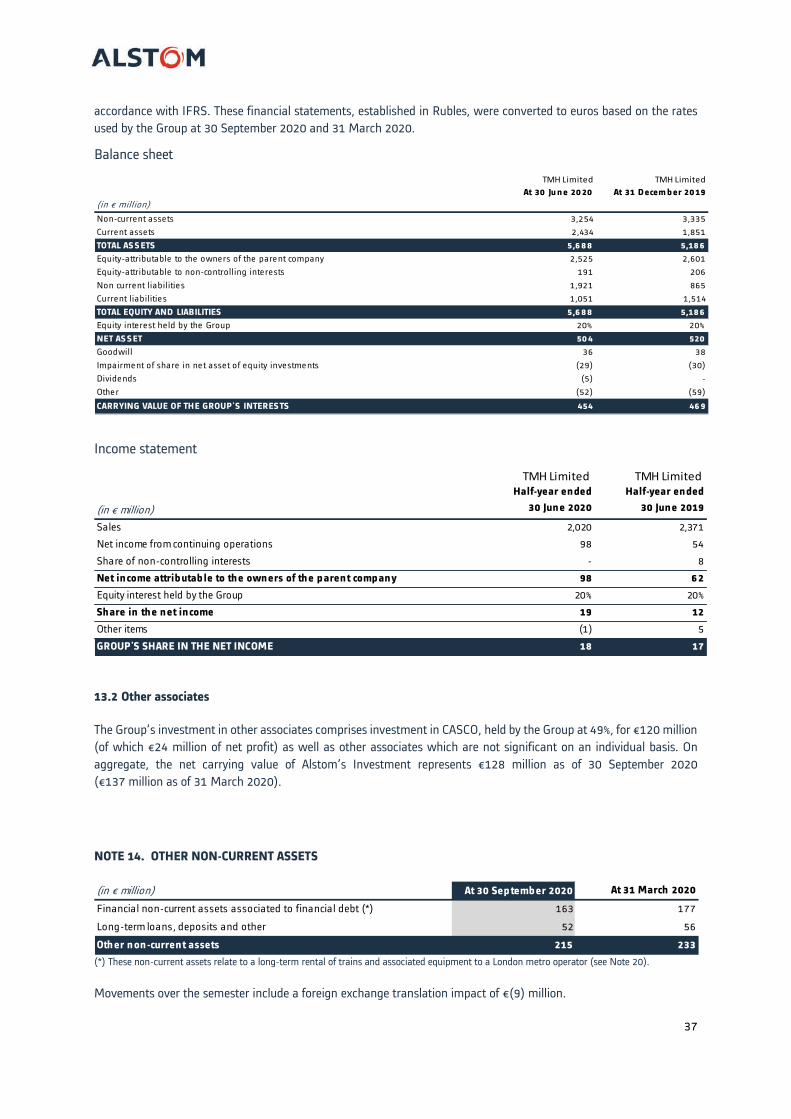
37
accordance with IFRS. These financial statements, established in Rubles, were converted to euros based on the rates
used by the Group at 30 September 2020 and 31 March 2020.
Balance sheet
Income statement
13.2 Other associates
The Group’s investment in other associates comprises investment in CASCO, held by the Group at 49%, for €120 million
(of which €24 million of net profit) as well as other associates which are not significant on an individual basis. On
aggregate, the net carrying value of Alstom’s Investment represents €128 million as of 30 September 2020
(€137 million as of 31 March 2020).
NOTE 14. OTHER NON-CURRENT ASSETS
(*) These non-current assets relate to a long-term rental of trains and associated equipment to a London metro operator (see Note 20).
Movements over the semester include a foreign exchange translation impact of €(9) million.
TMH Limited TMH Limited
(in € million)
At 30 Ju n e 20 20 At 31 Decem b er 20 19
Non-current assets 3,254 3,335
Current assets 2,434 1,851
TOTAL AS S ETS 5,6 8 8 5,18 6
Equity-attributable to the owners of the parent company 2,525 2,601
Equity-attributable to non-controlling interests 191 206
Non current liabilitie s 1,921 865
Current liabilitie s 1,051 1,514
TOTAL EQUITY AND LIABILITIES 5,6 8 8 5,18 6
Equity interest he ld by the Group 20% 20%
NET AS SET 50 4 520
Goodwill 36 38
Impairment of share in ne t asset of equity investments (29) (30)
Dividends (5) -
Othe r (52) (59)
CARRYING VALUE OF THE GROUP'S INTERESTS 454 46 9
TMH Limited TMH Limited
(in € million)
Half-year ended
30 June 2020
Half-year ended
30 June 2019
Sales 2,020 2,371
Net income from continuing operations 98 54
Share of non-controlling interests - 8
Net income attrib utab le to the owners of the p arent comp any 98 62
Equity interest held by the Group 20% 20%
Share in the net income 19 12
Other items (1) 5
GROUP'S SHARE IN THE NET INCOME 18 17
(in € million) At 30 Sep tember 2020 At 31 March 2020
Financial non-current assets associated to financial debt (*) 163 177
Long-term loans, deposits and other 52 56
Other non-current assets 215 233

38
F. WORKING CAPITAL
NOTE 15. WORKING CAPITAL
15.1 Inventories
15.2 Net contract Assets/(Liabilities)
(in € million) At 30 S ep tem b er 20 20 At 31 M a rch 20 20 Va ri a ti on
Inventorie s 1,737 1,743 (6)
Contract assets 1,927 1,644 283
Trade rece ivables 1,382 1,581 (199)
Other current operating asse ts / (liabilitie s) (520) (528) 8
Contract liabilitie s (2,568) (3,148) 580
Provisions (902) (1,013) 111
Trade payables (1,849) (1,653) (196)
WORKING CAPITAL (793) (1,374) 58 1
(in € million)
For th e h a l f-yea r
ended At 30
S ep tem b er 20 20
Worki ng ca p i ta l a t th e b egi n n in g of th e p eri od (1,374)
Changes in working capital resulting from operating activities 461
Changes in working capital resulting from investing activities 2
Translation adjustments and other changes 118
Tota l ch a nges i n worki n g ca p i ta l 58 1
Worki ng ca p i ta l a t th e en d of th e p eri od (793)
(in € million) At 30 Sep tem b er 20 20 At 31 Ma rch 20 20
Raw materials and supplies 1,135 1,099
Work in progress 604 692
Finished products 150 146
Inventories, gross 1,889 1,937
Raw materials and supplies (140) (129)
Work in progress (7) (58)
Finished products (5) (7)
Write-down (152) (194)
Inventories, net 1,737 1,743
(in € million) At 30 Sep tem b er 20 20 At 31 Ma rch 20 20 Va ri a ti on
Cost to fulfil a contract 17 15 2
Contract assets 1,910 1,629 281
Total contract assets 1,927 1,6 44 283
Contract liabilities (2,568) (3,148) 580
Net contract Assets/(Liab ilities) (6 41) (1,504) 863

39
Net contract Assets/(Liabilities) include down-payments for €2,116 million at 30 September 2020 and €2,238 million
at 31 March 2020.
15.3 Other current operating assets & liabilities
Over the period ended 30 September 2020, the Group entered into agreements of assignment of receivables that lead
to the derecognition of tax receivables for an amount of €45 million. The total disposed amount outstanding at 30
September 2020 is €123 million.
15.4 Provisions
Provisions for warranties relate to estimated costs to be incurred over the residual contractual warranty period on
completed contracts.
Provisions for risks on contracts relate to provisions on contract losses and to commercial disputes and operating risks.
In relation to uncertain tax treatments and tax risks, the Group tax filings are subject to audit by tax authorities in most
jurisdictions in which the Group operates. These audits may result in assessment of additional taxes that are
(in € million) At 30 Sep temb er 2020 At 31 March 2020
Down payments made to suppliers 53 63
Corporate income tax 71 85
Other taxes 314 326
Prepaid expenses 89 55
Other receivables 297 209
Derivatives relating to operating activities 104 207
Remeasurement of hedged firm commitments in foreign currency 282 247
Other current op erating assets 1,210 1,192
(in € million) At 30 Sep temb er 2020 At 31 March 2020
Staff and associated liabilities 427 531
Corporate income tax 96 93
Other taxes 150 137
Deferred income 11 9
Other payables 720 572
Derivatives relating to operating activities 178 199
Remeasurement of hedged firm commitments in foreign currency 148 179
Other current op erating liab ilities 1,730 1,720
(in € million)
At 31 March
2020 Additions Releases Applications
Translation
adjustments and
other
At 30 September
2020
Warranties 275 89 (21) (49) (16) 278
Risks on contracts 578 42 (72) (28) (33) 487
Current provisions 853 131 (93) (77) (49) 765
Tax risks & litigations 63 3 (2) (1) (4) 59
Restructuring 30 4 (1) (18) - 15
Other non-current provisions 67 1 (1) - (4) 63
Non-current provisions 160 8 (4) (19) (8) 137
Total Provisions 1,013 139 (97) (96) (57) 902

40
subsequently resolved with the authorities or potentially through the courts. The Group believes that it has strong
arguments against the questions being raised, that it will pursue all legal remedies to avoid an unfavourable outcome
and that it has adequately provided for any risk that could result from those proceedings where it is probable that it
will pay some amounts. Following IFRIC 23 application in April 2019, it is reminded that liabilities for uncertainty over
income tax treatments are now presented as tax liabilities on the line corporate income tax in the other current
operating liabilities.
Restructuring provisions mainly derive from the adaptation of the means of production in certain countries, as
Germany.
Other non-current provisions mainly relate to guarantees delivered or risks in connection with disposals, employee
litigations, commercial disputes and environmental obligations.
The management identifies and analyses on a regular basis current litigations and other risks, using its best estimate
to assess, when necessary, provisions. These estimates take into account information available and different possible
outcomes. Main disputes are described in Note 23.
G. EQUITY AND DIVIDENDS
NOTE 16. EQUITY
16.1 Capital
At 30 September 2020, the share capital of Alstom amounts to €1,588,088,334 consisting of 226,869,762 ordinary
shares with a par value of €7 each. Over the period, the weighted average number of outstanding ordinary shares
amounts to 226,576,921 after the dilutive effect of bonds reimbursable in shares “Obligations Remboursables en
Actions” and to 228,077,666 after the effect of all dilutive instruments
During the period ended 30 September 2020:
33,682 ordinary shares were issued under equity settled share-based payments;
862,298 ordinary shares were issued under long term incentive plans.
16.2 Currency translation adjustment
As at 30 September 2020, the currency translation group reserve amounts to €(742) million.
The currency translation adjustment, presented within the consolidated statement of comprehensive income for €(120)
million, primarily reflects the effect of variations of the US Dollar (€(48) million), Russian Federation Rouble (€(31)
million), Brazilian Real (€(15) million), Indian Rupee (€(9) million), British pound (€(5) million) and against the Euro
for the half-year ended 30 September 2020.
NOTE 17. DISTRIBUTION OF DIVIDENDS
As approved at the Combined Shareholders’ Meeting on 8 July 2020, Alstom did not distribute dividend for fiscal year
2019/20 in the context of the sanitary crisis.

41
H. FINANCING AND FINANCIAL RISK MANAGEMENT
NOTE 18. OTHER CURRENT FINANCIAL ASSETS
As at 30 September 2020, other current financial assets comprise the positive market value of derivatives instruments
hedging financing activities.
Alstom Group's derivatives related to financing activities as of September 30st 2020 contain derivatives instruments
entered to mitigate the Foreign Exchange Currency risk of the purchase price in the frame of the Bombardier
Transportation acquisition for €12million. Hedges first designation is based so far on the highly probable value of the
purchase price on the sale and purchase agreement date (see Note 1) and is therefore eligible for cash flow hedge
accounting. This estimate will be reassessed based on new available information up to the closing.
NOTE 19. CASH AND CASH EQUIVALENTS
In addition to bank open deposits classified as cash for €1,148 million, the Group invests in cash equivalents:
Euro money market funds for an amount of €651 million (€853 million at 31 March 2020) qualified as “monetary”
or “monetary short-term” under the French AMF classification;
Bank term deposits that can be terminated at any time with less than three months notification period for an
amount of €154 million (€262 million at 31 March 2020).
NOTE 20. FINANCIAL DEBT
Paid interests are disclosed in the net cash provided by operating activities part in the cash flow statement. Net
interests paid and received amount to €(9) million and those related to lease obligations amount to €(4) million.
(in € million) At 30 Sep temb er 2020 At 31 March 2020
Derivatives related to financing activities and others 25 45
OTHER CURRENT FINANCIAL ASSETS 25 45
(in € million) At 30 Sep temb er 2020 At 31 March 2020
Cash 1,148 1,060
Cash equivalents 805 1,115
CASH AND CASH EQUIVALENT 1,953 2,175
Cash movements
Non-cash
movements
(in € million)
At 31 March
2020
Net cash
variation
Translation
adjustments and
other
At 30 September
2020
Bonds 694 - 1 695
Other borrowing facilities 290 126 8 424
Derivatives relating to financing activities 57 - (43) 14
Accrued interests 1 (13) 14 2
Borrowings 1,042 113 (20) 1,135
Lease ob ligations 596 (52) 25 56 9
Total financial deb t 1,638 61 5 1,704

42
Lease obligations include obligations under long-term rental representing liabilities related to lease obligations on trains
and associated equipment for €163 million at 30 September 2020 and €177 million at 31 March 2020 (see Note 14).
Bonds
The following table summarizes terms of the Group’s bond:
Other borrowings facilities
Other borrowings facilities include:
Negotiable European Commercial Papers for €215 million of which €190 million issued during the semester;
Banking facilities drawn by affiliates.
NOTE 21. FINANCIAL INSTRUMENTS AND FINANCIAL RISK MANAGEMENT
The main categories of financial assets and financial liabilities of the Group and Financial Risk Management are
identical to those described in the consolidated financial statements at 31 March 2020.
Revolving Credit Facility
In addition to its available cash and cash equivalents, amounting to €1.953 million at 30 September 2020, the Group
can access a €400 million revolving credit facility, maturing in June 2022, which is fully undrawn on September 2020.
In the context of COVID-19, Alstom has taken additional measures to bolster its liquidity.
Alstom secured a €1,750 million Revolving Credit Facility with a 1-year maturity, a 6-month extension option at the
borrower’s discretion and another 6 months extension at the lenders’ discretion. This additional RCF aims at stepping
in for Alstom’s €1 billion Negotiables European Commercial Paper program, should the Commercial Papers market be
no longer accessible, in addition to providing an extra liquidity buffer.
With these facilities in place and cash position, the Company has significant liquidity available to cope with additional
cash requirements related to the coronavirus.
Commercial obligations
Contractual obligations of the Group towards its customers may be guaranteed by bank bonds or insurance bonds.
Bank and insurance bonds may guarantee liabilities already recorded on the balance sheet as well as contingent
liabilities.
To issue these bonds, the Group relies on both uncommitted bilateral lines in numerous countries and a €3 billion
Committed Guarantee Facility Agreement (“CGFA”) with five tier one banks allowing issuance until 2nd March 2023 of
bonds with tenors up to 7 years. This bilateral line contains a change of control clause, which may result in the program
being suspended, in the obligation to procure new bonds to replace outstanding bonds or to provide cash collateral, as
well as early reimbursement of the other debts of the Group, as a result of their cross-default or cross-acceleration
provisions.
As at 30 September 2020, the total outstanding bonding guarantees related to contracts from continuing operations,
issued by banks or insurance companies, amounted to €9.6 billion (€9.6 billion at 31 March 2020).
In i ti a l Nom i n a l
va l u e (i n €
m i l l i on )
Ma tu ri ty da te
(dd/m m /yy)
Nom i n a l i n teres t
ra te
Effecti ve i n teres t
ra te
Accou n ti n g va l u e
a t At 30
S ep tem b er 20 20
Ma rket va l u e a t
At 30 S ep tem b er
20 20
Alstom October 2026 700 14/10/2026 0.25% 0.38% 695 687
Tota l a n d wei gh ted a vera ge ra te 0 .25% 0 .38 % 6 95 6 8 7

43
The available amount under the Committed Guarantee Facility Agreement at 30 September 2020 amounts to €1.4
billion (€1.7 billion at 31 March 2020).
Issues under the syndicated line are also subject to certain financial criteria (debt ratio), based on consolidated Group
data and consistent with the debt ratio of the credit line.
Financial covenant
The €400 million Revolving Credit Facility is subject to a covenant on the ratio of total net debt to EBITDA:
- Total net debt is defined as total financial debt except lease obligations under IFRS 16 scope, less cash and cash
equivalents;
- The EBITDA is defined as earnings before financial expense, financing income, income taxes, amortisation and
impairment charges on tangible and intangible assets less capital gain on disposal of investments less the rental
costs related to Lease Obligations under IFRS 16 scope (over rolling 12 months for the semester).
This ratio should not exceed 2.5.
The financial covenant calculation is detailed below:
There is no financial covenant in the €3 billion Committed Guarantee Facility agreement, in the 1,750 million revolving
credit facility and the bridge facilities that will fund the Bombardier Transportation acquisition.
I. POST-EMPLOYMENT AND OTHER LONG-TERM DEFINED EMPLOYEE BENEFITS
NOTE 22. POST-EMPLOYMENT AND OTHER LONG-TERM DEFINED EMPLOYEE BENEFITS
The net liability on post-employment and on other long term employee defined benefits is calculated using the latest
valuation at the previous financial year closing date. Adjustments of actuarial assumptions are performed on main
contributing areas (United Kingdom, Germany, France, Switzerland, Italy, Sweden and the US) if significant
fluctuations or one-time events have occurred during the 6 months period. The fair value of main plan assets was
reviewed at 30 September 2020.
Discount rates for main geographic areas (weighted average rates)
Movements of the period
At 30 September 2020, the net provision for post-employment benefits amounts to €531 million compared with €491
million at 31 March 2020. The variation of actuarial gains and losses arising from post-employment defined benefit
(in € million)
For the half-year
ended At 30
September 2020
For the year ended
At 31 March 2020
EBITDA 607 746
Total net debt (832) (1,190)
Total Net deb t leverage (1.4) (1.6 )
(in %) At 30 September 2020 At 31 March 2020
United Kingdom 1.85 2.55
Euro Zone 0.90 1.54
Other 2.36 2.60

44
plans recognized in the Other comprehensive income amounts to €50 million for the half-year ended 30 September
2020 because of the evolution of the discount rate by geographic areas.
Other variations in the period ended 30 September 2020 mainly arose from service costs related to defined benefits
that are consistent with costs incurred in the previous period, and with projections estimated in actuarial valuations
performed at 31 March 2020.
J. CONTINGENT LIABILITIES AND DISPUTES
NOTE 23. DISPUTES
Disputes in the Group’s ordinary course of business
The Group is engaged in several legal proceedings, mostly contract-related disputes that have arisen in the ordinary
course of business. These disputes, often involving claims for contract delays or additional work, are common in the
areas in which the Group operates, particularly for large long-term projects. In some cases, the amounts, which may
be significant, are claimed against the Group, sometimes jointly with its consortium partners.
In some proceedings the amount claimed is not specified at the beginning of the proceedings. Amounts retained in
respect of these litigations are taken into account in the estimate of margin at completion in case of contracts in
progress or included in provisions and other current liabilities in case of completed contracts when considered as reliable
estimates of probable liabilities. Actual costs incurred may exceed the amount of initial estimates because of a number
of factors including the inherent uncertainties of the outcome of litigation.
Other disputes
Asbestos
Some of the Group’s subsidiaries are subject to civil proceedings in relation to the use of asbestos in France essentially
and in Spain and the United Kingdom. In France, these proceedings are initiated by certain employees or former
employees suffering from an occupational disease in relation to asbestos with the aim of obtaining a court decision
allowing them to obtain a supplementary compensation from the French Social Security funds. In addition, employees
and former employees of the Group not suffering from an asbestos related occupational disease have started lawsuits
before the French courts with the aim of obtaining compensation for damages in relation to their alleged exposure to
asbestos, including the specific anxiety damage.
The Group believes that the cases where it may be required to bear the financial consequences of such proceedings do
not represent a material exposure. While the outcome of the existing asbestos-related cases cannot be predicted with
reasonable certainty, the Group believes that these cases would not have any material adverse effect on its financial
condition.
Alleged anti-competitive activities
Transportation activities in Brazil
In July 2013, the Brazilian Competition Authority (“CADE”) raided a number of companies involved in transportation
activities in Brazil, including the subsidiary of Alstom, following allegations of anti-competitive practices and illegal
payments. After a preliminary investigation stage, CADE notified in March 2014 the opening of an administrative
procedure against several companies, of which the Alstom’s subsidiary in Brazil, and certain current and former
employees of the Group. CADE ruled in July 2019 a financial fine of BRL 133 million (approximately €20 million) on
Alstom’s subsidiary in Brazil as well as a ban to participate in public procurement bids in Brazil conducted by the

45
Federal, State, and Municipal Public Administration over a period of 5 years. The administrative decision is now
considered final. In September 2020, Alstom’s subsidiary in Brazil has lodged a judicial appeal against the July 2019
administrative decision before the Brasilia Civil Court as well as an injunction to suspend CADE´s decision until the
final decision on the judicial appeal. On September 14th, 2020 the Court has responded positively to the injunction
request. CADE has filed an appeal against this injunction on 3rd November 2020 solely on the merits and not on the
suspension aspect, which therefore remains valid. The review and assessment of this appeal is ongoing with Alstom
external lawyers. In parallel to this main case opened by CADE only in relation to entities and individuals formally
notified when launching the proceedings in 2014, CADE launched in the Spring of 2018 formal notifications against
individuals who had not yet been notified yet, mainly foreign individuals not residing in Brazil. The proceedings against
these individuals are part of a second phase of the case. Current and former employees of Alstom are also subject to
proceedings initiated by the public prosecutor of the state of Sao Paulo in connection with some of the Transport
projects subject to CADE procedure.
The Prosecutor of the State of Sao Paulo launched in May 2014 a civil action against a Group’s subsidiary in Brazil,
along with a number of other companies, for a total amount asserted against all companies of BRL2.5 billion
(approximately €439 million) excluding interests and possible damages in connection with a transportation project.
The Group’s subsidiary is actively defending itself against this action.
In December 2014, the public prosecutor of the state of Sao Paulo also initiated a lawsuit against Alstom’s subsidiary
in Brazil, along with a number of other companies, related to alleged anti-competitive practices regarding the first
phase of a train maintenance project, which is also subject to administrative proceedings since 2013. In the last quarter
of 2016, this Alstom subsidiary in Brazil, along with a number of other companies, faced the opening of another lawsuit
by the public prosecutor of the state of Sao Paulo related to alleged anti-competitive practices regarding a second phase
of the said train maintenance project. In case of proven illicit practices, possible sanctions can include the cancellation
of the relevant contracts, the payment of damage compensation, the payment of punitive damages and/or the
dissolution of the Brazilian companies involved.
Italy – new file
On 23th of June 2020, a series of searches and arrests have been carried out by the Milan police under instructions of
the Milan Prosecution Office as part of a preliminary investigation into alleged bribes and bid-rigging in connection
with public tenders for Azienda Transporte Milanesi (“ATM”), the municipal public transport company and operator of
the Milan Subway. The investigation concerns at least seven companies and 28 individuals, including three current
employees and one former employee of Alstom Ferroviaria S.p.A (the “Alstom Italy employees”).
The Prosecution Office alleges that the Alstom Italy employees engaged in bid-rigging under Article 353 of the Italian
Criminal Code, including colluding with an employee of ATM, to obtain confidential technical information in order to
secure an undue advantage in the tender process for a 2019 contract for the Milan subway. Alstom did not ultimately
submit a bid in respect of this contract.
Alstom Ferroviaria S.p.A. is also subject to investigation regarding alleged violation of Legislative Decree No. 231/2001
(“Decree 231/2001”) for not having implemented (or not having efficiently applied) a system of control capable to
avoid the commission by its employees of corruption. A company may only be held liable under Decree 231 if the
criminal misconduct of its employees is established. In such a case, a company may seek to defend itself from corporate
liability under Decree 231/2001 by showing that it had adopted and effectively implemented an organizational model
(known as a “Modello”) to prevent misconduct and established an independent supervisory body (known as an
“organismo di vigilenza”) to oversee compliance with the Modello. Alstom Ferroviaria S.p.A. has adopted a Modello
and has established on organism di vigilenza.
Alstom is conducting an internal investigation into the allegations discussed above in coordination with external counsel
and has taken certain interim measures in response to the allegations of the Prosecution Office, in particular by
suspending one of its employee of Alstom Ferroviaria S.p.A. . The preliminary investigation by the Prosecution Office
continues in parallel. Following its investigation, the Prosecution Office will decide whether to request a dismissal or
to request an indictment.

46
Alleged illegal payments
Certain companies and former employees of the Group are currently being investigated and/or subject to procedures,
by judicial or administrative authorities (including in Hungary) or international financial institutions with respect to
alleged illegal payments in certain countries.
With respect to these matters, the Group is cooperating with the concerned authorities or institutions. These
investigations or procedures may result in criminal sanctions, including fines which may be significant, exclusion of
Group subsidiaries from tenders and third-party actions.
CR-1 Marmaray railway infrastructure – Turkey
In March 2007, the Turkish Ministry of Transport (DLH) awarded the contract to upgrade approximately 75 km of
railway infrastructure in the Istanbul region, known as the “Marmaray Commuter Rail Project (CR-1)” to the
consortium Alstom Dogus Marubeni (AMD), of which Alstom Transport’s main French subsidiary is a member. This
project, which included works on the transcontinental railway tunnel under the Bosphorus, has undergone significant
delays mainly due to difficulties for the DLH to make the construction site available. Thus, the AMD consortium
terminated the contract in 2010. This termination was challenged by DLH, who thereafter called the bank guarantees
issued by the consortium up to an amount of approximately €80 million. Following injunctions, the payment of such
bank guarantees was forbidden, and the AMD consortium immediately initiated an arbitration procedure to resolve the
substantive issues. The arbitral tribunal has decided in December 2014 that the contract stands as terminated by virtue
of Turkish law and has authorized the parties to submit their claims for compensation of the damages arising from
such termination. Following this decision on the merits, DLH made renewed attempts in 2015 to obtain payment of
the bank guarantees but defense proceedings by the AMD consortium have enabled so far to reject these payment
requests.
In the arbitration procedure, the phase of assessment of damages is over. Hearings took place in October 2017 and
post-hearing submissions were exchanged in February 2018. In May 2018, the arbitral tribunal requested further
submissions from the parties to clarify certain claims and the parties exchanged their submissions until July 2018. A
second partial final award on quantum was issued to the parties’ on 20 September 2019, which recognized (a) the
significant delays caused by DLH and AMD’s entitlements in the sum of approximately €41 million, and (b) DLH’s
alleged loss in the amount of approximately €68 million, resulting in a net principal sum, after set-off, ordered payable
by the AMD consortium to DLH in the amount of approximately €27 million. An addendum to the second partial award
was issued by the tribunal on 23 December 2019, reducing AMD’s exposure to €21 million. The third and final award,
which exclusively deals with legal costs, interests, tax and four minor claims, was communicated to Alstom on July
24th. 2020. The set off of the various amounts awarded by the tribunal to both parties results in an additional net
amount of approx. 6M due by AMD to the Ministry (totalling approx. €28 million). On 29 August 2020, AMD filed a
request for clarification of the award which could potentially decrease the consortium net exposure by €500.000. The
draft of the award has been validated by the ICC on 29th of October 2020 and sent back to the Tribunal for finalization
before communication. The communication date has not been shared with the parties yet.
On the other hand, through arbitration request notified on 29 September 2015, Marubeni Corporation launched
proceedings against Alstom Transport SA taken as consortium leader in order to be compensated for the consequences
of the termination of the contract with AMD. In a similar fashion, through arbitration request issued on 15 March
2016, the other consortium member Dogus launched proceedings against Alstom Transport SA with similar demands
and a request to have the disputes between consortium members consolidated in a single case. Alstom Transport SA
is rejecting these compensation requests and is defending itself in these proceedings between consortium members
which, while having gone through a consolidation in a single case, have however been suspended by the arbitral
tribunal pending the outcome of the main arbitral proceedings between AMD and DLH. In October 2018, Dogus applied
for interim measures to clarify certain aspects of the consortium agreement and this request was rejected by the arbitral
tribunal.
47
Regional Minuetto trains & high-speed Pendolino trains – Italy
Alstom Transport’s subsidiary in Italy is involved in two litigation proceedings with the Italian railway company
Trenitalia. One is related to a supply contract of regional Minuetto trains awarded in 2001 (the “Minuetto case”), and
the other to a supply contract of high-speed Pendolino trains awarded in 2004 (the “Pendolino case”). Each of these
contracts has undergone technical issues and delays leading the Trenitalia company to apply delay and technical
penalties and, consequently, to withhold payments. Since the parties dispute certain technical matters as well as the
causes and responsibilities of the delays, the matter was brought before Italian courts in 2010 and 2011 respectively.
In the Minuetto case, the technical expertise report has been released and Alstom has challenged its contents with
amendment requests. The technical expert submitted his final report in April 2017 and certain amendment requests
were taken into account. The parties have exchanged final summary memorials, and the next step will be the decision
of the tribunal. On 26 June 2019, the Court of Cuneo issued its decision, mainly (i) recognizing that Trenitalia abused
of Alstom’s economic dependence (which led Alstom to accept unfair contractual terms, some of which were declared
null), (ii) acknowledging a substantial amount of penalties but for which the court ruled that Trenitalia could not obtain
payment of on the basis of procedural grounds and (iii) dismissing all other claims of the parties. On 24 January 2020
Alstom appealed the decision before the Court of Appeal of Turin. On 12 May 2020 Trenitalia filed its defense and
counter-appeal. The Court of Appeal of Turin fixed the first hearing of the proceedings on 4 November 2020.
In the Pendolino case, the technical expertise report was released, and Alstom has obtained certain corrections
following its challenge on some of the conclusions of the report. After the closing of the expertise phase the proceedings
continued their path on the legal aspects of the dispute. The tribunal rendered in March 2019 a decision acknowledging
that a significant part of the delays was not attributable to Alstom and therefore reduced a large portion of the delay
damages claimed by Trenitalia s. The tribunal also rejected the reliability penalties claimed by Trenitalia while accepting
certain of its residual damage compensation requests. Finally, the tribunal accepted Alstom’s claims linked to contract
price adjustment formula while rejecting some of its other cost compensation claims. Alstom appealed the decision on
7 October 2019. On 15 January 2020 Trenitalia filed its defense and counter-appeal. The Court of Appeal of Rome fixed
the first hearing of the proceedings on 13 January 2022.
Saturno
Following a dispute within a consortium involving Alstom’s subsidiary in Italy and three other Italian companies, the
arbitral tribunal constituted to resolve the matter has rendered in August 2016 a decision against Alstom by awarding
€22 million of damage compensation to the other consortium members. Alstom’s subsidiary strongly contests this
decision and considers that it should be able to avoid its enforcement and thus prevent any damage compensation
payment. On 30 November 2016, Alstom’s subsidiary filed a motion in the Court of Appeals of Milan to obtain the
cancellation of the arbitral award. On 1 December 2016, Alstom’s subsidiary filed an ex parte motion for injunctive
relief to obtain the suspension of the arbitral award pending the outcome of the appeal proceedings, which was
temporarily accepted by the Court. After a phase of hearings in contradictory proceedings on the request for suspension
of the arbitral award, the Court of Appeal of Milan decided on 3 March 2017 in favor of Alstom’s subsidiary by
confirming definitively the suspension of this arbitration decision pending the outcome of the proceedings relating to
the cancellation of such decision. The Court of Appeal of Milan ruled on the merits in March 2019 in favour of the
Alstom’s subsidiary and cancelled the arbitration award of August 2016 including the €22 million of damage
compensation. The members of the consortium (excluding Alstom) appealed the decision of the Court of Appeal of
Milan on 19 October 2019. On 27 November 2019 Alstom filed its defense and counter-appeal. The parties are now
waiting for a decision on the admissibility of the recourse, to be given by the so-called “Filter Section” of the Court of
Cassation.
Sale of Alstom’s Energy Businesses in November 2015 Finally, it shall be noted that, by taking over Alstom’s Energy Businesses in November 2015, General Electric undertook
to assume all risks and liabilities exclusively or predominantly associated with said businesses and in a symmetrical
way, Alstom undertook to keep all risks and liabilities associated with the non-transferred business. Cross-
indemnification for a duration of 30 years and asset reallocation (“wrong pocket”) mechanisms have been established
to ensure that, on the one hand, assets and liabilities associated with the Energy businesses being sold are indeed

48
transferred to General Electric and on the other hand, assets and liabilities not associated with such businesses are
borne by Alstom. As a result, the consequences of litigation matters that were on-going at the time of the sale and
associated with these transferred activities are taken over by General Electric. Indemnity provisions protect Alstom in
case of third-party claims directed at Alstom and relating to the transferred activities. For this reason and since Alstom
no longer manages these litigation matters, Alstom is ceasing to include them in this section.
There are no other governmental, legal or arbitration procedures, including proceedings of which the Group is aware,
and which are pending or threatening, which might have, or have had during the last twelve months, a significant
impact on the financial situation or profitability of the Group.
K. OTHER NOTES
NOTE 24. RELATED PARTIES
There are no material changes in related-party transactions between 31 March 2020 and 30 September 2020.
NOTE 25. SUBSEQUENT EVENTS
The Group has not identified any subsequent event to be reported other than the items already described above or in
the previous notes.

49
NOTE 26. SCOPE OF CONSOLIDATION
PARENT COMPANY
ALSTOM SA France - Parent Company
Companies Country
Ownership
% Consolidation Method
ALSTOM Algérie "Société par Actions" Algeria 100 Full consolidation
ALSTOM Grid Algérie SPA Algeria 100 Full consolidation
ALSTOM Argentina S.A. Argentina 100 Full consolidation
ALSTOM Transport Australia Holdings Pty Limited Australia 100 Full consolidation
ALSTOM Transport Australia Pty Limited Australia 100 Full consolidation
NOMAD DIGITAL PTY LTD Australia 100 Full consolidation
ALSTOM Transport Azerbaijan LLC Azerbaijan 100 Full consolidation
ALSTOM Belgium SA Belgium 100 Full consolidation
CABLIANCE BELGIUM Belgium 100 Full consolidation
NOMAD DIGITAL BELGIUM Belgium 100 Full consolidation
ALSTOM Brasil Energia e Transporte Ltda Brazil 100 Full consolidation
ETE - EQUIPAMENTOS DE TRACAO ELETRICA LTDA Brazil 100 Full consolidation
ALSTOM Transport Canada Inc. Canada 100 Full consolidation
ALSTOM Chile S.A. Chile 100 Full consolidation
ALSTOM Hong Kong Ltd China 100 Full consolidation
ALSTOM Investment Company Limited China 100 Full consolidation
ALSTOM Qingdao Railway Equipment Co Ltd China 51 Full consolidation
SHANGHAI ALSTOM Transport Electrical Equipment Company Ltd China 60 Full consolidation
Chengdu ALSTOM Transport Electrical Equipment Co., Ltd. China 60 Full consolidation
TRANSLOHR INDUSTRIAL (TIANJIN) CO. LTD China 100 Full consolidation
XI'AN ALSTOM YONGJI ELECTRIC EQUIPMENT CO., LTD China 51 Full consolidation
ALSTOM Transport Danmark A/S Denmark 100 Full consolidation
NOMAD DIGITAL APS Denmark 100 Full consolidation
NOMAD DIGITAL (DENMARK) APS Denmark 100 Full consolidation
ALSTOM Egypt for Transport Projects SAE Egypt 99 Full consolidation
AREVA INTERNATIONAL EGYPT FOR ELECTRICITY TRANSMISSION &
DISTRIBUTION Egypt 100 Full consolidation
ALSTOM Transport Finland Oy Finland 100 Full consolidation
ALSTOM APTIS France 100 Full consolidation
ALSTOM Executive Management France 100 Full consolidation
ALSTOM Holdings France 100 Full consolidation
ALSTOM IBRE France 100 Full consolidation
ALSTOM Kleber Sixteen France 100 Full consolidation
ALSTOM Leroux Naval France 100 Full consolidation
ALSTOM Network Transport France 100 Full consolidation
ALSTOM Omega 1 France 100 Full consolidation
ALSTOM SHIPWORKS France 100 Full consolidation
ALSTOM Transport SA France 100 Full consolidation
ALSTOM Transport Technologies France 100 Full consolidation
CENTRE D'ESSAIS FERROVIAIRES France 95 Full consolidation
ETOILE KLEBER France 100 Full consolidation
INTERINFRA (COMPAGNIE INTERNATIONALE POUR LE
DEVELOPPEMENT D'INFRASTRUCTURES) France 50 Full consolidation
LORELEC France 100 Full consolidation
NEWTL France 100 Full consolidation
NOMAD DIGITAL France France 100 Full consolidation
NTL HOLDING France 100 Full consolidation
StationOne France 100 Full consolidation
ALSTOM Lokomotiven Service GmbH Germany 100 Full consolidation
ALSTOM Transport Deutschland GmbH Germany 100 Full consolidation
NOMAD DIGITAL GMBH Germany 100 Full consolidation
VGT VORBEREITUNGSGESELLSCHAFT TRANSPORTTECHNIK GMBH Germany 100 Full consolidation

50
Companies Country
Ownership
% Consolidation Method
ALSTOM Network UK Ltd Great Britain 100 Full consolidation
ALSTOM NL Service Provision Limited Great Britain 100 Full consolidation
ALSTOM Academy for rail Great Britain 100 Full consolidation
ALSTOM Product and Services Limited Great Britain 100 Full consolidation
ALSTOM Transport Service Ltd Great Britain 100 Full consolidation
ALSTOM Transport UK (Holdings) Ltd Great Britain 100 Full consolidation
ALSTOM Transport UK Limited Great Britain 100 Full consolidation
NOMAD DIGITAL (INDIA) LIMITED Great Britain 70 Full consolidation
NOMAD DIGITAL LIMITED Great Britain 100 Full consolidation
NOMAD HOLDINGS LIMITED Great Britain 100 Full consolidation
NOMAD SPECTRUM LIMITED Great Britain 100 Full consolidation
WASHWOOD HEATH TRAINS LTD Great Britain 100 Full consolidation
WEST COAST SERVICE PROVISION LIMITED Great Britain 100 Full consolidation
WEST COAST TRAINCARE LIMITED Great Britain 100 Full consolidation
21NET LTD Great Britain 100 Full consolidation
J&P AVAX SA - ETETH SA - ALSTOM TRANSPORT SA Greece 34 Full consolidation
ALSTOM Transport Hungary Zrt. Hungary 100 Full consolidation
ALSTOM Manufacturing India Private Limited India 100 Full consolidation
ALSTOM Systems India Private Limited India 95 Full consolidation
ALSTOM Transport India Limited India 100 Full consolidation
MADHEPURA ELECTRIC LOCOMOTIVE PRIVATE LIMITED India 74 Full consolidation
NOMAD DIGITAL (INDIA) PRIVATE LIMITED India 70 Full consolidation
TWENTY ONE NET (INDIA) PRIVATE LTD India 100 Full consolidation
PT ALSTOM Transport Indonesia Indonesia 67 Full consolidation
ALSTOM Khadamat S.A. Iran 100 Full consolidation
ALSTOM Transport Ireland Ltd Ireland 100 Full consolidation
CITADIS ISRAEL LTD Israel 100 Full consolidation
ALSTOM Ferroviaria S.p.A. Italy 100 Full consolidation
ALSTOM Services Italia S.p.A. Italy 100 Full consolidation
NOMAD DIGITAL ITALIA S.R.L. Italy 100 Full consolidation
ALSTOM Kazakhstan LLP Kazakhstan 100 Full consolidation
EKZ Service Limited Liability Partnership Kazakhstan 80 Full consolidation
ELECTROVOZ KURASTYRU ZAUYTY LLP Kazakhstan 80 Full consolidation
ALSTOM Transport (Malaysia) Sdn Bhd Malaysia 100 Full consolidation
ALSTOM Transport Mexico, S.A. de C.V. Mexico 100 Full consolidation
ALSTOM CABLIANCE Morocco 100 Full consolidation
ALSTOM Transport Maroc SA Morocco 100 Full consolidation
ALSTOM Transport B.V. Netherlands 100 Full consolidation
ALSTOM Transport Holdings B.V. Netherlands 100 Full consolidation
NOMAD DIGITAL B.V. Netherlands 100 Full consolidation
AT NIGERIA LIMITED Nigeria 100 Full consolidation
ALSTOM Enio ANS Norway 100 Full consolidation
ALSTOM Transport Norway AS Norway 100 Full consolidation
ALSTOM Panama, S.A. Panama 100 Full consolidation
ALSTOM Transport Peru S.A. Peru 100 Full consolidation
ALSTOM Transport Construction Philippines, Inc Philippines 100 Full consolidation
ALSTOM Konstal Spolka Akcyjna Poland 100 Full consolidation
ALSTOM Pyskowice Sp. z o.o. Poland 100 Full consolidation
ALSTOM Transporte Portugal Unipessoal Lda Portugal 100 Full consolidation
NOMAD TECH, LDA. Portugal 51 Full consolidation
ALSTOM Transport SA (Romania) Romania 93 Full consolidation
ALSTOM Transport Rus LLC Russian Federation 100 Full consolidation

51
Companies Country
Ownership
% Consolidation Method
ALSTOM Transport (S) Pte Ltd Singapore 100 Full consolidation
ALSTOM Southern Africa Holdings (Pty) Ltd South Africa 100 Full consolidation
ALSTOM Transport Holdings SA (Pty) Ltd South Africa 100 Full consolidation
ALSTOM Ubunye (Pty) Ltd South Africa 51 Full consolidation
GIBELA RAIL TRANSPORT CONSORTIUM (PTY) LTD South Africa 70 Full consolidation
ALSTOM Korea Transport Ltd South Korea 100 Full consolidation
ALSTOM Espana IB, S.L. Spain 100 Full consolidation
ALSTOM Transporte, S.A. Spain 100 Full consolidation
APLICACIONES TECNICAS INDUSTRIALES, S.A. Spain 100 Full consolidation
ALSTOM Transport AB Sweden 100 Full consolidation
ALSTOM Transport Information Systems AB Sweden 100 Full consolidation
ALSTOM Network Schweiz AG Switzerland 100 Full consolidation
ALSTOM Schienenfahrzeuge AG Switzerland 100 Full consolidation
ALSTOM Transport (Thailand) Co., Ltd. Thailand 100 Full consolidation
ALSTOM T&T Ltd
Trinidad and
Tobago 100 Full consolidation
ALSTOM Ulasim Anonim Sirketi Turkey 100 Full consolidation
ALSKAW LLC USA 100 Full consolidation
ALSTOM Transport Holding US Inc. USA 100 Full consolidation
ALSTOM Transportation Inc. USA 100 Full consolidation
ALSTOM Signaling Inc. USA 100 Full consolidation
ALSTOM Signaling Operation, LLC USA 100 Full consolidation
NOMAD DIGITAL, INC USA 100 Full consolidation
ALSTOM Venezuela, S.A. Venezuela 100 Full consolidation
ALSTOM Transport Vietnam Ltd Vietnam 100 Full consolidation
METROLAB France 50 Joint Operation
THE ATC JOINT VENTURE Great Britain 38 Joint Operation
IRVIA MANTENIMIENTO FERROVIARIO, S.A. Spain 51 Joint Operation
CITAL Algeria 49 Equity Method
TMH ARGENTINA SA(*) Argentina 14 Equity Method
CASCO SIGNAL LTD China 49 Equity Method
SHANGHAI ALSTOM Transport Company Limited China 40 Equity Method
TRANSMASHHOLDING LIMITED Cyprus 20 Equity Method
SILASIO TRADING LIMITED(*) Cyprus 20 Equity Method
TMH EGYPT FOR DEVELOPMENT S.A.E.(*) Egypt 20 Equity Method
SPEEDINNOV France 74 Equity Method
ABC ELECTRIFICATION LTD Great Britain 33 Equity Method
TRANSMASHHOLDING HUNGARY INVEST KFT.(*) Hungary 10 Equity Method
TRANSMASHHOLDING HUNGARY KFT(*) Hungary 10 Equity Method
LKZ AO(*) Kazakhstan 10 Equity Method
LLP JV KAZELEKTROPRIVOD Kazakhstan 50 Equity Method
SMART TECHNOLOGY ALMATY COM TOO(*) Kazakhstan 20 Equity Method
TRANSMASHHOLDING KAZAKHSTAN-KZ TOO(*) Kazakhstan 20 Equity Method
TMHS(*) Mongolia 20 Equity Method
MALOCO GIE Morocco 70 Equity Method
RAILCOMP BV Netherlands 60 Equity Method
THE BREAKERS INVESTMENTS B.V.(*) Netherlands 20 Equity Method
TMH-ALSTOM BV Netherlands 60 Equity Method
TMH DIESEL ENGINE BV(*) Netherlands 20 Equity Method
AM-TEKH(*) Russian Federation 20 Equity Method

52
Companies Country
Ownership
% Consolidation Method
CENTRAL RESEARCH AND DEVELOPMENT INSTITUTE
"TransElektroPribor"(*) Russian Federation 20 Equity Method
CORPORATE UNIVERSITY OF LOCOMOTIVE TECHNOLOGIES(*) Russian Federation 20 Equity Method
DEMIKHOVSKY MASHINOSTROITELNY ZAVOD OAO(*) Russian Federation 20 Equity Method
DIESEL-INSTRUMENT SPB LLC(*) Russian Federation 10 Equity Method
DIMICROS OAO(*) Russian Federation 9 Equity Method
DOL BRIGANTINA LLC(*) Russian Federation 15 Equity Method
ELTK-URAL LLC(*) Russian Federation 10 Equity Method
FIRM LOCOTECH(*) Russian Federation 20 Equity Method
IVSK OOO(*) Russian Federation 12 Equity Method
IZD TMH LLC(*) Russian Federation 17 Equity Method
KOLOMENSKY ZAVOD OAO(*) Russian Federation 17 Equity Method
KOLOMNA ENERGO DIESEL LLC(*) Russian Federation 17 Equity Method
LOCOTECH GLOBAL TRADING(*) Russian Federation 20 Equity Method
LOCOTECH-FOUNDRY PLANTS(*) Russian Federation 15 Equity Method
LOCOTECH-KOMPOSIT LLC(*) Russian Federation 8 Equity Method
LOCOTECH-LEASING(*) Russian Federation 15 Equity Method
LOCOTECH-PROMSERVICE(*) Russian Federation 20 Equity Method
LOCOTECH-SERVICE(*) Russian Federation 20 Equity Method
MASHCONSULTING ZAO(*) Russian Federation 20 Equity Method
METROVAGONMASH OAO(*) Russian Federation 15 Equity Method
METROVAGONMASH SERVICE LLC(*) Russian Federation 15 Equity Method
MONTAZHNAYA BAZA OAO(*) Russian Federation 2 Equity Method
NERZ LLC(*) Russian Federation 8 Equity Method
NO TIV ZAO(*) Russian Federation 18 Equity Method
NOVOCHERKASSKY ELEKTROVOZOSTROITELNY ZAVOD
PROIZVODSTVENNAY KOMPANIYA OOO(*) Russian Federation 20 Equity Method
NPO SYSTEMA LLC(*) Russian Federation 19 Equity Method
NPP LCL ZAO(*) Russian Federation 4 Equity Method
OKHOTRESURS LLC(*) Russian Federation 20 Equity Method
OKTYABRSKY ELEKTROVAGONOREMONTNY ZAVOD OAO(*) Russian Federation 15 Equity Method
OVK TMH ZAO(*) Russian Federation 20 Equity Method
PENZADIESELMASH OAO(*) Russian Federation 20 Equity Method
PENZENSKIYE DIESELNIYE DVIGATELY LLC(*) Russian Federation 20 Equity Method
PO BEZHITSKAYA STAL OAO(*) Russian Federation 12 Equity Method
PROFIL LLC(*) Russian Federation 13 Equity Method
PSOM AO(*) Russian Federation 15 Equity Method
RAILCOMP LLC Russian Federation 60 Equity Method
REKOLD AO(*) Russian Federation 6 Equity Method
ROSLOKOMOTIV ZAO(*) Russian Federation 20 Equity Method
SAPFIR OOO(*) Russian Federation 20 Equity Method
TMH ENGINEERING ASIA LLC(*) Russian Federation 10 Equity Method
TMH ENGINEERING LLC(*) Russian Federation 20 Equity Method
TMH FINANCE LLC(*) Russian Federation 20 Equity Method
TMH INTERNATIONAL LLC(*) Russian Federation 20 Equity Method
TMH INVESTMENTS LLC(*) Russian Federation 20 Equity Method
TMH TECHNOLOGIE LLC(*) Russian Federation 20 Equity Method
TMH TRACTION SYSTEMS LLC(*) Russian Federation 10 Equity Method
TMH-ELECTROTEKH LLC(*) Russian Federation 20 Equity Method
TMHS LOKALIZATSIYA LLC(*) Russian Federation 10 Equity Method
TORGOVY DOM TMH ZAO(*) Russian Federation 20 Equity Method
TRAMRUS LLC Russian Federation 60 Equity Method
TRANSCONVERTER LLC(*) Russian Federation 13 Equity Method
TRANSHOLDLEASING AO(*) Russian Federation 4 Equity Method

53
Companies Country
Ownership
% Consolidation Method
TRANSMASH OAO(*) Russian Federation 12 Equity Method
TRANSMASHHOLDING ZAO(*) Russian Federation 20 Equity Method
TRTrans LLC Russian Federation 60 Equity Method
TSENTR PERSPEKTIVNYKH TECHNOLOGIY TMH LLC(*) Russian Federation 20 Equity Method
TVER-SAFARI LLC(*) Russian Federation 19 Equity Method
TVERSKOY VAGONOSTROITELNY ZAVOD OAO(*) Russian Federation 19 Equity Method
UPRAVLYAUSCHAYA KOMPANIYA BRYANSKY
MASHINOSTROITELNY ZAVOD ZAO(*) Russian Federation 20 Equity Method
VOSKHOD LLC(*) Russian Federation 9 Equity Method
VSEROSSIYSKY NAUCHNO-ISSLEDOVATELSKY I PROEKTNO-
KONSTRUKTORSKY INSTITUT ELEKTROVOZOSTROENIYA OAO(*) Russian Federation 13 Equity Method
YUZHDIESELMASH OAO(*) Russian Federation 1 Equity Method
ZAVOD AIT(*) Russian Federation 10 Equity Method
ZENTROSVARMASH OAO(*) Russian Federation 20 Equity Method
ZHELDORREMMASH(*) Russian Federation 15 Equity Method
ZTOV LLC(*) Russian Federation 4 Equity Method
TMH AFRICA PLC(*) South Africa 14 Equity Method
TMH INTERNATIONAL AG(*) Switzerland 20 Equity Method
LUGANSKTEPLOVOZ OAO(*) Ukraine 15 Equity Method
TRANSMASH EAST TRAIN TRADING LLC(*)
United Arab
Emirates 20 Equity Method
RTA RAIL TEC ARSENAL FAHRZEUGVERSUCHSANLAGE GMBH Austria 15 Non-consolidated investment
MOBILIEGE Belgium 15 Non-consolidated investment
4iTEC 4.0 France 23 Non-consolidated investment
AIRE URBAINE INVESTISSEMENT France 4 Non-consolidated investment
CADEMCE SAS France 16 Non-consolidated investment
COMPAGNIE INTERNATIONALE DE MAINTENANCE - C.I.M. France 1 Non-consolidated investment
EASYMILE France 13 Non-consolidated investment
ESPACE DOMICILE SA HABITAT LOYER MODERE France 1 Non-consolidated investment
FRAMECA - FRANCE METRO CARACAS France 19 Non-consolidated investment
MOBILITE AGGLOMERATION REMOISE SAS France 17 Non-consolidated investment
OC'VIA CONSTRUCTION France 12 Non-consolidated investment
OC'VIA MAINTENANCE France 12 Non-consolidated investment
RESTAURINTER France 35 Non-consolidated investment
SOCIETE IMMOBILIERE DE VIERZON France 1 Non-consolidated investment
SUPERGRID INSTITUTE SAS France 3 Non-consolidated investment
IFB INSTITUT FUR BAHNTECHNIK GMBH Germany 7 Non-consolidated investment
TRAMLINK NOTTINGHAM (HOLDINGS) LTD Great Britain 13 Non-consolidated investment
PARS SWITCH Iran 1 Non-consolidated investment
CRIT SRL Italy 1 Non-consolidated investment
CONSORZIO ELIS PER LA FORMAZIONE PROFESSIONALE
SUPERIORE Italy 0 Non-consolidated investment
METRO 5 SPA Italy 9 Non-consolidated investment
T.P.B. TRASPORTI PUBBLICI DELLA BRIANZA S.p.A. (in bankruptcy) Italy 30 Non-consolidated investment
TRAM DI FIRENZE S.P.A. Italy 9 Non-consolidated investment
VAL 208 TORINO GEIE Italy 14 Non-consolidated investment
SUBURBANO EXPRESS, S.A. DE C.V. Mexico 11 Non-consolidated investment
IDEON S.A. Poland 0 Non-consolidated investment
INWESTSTAR S.A. Poland 0 Non-consolidated investment
KOLMEX SA Poland 2 Non-consolidated investment
ALBALI SEÑALIZACIÓN, S.A. Spain 12 Non-consolidated investment
TRAMVIA METROPOLITA DEL BESOS SA Spain 21 Non-consolidated investment
TRAMVIA METROPOLITA, S.A. Spain 24 Non-consolidated investment
(*) Subsidiaries of TMH Limited., consolidated within Alstom financial statements by equity method.

54
.
Report of independent auditors on the half-year financial information

55
PricewaterhouseCoopers Audit 63, rue de Villiers 92200 Neuilly-sur-Seine
MAZARS 61, rue Henri Regnault 92075 Paris La Défense
STATUTORY AUDITORS’ REVIEW REPORT ON THE INTERIM FINANCIAL INFORMATION
(Period from 1 April 2020 to 30 September 2020) This is a free translation into English of the Statutory Auditors’ review report issued in French and is provided solely for the convenience of English speaking readers. This report should be read in conjunction with, and construed in accordance with, French law and professional auditing standards applicable in France.
To the Shareholders, ALSTOM SA 48 rue Albert Dhalenne 93400 Saint-Ouen France In compliance with the assignment entrusted to us by your Shareholder’s Meeting and in accordance with the requirements of article L. 451-1-2 III of the French Monetary and Financial Code (Code monétaire et financier), we hereby report to you on:
- the review of the accompanying condensed interim consolidated financial statements of
Alstom SA, for the period from 1 April 2020 to 30 September 2020;
- the verification of the information contained in the interim management report. These condensed interim consolidated financial statements were prepared under the responsibility of the Board of Directors on November 10th, 2020, on the basis of the information available at that date in the evolving context of the crisis related to Covid-19 and of difficulties in assessing its impact and future prospects. Our role is to express a conclusion on these financial statements based on our review.
I. Conclusion on the financial statements
We conducted our review in accordance with professional standards applicable in France. A review of interim financial information consists of making inquiries, primarily of persons responsible for financial and accounting matters, and applying analytical and other review procedures. A review is substantially less in scope than an audit conducted in accordance with professional standards applicable in France and consequently does not enable us to obtain assurance that we would become aware of all significant matters that might be identified in an audit. Accordingly, we do not express an audit opinion. Based on our review, nothing has come to our attention that causes us to believe that the accompanying condensed interim consolidated financial statements are not prepared, in all material respects, in accordance with IAS 34 - the standard of IFRSs as adopted by the European Union applicable to interim financial information.

56
II. Specific verification
We have also verified the information given in the interim management report prepared on November 10th, 2020 on the condensed interim consolidated financial statements subject to our review. We have no matters to report as to its fair presentation and consistency with the condensed interim consolidated financial statements.
Neuilly-sur-Seine and Paris La Défense, November 10, 2020
The Statutory Auditors
French original signed by
PricewaterhouseCoopers Audit Edouard Demarcq
MAZARS
Jean-Luc Barlet

57
Responsibility statement of the person responsible for the half-year financial report

58
STATEMENT BY THE PERSON RESPONSIBLE FOR THE HALF-YEAR FINANCIAL REPORT*
I hereby certify that, to the best of my knowledge, the condensed consolidated financial statements of ALSTOM (the
“Company”) for the first half-year of fiscal year 2020/21 have been prepared under generally accepted accounting
principles and give a true and fair view of the assets, liabilities, financial position and profit and loss of the Company
and of all entities included in its scope of consolidation, and that the half-year management report included herein
presents a true and fair review of the main events which occurred in the first six months of the fiscal year and their
impact on the condensed accounts, as well as the main transactions between related parties and a description of
the main risks and uncertainties for the remaining six months of the fiscal year.
Saint-Ouen-sur-Seine, on 10 November 2020,
Original signed by
Henri Poupart-Lafarge
Chairman and Chief Executive Officer
* This is a free translation of the statement signed and issued in French language by the Chairman and Chief Executive Officer of
the Company and is provided solely for the convenience of English-speaking readers.