Embed Size (px)
Citation preview

Quarter ended 31 March 2013 Financial results & business update
23 April 2013

2
Any remarks that we may make about future expectations, plans and prospects for the company constitute forward-looking statements. Actual results may differ materially from those indicated by these forward-looking statements as a result of various factors.
In particular, the forward-looking financial information provided by the company in this conference call represent the company’s estimates as of 23 April 2013. We anticipate that subsequent events and developments will cause the company’s estimates to change.
However, while the company may elect to update this forward-looking financial information at some point in the future, the company specifically disclaims any obligation to do so. This forward-looking information should not be relied upon as representing the company’s estimates of its future financial performance as of any date subsequent to 23 April 2013.
Disclaimer

3
Business update David Arnott, CEO
Financial update Max Chuard, CFO
Summary David Arnott, CEO
Q&A
Agenda

4
Solid Q1 performance across all metrics
Multi-product strategy gaining momentum
Sustainably lower cost base underpinning margin expansion
Strong cash conversion
Acquisition of TriNovus to accelerate US growth and enter US SaaS market
Refinancing and bond issue completed to lock-in flexible, low cost, long term funding
Summary
Strategy validated – all KPIs performing well

5
LFL licence revenues up 5% - the second consecutive quarter of growth
Maintenance revenues remain resilient with LFL growth of 4%
Services revenues stable and margin improving as revenue mix shifts
Non-IFRS EBIT more than doubled with margin up 7 percentage points
LTM cash conversion of 111%
Q1 financial overview
Solid financial performance – on track to deliver full year guidance

6
Multi-product approach is working
• Strong and high quality pipeline across all products
• Gradual improvement in core banking
• Europe resilient with growth in the quarter, all other markets gaining traction
• Strong sales into the installed base
• Almost half of licence sales from tier 1 and 2 customers
• Significant deal with tier 1 PWM customer – validating product strategy
7 new customer wins in Q1 (Q1 2012: 7)
Services strategy delivering - 19 go-lives in Q1 (Q1 2012: 15)
Q1 sales and operational overview
Multi-product strategy gaining momentum

7
Competitive landscape
• Sole vendor at the top of both pyramids • 8th consecutive year as “Global Power Seller”
New-named clients All counted deals
Taking market share in a consolidating marketplace
• 1st position – 14th year in top 2 places • 34 deals – twice nearest competitor
Source: Forrester “Global Banking Platform deals 2012”, published April 2013 Source: International Banking Systems “Sales League Table 2013 (results Jan-Dec 2012)”, published March 2013

8
TriNovus signed 57 new clients in Q1 including State Bank & Trust, Intercontinental Bank and Sunwest Bank
Integration on track
• SaaS versions of Insight and AML going to market in Q2
• Early adopters for US SaaS version of T24 identified
Launching Social Comply to non-US customers at TCF
TriNovus to be included from Q2 – SaaS revenues separately disclosed (see appendix)
ADR started trading today (TMSNY)
Update on US
Momentum building in the US

9
Business update David Arnott, CEO
Financial update Max Chuard, CFO
2013 guidance David Arnott, CEO
Q&A
Agenda

10
Non-IFRS income statement - operating
A lower cost base coupled with recovering top line sees profits double
In USDm
Q1 13 Q1 12 Y-o-Y
LTM 13 LTM 12 Y-o-Y
Licences
24.5 23.5 4.3%
126.2 141.4 (10.8)%
Maintenance
51.0 48.5 5.1%
204.1 197.0 3.6%
Services
28.1 28.4 (0.8)%
123.2 132.2 (6.8)%
Total revenue
103.6 100.3 3.3%
453.5 470.7 (3.7)%
Operating costs
90.2 94.1 (4.2)%
360.8 381.7 (5.5)%
EBIT
13.5 6.3 114.7%
92.7 89.0 4.2%
Margin
13.0% 6.2% 6.7% pts
20.4% 18.9% 1.5% pts
EBITDA
21.6 14.8 46.6%
126.7 119.4 6.1%
Margin
20.9% 14.7% 6.2% pts
27.9% 25.4% 2.6% pts

11
0
30
60
90
120
Q1 2012 Q1 2013
USDm Maintenance Licence Services
+5%
+4%
(2)%
Like-for-like revenue and costs
Q1 like-for-like revenue up 2%
LFL revenue up 2% with costs down 5%
Q1 like-for-like non-IFRS costs down 5%
0
30
60
90
120
Q1 2012 Q1 2013
USDm
(5)%

12
Non-IFRS income statement – non-operating
In USDm, except EPS
Q1 13 Q1 12 Y-o-Y
LTM 13 LTM 12 Y-o-Y
EBIT
13.5 6.3 114.7%
92.7 89.0 4.2%
Net finance charge
(1.6) (2.0) 23.7%
(7.3) (8.9) 17.9%
FX loss
(0.6) (1.9) 67.6%
(2.2) (7.7) 71.3%
Tax
(2.5) (2.1) (8.9%)
(13.0) (14.2) 9.8%
Net profit
8.7 0.2 NA
70.1 58.1 21.0%
EPS (USD)
0.13 0.00 NA
1.01 0.83 21.7%
Well controlled financing and tax structure drive faster growth in EPS

13
Cash conversion
Strong cash conversion – on track to deliver full year commitments
0
30
60
90
120
LTM Q1 2011 LTM Q1 2012 LTM Q1 2013
USDm
EBITDA Operating cashflow
82% 216%
111%

14
Balance sheet – debt and financing
Low leverage provides flexibility to support strategic objectives
In USDm 31 March 13 Comment
Credit facilities
210.1 USD 350m facility and CHF 100m bond, due in 2017
Others
0.6
Total debt
210.7
Cash
(92.8) Held in short term deposits
Net debt
117.9 1.1x LTM EBITDA
Treasury shares
(58.2) Reflects market value as of 31 March 2013
Net debt and financing
59.7 0.6x LTM EBITDA
LTM EBITDA
108.0

15
Bank debt refinancing and bond issue in March 2013 to take advantage of favourable market conditions and lock in low cost, long term financing
CHF 100m senior unsecured bond – 2.75% coupon, matures July 2017
First ever public debt issuance
Oversubscribed - evidencing capital market confidence in Temenos
Starts trading on 25 April 2013
USD 350m banking facilities – mature in March 2017
USD 100m term loan and a revolving credit facility of USD 250m
Same five large financial institutions as the previous facilities
Interest rate of LIBOR plus 1.5% to 2.8% depending on level of leverage
Bond issue and refinancing
Low-cost, long-term & flexible financing in place to support strategy

16
Non-IFRS revenue growth of 4.5% to 7.5% (implying revenue of USD 469m to USD 482m)*
Licence growth of 5% to 10% (implying licence revenue of USD 131m to USD 137m)*
Non-IFRS cost base of USD 368m reaffirmed with non-IFRS EBIT margin of 21.7% to 23.2% (implying non-IFRS EBIT of USD 102m to USD 112m)*
100%+ conversion of EBITDA into operating cashflow
Tax rate of 17% to 18%
2013 guidance (post TriNovus acquisition)
2013 guidance reaffirmed
* Currency assumptions in Appendix See Appendix for definition of non-IFRS

17
Business update David Arnott, CEO
Financial update Max Chuard, CFO
Summary David Arnott, CEO
Q&A
Agenda

18
TCF 2013 - Abu Dhabi
14- 16 May 2013 • Great venue • Lots of new product launches • Separate Investor track • Eminent industry speakers • Meet senior management • Hear directly from our customers
Biggest and best attended to date

19
Solid Q1 performance across all metrics
Multi-product strategy gaining momentum
Sustainably lower cost base underpinning margin expansion
Strong cash conversion
Acquisition of TriNovus to accelerate US growth and enter US SaaS market
Refinancing and bond issue completed to lock-in flexible, low cost, long term funding
Summary
Strategy validated – all KPIs performing well

Appendices

21
New look non-IFRS income statement from Q2 2013
In USDm
Comments for FY 2013
Licence revenues
Expected growth of 5% to 10%
SaaS revenues Expected to be c.USD 5.5m
Total software licensing
Maintenance
Services
Total revenue
Expected growth of 4.5% to 7.5%
Operating costs
Expected to be USD 368m
EBIT
Expected to be USD 102m to USD 112m
EBIT margin Expected to be 21.7% to 23.2%

22
FX assumptions underlying 2013 guidance
In preparing the 2013 guidance, the Company has taken the actual Q1 2013 results and for the remainder of 2013 assumed the following (with comparisons at announcement of Q4 and FY 2012 results):
• USD to Euro exchange rate of 0.780 (from 0.778);
• USD to GBP exchange rate of 0.658 (from 0.631); and
• USD to CHF exchange rate of 0.950 (from 0.938).

23
Net earnings reconciliation
In USDm, except EPS
Q1 13 Q1 12
IFRS net earnings
3.7 (11.4)
Acquisition related charges 0.3 5.0
Amortisation of acquired intangibles
2.6 3.4
Restructuring
2.3 3.2
Taxation (0.2) -
Net earnings for non-IFRS EPS
8.7 0.2
No. of dilutive shares
70.0 69.6
Non-IFRS EPS (USD)
0.13 0.00

24
Licence revenue breakdown by geography
16%
40%
30%
14% APAC
Europe
Americas
MEA
21%
40%
13%
26%
APAC
Europe
Americas
MEA
29%
38%
11%
22%
APAC
Europe
Americas
MEA
26%
40%
12%
22%
APAC
Europe
Americas
MEA
LTM Q1 2012
Q1 2012 Q1 2013
LTM Q1 2013

25
Licence revenue breakdown by customer tier
33%
67%
1 and 2
3, 4 and 5 43%
57%
1 and 2
3, 4 and 5
28%
72%
1 and 2
3, 4 and 537%
63%
1 and 2
3, 4 and 5
LTM Q1 2012
Q1 2012 Q1 2013
LTM Q1 2013

26
Licence revenue breakdown by new / existing customer
47%
53%
New
Existing
33%
67%
New
Existing
46%
54%
New
Existing37%
63%
New
Existing
LTM Q1 2012
Q1 2012 Q1 2013
LTM Q1 2013
27
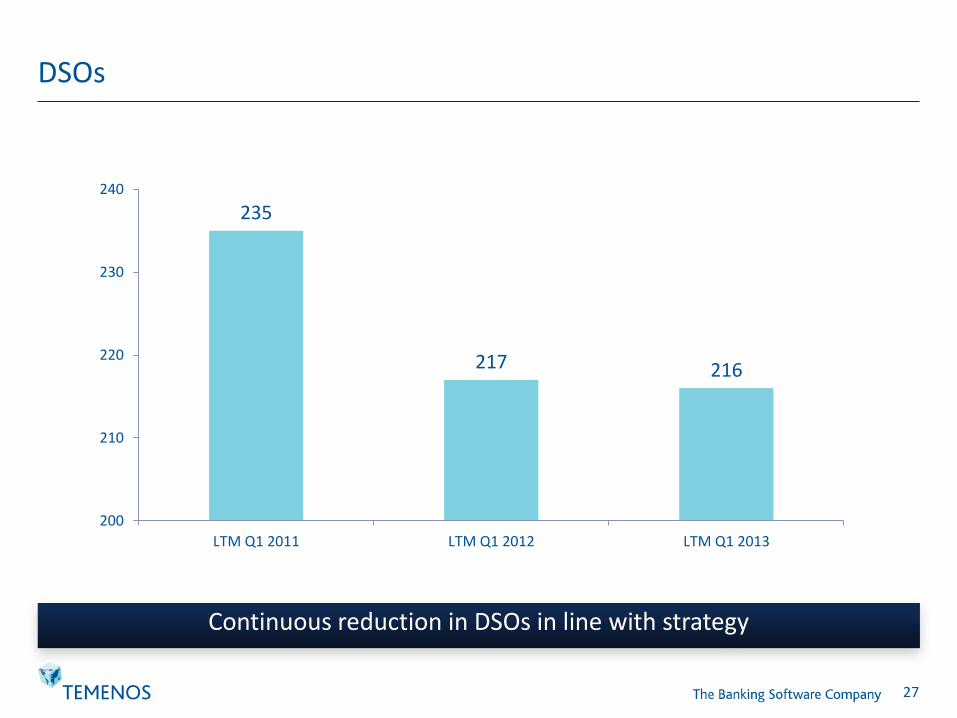
DSOs
235
217 216
200
210
220
230
240
LTM Q1 2011 LTM Q1 2012 LTM Q1 2013
Continuous reduction in DSOs in line with strategy

28
ADR
For further information about our program or ADRs in general
• please call BNY Mellon on +1 212 815 2293 or
• visit the ADR website of BNY Mellon at www.bnymellon.com/dr
ADR commenced trading today
Details of ADR
Type of ADR program Sponsored Level I ADR Program
Ratio 1 ADR = 1 ordinary share
US CUSIP 87974R208
Stock Symbol TMSNY
Depositary bank BNY Mellon
Swiss custodian bank UBS

29
Definition of Non-IFRS adjustments
Deferred revenue write-down Adjustments made resulting from acquisitions Discontinued activities Discontinued operations at Temenos that do not qualify as such under IFRS Acquisition related charges Relates mainly to advisory fees and integration costs Amortisation of acquired intangibles Amortisation charges as a result of acquired intangible assets Restructuring Costs incurred in connection with a restructuring plan implemented and controlled by management Severance charges, for example, would only qualify under this expense category if incurred as part of a company-wide restructuring plan Taxation Adjustments made to reflect the associated tax charge relating to the above items

30
Reconciliation from IFRS to non-IFRS
IFRS revenue measure
+ Deferred revenue write-down
= Non-IFRS revenue measure
IFRS profit measure
+ / - Discontinued activities
+ / - Acquisition related charges
+ / - Amortisation of acquired intangibles
+/- Restructuring
+ / - Taxation
= Non-IFRS profit measure

31
Reconciliation from IFRS EBIT to non-IFRS EBIT
USDm Q1 2013
IFRS EBIT 8.2
Deferred revenue write-down -
Discontinued activities -
Acquisition-related charges 0.3
Amortisation of acquired intangibles 2.6
Restructuring 2.3
Non-IFRS EBIT 13.5

Thank you www.temenos.com


![Results Update Presentation [Company Update]](https://img.pdfslide.net/doc/110x75/577ca7a11a28abea748c7c9d/results-update-presentation-company-update.jpg)