Embed Size (px)
Citation preview

Sakura Sogo REIT Presentation Material for the 1st Fiscal Period (Ended February 2017)
Financial Results for the 1st Fiscal Period (“FP1”)
Sakura Sogo REIT Investment Corporation (Securities code: 3473)
Fiscal Period ended 28 February 2017
Sakura Sogo REIT Presentation Material for the 1st Fiscal Period (Ended February 2017) 2
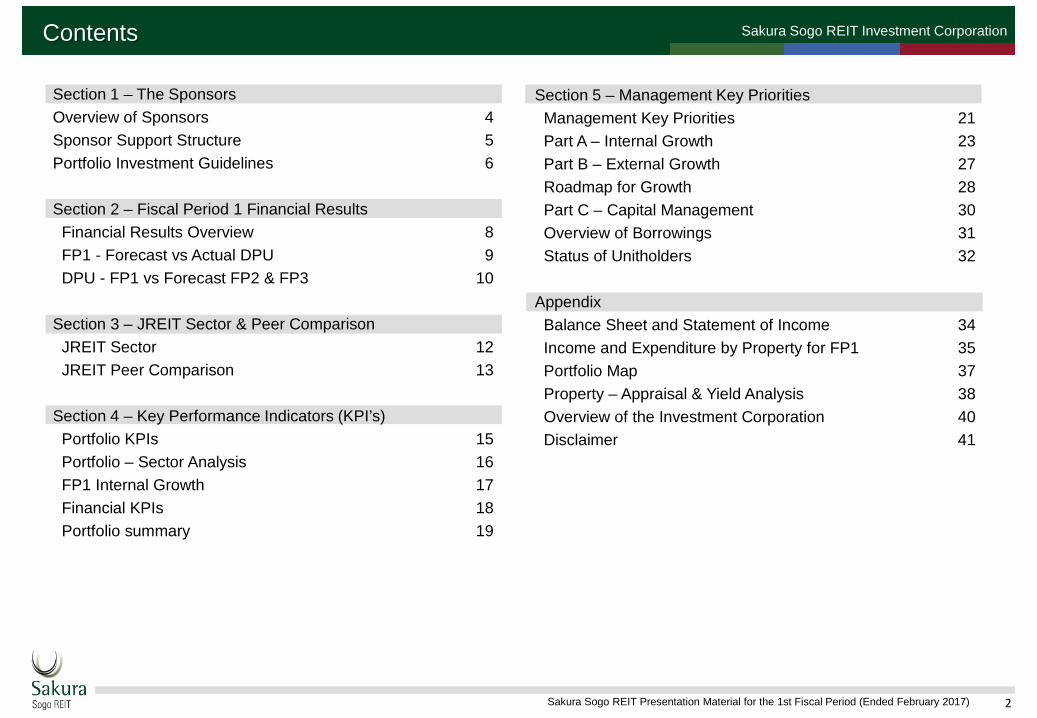
Sakura Sogo REIT Investment CorporationContents
Section 1 – The SponsorsOverview of Sponsors 4Sponsor Support Structure 5Portfolio Investment Guidelines 6
Section 2 – Fiscal Period 1 Financial ResultsFinancial Results Overview 8FP1 - Forecast vs Actual DPU 9DPU - FP1 vs Forecast FP2 & FP3 10
Section 3 – JREIT Sector & Peer ComparisonJREIT Sector 12JREIT Peer Comparison 13
Section 4 – Key Performance Indicators (KPI’s)Portfolio KPIs 15Portfolio – Sector Analysis 16FP1 Internal Growth 17Financial KPIs 18Portfolio summary 19
Section 5 – Management Key PrioritiesManagement Key Priorities 21Part A – Internal Growth 23Part B – External Growth 27Roadmap for Growth 28Part C – Capital Management 30Overview of Borrowings 31Status of Unitholders 32
AppendixBalance Sheet and Statement of Income 34Income and Expenditure by Property for FP1 35Portfolio Map 37Property – Appraisal & Yield Analysis 38Overview of the Investment Corporation 40Disclaimer 41

Sakura Sogo REIT Investment Corporation
3Sakura Sogo REIT Presentation Material for the 1st Fiscal Period (Ended February 2017)
Section 1 – The Sponsors

Sakura Sogo REIT Presentation Material for the 1st Fiscal Period (Ended February 2017) 4
Sakura Sogo REIT Investment Corporation
Development (Australia)
32.2%
Acquisition (U.S./Japan)
67.8%
Office9.4%
Retail84.2%
Residential3.1%
Other3.3% Retail
6.0%
Residential88.4%
Land lots5.6%
339.5 ¥bn
500.6 ¥bn
161.2 ¥bn
Overview of Sponsors
The Galileo Group is an independent Australian real estate and fund management business with an extensive track record in real estate investment and developments in Australia, Japan and the U.S. The Group has significant real estate capital markets experience with senior personnel having been directly involved in the IPO and ongoing management of listed REITs for over 20 years. The Group commenced operations in Japan in 2006.
Source: Galileo Group - Cumulative figures from 2003 to September 30, 2016
Track Record of Galileo Group
Established an Australian listed REIT (investment
target: U.S. shopping centres)
Established an Australian listed REIT (investment
target: Japanese diversified portfolio)
Established a REIT listed on Tokyo Stock Exchange
(investment target: Japanese diversified portfolio)
2003 2006 2016
■ Acquisitions by Asset Type (U.S./Japan)
■ Galileo Group’s Acquisitions and Developments (Global)
■ Development by Asset Type (Australia)
The Nippon Kanzai Group, established in 1965, is headed by Nippon Kanzai Co. Ltd., one of the major companies involved in building management and operation in Japan offering a full-line of real estate management services. It is entrusted with the building management and operation of a variety of buildings including office buildings, condominiums and retail facilities in major cities across Japan and through its business operations, it has acquired extensive know-how in the building management and operation of buildings of various sizes, purpose of use and location.
▪ Provision of a Full-Line of Real Estate Management ServicesIts core business is building maintenance, however other related services include facilities management, cleaning, security and property management.
▪ High Level of Management Nippon Kanzai Group is able to achieve industry best practice in terms of building maintenance and management by developing and leveraging its own original technology and databases described below.
Wide-Area Facility Management System
WAFMTM
A network based system which enables even buildings located at distant sites to be monitored remotely 24 hours
a day, 365 days a year.
LEAD-Web System
A portal site system which enables management information of multiple
buildings to be shared with building owners and centrally
managed.
Building Health Record
Nippon Kanzai Group's internal database consolidating the
accumulated data on buildings under its
management.
Characteristics of Nippon Kanzai Group
Nippon Kanzai Co., Ltd.

Sakura Sogo REIT Presentation Material for the 1st Fiscal Period (Ended February 2017) 5
Sakura Sogo REIT Investment CorporationSponsor Support Structure
Sakura Real Estate Funds Management, Inc. (“the Asset Management Company”) receives extensive support for external and internal growth based on the Sponsor Support Agreement executed with Nippon Kanzai and Galileo Group1
1 "Nippon Kanzai Group’s core companies" means Nippon Kanzai and Tokyo Capital Management2 "Sponsors" means Nippon Kanzai,Tokyo Capital Management and Galileo which have executed a Sponsor Support Agreement
Both sponsors2 acquired investment units of the Investment Corporation at the time of IPO in order to align their interests with those of the unitholders’. As a result, each owns 2.6% of investment units issued and outstanding (5.2% in total by both sponsors)
Support Provided
External Growth Support
Provision of sales information on properties held and granting of first refusal rightsProvision of information on external propertiesProvision of warehousing functionsGathering of information on the real estate transaction market and provision of results of analysesExamining joint ownership of propertiesProvision of advice on investment strategies and global offerings
Internal Growth SupportProvision of advice on the management and operation of propertiesSupport and cooperation with sourcing, redevelopment and renovationsDispatching seconded staff and other human resource support
Same Boat Investment by the Nippon Kanzai Group and Galileo Group
Leverage off of the complementary skill sets of Nippon Kanzai and Galileo Group
Investment in the Investment Corporation by Galileo Group
Investment in the Investment Corporation by Nippon Kanzai Group
Nippon Kanzai Co., Ltd.

Sakura Sogo REIT Presentation Material for the 1st Fiscal Period (Ended February 2017) 6
Sakura Sogo REIT Investment Corporation
Investment Ratio by Asset Type Characteristics of Asset Type
Office30~60%
During economic expansion, up-side potential can be capitalized on By targeting B-grade office buildings for investment, it is possible to pursue a large
number of investment opportunities that offer relatively high liquidity and tenant diversity
Residential10~30%
Rental demand and rent rates are relatively stable irrespective of economic changes and tenants are diversified making residential housing suitable as a medium to long-term stable investment
Retail30~60%
Areas with stable population, expected to support ongoing retail sales that result in secure rental income
A long-term stable cash flow possible via lease agreements with a tenure of at least three years or more which do not allow for early termination
Other0~20%
The potential and value of each individual property will be identified and the goal will be to conduct flexible property acquisition and investment
Investment Ratio by Asset Type1
Portfolio Investment Guidelines
Flexible investments possible with respect to asset type and location enabling the Asset Management Company to enhance unitholder value Able to reduce portfolio concentration risks by aiming to diversify the portfolio by sector, location, tenant and lease type Ongoing review of real estate market trends to identify potential new, and optimize existing revenue streams Pursue opportunities to actively recycle capital to enhance unitholder returns
1 The ratios above are target ratios over the medium to long-term
Tokyo Metropolitan AreaApprox. 50%
Regional Major CitiesApprox. 40%
OtherApprox.
10%
Investment Ratio by Location1
Stability
Growth
Overview

Sakura Sogo REIT Investment Corporation
7Sakura Sogo REIT Presentation Material for the 1st Fiscal Period (Ended February 2017)
Section 2 – Fiscal Period 1 Financial Results
Sakura Sogo REIT Presentation Material for the 1st Fiscal Period (Ended February 2017) 8
Sakura Sogo REIT Investment CorporationFinancial Results Overview
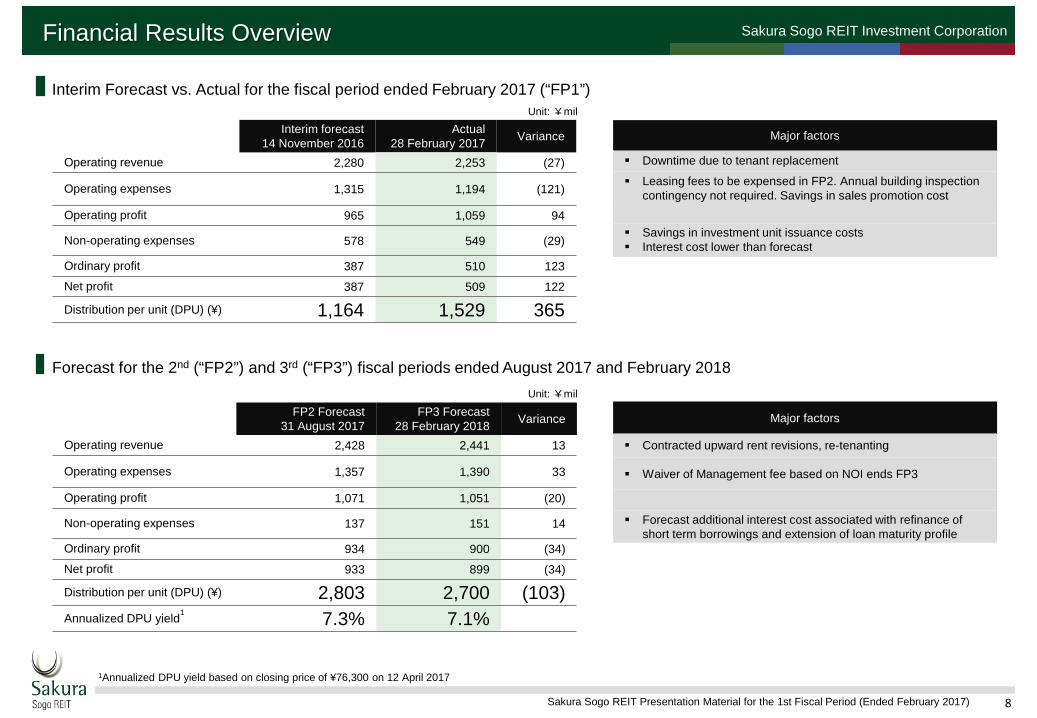
Interim forecast 14 November 2016
Actual28 February 2017 Variance
Operating revenue 2,280 2,253 (27)
Operating expenses 1,315 1,194 (121)
Operating profit 965 1,059 94
Non-operating expenses 578 549 (29)
Ordinary profit 387 510 123
Net profit 387 509 122
Distribution per unit (DPU) (¥) 1,164 1,529 365
Unit: ¥mil
Unit: ¥mil
Forecast for the 2nd (“FP2”) and 3rd (“FP3”) fiscal periods ended August 2017 and February 2018
Interim Forecast vs. Actual for the fiscal period ended February 2017 (“FP1”)
1Annualized DPU yield based on closing price of ¥76,300 on 12 April 2017
Major factors
Downtime due to tenant replacement
Leasing fees to be expensed in FP2. Annual building inspection contingency not required. Savings in sales promotion cost
Savings in investment unit issuance costs Interest cost lower than forecast
FP2 Forecast31 August 2017
FP3 Forecast28 February 2018 Variance
Operating revenue 2,428 2,441 13
Operating expenses 1,357 1,390 33
Operating profit 1,071 1,051 (20)
Non-operating expenses 137 151 14
Ordinary profit 934 900 (34)
Net profit 933 899 (34)
Distribution per unit (DPU) (¥) 2,803 2,700 (103)Annualized DPU yield1 7.3% 7.1%
Major factors
Contracted upward rent revisions, re-tenanting
Waiver of Management fee based on NOI ends FP3
Forecast additional interest cost associated with refinance of short term borrowings and extension of loan maturity profile
Sakura Sogo REIT Presentation Material for the 1st Fiscal Period (Ended February 2017) 9
Sakura Sogo REIT Investment Corporation
0
250
500
750
1,000
1,250
1,500
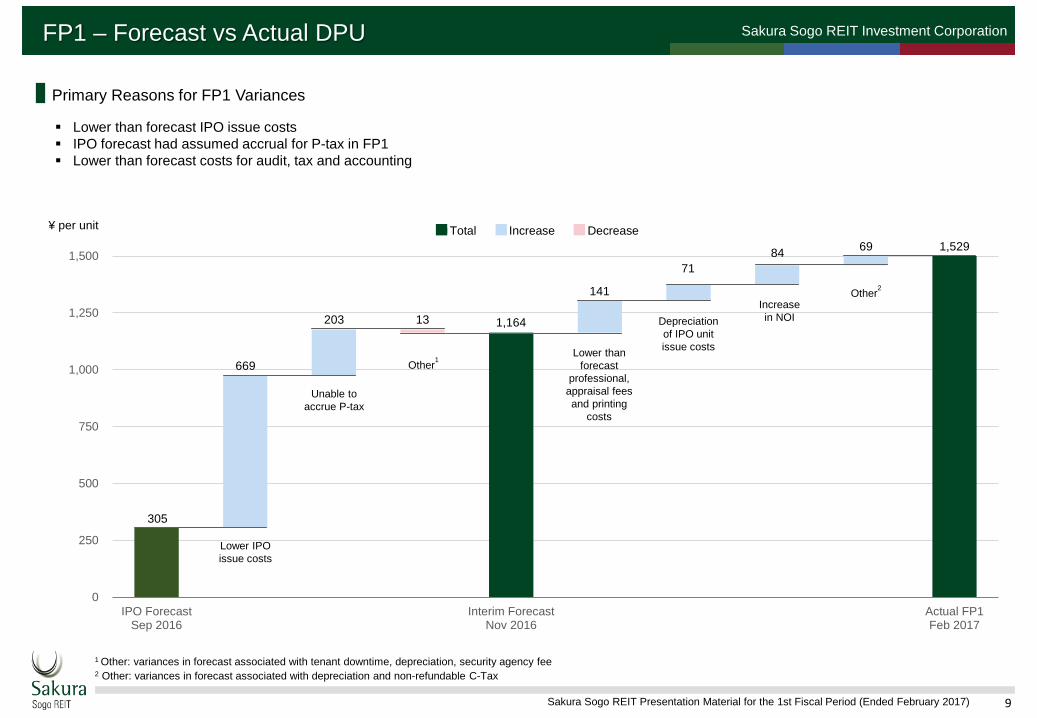
IPO ForecastSep 2016
Interim ForecastNov 2016
Actual FP1Feb 2017
Total Increase Decrease
FP1 – Forecast vs Actual DPU
Lower IPO issue costs
Unable to accrue P-tax
Depreciation of IPO unit issue costs
Increase in NOI
¥ per unit
2 Other: variances in forecast associated with depreciation and non-refundable C-Tax1 Other: variances in forecast associated with tenant downtime, depreciation, security agency fee
Lower than forecast
professional, appraisal fees and printing
costs
Primary Reasons for FP1 Variances
Lower than forecast IPO issue costs IPO forecast had assumed accrual for P-tax in FP1 Lower than forecast costs for audit, tax and accounting
Other1
Other2
305
669
203 13 1,164
141
84 69 1,529
71
Sakura Sogo REIT Presentation Material for the 1st Fiscal Period (Ended February 2017) 10
Sakura Sogo REIT Investment CorporationDPU - FP1 Actual vs Forecast for FP2 & FP3
0
500
1,000
1,500
2,000
2,500
3,000
3,500
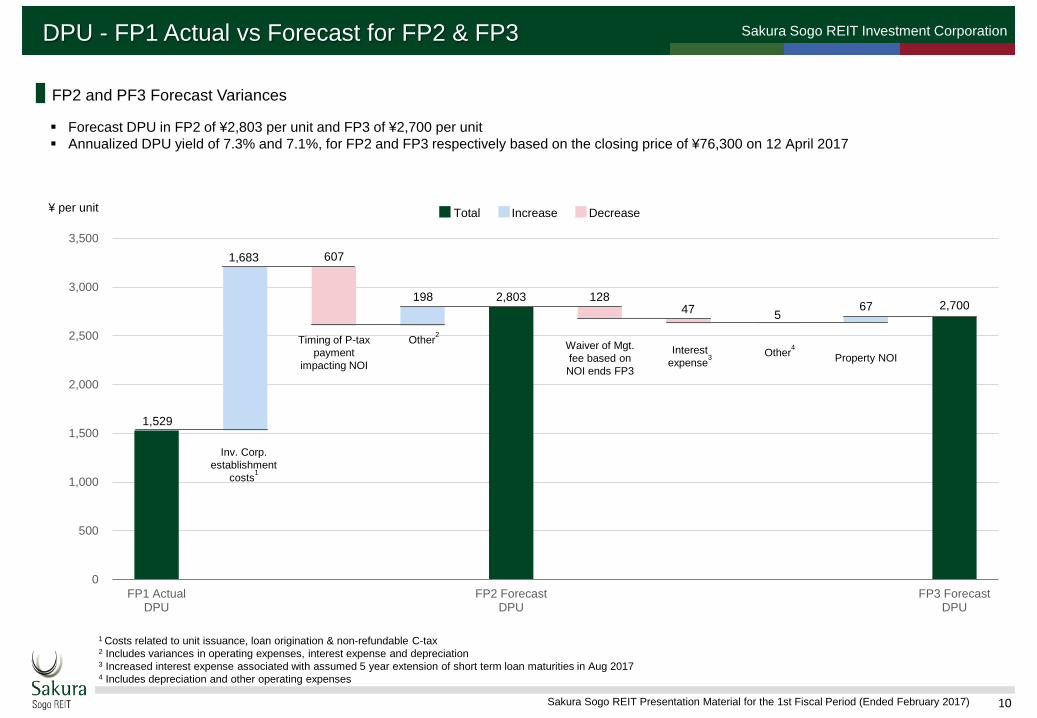
FP1 ActualDPU
FP2 ForecastDPU
FP3 ForecastDPU
Total Increase Decrease¥ per unit
FP2 and PF3 Forecast Variances
Forecast DPU in FP2 of ¥2,803 per unit and FP3 of ¥2,700 per unit Annualized DPU yield of 7.3% and 7.1%, for FP2 and FP3 respectively based on the closing price of ¥76,300 on 12 April 2017
1 Costs related to unit issuance, loan origination & non-refundable C-tax2 Includes variances in operating expenses, interest expense and depreciation3 Increased interest expense associated with assumed 5 year extension of short term loan maturities in Aug 20174 Includes depreciation and other operating expenses
Other2
Inv. Corp.establishment
costs1
Timing of P-tax payment
impacting NOIInterest
expense3Waiver of Mgt.fee based on NOI ends FP3
Property NOIOther4
1,529
1,683 607
198 2,803 1285
67 2,70047

Sakura Sogo REIT Investment Corporation
11Sakura Sogo REIT Presentation Material for the 1st Fiscal Period (Ended February 2017)
Section 3 – JREIT Sector & Peer Comparison

Sakura Sogo REIT Presentation Material for the 1st Fiscal Period (Ended February 2017) 12
Sakura Sogo REIT Investment Corporation
IPO PO IPO+PO J-REIT Total
Market Cap
(USDm)Volume Value
(USDm) Volume Value(USDm) Volume Value
(USDm)
2012 4 2,462 11 1,931 15 4,393 39,9402013 6 4,004 37 6,615 43 10,619 67,3842014 6 2,103 30 5,137 36 7,240 93,6142015 5 1,063 35 6,210 40 7,247 93,4542016 7 2,712 30 4,849 37 7,560 107,2862017 1 400 10 1,477 11 1,877 106,791
JREIT Sector
1 Source: Nomura Securities Co. Ltd. / SMBC Nikko Securities Inc.2 Source: Nomura Securities Co. Ltd.
JREIT Sector
Total market capitalization has increased 167% or ¥7.6 trillion since December 2012 and now exceeds ¥12 trillion 58 JREIT’s with 7 new entrants in the past 12 months, the sector continues to benefit from strong investor support Although the TSE REIT Index is at a similar level vs June 2016, the DPU yield gap of larger vs smaller REIT’s has widened significantly
Note: As of 28 Feb 2017 (1 USD=¥113)
0
10
20
30
40
50
60
0.0
2.0
4.0
6.0
8.0
10.0
12.0
14.0
01/09 03/09 05/09 07/09 09/09 11/09 13/09 15/09
Market Cap. (LHS)No .of Listed REITs (RHS)
(¥ Trillion)
Number of Listed J-REITs and Market Capitalisation1
Number of Listed J-REITs and Market Capitalisation1 JREIT DPU Yields – Significant gap between small and large cap REITs1
1.0%
2.0%
3.0%
4.0%
5.0%
6.0%
7.0%
8.0%
9.0%
0 200 400 600 800 1,000Market Cap: ¥ bn
JREIT DPU Yields – Spread with JGBs still attractive2
-2.0
0.0
2.0
4.0
6.0
8.0
10.0
12.0
01/09 03/09 05/09 07/09 09/09 11/09 13/09 15/09
REIT Distribution Yield(Weighted Average)JGB Yield(10years)Spread(REIT-JGB)
(%)

Sakura Sogo REIT Presentation Material for the 1st Fiscal Period (Ended February 2017) 13
Sakura Sogo REIT Investment CorporationJREIT Peer Comparison
7.3
4.6
6.0
0.0%
2.0%
4.0%
6.0%
8.0%
SKR DiversifiedREITS
Small CapREITs
Annualised DPU Yield3
JREIT Peer Comparison1
5.6
4.45.3
0.0%
2.0%
4.0%
6.0%
SKR DiversifiedREITS
Small CapREITs
0.82
1.10
0.86
0.00%
0.30%
0.60%
0.90%
1.20%
SKR DiversifiedREITS
Small CapREITs
39.636.4
16.6
0.0%
10.0%
20.0%
30.0%
40.0%
50.0%
SKR DiversifiedREITS
Small CapREITs
1 Source: SMBC Nikko Securities Inc.2 Small Cap REITs defined as those with market capitalization less than ¥100 billion 3 Annualized DPU for SKR based on FP2 DPU and closing price of ¥76,300 on 12 April 2017. JREIT peers average DPU as at 30 March 2017.
Sakura Sogo REIT (“SKR”) DPU yield 270 basis points (“bps”) higher than Diversified REITs and 130 bps higher than Small Cap REITs2
Based on current trading price SKR’s implied NOI cap rate is 5.6%, 120 bps higher than Diversified REITs SKR has a greater proportion of its portfolio (by value) located in Tokyo’s central five wards relative to:
- The average for Diversified REITs- The average for Small Cap REITs
Price / Net Asset Value
Implied Capitalisation Rate % of Portfolio located in Tokyo Central Five Wards

Sakura Sogo REIT Investment Corporation
14Sakura Sogo REIT Presentation Material for the 1st Fiscal Period (Ended February 2017)
Section 4 - Key Performance Indicators
Sakura Sogo REIT Presentation Material for the 1st Fiscal Period (Ended February 2017) 15
Sakura Sogo REIT Investment Corporation
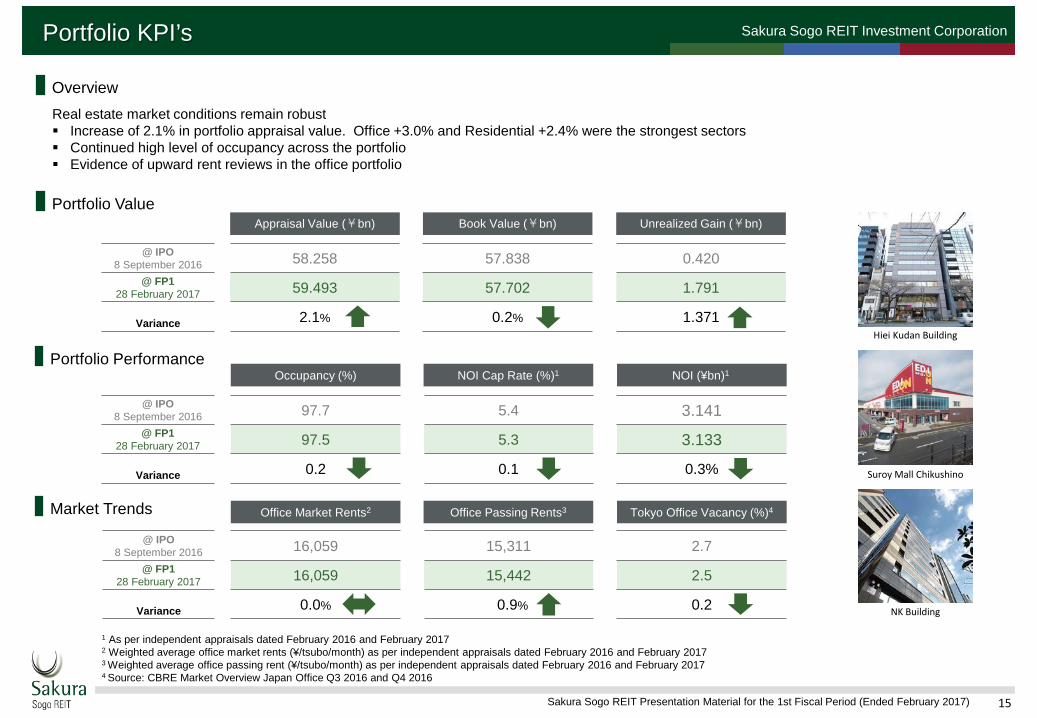
Real estate market conditions remain robust Increase of 2.1% in portfolio appraisal value. Office +3.0% and Residential +2.4% were the strongest sectors Continued high level of occupancy across the portfolio Evidence of upward rent reviews in the office portfolio
Portfolio KPI’s
Overview
Book Value (¥bn)Appraisal Value (¥bn)
NOI (¥bn)1 NOI Cap Rate (%)1
Office Market Rents2
Occupancy (%)
Tokyo Office Vacancy (%)4Office Passing Rents3
57.838
57.702
0.2%
58.258
59.493
2.1%
16,059
16,059
0.0%
15,311
15,442
0.9%
3.141
3.133
0.3%
5.4
5.3
0.1
97.7
97.5
0.2
2.7
2.5
0.2
1 As per independent appraisals dated February 2016 and February 20172 Weighted average office market rents (¥/tsubo/month) as per independent appraisals dated February 2016 and February 2017 3 Weighted average office passing rent (¥/tsubo/month) as per independent appraisals dated February 2016 and February 20174 Source: CBRE Market Overview Japan Office Q3 2016 and Q4 2016
Unrealized Gain (¥bn)
0.420
1.791
1.371
@ IPO8 September 2016
@ FP128 February 2017
Variance Hiei Kudan Building
Suroy Mall Chikushino
NK Building
@ IPO8 September 2016
@ FP128 February 2017
Variance
@ IPO8 September 2016
@ FP128 February 2017
Variance
Portfolio Value
Portfolio Performance
Market Trends
Sakura Sogo REIT Presentation Material for the 1st Fiscal Period (Ended February 2017) 16
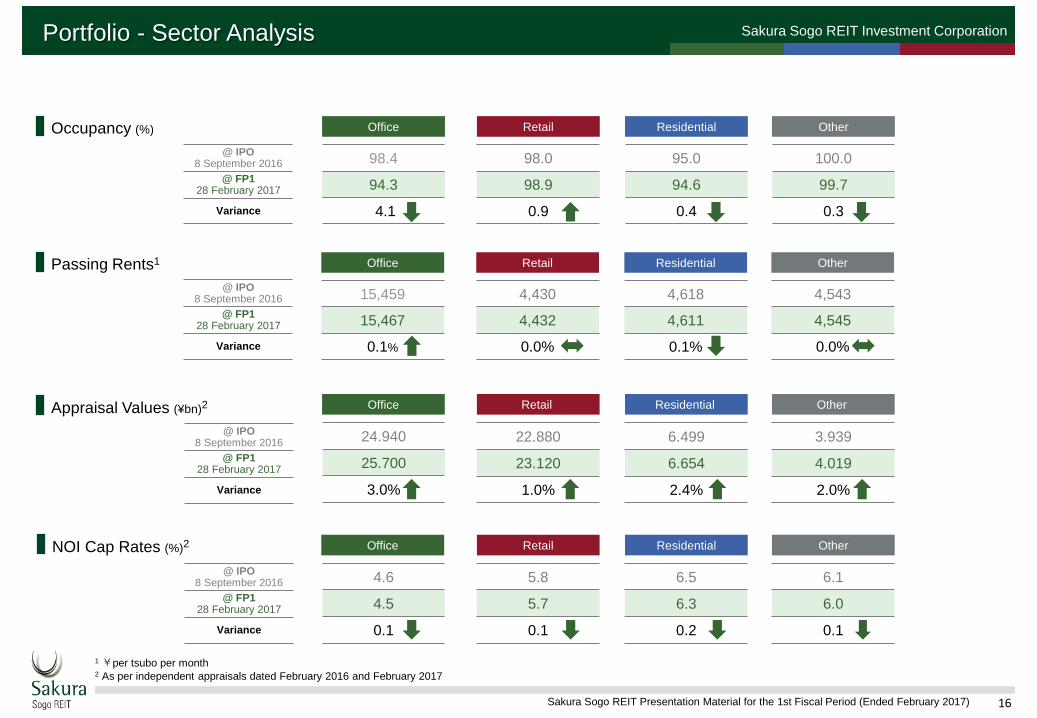
Sakura Sogo REIT Investment CorporationPortfolio - Sector Analysis
1 ¥per tsubo per month2 As per independent appraisals dated February 2016 and February 2017
Office
Retail Office
Retail Office
15,459
15,467
0.1%
4.6
4.5
0.1
22.880
23.120
1.0%
24.940
25.700
3.0%
5.8
5.7
0.1
Retail
4,430
4,432
0.0%
Passing Rents1
Appraisal Values (¥bn)2
NOI Cap Rates (%)2
Office
98.4
94.3
4.1
Retail
98.0
98.9
0.9
@ IPO8 September 2016
@ FP128 February 2017
Variance
Occupancy (%)
Residential
Residential
6.499
6.654
2.4%
6.5
6.3
0.2
Residential
4,618
4,611
0.1%
Residential
95.0
94.6
0.4
Other
Other
3.939
4.019
2.0%
6.1
6.0
0.1
Other
4,543
4,545
0.0%
Other
100.0
99.7
0.3
@ IPO8 September 2016
@ FP128 February 2017
Variance
@ IPO8 September 2016
@ FP128 February 2017
Variance
@ IPO8 September 2016
@ FP128 February 2017
Variance

Sakura Sogo REIT Presentation Material for the 1st Fiscal Period (Ended February 2017) 17
Sakura Sogo REIT Investment CorporationFP1 Internal Growth
Office Rent Reviews
Number of rent increases 7
Number of leases renewed 17
Number of rent reviews 7
% of office portfolio reviewed 5.9
Average rent increase (%) 11.6
Before
After
Strategic Capital Expenditure
Shin Yokohama Nara Building
LED lighting installed in the 1F lobby Occupancy prior to works 87.0%, current occupancy 100.0% Electricity costs down approximately 3.0%
Hiei Kudan BuildingSeishin Building Azabu Amerex Building
Shin Yokohama Nara Building

Sakura Sogo REIT Presentation Material for the 1st Fiscal Period (Ended February 2017) 18
Sakura Sogo REIT Investment CorporationFinancial KPI’s
Overview
LTV (%)
Total Assets (¥bn)
Annualized DPU yield (%)
NAV (¥per unit) Net Equity (¥bn)
Unit Price (¥ per unit) P/NAV
Total Liabilities (¥bn)
48.9
48.0
0.9
63.19
64.39
1.9%
29.25
29.25
0.0%
33.93
34.63
2.1%
6.32
7.33
1.0
89,113
93,229
4.6%
79,2001
76,300
3.7%
0.89
0.82
7.9%
Ave. loan maturity (years)
2.79
2.32
0.47Shin Yokohama Nara
Royal Hill Sannomiya
Confomall Sapporo
@ IPO8 September 2016
@ FP128 February 2017
Variance
@ IPO8 September 2016
@ FP128 February 2017
Variance
@ IPO8 September 2016
12 April 2017
Variance
1 Closing price on the first day trading on TSE2 Stabilized DPU yield based on IPO issue price of ¥91,000 and FP2 Forecast at IPO of ¥2,8633 Annualized DPU yield based on FP2 forecast DPU of ¥2,803 and closing price on 12 April 2017 of ¥76,300
LTV 48.0% at 28 February 2017. Adjusted for forecast repayment of ¥1.9 bn of short term borrowings in August 2017, LTV restated would be 46.0% NAV per unit increased 4.6% due to an uplift in appraisal values
Balance Sheet
Investment Units
Sakura Sogo REIT Presentation Material for the 1st Fiscal Period (Ended February 2017) 19
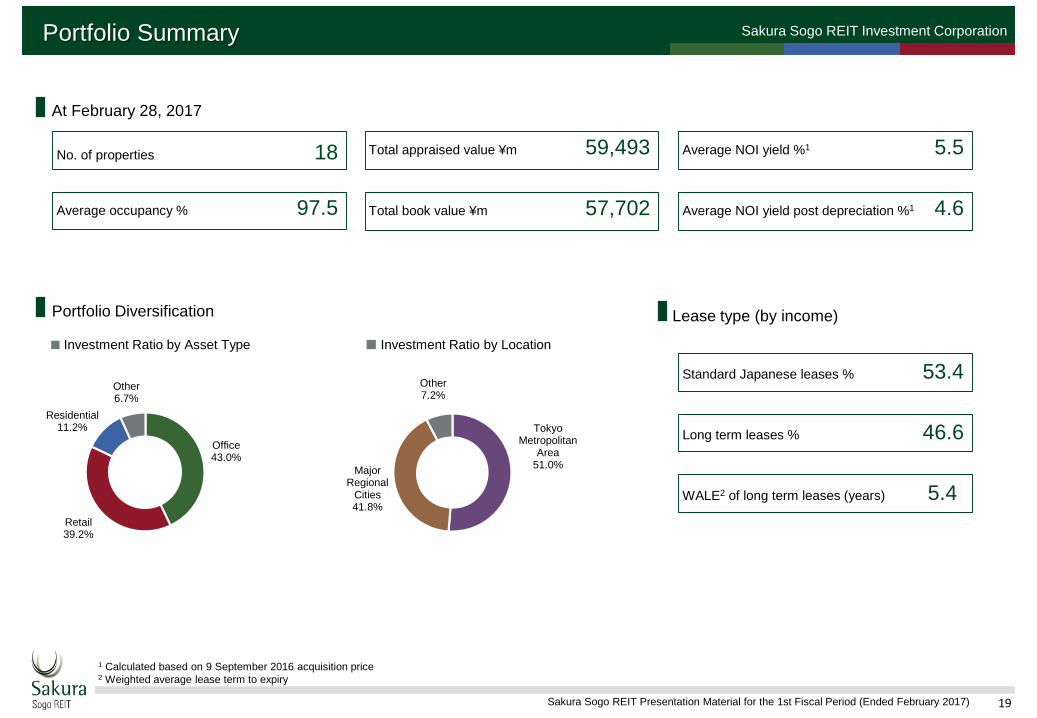
Sakura Sogo REIT Investment CorporationPortfolio Summary
Tokyo Metropolitan
Area51.0%Major
Regional Cities41.8%
Other7.2%
Office43.0%
Retail39.2%
Residential11.2%
Other6.7%
No. of properties 18
Total book value ¥m 57,702
Total appraised value ¥m 59,493 Average NOI yield %1 5.5
Average occupancy % 97.5 Average NOI yield post depreciation %1 4.6
Portfolio Diversification
At February 28, 2017
■ Investment Ratio by Location■ Investment Ratio by Asset Type
Lease type (by income)
1 Calculated based on 9 September 2016 acquisition price2 Weighted average lease term to expiry
WALE2 of long term leases (years) 5.4
Standard Japanese leases % 53.4
Long term leases % 46.6

Sakura Sogo REIT Investment Corporation
20Sakura Sogo REIT Presentation Material for the 1st Fiscal Period (Ended February 2017)
Section 5 - Management Key Priorities

Sakura Sogo REIT Presentation Material for the 1st Fiscal Period (Ended February 2017) 21
Sakura Sogo REIT Investment Corporation
Internal Growth
Utilize the expertise of Nippon Kanzai to ensure buildings are well maintained while minimizing costs
Strategic capital expenditure initiatives to:
- Maintain high occupancy- Minimize downtime on vacant space- Enhance prospects of current and
future rent reviews
Actively pursue growth- Upward rent reviews particularly
in office- Explore opportunities to create
new revenue streams
Explore opportunities to recycle assets which can:
- Increase distributions and,
- Enhance portfolio characteristics
Carefully manage borrowings to mitigate maturity risk and minimize ongoing cost of debt
Cumulative investment scheme for the Asset Management Company Directors and Employees to further align interest with unitholders
Capital Management
Management Key Priorities
Enhance Unitholder Value
Identifying investment opportunities off market via sponsor relationships
Add to existing pipeline support network (currently 5)
Foster relationships with mid scale developers that are not aligned with JREITs
External Growth

Sakura Sogo REIT Investment Corporation
22Sakura Sogo REIT Presentation Material for the 1st Fiscal Period (Ended February 2017)
Part A - Internal Growth Initiatives

Sakura Sogo REIT Presentation Material for the 1st Fiscal Period (Ended February 2017) 23
Sakura Sogo REIT Investment CorporationInternal Growth
Office
3rd Fiscal Period
Tenant Lease Renewals
21Under rent
> 10%
7Tenants
below Market
11Under rent
Between 0-10%
4
1 Average passing rent vs. assessed market rent from independent appraisal dated 28 February 2017
28.3%
43.9%
19.1%
8.8%
71.7%
Rent Gap1
> 10% < 20%
between 0% - 10%
less than 0%
15 tenants1,367 tsubo
30 tenants3,146 tsubo
25 tenants2,028 tsubo
Plan to approach 12 tenants whose leases renew in FP2 and FP3 for rent review
Monitor / consider upward rent revisions for tenants with a rent gap of less than 10%
Maintain sound relationships and ensure building services meet tenant expectationFocus on high level of tenant retention – target > 80%
> 20% 8 tenants628 tsubo
Successful track record of achieving rent increases in office assets Average uplift of 11.6% for office rent reviews in FP1 Based on independent appraisals over 70% of office floor space is at or below assessed market rent
2nd Fiscal Period
Tenant Lease Renewals
13Under rent
> 10%
5Tenants
below Market
7Under rent
Between 0-10%
2

Sakura Sogo REIT Presentation Material for the 1st Fiscal Period (Ended February 2017) 24
Sakura Sogo REIT Investment CorporationInternal Growth
Retail
Vacant storage area has been successfully converted to office use leading to additional (higher) revenue
Potential to convert additional vacant storage area to generate higher revenue (¥4m p.a.)
La Park Kishiwada Conversion Opportunity
Introduction of a well known national apparel retailer and a major Kansai area based book store to achieve the following: improve overall retail offer increase appeal to young and family shoppers expected to increase foot traffic leading to higher sales potential
for 2F existing tenants and the shopping center over all.
La Park Kishiwada 2F Tenant Repositioning
Residential
Replaced carpet with wood flooring Resulting in an increase in average passing rents Actual vs. forecast downtime was reduced
Before After
Shiroi Logiman Renovation Works
A model room was established to show prospective tenants sample fixture and room layout
Has been helpful in maintaining high occupancy
Shiroi Logiman Model Room

Sakura Sogo REIT Presentation Material for the 1st Fiscal Period (Ended February 2017) 25
Sakura Sogo REIT Investment CorporationInternal Growth
Office: Strategic Capital Expenditure
Nippon Kanzai Group has undertaken extensive review of building services Nippon Kanzai Group is coordinating replacement of HVAC systems with the key objectives as follows:
- High rate of tenant retention- Attract new tenants to minimize any downtime due to vacancy- Ensure building services meet tenant expectations to optimize rent review outcomes
Seishin Building
HVAC Replacement 2nd - 9th FPY55m p.a.
Takadanobaba Access
HVAC Replacement 2nd - 7th FPY18m p.a.
Shin Yokohama Nara Building
HVAC Replacement 2nd - 10th FPY25m p.a.
Explore new revenue streams and cost reduction
Promote actions to increase revenue such as installing rooftop telcom antennas, introducing bento trucks during lunch hours at office properties
- Potential to generate additional revenue of approx. ¥600,000 p.a. per building
Reduce costs by updating facility equipment such as LED lighting and HVAC
TsukasamachiBuilding
HVAC Replacement 3rd - 5th FPY32m p.a.
Sakura Sogo REIT Investment Corporation
26Sakura Sogo REIT Presentation Material for the 1st Fiscal Period (Ended February 2017)
Part B - External Growth Initiatives
Sakura Sogo REIT Presentation Material for the 1st Fiscal Period (Ended February 2017) 27
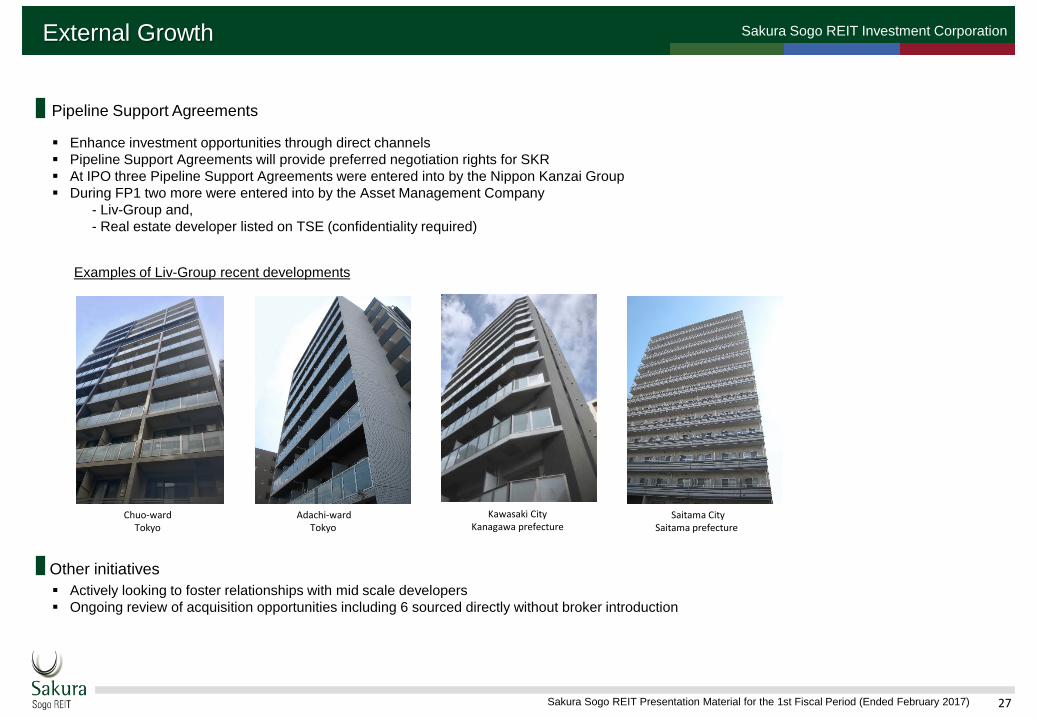
Sakura Sogo REIT Investment Corporation
Enhance investment opportunities through direct channels Pipeline Support Agreements will provide preferred negotiation rights for SKR At IPO three Pipeline Support Agreements were entered into by the Nippon Kanzai Group During FP1 two more were entered into by the Asset Management Company
- Liv-Group and,- Real estate developer listed on TSE (confidentiality required)
Other initiatives Actively looking to foster relationships with mid scale developers Ongoing review of acquisition opportunities including 6 sourced directly without broker introduction
External Growth
Pipeline Support Agreements
Saitama CitySaitama prefecture
Chuo-wardTokyo
Kawasaki CityKanagawa prefecture
Adachi-wardTokyo
Examples of Liv-Group recent developments
Sakura Sogo REIT Presentation Material for the 1st Fiscal Period (Ended February 2017) 28
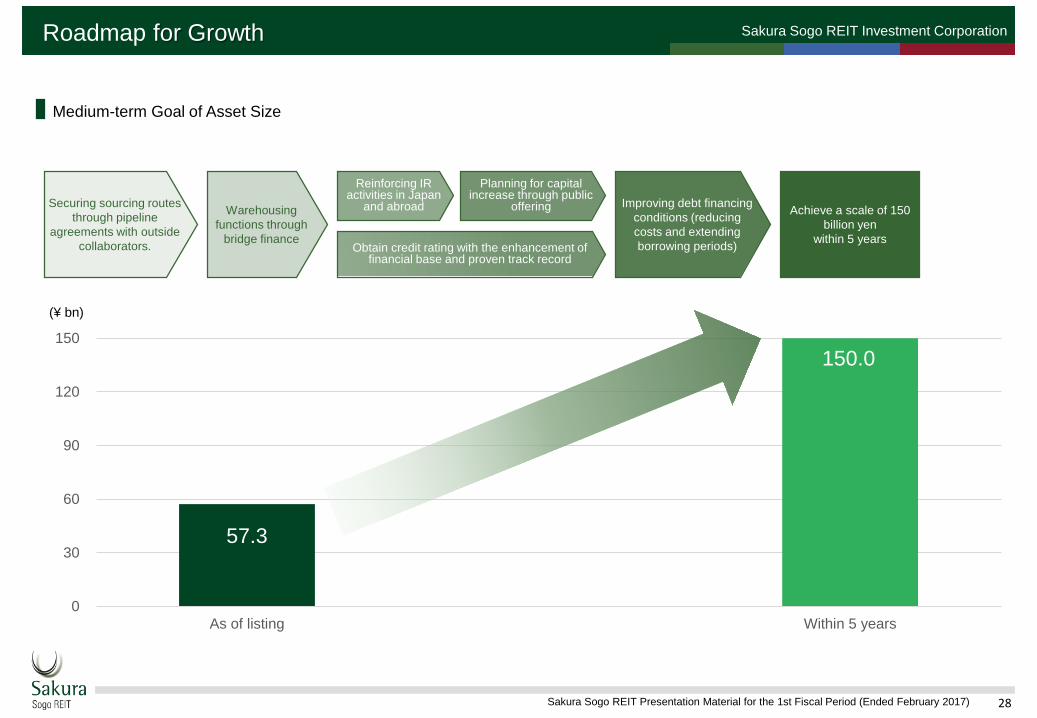
Sakura Sogo REIT Investment CorporationRoadmap for Growth
57.3
150.0
0
30
60
90
120
150
As of listing Within 5 years
Improving debt financing conditions (reducing costs and extending borrowing periods)
Planning for capital increase through public
offering
Reinforcing IR activities in Japan
and abroad
Obtain credit rating with the enhancement of financial base and proven track record
Warehousing functions through
bridge finance
Securing sourcing routes through pipeline
agreements with outside collaborators.
Achieve a scale of 150 billion yen
within 5 years
(¥ bn)
Medium-term Goal of Asset Size

Sakura Sogo REIT Investment Corporation
29Sakura Sogo REIT Presentation Material for the 1st Fiscal Period (Ended February 2017)
Part C - Capital Management
Sakura Sogo REIT Presentation Material for the 1st Fiscal Period (Ended February 2017) 30
Sakura Sogo REIT Investment CorporationCapital Management
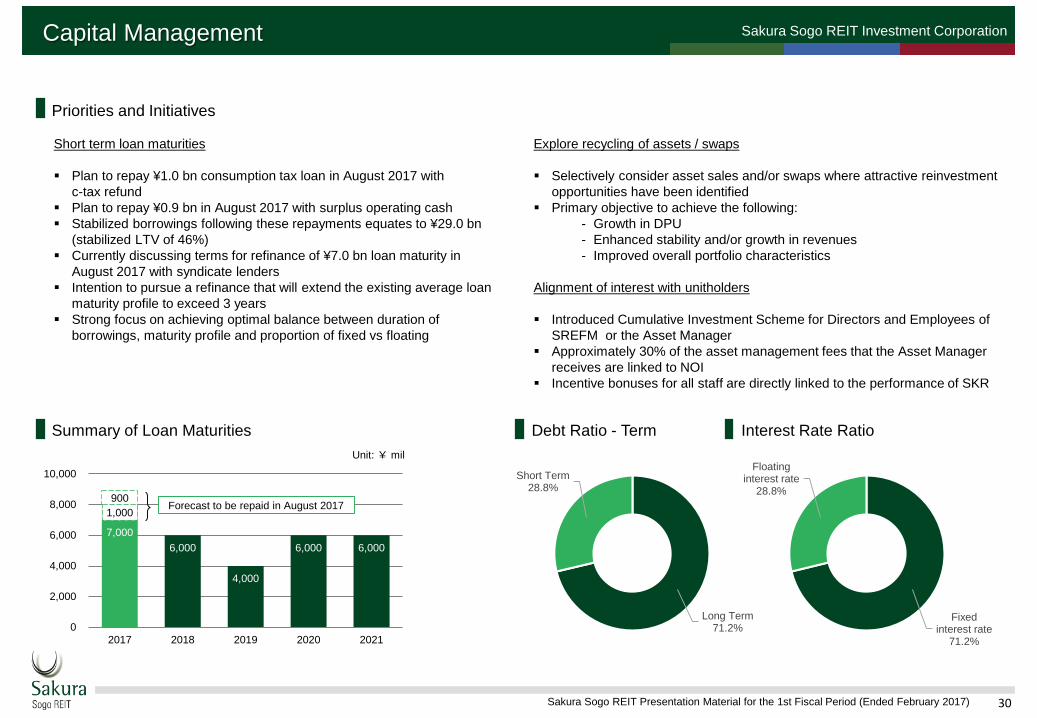
Priorities and Initiatives
Short term loan maturities
Plan to repay ¥1.0 bn consumption tax loan in August 2017 withc-tax refund
Plan to repay ¥0.9 bn in August 2017 with surplus operating cash Stabilized borrowings following these repayments equates to ¥29.0 bn
(stabilized LTV of 46%) Currently discussing terms for refinance of ¥7.0 bn loan maturity in
August 2017 with syndicate lenders Intention to pursue a refinance that will extend the existing average loan
maturity profile to exceed 3 years Strong focus on achieving optimal balance between duration of
borrowings, maturity profile and proportion of fixed vs floating
7,000 6,000
4,000
6,000 6,000
1,000 900
0
2,000
4,000
6,000
8,000
10,000
2017 2018 2019 2020 2021
Unit: ¥ mil
Summary of Loan Maturities Debt Ratio - Term Interest Rate Ratio
Explore recycling of assets / swaps
Selectively consider asset sales and/or swaps where attractive reinvestment opportunities have been identified
Primary objective to achieve the following:- Growth in DPU- Enhanced stability and/or growth in revenues- Improved overall portfolio characteristics
Alignment of interest with unitholders
Introduced Cumulative Investment Scheme for Directors and Employees of SREFM or the Asset Manager
Approximately 30% of the asset management fees that the Asset Manager receives are linked to NOI
Incentive bonuses for all staff are directly linked to the performance of SKR
Forecast to be repaid in August 2017
Long Term 71.2%
Short Term28.8%
Fixed interest rate
71.2%
Floating interest rate
28.8%

Sakura Sogo REIT Presentation Material for the 1st Fiscal Period (Ended February 2017) 31
Sakura Sogo REIT Investment Corporation
Sumitomo Mitsui Banking Corporation
32.2%
Shinsei Bank, Limited.32.2%
Resona Bank, Limited.9.7%
Aozora Bank, Ltd.9.7%
ORIX Bank Corporation6.5%
The Nishi-Nippon City Bank, Ltd.
3.2%
The Bank of Fukuoka, Ltd.3.2%
Sumitomo Mitsui Trust Bank, Limited.
3.2%
Overview of Borrowings
Balance of Borrowings by Lender
Borrowings
Collateral: Unsecured and unguaranteed
Loan amount (¥ mil)
Forecast repayment (¥ mil)
Forecast roll over (¥ mil)
Forecast balance (¥ mil) Interest rate Maturity date
Lender 28-Feb-17 31-Aug-17 31-Aug-17 31-Aug-17
Short-termA Syndicate of lenders with Sumitomo Mitsui Banking Corporation (Sumitomo Mitsui Banking Corporation, Shinsei Bank, Limited, Resona Bank, Limited, Aozora Bank, Ltd., ORIX Bank Corporation, The Nishi-Nippon City Bank, Ltd., The Bank of Fukuoka, Ltd, Sumitomo Mitsui Trust Bank, Limited)
4,900 1,900 3,000 3,000 Base Rate +0.2% (floating) 31-Aug-17
4,000 - 4,000 4,000 Base Rate +0.2% (floating) 31-Aug-17
Long-term
6,000 - - 6,000 0.62473% (fixed) 31-Aug-18
4,000 - - 4,000 0.71096% (fixed) 30-Aug-19
6,000 - - 6,000 0.81842% (fixed) 31-Aug-20
6,000 - - 6,000 0.93842% (fixed) 31-Aug-21
Total 30,900 1,900 7,000 29,000
Loan cost and duration (at 28 February 2017)
Weighted average cost (%) 0.82
Average duration (Years) 2.32
Sakura Sogo REIT Presentation Material for the 1st Fiscal Period (Ended February 2017) 32
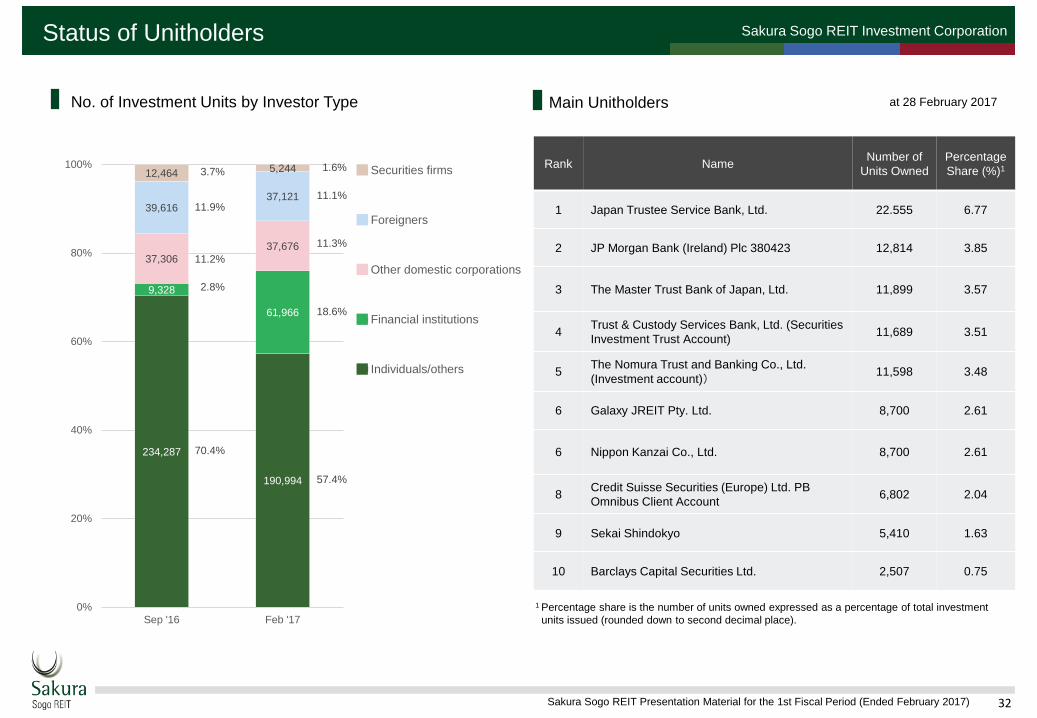
Sakura Sogo REIT Investment CorporationStatus of Unitholders
Rank Name Number of Units Owned
Percentage Share (%)1
1 Japan Trustee Service Bank, Ltd. 22.555 6.77
2 JP Morgan Bank (Ireland) Plc 380423 12,814 3.85
3 The Master Trust Bank of Japan, Ltd. 11,899 3.57
4 Trust & Custody Services Bank, Ltd. (Securities Investment Trust Account) 11,689 3.51
5 The Nomura Trust and Banking Co., Ltd. (Investment account)) 11,598 3.48
6 Galaxy JREIT Pty. Ltd. 8,700 2.61
6 Nippon Kanzai Co., Ltd. 8,700 2.61
8 Credit Suisse Securities (Europe) Ltd. PB Omnibus Client Account 6,802 2.04
9 Sekai Shindokyo 5,410 1.63
10 Barclays Capital Securities Ltd. 2,507 0.75
1 Percentage share is the number of units owned expressed as a percentage of total investment units issued (rounded down to second decimal place).
Main Unitholders at 28 February 2017
234,287
190,994
9,328
61,966
37,306 37,676
39,616 37,121
12,464 5,244
0%
20%
40%
60%
80%
100%
Sep '16 Feb '17
Securities firms
Foreigners
Other domestic corporations
Financial institutions
Individuals/others
No. of Investment Units by Investor Type
57.4%
18.6%
11.3%
11.1%
1.6%
70.4%
2.8%
11.2%
11.9%
3.7%

Sakura Sogo REIT Investment Corporation
33Sakura Sogo REIT Presentation Material for the 1st Fiscal Period (Ended February 2017)
Appendix

Sakura Sogo REIT Presentation Material for the 1st Fiscal Period (Ended February 2017) 34
Sakura Sogo REIT Investment CorporationBalance Sheet and Statement of Income
Unit: ¥milAssetsCurrent assets 6,571
Cash and deposits 1,062Cash and deposits in trust 4,147Other 1,362
Non-current assets 57,828Property, plant and equipment 57,031Investments and other assets 797
Total assets 64,399LiabilitiesCurrent liabilities 9,515
Operating accounts payable 220Short-term loans payable 8,900Accounts payable – other 19Advances received 372Other 4
Non-current liabilities 25,120Long-term loans payable 22,000Tenant leasehold and security deposits in trust 3,120
Total liabilities 34,635Total unitholders’ equity 29,764
Unitholders’ capital 29,255Surplus 509
Total net assets 29,764Total liabilities and equity 64,399
Unit: ¥mil
Operating revenue 2,253Leasing business revenue 1,979Other leasing business revenue 274
Operating expenses 1,194Expenses related to rent business 834Asset management fee 108Asset custody fee/Administrative service fees 23Directors’ compensation 11Other operating expenses 218
Operating profit 1,059Non-operating expenses 548
Interest expenses 90Depreciation of deferred organization expenses 51Investment unit issuance expenses 169Borrowing related expenses 237
Ordinary profit (loss) 511Net profit (loss) before income taxes 511Net profit (loss) 509Unappropriated retained earnings (undisposed loss) 509
Statement of IncomeBalance Sheet at 28 February 2017
Sakura Sogo REIT Presentation Material for the 1st Fiscal Period (Ended February 2017) 35
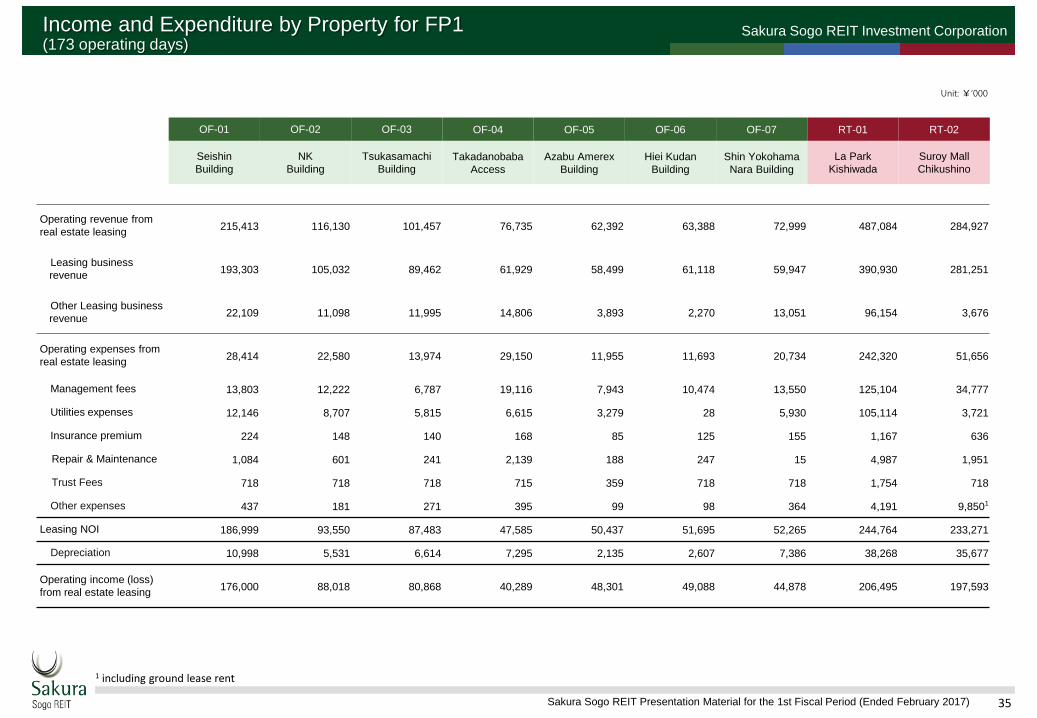
Sakura Sogo REIT Investment CorporationIncome and Expenditure by Property for FP1(173 operating days)
Unit: ¥’000
OF-01 OF-02 OF-03 OF-04 OF-05 OF-06 OF-07 RT-01 RT-02
Seishin Building
NK Building
Tsukasamachi Building
Takadanobaba Access
Azabu Amerex Building
Hiei Kudan Building
Shin Yokohama Nara Building
La Park Kishiwada
Suroy Mall Chikushino
Operating revenue from real estate leasing 215,413 116,130 101,457 76,735 62,392 63,388 72,999 487,084 284,927
Leasing business revenue 193,303 105,032 89,462 61,929 58,499 61,118 59,947 390,930 281,251
Other Leasing business revenue 22,109 11,098 11,995 14,806 3,893 2,270 13,051 96,154 3,676
Operating expenses from real estate leasing 28,414 22,580 13,974 29,150 11,955 11,693 20,734 242,320 51,656
Management fees 13,803 12,222 6,787 19,116 7,943 10,474 13,550 125,104 34,777
Utilities expenses 12,146 8,707 5,815 6,615 3,279 28 5,930 105,114 3,721
Insurance premium 224 148 140 168 85 125 155 1,167 636
Repair & Maintenance 1,084 601 241 2,139 188 247 15 4,987 1,951
Trust Fees 718 718 718 715 359 718 718 1,754 718
Other expenses 437 181 271 395 99 98 364 4,191 9,8501
Leasing NOI 186,999 93,550 87,483 47,585 50,437 51,695 52,265 244,764 233,271
Depreciation 10,998 5,531 6,614 7,295 2,135 2,607 7,386 38,268 35,677
Operating income (loss) from real estate leasing 176,000 88,018 80,868 40,289 48,301 49,088 44,878 206,495 197,593
1 including ground lease rent

Sakura Sogo REIT Presentation Material for the 1st Fiscal Period (Ended February 2017) 36
Sakura Sogo REIT Investment Corporation
RT-03 RT-04 RS-01 RS-02 RS-03 RS-04 OT-01 OT-02 OT-03
Seiyu Minakuchi
Suroy Mall Nagamine
Shiroi Logiman
Matsuya Residence
Sekime
Royal Hill Kobe Sannomiya II
Urban Plaza Imazato
Funabashi Hi-Tech Park Hidan
Funabashi Hi-Tech Park
Factory
Confomall Sapporo
Operating revenue from real estate leasing Non-disclosure 165,560 130,305 80,853 56,097 37,685 Non-disclosure Non-disclosure 68,041
Leasing business revenue Non-disclosure 135,639 121,824 74,672 51,955 35,799 Non-disclosure Non-disclosure 58,379
Other Leasing business revenue Non-disclosure 29,921 8,480 6,181 4,142 1,886 Non-disclosure Non-disclosure 9,662
Operating expenses from real estate leasing 23,361 45,967 41,204 20,556 13,610 8,496 1,799 10,845 18,381
Management fees 5,790 15,658 25,126 12,061 8,228 5,082 950 9,873 6,244
Utilities expenses 0 22,153 2 2,377 1,607 490 0 133 9,941
Insurance premium 496 250 599 240 145 114 114 60 264
Repair & Maintenance 310 6,209 12,463 5,101 2,863 2,134 0 0 653
Trust Fees 715 718 1,197 359 359 359 718 718 718
Other expenses 16,0481 976 1,815 416 406 313 16 59 558
Leasing NOI Non-disclosure 119,593 89,100 60,297 42,487 29,189 Non-disclosure Non-disclosure 49,660
Depreciation 41,792 17,492 18,655 9,543 11,552 5,423 9,291 2,991 12,877
Operating income (loss) from real estate leasing Non-disclosure 102,101 70,444 50,753 30,934 23,766 Non-disclosure Non-disclosure 36,782
Income and Expenditure by Property for FP1 (173 operating days)
Unit: ¥’000
1 including ground lease rent
Sakura Sogo REIT Presentation Material for the 1st Fiscal Period (Ended February 2017) 37
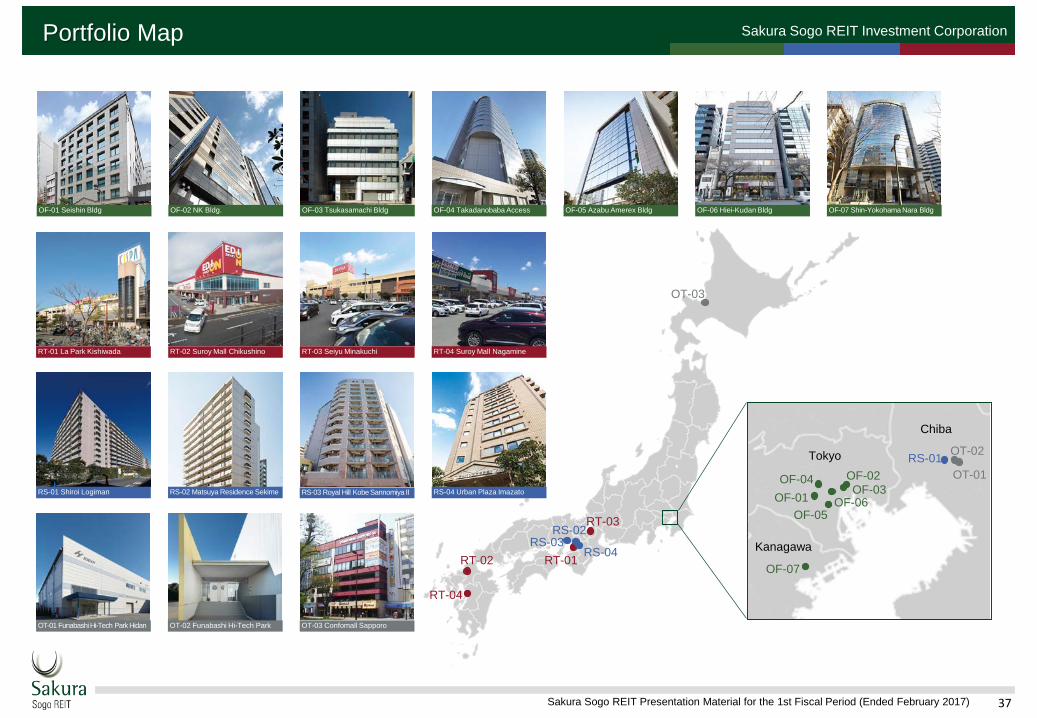
Sakura Sogo REIT Investment CorporationPortfolio Map
OF-01 Seishin Bldg OF-02 NK Bldg. OF-03 Tsukasamachi Bldg OF-04 Takadanobaba Access OF-05 Azabu Amerex Bldg OF-06 Hiei-Kudan Bldg OF-07 Shin-Yokohama Nara Bldg
RT-01 La Park Kishiwada RT-02 Suroy Mall Chikushino RT-03 Seiyu Minakuchi RT-04 Suroy Mall Nagamine
RS-01 Shiroi Logiman RS-02 Matsuya Residence Sekime RS-03 Royal Hill Kobe Sannomiya II
OT-01 Funabashi Hi-Tech Park Hidan OT-02 Funabashi Hi-Tech Park OT-03 Confomall Sapporo
OF-02OF-03
OF-01OF-04
OF-05OF-06
OF-07
RS-01OT-01
OT-02
Chiba
Tokyo
Kanagawa
RS-04 Urban Plaza Imazato
RT-01RT-02
RT-03
RT-04
RS-02RS-03
OT-03
RS-04

Sakura Sogo REIT Presentation Material for the 1st Fiscal Period (Ended February 2017) 38
Sakura Sogo REIT Investment Corporation
Asset Type Office Retail
No. OF-01 OF-02 OF-03 OF-04 OF-05 OF-06 OF-07 RT-01 RT-02 RT-03
Property Name SeishinBuilding
NK Building
Tsukasamachi Building
Takadanobaba Access
Azabu Amerex Building
Hiei Kudan Building
Shin Yokohama Nara Building
La Park Kishiwada
Suroy Mall Chikushino
Seiyu Minakuchi
Address Shinjuku-ku, Tokyo
Chiyoda-ku, Tokyo
Chiyoda-ku, Tokyo
Shinjuku-ku, Tokyo Minato-ku, Tokyo Chiyoda-ku,
TokyoKohoku-ku,Yokohama Kishiwada, Osaka Chikushino,
Kyushu Minakuchi, Shiga
Appraisal @ IPO (¥bn) 7,960 3,780 3,860 3,370 2,050 1,990 1,930 6,510 7,810 4,240
Appraisal @ FP1 (¥bn) 8,360 3,860 3,910 3,430 2,140 2,050 1,950 6,600 7,820 4,240
NOI Yield @ IPO (%) 4.2% 4.6% 4.6% 4.8% 4.4% 4.9% 5.6% 6.1% 5.6% 6.0%
NOI Yield @ FP1 (%) 4.0% 4.5% 4.6% 4.7% 4.2% 4.7% 5.5% 5.9% 5.6% 6.0%
NOI Yield @ IPO post depr (%)
3.9% 4.3% 4.3% 4.4% 4.2% 4.7% 4.8% 5.0% 4.7% 4.0%
NOI Yield @ PF1 post depr (%)
3.8% 4.2% 4.2% 4.3% 4.0% 4.5% 4.7% 4.7% 4.7% 4.0%
Property – Appraisal & Yield Analysisat 28 February 2017

Sakura Sogo REIT Presentation Material for the 1st Fiscal Period (Ended February 2017) 39
Sakura Sogo REIT Investment Corporation
Asset Type Retail Residential Other
Total(18 properties)
No. RT-04 RS-01 RS-02 RS-03 RS-04 OT-01 OT-02 OT-03
Property Name Suroy Mall Nagamine
ShiroiLogiman
Matsuya Residence Sekime
Royal Hill Kobe Sannomiya II
Urban Plaza Imazato
Funabashi Hi-Tech Park
Hidan
Funabashi Hi-Tech Park
Confomall Sapporo
Address Kumamoto City, Kumamoto
Shiroi City, Chiba
Osaka City, Osaka
Kobe City, Hyogo
Osaka City, Osaka
Funabashi City, Chiba
Funabashi City, Chiba
Sapporo City, Hokkaido
Appraisal @ IPO (¥bn) 4,320 2,190 1,850 1,500 959 1,760 749 1,430 58,258
Appraisal @ FP1 (¥bn) 4,460 2,210 1,910 1,550 984 1,800 779 1,440 59,493
NOI Yield @ IPO (%) 5.6% 7.4% 6.5% 5.5% 6.1% 6.3% 6.4% 5.8% 5.4%
NOI Yield @ FP1 (%) 5.6% 7.2% 6.4% 5.3% 5.9% 6.1% 6.2% 5.6% 5.3%
NOI Yield @ IPO post depr (%)
4.8% 5.7% 5.5% 4.0% 5.0% 5.2% 5.5% 4.0% 4.6%
NOI Yield @ PF1 post depr (%)
4.8% 5.5% 5.4% 3.8% 4.8% 5.1% 5.4% 3.8% 4.4%
Property – Appraisal & Yield Analysisat 28 February 2017

Sakura Sogo REIT Presentation Material for the 1st Fiscal Period (Ended February 2017) 40
Sakura Sogo REIT Investment CorporationOverview of the Investment Corporation
Investment Corporation
❶ Asset Management Entrustment Agreement❷ Asset Custody Entrustment Agreement / Entrustment
Agreement for Administrator of the Investment Unitholder Registry / Entrustment Agreement for Clerical undertakings (Institution services)
❸ Sponsor Support Agreement❹ Business Entrustment Agreement
Sponsor
Nippon Kanzai Co., Ltd.
Tokyo Capital Management Co., Ltd.
Asset Management Company
Sakura Real Estate Funds Management, Inc.
Sponsor / Parent Company of Asset Management Company
Galileo Sydney Holdings Pty Limited
Board of OfficersExecutive Officer: Makoto Muranaka
Supervisory Officer: Hirotaka IsayamaSupervisory Officer: Shigeru Kaneda
Accounting AuditorPricewaterhouseCoopers Arata
General Meeting of Unitholders
General Administrator for Accounting Affairs
Kaneyama & Associates
Asset Custody Company/Administrator of Unitholder Registry/General Administrator related to the operation of the administrative institution
Sumitomo Mitsui Trust Bank, Limited.
❶
❷
❸
❹
❸
General Meeting of Unitholders
Board of Directors
Representative Director and Chairman / Representative Director and President
Statutory Auditor
Compliance Committee
Finance and Planning DivisionInvestment Division
Investment Committee
Compliance Officer
Overview of Asset Management Company
Schematic Diagram of the Investment Corporation’s Structure
Sakura Sogo REIT Investment
Trade Name Sakura Real Estate Funds Management, Inc.
Date of Incorporation July 7, 2015
Stated Capital 101.52 million yen
Shareholder Composition Galaxy JREIT Pty Limited 50%Tokyo Capital Management Co., Ltd. 50%(based on voting rights: Galaxy JREIT Pty Limited 100%)
Principal Lines of Business Discretionary Investment Business, management of Investment Corporation’s assets
Officers 6 Directors (2 Full-time Directors), 1 Statutory Auditor
Financial Instrument Business Registration
Reg. No.: Director of Kanto Local Finance Bureau (FI) No. 2907Member of Investment Trusts Association, Japan
Real estate agency business license License No.: Tokyo Metropolitan Governor (1) No. 98232
Approval as Entrustment - Based Agency Services for Transactions
Approval No.: Minister of Land, Infrastructure, Transport and Tourism No. 100

Sakura Sogo REIT Presentation Material for the 1st Fiscal Period (Ended February 2017) 41
Sakura Sogo REIT Investment CorporationDisclaimer
This presentation material has been prepared solely for the purpose of providing information, and not for soliciting investments in certain products.
The presentation material includes, in addition to a description of Sakura Sogo REIT Investment Corporation (hereinafter the “Investment Corporation”), charts, data, etc. prepared by Sakura Real Estate Funds Management, Inc. (hereinafter the “Asset Management Company”) based on data and indices published by third parties. Furthermore, it includes present analysis, judgements and other opinions of the Asset Management Company regarding such information.
The contents of the presentation material have not been audited, and their accuracy nor integrity is guaranteed. The analysis and judgement by the Asset Management Company are its current opinions and the contents may be modified or repealed without any advance notice.
The Investment Corporation or the Asset Management Company bear no responsibility with regard to the accuracy of the data or indices published by third parties (including data based on real estate appraisal reports).
The content of this presentation material include statements on forecast and future operating results. Such statements are based on the information available at the time of preparation of this presentation material and certain assumptions for unforeseeable factors, and thus do not guarantee future operating results of the Investment Corporation and may differ from actual operating results.