Embed Size (px)
Citation preview
31 Management’s Discussion & Analysis
35 Risk Factors
36 Consolidated Financial Statements
36 Consolidated Balance Sheets
38 Consolidated Statements of Income
38 Consolidated Statements of Comprehensive Income
39 Consolidated Statements of Changes in Net Assets
40 Consolidated Statements of Cash Flows
41 Notes to Consolidated Financial Statements
Contents
FINANCIAL SECTION
30 THK ANNUAL REPORT 2017
THK ANNUAL REPORT 2017 31
Analysis of Operating Results
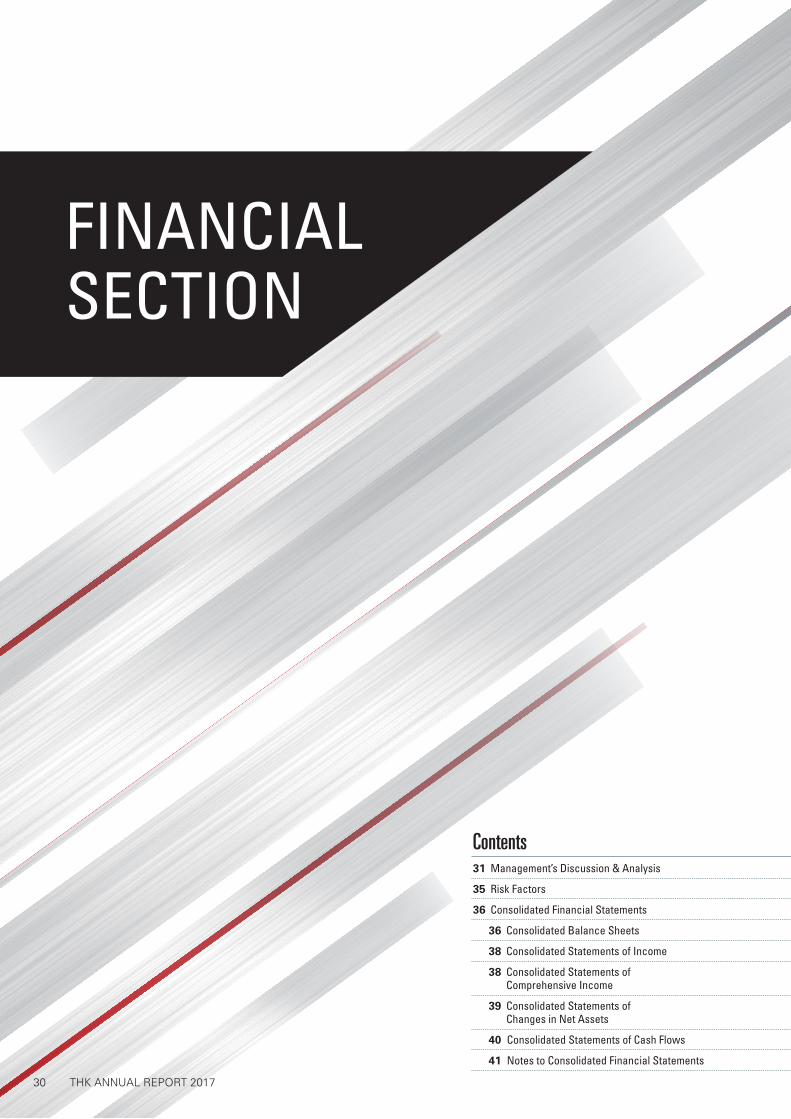
Net SalesIn the fiscal year 2016, which ended March 31, 2017, a moderate recov-ery continued in the global economy, led by Europe and the United States and other developed countries, despite a slowdown in the eco-nomic growth of China and other emerging countries. Although Japan experienced a weakness in exports due to the increased value of the yen, the economy improved overall, moderately recovering through the second half of the year. The THK Group has identified full-scale globalization, the devel-opment of new business areas, and a change in business style as cor-nerstones of its growth strategy to expand markets for the Company’s products, including LM guides. Under its full-scale globalization strat-egy, the Group is striving to expand its production and sales structures globally to capture demand from China and other emerging countries, where the market is growing due to developments in factory auto-mation (FA) and other areas, as well as the demand from developed countries, where the user base is expanding. Under the development of new business areas strategy, the Group is working to increase sales revenue from not only existing products, but also newly developed products, buoyed by growing use of the Company’s products in such consumer goods-related fields as automotive parts, seismic isolation and damping systems, medical equipment, aircraft, robotics, and renewable energy. Additionally, in order to promote these strategies,
the Company is making full use of the IoT, cloud computing, AI, and robots from a variety of different angles, thereby expanding its busi-ness domains by realizing a change in business style. During the fiscal year under review, the THK Group vigorously worked to expand sales on a global scale, harnessing the results of prolonged efforts to strengthen its business structure. Furthermore, four THK RHYTHM AUTOMOTIVE (TRA) companies were added to the scope of consolidation after August 31, 2015, with the aim of fur-ther expanding the Group’s automotive and transportation business. As a result, consolidated net sales increased to ¥273,577 million, up ¥33,098 million (13.8%) compared to last year.
Cost of SalesWith the addition of the four TRA companies, which have higher cost to sales ratios than the industrial machinery business, the cost to sales ratio increased 2.4 percentage points from last year, to 74.2%.
Selling, General, and Administrative (SG&A) ExpensesWith the addition of the four TRA companies, which have lower ratios of SG&A expenses to sales than the industrial machinery business, the ratio of SG&A expenses to sales decreased 1.8 percentage points from last year, to 16.7%.
0
100,000
300,000
200,000
2013 2014 2015 20160
10,000
30,000
20,000
0
5
15
10
2013 2014 2015 2016 20172017
(Millions of yen) (Millions of yen)
Net Sales
Years ended March 31
(%)
Operating Income/Operating Income Margin
Years ended March 31
Operating Income (Left scale) Operating Income Margin (Right scale)
MANAGEMENT’S DISCUSSION & ANALYSIS
32 THK ANNUAL REPORT 2017
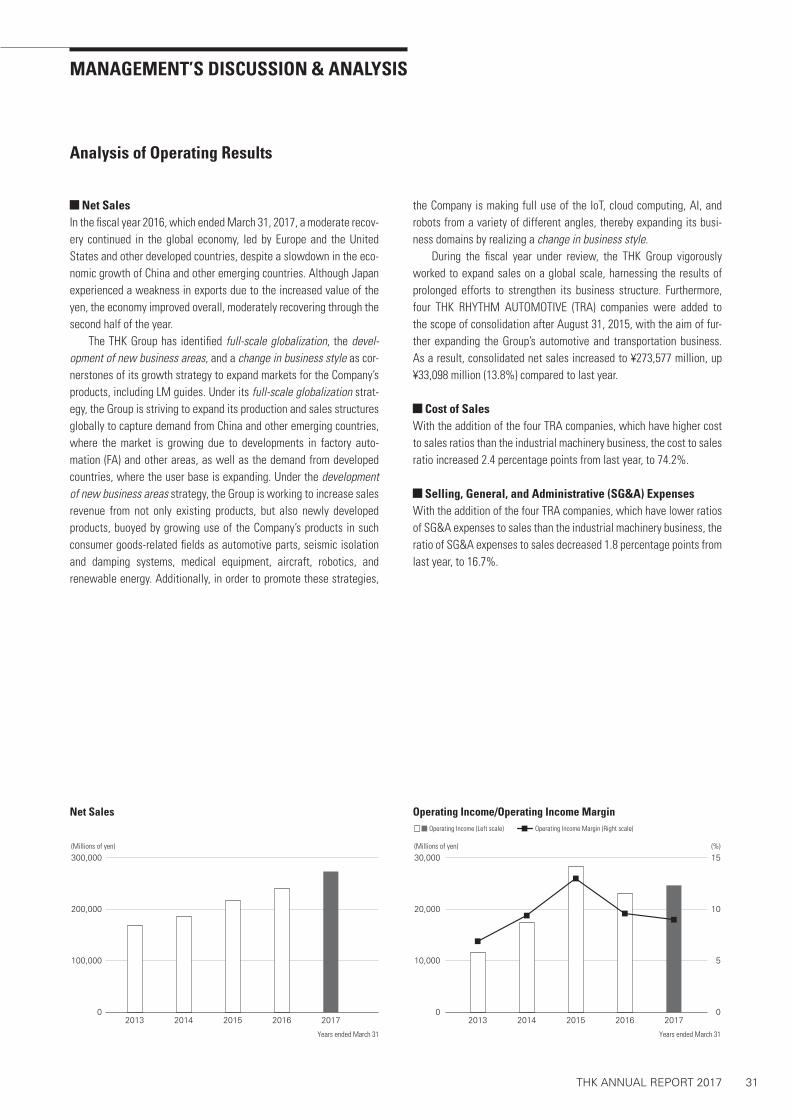
Operating IncomeAs a result, while operating income was ¥24,653 million, up ¥1,483 million (6.4%) compared to the previous fiscal year, the operating mar-gin decreased 0.6 percentage points, to 9.0%.
Non-Operating Income and ExpensesNon-operating income was ¥2,596 million. This largely comprised ¥524 million of equity in earnings of affiliates and interest received of ¥418 million. Non-operating expenses were ¥3,851 million due mainly to a foreign exchange loss of ¥2,942 million, which resulted from the increased value of the yen.
Net Income Attributable to Shareholders of THK CO., LTD.As a result, the net income attributable to shareholders of THK CO., LTD., rose to ¥16,731 million, which was an increase of ¥3,155 million (23.2%) compared to the previous fiscal year.
Segment Information
JapanAlthough Japan experienced a weakness in exports due to the increased value of the yen, the economy improved overall, moder-ately recovering through the second half of the year. In addition to actively expanding its sales activities, the THK Group is developing new business areas such as seismic isolation and damping systems, medical equipment, renewable energy, and robotics. With these devel-opments and the rising demand in the electronics field, sales increased to ¥121,865 million, up ¥3,014 million (2.5%) compared to the previ-ous fiscal year. Meanwhile, from a profit perspective, the operating income (segment income) decreased ¥910 million (4.6%) year-on-year, to ¥18,809 million, due primarily to the shift in exchange rates because of the increased value of the yen.
The AmericasIn the Americas, economic recovery continued with steady consumer spending and capital investments. The Company worked diligently to expand transactions with existing customers by unifying production and sales while developing new business areas, including the medical equipment and aircraft fields as well as energy-related fields. With these developments and the demand in the electronics field staying steady, as well as the addition of two North American TRA compa-nies into the scope of consolidation, sales increased ¥13,378 million (27.0%) year-on-year, to ¥62,870 million. The operating income (seg-ment income) increased ¥215 million (10.3%), to ¥2,311 million.
0
6
3
15
12
9
0
5,000
10,000
15,000
25,000
20,000
2013 2014 2015 20160
2
10
6
8
4
2013 2014 2015 2016 20172017
(%) (%)
Years ended March 31 Years ended March 31
(Millions of yen)
Net Income Attributable to Shareholders of THK CO., LTD./Net Income Margin Return on Assets (ROA)/Return on Equity (ROE)Net Income Attributable to Shareholders of THK CO., LTD. (Left scale) Net Income Margin (Right scale) ROEROA
MANAGEMENT’S DISCUSSION & ANALYSIS

THK ANNUAL REPORT 2017 33
EuropeIn Europe, the economy continued to show a moderate recovery. In the fiscal year under review, THK strove to expand transactions with existing customers by unifying production and sales while developing aggressive sales activities to explore new business areas, including the fields of medical equipment, aircraft, and robotics. With these developments, in addition to bringing two European TRA compa-nies into the scope of consolidation, sales increased ¥17,552 million (56.2%) year-on-year, to ¥48,775 million. The operating income (seg-ment income) increased ¥17 million (2.7%), to ¥649 million.
ChinaIn China, where FA has progressed against the backdrop of rising wages and a shortage of labor, which in turn has broadened demand for the Company’s products, the Group undertook aggressive sales activities, optimizing the sales networks it has strengthened over time. As a result, the range of demand has broadened despite the slowdown of economic growth. However, sales decreased ¥164 million (0.6%) year-on-year, to ¥28,008 million, primarily due to the shift in exchange rates from the increasing value of the yen. Meanwhile, from a profit perspective, the operating income (segment income) increased ¥2,095 million compared to the previous fiscal year, to ¥750 million. This turn-around was made possible through the many efforts aimed at improv-ing profitability.
OtherIn other regions, as the THK Group expanded its sales network in the ASEAN region and India, the Group undertook aggressive sales activ-ities to expand transactions with existing customers and acquire new customers. However, due in part to the shift in exchange rates from the increased value of the yen, sales decreased ¥682 million (5.4%) compared to the previous fiscal year, to ¥12,056 million. Meanwhile, the operating income (segment income) increased ¥68 million (5.4%), to ¥1,336 million.
0
50
100
150
200
2013 2014 2015 20160
1,000
500
2,000
1,500
2013 2014 2015 20162017 2017
(Yen) (Yen)
Net Income per Share Net Assets per Share
Years ended March 31 Years ended March 31

34 THK ANNUAL REPORT 2017
Financial Position
Assets, Liabilities, and Net AssetsAssetsTotal current assets stood at ¥259,827 million as of March 31, 2017, an increase of ¥10,968 million compared with the previous fiscal year end. While trade accounts and notes receivable climbed ¥3,933 million in line with the upswing in net sales, inventories decreased ¥1,813 million. Cash and cash equivalents, on the other hand, increased ¥10,380 million due primarily to free cash flow. Total non-current assets stood at ¥155,103 million as of March 31, 2017, a decrease of ¥3,846 million compared with the previous fiscal year end. In addition to a decrease in property, plant, and equipment of ¥788 million, intangibles also decreased ¥4,240 million.
LiabilitiesTotal liabilities came to ¥163,390 million, up ¥6,122 million com-pared with March 31, 2016. Major movement in liabilities included a decrease in long-term debt of ¥2,800 million, but also an increase in trade accounts and notes payable of ¥6,015 million.
Net AssetsTotal net assets stood at ¥251,540 million as of March 31, 2017, an increase of ¥1,000 million compared with the previous fiscal year end. While net income attributable to shareholders of THK CO., LTD., came to ¥16,731 million, THK undertook payments for cash dividends of ¥5,185 million. At the same time, foreign currency translation adjustments declined ¥10,965 million compared with the previous fiscal year end.
Cash FlowsNet cash provided by operating activities came to ¥40,175 million. The major cash inflows were an income before income taxes of ¥23,057 million as well as depreciation and amortization of ¥13,185 million. The principal cash outflows included an increase in trade accounts and notes payable of ¥7,416 million. Net cash used in investing activities totaled ¥17,960 million, pri-marily due to the purchase of fixed assets. Net cash provided by financing activities was ¥7,548 million. The major cash outflows included the payment of cash dividends and the repayment of long-term debts. In addition to each of the aforementioned activities, accounting for the effect of exchange differences, cash and cash equivalents as of March 31, 2017, stood at ¥137,345 million, an increase of ¥10,380 million compared with the end of the previous fiscal year.
0
0.4
0.2
1.0
0.8
0.6
0
100,000
200,000
300,000
500,000
400,000
2013 2014 2015 20160
40
20
100
60
80
0
300,000
240,000
180,000
120,000
60,000
2013 2014 2015 20162017 2017
Total Assets/Turnover RatioTotal Assets (Left scale) Turnover Ratio (Right scale)
Net Worth/Net Worth RatioNet Worth (Left scale) Net Worth Ratio (Right scale)
Years ended March 31 Years ended March 31
(Millions of yen) (Millions of yen) (%)(Times)
MANAGEMENT’S DISCUSSION & ANALYSIS

THK ANNUAL REPORT 2017 35
Risk factors and uncertainties that could affect the THK Group’s busi-ness results and financial position include, but are not limited to, the items outlined below. Please note that any items relating to the future are based on the best judgment of THK Group management as of June 19, 2017.
Dependence on Linear Motion SystemsThe principal business of the THK Group is the manufacture and sale of linear motion systems, notably LM guides. Linear motion systems account for the majority of sales and are expected to continue to do so for the foreseeable future. Any unexpected technical revolution that jeopardizes the position of linear motion systems as a critical machine component could have a negative impact on the business results and financial position of the THK Group.
Effect of Changes in Production Trends within Specific IndustriesThe THK Group manufactures and sells LM guides, ball screws, and other machine components, as well as link balls, suspension ball joints, and other transportation equipment components. The principal users of these products are companies that make industrial machin-ery and equipment, including machine tools, general machinery, and semiconductor production equipment, as well as manufacturers of transportation equipment. While the THK Group is striving through full-scale globalization, the development of new business areas, and a change in business style to realize expansions in its business domains, the performance of the THK Group is influenced by production trends within industrial sectors such as machine tools, general machinery, semiconductor production equipment, and transportation equipment, whose manufacturers constitute the THK Group’s major customers. As a result, the business results and financial position of the THK Group could be affected negatively in the future by a downturn in pro-duction levels in these specific industries.
Business Expansion Outside of JapanThe THK Group has manufacturing and sales operations in the Americas, Europe, China, and other regions. Economic downturns in countries where the THK Group manufactures or sells products, as well as the resulting reduction in demand for the Company’s products, could have a negative impact on the THK Group’s business results and financial position. Any unexpected legal and regulatory changes in countries other than Japan could also have a similar effect.
Exchange Rate FluctuationsWhile the THK Group engages in the hedging of risks by means such as foreign exchange contracts for foreign currency transactions, primarily with regard to importing and exporting, there is the possibility that the Group’s business results and financial position could be negatively impacted by any major exchange rate fluctuations. Furthermore, the financial statements of THK’s subsidiaries out-side of Japan are converted to yen for the generation of the Company’s consolidated financial statements. Thus, there is also the possibility that, even with there being no change in the value in the local cur-rency, the amount on the consolidated financial statement after the
conversion to yen could be negatively impacted by the exchange rate at the time of conversion.
Reliance on Specific Supply SourcesThe THK Group procures some of its raw materials and parts from external supply sources. As a result, the THK Group’s business results and financial position could be negatively affected in the event of a shortfall in raw materials and parts owing to factors such as a drop in the production capacity of suppliers, a natural disaster, or some other unforeseen incident.
Incidence of Non-Conforming ProductsTHK Group products are widely used in industrial machinery, including machine tools, industrial robots, and semiconductor production equip-ment. Applications for THK products have also expanded to include various areas related to consumer goods, including automobiles, seismic isolation and damping systems, medical equipment, aircraft, robots, and renewable energy. Under these circumstances, the THK Group has worked to estab-lish quality assurance systems to ensure that high product quality is maintained across all product sectors. However, any incidence of non-conforming product that arises in any of these markets could potentially result in substantial costs or a loss of trust among the gen-eral public, thereby exerting a negative impact on the business results and financial position of the THK Group.
Information SecurityThe THK Group collects, maintains, and manages personal information as well as trade secrets relating to its customers, business partners, and other affiliates as it conducts its business activities. Every effort is made to ensure that this information is stringently managed. However, if part or all of this information is leaked due to a computer virus, information system defect, or another factor, such an event would have the potential to exert a negative impact on the Group’s credibility, which could simi-larly affect the Group’s business results and financial position.
Disasters, Acts of Terrorism, Infectious Diseases, and Other MaladiesThe THK Group possesses manufacturing facilities as well as sales offices in Japan, the Americas, Europe, China, and other regions. In the event that any of the Group’s places of business are affected by natural disasters, including earthquakes and fires; political unrest due to acts of terrorism or war; or the outbreak of an infectious disease, the potential exists for the THK Group’s business results and financial position to be negatively impacted.
Sharp Hikes in the Prices of Raw MaterialsIn the event of unanticipated sharp hikes in the prices of raw mate-rials arising from factors such as high crude oil prices, the social conditions in countries that supply raw materials, and rising demand in newly emerging markets, the manufacturing costs of the Group’s products can be expected to increase. As a result, there is a possibil-ity that the THK Group’s business results and financial position could be negatively impacted.
RISK FACTORS
36 THK ANNUAL REPORT 2017
THK CO., LTD. and consolidated subsidiaries
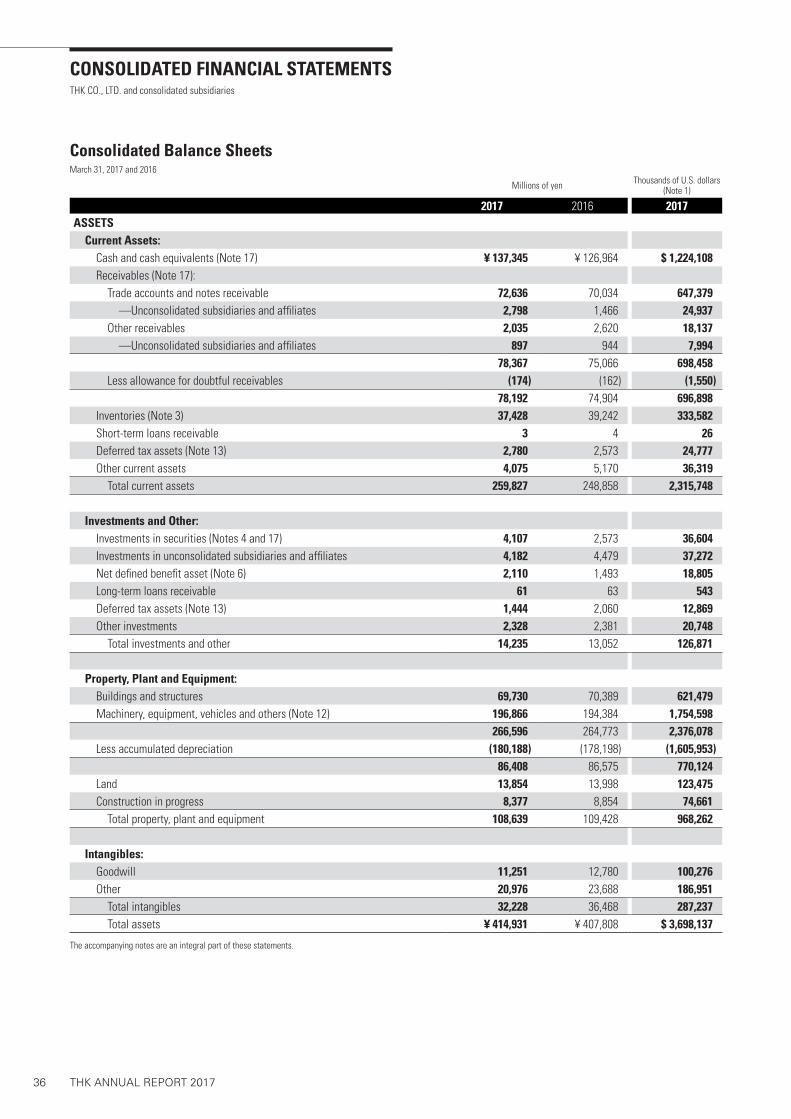
CONSOLIDATED FINANCIAL STATEMENTS
Consolidated Balance SheetsMarch 31, 2017 and 2016
Millions of yen Thousands of U.S. dollars (Note 1)
2017 2016 2017ASSETS Current Assets: Cash and cash equivalents (Note 17) ¥ 137,345 ¥ 126,964 $ 1,224,108 Receivables (Note 17): Trade accounts and notes receivable 72,636 70,034 647,379 —Unconsolidated subsidiaries and affiliates 2,798 1,466 24,937 Other receivables 2,035 2,620 18,137 —Unconsolidated subsidiaries and affiliates 897 944 7,994
78,367 75,066 698,458 Less allowance for doubtful receivables (174) (162) (1,550)
78,192 74,904 696,898 Inventories (Note 3) 37,428 39,242 333,582 Short-term loans receivable 3 4 26 Deferred tax assets (Note 13) 2,780 2,573 24,777 Other current assets 4,075 5,170 36,319 Total current assets 259,827 248,858 2,315,748
Investments and Other: Investments in securities (Notes 4 and 17) 4,107 2,573 36,604 Investments in unconsolidated subsidiaries and affiliates 4,182 4,479 37,272 Net defined benefit asset (Note 6) 2,110 1,493 18,805 Long-term loans receivable 61 63 543 Deferred tax assets (Note 13) 1,444 2,060 12,869 Other investments 2,328 2,381 20,748 Total investments and other 14,235 13,052 126,871
Property, Plant and Equipment: Buildings and structures 69,730 70,389 621,479 Machinery, equipment, vehicles and others (Note 12) 196,866 194,384 1,754,598
266,596 264,773 2,376,078 Less accumulated depreciation (180,188) (178,198) (1,605,953)
86,408 86,575 770,124 Land 13,854 13,998 123,475 Construction in progress 8,377 8,854 74,661 Total property, plant and equipment 108,639 109,428 968,262
Intangibles: Goodwill 11,251 12,780 100,276 Other 20,976 23,688 186,951 Total intangibles 32,228 36,468 287,237 Total assets ¥ 414,931 ¥ 407,808 $ 3,698,137
The accompanying notes are an integral part of these statements.

THK ANNUAL REPORT 2017 37
The accompanying notes are an integral part of these statements.
Millions of yen Thousands of U.S. dollars (Note 1)
2017 2016 2017LIABILITIES AND NET ASSETS Current Liabilities: Current portion of long-term debt (Notes 5 and 17) ¥ 15,185 ¥ 2,253 $ 135,338 Payables (Note 17): Trade accounts and notes payable 41,728 35,750 371,907 —Unconsolidated subsidiaries and affiliates 960 923 8,556 Other payables 3,346 7,930 29,821 —Unconsolidated subsidiaries and affiliates 37 145 329
46,073 44,750 410,632 Income taxes payable 3,865 806 34,447 Accrued bonuses to employees 3,398 3,193 30,285 Other accrued expenses 6,599 6,678 58,814 Lease obligations 147 190 1,310 Other current liabilities 5,610 1,699 50,000 Total current liabilities 80,880 59,572 720,855
Long-term Liabilities: Long-term debt (Notes 5 and 17) 67,480 83,280 601,426 Reserve for directors’ and corporate auditors’ retirement benefits 116 129 1,033 Reserve for product warranty 129 142 1,149 Long-term lease obligations 156 234 1,390 Net defined benefit liability (Note 6) 7,827 7,195 69,759 Deferred tax liabilities (Note 13) 5,359 5,488 47,762 Other liabilities 1,440 1,224 12,834 Total long-term liabilities 82,510 97,695 735,383
Commitment and Contingent Liabilities (Notes 7 and 8)
Net Assets (Note 9): Shareholders’ equity Common stock Authorized: 465,877,700 shares; Issued: 133,856,903 shares
as of March 31, 2017 and 2016 34,606 34,606 308,431
Additional paid-in capital 44,584 44,584 397,361 Retained earnings 176,617 165,076 1,574,126 Treasury stock, at cost: 7,285,746 shares and 7,269,394 shares
as of March 31, 2017 and 2016, respectively (13,991) (13,950) (124,696)
Total shareholders’ equity 241,817 230,317 2,155,231 Accumulated other comprehensive income: Net unrealized gain on available-for-sale securities 1,585 665 14,126 Foreign currency translation adjustments 6,793 17,759 60,543 Remeasurements of defined benefit plans (1,256) (1,394) (11,194) Total accumulated other comprehensive income 7,122 17,030 63,475 Non-controlling interests 2,600 3,192 23,172 Total net assets 251,540 250,540 2,241,889
Total liabilities and net assets ¥ 414,931 ¥ 407,808 $ 3,698,137

38 THK ANNUAL REPORT 2017
CONSOLIDATED FINANCIAL STATEMENTS
Millions of yen Thousands of U.S. dollars (Note 1)
2017 2016 2017Net Sales ¥ 273,577 ¥ 240,478 $ 2,438,297Cost of Sales (Note 11) 203,112 172,711 1,810,267 Gross profit 70,464 67,766 628,021
Selling, General and Administrative Expenses (Notes 10 and 11) 45,811 44,597 408,297 Operating income 24,653 23,169 219,723
Non-Operating Income (Expenses): Interest and dividend income 497 485 4,429 Interest expenses (397) (426) (3,538) Foreign exchange loss, net (2,942) (5,716) (26,221) Equity in earnings of an affiliate 524 644 4,670 Rental income 403 387 3,591 (Loss) gain on sales and disposal of property, plant and equipment, net (341) 472 (3,039) Other, net 659 595 5,873
(1,596) (3,557) (14,224) Income before income taxes 23,057 19,612 205,499
Income Taxes (Note 13) Current 6,447 5,289 57,459 Deferred (64) 1,073 (570) Total income taxes 6,383 6,363 56,889
Net income 16,673 13,249 148,600
Net loss attributable to non-controlling interests (58) (325) (516)Net income attributable to shareholders of THK CO., LTD. ¥ 16,731 ¥ 13,575 $ 149,117
Millions of yen Thousands of U.S. dollars (Note 1)
2017 2016 2017Net Income ¥ 16,673 ¥ 13,249 $ 148,600
Other Comprehensive Loss (Note 14): Net unrealized gain (loss) on available-for-sale securities 920 (643) 8,199 Foreign currency translation adjustments (10,990) (4,818) (97,950) Remeasurements of defined benefit plans 171 (1,223) 1,524 Share of other comprehensive loss of an affiliate accounted
for under the equity method (542) (565) (4,830)
Total other comprehensive loss (10,441) (7,250) (93,057)
Comprehensive Income 6,231 5,999 55,534 Attributable to: Shareholders of THK CO., LTD. 6,823 6,519 60,811 Non-controlling interests ¥ (591) ¥ (520) $ (5,267)
Consolidated Statements of IncomeYears ended March 31, 2017 and 2016
Consolidated Statements of Comprehensive IncomeYears ended March 31, 2017 and 2016
The accompanying notes are an integral part of these statements.
The accompanying notes are an integral part of these statements.

THK ANNUAL REPORT 2017 39
Millions of yenShareholders’ equity
Common stock Additional paid-in capital
Retained earnings
Treasury stock, at cost
Total shareholders’ equity
Balance at April 1, 2015 ¥ 34,606 ¥ 44,584 ¥ 158,463 ¥ (13,943) ¥ 223,711Cash dividends — — (6,962) — (6,962)Net income attributable to shareholders of THK CO., LTD. — — 13,575 — 13,575Purchase of treasury stock — — — (6) (6)Disposal of treasury stock — — — 0 0Net changes of items other than shareholders’ equity — — — — —Balance at March 31, 2016 ¥ 34,606 ¥ 44,584 ¥ 165,076 ¥ (13,950) ¥ 230,317Cash dividends — — (5,190) — (5,190)Net income attributable to shareholders of THK CO., LTD. — — 16,731 — 16,731Purchase of treasury stock — — — (41) (41)Net changes of items other than shareholders’ equity — — — — —Balance at March 31, 2017 ¥ 34,606 ¥ 44,584 ¥ 176,617 ¥ (13,991) ¥ 241,817
Thousands of U.S. dollars (Note 1)Shareholders’ equity
Common stock Additional paid-in capital
Retained earnings
Treasury stock, at cost
Total shareholders’ equity
Balance at March 31, 2016 $ 308,431 $ 397,361 $ 1,471,265 $ (124,331) $ 2,052,736Cash dividends — — (46,256) — (46,256)Net income attributable to shareholders of THK CO., LTD. — — 149,117 — 149,117Purchase of treasury stock — — — (365) (365)Net changes of items other than shareholders’ equity — — — — —Balance at March 31, 2017 $ 308,431 $ 397,361 $ 1,574,126 $ (124,696) $ 2,155,231
Millions of yenAccumulated other comprehensive income
Net unrealized gain on available-for-sale
securities
Foreign currency translation
adjustments
Remeasurements of defined benefit
plans
Total accumulated other comprehensive
income
Non-controlling interests
Total net assets
Balance at April 1, 2015 ¥ 1,312 ¥ 22,940 ¥ (166) ¥ 24,086 ¥ 2,701 ¥ 250,498Cash dividends — — — — — (6,962)Net income attributable to shareholders of THK CO., LTD. — — — — — 13,575Purchase of treasury stock — — — — — (6)Disposal of treasury stock — — — — — 0Net changes of items other than shareholders’ equity (646) (5,181) (1,227) (7,055) 490 (6,565)Balance at March 31, 2016 ¥ 665 ¥ 17,759 ¥ (1,394) ¥ 17,030 ¥ 3,192 ¥ 250,540Cash dividends — — — — — (5,190)Net income attributable to shareholders of THK CO., LTD. — — — — — 16,731Purchase of treasury stock — — — — — (41)Net changes of items other than shareholders’ equity (920) (10,965) 137 (9,907) (591) (10,499)Balance at March 31, 2017 ¥ 1,585 ¥ 6,793 ¥ (1,256) ¥ 7,122 ¥ 2,600 ¥ 251,540
Thousands of U.S. dollars (Note 1)Accumulated other comprehensive income
Net unrealized gain on available-for-sale
securities
Foreign currency translation
adjustments
Remeasurements of defined benefit
plans
Total accumulated other comprehensive
income
Non-controlling interests
Total net assets
Balance at March 31, 2016 $ 5,926 $ 158,279 $ (12,424) $ 151,782 $ 28,449 $ 2,232,976Cash dividends — — — — — (46,256)Net income attributable to shareholders of THK CO., LTD. — — — — — 149,117Purchase of treasury stock — — — — — (365)Net changes of items other than shareholders’ equity (8,199) (97,727) 1,221 (88,297) (5,267) (93,573)Balance at March 31, 2017 $ 14,126 $ 60,543 $ (11,194) $ 63,475 $ 23,172 $ 2,241,889
Consolidated Statements of Changes in Net AssetsYears ended March 31, 2017 and 2016
The accompanying notes are an integral part of these statements.

40 THK ANNUAL REPORT 2017
CONSOLIDATED FINANCIAL STATEMENTS
Millions of yen Thousands of U.S. dollars (Note 1)
2017 2016 2017Cash Flows from Operating Activities: Income before income taxes ¥ 23,057 ¥ 19,612 $ 205,499 Adjustments: Depreciation and amortization 13,185 13,643 117,513 Amortization of goodwill 978 664 8,716 Interest and dividend income (497) (485) (4,429) Interest expenses 397 426 3,538 Foreign exchange loss, net 1,409 2,659 12,557 Equity in earnings of an affiliate (524) (644) (4,670) Loss (gain) on sales and disposal of property, plant and equipment, net 341 (472) 3,039 Changes in assets and liabilities: Increase in accounts and notes receivable (5,906) (1,318) (52,638) Increase in inventories 422 (3,386) 3,761 Increase in accounts and notes payable 7,416 1,094 66,096 Increase in provisions 172 13 1,532 Increase in net defined benefit liability 421 75 3,752 Other, net 1,819 992 16,212 Subtotal 42,693 32,875 380,508 Interest and dividend received 480 504 4,278 Interest paid (351) (508) (3,128) Income taxes paid (2,646) (13,117) (23,582) Net cash provided by operating activities 40,175 19,753 358,065
Cash Flows from Investing Activities: Purchase of property, plant and equipment and intangibles (17,482) (15,522) (155,811) Proceeds from sales of property, plant and equipment 20 1,743 178 Increase in investments in securities, unconsolidated subsidiaries and affiliates (238) (67) (2,121) Increase in loans receivable (125) (11) (1,114) Payment for acquisition of subsidiaries’ shares resulting in change in scope of consolidation — (24,379) — Payment for transfer of business — (24,161) — Payment for insurance fund — (671) — Cancellation of insurance fund 11 — 98 Other, net (145) 385 (1,292) Net cash used in investing activities (17,960) (62,685) (160,071)
Cash Flows from Financing Activities: Proceeds from long-term debt — 22,534 — Repayment of long-term debt (2,185) (7,000) (19,474) Proceeds from issuance of corporate bonds — 10,000 — Cash dividends (5,185) (6,953) (46,212) Proceeds from payment from non-controlling shareholders — 1,011 — Purchase of treasury stock (41) (6) (365) Proceeds from sales of treasury stock — 0 — Repayment of lease obligations (137) (321) (1,221) Payment for acquisition of subsidiaries’ shares not resulting in change in
scope of consolidation — (10) —
Net cash (used in) provided by financing activities (7,548) 19,252 (67,272)
Foreign Currency Translation Adjustments on Cash and Cash Equivalents (4,285) (4,596) (38,190)Net Increase (Decrease) in Cash and Cash Equivalents 10,380 (28,275) 92,513 Cash and Cash Equivalents at Beginning of Year 126,964 155,239 1,131,586 Cash and Cash Equivalents at End of Year ¥ 137,345 ¥ 126,964 $ 1,224,108
Consolidated Statements of Cash FlowsYears ended March 31, 2017 and 2016
The accompanying notes are an integral part of these statements.
THK ANNUAL REPORT 2017 41
NOTES TO CONSOLIDATED FINANCIAL STATEMENTSTHK CO., LTD. and consolidated subsidiaries
1. Basis of Presenting Consolidated Financial Statements
The accompanying consolidated financial statements of THK CO., LTD. (the “Company”) and its consolidated subsidiaries have been prepared in accordance with the provisions set forth in the Financial Instruments and Exchange Act of Japan and its related accounting regulations, and in con-formity with accounting principles generally accepted in Japan (“Japanese GAAP”), which are different in certain respects from International Financial Reporting Standards as to application and disclosure requirements. The accompanying consolidated financial statements include certain reclassifications and rearrangements to present them in a form that is more familiar to readers outside Japan. Certain amounts previously reported may have been reclassified to conform to the current year financial state-ment presentation. Such reclassifications have been made solely for com-parability of the consolidated financial statements, and do not affect net income or net assets. In addition, the notes to the consolidated financial statements include information that is not required under Japanese GAAP, but which is provided herein as additional information.
U.S. dollar amounts presented in the consolidated financial state-ments are included solely for the convenience of the readers. These trans-lations should not be construed as presentations that the yen amounts actually represent or could be converted into U.S. dollars at that or any other rate. For this purpose, the rate of ¥112.20 to U.S. $1, the approximate rate of exchange prevailing in Tokyo on March 31, 2017, have been used for the translation of the accompanying consolidated financial statements as of March 31, 2017 and for the year then ended. As permitted by the Financial Instruments and Exchange Act, amounts of less than one million yen have been omitted. U.S. dollar amounts are translated from such yen amounts and amounts of less than one thousand dollars have been omitted. As a result, the total amounts in Japanese yen and translated U.S. dollars shown in the consolidated financial statements and notes to the consolidated financial statements do not necessarily agree with the sum of the individual amounts.
2. Summary of Significant Accounting Policies
(a) ConsolidationThe accompanying consolidated financial statements include the accounts of the Company and its subsidiaries that are controlled by the Company. Under the effective control approach, all majority-owned companies are to be consolidated. Additionally, those companies over which the Company is able to directly or indirectly exercise control are to be consolidated even if the holding ratio equals 50% or less. All significant inter-company transaction accounts and unrealized inter-company profits are eliminated upon consolidation. For consol-idated subsidiaries and an affiliate whose closing dates are different from that of the Company, certain adjustments necessary for consoli-dation have been made. The Company had 38 subsidiaries as of March 31, 2017 and 36 sub-sidiaries as of March 31, 2016. The consolidated financial statements for the years ended March 31, 2017 and 2016 include the accounts of the Company and its 35 (33 in 2016) consolidated subsidiaries (collectively, “the Group”). Investments in the remaining three subsidiaries including THK BRAZIL INDUSTRIA E COMERCIO LTDA are not consolidated and stated at cost, because these companies are small in size and if these companies had been consolidated, the effect on the consolidated finan-cial statements would not have been significant.
(Changes in the scope of consolidation)Changes in the scope of consolidation for the year ended March 31, 2017 were as follows:THK CAPITAL UNLIMITED COMPANY and THK FINANCE UNLIMITED COMPANY, which were newly established during the year ended March 31, 2017, were included in the scope of consolidation. The excess of the cost of acquisition over the fair value of the net assets of an acquired subsidiary (goodwill) at the date of acquisition is amortized over 5 to 15 years by the straight-line method. The fiscal year closing date of 29 overseas consolidated subsidiaries,
excluding THK India Pvt. Ltd., is December 31. In consolidating these accounts, financial statements as of and for the year ended December 31 are used after making necessary adjustments for consolidation to the significant intercompany transactions during the period between January 1 and March 31. The fiscal year closing date of other consol-idated subsidiaries is March 31.
Unification of Accounting Policies Applied to Foreign Subsidiaries for the Consolidated Financial StatementsUnder Japanese GAAP; (1) the accounting policies and procedures applied to a parent company and its subsidiaries for similar transac-tions and events under similar circumstances should in principle be unified for the preparation of the consolidated financial statements, (2) financial statements prepared by foreign subsidiaries in accordance with either International Financial Reporting Standards or the gener-ally accepted accounting principles in the United States of America tentatively may be used for the consolidation process, (3) however, the following items should be adjusted in the consolidation process so that net income is accounted for in accordance with Japanese GAAP unless they are immaterial; 1) amortization of goodwill; 2) scheduled amortization of actuarial gain or loss of pensions that has been directly recorded in net assets; 3) expensing capitalized development costs of research and development; 4) cancellation of the fair value model accounting for property, plant, and equipment and investment prop-erties and incorporation of the cost model accounting; 5) exclusion of non-controlling interests from net income, if contained. The Company had three affiliates and three unconsolidated sub-sidiaries as of March 31, 2017 and 2016. Under the control concept, companies over which the Company directly or indirectly has the abil-ity to exercise significant influence are accounted for using the equity method. For the years ended March 31, 2017 and 2016, the Company has applied the equity method to investment in SAMICK THK CO., LTD.
42 THK ANNUAL REPORT 2017
NOTES TO CONSOLIDATED FINANCIAL STATEMENTS
Investments in the remaining affiliates and unconsolidated subsidiar-ies (THK BRAZIL INDUSTRIA E COMERCIO LTDA, etc.) are stated at cost. If the equity method had been applied to the investments in those companies, the effect on the consolidated financial statements would not have been significant.
(b) Translation of Foreign Currency Financial StatementsAssets and liabilities of foreign subsidiaries and an affiliate are trans-lated into Japanese yen at exchange rates prevailing at the balance sheet date. Net assets except for minority interest account at begin-ning of year are translated into Japanese yen at historical rates. Profit and loss accounts are translated into Japanese yen using the average exchange rate during the year. Differences in yen amounts arising from use of different rates are presented as foreign currency translation adjustments in the accumulated other comprehensive income of net assets section.
(c) InventoriesInventories, except for work in process, are stated at cost determined principally by the gross average method. Work in process for ordered products is stated at cost determined principally by the specific iden-tified cost method. If acquisition cost of an inventory exceeds its net selling value, the carrying amount of such inventory is written down to its net selling value and the difference is charged to income.
(d) Financial InstrumentsSecuritiesInvestments in securities are classified and accounted for, depending on management's intent, as follows: (1) trading securities, which are held for the purpose of earning capital gains in the near term, are reported at fair value, and the related unrealized gains and losses are included in earnings; (2) held-to-maturity debt securities, which are expected to be held to maturity with the positive intent and ability to hold to maturity, are reported at amortized cost; and (3) available-for-sale securities, which are not classified as either of the aforemen-tioned securities, are reported at fair value, with unrealized gains and losses, net of applicable taxes, reported as a separate component of net assets. If the fair value of available-for-sale securities is not read-ily determinable, such investments are stated at cost. With respect to equity investments in investment business limited partnerships, which are regarded as securities pursuant to paragraph 2 of Article 2 of the Financial Instruments and Exchange Act, such investments are stated using net equity based on the recent available financial statements as of the reporting dates which are provided by the partnership agreements. For other than temporary declines in fair value, investments in securities are written down to the net realizable value and the differ-ence is charged to income.
Derivatives and Hedging AccountingThe Group uses a variety of derivative financial instruments, including forward foreign exchange contracts, interest rate swap contracts and interest rate and currency swap contracts to manage foreign exchange
risks and interest rate risks. The Company has established a control environment, which includes policies and procedures for risk assess-ments and approval, and reporting and monitoring of transactions involving derivative financial instruments. The Group does not hold or issue derivative financial instruments for speculative purposes.
Hedge accounting method:For forward foreign exchange contracts which qualify the required con-dition under the related Japanese accounting standards, the hedged foreign currency denominated receivables and payables are translated at the contract rates and no gains or losses are recognized. For interest rate swap contracts which qualify the required condi-tion under the related Japanese accounting standards, the differential paid or received under the swap contracts are recognized and included in the interest income or expenses. For interest rate and currency swap contracts which qualify the required condition under the related Japanese accounting standards, the hedged foreign currency assets and liabilities are translated at the contract rates and no gains or losses on the translation are recognized and the differential paid or received on interest rates under swap con-tracts are recognized and included in the interest income or expenses.
Hedging instruments and hedged items are as follows:
Hedging policy:Forward foreign exchange contracts aim to hedge foreign exchange fluctuation risk and fixed cash flows associated with collection of and payment for foreign currency denominated receivables and payables. Interest rate swap contracts aim to hedge interest rate fluctuation risk associated with bank loans. Interest rate and currency swap contracts aim to hedge foreign exchange fluctuation risk and interest rate fluctuation risk associated with foreign currency denominated bank loans.
Assessment of hedge effectiveness:With respect to forward foreign exchange contracts, assessment of hedge effectiveness is omitted since significant conditions concerning hedging instruments and hedged items are identical and it is assumed in advance that those contracts will offset market fluctuations or cash flow fluctuations continuously on and after the beginning of the hedge. With respect to interest rate swap contracts, assessment of hedge effectiveness is omitted since they meet the requirements for special hedge accounting treatments. With respect to interest rate and currency swap contracts, assess-ment of hedge effectiveness is omitted since they meet the requirements
Hedging instruments: Hedged items:
Forward foreign exchange contracts
Foreign currency denominated receivables and payables
Interest rate swap contracts Interest on bank loans
Interest rate and currency swap contracts
Foreign currency denominated loans and interest thereof

THK ANNUAL REPORT 2017 43
for applicable special accounting treatments as mentioned above.
(e) Property, Plant and Equipment (except for leased assets)Property, plant and equipment of the Company and its domestic con-solidated subsidiaries are depreciated using the straight-line method. The range of useful lives is principally from 5 to 50 years for build-ings and structures and from 4 to 12 years for machinery, equipment and vehicles. Normal repairs and maintenance, including minor renewals and improvements, are charged to income as incurred.
(f) IntangiblesIntangible assets are amortized using the straight-line method. Software for internal use of the Company and domestic consoli-dated subsidiaries is amortized on a straight-line basis over a period of five years, the estimated useful life of the software.
(g) LeaseLeased assets under finance lease arrangements that do not transfer ownership are depreciated using the straight-line method over the lease term as the useful life with the residual value deemed to be zero. (h) Allowance for Doubtful ReceivablesAllowance for doubtful receivables is stated in amounts considered to be appropriate based on the Group’s past credit loss experience and an evaluation of potential losses in the receivables outstanding.
(i) Accrued Bonuses to Employees Accrued bonuses to employees are stated at an estimated amount to be paid in the following year based on the employees’ compensation in the current year.
(j) Reserve for Directors’ and Corporate Auditors’ Retirement Benefits
Reserve for directors’ and corporate auditors’ retirement benefits rep-resents the liability at amount that would be required if all eligible directors and corporate auditors retired at each balance sheet date.
(k) Reserve for Product WarrantyReserve for product warranty is stated at amount based on the Group’s past experience in order to cover possible warranty liabilities.
(l) Accounting for Employees’ Retirement Benefits1) Methods to determine the estimated retirement benefits to be
attributed to the reporting period The benefit formula is employed for the method of determining the
estimated retirement obligation to be attributed to the reporting period.2) Amortization of actuarial gains/losses and prior service cost Prior service cost are amortized pro rata in the years from the fol-
lowing fiscal year by the straight-line method based on the average remaining service years (15 years) of the employees when incurred.
Actuarial gains/losses are amortized pro rata in the years from the following fiscal year by the straight-line method based on the
average remaining service years (from 5 to 18 years) of the employ-ees when incurred.
3) Application of the simplified method for small businesses For certain consolidated subsidiaries, a simplified method is applied
for the calculation of retirement benefit obligations and retirement benefit expenses whereby the necessary retirement benefit pro-visions for voluntary resignations at the end of the consolidated fiscal year are recorded as retirement benefit obligations.
(m) Foreign Currency TranslationAll monetary assets and liabilities denominated in foreign currencies, whether long-term or short-term, are translated into Japanese yen at exchange rates prevailing at the balance sheet date. Gains and losses from translation are recognized in the consolidated statements of income to the extent that they are not hedged by forward foreign exchange contracts.
(n) Consumption TaxesJapanese consumption taxes are levied at the flat rate of eight per-cent on all domestic consumption of goods and services, with certain exemptions. The consumption taxes received by the Company and domestic subsidiaries on sales are excluded from net sales but are recorded as a liability. The consumption taxes paid by the Company and domestic subsidiaries on purchases of goods and services are excluded from costs or expenses but are recorded as an asset. The net balance of liability after offsetting against assets is included in “Other current liabilities” in the consolidated balance sheets.
(o) Income TaxesJapanese income taxes consist of corporate income taxes, local inhab-itants’ taxes and enterprise taxes. Provision for income taxes is computed based on the pretax income included in the consolidated statements of income. The asset and liability approach is used to recognize deferred tax assets and lia-bilities for expected future tax consequences of temporary differences between the carrying amounts and the tax bases of assets and liabili-ties. Deferred taxes are determined by applying currently enacted tax laws to the temporary differences.
(p) Cash and Cash EquivalentsCash and cash equivalents are composed of cash on hand, bank depos-its that can be withdrawn on demand and short-term investments with original maturity of three months or less and which carry a minor risk of fluctuations in value.
(q) Per Share InformationNet assets per share is computed by dividing net assets except minority interests at the year-end by the number of common stock out-standing at the year-end. Net income per share is computed by dividing net income attrib-utable to common shareholders by the weighted-average number of common shares outstanding for the period. Diluted net income per share reflects the potential dilution that

44 THK ANNUAL REPORT 2017
NOTES TO CONSOLIDATED FINANCIAL STATEMENTS
could occur if securities were exercised or converted into common stock. Diluted net income per share of common stock assumes full conversion of the outstanding convertible notes and bonds at the beginning of the year (or at the time of issuance) with an applicable adjustment for related interest expense, net of tax, and full exercise of outstanding warrants.
(r) Accounting ChangesAccounting changes which are difficult to distinguish from changes in accounting estimatesRegarding the depreciation method of property, plant and equipment (excluding lease assets), the Company and its domestic consolidated subsidiaries had adopted mainly the declining-balance method and certain U.S. consolidated subsidiaries had adopted the accelerated declining-balance method, but effective from current fiscal year, they changed their depreciation method to the straight-line method. The Group judged that the straight-line method as a depreciation method for property, plant and equipment would reflect more appropri-ately its actual economic status because the property, plant and equip-ment are expected to operate stably, after the Group investigated the actual status of use of the property, plant and equipment from the viewpoint of unification of the Group accounting policies of domestic and foreign companies as the Group developed global activities in the recent years. As a result of this change, operating income and income before taxes for the year ended March 31, 2017 increased by ¥1,582 million
($14,038 thousand), respectively, compared to those amounts under the previous method.
(s) Changes in Accounting EstimatesChanges in the estimates of asset retirement obligationThe Company and certain domestic consolidated subsidiaries decided to relocate the head office in the year ended March 31, 2017. Pursuant to this decision, regarding asset retirement obligation which rep-resents the restoring costs in accordance with the real estate rent contract of the head office, the uncollectible amounts of key money on the building rent contract are reasonably estimated and the amounts attributed to the current fiscal year are charged to income in place of recording asset retirement obligation. As a result of this change, operating income and income before taxes for the year ended March 31, 2017 decreased by ¥13 million ($115 thousand), respectively, compared to those amounts under the previous method.
(t) Additional InformationApplication of Implementation Guidance on Recoverability of Deferred Tax Assets The Company has applied “Implementation Guidance on Recoverability of Deferred Tax Assets” (Accounting Standards Board of Japan (“ASBJ”) Guidance No. 26 issued on March 28, 2016) from the year ended March 31, 2017.
Inventories as of March 31, 2017 and 2016 comprised of the following:
3. Inventories
Millions of yen Thousands of U.S. dollars
2017 2016 2017Merchandise and finished goods ¥ 12,860 ¥ 16,619 $ 114,616Work in process 8,607 7,352 76,711Raw materials and supplies 15,960 15,270 142,245 Total ¥ 37,428 ¥ 39,242 $ 333,582
As of March 31, 2017 and 2016, available-for-sale securities with available fair value were as follows:
4. Investments in Securities
Millions of yen
2017Carrying amount Acquisition cost Net unrealized gain (loss)
Carrying amount (fair value) exceeds acquisition cost: Equity securities ¥ 3,307 ¥ 1,028 ¥ 2,279Carrying amount (fair value) does not exceed acquisition cost: Equity securities 366 430 (64) Total ¥ 3,674 ¥ 1,459 ¥ 2,215
Millions of yen
2016Carrying amount Acquisition cost Net unrealized gain (loss)
Carrying amount (fair value) exceeds acquisition cost: Equity securities ¥ 2,096 ¥ 1,006 ¥ 1,089Carrying amount (fair value) does not exceed acquisition cost: Equity securities 258 435 (176) Total ¥ 2,354 ¥ 1,442 ¥ 912

THK ANNUAL REPORT 2017 45
As of March 31, 2017 and 2016, available-for-sale securities whose fair value is not reliably determinable were as follows:
Thousands of U.S. dollars
2017Carrying amount Acquisition cost Net unrealized gain (loss)
Carrying amount (fair value) exceeds acquisition cost: Equity securities $ 29,474 $ 9,162 $ 20,311 Carrying amount (fair value) does not exceed acquisition cost: Equity securities 3,262 3,832 (570) Total $ 32,745 $ 13,003 $ 19,741
Millions of yen Thousands of U.S. dollars
2017 2016 2017Available-for-sale securities Unlisted equity securities ¥ 193 ¥ 173 $ 1,720 Investments in investment business limited partnerships 239 45 2,130
These unlisted equity securities and investments in investment busi-ness limited partnerships are not included in “Available-for-securities” in the above table. “Acquisition cost” in the above table refers to the cost after deducting impairment losses. No impairment losses on available-for-sale securities value were recognized during the years ended March 31, 2017 and 2016. When the fair value of each issue of securities declined more than 50% of the acquisition cost, impairment losses would be recognized.
When the fair value declined between 30% and 50% of the acquisi-tion cost, whether the impairment losses should be recognized or not is determined by considering the financial positions as of the latest fiscal year end and operating results for the past two fiscal years and comparing the average month-end closing market price during the past 24 months with the acquisition cost by each issue. There were no available-for-sale securities sold during the years ended March 31, 2017 and 2016.
Long-term debt as of March 31, 2017 and 2016 consisted of the following:
5. Long-term Debt
Millions of yen
2017Due within 1 year Due after 1 to 2 years Due after 2 to 3 years Due after 3 to 4 years Due after 4 to 5 years Due after 5 years
Bonds ¥ 13,000 ¥ 20,000 ¥ — ¥ 20,000 ¥ — ¥ —Bank loans 2,185 2,185 12,185 2,185 2,185 8,740 Total ¥ 15,185 ¥ 22,185 ¥ 12,185 ¥ 22,185 ¥ 2,185 ¥ 8,740
Thousands of U.S. dollars
2017Due within 1 year Due after 1 to 2 years Due after 2 to 3 years Due after 3 to 4 years Due after 4 to 5 years Due after 5 years
Bonds $ 115,864 $ 178,253 $ — $ 178,253 $ — $ —Bank loans 19,474 19,474 108,600 19,474 19,474 77,896 Total $ 135,338 $ 197,727 $ 108,600 $ 197,727 $ 19,474 $ 77,896
Millions of yen Thousands of U.S. dollars
2017 2016 2017Bank loans 0.076% due in 2026 ¥ 29,665 ¥ 32,533 $ 264,393Corporate bonds issued by the Company: 0.715% Unsecured straight bonds due in 2017 13,000 13,000 115,864 0.850% Unsecured straight bonds due in 2018 10,000 10,000 89,126 0.430% Unsecured straight bonds due in 2018 10,000 10,000 89,126 0.660% Unsecured straight bonds due in 2020 10,000 10,000 89,126 0.296% Unsecured straight bonds due in 2020 10,000 10,000 89,126
¥ 82,665 ¥ 85,533 $ 736,764Current portion (15,185) (2,253) (135,338)Long-term debt, less current portion ¥ 67,480 ¥ 83,280 $ 601,426
Annual maturities of long-term debt as of March 31, 2017 are as follows:

46 THK ANNUAL REPORT 2017
NOTES TO CONSOLIDATED FINANCIAL STATEMENTS
1. Outline of the retirement benefit plans adoptedThe Company and consolidated subsidiaries adopt contributory and non-contributory defined benefit plans and defined contribution plans. Under the defined benefit corporate pension plans (all are contrib-utory), lump-sum severance benefits or pensions based on salaries and service years are provided.
Under lump-sum payment plans (all are non-contributory), lump-sum payments based on salaries and service years are provided. Under some defined benefit corporate pension plans and lump-sum payment plans of certain consolidated subsidiaries, net defined benefit liability and retirement benefit expenses are calculated using a simplified method.
6. Employees’ Retirement Benefits
2. Defined Benefit Plans(1) The changes in projected benefit obligations for the years ended March 31, 2017 and 2016, were as follows:
Millions of yen Thousands of U.S. dollars
2017 2016 2017Beginning balance of projected benefit obligation ¥ 23,725 ¥ 15,336 $ 211,452 Service cost 1,073 791 9,563 Interest cost 334 280 2,976 Actuarial differences 160 1,673 1,426 Retirement benefits paid (485) (354) (4,322) Increase due to business combinations — 6,305 — Other 35 (307) 311 Ending balance of projected benefit obligations ¥ 24,842 ¥ 23,725 $ 221,408
Millions of yen Thousands of U.S. dollars
2017 2016 2017Beginning balance of plan assets ¥ 18,023 ¥ 10,438 $ 160,632 Expected return on plan assets 545 361 4,857 Actuarial differences 264 (291) 2,352 Contribution from the employer 827 791 7,370 Retirement benefits paid (342) (267) (3,048) Increase due to business combinations — 7,368 — Impact from foreign exchanges (191) (378) (1,702)Ending balance of plan assets ¥ 19,126 ¥ 18,023 $ 170,463
Millions of yen Thousands of U.S. dollars
2017 2016 2017Contributory defined benefit obligations ¥ 23,749 ¥ 22,626 $ 211,666Plan assets (19,126) (18,023) (170,463)
4,623 4,603 41,203 Non-contributory defined benefit obligations 1,093 1,098 9,741 Net liability recorded in the consolidated balance sheet ¥ 5,716 ¥ 5,701 $ 50,944 Net defined benefit liability 7,827 7,195 69,759 Net defined benefit asset (2,110) (1,493) (18,805)Net liability recorded in the consolidated balance sheet ¥ 5,716 ¥ 5,701 $ 50,944
(2) The changes in plan assets for the years ended March 31, 2017 and 2016, were as follows:
(3) Reconciliation between the ending balances of defined benefit obligations and plan assets and net defined benefit liability recorded in the con-solidated balance sheet
THK ANNUAL REPORT 2017 47
Millions of yen Thousands of U.S. dollars
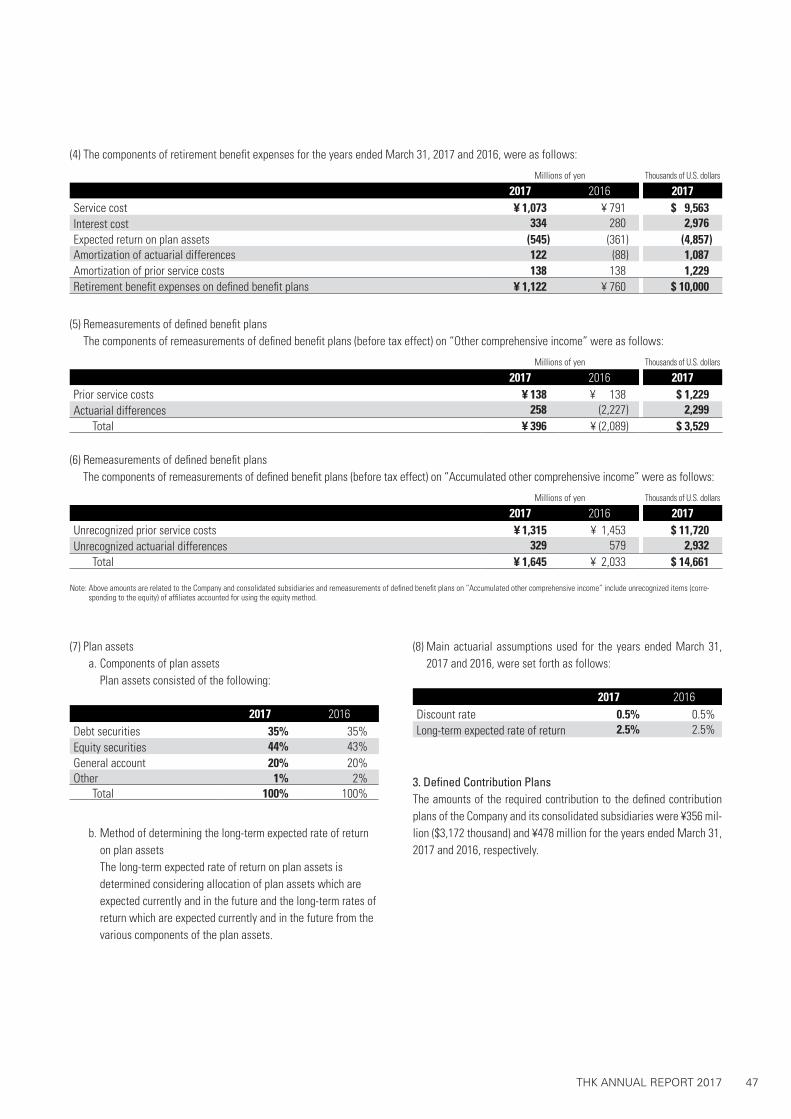
2017 2016 2017Service cost ¥ 1,073 ¥ 791 $ 9,563Interest cost 334 280 2,976 Expected return on plan assets (545) (361) (4,857)Amortization of actuarial differences 122 (88) 1,087 Amortization of prior service costs 138 138 1,229 Retirement benefit expenses on defined benefit plans ¥ 1,122 ¥ 760 $ 10,000
(4) The components of retirement benefit expenses for the years ended March 31, 2017 and 2016, were as follows:
(5) Remeasurements of defined benefit plans The components of remeasurements of defined benefit plans (before tax effect) on “Other comprehensive income” were as follows:
(6) Remeasurements of defined benefit plans The components of remeasurements of defined benefit plans (before tax effect) on “Accumulated other comprehensive income” were as follows:
(7) Plan assets a. Components of plan assets Plan assets consisted of the following:
b. Method of determining the long-term expected rate of return on plan assets
The long-term expected rate of return on plan assets is determined considering allocation of plan assets which are expected currently and in the future and the long-term rates of return which are expected currently and in the future from the various components of the plan assets.
(8) Main actuarial assumptions used for the years ended March 31, 2017 and 2016, were set forth as follows:
3. Defined Contribution PlansThe amounts of the required contribution to the defined contribution plans of the Company and its consolidated subsidiaries were ¥356 mil-lion ($3,172 thousand) and ¥478 million for the years ended March 31, 2017 and 2016, respectively.
Millions of yen Thousands of U.S. dollars
2017 2016 2017Prior service costs ¥ 138 ¥ 138 $ 1,229 Actuarial differences 258 (2,227) 2,299 Total ¥ 396 ¥ (2,089) $ 3,529
Millions of yen Thousands of U.S. dollars
2017 2016 2017Unrecognized prior service costs ¥ 1,315 ¥ 1,453 $ 11,720Unrecognized actuarial differences 329 579 2,932 Total ¥ 1,645 ¥ 2,033 $ 14,661
2017 2016Debt securities 35% 35%Equity securities 44% 43%General account 20% 20%Other 1% 2% Total 100% 100%
2017 2016Discount rate 0.5% 0.5%Long-term expected rate of return 2.5% 2.5%
Note: Above amounts are related to the Company and consolidated subsidiaries and remeasurements of defined benefit plans on “Accumulated other comprehensive income” include unrecognized items (corre-sponding to the equity) of affiliates accounted for using the equity method.

48 THK ANNUAL REPORT 2017
NOTES TO CONSOLIDATED FINANCIAL STATEMENTS
As of March 31, 2017 and 2016, the Group had committed lines of credit amounting to ¥15,000 million ($133,689 thousand). None of the committed lines of credit were used.
As of March 31, 2017 and 2016, the Group had no material contingent liabilities.
7. Committed Line of Credit
8. Contingent Liabilities
The changes in the number of issued shares of common stock and treasury stock during the years ended March 31, 2017 and 2016 were as follows:
An increase of 16,352 shares in treasury stock is due to acquisition of less than one share unit. The treasury stock in the above table includes treasury stock (shares issued by the Company) acquired by an affiliate accounted for using the equity method which is attributed to the Company.
An increase of 2,698 shares in treasury stock is due to acquisition of less than one share unit. A decrease of 50 shares in treasury stock is due to additional purchase requisition of less than one share unit. The treasury stock in the above table includes treasury stock (shares issued by the Company) acquired by an affiliate accounted for using the equity method which is attributed to the Company.
The Companies Act of Japan (the “Act”) requires that at least 50% of the paid-in capital of new share issues be transferred to the “Common stock” account and the amount not exceeding 50% of the paid-in capi-tal be included in capital surplus as “Additional paid-in capital.” Under the Act, companies can pay dividends at any time during the fiscal year in addition to the year-end dividend upon resolution at the shareholders’ meeting. Interim dividends may be paid at any time during the fiscal year upon resolution by the Board of Directors if the company has prescribed so in its articles of incorporation. The Act provides certain limitations on the amounts available for dividends or the purchase of treasury stock. The limitation is defined as the amount available for distribution to the shareholders, but the
amount of net assets after dividends must be maintained at no less than ¥3 million. The Act requires that an amount equal to 10% of dividends must be appropriated as a legal reserve or as additional paid-in capital depending on the equity account charged upon the payment of such dividends until the aggregate amount of legal reserve and additional paid-in capital equals 25% of the common stock. Under the Act, the total amount of additional paid-in capital and legal reserve may be reversed without limitation. The Act also provides that common stock, legal reserve, additional paid-in capital, other capital surplus and retained earnings can be transferred among the accounts under cer-tain conditions upon resolution of the shareholders.
9. Net Assets
Number of shares
April 1, 2015 Increase Decrease March 31, 2016
Outstanding shares issued: Common stock 133,856,903 — — 133,856,903Treasury stock: Common stock 7,266,746 2,698 50 7,269,394
Number of shares
April 1, 2016 Increase Decrease March 31, 2017
Outstanding shares issued: Common stock 133,856,903 — — 133,856,903Treasury stock: Common stock 7,269,394 16,352 — 7,285,746
THK ANNUAL REPORT 2017 49
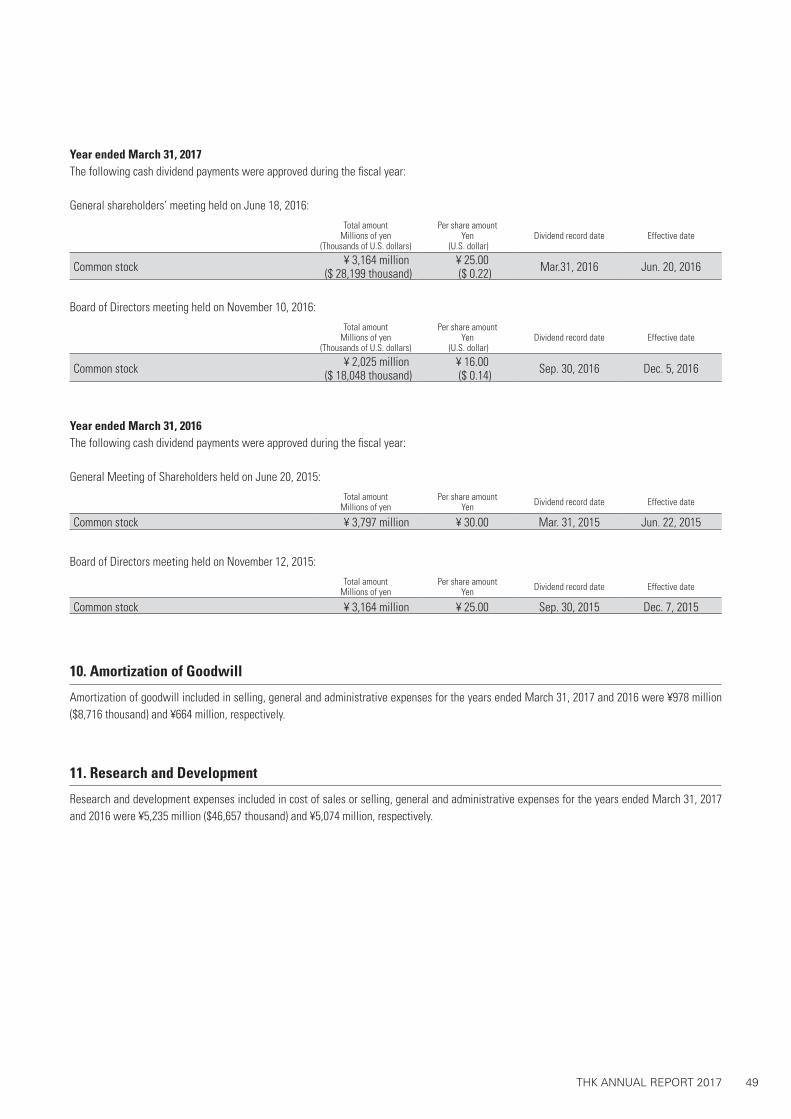
Amortization of goodwill included in selling, general and administrative expenses for the years ended March 31, 2017 and 2016 were ¥978 million ($8,716 thousand) and ¥664 million, respectively.
Research and development expenses included in cost of sales or selling, general and administrative expenses for the years ended March 31, 2017 and 2016 were ¥5,235 million ($46,657 thousand) and ¥5,074 million, respectively.
Year ended March 31, 2017The following cash dividend payments were approved during the fiscal year:
General shareholders’ meeting held on June 18, 2016:
Year ended March 31, 2016The following cash dividend payments were approved during the fiscal year:
General Meeting of Shareholders held on June 20, 2015:
Board of Directors meeting held on November 10, 2016:
Board of Directors meeting held on November 12, 2015:
10. Amortization of Goodwill
11. Research and Development
Total amountMillions of yen
(Thousands of U.S. dollars)
Per share amountYen
(U.S. dollar)Dividend record date Effective date
Common stock ¥ 3,164 million ($ 28,199 thousand)
¥ 25.00 ($ 0.22) Mar.31, 2016 Jun. 20, 2016
Total amountMillions of yen
Per share amountYen Dividend record date Effective date
Common stock ¥ 3,797 million ¥ 30.00 Mar. 31, 2015 Jun. 22, 2015
Total amountMillions of yen
(Thousands of U.S. dollars)
Per share amountYen
(U.S. dollar)Dividend record date Effective date
Common stock ¥ 2,025 million ($ 18,048 thousand)
¥ 16.00 ($ 0.14) Sep. 30, 2016 Dec. 5, 2016
Total amountMillions of yen
Per share amountYen Dividend record date Effective date
Common stock ¥ 3,164 million ¥ 25.00 Sep. 30, 2015 Dec. 7, 2015

50 THK ANNUAL REPORT 2017
The Company and its domestic subsidiaries are subject to Japanese national and local income taxes which, in the aggregate, resulted in a normal effective statutory tax rate of approximately 30.9% and 33.1% for the years ended March 31, 2017 and 2016, respectively.
As of March 31, 2017 and 2016, significant components of deferred tax assets and liabilities were as follows:
13. Income Taxes
Millions of yen Thousands of U.S. dollars
2017 2016 2017Deferred tax assets: Valuation loss of investments in affiliates ¥ 6,987 ¥ 6,987 $ 62,272 Net defined benefit liability 1,884 2,078 16,791 Tax loss carried forward 1,243 1,275 11,078 Accrued bonuses to employees 968 945 8,627 Unrealized gain on intercompany sales of inventories 934 870 8,324 Loss on devaluation of inventories 790 890 7,040 Unrealized gain on intercompany sales of property, plant and equipment 539 681 4,803 Accumulated depreciation 314 299 2,798 Enterprise tax payable 304 57 2,709 Retirement benefits payable to directors and corporate auditors 262 266 2,335 Accrued expenses 212 252 1,889 Impairment loss 92 95 819 Loss on devaluation of investments in securities 60 59 534 Allowance for doubtful receivables 43 42 383 Other 844 623 7,522 Total 15,483 15,425 137,994 Less: valuation allowance (9,577) (9,430) (85,356) Total deferred tax assets 5,905 5,995 52,629
Deferred tax liabilities: Adjustment to book value of a subsidiary due to fair value measurement at the inception of consolidation (1,911) (2,366) (17,032)
Unrealized gains on available-for-sale securities (1,867) (1,486) (16,639) Depreciation (1,729) (1,409) (15,409) Unrealized gains on land revaluation (1,175) (1,175) (10,472) Special depreciation reserve for tax purpose (32) (34) (285) Other (417) (393) (3,716) Total deferred tax liabilities (7,134) (6,865) (63,582) Net deferred tax (liabilities) assets ¥ (1,229) ¥ (870) $ (10,953)
a. Finance leases The Group mainly leases computer machines and peripheral devices (tools, furniture and fixtures) used at the head office and other locations. Leased assets under finance lease arrangements are depreciated using the straight-line method over the lease term as useful life with the residual
value deemed to be zero.
b. Operating leases Lease commitments under non-cancelable operating leases as of March 31, 2017 and 2016 were as follows:
12. Lease
Millions of yen Thousands of U.S. dollars
2017 2016 2017Due within one year ¥ 329 ¥ 535 $ 2,932Due after one year 541 510 4,821 Total ¥ 871 ¥ 1,046 $ 7,762
NOTES TO CONSOLIDATED FINANCIAL STATEMENTS

THK ANNUAL REPORT 2017 51
A reconciliation between the normal effective statutory tax rate and the actual effective tax rate reflected in the accompanying consolidated state-ments of income for the year ended March 31, 2017 was as follows (For the year ended March 31, 2016, it is omitted because the difference between the normal effective statutory tax rate and the actual effective tax rate is less than 5% of the normal effective statutory tax rate):
2017Normal effective statutory tax rate 30.9% Non-deductible items such as entertainment expenses 0.6 Non-taxable items such as dividends received (2.4) Amortization of goodwill 1.1 Equity in earnings of affiliates (0.7) Inhabitant per capita tax 0.3 Statutory tax rate difference between parent and subsidiaries (1.4) Tax credit for research and development (2.4) Special tax incentives (2.3) Valuation allowance 1.6 Investments in consolidated subsidiaries 2.3 Other 0.1Actual effective tax rate 27.7%
The components of other comprehensive loss for the years ended March 31, 2017 and 2016 were as follows:
14. Other Comprehensive Loss
Millions of yen Thousands of U.S. dollars
2017 2016 2017Net unrealized gain (loss) on available-for-sale securities: Gain (loss) recognized during the year ¥ 1,301 ¥ (936) $ 11,595 Reclassification adjustment to net income — 0 — Amount before tax effect 1,301 (936) 11,595 Tax effect (381) 292 (3,395) Net unrealized gain (loss) on available-for-sale securities 920 (643) 8,199
Foreign currency translation adjustments: Loss recognized during the year (10,990) (4,818) (97,950) Reclassification adjustment to net income — — — Amount before tax effect (10,990) (4,818) (97,950) Tax effect — — — Foreign currency translation adjustments (10,990) (4,818) (97,950)
Remeasurements of defined benefit plans Gain (loss) recognized during the year 136 (1,993) 1,212 Reclassification adjustment to net income 260 50 2,317 Amount before tax effect 396 (1,942) 3,529 Tax effect (225) 719 (2,005) Remeasurements of defined benefit plans 171 (1,223) 1,524
Share of other comprehensive loss of an affiliate accounted for under the equity method: Loss recognized during the year (542) (565) (4,830) Reclassification adjustment to net income — — — Share of other comprehensive loss of an affiliate accounted for under the equity method (542) (565) (4,830)
Total other comprehensive loss ¥ (10,441) ¥ (7,250) $ (93,057)

52 THK ANNUAL REPORT 2017
NOTES TO CONSOLIDATED FINANCIAL STATEMENTS
Major components of assets and liabilities associated with business transfer made in consideration for cash and cash equivalents:
Year ended March 31, 2017There was no applicable information for the year ended March 31, 2017
Year ended March 31, 2016Components of assets and liabilities acquired by business transfer of L&S (Linkage and Suspension) business from TRW Automotive Inc. and rela-tionship between acquisition value of the business and net payment for acquisition are as follows:
Millions of yen
Current assets ¥ 7,438Noncurrent assets 18,426Goodwill 3,351Current liabilities (5,144)Noncurrent liabilities (0)Acquisition value of shares 24,073Cash and cash equivalents —Foreign exchange translation differences 88Net payment for acquisition ¥ 24,161
Per share information as of and for the years ended March 31, 2017 and 2016 is as follows:
Diluted net income per share for the years ended March 31, 2017 and 2016 is not presented since the Company did not have any kind of securities with potential dilutive effect in the fiscal years.
16. Per Share Information
yen U.S. dollars
2017 2016 2017Net income – basic ¥ 132.18 ¥ 107.24 $ 1.17Net assets 1,966.80 1,953.97 17.52
Major components of assets and liabilities of a company which newly became a consolidated subsidiary due to acquisition of shares:
Year ended March 31, 2017There was no applicable information for the year ended March 31, 2017
Year ended March 31, 2016Components of assets and liabilities at the beginning of consolidation of THK RHYTHM AUTOMOTIVE CZECH a.s., which newly became a consoli-dated subsidiary due to acquisition of shares and relationship between acquisition value of shares and net payment for acquisition, are as follows:
15. Supplementary Information to Consolidated statements of Cash Flows
Millions of yen
Current assets ¥ 5,205Noncurrent assets 16,561Goodwill 9,883Current liabilities (3,689)Noncurrent liabilities (2,702)Acquisition value of shares 25,257Cash and cash equivalents (877)Net payment for acquisition ¥ 24,379
THK ANNUAL REPORT 2017 53
(1) Policy for financial instrumentsThe Group’s use of its surplus funds is limited to short-term depos-its and other low-risk financial assets. As to raising funds, the Group finances by issuing bonds and bank loans in accordance with business plans. The Group does not hold or issue derivative financial instru-ments for speculative purposes.
(2) Nature and risks of financial instrumentsNotes and accounts receivable are subject to credit risks of custom-ers. Receivables denominated in foreign currencies arising from the Group’s global business are subject to foreign exchange risks. The Group controls these risks by utilizing forward foreign exchange con-tracts applicable to net amounts of receivables and payables denomi-nated in foreign currencies. Most investment securities consist of equity securities and are subject to market value volatility risks. Most of notes and accounts payable are due within a year. Bonds and bank loans are financed for working capital or capi-tal investment use and other investments for which the maximum redemption/repayment period is nine years. Long-term debt is exposed to interest rate fluctuation risk and foreign exchange fluctuation risk, but with respect to certain long-term debt, the principal and interest are hedged by derivatives (interest rate swaps and interest rate and currency swap contracts). The Group utilizes forward foreign exchange contracts to manage foreign exchange fluctuation risk associated with foreign currency denominated trade receivables and payables, interest rate swap con-tracts to manage interest rate fluctuation risk associated with long-term debt and interest rate and currency swap contracts to manage foreign exchange fluctuation risk and interest rate fluctuation risk associated with foreign currency denominated bank loans within the extent of actual demand. With respect to hedging instruments and hedged items, hedging policy and assessment method of hedge effec-tiveness concerning hedge accounting, please see Note 2 (d).
(3) Risk management (a) Credit risks—The Company controls customers’ credit risks
in accordance with internal rules for controlling receivables. Appropriate departments of the Company monitor major cus-tomers’ financial conditions to promptly obtain information about possible bad debts. Because the counterparties of derivatives are limited to major international financial institutions, the Company does not anticipate any losses arising from credit risk.
(b) Market risks—The Company utilizes forward foreign exchange contracts to manage foreign exchange fluctuation risk identified by currency associated with foreign currency denominated trade receivables and payables. The Company also utilizes interest rate swap contracts to manage interest rate risks associated with bank loans and interest rate and currency swap contracts to man-age foreign exchange fluctuation risk and interest rate fluctuation risk associated with foreign currency denominated bank loans. As to investments in securities, fair value and financial condition of investees are periodically reviewed. Derivative transactions are executed and controlled by the Corporate Strategy Division. The General Manager of the Corporate Strategy Division reports results and conditions of derivative transactions at the Board of Director’s meetings on a monthly basis.
(c) Liquidity risks—Each company of the Group prepares and updates cash-flow plans and maintains appropriate amounts of ready liquidity.
(4) Other information Fair values of financial instruments are based on quoted prices in active markets. If a quoted price is not available, other rational valuation tech-niques are used instead. Because such valuation techniques include certain assumptions, results may differ if different assumptions are used in the valuation. The contract amounts for derivatives listed in Note 18 do not rep-resent the volume of underlying market risks of the derivative transactions.
17. Financial Instruments and Related Disclosures
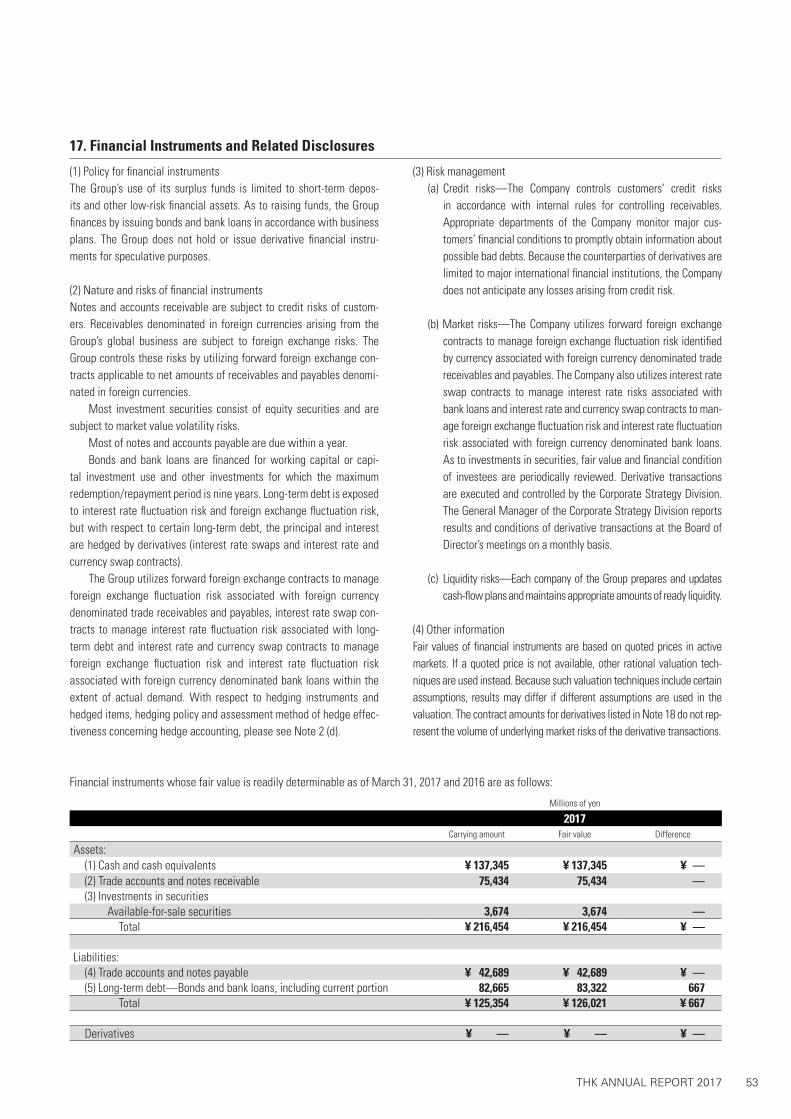
Financial instruments whose fair value is readily determinable as of March 31, 2017 and 2016 are as follows:
Millions of yen
2017Carrying amount Fair value Difference
Assets: (1) Cash and cash equivalents ¥ 137,345 ¥ 137,345 ¥ — (2) Trade accounts and notes receivable 75,434 75,434 — (3) Investments in securities Available-for-sale securities 3,674 3,674 — Total ¥ 216,454 ¥ 216,454 ¥ —
Liabilities: (4) Trade accounts and notes payable ¥ 42,689 ¥ 42,689 ¥ — (5) Long-term debt—Bonds and bank loans, including current portion 82,665 83,322 667 Total ¥ 125,354 ¥ 126,021 ¥ 667
Derivatives ¥ — ¥ — ¥ —

54 THK ANNUAL REPORT 2017
NOTES TO CONSOLIDATED FINANCIAL STATEMENTS
Thousands of U.S. dollars
2017Carrying amount Fair value Difference
Assets: (1) Cash and cash equivalents $ 1,224,108 $ 1,224,108 $ — (2) Trade accounts and notes receivable 672,317 672,317 — (3) Investments in securities Available-for-sale securities 32,745 32,745 — Total $ 1,929,180 $ 1,929,180 $ —
Liabilities: (4) Trade accounts and notes payable $ 380,463 $ 380,463 $ — (5) Long-term debt—Bonds and bank loans, including current portion 736,764 742,620 5,944 Total $ 1,117,237 $ 1,123,181 $ 5,944
Derivatives $ — $ — $ —
Note:Assets:(1) and (2) —As these items are settled within a year and have fair values approximately equal to their carrying amounts, they are stated at the carrying amounts. (3) —Fair value of equity securities is stated at quoted market price. Fair value information of investment securities is discussed in Note 4.
Liabilities:(4) —As these items are settled within a year and have fair values approximately equal to their carrying amounts, they are stated at the carrying amounts.(5) — Fair value of bonds is stated at present value of a total amount of its principal and interest discounted by a rate determined considering its remaining periods and credit risks. Bank loans are payable with variable interest rates. Fair value of bank loans is stated at carrying amount because fair value of such bank loans is considered approximately equal to its carrying amount based
on the following assumptions; (a) variable interest rates reflect the current market rate, and (b) the Company’s credit status has not significantly changed after the issuance.
Derivatives —Details and information are discussed in Note 18.
Financial instruments which do not have quoted market prices and whose fair value is not reliably determinable are not included in the table above. Such financial instruments as of March 31, 2017 and 2016 are as follows:
Millions of yen Thousands of U.S dollars
2017 2016 2017Unlisted equity securities ¥ 193 ¥ 173 $ 1,720Investments in investment business limited partnerships 239 45 2,130
Millions of yen
2016Carrying amount Fair value Difference
Assets: (1) Cash and cash equivalents ¥ 126,964 ¥ 126,964 ¥ — (2) Trade accounts and notes receivable 71,500 71,500 — (3) Investments in securities Available-for-sale securities 2,354 2,354 — Total ¥ 200,820 ¥ 200,820 ¥ —
Liabilities: (4) Trade accounts and notes payable ¥ 36,673 ¥ 36,673 ¥ — (5) Long-term debt—Bonds and bank loans, including current portion 85,534 86,477 943 Total ¥ 122,207 ¥ 123,151 ¥ 943
Derivatives ¥ — ¥ — ¥ —

THK ANNUAL REPORT 2017 55
Detailed information about investments in securities is discussed in Note 5.
Maturity analysis for financial assets as of March 31, 2017 is as follows:
Maturities of long-term debt as of March 31, 2017 are disclosed in Note 5.
Millions of yen Thousands of U.S dollars
2017 2017Due within one year Due after one year Due within one year Due after one year
(1) Cash and cash equivalents ¥ 137,345 — $ 1,224,108 —(2) Trade accounts and notes receivable 75,434 — 672,317 — Total ¥ 212,779 — $ 1,896,426 —
Derivatives to which hedge accounting is applied:The Group utilizes interest rate swap agreements to hedge interest rate risks associated with its bank loans and interest rate and cur-rency swap contracts to hedge foreign exchange risk and interest rate risks associated with its foreign currency denominated bank loans. The Group’s interest rate swaps and interest rate and currency swap con-tracts qualify for hedge accounting and meet specific matching criteria
under Japanese GAAP and are not remeasured at market value but the differential paid or received under the swap agreements are rec-ognized and included in interest expenses or income and the foreign currency assets and liabilities hedged by interest rate and currency swap contracts are translated at the contract rates and no gains or losses are recognized.
18. Derivatives and Hedging Activities
Fair value information of such derivatives as of March 31, 2017 and 2016 is as follows:
Millions of yen
2017Contract Amount
Within one year Over one year Fair value of derivative instruments
Interest rate and currency swaps (fixed rate payment in JPY, floating rate receipt in USD) ¥ 19,665 ¥ 17,480 ¥ 587
Millions of yen
2016Contract Amount
Within one year Over one year Fair value of derivative instruments
Interest rate and currency swaps (fixed rate payment in JPY, floating rate receipt in USD) ¥ 11,265 ¥ 10,138 ¥ (140)
Thousands of U.S. dollars
2017Contract Amount
Within one year Over one year Fair value of derivative instruments
Interest rate and currency swaps (fixed rate payment in JPY, floating rate receipt in USD) $ 175,267 $ 155,793 $ 5,231

56 THK ANNUAL REPORT 2017
NOTES TO CONSOLIDATED FINANCIAL STATEMENTS
As of March 31, 2017The Group recognizes restoration duty at the time of leaving based on the real estate rent contracts of the Company’s head office, etc. as asset retirement obligation. Regarding asset retirement obligation as of March 31, 2017, the Company reasonably estimates the amount of security deposits related to the building rent contracts that are not expected to be ultimately collected and records the amount attributed to the current fiscal year in place of record-ing a liability. As of March 31, 2016Under rent agreements of the head office and other spaces, the Group is obliged to pay restoring costs at relocation. The asset retirement obligation, however, is not reasonably determinable because the rent periods are uncertain. The Group also has obligation for disposal costs of PCB (polychlo-rinated biphenyl)-containing wastes and contamination survey on land. The asset retirement obligation, however, is not reasonably determinable because the time of performance, amount, and other factors of such obligations are uncertain. Therefore, the aforementioned obligations are not recognized in the accompanying consolidated financial statements.
19. Asset Retirement Obligation
The reportable segments are components of the Group for which sepa-rate financial information is available, and whose operating results are reviewed periodically by the Board of Directors to determine allocation of operating resources and evaluate its performance. The Group’s main products are machinery parts such as LM (linear motion) guides and ball screws, and transportation equipment-related
parts such as link balls and suspension ball joints. In each country, each local subsidiary establishes its comprehensive business strategies and conduct its business activities in a similar way that the Company and domestic subsidiaries do in Japan. Therefore, the reportable segment information consists of the five geographical segments, namely; (1) Japan, (2) The Americas (the
20. Segment Information
Millions of yen
2016Contract Amount
Within one year Over one year Fair value of derivative instruments
Interest rate swaps (fixed rate payment, floating rate receipt) ¥ 10,000 ¥ 10,000 ¥ (137)
Millions of yen
2017Contract Amount
Within one year Over one year Fair value of derivative instruments
Interest rate swaps (fixed rate payment, floating rate receipt) ¥ 10,000 ¥ 10,000 ¥ (75)
Thousands of U.S. dollars
2017Contract Amount
Within one year Over one year Fair value of derivative instruments
Interest rate swaps (fixed rate payment, floating rate receipt) $ 89,126 $ 89,126 $ (668)
Fair value of derivative instruments in the table above is stated at amount obtained from financial institutions, the counter parties of the contracts.

THK ANNUAL REPORT 2017 57
United States and other), (3) Europe (Germany, France and other), (4) China, and (5) Other (Taiwan, Singapore and other) based on the Group’s production/sales structure. Segment income is computed based on operating income. The reportable segment information is prepared under the same accounting policies as discussed in Note 2. Inter-segment sales and transfer are stated at amounts based on their fair market values. All adjustments in the following tables are inter-segment elimination on consolidation. As noted in (r) “Accounting Changes” under “2. Significant Accounting Policies,” the Company and its domestic consolidated
subsidiaries had adopted mainly the declining-balance method and certain U.S. consolidated subsidiaries adopted mainly the accelerated declining-balance method in the previous years, but effective from the current fiscal year, they changed their depreciation method to the straight-line method. As a result of this change, segment profit of “Japan” and “The Americas” increased by ¥1,432 million ($12,762 thousand) and ¥150 million ($1,336 thousand), respectively, compared to those amounts under the previous method.
Segment information of the Group as of March 31, 2017 and 2016 and for the years then ended is as follows:
Reportable segments
Millions of yen
2017Japan The Americas Europe China Other Total Adjustments Consolidated
Sales to customers ¥ 121,865 ¥ 62,870 ¥ 48,775 ¥ 28,008 ¥ 12,056 ¥ 273,577 ¥ — ¥ 273,577Inter-segment 44,982 39 47 4,091 1,464 50,625 (50,625) — Total 166,848 62,909 48,822 32,100 13,521 324,202 (50,625) 273,577Segment profit (loss) ¥ 18,809 ¥ 2,311 ¥ 649 ¥ 750 ¥ 1,336 ¥ 23,857 ¥ 795 ¥ 24,653Assets ¥ 363,731 ¥ 67,579 ¥ 84,757 ¥ 60,801 ¥ 15,000 ¥ 591,870 ¥ (176,938) ¥ 414,931Other items Depreciation and amortization ¥ 4,450 ¥ 2,935 ¥ 2,007 ¥ 3,556 ¥ 313 ¥ 13,262 ¥ (77) ¥ 13,185 Amortization of goodwill 20 157 649 — 151 978 — 978 Investment in an affiliate accounted for under the equity method 4,016 — — — — 4,016 — 4,016
Increase in property, plant and equipment and intangibles 8,486 3,482 3,608 2,157 187 17,922 (81) 17,840
Millions of yen
2016Japan The Americas Europe China Other Total Adjustments Consolidated
Sales to customers ¥ 118,851 ¥ 49,491 ¥ 31,223 ¥ 28,173 ¥ 12,738 ¥ 240,478 ¥ — ¥ 240,478Inter-segment 41,287 17 26 5,831 1,352 48,516 (48,516) — Total 160,138 49,509 31,249 34,005 14,091 288,994 (48,516) 240,478Segment profit (loss) ¥ 19,719 ¥ 2,096 ¥ 632 ¥ (1,344) ¥ 1,267 ¥ 22,372 ¥ 797 ¥ 23,169Assets ¥ 348,106 ¥ 88,686 ¥ 65,047 ¥ 65,747 ¥ 14,502 ¥ 582,090 ¥ (174,281) ¥ 407,808Other items Depreciation and amortization ¥ 5,644 ¥ 2,272 ¥ 1,019 ¥ 4,437 ¥ 447 ¥ 13,821 ¥ (177) ¥ 13,643 Amortization of goodwill 61 58 231 — 312 664 — 664 Investment in an affiliate accounted for under the equity method 4,312 — — — — 4,312 — 4,312
Increase in property, plant and equipment and intangibles 10,686 18,383 5,319 3,272 496 38,157 522 38,680
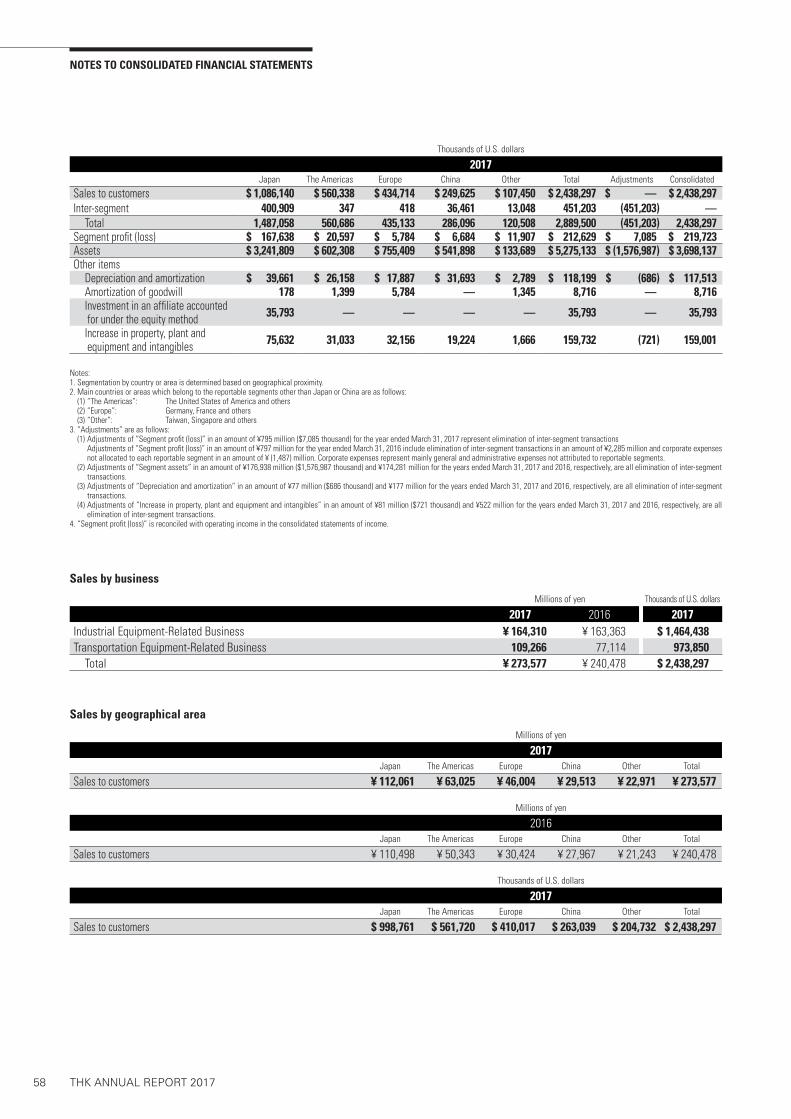
58 THK ANNUAL REPORT 2017
NOTES TO CONSOLIDATED FINANCIAL STATEMENTS
Millions of yen
2017Japan The Americas Europe China Other Total
Sales to customers ¥ 112,061 ¥ 63,025 ¥ 46,004 ¥ 29,513 ¥ 22,971 ¥ 273,577
Thousands of U.S. dollars
2017Japan The Americas Europe China Other Total
Sales to customers $ 998,761 $ 561,720 $ 410,017 $ 263,039 $ 204,732 $ 2,438,297
Millions of yen
2016Japan The Americas Europe China Other Total
Sales to customers ¥ 110,498 ¥ 50,343 ¥ 30,424 ¥ 27,967 ¥ 21,243 ¥ 240,478
Sales by geographical area
Sales by business
Millions of yen Thousands of U.S. dollars
2017 2016 2017Industrial Equipment-Related Business ¥ 164,310 ¥ 163,363 $ 1,464,438Transportation Equipment-Related Business 109,266 77,114 973,850 Total ¥ 273,577 ¥ 240,478 $ 2,438,297
Notes:1. Segmentation by country or area is determined based on geographical proximity.2. Main countries or areas which belong to the reportable segments other than Japan or China are as follows: (1) “The Americas”: The United States of America and others (2) “Europe”: Germany, France and others (3) “Other”: Taiwan, Singapore and others3. “Adjustments” are as follows: (1) Adjustments of “Segment profit (loss)” in an amount of ¥795 million ($7,085 thousand) for the year ended March 31, 2017 represent elimination of inter-segment transactions Adjustments of “Segment profit (loss)” in an amount of ¥797 million for the year ended March 31, 2016 include elimination of inter-segment transactions in an amount of ¥2,285 million and corporate expenses
not allocated to each reportable segment in an amount of ¥ (1,487) million. Corporate expenses represent mainly general and administrative expenses not attributed to reportable segments. (2) Adjustments of “Segment assets” in an amount of ¥176,938 million ($1,576,987 thousand) and ¥174,281 million for the years ended March 31, 2017 and 2016, respectively, are all elimination of inter-segment
transactions. (3) Adjustments of “Depreciation and amortization” in an amount of ¥77 million ($686 thousand) and ¥177 million for the years ended March 31, 2017 and 2016, respectively, are all elimination of inter-segment
transactions. (4) Adjustments of “Increase in property, plant and equipment and intangibles” in an amount of ¥81 million ($721 thousand) and ¥522 million for the years ended March 31, 2017 and 2016, respectively, are all
elimination of inter-segment transactions.4. “Segment profit (loss)” is reconciled with operating income in the consolidated statements of income.
Thousands of U.S. dollars
2017Japan The Americas Europe China Other Total Adjustments Consolidated
Sales to customers $ 1,086,140 $ 560,338 $ 434,714 $ 249,625 $ 107,450 $ 2,438,297 $ — $ 2,438,297Inter-segment 400,909 347 418 36,461 13,048 451,203 (451,203) — Total 1,487,058 560,686 435,133 286,096 120,508 2,889,500 (451,203) 2,438,297Segment profit (loss) $ 167,638 $ 20,597 $ 5,784 $ 6,684 $ 11,907 $ 212,629 $ 7,085 $ 219,723Assets $ 3,241,809 $ 602,308 $ 755,409 $ 541,898 $ 133,689 $ 5,275,133 $ (1,576,987) $ 3,698,137Other items Depreciation and amortization $ 39,661 $ 26,158 $ 17,887 $ 31,693 $ 2,789 $ 118,199 $ (686) $ 117,513 Amortization of goodwill 178 1,399 5,784 — 1,345 8,716 — 8,716 Investment in an affiliate accounted for under the equity method 35,793 — — — — 35,793 — 35,793
Increase in property, plant and equipment and intangibles 75,632 31,033 32,156 19,224 1,666 159,732 (721) 159,001

THK ANNUAL REPORT 2017 59
The payments will be financed from internal and external resources.
Total amountMillions of yen
(Thousands of U.S. dollars)
Per share amountYen
(U.S. dollar)Dividend record date Effective date
Common stock ¥ 3,164 million ($ 28,199 thousand)
¥ 25.00 ($ 0.22) Mar.31, 2017 Jun. 19, 2017
Millions of yen
2017Japan The Americas Europe China Other Total
Tangible fixed assets ¥ 47,049 ¥ 16,838 ¥ 13,760 ¥ 28,167 ¥ 2,823 ¥ 108,639
Thousands of U.S. dollars
2017Japan The Americas Europe China Other Total
Tangible fixed assets $ 419,331 $ 150,071 $ 122,638 $ 251,042 $ 25,160 $ 968,262
Millions of yen
2016Japan The Americas Europe China Other Total
Tangible fixed assets ¥ 43,390 ¥ 16,350 ¥ 12,924 ¥ 33,493 ¥ 3,269 ¥ 109,428
Tangible fixed assets by geographical area
Amortization and unamortized balance of goodwill by reportable segment
Appropriation of retained earningsThe following appropriation of retained earnings as of March 31, 2017 was approved at the Company’s General Meeting of Shareholders held on June 17, 2017:
21. Subsequent Events
Millions of yen
2017Japan The Americas Europe China Other Total Adjustments Consolidated
Amortization ¥ 20 ¥ 157 ¥ 649 ¥ — ¥ 151 ¥ 978 ¥ — ¥ 978Unamortized balance — 2,303 8,948 — — 11,251 — 11,251
Thousands of U.S. dollars
2017Japan The Americas Europe China Other Total Adjustments Consolidated
Amortization $ 178 $ 1,399 $ 5,784 $ — $ 1,345 $ 8,716 $ — $ 8,716Unamortized balance — 20,525 79,750 — — 100,276 — 100,276
Millions of yen
2016Japan The Americas Europe China Other Total Adjustments Consolidated
Amortization ¥ 61 ¥ 58 ¥ 231 ¥ — ¥ 312 ¥ 664 ¥ — ¥ 664Unamortized balance 20 2,542 10,052 — 164 12,780 — 12,780