Embed Size (px)
Citation preview
East Tennessee State UniversityDigital Commons @ East Tennessee State University
Undergraduate Honors Theses Student Works
5-2012
Financial Solvency of the American Government.Jamie ThomasEast Tennessee State University
Follow this and additional works at: https://dc.etsu.edu/honors
Part of the Finance Commons
This Honors Thesis - Open Access is brought to you for free and open access by the Student Works at Digital Commons @ East Tennessee StateUniversity. It has been accepted for inclusion in Undergraduate Honors Theses by an authorized administrator of Digital Commons @ East TennesseeState University. For more information, please contact [email protected].
Recommended CitationThomas, Jamie, "Financial Solvency of the American Government." (2012). Undergraduate Honors Theses. Paper 28.https://dc.etsu.edu/honors/28
Financial Solvency of the American Government 1
FINANCIAL SOLVENCY OF THE AMERICAN GOVERNMENT
Thesis submitted in partial fulfillment of Honors
By
Jamie Thomas
The Honors College
University Honors Scholars Program
East Tennessee State University
April 10, 2012
Dr. William Trainor, Jr., Faculty Mentor
Dr. Richard Gregory, Faculty Reader
Dr. Joseph Corso, Faculty Reader
Financial Solvency of the American Government 2
Abstract
The main topic of this paper is the financial solvency, or “the ability to pay all debts,” of
the United States government (“solvency,” n.d.). The questions posed and analyzed are 1) is the
American government solvent, 2) did Standard and Poor’s accurately downgrade the American
debt, and 3) how does the national debt affect the solvency of the American government. To
determine the solvency and effects of debt, analysis of financial information for America and
nine other countries, grouped according to their credit rating is used. Solvency is determined by
credit rating for this analysis; a country with a high credit rating of AAA will be considered
extremely solvent, with each downgrade showing a more at risk country. The appropriate credit
rating for the United States will be determined by comparing the information and noting where
the United States stands in relation to the other countries for four key economic indicators. Also,
analysis of standard lending rules applied to America’s financial information shows whether or
not the amount of debt America holds is safe compared to what requirements are expected of
individuals. Appendices show more detailed solvency analyses for the ten countries, at present
and over the past thirty years.
The results of the study show that solvency could be a future problem for the American
government. It has only adequate capacity to repay its debt and should not have received a AA+
rating from Standard and Poor’s. A BBB+ rating would have been more appropriate. Also,
applying standard lending rules to the American debt shows that it exceeds the 40% debt-to-
income standard, making the likelihood of debt repayment, or solvency, low based on standards
used in the financial lending sphere.
Financial Solvency of the American Government 3
Index
I. Introduction and Thesis Statement.............................................................................................5
II. Literature Review.......................................................................................................................6
III. Global Comparison of Solvency ................................................................................................8
a. Analysis of Economic Indicators .......................................................................................10
i. Average Percentage Change in GDP ........................................................................10
ii. Average Net Lending/Borrowing .............................................................................11
iii. Average Gross Debt ..................................................................................................12
b. Detailed Solvency Analysis of the United States
i. Analysis of Economic Indicators ..............................................................................13
ii. United States Gross Debt as a Percentage of GDP ...................................................15
iii. Total United States Debt as a Percentage of GDP ....................................................16
c. Summary of Analysis .........................................................................................................17
IV. United States Debt Analyzed by Standard Lending Rules ......................................................19
V. Summary and Conclusions ......................................................................................................22
References ......................................................................................................................................23
Appendix 1: Ideal Results for Current, Projected, and Historic Period Analysis ..........................26
Appendix 2: Detailed Solvency Analysis for Current and Projected Periods ...............................28
Appendix 2.1: France .........................................................................................................28
Appendix 2.2: Germany .....................................................................................................30
Appendix 2.3: Greece ........................................................................................................32
Appendix 2.4: Ireland ........................................................................................................33
Appendix 2.5: Italy ............................................................................................................35
Financial Solvency of the American Government 4
Index, Continued
Appendix 2: Detailed Solvency Analysis for Current and Projected Periods
Appendix 2.6: Portugal ......................................................................................................36
Appendix 2.7: Spain...........................................................................................................38
Appendix 2.8: Switzerland.................................................................................................39
Appendix 2.9: United Kingdom .........................................................................................40
Appendix 3: Detailed Solvency Analysis for 1980-2010 ..............................................................42
Appendix 3.1: Investment as a Percentage of GDP ...........................................................42
Appendix 3.2: Percentage Change in GDP, Constant Prices .............................................43
Appendix 3.3: Gross National Saving as a Percentage of GDP ........................................46
Appendix 3.4: General Government Gross Debt as a Percentage of GDP ........................47
Appendix 3.5: General Government Net Lending and Borrowing
as a Percentage of GDP .............................................................................49
Appendix 3.6: General Government Revenue as a Percentage of GDP ............................50
Appendix 3.7: General Government Total Expenditure as a Percent of GDP ...................52
Financial Solvency of the American Government 5
I. Introduction and Thesis Statement
With the recent financial crisis of 2008 and the downgrade of the American government
from AAA to AA+ by Standard and Poor’s, many American citizens are concerned about the
financial solvency of the American government (“S&P ratings sovereign," 2012). Another point
of concern is the high amount of national debt. While the United States has become a major
player in the global economy, some now doubt whether the country will be able to continue its
current debt policy.
Many financial writers have discussed the ideas of solvency and the national debt. First,
John Steele Gordon has written about the general definition of the national debt and what should
be included. Second, Andrew Abel and Barry M. Ferguson have detailed the implications of
how the government runs the Social Security Trust Fund. Third, David Weliver has explained
standard lending rules that apply to individuals.
While these articles offer great insight individually, bringing these ideas all together can
give an idea of whether the solvency of the American government might be an issue. Comparing
these articles to current financial data for the United States shows whether the debt makes the
government at risk of default as so many researchers suspect it might be. Analyzing the data and
comparing the United States to other countries and applying Gordon, Abel, Ferguson, and
Weliver’s articles to the data can show how well the government can maintain its current debt
load, what credit rating is most appropriate, and whether the amount of the United States national
debt is too high relative to standard lending rules. The American government is on a path that
might be unsustainable, should not have received such a high rating from Standard and Poor’s,
and has a debt-to-income so high it is at risk of default.
Financial Solvency of the American Government 6
II. Literature Review
To discuss the national debt, there must be a definition of what is included in the term. In
“A Short Primer on the National Debt,” John Steele Gordon (2011) states that “the total national
debt of the United States is the sum of all federal bills, notes and bonds that have been issued by
the Treasury and not yet redeemed.” This total debt includes Treasury securities held by
individuals, governments, and financial institutions. Gordon also discusses intra-governmental
debt, Treasury bonds that are held by the government itself to fund different sections of the
government, and asks if these securities should be included in the amount of national debt.
According to his previous definition of the total national debt, these securities should be
included. This definition of the national debt, including the intra-governmental debt, will be
used for this paper. The largest majority of these intra-governmental securities are found in the
Social Security Trust Fund. Gordon offers three solutions, “cut spending elsewhere, raise taxes,
or borrow the money in the bond market, thus converting intra-governmental debt into publicly
held debt.”
In conjunction with Gordon’s concerns about the Social Security Trust Fund, Andrew
Abel (1992) wrote an article entitled “Can the Government Roll Over Its Debt Forever,” in
which he details the idea that the United States government is running a Ponzi scheme to keep
making its Social Security payments. Abel discusses how the government rolls over its debt by
issuing new Treasury securities to pay for ones that are coming due. Instead of using regular
income to make these payments, the government is using new debt to pay existing debt. In the
business world, this is known as a Ponzi scheme and is illegal. According to Abel’s calculations,
if the government continues to roll over its debt to pay Social Security, it will no longer be able
to do so in the future. Eventually, this process must stop. What Abel does not do is determine
Financial Solvency of the American Government 7
when that might happen. In the conclusion of his paper, Abel has two suggestions to reduce the
debt: 1) the government must employ “an increase in tax revenues and / or 2) a cut in
government expenditure” but states that “neither . . . will be universally popular.”
Barry M. Ferguson (2011) also discusses the Social Security Fund in his article “US Debt
Default Will Punish Pensions.” Ferguson states that the government itself holds one third of the
total Treasury debt and that this money does, in fact, help fund the Social Security program. He
also discusses how a ruling by the Supreme Court in 1960 takes away the right of citizens to their
Social Security benefits, even if they paid some into the system, but Congress keeps running up
the debt by using Treasuries to further the Social Security Trust Fund.
To determine the level of debt the American government should hold, standard lending
rules can be used. David Weliver (2010) states the common lending rule that the sum of total
debts for an individual should not exceed forty percent of gross income. Also, Weliver states
that a mortgage payment should not exceed twenty-eight percent of gross income. These rules
will be applied to the amount of income and debt the American government holds to determine
whether or not the United States meets these rules.
Financial Solvency of the American Government 8
III. Global Comparison of Solvency
With the recent economical collapse and recession, many people have been concerned
with their country’s ability to repay debt, and rightfully so. With Greece’s economy spiraling
downward, the question to be answered now is which countries are to follow. The downgrade of
American bonds by Standard and Poor’s has made all these fears even worse, to the point that
Americans no longer have faith in their government to repay their debt. Compared to other
countries, how does America really rank, though? Is the United States one of the countries that
is about to fall apart? If so, how long will it be before a plummet occurs?
To answer these questions, a process of comparison and contrast is used. Economic
ratios and figures can be calculated and analyzed for the United States and other countries to
determine where the United States is in relation to nations across the globe. Four key
calculations provide the basis for analysis between countries. These calculations include average
percentage change in GDP, average net lending and borrowing, and average gross debt for ten
countries from the time period 2009 to 2016. Looking at the actual data from 2009 to 2011 and
projected data from 2012 to 2016 gives a perspective of where each country is currently and
where it expects to go in the near future, allowing for a comparison showing if the United States
is likely to have a solvency issue in the near future. Average percent change in GDP shows the
growth in the amount of production each country has per year. If the country’s GDP is expected
to grow, the economy is growing also, and there will be more opportunity for government
revenue from taxation. Thus, a rise in GDP can be seen as a rise in the amount of money the
government has to pay its debt. Average net lending and borrowing determines whether the
country is taking on more debt and causing the nation to have more debt to repay in the future.
Average gross debt as a percent of GDP is the most important figure in the analysis and shows
Financial Solvency of the American Government 9
the amount of debt the country has in relation to how much it produces. If this figure is too high,
the country might have a solvency issue because the entire nation would literally be producing
less per year on whole than the amount only the government holds in debt.
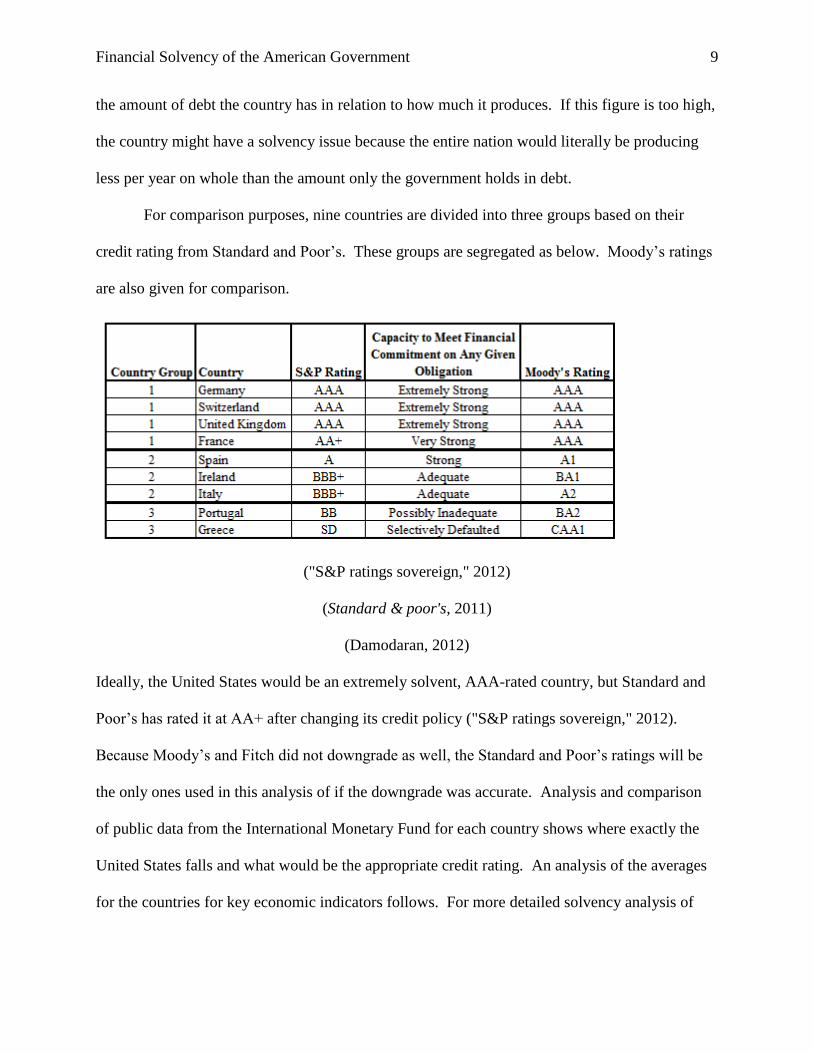
For comparison purposes, nine countries are divided into three groups based on their
credit rating from Standard and Poor’s. These groups are segregated as below. Moody’s ratings
are also given for comparison.
("S&P ratings sovereign," 2012)
(Standard & poor's, 2011)
(Damodaran, 2012)
Ideally, the United States would be an extremely solvent, AAA-rated country, but Standard and
Poor’s has rated it at AA+ after changing its credit policy ("S&P ratings sovereign," 2012).
Because Moody’s and Fitch did not downgrade as well, the Standard and Poor’s ratings will be
the only ones used in this analysis of if the downgrade was accurate. Analysis and comparison
of public data from the International Monetary Fund for each country shows where exactly the
United States falls and what would be the appropriate credit rating. An analysis of the averages
for the countries for key economic indicators follows. For more detailed solvency analysis of
Financial Solvency of the American Government 10
individual countries for this time period, see Appendix 2. For detailed solvency analysis for the
countries over the past thirty years based on more criteria, see Appendix 3.
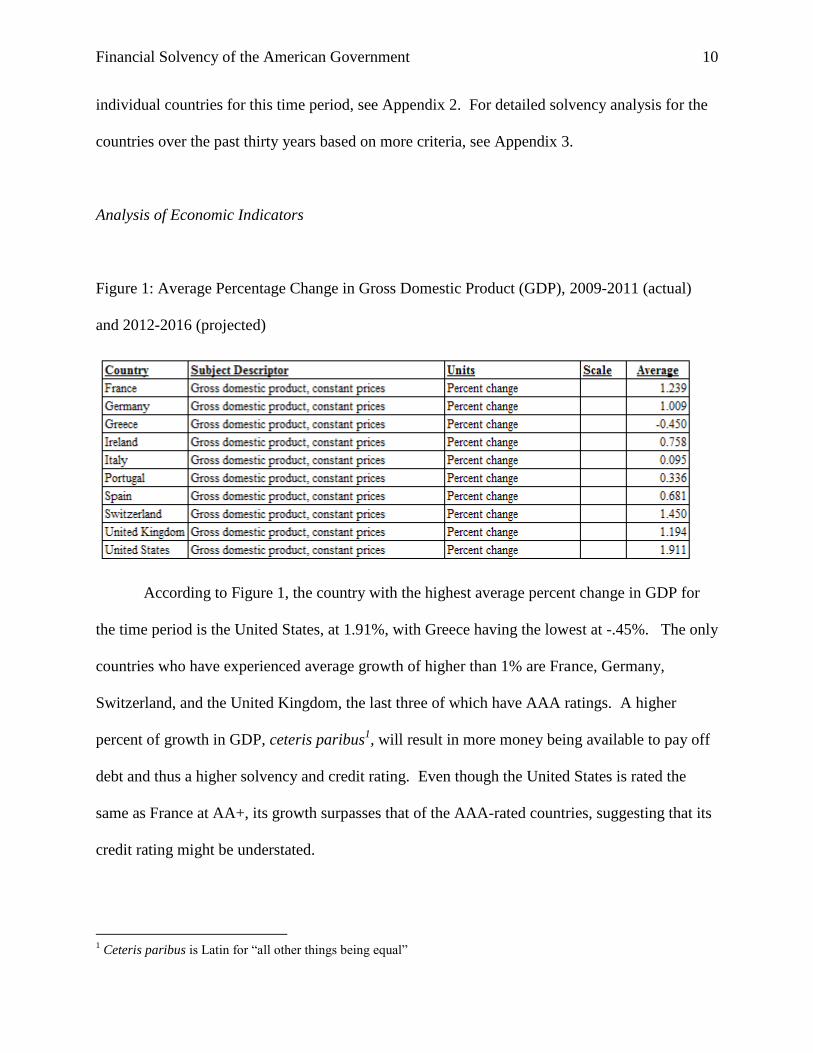
Analysis of Economic Indicators
Figure 1: Average Percentage Change in Gross Domestic Product (GDP), 2009-2011 (actual)
and 2012-2016 (projected)
According to Figure 1, the country with the highest average percent change in GDP for
the time period is the United States, at 1.91%, with Greece having the lowest at -.45%. The only
countries who have experienced average growth of higher than 1% are France, Germany,
Switzerland, and the United Kingdom, the last three of which have AAA ratings. A higher
percent of growth in GDP, ceteris paribus1, will result in more money being available to pay off
debt and thus a higher solvency and credit rating. Even though the United States is rated the
same as France at AA+, its growth surpasses that of the AAA-rated countries, suggesting that its
credit rating might be understated.
1 Ceteris paribus is Latin for “all other things being equal”
Financial Solvency of the American Government 11
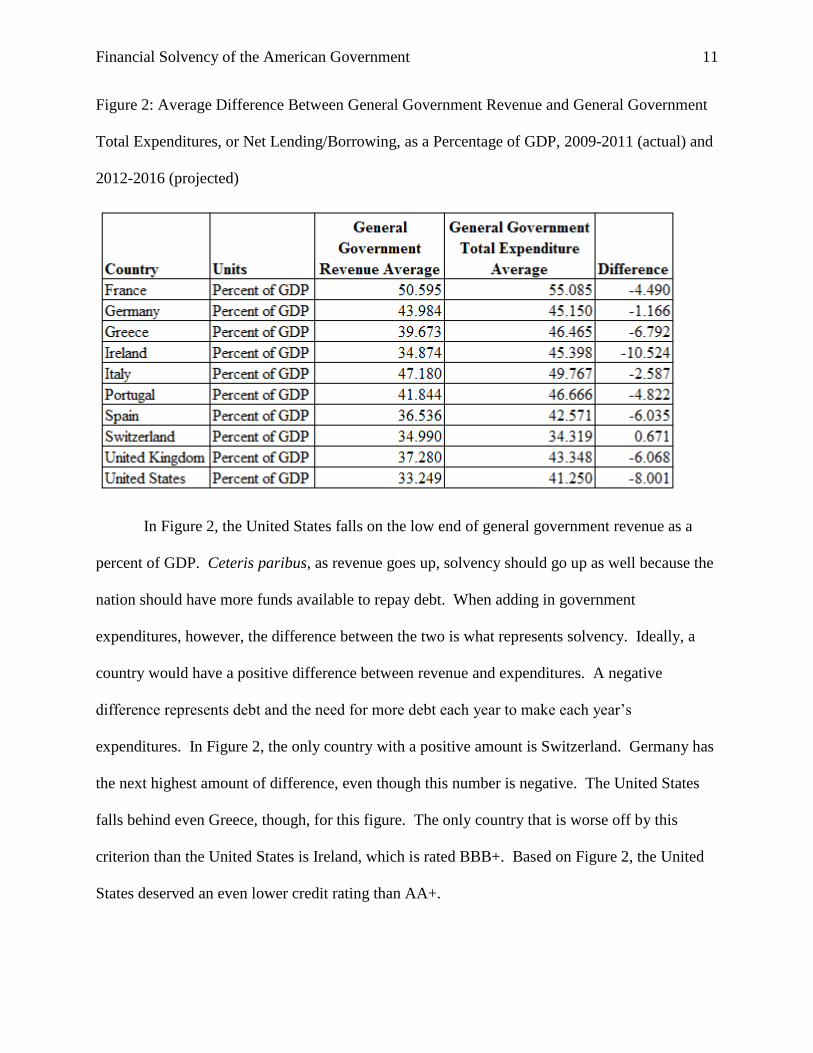
Figure 2: Average Difference Between General Government Revenue and General Government
Total Expenditures, or Net Lending/Borrowing, as a Percentage of GDP, 2009-2011 (actual) and
2012-2016 (projected)
In Figure 2, the United States falls on the low end of general government revenue as a
percent of GDP. Ceteris paribus, as revenue goes up, solvency should go up as well because the
nation should have more funds available to repay debt. When adding in government
expenditures, however, the difference between the two is what represents solvency. Ideally, a
country would have a positive difference between revenue and expenditures. A negative
difference represents debt and the need for more debt each year to make each year’s
expenditures. In Figure 2, the only country with a positive amount is Switzerland. Germany has
the next highest amount of difference, even though this number is negative. The United States
falls behind even Greece, though, for this figure. The only country that is worse off by this
criterion than the United States is Ireland, which is rated BBB+. Based on Figure 2, the United
States deserved an even lower credit rating than AA+.
Financial Solvency of the American Government 12
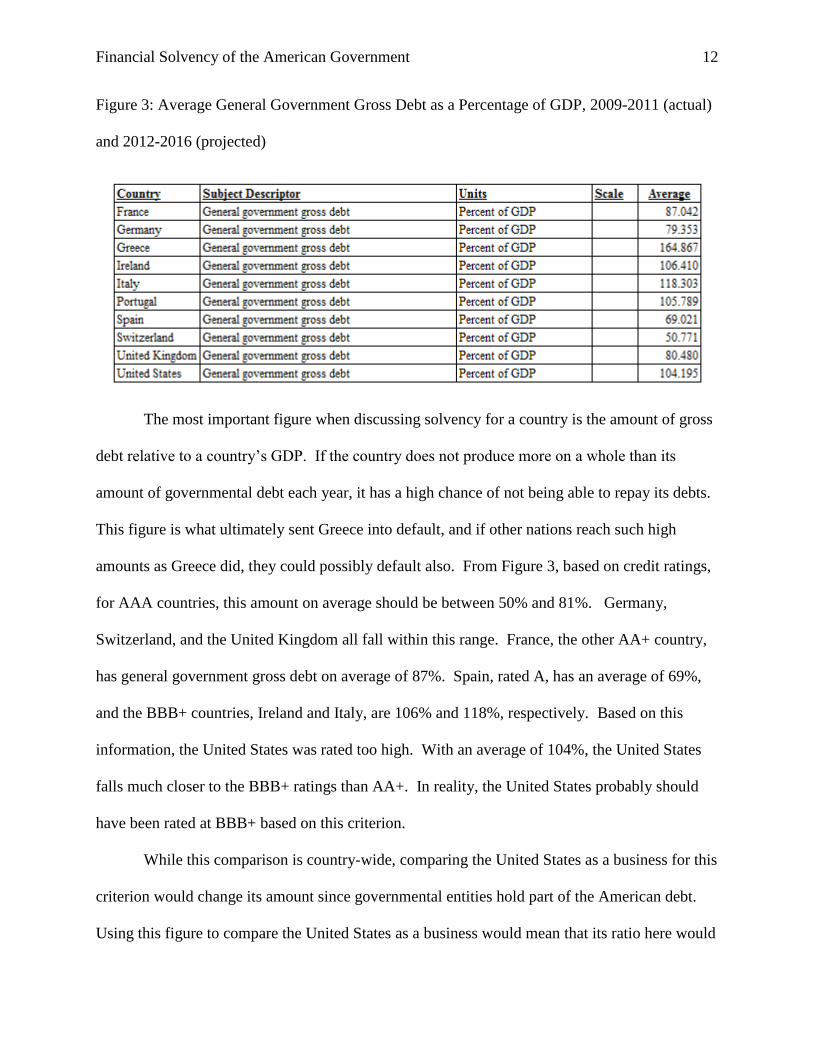
Figure 3: Average General Government Gross Debt as a Percentage of GDP, 2009-2011 (actual)
and 2012-2016 (projected)
The most important figure when discussing solvency for a country is the amount of gross
debt relative to a country’s GDP. If the country does not produce more on a whole than its
amount of governmental debt each year, it has a high chance of not being able to repay its debts.
This figure is what ultimately sent Greece into default, and if other nations reach such high
amounts as Greece did, they could possibly default also. From Figure 3, based on credit ratings,
for AAA countries, this amount on average should be between 50% and 81%. Germany,
Switzerland, and the United Kingdom all fall within this range. France, the other AA+ country,
has general government gross debt on average of 87%. Spain, rated A, has an average of 69%,
and the BBB+ countries, Ireland and Italy, are 106% and 118%, respectively. Based on this
information, the United States was rated too high. With an average of 104%, the United States
falls much closer to the BBB+ ratings than AA+. In reality, the United States probably should
have been rated at BBB+ based on this criterion.
While this comparison is country-wide, comparing the United States as a business for this
criterion would change its amount since governmental entities hold part of the American debt.
Using this figure to compare the United States as a business would mean that its ratio here would
Financial Solvency of the American Government 13
drastically decrease, falling behind Germany. For this analysis, though, the figure is assumed to
remain as quoted from the International Monetary Fund, and the countries are compared based
on their national average as a sovereign entity instead of as a business.
Detailed Solvency Analysis of the United States, 2009 through 2016 (actual and projected)
Analysis of Economic Indicators
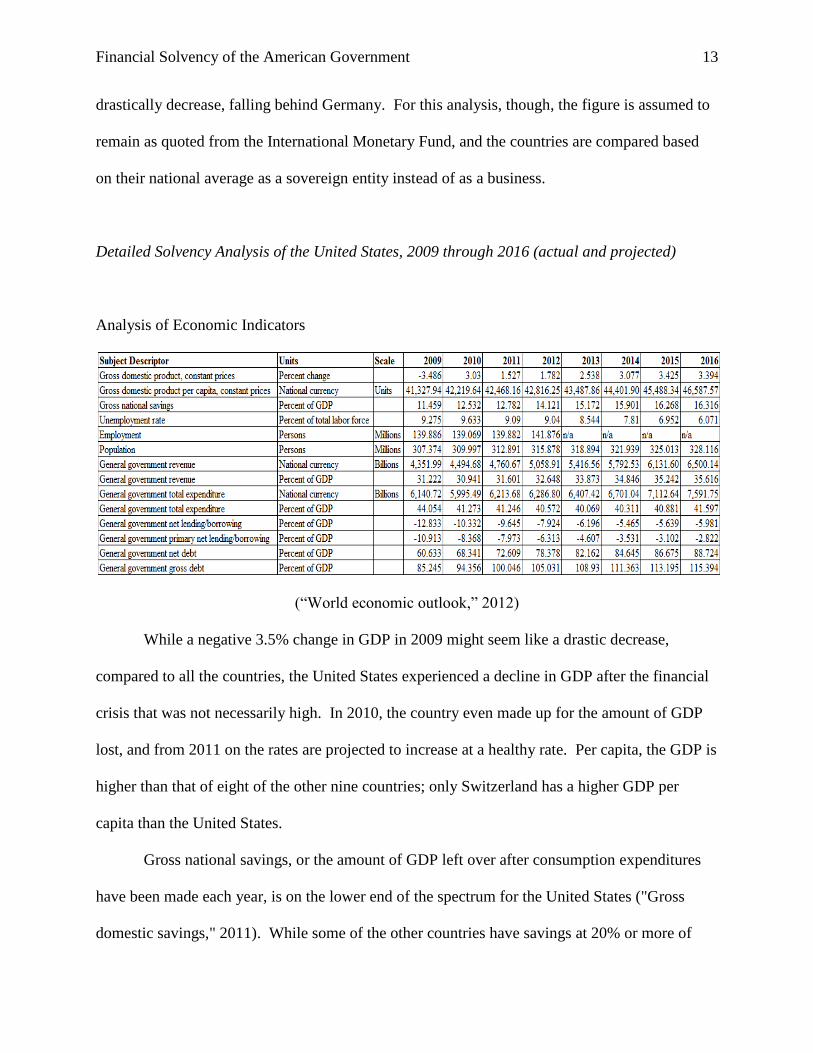
(“World economic outlook,” 2012)
While a negative 3.5% change in GDP in 2009 might seem like a drastic decrease,
compared to all the countries, the United States experienced a decline in GDP after the financial
crisis that was not necessarily high. In 2010, the country even made up for the amount of GDP
lost, and from 2011 on the rates are projected to increase at a healthy rate. Per capita, the GDP is
higher than that of eight of the other nine countries; only Switzerland has a higher GDP per
capita than the United States.
Gross national savings, or the amount of GDP left over after consumption expenditures
have been made each year, is on the lower end of the spectrum for the United States ("Gross
domestic savings," 2011). While some of the other countries have savings at 20% or more of
Financial Solvency of the American Government 14
GDP through some years, the United States only starts at 11.5% and increases to 16.3% in 2016.
The amount of savings represented by these figures is not a large amount and shows that the
United States is not as solvent as the AAA-rated countries. While this seems to be of some
concern, long term investments are not included in this figure, causing it to be smaller than the
actual savings are.
One of the most common concerns to the average U.S. citizen in today’s economy is the
unemployment rate. With an unemployment rate a high 9.3% in 2009 following the financial
crisis, there was little room for error when the rate rose again to 9.6% in 2010. Although the rate
dropped in 2011 and is projected to keep falling, it is expected to only get as low as 6.0% by
2016.
The United States shows the highest amount of government revenue by far. With figures
starting at $4.4 in 2009 and rising to $6.5 trillion in 2016, the American government looks
extremely profitable. However, there is no room to believe that America can grow based on its
amount of revenue as soon as government total expenditure comes into play. At a shocking $1.8
trillion difference between America’s government expenditures and revenues, the amount of debt
the country has makes sense. While government revenues are rising and are expected to
continue to rise, so are government expenditures. In 2012, the difference between the two should
be $1.2 trillion, and by 2016 the difference is projected to be $1.1 trillion. This lack of
improvement puts the United States in danger of taking on even more debt, which is accurately
reflected by its projected general gross debt.
The amount of borrowing the American government has taken on is also high. With the
bailout plan in 2008, the country needed to borrow 12.8% of its GDP in 2009. This number is
projected to decrease, but not by much. In 2013 it should amount to about half of the 2009
Financial Solvency of the American Government 15
figure, and it is not expected to decrease much past that. With a higher net borrowing balance
than other countries, the United States is beginning to look similar to Greece. Although the
United States does not start at a gross debt level 100% or higher of its GDP, it does surpass
100% in 2011 and is only expected to continue to rise after that. Comparing the United States to
Greece, it might not be too much longer that the country can sustain these levels of debt. Greece
started at a ratio of 127% debt to GDP in 2009; the United States is expected to hit 115% by
2016. Of course, such high amounts of debt that are only expected to grow put the United States
at even higher risk for default.
Although some aspects of the data indicate that the United States is not in terrible
shape, others provide great concern. Based on the difference between government expenditure
and revenue and the amount of general government gross debt as a percentage of GDP, the
United States should not have a AAA rating.
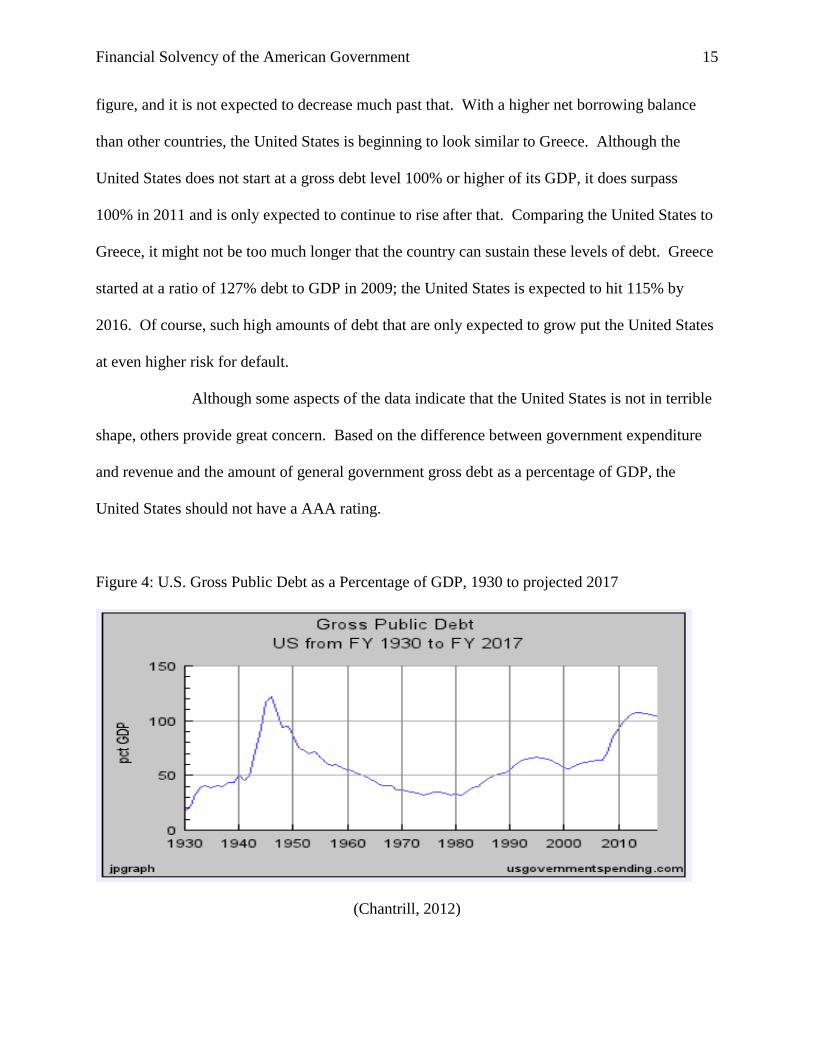
Figure 4: U.S. Gross Public Debt as a Percentage of GDP, 1930 to projected 2017
(Chantrill, 2012)
Financial Solvency of the American Government 16
Even at the beginning of the Great Depression, America’s Gross Public Debt as a
percentage of GDP was well below 50%. While this number rose to over 100% in the 1940s,
debt as a percentage of GDP continued to decline until 1980, when it started to rise again.
According to Figure 4, over the past thirty years (see Appendix 3.4), the United States has
consistently raised its debt as a percentage of GDP. Although it started under 50% in 1980, it
has grown to exceed 100% in 2011, mostly increasing after the 2008 financial crisis, suggesting
that the United States credit rating should not have taken so long to drop from AAA to AA+.
According to Appendix 3.4, the United States increased past the AAA range between 2005 and
2010, around 2008.
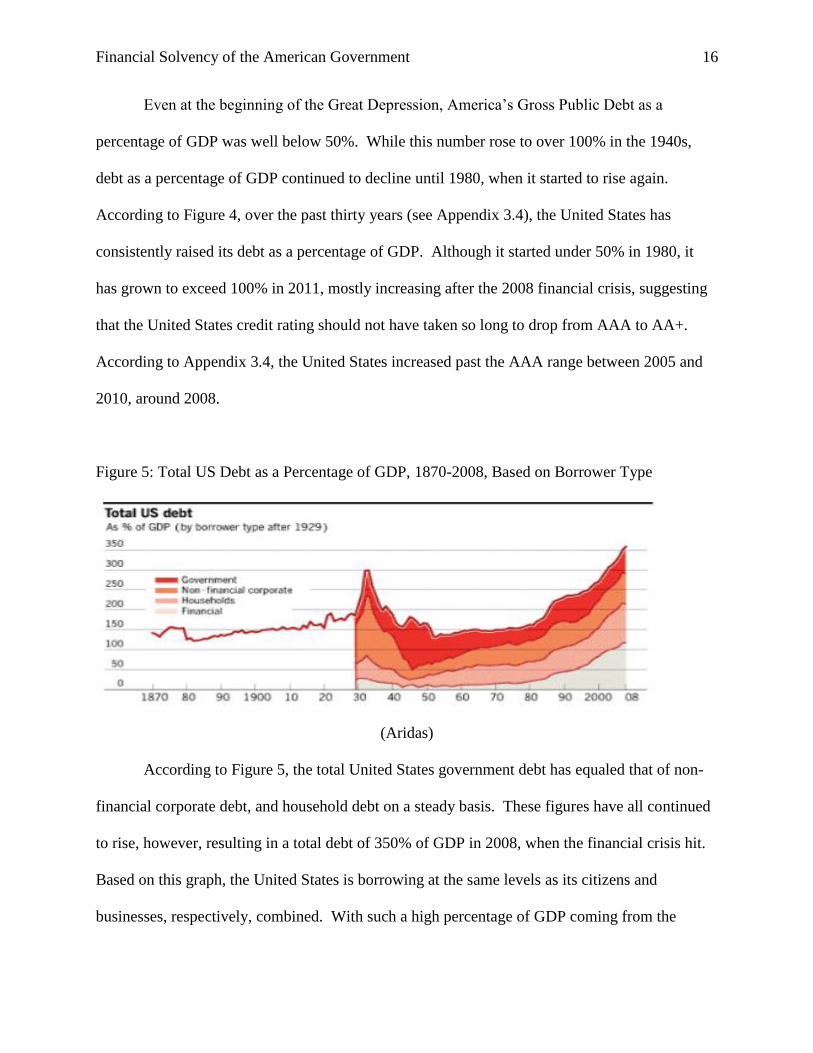
Figure 5: Total US Debt as a Percentage of GDP, 1870-2008, Based on Borrower Type
(Aridas)
According to Figure 5, the total United States government debt has equaled that of non-
financial corporate debt, and household debt on a steady basis. These figures have all continued
to rise, however, resulting in a total debt of 350% of GDP in 2008, when the financial crisis hit.
Based on this graph, the United States is borrowing at the same levels as its citizens and
businesses, respectively, combined. With such a high percentage of GDP coming from the
Financial Solvency of the American Government 17
governmental entity alone, the amount of debt the United States holds as a country might pose a
serious issue for repayment.
Summary of Analysis
Although the United States is the leader of GDP growth from 2009 to 2016, its other
figures do not indicate that it is a very solvent nation. Based on net lending and borrowing, the
United States also does not deserve a AA+ rating. The best determinant, though, gross debt as a
percent of GDP, shows that the United States should have been rated at a BBB+. Based on the
analysis, the United States does not have a strong capacity to repay its debt and should not have
received a AA+ rating from Standard and Poor’s.
If the United States were to experience more growth in GDP than debt, it could possibly
achieve a AAA credit rating again in the future. For a AAA rating, based on the data and ratings
for the other countries, the United States must have a debt-to-GDP ratio around 80% or below.
Based on a growth of 140.35%2 in debt from 2000 to 2010, the amount of growth needed by
GDP for the ratio to get down to 80% is determined. In 2011, GDP was $15.04 trillion ("CIA -
the,"). Based on the 100% ratio in 2011, debt is concluded to be the same amount. The
following calculation shows the amount of growth in GDP needed to achieve an 80% debt-to-
GDP ratio by 2021, given the 140.35% growth debt is currently experiencing.
2 In 2000, debt was $5628.7 billion. In 2010, debt was $13528.82 billion. ("Government spending chart:," )
Financial Solvency of the American Government 18
.80 =
.80 =
.80(36.1486) = 15.04(1+x)
28.9189 = 15.04(1+x)
1.9228 = 1+x
.9228 = x
Thus, GDP needs to grow by 92.28% over the ten years for the United States to obtain an 80%
debt-to-GDP ratio and a AAA rating by 2021. Considering that GDP only grew 47.22%3 from
2000 to 2010, it is unlikely that the United States will achieve this goal.
3 In 2000, GDP was $9884.17 billion. In 2010, GDP was $14551.8 billion. ("US gross domestic," )
Financial Solvency of the American Government 19
IV. United States Debt Analyzed by Standard Lending Rules
One of the most prominent discussion topics in the nation recently has been the amount
of debt the United States government holds. As Abel said, if citizens, financial institutions, an
other countries decide to stop purchasing Treasury securities, some government programs might
no longer be able to function (Abel, 1992). In this case, the United States would be forced to
change either its budgeting processes or its basic governmental structure, as Greece has recently
experienced. If the government were any other institution, debtors would approve it for these
loans based on specified ratios. These standard lending rules can be applied to the government’s
current financial data to determine eligibility for a safe loan that a debtor can expect to be repaid.
When making these calculations, tax receipts will be considered the country’s income. In basic
business and political jargon, the terms “surplus” and “deficit” represent the total amount extra
that a company brought in or the total amount a company lost during the year, respectively. The
surplus and deficit can thus be considered as a “net operating income,” the income from normal
business operations that the company has left over after all expenditures have been made at the
end of the year. This use of surplus and deficit as net operating income occurs in the following
analysis. All data used in these calculations comes from the United States Office of
Management and Budget’s historical tables, Table 1.3, Summary of Receipts, Outlays, and
Surpluses or Deficits (-) in Current Dollars, Constant (FY 2005) Dollars, and as Percentages of
GDP: 1940-2017.
The most basic business rule is the break-even rule, where companies attempt to bring in
more than they spend. For a government to break even, it must have a zero balance or a surplus,
where tax receipts are equal to or greater than government expenditures. A deficit would mean
that the government did not break even. Since 1940, the American government has only had a
Financial Solvency of the American Government 20
surplus 12 times. In 2002, the difference went from a $128.2 billion surplus to a $157.8 billion
deficit, and the deficits have almost consistently increased since then. According to this rule, the
United States is not functioning as a sustainable economic entity. Comparing the United States
government to a business, however, poses a few issues. Because governments wield the power
to tax, they are the ones issuing currency and determining which currency will be used to repay
their debts. Also, some governments, including the United States, can print money to repay their
debts instead of repaying debt out of income. Governments can also create and enforce legal
contracts. These three differences between governments and businesses could make a difference
in analyzing the United States according to business-related rules.
To determine whether a bank will lend money to an individual, there are two main
standard lending rules (Weliver, 2010). First, the mortgage payment must not exceed 28% of the
individual’s gross monthly income. Second, the total of the individual’s monthly mandatory
payments must not exceed 40% of gross monthly income.
For the 40% rule, the sum of debts is not the entire amount of debt a person has but the
sum of his required payments toward debt during the year. In 2010, the United States had
receipts of $2.17 trillion. Also in 2010, the United States paid $415 billion in interest expenses
alone ("Government - interest," 2012). Thus, the interest payments on the national debt account
for 415/2170, or 19.12% of the country’s receipts. Note that the 19.12% includes only interest
payments, so it meets the 28% rule. Adding in fixed expenditures, like an individual would with
his credit card debt, car payment, etc., gives the total debt used for the 40% rule. Assuming that
Social Security, Medicare, and Medicaid do not need debt funding additional to what taxpayers
put into the systems, fixed spending in 2010 was around $590 billion (Amadeo, 2012). Adding
this figure to the interest payment, the result is total mandatory payments of $1.005 trillion.
Financial Solvency of the American Government 21
Dividing this figure by the $2.170 trillion of receipts, total debt payments are 46.31% of receipts,
which does not meet the standard.
In lending, if one standard rule is broken, the lender usually will not make the deal. The
American government already has obtained the loan, however. Based on this analysis, the
amount of debt the American government holds is too high because it exceeds the 40% standard.
A loan based on this percentage of debt to income would be considered at risk or subprime. In
fact, people are starting to figure this out about the American debt. With the Federal Reserve
purchasing most of the Treasury issuance last year, the amount of debt appears lower (Goodman,
2012). According to Goodman, if the Federal Reserve weans the Treasury from this “subsidized
spending and borrowing,” and natural buyers begin purchasing the securities again, the deficit
incurred might convince the government to attempt to reduce its high amount of debt (Goodman,
2012). If the government can reduce its amount of debt, it might get back under the 40%
standard and once again be operating with debt levels that are sustainable by individuals and
businesses.
Financial Solvency of the American Government 22
V. Summary and Conclusions
The United States is experiencing a decreased likelihood of ability to repay its debt,
bringing into question its future solvency. This analysis shows that the American government
might not be able to sustain its level of debt in the future. Although Standard and Poor’s only
downgraded the American debt to AA+, it should have been downgraded lower based on net
lending/borrowing and gross debt as a percent of GDP. The United States also does not meet the
standards for its debt that its individual citizens are required to meet to get a loan. If the United
States were an individual, it would not be able to borrow as much money as it has.
Although this analysis shows discouraging results, the United States does have options
for increasing its future ability to maintain solvency and achieving a higher credit rating. As
Abel said, the government can either increase taxation or reduce expenditures (Abel, 1992). The
United States also could print more money, inflating the money supply. Increasing the money
supply would decrease the value of the currency and could cause a decline in the American
economy, so it is not the most feasible option. Increasing taxation would provide more revenue
and cash flow for the government to repay its debt. Decreasing expenditures would allow for
more of the revenue the government already collects to be spent paying off the principal of its
debt. To pay off this principal, the Treasury could buy back securities. These purchases would
also eliminate the interest payments the government would have to make when before these
securities come due.
Financial Solvency of the American Government 23
References
Abel, A. B. (1992). Can the government roll over its debt forever?. The Business Review,
Retrieved from http://www.phil.frb.org/research-and-data/publications/business-
Amadeo, K. (2012). Fy 2010 us federal budget - how the fy 2010 social security budget and
health care budget affected the us economy. Retrieved from
http://useconomy.about.com/od/usfederalbudget/p/FY2010_Mandatory_Budget.htm
Aridas, T. (n.d.). Total debt to gdp. Global Finance, Retrieved from
http://www.gfmag.com/tools/global-database/economic-data/10403-total-debt-to-
gdp.html
Chantrill, C. (n.d.). Government spending chart: United states 1930-2017 - federal state local
data. Retrieved from
http://www.usgovernmentspending.com/spending_chart_1930_2017USp_13s1li001mcn_
H0f
CIA - the world factbook. (n.d.). Retrieved from https://www.cia.gov/library/publications/the-
world-factbook/geos/us.html
Colwell, P. F., & Trefzger, J. W. (1995). Loan underwriting rules of thumb. Illinois Real Estate
Leter, Retrieved from http://business.illinois.edu/orer/V9-2-4.pdf
Damodaran, A. (2012, January). Country default spreads and risk premiums. Retrieved from
http://pages.stern.nyu.edu/~adamodar/New_Home_Page/datafile/ctryprem.html
Ferguson, B. M. (2011, July 25). Us debt default will punish pensions. Retrieved from
http://www.marketoracle.co.uk/Article29474.html
Goodman, L. (2012). Demand for u.s. debt is not limitless.The Wall Street Journal, Retrieved
from
Financial Solvency of the American Government 24
http://online.wsj.com/article/SB10001424052702304450004577279754275393064.html?
mod=googlenews_wsj
Gordon, J. S. (2011). A short primer on the national debt. The Wall Street Journal, Retrieved
from
http://online.wsj.com/article/SB10001424053111903480904576510660976229354.html
Government - interest expense on the debt outstanding. (2012). Retrieved from
http://www.treasurydirect.gov/govt/reports/ir/ir_expense.htm
Government investment definition from financial times lexicon. (2012). Retrieved from
http://lexicon.ft.com/Term?term=government-investment
Government spending chart: United states 1997-2017 - federal state local data. (n.d.). Retrieved
from
http://www.usgovernmentspending.com/spending_chart_1997_2017USb_13s1li111mcn_
H0f
Gross domestic savings. (2011). Retrieved from
http://data.worldbank.org/indicator/NY.GDS.TOTL.ZS
Historical federal receipt and outlay summary. (2011, March 25). Retrieved from
http://www.taxpolicycenter.org/taxfacts/displayafact.cfm?Docid=200
International Monetary Fund. (2011, September). Good public data explorer. Retrieved from
http://www.google.com/publicdata/explore?ds=k3s92bru78li6_&ctype=l&strail=false&n
selm=h&met_y=ggxwdg_ngdp&scale_y=lin&ind_y=false&rdim=country&idim=country
:JP:GR:IT:IS:US:GB:AR:IE&tstart=852076800000&tunit=Y&tlen=18&iconSize=0.5&u
niSize=0.035
Financial Solvency of the American Government 25
solvency. (n.d.). Collins English Dictionary - Complete & Unabridged 10th Edition. Retrieved
March 23, 2012, from Dictionary.com
website:http://dictionary.reference.com/browse/solvency
Standard & poor's ratings definitions. In (2011). (pp. 10-11). Standard & Poors Financial
Services. Retrieved from
http://img.en25.com/Web/StandardandPoors/Ratings_Definitions.pdfS&p ratings
sovereign ratings list. (2012). Retrieved from
http://www.standardandpoors.com/ratings/sovereigns/ratings-
list/en/us/?subSectorCode=39&start=100&range=50
U.S. Department of the Treasury, Bureau of the Public Debt. (2012). Interest expense on the debt
outstanding. Retrieved from U.S. Government Printing website:
http://www.treasurydirect.gov/govt/reports/ir/ir_expense.htm
US gross domestic product gdp history united states 1950-2010 - federal state local data. (n.d.).
Retrieved from http://www.usgovernmentspending.com/us_gdp_history
Weliver, D. (2010, March 5). [Web log message]. Retrieved from
http://www.moneyunder30.com/how-much-house-can-you-afford
World economic outlook database. In (2011). World economic outlook database International
Monetary Fund. Retrieved from
http://www.imf.org/external/pubs/ft/weo/2011/02/weodata/index.aspx
Financial Solvency of the American Government 26
Appendix 1: Ideal Data Results for Current, Projected, and Historic Period Analysis
In 2009, immediately following the financial crisis of 2008, the percentage change in the
gross domestic product (GDP) for many countries was negative. Given the conditions of the
global economy, this negative change was to be expected; what truly matters about the analysis
of GDP is what happened and is projected to happen after that initial drop. Ideally, a country’s
GDP as a percentage change and GDP per capita4 will continue to rise. This incline results from
a growth in production of the country overall and suggests that the economy is in an
expansionary period, where there will be higher employment and inflationary pressure on prices.
The government will be able to collect more revenue during this time period, allowing it more
cash flow to repay its debt. To keep this expansionary period sustainable for a longer amount of
time, the best growth to see in GDP is small, not drastic.
For the unemployment rate, a lower number is better. Typically, any time the percent of
the total labor force that is unemployed falls below five percent, the country is said to have full
employment. Again, given the recent financial crisis, these numbers should be fairly high in
2009. The unemployment rate should decline between 2009 and 2016, though. As far as the
actual number of people employed, if the economy is growing, this number should be expected
to rise. A low unemployment rate allows for more taxation and revenue, increasing solvency.
General government revenue should increase over time and should be above general
government total expenditure. Ideally, ceteris paribus (“all other things equal”), these two
would have an inverse relationship, with general government revenue constantly increasing and
general government expenditure decreasing. When the general government total expenditure is
higher than revenue, however, the government has much less of a likelihood of repaying its debt.
4 (per “head,” directly translated from the Latin)
Financial Solvency of the American Government 27
General government net lending/borrowing and general government primary net
lending/borrowing should both be positive, representative of a situation in which the government
is lending money to other countries, financial institutions, et cetera, that can repay the money
with interest to provide revenue. If the lending/borrowing as a percent of GDP is positive, it
should rise to show improvement. If it is negative, it should approach zero. A solvent country
need not necessarily have a positive ratio for this category, but it should show improvement if
the ratio is negative and be should approaching zero for the country to have high solvency.
Finally, general government net debt and general government gross debt as percentages
of GDP should be low. A lower ratio in this category indicates a higher level of solvency for the
given country. When the ratio exceeds 100%, the government’s net or gross debt, respectively,
is higher than the production of the entire country. Countries whose debt thus exceeds their GDP
have a harder time repaying such debt and likely will be considered insolvent with a lower credit
rating.
Financial Solvency of the American Government 28
Appendix 2: Detailed Solvency Analysis for Current and Projected Periods
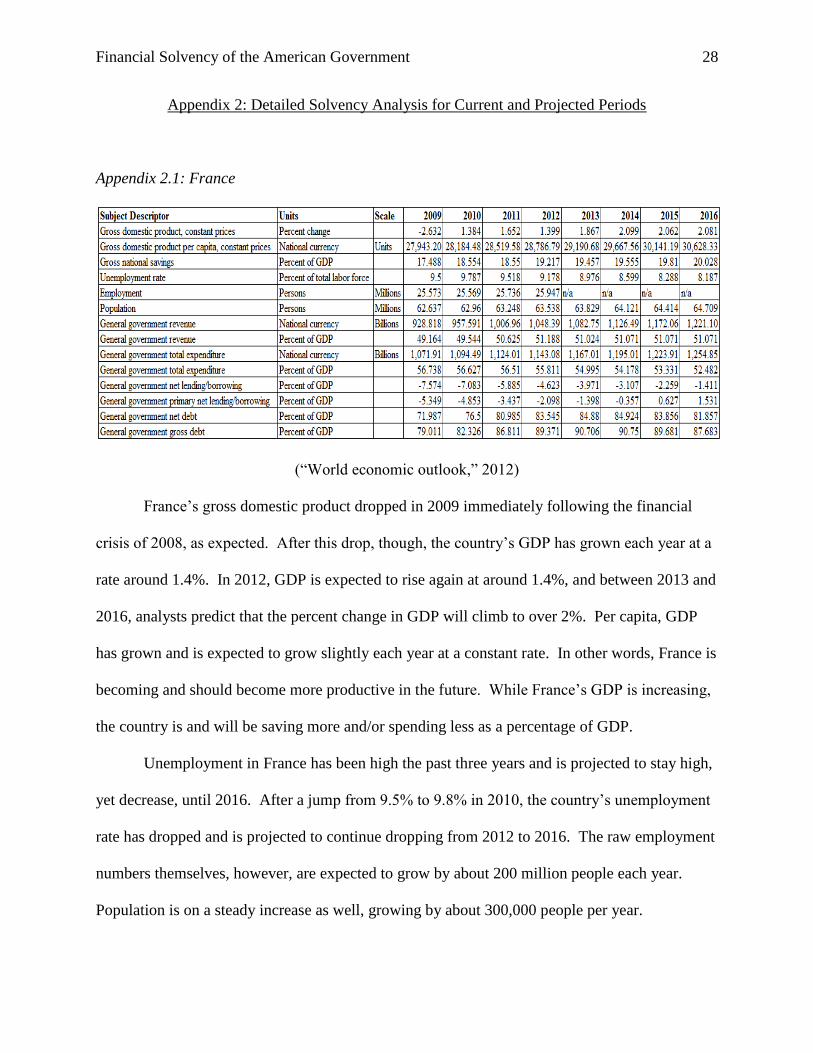
Appendix 2.1: France
(“World economic outlook,” 2012)
France’s gross domestic product dropped in 2009 immediately following the financial
crisis of 2008, as expected. After this drop, though, the country’s GDP has grown each year at a
rate around 1.4%. In 2012, GDP is expected to rise again at around 1.4%, and between 2013 and
2016, analysts predict that the percent change in GDP will climb to over 2%. Per capita, GDP
has grown and is expected to grow slightly each year at a constant rate. In other words, France is
becoming and should become more productive in the future. While France’s GDP is increasing,
the country is and will be saving more and/or spending less as a percentage of GDP.
Unemployment in France has been high the past three years and is projected to stay high,
yet decrease, until 2016. After a jump from 9.5% to 9.8% in 2010, the country’s unemployment
rate has dropped and is projected to continue dropping from 2012 to 2016. The raw employment
numbers themselves, however, are expected to grow by about 200 million people each year.
Population is on a steady increase as well, growing by about 300,000 people per year.
Financial Solvency of the American Government 29
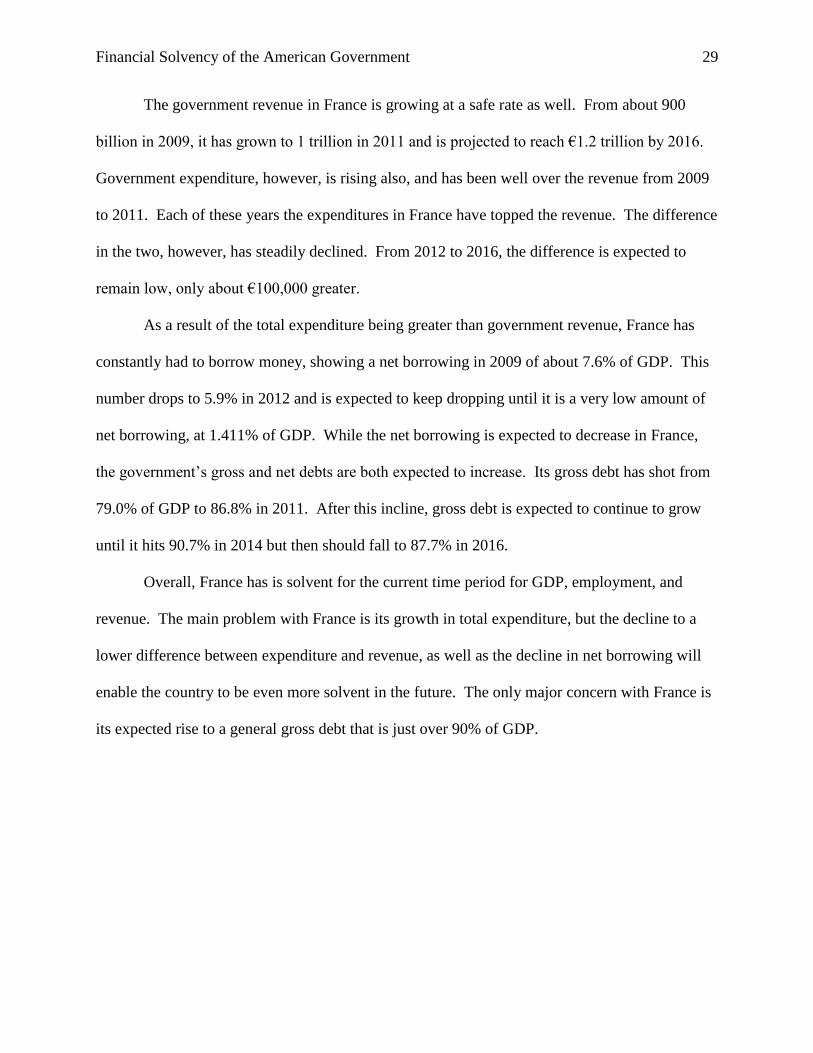
The government revenue in France is growing at a safe rate as well. From about 900
billion in 2009, it has grown to 1 trillion in 2011 and is projected to reach €1.2 trillion by 2016.
Government expenditure, however, is rising also, and has been well over the revenue from 2009
to 2011. Each of these years the expenditures in France have topped the revenue. The difference
in the two, however, has steadily declined. From 2012 to 2016, the difference is expected to
remain low, only about €100,000 greater.
As a result of the total expenditure being greater than government revenue, France has
constantly had to borrow money, showing a net borrowing in 2009 of about 7.6% of GDP. This
number drops to 5.9% in 2012 and is expected to keep dropping until it is a very low amount of
net borrowing, at 1.411% of GDP. While the net borrowing is expected to decrease in France,
the government’s gross and net debts are both expected to increase. Its gross debt has shot from
79.0% of GDP to 86.8% in 2011. After this incline, gross debt is expected to continue to grow
until it hits 90.7% in 2014 but then should fall to 87.7% in 2016.
Overall, France has is solvent for the current time period for GDP, employment, and
revenue. The main problem with France is its growth in total expenditure, but the decline to a
lower difference between expenditure and revenue, as well as the decline in net borrowing will
enable the country to be even more solvent in the future. The only major concern with France is
its expected rise to a general gross debt that is just over 90% of GDP.
Financial Solvency of the American Government 30
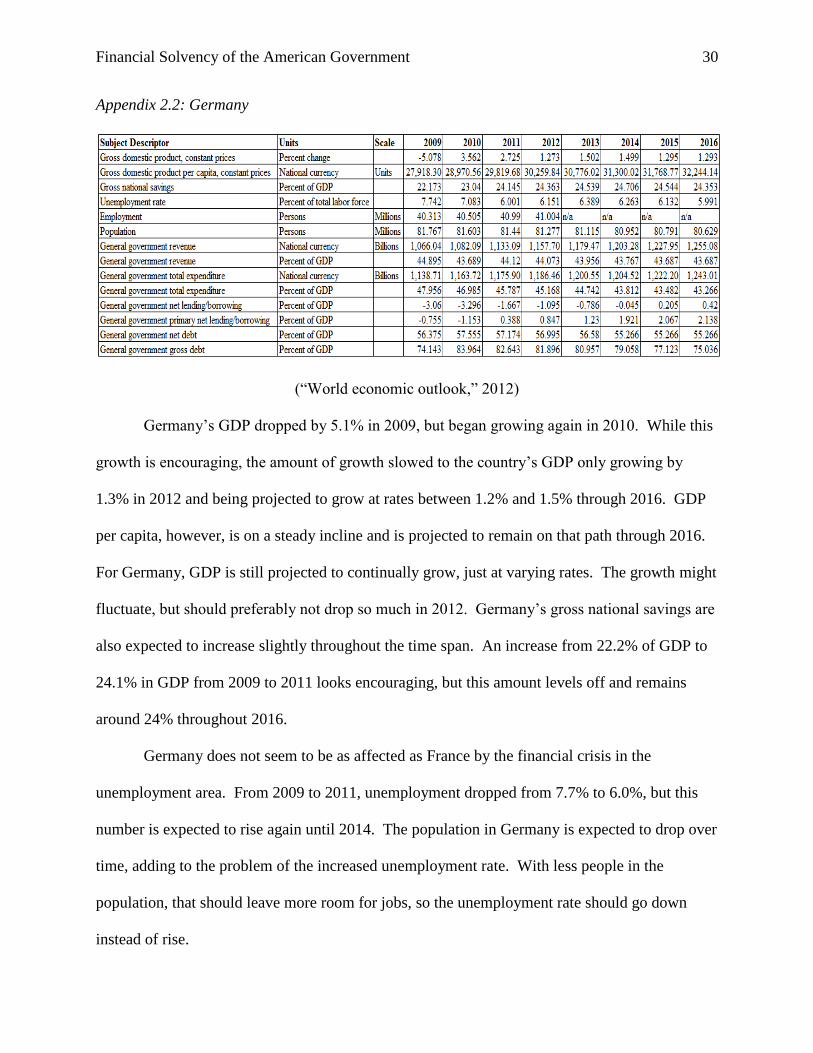
Appendix 2.2: Germany
(“World economic outlook,” 2012)
Germany’s GDP dropped by 5.1% in 2009, but began growing again in 2010. While this
growth is encouraging, the amount of growth slowed to the country’s GDP only growing by
1.3% in 2012 and being projected to grow at rates between 1.2% and 1.5% through 2016. GDP
per capita, however, is on a steady incline and is projected to remain on that path through 2016.
For Germany, GDP is still projected to continually grow, just at varying rates. The growth might
fluctuate, but should preferably not drop so much in 2012. Germany’s gross national savings are
also expected to increase slightly throughout the time span. An increase from 22.2% of GDP to
24.1% in GDP from 2009 to 2011 looks encouraging, but this amount levels off and remains
around 24% throughout 2016.
Germany does not seem to be as affected as France by the financial crisis in the
unemployment area. From 2009 to 2011, unemployment dropped from 7.7% to 6.0%, but this
number is expected to rise again until 2014. The population in Germany is expected to drop over
time, adding to the problem of the increased unemployment rate. With less people in the
population, that should leave more room for jobs, so the unemployment rate should go down
instead of rise.
Financial Solvency of the American Government 31
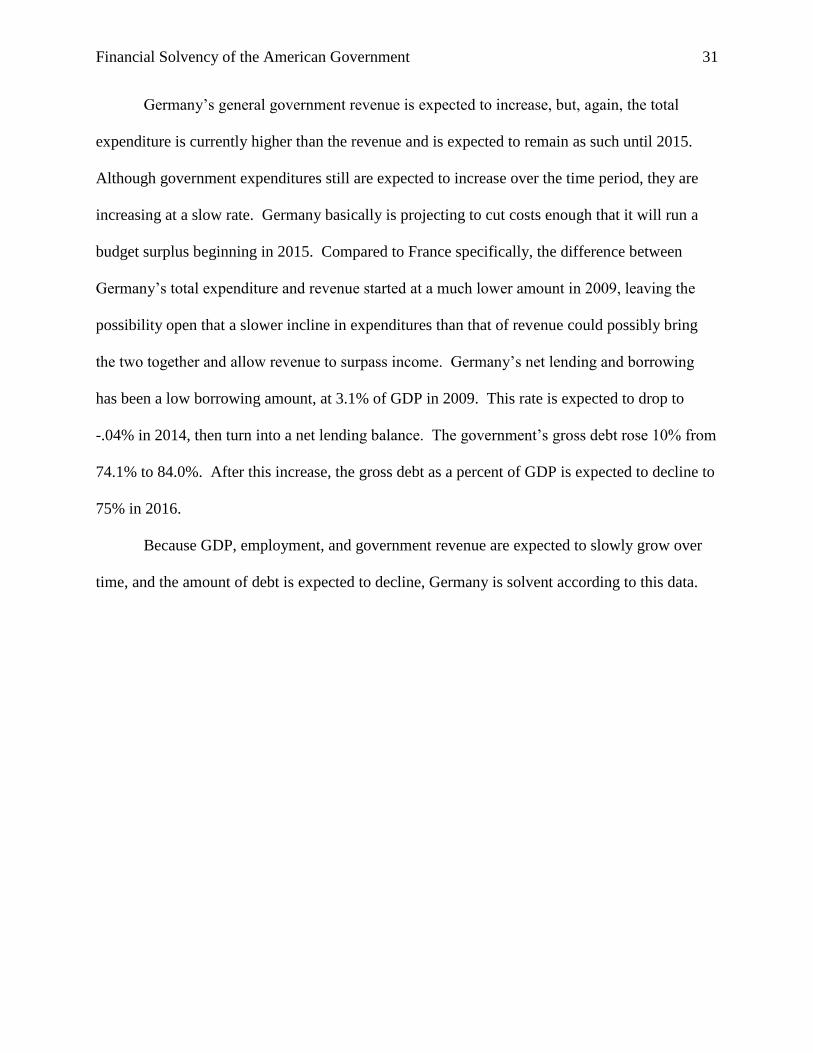
Germany’s general government revenue is expected to increase, but, again, the total
expenditure is currently higher than the revenue and is expected to remain as such until 2015.
Although government expenditures still are expected to increase over the time period, they are
increasing at a slow rate. Germany basically is projecting to cut costs enough that it will run a
budget surplus beginning in 2015. Compared to France specifically, the difference between
Germany’s total expenditure and revenue started at a much lower amount in 2009, leaving the
possibility open that a slower incline in expenditures than that of revenue could possibly bring
the two together and allow revenue to surpass income. Germany’s net lending and borrowing
has been a low borrowing amount, at 3.1% of GDP in 2009. This rate is expected to drop to
-.04% in 2014, then turn into a net lending balance. The government’s gross debt rose 10% from
74.1% to 84.0%. After this increase, the gross debt as a percent of GDP is expected to decline to
75% in 2016.
Because GDP, employment, and government revenue are expected to slowly grow over
time, and the amount of debt is expected to decline, Germany is solvent according to this data.
Financial Solvency of the American Government 32
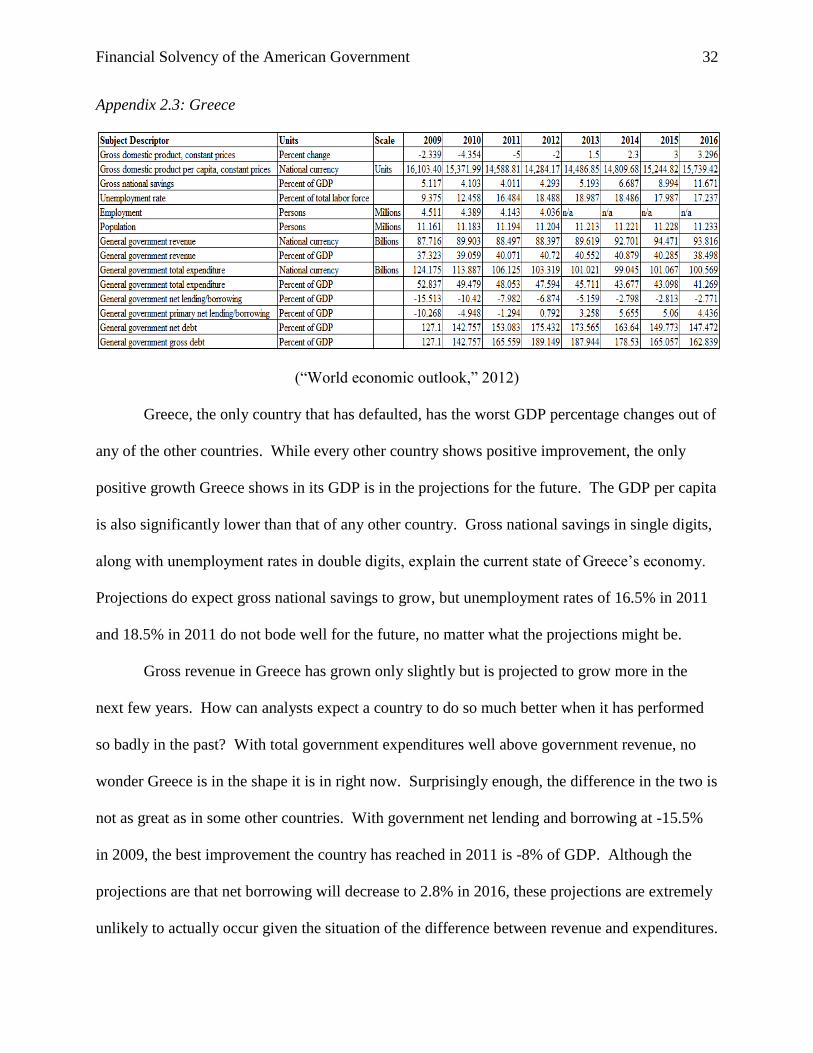
Appendix 2.3: Greece
(“World economic outlook,” 2012)
Greece, the only country that has defaulted, has the worst GDP percentage changes out of
any of the other countries. While every other country shows positive improvement, the only
positive growth Greece shows in its GDP is in the projections for the future. The GDP per capita
is also significantly lower than that of any other country. Gross national savings in single digits,
along with unemployment rates in double digits, explain the current state of Greece’s economy.
Projections do expect gross national savings to grow, but unemployment rates of 16.5% in 2011
and 18.5% in 2011 do not bode well for the future, no matter what the projections might be.
Gross revenue in Greece has grown only slightly but is projected to grow more in the
next few years. How can analysts expect a country to do so much better when it has performed
so badly in the past? With total government expenditures well above government revenue, no
wonder Greece is in the shape it is in right now. Surprisingly enough, the difference in the two is
not as great as in some other countries. With government net lending and borrowing at -15.5%
in 2009, the best improvement the country has reached in 2011 is -8% of GDP. Although the
projections are that net borrowing will decrease to 2.8% in 2016, these projections are extremely
unlikely to actually occur given the situation of the difference between revenue and expenditures.
Financial Solvency of the American Government 33
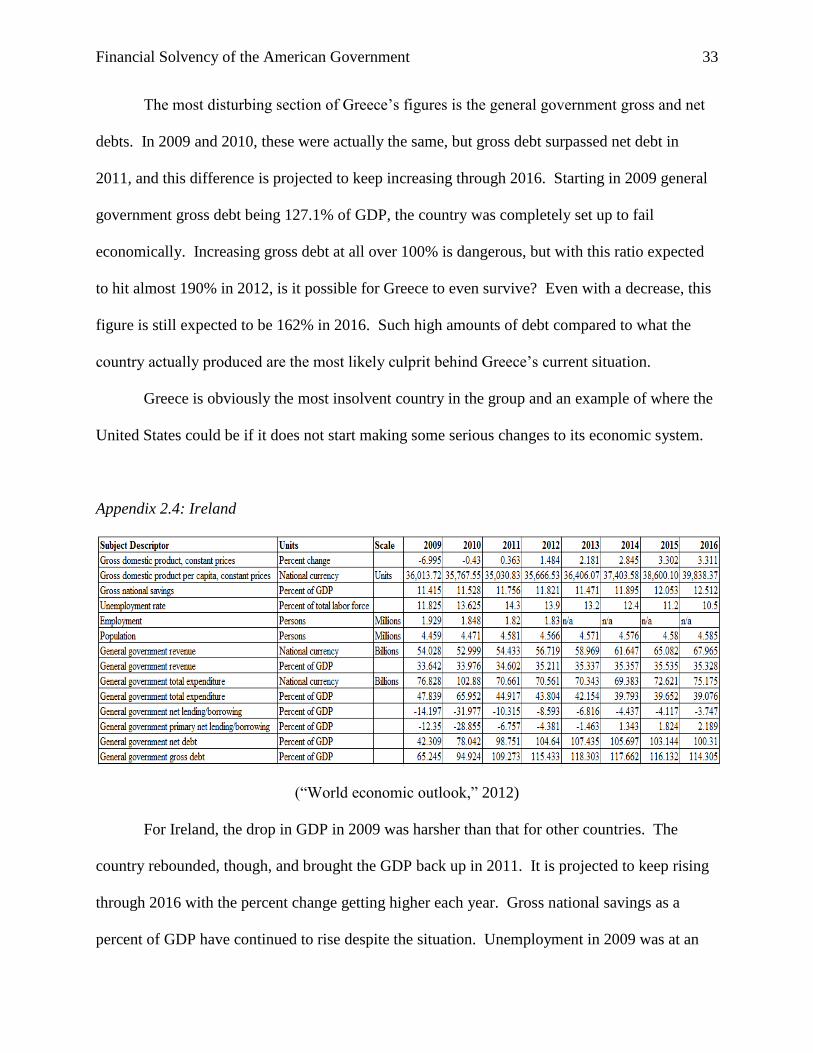
The most disturbing section of Greece’s figures is the general government gross and net
debts. In 2009 and 2010, these were actually the same, but gross debt surpassed net debt in
2011, and this difference is projected to keep increasing through 2016. Starting in 2009 general
government gross debt being 127.1% of GDP, the country was completely set up to fail
economically. Increasing gross debt at all over 100% is dangerous, but with this ratio expected
to hit almost 190% in 2012, is it possible for Greece to even survive? Even with a decrease, this
figure is still expected to be 162% in 2016. Such high amounts of debt compared to what the
country actually produced are the most likely culprit behind Greece’s current situation.
Greece is obviously the most insolvent country in the group and an example of where the
United States could be if it does not start making some serious changes to its economic system.
Appendix 2.4: Ireland
(“World economic outlook,” 2012)
For Ireland, the drop in GDP in 2009 was harsher than that for other countries. The
country rebounded, though, and brought the GDP back up in 2011. It is projected to keep rising
through 2016 with the percent change getting higher each year. Gross national savings as a
percent of GDP have continued to rise despite the situation. Unemployment in 2009 was at an
Financial Solvency of the American Government 34
already high rate of 11.9%, but in 2010 and 2011 it got even worse, ending up at 14.3%.
Although this number is projected to decrease over the next few years, it still should remain at
least 10%, if not well over.
Ireland’s general government revenue is a percent of GDP has consistently risen between
2009 and 2011 and is expected to sustain at least the same amount of growth until 2016. In
actual Euros, though, the government revenue dropped slightly from 2009 to 2010, due to the
drop in GDP. Total expenditure for Ireland began at a high enough amount over revenue, but
when it rose from a 3/2 ratio of total expenditure to revenue in 2009 to being double, that was too
much. Apparently the government agreed, however, because it fell again in 2011 and is expected
to remain level while revenues are expected to rise, allowing the government to make enough
money to cover its spending. As a result of the 2010 drastic change in expenditures, government
net lending and borrowing also surpassed an extremely high and dangerous amount, with a -32%
net borrowing in 2010, but this amount decreased again to a normal basis and is expected to
decrease even more until 2016. The general government gross debt, however, is a major
concern. In 2011, the country had debt 109.3% of GDP; this number is only expected to rise.
Without changing this policy, regardless of anything else, Ireland is one of the more insolvent
countries in the group and is headed down the same path Greece took.
Financial Solvency of the American Government 35
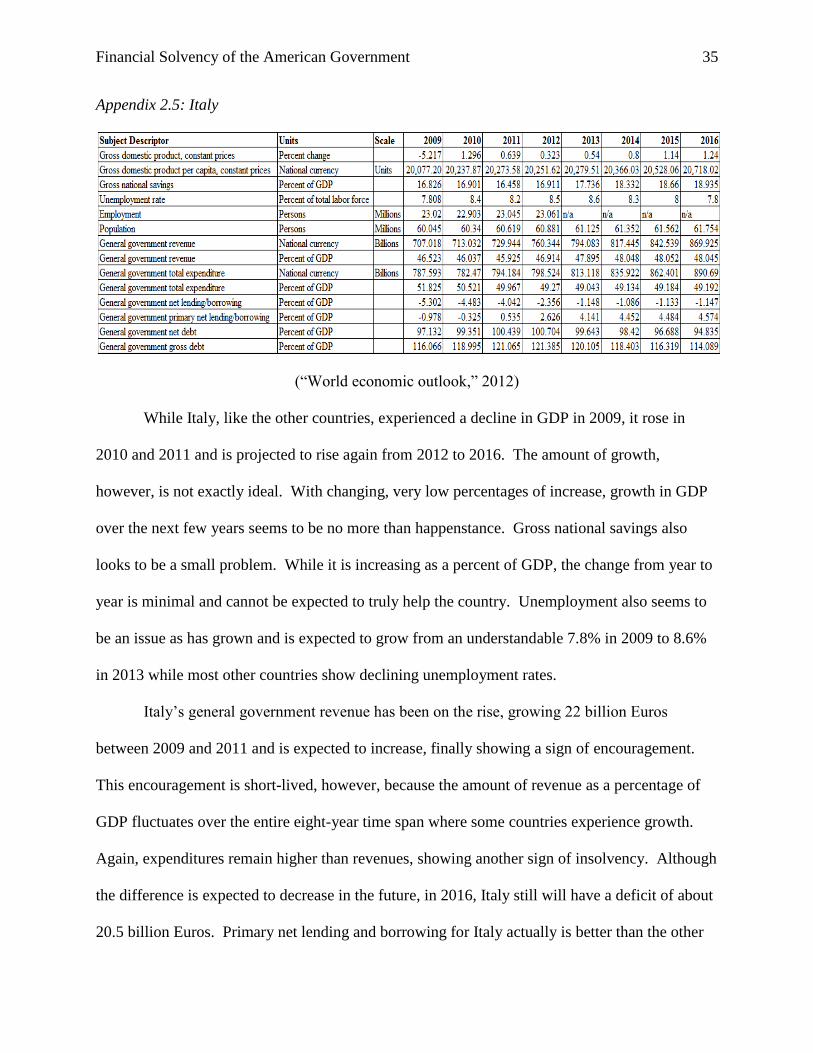
Appendix 2.5: Italy
(“World economic outlook,” 2012)
While Italy, like the other countries, experienced a decline in GDP in 2009, it rose in
2010 and 2011 and is projected to rise again from 2012 to 2016. The amount of growth,
however, is not exactly ideal. With changing, very low percentages of increase, growth in GDP
over the next few years seems to be no more than happenstance. Gross national savings also
looks to be a small problem. While it is increasing as a percent of GDP, the change from year to
year is minimal and cannot be expected to truly help the country. Unemployment also seems to
be an issue as has grown and is expected to grow from an understandable 7.8% in 2009 to 8.6%
in 2013 while most other countries show declining unemployment rates.
Italy’s general government revenue has been on the rise, growing 22 billion Euros
between 2009 and 2011 and is expected to increase, finally showing a sign of encouragement.
This encouragement is short-lived, however, because the amount of revenue as a percentage of
GDP fluctuates over the entire eight-year time span where some countries experience growth.
Again, expenditures remain higher than revenues, showing another sign of insolvency. Although
the difference is expected to decrease in the future, in 2016, Italy still will have a deficit of about
20.5 billion Euros. Primary net lending and borrowing for Italy actually is better than the other
Financial Solvency of the American Government 36
countries, though. Although Italy does run a net borrowing amount, it starts at only 5.3% in
2009 and is expected to gradually decrease over time. The gross debt, however, seems to be a
great issue. Italy is ahead of Ireland on government gross debt, starting at 116.1% of GDP in
2009. This rate increased until 2012, but it is expected to slowly decrease between 2012 and
2016.
Most of these figures paint a bad picture for Italy’s future. Although the numbers might
look scary, there is room for improvement, and Italy does seem to be taking small steps to make
its government more solvent.
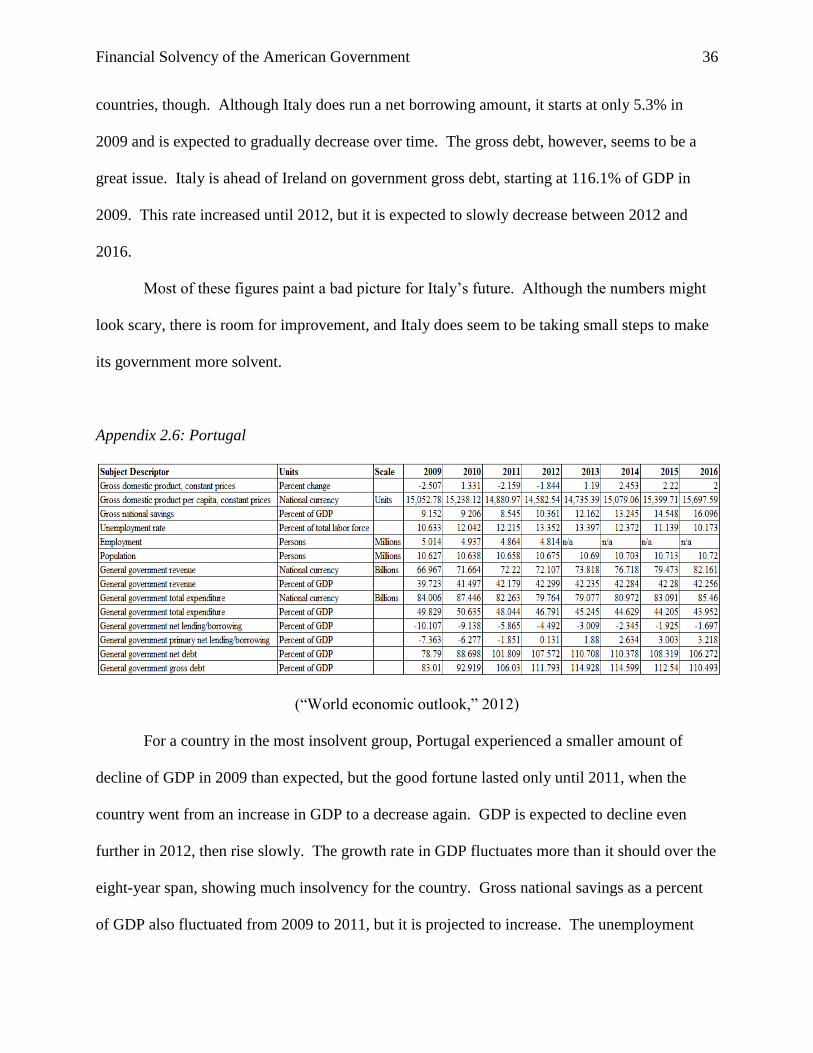
Appendix 2.6: Portugal
(“World economic outlook,” 2012)
For a country in the most insolvent group, Portugal experienced a smaller amount of
decline of GDP in 2009 than expected, but the good fortune lasted only until 2011, when the
country went from an increase in GDP to a decrease again. GDP is expected to decline even
further in 2012, then rise slowly. The growth rate in GDP fluctuates more than it should over the
eight-year span, showing much insolvency for the country. Gross national savings as a percent
of GDP also fluctuated from 2009 to 2011, but it is projected to increase. The unemployment
Financial Solvency of the American Government 37
rate has risen and should continue to rise through 2013, when it should start falling again.
Considering that all the rates are above ten percent, however, Portugal does not look like the
ideal place to be an employee or citizen.
Portugal has experienced a small increase in general government revenue from 2009 to
2011. The amount of revenue is expected to slowly rise through 2016. Expenditures started at
17 billion Euros higher than revenue, but by 2011 were only 10 billion Euros higher. In 2016,
they are projected to be a mere 3 billion Euros higher than revenue. With Portugal working on
reducing expenditures relative to revenues, the country’s net lending and borrowing should be
expected to improve. From 2009 to 2011, Portugal cut its net borrowing almost in half to 5.9%,
and projections show it reaching a borrowed amount of 1.7% of GDP in 2016. Also, although
the amount of government gross debt rose drastically by 23 percentage points of GDP from 2009
to 2011, the number is expected to rise only slightly until 2014 then begin to fall.
Like Italy, Portugal seems to be in bad shape but is also taking steps that will lead it in
the right direction for the future.
Financial Solvency of the American Government 38
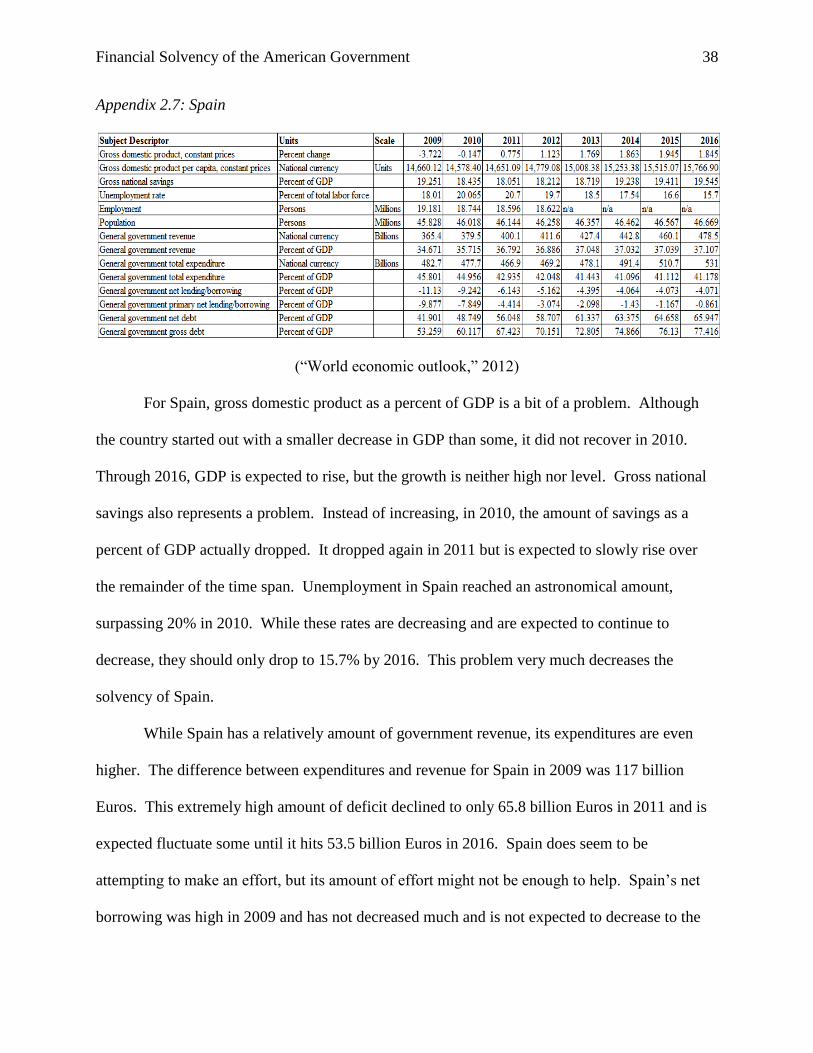
Appendix 2.7: Spain
(“World economic outlook,” 2012)
For Spain, gross domestic product as a percent of GDP is a bit of a problem. Although
the country started out with a smaller decrease in GDP than some, it did not recover in 2010.
Through 2016, GDP is expected to rise, but the growth is neither high nor level. Gross national
savings also represents a problem. Instead of increasing, in 2010, the amount of savings as a
percent of GDP actually dropped. It dropped again in 2011 but is expected to slowly rise over
the remainder of the time span. Unemployment in Spain reached an astronomical amount,
surpassing 20% in 2010. While these rates are decreasing and are expected to continue to
decrease, they should only drop to 15.7% by 2016. This problem very much decreases the
solvency of Spain.
While Spain has a relatively amount of government revenue, its expenditures are even
higher. The difference between expenditures and revenue for Spain in 2009 was 117 billion
Euros. This extremely high amount of deficit declined to only 65.8 billion Euros in 2011 and is
expected fluctuate some until it hits 53.5 billion Euros in 2016. Spain does seem to be
attempting to make an effort, but its amount of effort might not be enough to help. Spain’s net
borrowing was high in 2009 and has not decreased much and is not expected to decrease to the
Financial Solvency of the American Government 39
point that other countries have. Although this information makes Spain look like an extremely
insolvent country, Spain is not so bad off as to be compared with Portugal or Greece.
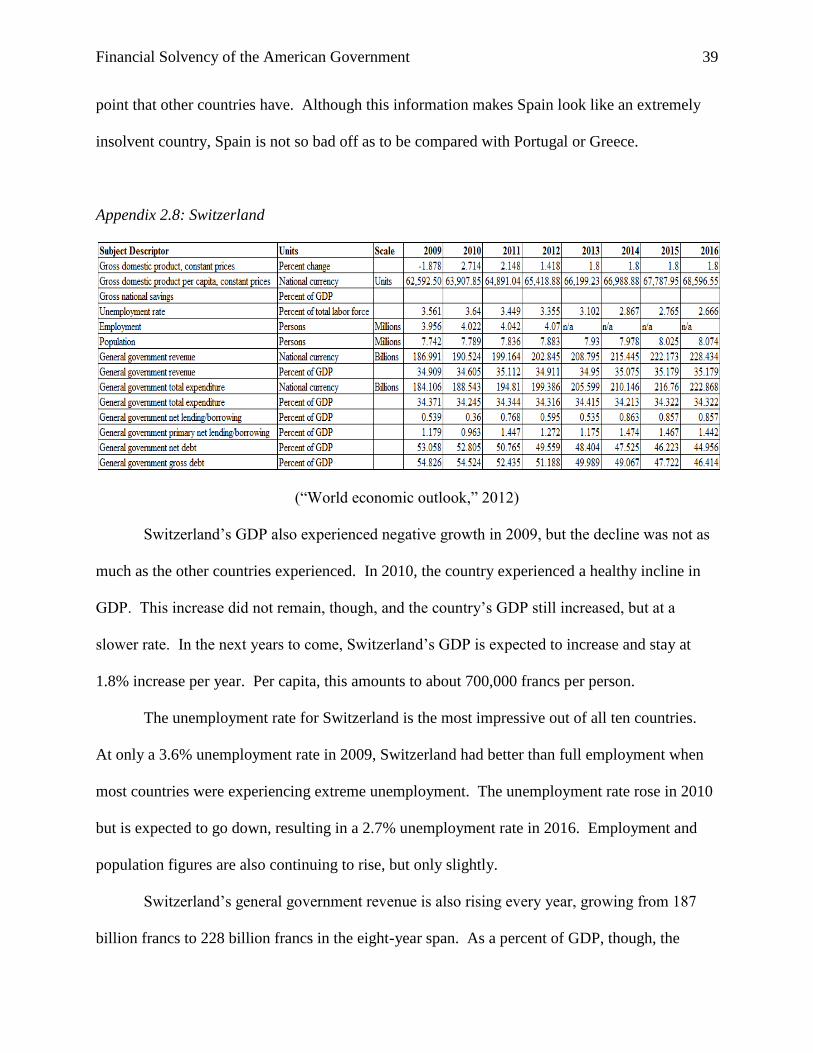
Appendix 2.8: Switzerland
(“World economic outlook,” 2012)
Switzerland’s GDP also experienced negative growth in 2009, but the decline was not as
much as the other countries experienced. In 2010, the country experienced a healthy incline in
GDP. This increase did not remain, though, and the country’s GDP still increased, but at a
slower rate. In the next years to come, Switzerland’s GDP is expected to increase and stay at
1.8% increase per year. Per capita, this amounts to about 700,000 francs per person.
The unemployment rate for Switzerland is the most impressive out of all ten countries.
At only a 3.6% unemployment rate in 2009, Switzerland had better than full employment when
most countries were experiencing extreme unemployment. The unemployment rate rose in 2010
but is expected to go down, resulting in a 2.7% unemployment rate in 2016. Employment and
population figures are also continuing to rise, but only slightly.
Switzerland’s general government revenue is also rising every year, growing from 187
billion francs to 228 billion francs in the eight-year span. As a percent of GDP, though, the
Financial Solvency of the American Government 40
increase is not as impressive. Switzerland is the only one of the ten countries to show
government revenue greater than total expenditure that is positive every year making it the most
solvent. It also has experienced and plans to keep a positive net lending/borrowing, making it
the only country also to be a net lender each year. Its government’s gross debt is also extremely
low, staying in the low 50% range and the high 40% range. Also to be noted, the government’s
net debt and gross debt are extremely close, only a couple percentage points apart at most during
any year in the time period. Overall, Switzerland is the most solvent country and enjoys the best
results in almost every category out of the ten countries.
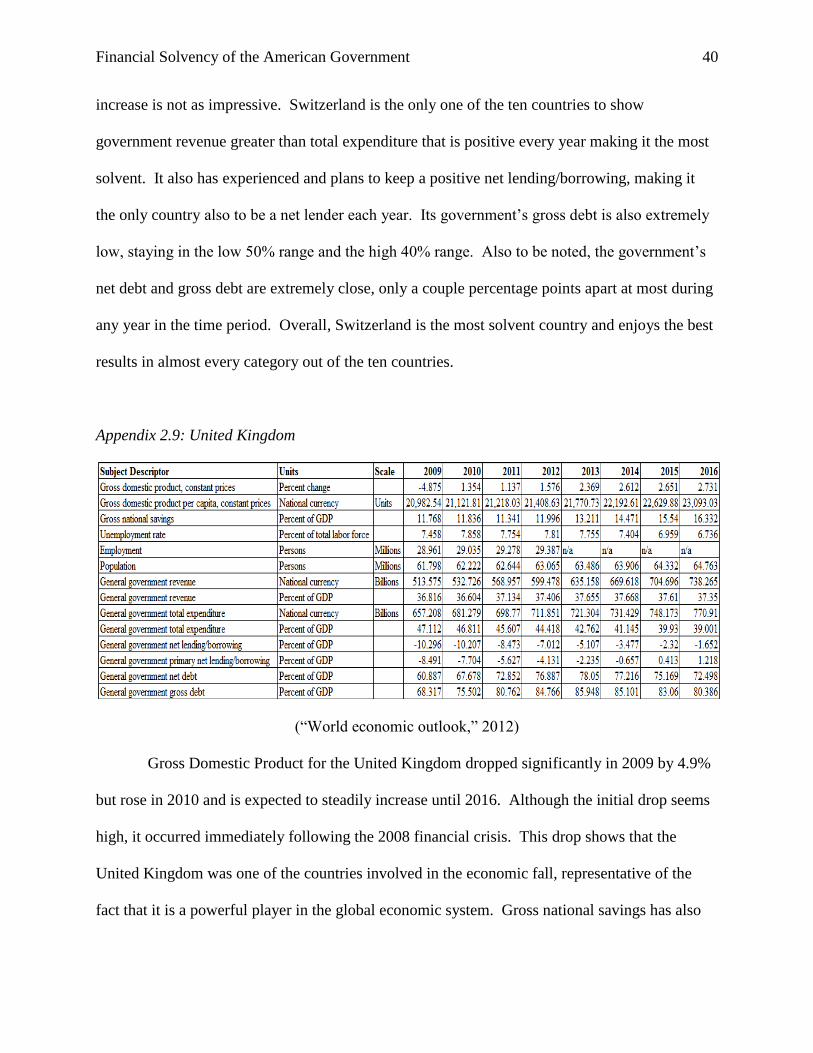
Appendix 2.9: United Kingdom
(“World economic outlook,” 2012)
Gross Domestic Product for the United Kingdom dropped significantly in 2009 by 4.9%
but rose in 2010 and is expected to steadily increase until 2016. Although the initial drop seems
high, it occurred immediately following the 2008 financial crisis. This drop shows that the
United Kingdom was one of the countries involved in the economic fall, representative of the
fact that it is a powerful player in the global economic system. Gross national savings has also
Financial Solvency of the American Government 41
been rising, and is projected to continue to rise at a growing rate. These two areas are growing
ideally for the United Kingdom, showing that it is experiencing growth in its economy.
Unemployment in the United Kingdom began in 2009 at a high 7.5% and rose again in
2010 to 7.9%, not unlike other countries that were involved in the 2008 financial crisis. While
most countries show a downward trend in unemployment, the United Kingdom’s projections for
unemployment have the rate fluctuating from 2011 to 2016. The actual employment figures
have been rising, but no projects are made for the future. Population is expected to grow,
however, so unemployment being erratic presents a bit of an issue.
The United Kingdom’s general government revenue is increasing, both in actual currency
figures and as a percentage of GDP. While revenue is experiencing healthy growth, expenditures
are also on the rise and are an entire 150 billion British pounds over the amount of revenues in
2009. This difference does not decline much until the projected figures for 2012, when it
declines to 120 billion, then about 45 billion in 2015. With such a deficit, the United Kingdom
does not look as solvent as before. The government had a higher net borrowing as a percent of
GDP in 2009, but it fell in 2011 and is projected to decline to a balance of -1.7% of GDP in
2016, a much better rate. The government’s grow debt is still not as high as some of the other
countries, either. Starting at 68% in 2009, it is has risen to 84.8% in 2012 and is expected to rise
in 2013 slightly then fall back down. Unlike some of the countries in the following group, it is
actually projected to decline. Overall, the United Kingdom is more solvent than some countries,
but it is the most insolvent of those in its group.
Financial Solvency of the American Government 42
Appendix 3: Detailed Solvency Analysis for 1980-2010
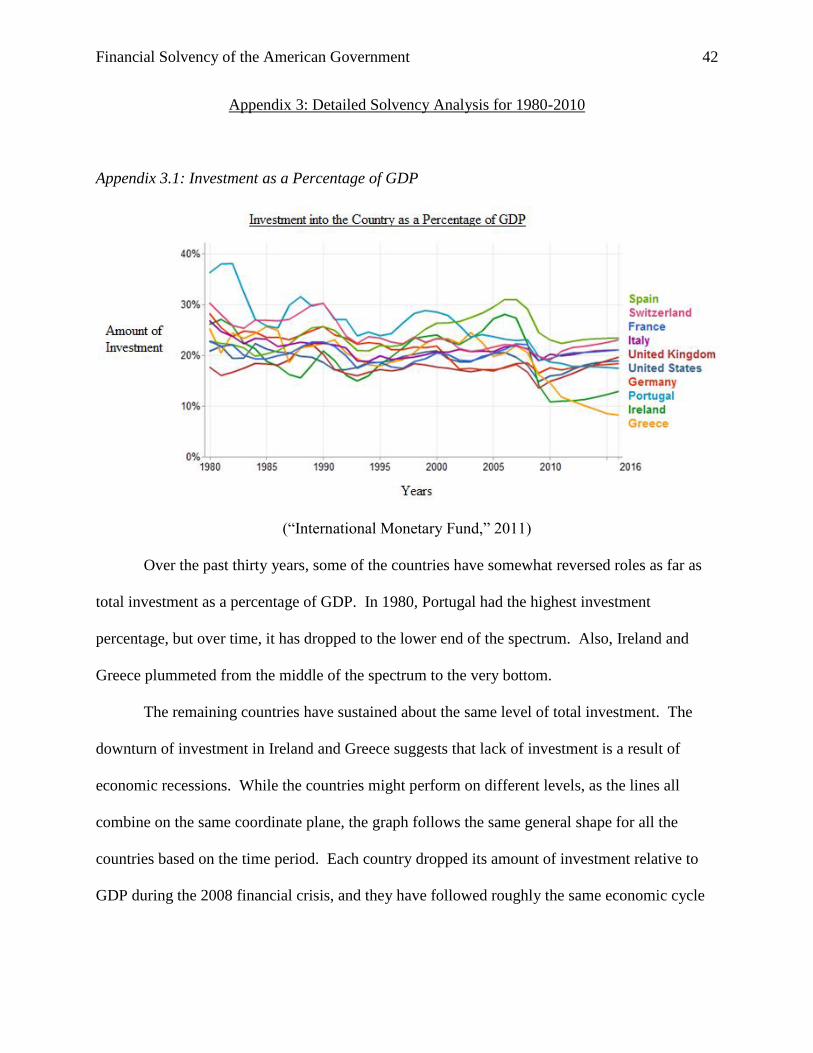
Appendix 3.1: Investment as a Percentage of GDP
(“International Monetary Fund,” 2011)
Over the past thirty years, some of the countries have somewhat reversed roles as far as
total investment as a percentage of GDP. In 1980, Portugal had the highest investment
percentage, but over time, it has dropped to the lower end of the spectrum. Also, Ireland and
Greece plummeted from the middle of the spectrum to the very bottom.
The remaining countries have sustained about the same level of total investment. The
downturn of investment in Ireland and Greece suggests that lack of investment is a result of
economic recessions. While the countries might perform on different levels, as the lines all
combine on the same coordinate plane, the graph follows the same general shape for all the
countries based on the time period. Each country dropped its amount of investment relative to
GDP during the 2008 financial crisis, and they have followed roughly the same economic cycle

Financial Solvency of the American Government 43
over the entire thirty-year time period. From this information, when a country experiences a
recession, total investment as a percentage of GDP is lower.
Over the past thirty years, the United States has had enough money to reinvest it into the
country at a higher proportion than some others. This excess spending could be turned around
and used to repay debt, so America has remained solvent based on this criterion.
Appendix 3.2: Percentage Change in GDP, Constant Prices
Group 1: AAA-AA+ Ratings
(“International Monetary Fund,” 2011)
Financial Solvency of the American Government 44
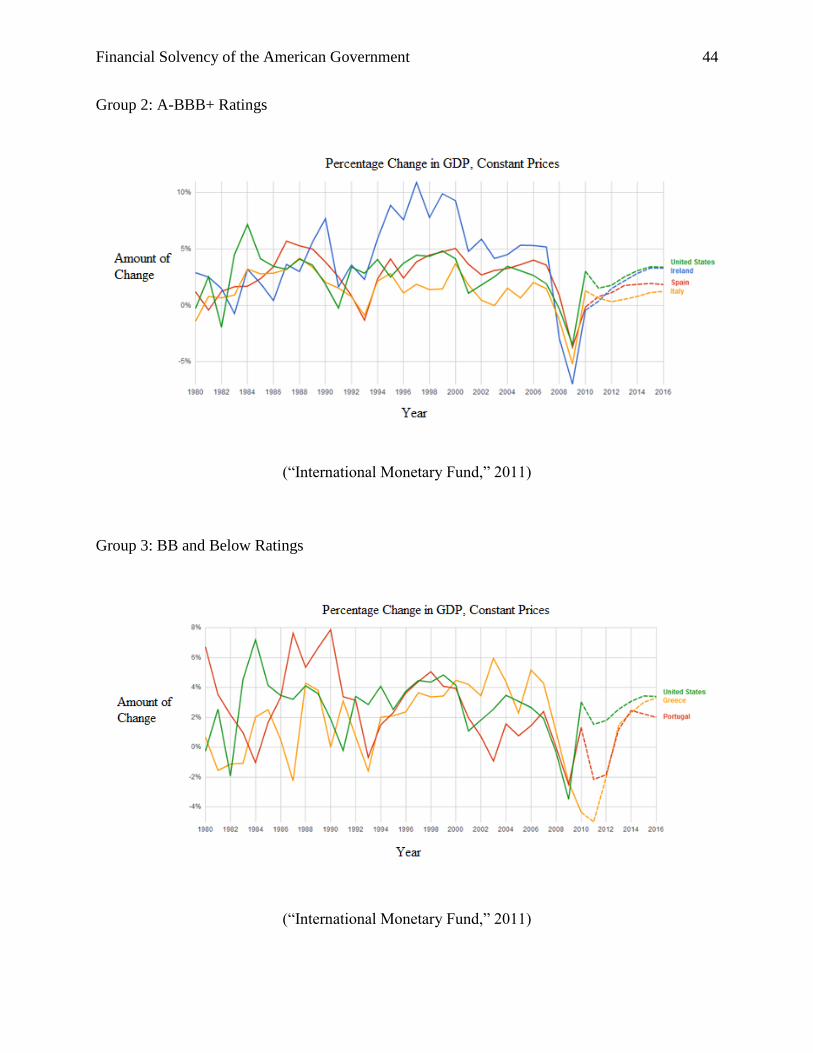
Group 2: A-BBB+ Ratings
(“International Monetary Fund,” 2011)
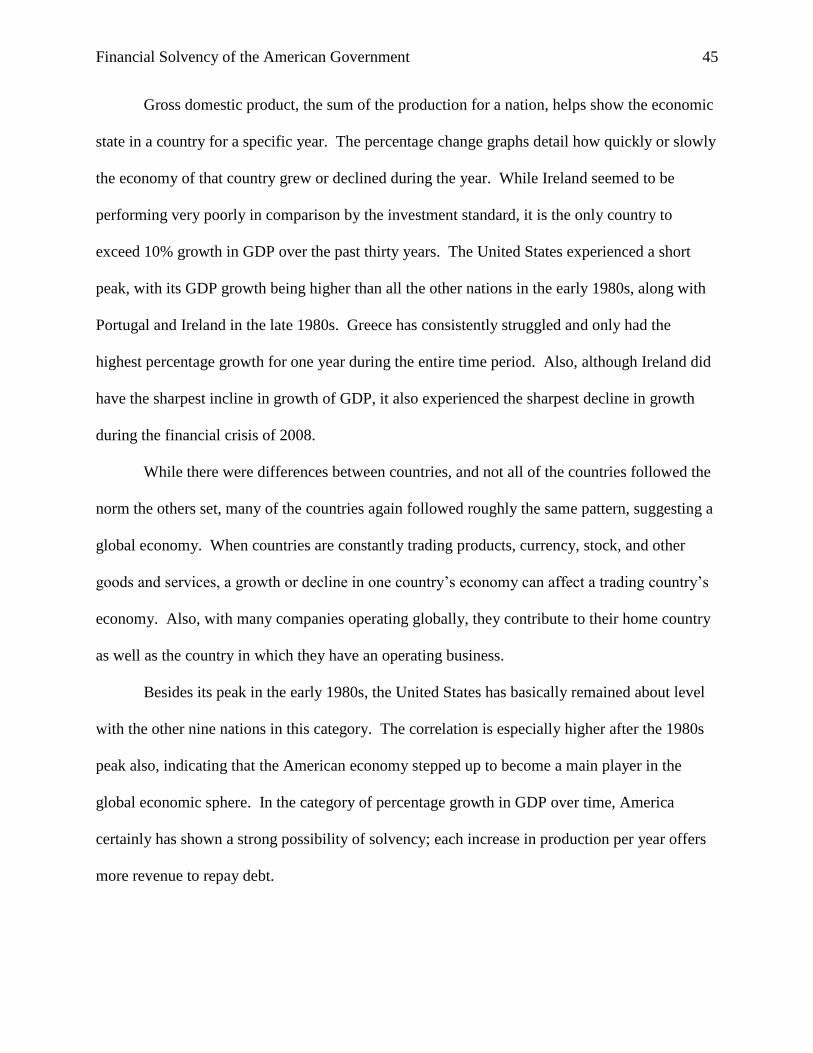
Group 3: BB and Below Ratings
(“International Monetary Fund,” 2011)
Financial Solvency of the American Government 45
Gross domestic product, the sum of the production for a nation, helps show the economic
state in a country for a specific year. The percentage change graphs detail how quickly or slowly
the economy of that country grew or declined during the year. While Ireland seemed to be
performing very poorly in comparison by the investment standard, it is the only country to
exceed 10% growth in GDP over the past thirty years. The United States experienced a short
peak, with its GDP growth being higher than all the other nations in the early 1980s, along with
Portugal and Ireland in the late 1980s. Greece has consistently struggled and only had the
highest percentage growth for one year during the entire time period. Also, although Ireland did
have the sharpest incline in growth of GDP, it also experienced the sharpest decline in growth
during the financial crisis of 2008.
While there were differences between countries, and not all of the countries followed the
norm the others set, many of the countries again followed roughly the same pattern, suggesting a
global economy. When countries are constantly trading products, currency, stock, and other
goods and services, a growth or decline in one country’s economy can affect a trading country’s
economy. Also, with many companies operating globally, they contribute to their home country
as well as the country in which they have an operating business.
Besides its peak in the early 1980s, the United States has basically remained about level
with the other nine nations in this category. The correlation is especially higher after the 1980s
peak also, indicating that the American economy stepped up to become a main player in the
global economic sphere. In the category of percentage growth in GDP over time, America
certainly has shown a strong possibility of solvency; each increase in production per year offers
more revenue to repay debt.
Financial Solvency of the American Government 46
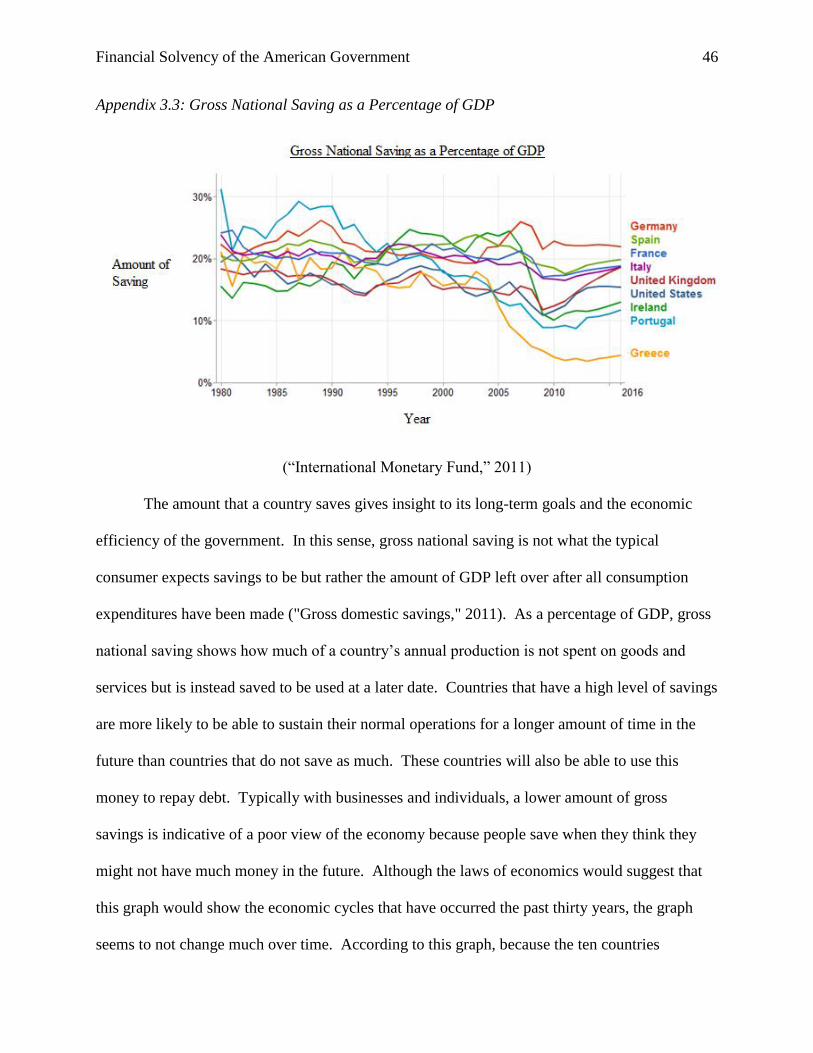
Appendix 3.3: Gross National Saving as a Percentage of GDP
(“International Monetary Fund,” 2011)
The amount that a country saves gives insight to its long-term goals and the economic
efficiency of the government. In this sense, gross national saving is not what the typical
consumer expects savings to be but rather the amount of GDP left over after all consumption
expenditures have been made ("Gross domestic savings," 2011). As a percentage of GDP, gross
national saving shows how much of a country’s annual production is not spent on goods and
services but is instead saved to be used at a later date. Countries that have a high level of savings
are more likely to be able to sustain their normal operations for a longer amount of time in the
future than countries that do not save as much. These countries will also be able to use this
money to repay debt. Typically with businesses and individuals, a lower amount of gross
savings is indicative of a poor view of the economy because people save when they think they
might not have much money in the future. Although the laws of economics would suggest that
this graph would show the economic cycles that have occurred the past thirty years, the graph
seems to not change much over time. According to this graph, because the ten countries
Financial Solvency of the American Government 47
(excluding Greece, of course) stay at relatively the same level of saving as a percentage of GDP,
the proportion of gross national saving does not increase when GDP falls as a result of a
recession. Portugal and Greece are the only two countries who significantly dropped their
proportions, suggesting that, for countries at risk, a higher level of gross national savings as a
percentage of GDP makes a country less solvent.
The United States stayed in almost a horizontal line over the entire thirty-year span, with
only small changes made to the percent of GDP saved. The United States has remained solvent
with its amount of gross national savings as a percentage of GDP.
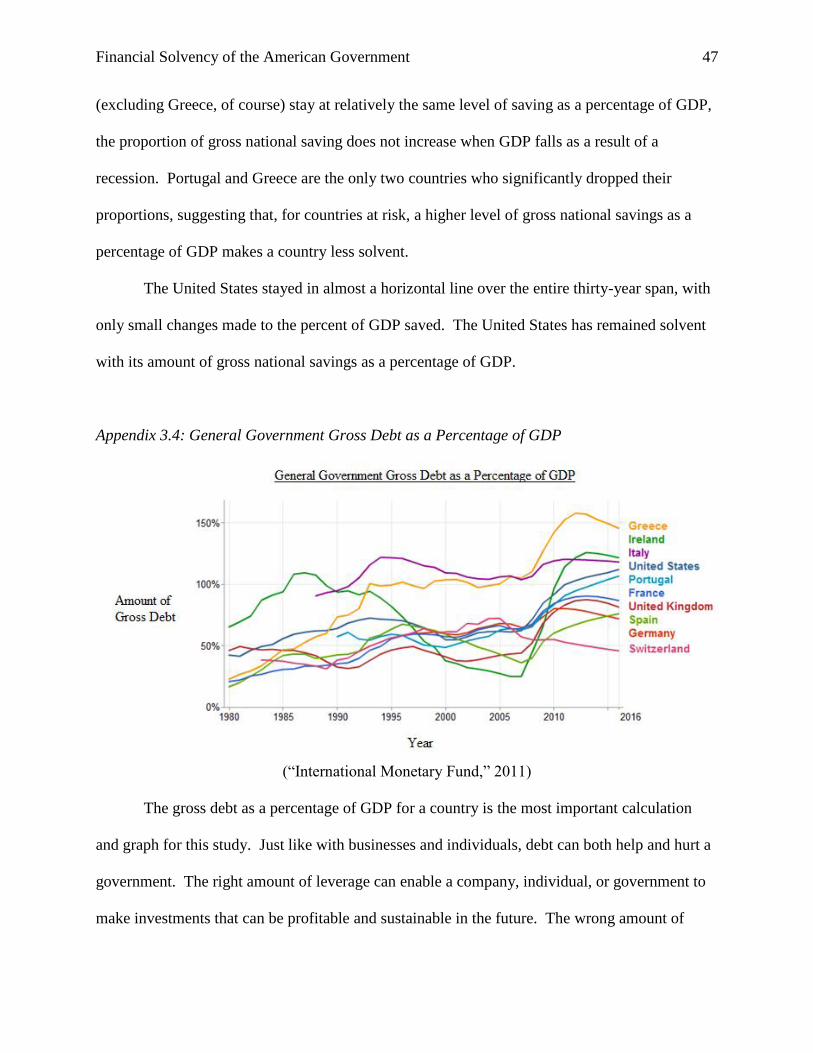
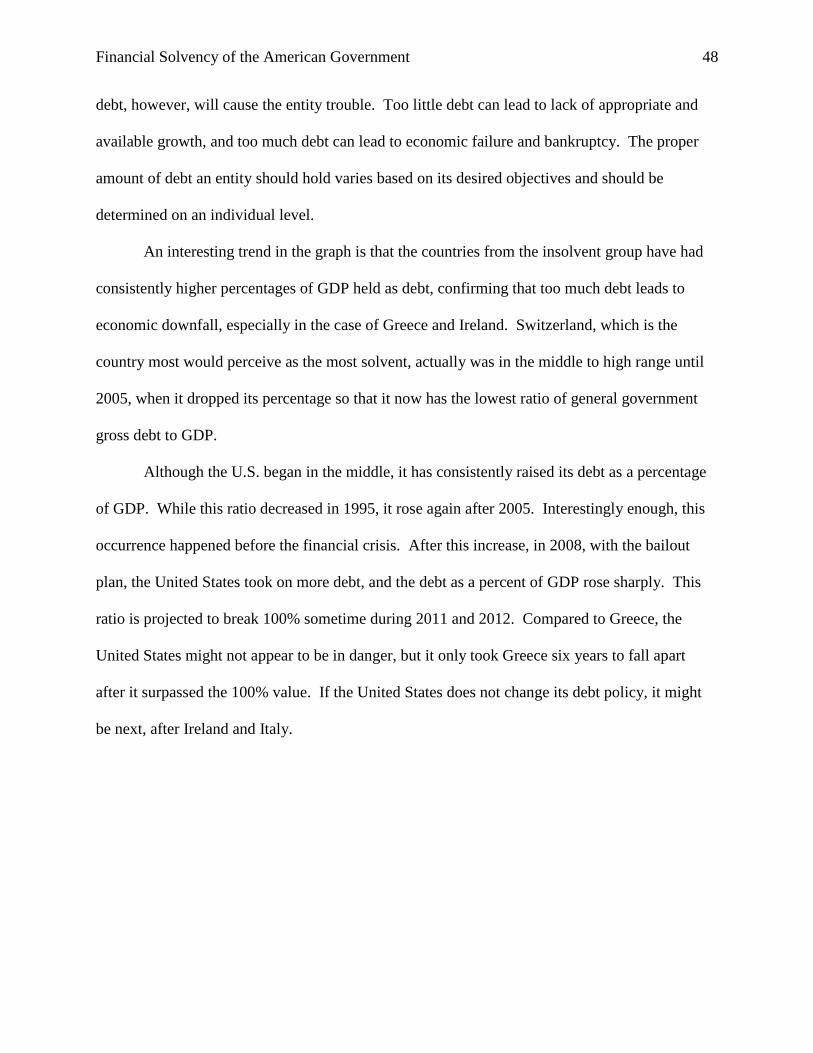
Appendix 3.4: General Government Gross Debt as a Percentage of GDP
(“International Monetary Fund,” 2011)
The gross debt as a percentage of GDP for a country is the most important calculation
and graph for this study. Just like with businesses and individuals, debt can both help and hurt a
government. The right amount of leverage can enable a company, individual, or government to
make investments that can be profitable and sustainable in the future. The wrong amount of
Financial Solvency of the American Government 48
debt, however, will cause the entity trouble. Too little debt can lead to lack of appropriate and
available growth, and too much debt can lead to economic failure and bankruptcy. The proper
amount of debt an entity should hold varies based on its desired objectives and should be
determined on an individual level.
An interesting trend in the graph is that the countries from the insolvent group have had
consistently higher percentages of GDP held as debt, confirming that too much debt leads to
economic downfall, especially in the case of Greece and Ireland. Switzerland, which is the
country most would perceive as the most solvent, actually was in the middle to high range until
2005, when it dropped its percentage so that it now has the lowest ratio of general government
gross debt to GDP.
Although the U.S. began in the middle, it has consistently raised its debt as a percentage
of GDP. While this ratio decreased in 1995, it rose again after 2005. Interestingly enough, this
occurrence happened before the financial crisis. After this increase, in 2008, with the bailout
plan, the United States took on more debt, and the debt as a percent of GDP rose sharply. This
ratio is projected to break 100% sometime during 2011 and 2012. Compared to Greece, the
United States might not appear to be in danger, but it only took Greece six years to fall apart
after it surpassed the 100% value. If the United States does not change its debt policy, it might
be next, after Ireland and Italy.
Financial Solvency of the American Government 49
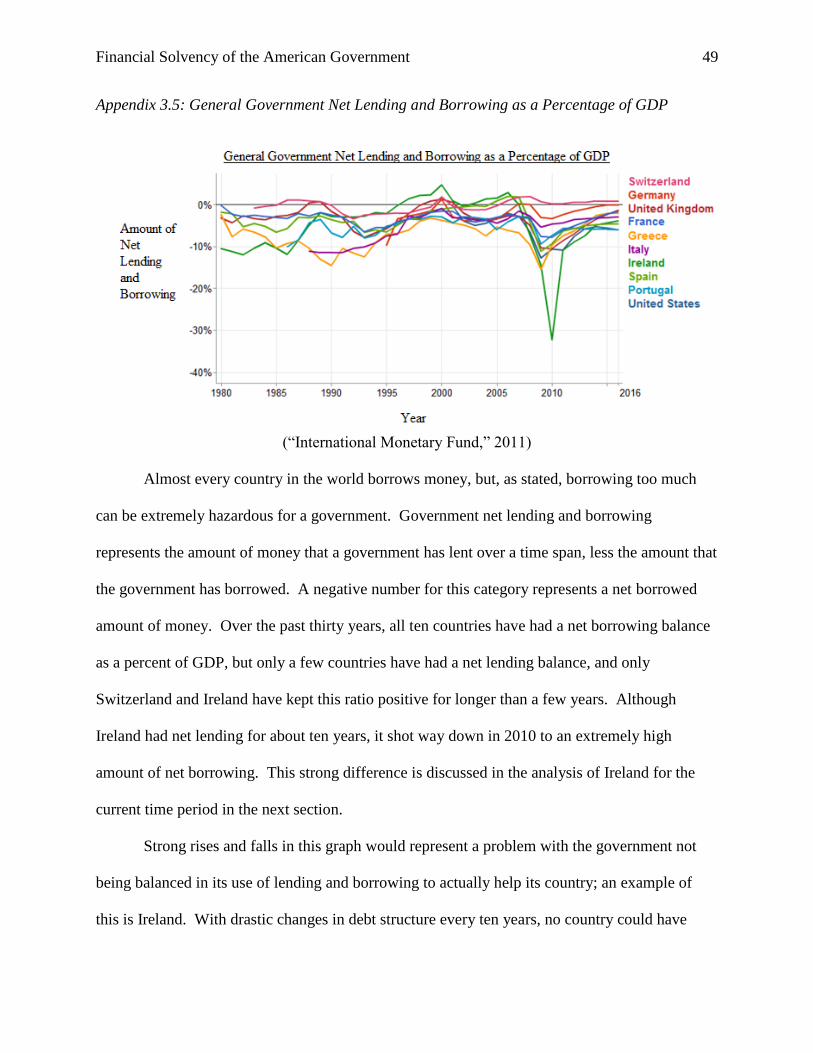
Appendix 3.5: General Government Net Lending and Borrowing as a Percentage of GDP
(“International Monetary Fund,” 2011)
Almost every country in the world borrows money, but, as stated, borrowing too much
can be extremely hazardous for a government. Government net lending and borrowing
represents the amount of money that a government has lent over a time span, less the amount that
the government has borrowed. A negative number for this category represents a net borrowed
amount of money. Over the past thirty years, all ten countries have had a net borrowing balance
as a percent of GDP, but only a few countries have had a net lending balance, and only
Switzerland and Ireland have kept this ratio positive for longer than a few years. Although
Ireland had net lending for about ten years, it shot way down in 2010 to an extremely high
amount of net borrowing. This strong difference is discussed in the analysis of Ireland for the
current time period in the next section.
Strong rises and falls in this graph would represent a problem with the government not
being balanced in its use of lending and borrowing to actually help its country; an example of
this is Ireland. With drastic changes in debt structure every ten years, no country could have
Financial Solvency of the American Government 50
enough solvency for a high credit rating. The current state of Ireland’s economy accurately
reflects the changes Ireland made between 2000 and 2010. Switzerland, however, has remained
balanced, and this small amount of change is represented by the solvency its economy has
experienced over the past thirty years.
The United States has continually remained around the same level as the other countries
for this section, making it difficult to determine which group to put the United States into. It has
remained on the lower end, though, suggesting it has been insolvent compared to some of the
other countries.
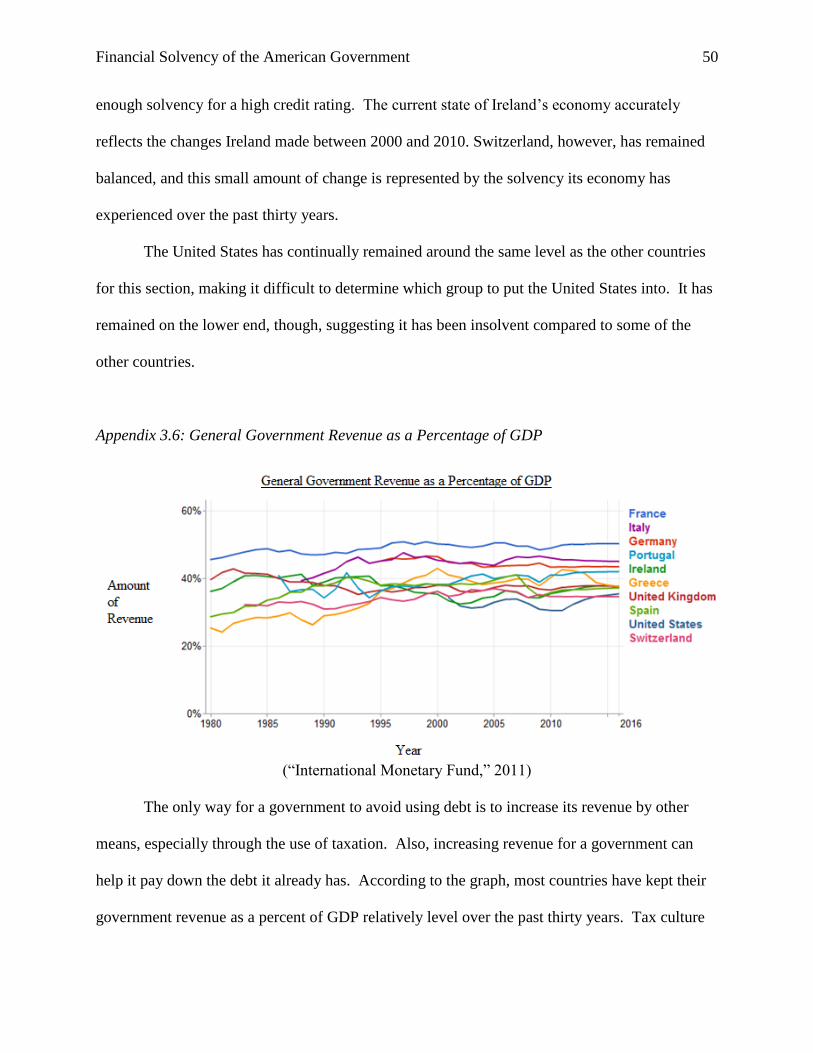
Appendix 3.6: General Government Revenue as a Percentage of GDP
(“International Monetary Fund,” 2011)
The only way for a government to avoid using debt is to increase its revenue by other
means, especially through the use of taxation. Also, increasing revenue for a government can
help it pay down the debt it already has. According to the graph, most countries have kept their
government revenue as a percent of GDP relatively level over the past thirty years. Tax culture
Financial Solvency of the American Government 51
could have pushed to decrease tax revenue, but the governments have attempted to keep it as
level as possible. Only Greece has increased their government revenue over the past thirty years,
from about 20% to about 40%, which does not make sense given its current state.
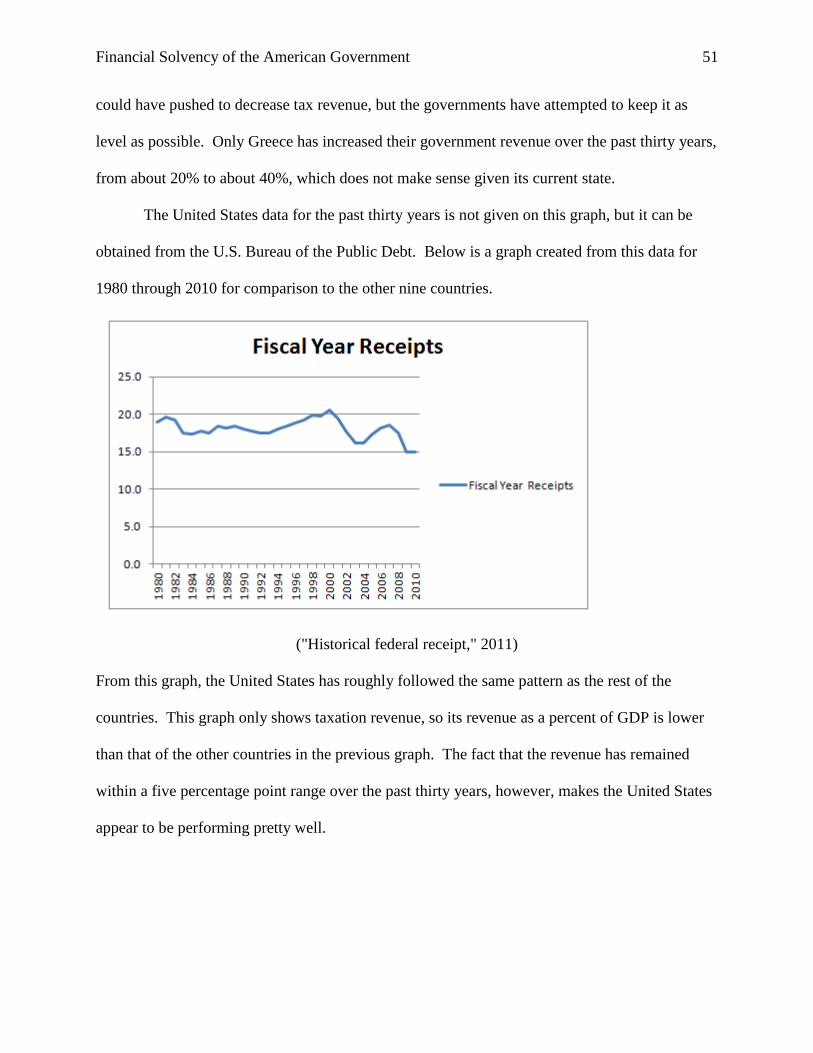
The United States data for the past thirty years is not given on this graph, but it can be
obtained from the U.S. Bureau of the Public Debt. Below is a graph created from this data for
1980 through 2010 for comparison to the other nine countries.
("Historical federal receipt," 2011)
From this graph, the United States has roughly followed the same pattern as the rest of the
countries. This graph only shows taxation revenue, so its revenue as a percent of GDP is lower
than that of the other countries in the previous graph. The fact that the revenue has remained
within a five percentage point range over the past thirty years, however, makes the United States
appear to be performing pretty well.
Financial Solvency of the American Government 52
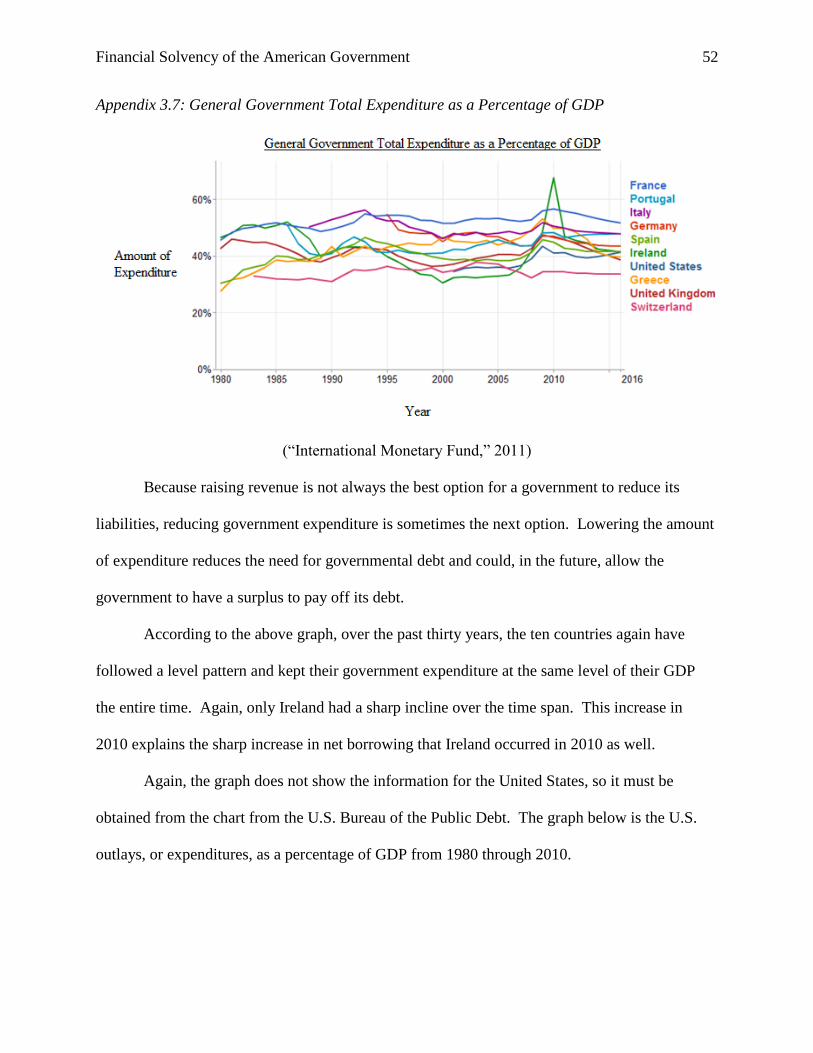
Appendix 3.7: General Government Total Expenditure as a Percentage of GDP
(“International Monetary Fund,” 2011)
Because raising revenue is not always the best option for a government to reduce its
liabilities, reducing government expenditure is sometimes the next option. Lowering the amount
of expenditure reduces the need for governmental debt and could, in the future, allow the
government to have a surplus to pay off its debt.
According to the above graph, over the past thirty years, the ten countries again have
followed a level pattern and kept their government expenditure at the same level of their GDP
the entire time. Again, only Ireland had a sharp incline over the time span. This increase in
2010 explains the sharp increase in net borrowing that Ireland occurred in 2010 as well.
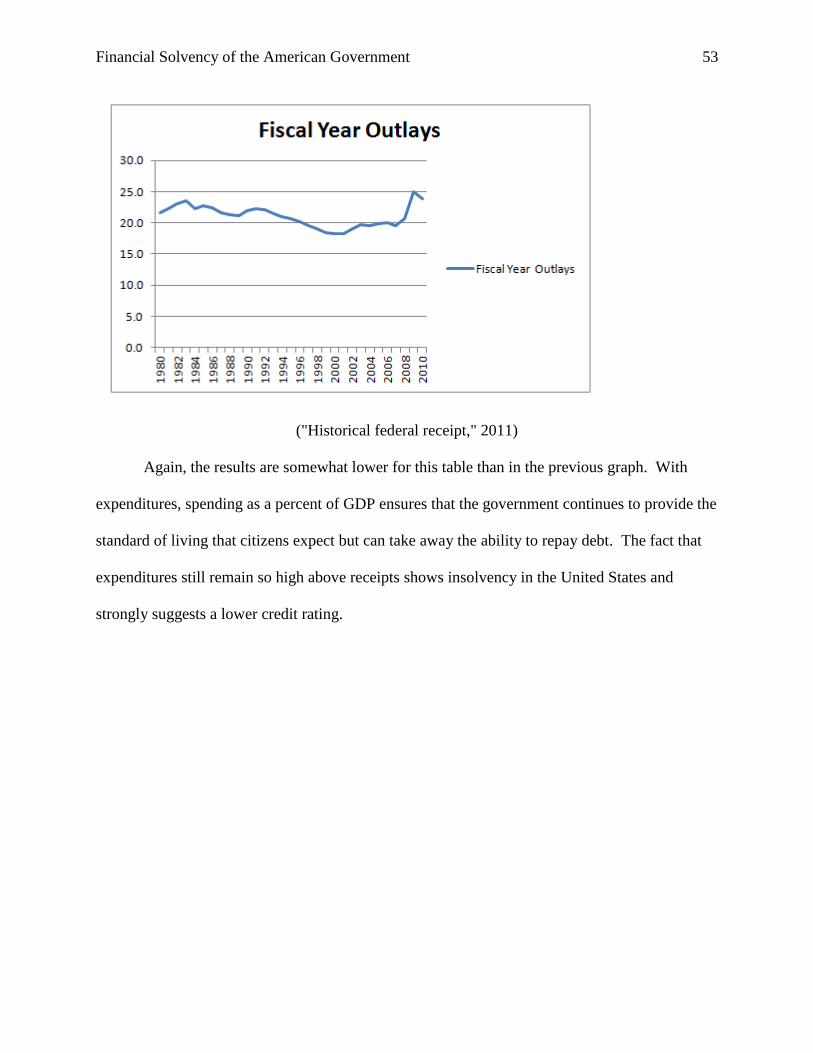
Again, the graph does not show the information for the United States, so it must be
obtained from the chart from the U.S. Bureau of the Public Debt. The graph below is the U.S.
outlays, or expenditures, as a percentage of GDP from 1980 through 2010.
Financial Solvency of the American Government 53
("Historical federal receipt," 2011)
Again, the results are somewhat lower for this table than in the previous graph. With
expenditures, spending as a percent of GDP ensures that the government continues to provide the
standard of living that citizens expect but can take away the ability to repay debt. The fact that
expenditures still remain so high above receipts shows insolvency in the United States and
strongly suggests a lower credit rating.