Embed Size (px)
Citation preview

FINANCIAL STATEMENTS 2013

98
31-12-2013 31-12-2012 01-01-2012
revised revised
Assets
Non-current assetsProperty, plant and equipment (9) 65,797 71,200 55,670
Goodwill (10) 53,652 53,307 34,022
Other intangible fixed assets (11) 39,390 38,626 16,008
Non-consolidated subsidiaries (12) 4,526 4,549 4,569
Deferred tax assets (19) 11,285 10,173 4,694
Net pension assets (18) 1,564 1,022 0
Other financial fixed assets (13) 2,463 2,692 2,683
178,677 181,569 117,646
Current assetsInventories (14) 238,308 269,111 189,087
Trade receivables (15) 99,495 104,493 85,576
Other financial instruments (22) 0 0 7,626
Tax receivables 8,864 12,452 10,178
Other receivables 18,622 15,534 11,184
Cash and cash equivalents 15,907 6,552 4,259
381,196 408,142 307,910
Assets held for sale (27) 19,711
Total assets 579,584 589,711 425,556
CONSOLIDATED BALANCE SHEET
The figures following the various items refer to the notes on pages 120 to 155.
Before profit appropriation (in thousands of euros)

ACCELL GROUP NV | ANNUAL REPORT 2013 | FIT FOR A HEALTHY FUTURE FINAN
CIAL
STA
TEME
NTS
99
31-12-2013 31-12-2012 01-01-2012
revised revised
Equity & liabilities
Group equity (16)Share capital 244 239 211
Reserves 220,719 216,254 166,487
Net profit for the year 19,020 23,292 40,277
239,983 239,785 206,975
Non-current liabilitiesInterest-bearing loans (17) 103,313 15,780 47,994
Pension provisions (18) 5,506 7,336 4,994
Deferred tax liabilities (19) 9,681 9,938 6,404
Provisions (20) 5,330 4,440 4,568
Deferred income (21) 2,462 2,157 2,124
126,292 39,651 66,084
Current liabilitiesInterest-bearing loans and bank overdrafts (17)
96,087 134,617 71,918
Trade payables 71,238 132,782 52,711
Other financial instruments (22) 9,027 8,799 4,708
Current tax liabilities 12,455 12,518 7,026
Provisions (20) 6,635 4,015 2,676
Deferred income (21) 650 1,000 1,000
Other liabilities 16,547 16,544 12,458
212,639 310,275 152,497
Liabilities held for sale (27) 670
Total equity & liabilities 579,584 589,711 425,556

100

ACCELL GROUP NV | ANNUAL REPORT 2013 | FIT FOR A HEALTHY FUTURE FINAN
CIAL
STA
TEME
NTS
101
The figures following the various items refer to the notes on pages 120 to 155.
2013 2012revised
Net turnover (1) 848,971 772,546
Costs of raw materials and components 589,431 526,183
Cost of inventory change 552 226
Personnel costs (2) 106,615 101,552
Depreciation and amortisation (3) 8,692 8,156
Other operating expenses (4) 106,744 100,336
812,034 736,453
36,937 36,093
Reorganisation costs (5) -3,004 0
Reorganisation and termination costs Raleigh Canada (5) -3,185 0
Compensation of costs Raleigh Canada (5) 3,185 0
Acquisition costs 0 -3,443
Operating profit 33,933 32,650
Income from non-consolidated subsidiaries (12) 489 188
Financial income (6) 520 400
Financial expenses (6) -12,200 -7,337
-11,191 -6,749
Profit before taxes 22,742 25,901
Taxes (7) -3,722 -2,609
Net profit 19,020 23,292
Earnings per share (8) (in euros)
Earnings per share 0.79 1.00
Weighted average number of issued shares 24,195,467 22,897,471
Earnings per share (diluted) 0.78 0.99
Weighted average number of issued shares (diluted) 24,328,392 23,081,871
CONSOLIDATED INCOME STATEMENT (in thousands of euros)

102
2013 2012revised
Net profit for the year 19,020 23,292
Items that will not be reclassified subsequently to the income statement
Remeasurement of defined benefit obligations 1,177 -1,254
Movements in deferred taxes -30 232
1,147 -1,022
Items that may be reclassified subsequently to the income statement
Fair value adjustment of financial instruments -707 -11,067
Exchange differences arising on translation of foreign operations
-8,425 -697
Movements in deferred taxes 86 2,767
-9,046 -8,997
Total comprehensive income for the year 11,121 13,273
CONSOLIDATED STATEMENT OF COMPREHENSIVE INCOME(in thousands of euros)

ACCELL GROUP NV | ANNUAL REPORT 2013 | FIT FOR A HEALTHY FUTURE FINAN
CIAL
STA
TEME
NTS
103
2013 2012revised
Cash flows from operating activities
Operating profit 33,933 32,650
Depreciation and amortisation (3) 8,695 8,158
Share-based payments (2) 267 257
Operating cash flows before changes in working capital and provisions 42,895 41,065
Movement in inventories 12,510 -44,691
Movement in receivables -1,631 27,673
Movement in trade payables and other liabilities -62,764 37,526
Movement in provisions and deferred revenue -1,784 -2,273
-53,669 18,235
Cash flow from operating activities -10,774 59,300
Interest paid -9,931 -8,568
Income taxes paid/received -2,542 3,383
Net cash flows from operating activities -23,247 54,115
Cash flows from investing activities
Interest received 634 597
Investment in property, plant and equipment (9) -6,727 -14,498
Divestments of property, plant and equipment (9) 2,113 110
Investments in intangible fixed assets -1,128 -802
Movements in financial fixed assets -1,158 332
Business combinations (23) -1,392 -59,740
Net cash flows from investing activities -7,658 -74,001
Free cash flow 1) -30,905 -19,886
Cash flows from financing activities
New loans 110,000 32,289
Repayments of long-term loans -72,005 -4,952
Borrowing/repayments bank overdrafts 13,863 -24,442
Cash dividend (24) -10,836 -10,978
Proceeds from issue of shares 0 30,808
Stock and option plans -352 -546
Net cash flows from financing activities 40,670 22,179
Net cash flow 9,765 2,293
Effects of exchange rate changes on cash and cash equivalents
-410 0
Cash and cash equivalents as at 1 January 6,552 4,259
Cash and cash equivalents as at 31 December 15,907 6,552
CONSOLIDATED CASH FLOW STATEMENT
1) Free cash flow is defined as the balance of the net cash flow from operating and investing activities and is not defined as a financial performance indicator in IFRS.
(in thousands of euros)

104
ACCELL GROUP NV | ANNUAL REPORT 2013 | FIT FOR A HEALTHY FUTURE FINAN
CIAL
STA
TEME
NTS
105
Issu
ed s
hare
cap
ital
Shar
e pr
emiu
m
rese
rve
Rev
alua
tion
rese
rve
Hed
ging
res
erve
Tran
slat
ion
rese
rve
Oth
er S
tatu
tory
re
serv
e
Oth
er r
eser
ves
Res
ult f
inan
cial
yea
r
Tota
l equ
ity
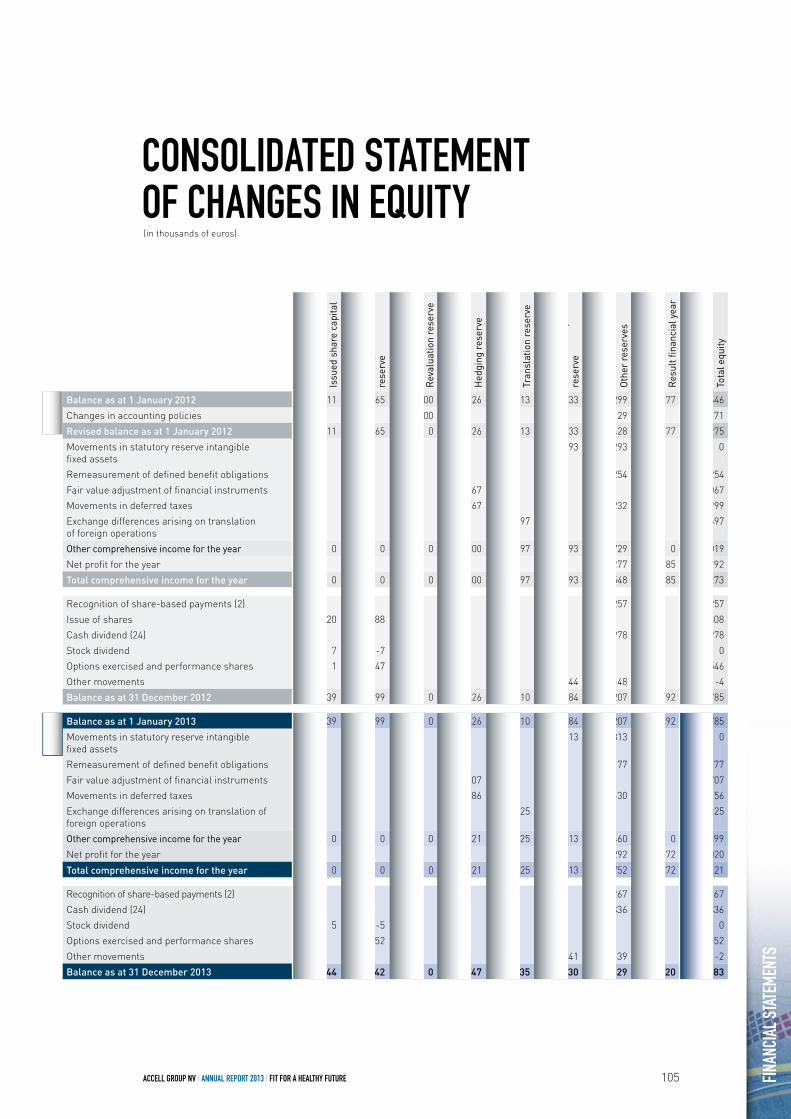
Balance as at 1 January 2012 211 14,565 7,800 -126 -3,613 2,233 153,299 40,277 214,646
Changes in accounting policies -7,800 129 -7,671
Revised balance as at 1 January 2012 211 14,565 0 -126 -3,613 2,233 153,428 40,277 206,975
Movements in statutory reserve intangible fixed assets
-293 293 0
Remeasurement of defined benefit obligations -1,254 -1,254
Fair value adjustment of financial instruments -11,067 -11,067
Movements in deferred taxes 2,767 232 2,999
Exchange differences arising on translation of foreign operations
-697 -697
Other comprehensive income for the year 0 0 0 -8,300 -697 -293 -729 0 -10,019
Net profit for the year 40,277 -16,985 23,292
Total comprehensive income for the year 0 0 0 -8,300 -697 -293 39,548 -16,985 13,273
Recognition of share-based payments (2) 257 257
Issue of shares 20 30,788 30,808
Cash dividend (24) -10,978 -10,978
Stock dividend 7 -7 0
Options exercised and performance shares 1 -547 -546
Other movements 44 -48 -4
Balance as at 31 December 2012 239 44,799 0 -8,426 -4,310 1,984 182,207 23,292 239,785
Balance as at 1 January 2013 239 44,799 0 -8,426 -4,310 1,984 182,207 23,292 239,785
Movements in statutory reserve intangible fixed assets
-313 313 0
Remeasurement of defined benefit obligations 1,177 1,177
Fair value adjustment of financial instruments -707 -707
Movements in deferred taxes 86 -30 56
Exchange differences arising on translation of foreign operations
-8,425 -8,425
Other comprehensive income for the year 0 0 0 -621 -8,425 -313 1,460 0 -7,899
Net profit for the year 23,292 -4,272 19,020
Total comprehensive income for the year 0 0 0 -621 -8,425 -313 24,752 -4,272 11,121
Recognition of share-based payments (2) 267 267
Cash dividend (24) -10,836 -10,836
Stock dividend 5 -5 0
Options exercised and performance shares -352 -352
Other movements -141 139 -2
Balance as at 31 December 2013 244 44,442 0 -9,047 -12,735 1,530 196,529 19,020 239,983
2013
2012
CONSOLIDATED STATEMENT OF CHANGES IN EQUITY(in thousands of euros)

106
General information
Accell Group N.V. (‘Accell Group’) in Heerenveen, the Netherlands, is the holding company of a group of legal entities. An overview of the data required pursuant to articles 2:379 and 2:414 of the Netherlands Civil Code is enclosed on page 131 of the financial statements. Accell Group with its group of companies is internationally active in the design, development, production, marketing and sales of innovative and high-quality bicycles, bicycle parts and accessories and fitness equipment.
Accell Group’s consolidated financial statements for the year ended 2013 have been prepared in accordance with International Accounting Standards Board (IASB) standards as approved by the European Commission which are applicable as of 31 December 2013.
The financial data of Accell Group are incorporated in the consolidated financial statements. An abbreviated income statement is therefore presented for the parent company, as permitted under article 2:402 of the Netherlands Civil Code.
Accounting policies
The financial statements have been prepared at historical cost, unless stated otherwise.
The accounting policies outlined below were applied consistently for all the periods presented in these consolidated financial statements.
Application of new and revised IFRSAccell Group applied new and amended standards and interpretations applicable to the year under review, as determined by the IASB and approved by the European Commission, and which are applicable for the period commencing on 1 January 2013. The new and adjusted standards, applied in these financial statements have no material effect on the consolidated financial statements, except for the adjustments as a result of IAS 19R Employee Benefits. These effects are described in the following paragraph ‘Changes in accounting policies’.
Disclosure requirements with regard to fair value which result from IFRS 13 Fair Value Measurement have been applied for the first time in the consolidated financial statements 2013. Accell Group periodically reviews significant changes in value. Where fair value measurement is based on external information, Accell Group assesses the evidence of fair value obtained from these third parties to verify that the measurement complies to IFRS requirements, including the hierarchy level of the fair values into which such measured amounts are classified.
Accell Group has elected not to apply the EU-approved standards IFRS 10 Consolidated Financial Statements, IFRS 11 Joint Arrangements, IFRS 12 Disclosure of Interests in Other Entities and the amendments to IFRS 7 relating to the netting of financial assets and financial liabilities before the 2014 financial year. None of these standards are expected to have a material effect on the consolidated financial statements, but a number of additional disclosures will be made in the notes.
No further explanation is provided regarding other changes and interpretations that were not yet approved by the European Commission on 31 December 2013.
NOTES TO THE CONSOLIDATEDFINANCIAL STATEMENTSFor the financial year ended 31 December 2013

ACCELL GROUP NV | ANNUAL REPORT 2013 | FIT FOR A HEALTHY FUTURE FINAN
CIAL
STA
TEME
NTS
107
31-12-2012 31-12-2012 01-01-2012 01-01-2012
revised revised
A x 1.000 A x 1.000 A x 1.000 A x 1.000
Pension provision -12,574 -10,602 -4,994 -4,276
Equity -246,181 -247,710 -214,139 -214,646
Deferred tax liabilities -11,349 -11,792 -8,369 -8,580
Remeasurement of defined benefit obligations -1,254 0
Movement in deferred taxes 3,518 3,286
Total comprehensive income 12,505 13,527
Changes in accounting policiesIn 2013 the following changes in accounting policies were made. As a result of these changes equity decreased by € 7.9 million as per 31 December 2012. As per 31 December 2012 the balance sheet total decreased by € 12.4 million.
Accounting policy changes
IAS 19R Employee benefitsIAS 19R is effective for financial years commencing on or after 1 January 2013. IAS 19 revised, eliminates the use of the corridor method and requires that actuarial results are recorded within the consolidated statement of comprehensive income.
The changes in IAS 19R led to an increase of the pension provision of € 2.0 million as per 31 December 2012 respectively € 0.7 million as per 1 January 2012. In addition this led to a decrease of other comprehensive income in 2012 amounting to € 1.0 million. The effect on the income statement in 2012 is limited.
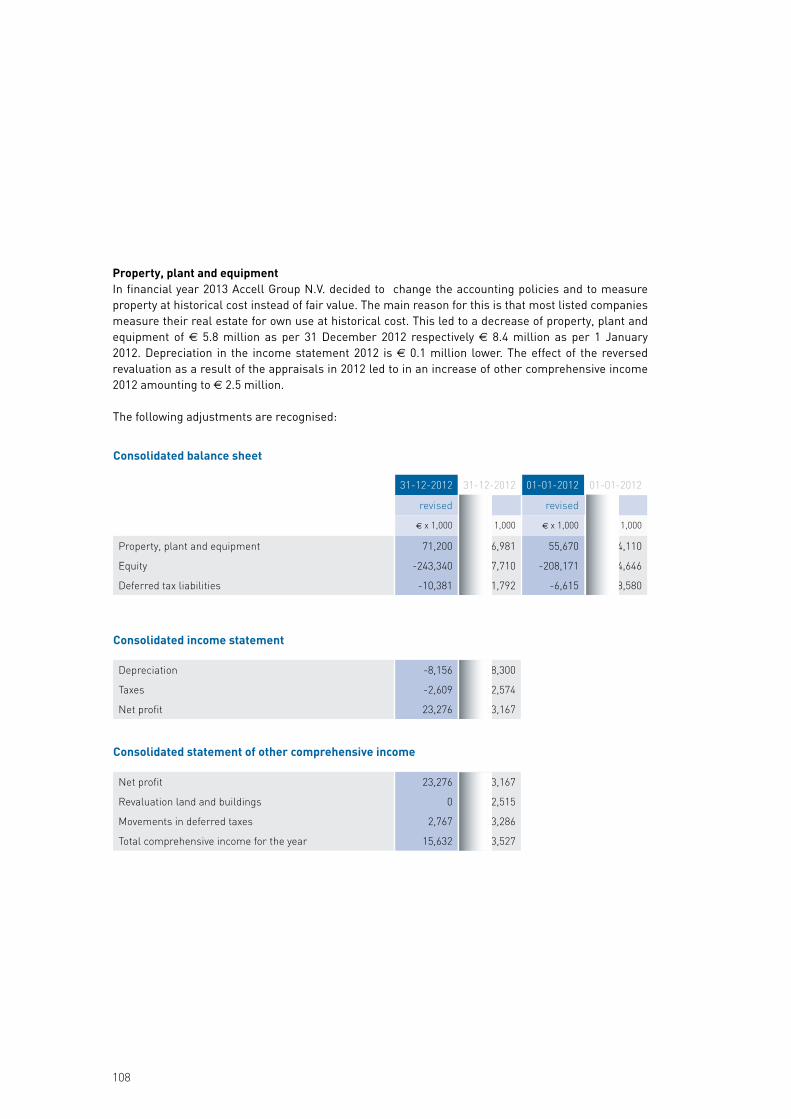
The following adjustments are recognised:
Consolidated balance sheet
Consolidated statement of comprehensive income
Consolidated income statement
31-12-2012 31-12-2012 01-01-2012 01-01-2012
revised revised
A x 1,000 A x 1,000 A x 1,000 A x 1,000
Property, plant and equipment 71,200 76,981 55,670 64,110
Equity -243,340 -247,710 -208,171 -214,646
Deferred tax liabilities -10,381 -11,792 -6,615 -8,580
Depreciation -8,156 -8,300
Taxes -2,609 -2,574
Net profit 23,276 23,167
Consolidated balance sheet
108
Consolidated statement of other comprehensive income
The following adjustments are recognised:
Net profit 23,276 23,167
Revaluation land and buildings 0 -2,515
Movements in deferred taxes 2,767 3,286
Total comprehensive income for the year 15,632 13,527
Property, plant and equipmentIn financial year 2013 Accell Group N.V. decided to change the accounting policies and to measure property at historical cost instead of fair value. The main reason for this is that most listed companies measure their real estate for own use at historical cost. This led to a decrease of property, plant and equipment of € 5.8 million as per 31 December 2012 respectively € 8.4 million as per 1 January 2012. Depreciation in the income statement 2012 is € 0.1 million lower. The effect of the reversed revaluation as a result of the appraisals in 2012 led to in an increase of other comprehensive income 2012 amounting to € 2.5 million.

ACCELL GROUP NV | ANNUAL REPORT 2013 | FIT FOR A HEALTHY FUTURE FINAN
CIAL
STA
TEME
NTS
109
Adjustments of errors
Pension provision/goodwillThe position of the UK pension fund has been examined in more detail in 2013, also in the context of the changes in IAS 19R in combination with the application of IFRIC 14 on the recognition of a liability under funding agreements. This showed that the pension liability of € 5.4 million, which is included in the acquisition balance sheet of Raleigh does not need to be recorded, since the payments are ultimately for the beneficiary of the company. As a result the pension provision is adjusted in the acquisition balance sheet 2012 against goodwill in accordance with IFRS 3.50. Besides the related net pension asset of € 1.0 million is reclassified from the provisions to the net pension assets in the balance sheet as per 31 December 2012. In addition goodwill is reduced by € 1.0 million as a result of currency translation differences as per 31 December 2012. This has no effect on the income statement.
31-12-2012 31-12-2012
revised
A x 1,000 A x 1,000
Goodwill 53,307 59,684
Deferred tax assets 10,173 11,409
Net pension asset 1,022 0
Pension provisions -5,364 -10,602
Equity -246,357 -247,710
Consolidated balance sheet
The following adjustments are recognised:
ProvisionsIn financial year 2013 Accell Group N.V. decided to change the discounting of provisions. Until 2012 provisions were discounted using the Weighted Average Cost of Capital (WACC) instead of Cost of Debt. Based on IAS 37 provisions need to be discounted using a discount rate reflecting the risks specific to the liability. This led to an increase of provisions of € 0.7 million as per 31 December 2012 respectively € 0.7 million as per 1 January 2012.

110
ConsolidationThe consolidated financial statements include the financial statements of Accell Group and its subsidiaries, being the group companies and other legal entities in which Accell Group has either a direct or indirect controlling interest with regard to the financial and operational policies.
The financial data of subsidiaries acquired during the year under review are consolidated from the date that Accell Group acquired a controlling interest. The financial data of subsidiaries disposed during the year under review are included in the consolidation until the date that Accell Group ceased to hold control. If necessary, the figures in the subsidiaries’ financial statements are adjusted to bring the statements in line with the accounting standards applied by Accell Group.
The financial data of the consolidated subsidiaries are fully included in the consolidated financial statements after elimination of all intercompany balances and transactions. Unrealised profits and losses on intercompany transactions are eliminated from the consolidated income statement.
Subsidiaries and joint ventures with an equity participation of 50% or less and where Accell Group does not have control, are valued according to the equity method or valued proportional interest in the fair value. Unrealised profits on intercompany transactions are eliminated pro rata based on the Accell Group interest in the company. Unrealised losses are also eliminated pro rata but only to the extent that there is no evidence for impairment.
A list of consolidated subsidiaries and non-consolidated subsidiaries is provided in note 12 to the consolidated financial statements.
The following adjustments are recognised:
31-12-2012 31-12-2012 01-01-2012 01-01-2012
revised revised
A x 1,000 A x 1,000 A x 1,000 A x 1,000
Provision deferred employee benefits -1,801 -1,518 -966 -685
Warranty provisions -5,474 -5,253 -4,992 -4,773
Deferred income -3,157 -2,988 -3,124 -2,935
Equity -247,037 -247,710 -213,957 -214,646
Financial income and expenses -6,937 -6,953
Net profit 23,183 23,167
Consolidated income statement
Consolidated balance sheet

ACCELL GROUP NV | ANNUAL REPORT 2013 | FIT FOR A HEALTHY FUTURE FINAN
CIAL
STA
TEME
NTS
111
Business combinations Acquisitions of subsidiaries are accounted for by the purchase accounting method. On acquisition date, the acquisition price is applied to the sum of the fair value of the assets acquired, the liabilities incurred or assumed and the equity instruments issued by Accell Group in exchange for the controlling interest in the company acquired. Identifiable assets, liabilities and contingent liabilities of the companies acquired that meet the criteria for accounting under IFRS 3 are recorded at their fair value on the acquisition date. The changes in the fair value of contingent liabilities are accounted for in the income statement.
Costs relating to the acquisition of business combinations are expensed directly into the income statement.
Foreign currencyThe income statement and balance sheet are stated in euros, which is the functional currency of Accell Group and the presentation currency for the consolidated financial statements. Receivables, debts and liabilities in foreign currencies are converted at the exchange rate on the balance sheet date.
In order to hedge its currency risks, Accell Group uses derivative financial instruments. The basis for these currency derivatives is detailed under ‘Financial Instruments’.
Transactions in foreign currencies during the reporting period are recorded at the exchange rates applying on the transaction date insofar the currency is not part of a hedging instrument. Currency differences arising from this conversion are recorded in the income statement.
Assets and liabilities of foreign subsidiaries are translated using the exchange rates applicable on the respective balance sheet dates. The income statements of foreign subsidiaries are converted at the weighted average monthly exchange rates applying for the periods involved. Differences arising from this conversion are recorded as a separate component of shareholders’ equity. These translation differences are recognised in the income statement at the time when the activities are sold.
EstimatesAccell Group makes certain estimates and assumptions when preparing the consolidated financial statements. These estimates and assumptions have an impact on assets and liabilities, disclosure of off-balance assets and liabilities at balance sheet date, and income and expense items for the period under review.
Important estimates and assumptions mainly relate to provisions, pensions and other employee benefits, goodwill and other intangible fixed assets, deferred tax assets and liabilities. Actual results may differ from these estimates and assumptions.
All assumptions, expectations and forecasts that are used as a basis for estimates in the consolidated financial statements represent an outlook as accurate as possible for Accell Group. These estimates only represent Accell Group’s interpretation as of the dates on which they were prepared. Estimates relate to known and unknown risks, uncertainties and other factors that can lead to future results differing significantly from those forecasted.
112
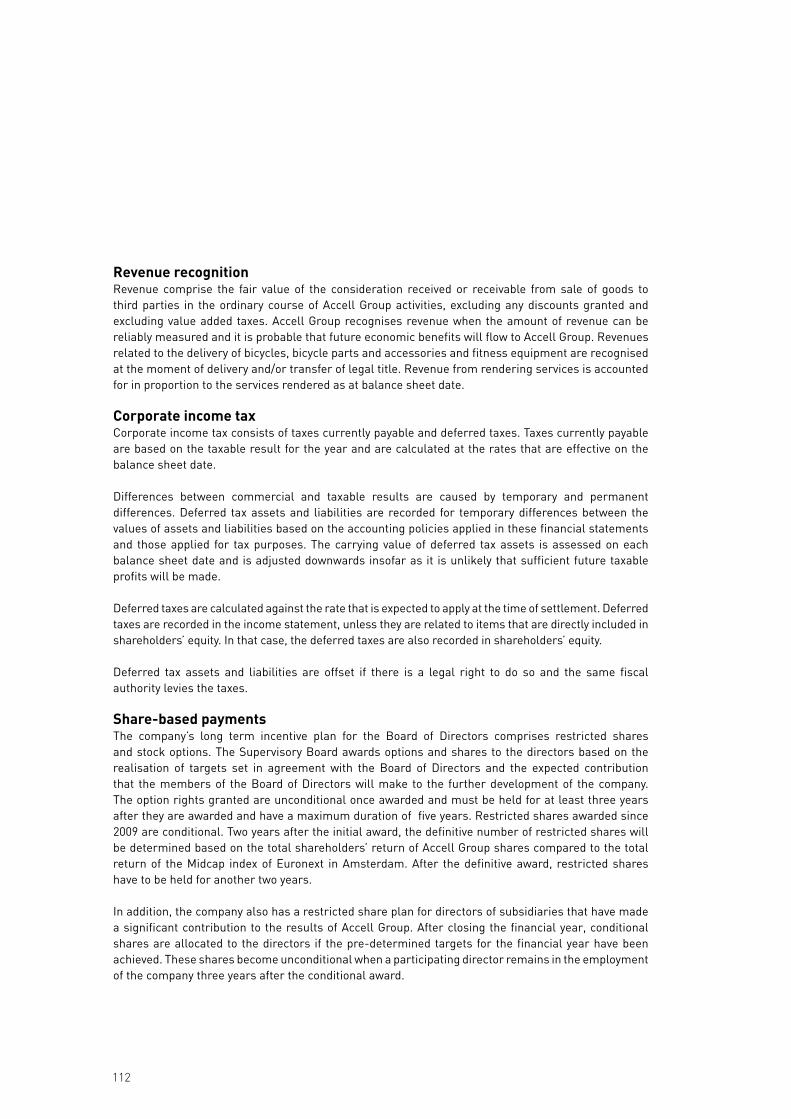
Revenue recognitionRevenue comprise the fair value of the consideration received or receivable from sale of goods to third parties in the ordinary course of Accell Group activities, excluding any discounts granted and excluding value added taxes. Accell Group recognises revenue when the amount of revenue can be reliably measured and it is probable that future economic benefits will flow to Accell Group. Revenues related to the delivery of bicycles, bicycle parts and accessories and fitness equipment are recognised at the moment of delivery and/or transfer of legal title. Revenue from rendering services is accounted for in proportion to the services rendered as at balance sheet date.
Corporate income taxCorporate income tax consists of taxes currently payable and deferred taxes. Taxes currently payable are based on the taxable result for the year and are calculated at the rates that are effective on the balance sheet date.
Differences between commercial and taxable results are caused by temporary and permanent differences. Deferred tax assets and liabilities are recorded for temporary differences between the values of assets and liabilities based on the accounting policies applied in these financial statements and those applied for tax purposes. The carrying value of deferred tax assets is assessed on each balance sheet date and is adjusted downwards insofar as it is unlikely that sufficient future taxable profits will be made.
Deferred taxes are calculated against the rate that is expected to apply at the time of settlement. Deferred taxes are recorded in the income statement, unless they are related to items that are directly included in shareholders’ equity. In that case, the deferred taxes are also recorded in shareholders’ equity.
Deferred tax assets and liabilities are offset if there is a legal right to do so and the same fiscal authority levies the taxes.
Share-based payments The company’s long term incentive plan for the Board of Directors comprises restricted shares and stock options. The Supervisory Board awards options and shares to the directors based on the realisation of targets set in agreement with the Board of Directors and the expected contribution that the members of the Board of Directors will make to the further development of the company. The option rights granted are unconditional once awarded and must be held for at least three years after they are awarded and have a maximum duration of five years. Restricted shares awarded since 2009 are conditional. Two years after the initial award, the definitive number of restricted shares will be determined based on the total shareholders’ return of Accell Group shares compared to the total return of the Midcap index of Euronext in Amsterdam. After the definitive award, restricted shares have to be held for another two years.
In addition, the company also has a restricted share plan for directors of subsidiaries that have made a significant contribution to the results of Accell Group. After closing the financial year, conditional shares are allocated to the directors if the pre-determined targets for the financial year have been achieved. These shares become unconditional when a participating director remains in the employment of the company three years after the conditional award.

ACCELL GROUP NV | ANNUAL REPORT 2013 | FIT FOR A HEALTHY FUTURE FINAN
CIAL
STA
TEME
NTS
113
The option rights and share plans qualify as share-based payment transactions that can be settled in equity instruments and are stated at fair value when awarded. This fair value is recorded as an expense on a straight-line basis during the awarding period, based on the company’s estimate of the shares that will ultimately be awarded and adjusted to compensate for the effect of non-market-standard awarding conditions. The fair value of the option rights is determined using an option valuation model. The expected life used in the model is adjusted, according to the company’s best estimate, for the effects of non-transferability, exercise restrictions and behavioral considerations.
Lease agreementsLease agreements are classified as financial lease agreements if the economic benefits and obligations related to the underlying asset are largely at the risk and for the account of Accell Group. All other lease agreements are classified as operational lease agreements.
Lease payments for operational lease agreements are charged to expenses on a straight-line basis over the duration of the agreement.
Property, plant and equipmentProperty, plant and equipment are valued at historical cost less accumulated depreciation and any accumulated impairments. Subsidies received which directly relate to property, plant and equipment are deducted from the historical cost.
Depreciation is calculated on the basis of the straight-line method. As such, the cost price, less any residual value, is depreciated over the expected economic life. Land is not depreciated.
The estimated economic useful life per category is: Buildings: 30 – 50 yearsMachinery and equipment: 3 – 10 years
The gain or loss of divestments of property, plant and equipment is determined as the difference between the proceeds from sale and the carrying value of the asset. The gain or loss is accounted for in the income statement. Impairment of non-current assets other than goodwillOn each balance sheet date, Accell Group reviews whether there is any indication that non-current assets may be subject to impairment. If there is such indication, the recoverable amount of the asset involved is estimated in order to determine the extent to which impairment may apply. If it is not possible to determine the recoverable amount of the individual asset, then Accell Group determines the recoverable amount of the cash generating unit to which the asset belongs.
Impairment applies if the carrying value of an asset exceeds its recoverable amount. The recoverable amount is equal to the proceeds or value in use, whichever is the greater; the value in use being the present value of the expected future cash flows from the use of the asset and its ultimate disposal. A pre-tax discount percentage is applied to determine present value, whereby the percentage provides a good indication from the assessment of the current market conditions regarding time value of money and the asset’s specific risks.
Impairment is charged to the income statement in the period in which it occurs, unless it relates to a revalued asset. In that case, the impairment is accounted for as a reduction of the revaluation.

114
GoodwillGoodwill represents the excess of the cost of an acquisition over the fair value of the identifiable assets, liabilities and contingent liabilities at the time the subsidiary was acquired. Goodwill is measured at cost less any accumulated impairments. Goodwill resulting from the acquisition of a foreign activity is expressed in the functional currency of the foreign activity and is converted at the exchange rate on balance sheet date.
To determine whether any impairment has taken place, goodwill is attributed to the (group of) cash-generating units of Accell Group that are expected to benefit from the synergy created by the combination. Goodwill is tested for impairment annually or more frequently if there is any indication that goodwill might have to be impaired. If the recoverable amount of the (group of) cash- generating units is less than its carrying amount, the impairment loss reduces the carrying amount of the goodwill.
The recoverable amount of a cash-generating unit is determined based on the value in use, which is based on expected cash flows. These cash flows are based, among other things, on realised results in the past. Once a goodwill impairment loss is recognised, it is not reversed in a subsequent period.
Upon the disposal of a subsidiary, the attributable amount of goodwill is included in the determination of the gain or loss upon disposal. Other intangible fixed assets
Trademarks, patents and customer listsIntangible assets include trademarks, patents and customer lists, acquired in a business combination by Accell Group and recognised separately from goodwill. Separately acquired intangible fixed assets are stated at fair value. Intangible fixed assets with a limited life, such as patents and customer lists, are depreciated on a straight-line basis against the income statement over the expected economic life, for patents generally estimated at five years and for customer lists generally estimated at ten to twenty years. Assets with an indefinite useful life, such as trademarks, are not depreciated, but are tested on impairment, as described under goodwill. Trademarks have an indefinite useful life, because the brands acquired are positioned in the middle and upper segments and mostly have a long history and tradition in the local and international markets in which they operate.
Research & Development expenditureExpenditure on research activities is recognised as an expense in the period in which it is incurred. An intangible asset arising from development is recognised if, and only if, all the following criteria have been met:- the asset is uniquely identified and the costs can be determined separately; - the technical feasibility of the asset has been sufficiently demonstrated;- it is probable that the asset will generate future economic revenues;- the development expenditures can be measured reliably.
If these criteria are not met, development costs will be recognised in the income statement in the period when the expenses occur.
Capitalised development costs are amortised from the date when they are put into use on a straight-line basis over their estimated economic useful life, which is expected to be three to five years.
ACCELL GROUP NV | ANNUAL REPORT 2013 | FIT FOR A HEALTHY FUTURE FINAN
CIAL
STA
TEME
NTS
115
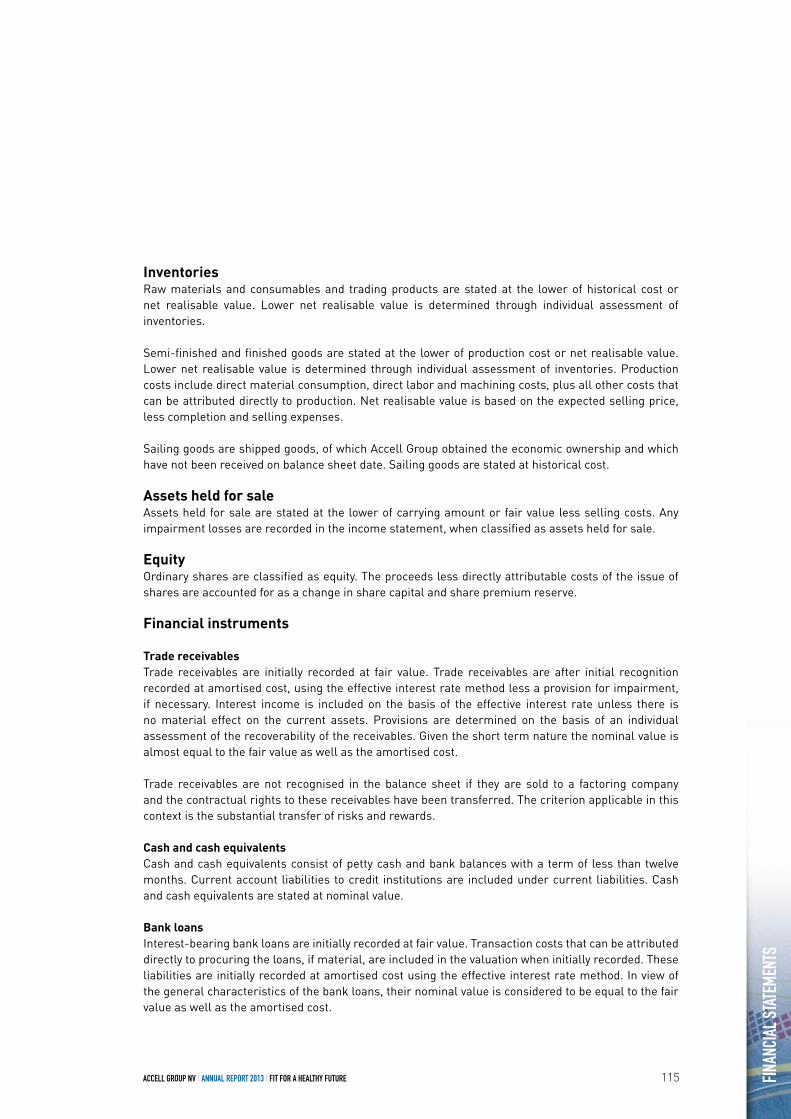
InventoriesRaw materials and consumables and trading products are stated at the lower of historical cost or net realisable value. Lower net realisable value is determined through individual assessment of inventories.
Semi-finished and finished goods are stated at the lower of production cost or net realisable value. Lower net realisable value is determined through individual assessment of inventories. Production costs include direct material consumption, direct labor and machining costs, plus all other costs that can be attributed directly to production. Net realisable value is based on the expected selling price, less completion and selling expenses.
Sailing goods are shipped goods, of which Accell Group obtained the economic ownership and which have not been received on balance sheet date. Sailing goods are stated at historical cost.
Assets held for saleAssets held for sale are stated at the lower of carrying amount or fair value less selling costs. Any impairment losses are recorded in the income statement, when classified as assets held for sale. EquityOrdinary shares are classified as equity. The proceeds less directly attributable costs of the issue of shares are accounted for as a change in share capital and share premium reserve.
Financial instruments
Trade receivablesTrade receivables are initially recorded at fair value. Trade receivables are after initial recognition recorded at amortised cost, using the effective interest rate method less a provision for impairment, if necessary. Interest income is included on the basis of the effective interest rate unless there is no material effect on the current assets. Provisions are determined on the basis of an individual assessment of the recoverability of the receivables. Given the short term nature the nominal value is almost equal to the fair value as well as the amortised cost.
Trade receivables are not recognised in the balance sheet if they are sold to a factoring company and the contractual rights to these receivables have been transferred. The criterion applicable in this context is the substantial transfer of risks and rewards.
Cash and cash equivalentsCash and cash equivalents consist of petty cash and bank balances with a term of less than twelve months. Current account liabilities to credit institutions are included under current liabilities. Cash and cash equivalents are stated at nominal value.
Bank loansInterest-bearing bank loans are initially recorded at fair value. Transaction costs that can be attributed directly to procuring the loans, if material, are included in the valuation when initially recorded. These liabilities are initially recorded at amortised cost using the effective interest rate method. In view of the general characteristics of the bank loans, their nominal value is considered to be equal to the fair value as well as the amortised cost.

116
Trade payablesAmounts due to trade creditors are initially recorded at fair value. These liabilities are after initial recognition recorded at amortised cost using the effective interest rate method. In view of the short-term nature of these liabilities, their nominal value is considered to be equal to the fair value as well as the amortised cost.
Derivative financial instrumentsOther financial instruments, such as interest swaps, currency future contracts, currency future swaps and options used by Accell Group are stated on the balance sheet at their fair value. The fair value is determined either on the basis of the net present value of future cash flows or using the binomial option valuation model. Cash flow hedgingChanges in the fair value of a derivative that is highly effective (and that is designated and qualifies as a cash flow hedge) are recorded in equity, until the income statement is affected by the variability in cash flows of the designated hedged item. To the extent that the hedge is ineffective, changes in the fair value are recognised in the income statement. In the event that the hedge results in the inclusion of a non-financial asset or non-financial liability, then the amounts that were included in shareholders’ equity (in accordance with IAS 39.98b) are transferred to the initial cost price of the related asset or liability.
When a hedging instrument expires or is sold, or when a hedge no longer meets the criteria for hedge accounting, any cumulative gain or loss recognised in equity at that time remains in equity and is recognised in the income statement when the forecast transaction occurs. When a future transaction is no longer expected to occur, the cumulative gain or loss that was recognised in equity is immediately reclassified to the income statement.
Hedging of a net investmentHedging of a net investment in a foreign entity is recorded in the same manner as a cash flow hedge. Changes in the fair value of the effective hedge are recorded in equity as a translation reserve. To the extent the hedge is not effective, changes in the fair value are recognised in the income statement. Upon the disposal of a foreign entity, the cumulative value of the gains or losses, which were recorded in the translation reserve, are transferred to the income statement.
For any hedging instrument to be classified as a cash-flow hedge, Accell Group applies the following criteria:(1) the hedge is expected to be effective in compensating for changes in anticipated future cash flows
which can be attributed to the hedged risk;(2) the effectiveness of the hedge can be reliably measured;(3) the required documentation regarding the link between the hedged risk and the hedge instrument
is available while the hedge instrument exists when the financial derivative is initiated;(4) there must be a high probability that the recorded transactions will actually take place;(5) the hedge has been assessed throughout its duration, and it has been determined that the hedge
will be effective during the reporting period.

ACCELL GROUP NV | ANNUAL REPORT 2013 | FIT FOR A HEALTHY FUTURE FINAN
CIAL
STA
TEME
NTS
117
Provisions
GeneralProvisions are set aside to cover present legal or constructive obligations, arising from events on or before the balance sheet date, where it is likely that the company will have to meet these obligations and to the extent that the obligations can be estimated reliably. The level of the provisions reflects the best estimate of Accell Group as at the balance sheet date regarding expected expenditures. If material, the liabilities are discounted to their present value. Provisions for pensions
Defined benefit pension plansThe pension provision reflects the company’s commitments arising from defined benefit pension plans. Individual rights to post-employment benefit plans are accumulated depending on criteria such as age, seniority and salary level. Pension liabilities are discounted to determine the present value; the fair value of plan assets is deducted from this amount. Actuarial calculations are determined by qualified actuaries using the Projected Unit Credit Method. Liabilities resulting from defined benefit obligations are calculated for every plan separately. In case a defined benefit pension plan results in a surplus, after deducting any IFRIC 14 restrictions, this plan is presented as a pension asset in the balance sheet.
Accell Group recognises a profit or a loss on the settlement of defined benefit plans, when the settlement occurs. Actuarial profit and losses are recognised in the statement of other comprehensive income. Defined benefit pension plans accounted for as defined contribution plansThe majority of the Dutch operating companies have transferred their pension plans to Metalektro, the pension fund for the metal industry. These schemes generally qualify as defined benefit plans. The industry sector pension fund has informed Accell Group that the pension plan of the members should be included under IAS 19 as a defined contribution plan. Member companies only have an obligation to pay annual pension premiums due. The member companies are under no obligation whatsoever to provide compensation for any deficits of the fund. The member companies are also not entitled to any existing surpluses. Member companies are subject to actuarial risks which relate to present and former employees of other companies, so that no consistent and reliable basis is available to allocate liabilities, plan assets and costs to the individual member companies.
Defined contribution plansLiabilities under defined contribution plans are accounted for as expenses as soon as they are due. Payments under government pension plans are treated as payments under defined contribution plans if the liabilities of Accell Group are equivalent to the liabilities under a defined contribution plan.
Provision for deferred employee benefitsOther deferred personnel benefits, including anniversary bonuses, are based on actuarial calculations.
Provisions for warrantiesThe warranty provision represents the estimated costs under warranty obligations for supplied goods and services as at the balance sheet date. For material amounts, discounting takes place to present value. Warranty claims are charged to the provision.

118
Cash flow statementThe cash flow statement is prepared using the indirect method. The cash balance in the cash flow statement consists solely of immediately available cash and cash equivalents. Cash flows in foreign currencies are translated using the exchange rate on the transaction date. Expenditures for interest and corporation taxes are included in the cash flow from operating activities. Cash dividends are included in the cash flow from financing activities. The purchase price paid for acquisitions acquired during the year, as well as the selling price received for participations sold during the year, is included in the cash flow from investing activities as well as receipts from interests. Cash acquired in an acquisition is deducted from the acquisition price. Non-cash items or effects are excluded from the cash flow statement. Currency translation effects on cash and cash equivalents in foreign currencies are presented in the cash flow statement in order to achieve reconciliation between the cash and cash equivalents at the beginning and the end of the period.
Information by segment IFRS 8 requires Accell Group to identify operational segments separately on the basis of internal reports that are regularly reviewed by the chief operating decision maker in order to allocate resources to the segments and to assess their performance. Accell Group identifies the following operational segments: bicycle & bicycle parts and fitness.
Operating companies are not identified as an operational segment, but aggregated to one operational segment since operating companies show the same economic features and are also comparable as regards to the nature of products, services and production processes, clients for their products and services and distribution channels of products and services. The bicycles & bicycle parts segment, which targets the middle and upper segments of the market, is diverse: it ranges from children’s bicycles to comfortable and luxury city bicycles right through to trekking and racing bikes, electrical bikes, bicycle parts, and accessories. The fitness segments target the middle and upper segments and, more specifically, the home market.
Internal transfer prices between the operating segments are determined on a commercial basis, which is comparable to the approach adopted with third parties.
The sales to customers reported in the geographical segments are based on the geographical location of the customers. The secondary segment information consists of information about the division of sales, assets and investments per country.

ACCELL GROUP NV | ANNUAL REPORT 2013 | FIT FOR A HEALTHY FUTURE FINAN
CIAL
STA
TEME
NTS
119

120
1) Net turnover
Net turnover can be specified as follows:
Turnover and profit allocation per segment: The segmentation is based on business segments as the risk and return profile of Accell Group is largely determined by the difference in the products that are manufactured. A distinction is made between two operational segments: bicycles & bicycle parts and fitness.
2013 2012Turnover per product group: A x 1,000 A x 1,000
Bicycles 617,484 553,100
Bicycle parts & accessories 210,070 198,039
Fitness 21,417 21,407
848,971 772,546
Net turnover Segment result
2013 2012 2013 2012
revised
A x 1,000 A x 1,000 A x 1,000 A x 1,000
Bicycle & bicycle parts 827,527 751,366 49,957 48,920
Fitness 22,067 21,741 -338 34
Elimination of inter-segment turnover -623 -561
Reorganisation costs -3,004 0
Acquisition costs 0 -3,443
Sub-total segments 848,971 772,546 46,615 45,511
Income from non-consolidated companies 489 188
Unallocated expenses -12,682 -12,861
Financial income 520 400
Financial expenses -12,200 -7,337
Profit before taxes 22,742 25,901
NOTES

ACCELL GROUP NV | ANNUAL REPORT 2013 | FIT FOR A HEALTHY FUTURE FINAN
CIAL
STA
TEME
NTS
121
Assets and liabilities per segment:Assets Liabilities
2013 2012 2013 2012
revised revised
A x 1,000 A x 1,000 A x 1,000 A x 1,000
Bicycles & bicycle parts 561,532 571,247 317,878 262,520
Fitness 12,264 16,120 7,888 15,450
Unallocated corporate 5,788 2,344 13,835 71,956
Sub-total segments 579,584 589,711 339,601 349,926
Equity 239,983 239,785
Balance sheet total 579,584 589,711
Depreciation Investments
2013 2012 2013 2012
revised revised
A x 1,000 A x 1,000 A x 1,000 A x 1,000
Bicycles & bicycle parts 7,691 6,787 10,103 65,960
Fitness 166 325 45 23
Unallocated corporate 835 1,044 466 713
Total segments 8,692 8,156 10,614 66,696
Net turnover Non-current assets1)
2013 2012 2013 2012
revised
A x 1,000 A x 1,000 A x 1,000 A x 1,000
The Netherlands 210,022 205,661 27,760 30,333
Germany 202,113 189,812 50,552 51,558
Other Europe 270,664 234,278 64,893 64,253
North-America 128,599 111,323 13,737 15,164
Other countries 37,573 31,472 10,450 10,088
848,971 772,546 167,392 171,396
Geographical information:Geographical segments are based on the physical location of the assets. The sales to external customers reported in the geographical segments are based on the geographical location of the customers.
1) Deferred tax assets are not included in the non-current assets, in accordance with IFRS 8.33b.

122
2) Personnel costs
Personnel costs are comprised of the following:
In the social security charges an accrual of A 0.2 million (2012: A 0,3 million) is made for the payment of the Dutch crisis levy, which is extended unexpectedly in 2013 for one year. The remuneration of the Board of Directors and the Supervisory Board is disclosed in the notes to the company financial statements.
Share based payments In 2013, no unconditional option rights are granted to the Board of Directors. The option plan for the Board of Directors is described in the notes to the company financial statements.
Accell Group also has a stock option plan whereby conditional shares are granted to the members of the Board of Directors and to directors of subsidiaries who contribute significantly to the result of Accell Group. The fair value of these conditional shares is determined when granted; various factors which will influence the final number of distributed shares are taken into account.
The stock option entitlements that have been conditionally granted are comprised of the following:
The fair value will be charged to the income statement according to the straight-line method spread over the period between grant date and the time that the shares become unconditional, whereby adjust-ment will be made for the expected number of shares to be distributed. As a result, A 267,000 has been charged to the income statement in 2013.
2013 2012A x 1,000 A x 1,000
Wages and salaries 86,126 82,307
Social security charges 14,586 12,724
Pension contributions 5,031 5,247
Profit sharing 605 1,017
Share-based payments 267 257
106,615 101,552
Number Granting date
Expiry date Share price at granting
date
Fair value at granting date
Conditional shares in A in A
Conditional shares granted in 2011 8,260 24-02-11 3 year 19.39 136,000
Conditional shares granted in 2012 29,240 23-02-12 2-3 year 17.89 177,000
Conditional shares granted in 2013 45,305 22-02-13 2-3 year 13.57 289,000

ACCELL GROUP NV | ANNUAL REPORT 2013 | FIT FOR A HEALTHY FUTURE FINAN
CIAL
STA
TEME
NTS
123
Other operating expenses consist of costs relating to the general and specific business activities of Accell Group. In accordance with IAS 38.126 and IAS 17.35c research costs and lease costs are listed below.
4) Other operating expenses
Depreciation and amortisation expenses comprise the following:
3) Depreciation and amortisation
2013 2012revised
A x 1,000 A x 1,000
Depreciation of intangible fixed assets 822 869
Depreciation of property, plant and equipment 7,873 7,289
Capital gain on sale of tangible fixed assets -3 -2
8,692 8,156
2013 2012A x 1,000 A x 1,000
Third-party research and development costs 1,788 1,791
Lease expenses 3,354 3,729
5,142 5,520
Reorganisation costs consist of reorganisation costs in the Netherlands and the United States for a pre-tax amount of A 3.0 million. The reorganisation expenses in Canada as well as other costs of termination of the mass market activities in Canada, together A 3.2 million, have been compensated by the sellers of Raleigh on grounds of warranties in the purchase agreement.
5) Reorganisations

124
The effective corporate income tax charge comprises the following:
7) Taxes
2013 2012revised
A x 1,000 A x 1,000
Current taxes 5,783 3,070
Deferred taxes -2,061 -461
Taxes in income statement 3,722 2,609
Taxes based on the weighted average applicable rate 4,121 2,105
Non-deductible amounts 115 1,396
Participation exemption -210 -516
Benefits from tax facilities -467 -561
Deferred tax assets not carried forward 16 192
Adjustment of current taxes of prior years -136 -35
Adjustment of deferred taxes of prior years 283 28
Taxes in income statement 3,722 2,609
Financial income and expenses comprise the following:
6) Financial income and expenses
The policy regarding interest and currency risks is covered in note 22, ‘Financial instruments and risk management’.
2013 2012revised
A x 1,000 A x 1,000
Interest income 520 400
Interest expenses -8,854 -6,611
Financing and factoring expenses -2,688 -711
Exchange rate differences -658 -15
-11,680 -6,937
ACCELL GROUP NV | ANNUAL REPORT 2013 | FIT FOR A HEALTHY FUTURE FINAN
CIAL
STA
TEME
NTS
125
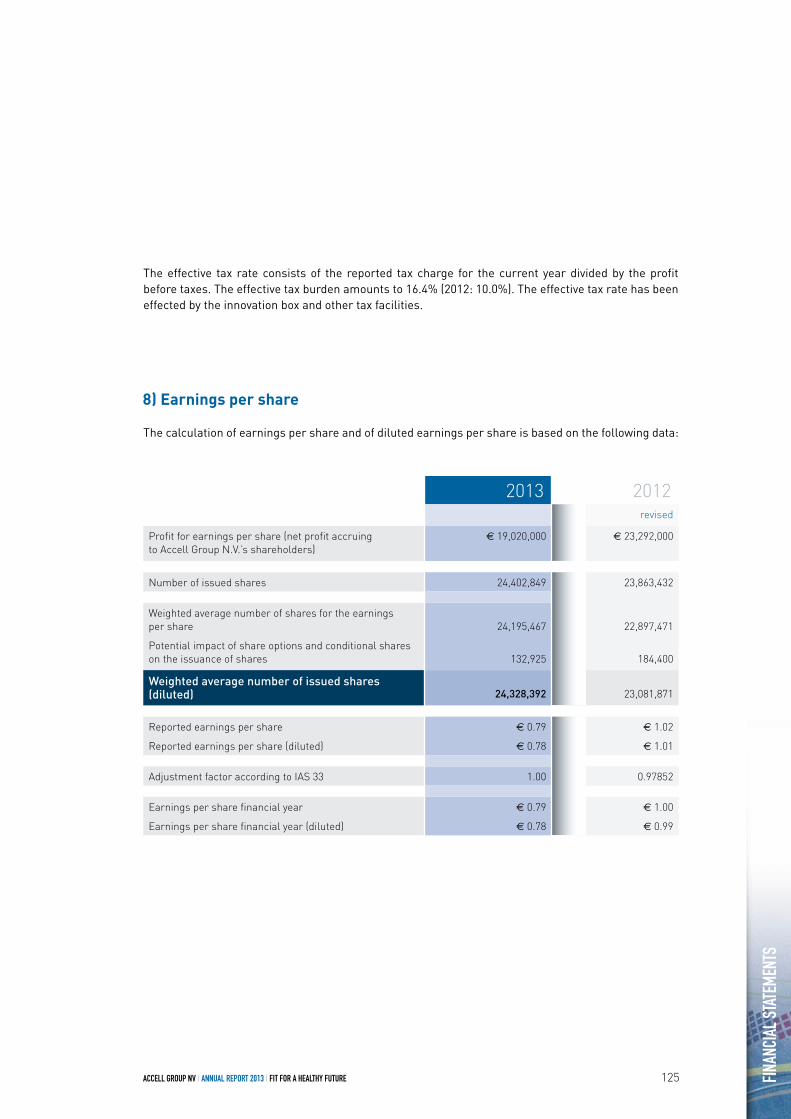
The calculation of earnings per share and of diluted earnings per share is based on the following data:
8) Earnings per share
2013 2012revised
Profit for earnings per share (net profit accruing to Accell Group N.V.’s shareholders)
€ 19,020,000 € 23,292,000
Number of issued shares 24,402,849 23,863,432
Weighted average number of shares for the earnings per share 24,195,467 22,897,471
Potential impact of share options and conditional shares on the issuance of shares 132,925 184,400
Weighted average number of issued shares (diluted) 24,328,392 23,081,871
Reported earnings per share € 0.79 € 1.02
Reported earnings per share (diluted) € 0.78 € 1.01
Adjustment factor according to IAS 33 1.00 0.97852
Earnings per share financial year € 0.79 € 1.00
Earnings per share financial year (diluted) € 0.78 € 0.99
The effective tax rate consists of the reported tax charge for the current year divided by the profit before taxes. The effective tax burden amounts to 16.4% (2012: 10.0%). The effective tax rate has been effected by the innovation box and other tax facilities.
126
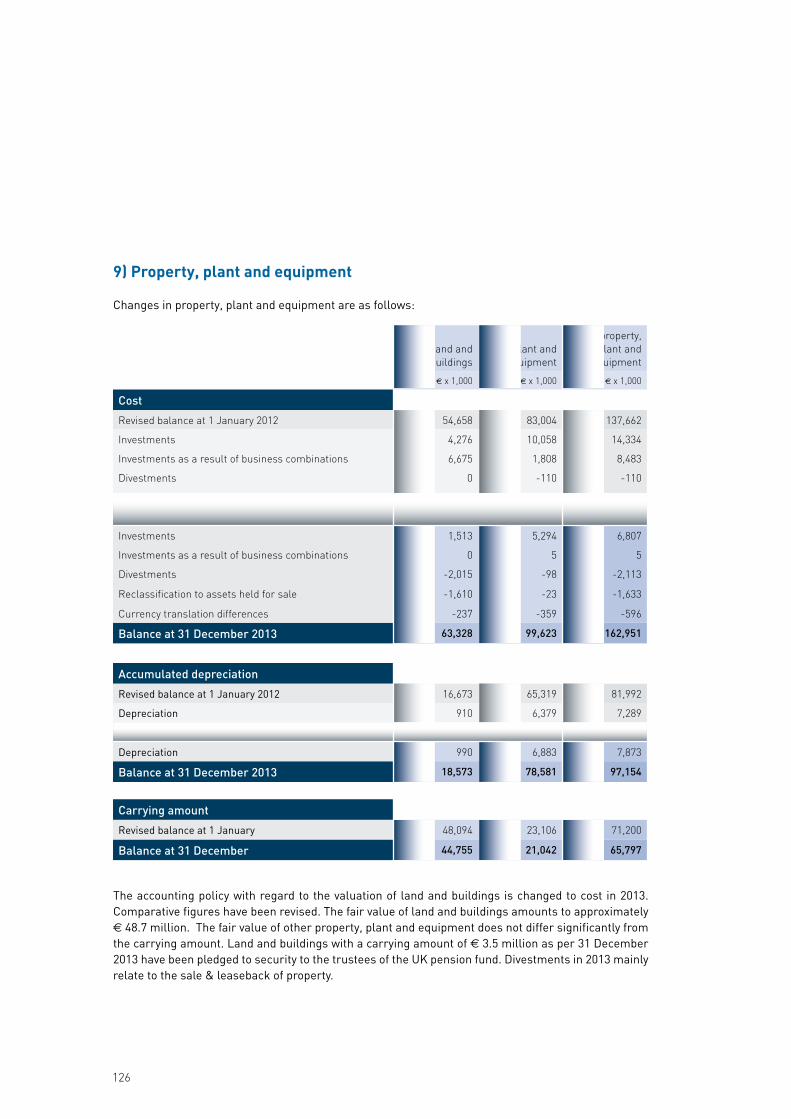
Land and buildings
Plant and equipment
Total property, plant and
equipment
A x 1,000 A x 1,000 A x 1,000
Cost
Revised balance at 1 January 2012 54,658 83,004 137,662
Investments 4,276 10,058 14,334
Investments as a result of business combinations 6,675 1,808 8,483
Divestments 0 -110 -110
Currency translation differences 68 44 112
Revised balance at 1 January 2013 65,677 94,804 160,481
Investments 1,513 5,294 6,807
Investments as a result of business combinations 0 5 5
Divestments -2,015 -98 -2,113
Reclassification to assets held for sale -1,610 -23 -1,633
Currency translation differences -237 -359 -596
Balance at 31 December 2013 63,328 99,623 162,951
Accumulated depreciation
Revised balance at 1 January 2012 16,673 65,319 81,992
Depreciation 910 6,379 7,289
Revised balance at 1 January 2013 17,583 71,698 89,281
Depreciation 990 6,883 7,873
Balance at 31 December 2013 18,573 78,581 97,154
Carrying amount
Revised balance at 1 January 48,094 23,106 71,200
Balance at 31 December 44,755 21,042 65,797
The accounting policy with regard to the valuation of land and buildings is changed to cost in 2013. Comparative figures have been revised. The fair value of land and buildings amounts to approximately b 48.7 million. The fair value of other property, plant and equipment does not differ significantly from the carrying amount. Land and buildings with a carrying amount of b 3.5 million as per 31 December 2013 have been pledged to security to the trustees of the UK pension fund. Divestments in 2013 mainly relate to the sale & leaseback of property.
9) Property, plant and equipment
Changes in property, plant and equipment are as follows:
ACCELL GROUP NV | ANNUAL REPORT 2013 | FIT FOR A HEALTHY FUTURE FINAN
CIAL
STA
TEME
NTS
127
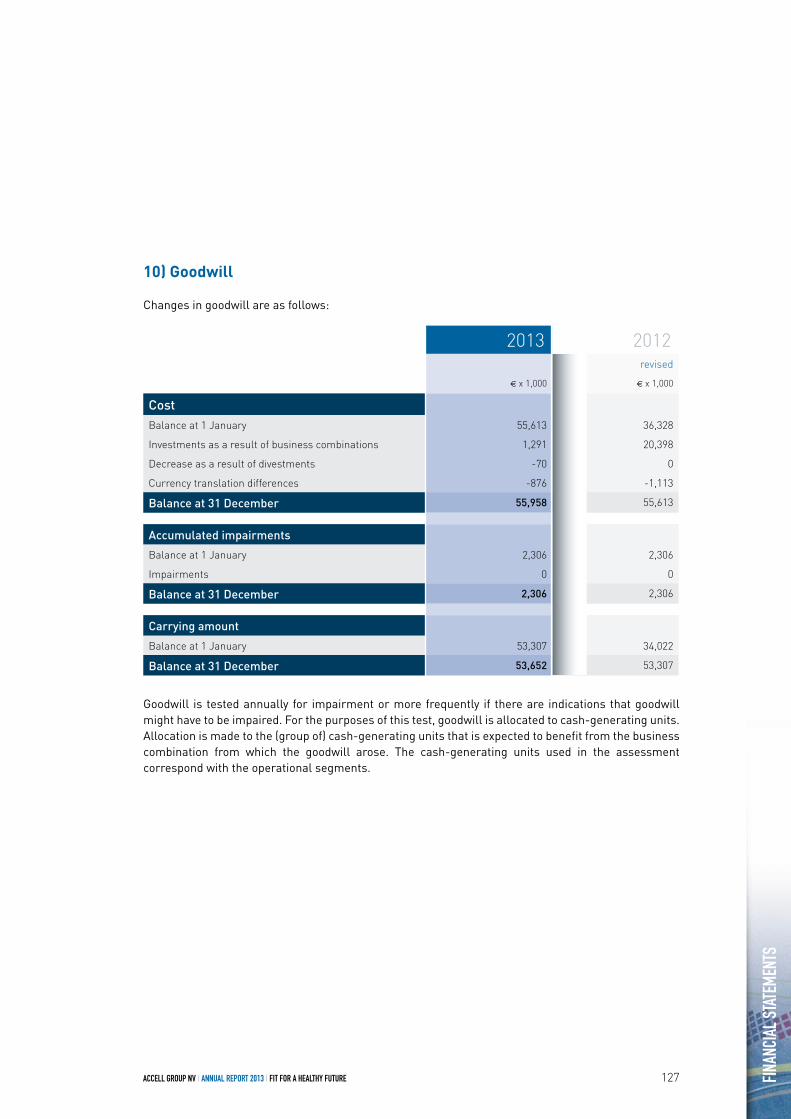
10) Goodwill
Changes in goodwill are as follows:
2013 2012revised
A x 1,000 A x 1,000
CostBalance at 1 January 55,613 36,328
Investments as a result of business combinations 1,291 20,398
Decrease as a result of divestments -70 0
Currency translation differences -876 -1,113
Balance at 31 December 55,958 55,613
Accumulated impairments
Balance at 1 January 2,306 2,306
Impairments 0 0
Balance at 31 December 2,306 2,306
Carrying amount
Balance at 1 January 53,307 34,022
Balance at 31 December 53,652 53,307
Goodwill is tested annually for impairment or more frequently if there are indications that goodwill might have to be impaired. For the purposes of this test, goodwill is allocated to cash-generating units. Allocation is made to the (group of) cash-generating units that is expected to benefit from the business combination from which the goodwill arose. The cash-generating units used in the assessment correspond with the operational segments.

128
The carrying amount of goodwill (with an indefinite useful life) on segment level is divided as follows:
2013 2012revised
A x 1,000 A x 1,000
Bicycles & bicycle parts 53,652 53,307
Fitness 0 0
53,652 53,307
The following main assumptions are used in determining the value in use of the segment bicycles & bicycle parts and are based on historical experiences in specific markets and countries:- turnover growth based on the historical average of the last 3 years of 4.7% (2012: 5.4%);- operating margin based on the average of the last 3 years of 6.0% (2012: 8.2%);- working capital based on the historical average ratios in relation to turnover in the last 3 years of 33%
(2012: 31%);- a constant growth rate of 3% (2012: 3%) is used for the estimates of the future cash flow after the
initial period of 5 years;- a weighted average cost of capital post-tax of 7.6% (2012: 7.1%) was used for the discounting of the
cash flows. The discounting rate applied in accordance with IAS 36.55 corresponds to a weighted average cost of capital pre-tax of 9.9% (2012: 9.2%).
The impairment test in 2013 shows a substantial headroom in goodwill. Accell Group believes that any reasonably possible change in the key assumptions on which the recoverable amount is based would not cause the carrying amount to exceed the recoverable amount of the cash-generating units.

ACCELL GROUP NV | ANNUAL REPORT 2013 | FIT FOR A HEALTHY FUTURE FINAN
CIAL
STA
TEME
NTS
129
11) Other intangible fixed assets
Other intangible fixed assets consist of trademarks and patents, customer lists and licenses, and development costs. The changes are as follows:
Trademarks and patents
Customer lists and licenses
Development costs
Total other intangible fixed
assets
A x 1,000 A x 1,000 A x 1,000 A x 1,000
Cost
Balance at 1 January 2012 15,897 1,020 1,632 18,549
Investments 325 0 0 325
Investments as a result of business combinations
23,156 0 0 23,156
Currency translation differences -38 44 0 6
Balance at 1 January 2013 39,340 1,064 1,632 42,036
Investments 29 1,500 82 1,611
Investments as a result of business combinations 0 900 0 900
Currency translation differences -419 -504 -2 -925
Balance at 31 December 2013 38,950 2,960 1,712 43,622
Accumulated depreciation
Balance at 1 January 2012 1,988 0 553 2,541
Depreciation 521 55 293 869
Balance at 1 January 2013 2,509 55 846 3,410
Depreciation 194 235 393 822
Balance at 31 December 2013 2,703 290 1,239 4,232
Carrying amount
Balance at 1 January 2013 36,831 1,009 786 38,626
Balance at 31 December 2013 36,247 2,670 473 39,390

130
Trademarks mainly consist of the valuation of trademarks Raleigh (R 14.1 million), Diamondback (R 7.3 million) and Ghost (R 9.4 million) as per 31 December 2013. Furthermore trademarks of SBS, Brasseur, Hellberg, Currie and Van Nicholas are valued for a total amount of R 5.1 million. Investments in customer lists and licences consist of the valuation of the customer list of the in 2013 acquired Proway and the recognition of the extension of a license agreement by 10 years. The useful life of the Finnish customer list of Proway is estimated to be 10 years; as from 2013 this list is amor-tised. In addition, the customer lists consist of the valuation of the Turkish dealer network accounted for in the acquistion of Accell Bisiklet. The useful life of this customer list is estimated to be 20 years; as from 2012 this list is amortised. Development costs relate to a development project in connection with electric bicycles. Amortisation was started when the developed asset was put into use.
Amortisation expenses are accounted for in the income statement under depreciation. The remaining amortisation term for activated patents is 5 years, for the Turkish customer list 18 years and for the Finnish customer list 9 years. Trademarks have an indefinite useful life since it is not possible to determine a predictable limitation of the useful life.
The carrying amount of the trademarks (with indefinite useful life) at segment level is specified as follows:
Trademarks with indefinite useful life are subject to impairment testing.
2013 2012A x 1,000 A x 1,000
Bicycles & bicycle parts 35,895 36,111
Fitness 0 0
35,895 36,111

ACCELL GROUP NV | ANNUAL REPORT 2013 | FIT FOR A HEALTHY FUTURE FINAN
CIAL
STA
TEME
NTS
131
12) Subsidiaries
The consolidated 2013 financial statements include Accell Group N.V., in Heerenveen, and the financial information of the following companies.
Some subsidiaries that are immaterial to the consolidated financial statements are not included in the overview above. A complete list of subsidiaries is filed with the Trade Register of the Chamber of Commerce in Leeuwarden, the Netherlands.
Consolidated subsidiaries Participation Percentage
Accell Bisiklet A.S., Manisa, Turkey 100%
Accell Duitsland B.V., Heerenveen, The Netherlands 100%
Accell Hunland Kft, Toszeg, Hungary 100%
Accell Germany GmbH, Sennfeld, Germany 100%
Accell IT Services B.V., Heerenveen, The Netherlands 100%
Accell Ltd, St. Peter Port, Guernsey 100%
Accell North America Inc, Kent, Washington, United States of America 100%
Accell Suisse AG, Alpnach Dorf, Switzerland 100%
ATC Ltd (Taiwan Branch), Taipei, Taiwan 100%
Batavus B.V., Heerenveen, The Netherlands 100%
Brasseur S.A., Liège, Belgium 100%
Currie Tech Corp., Simi Valley, California, United States of America 100%
Cycles Lapierre S.A.S., Dijon, France 100%
Cycles France-Loire S.A.S., Saint-Cyprien, France 100%
E. Wiener Bike Parts GmbH, Sennfeld, Germany 100%
Ghost-Bikes GmbH, Waldsassen, Germany 100%
Juncker Bike Parts B.V., Veenendaal, The Netherlands 100%
Koga B.V., Heerenveen, The Netherlands 100%
Raleigh Canada Ltd, Oakville, Ontario, Canada 100%
Raleigh UK Ltd, Nottingham, United Kingdom 100%
Sparta B.V., Apeldoorn, The Netherlands 100%
Swissbike Vertriebs GmbH, Alpnach Dorf, Switzerland 100%
Tunturi Fitness B.V., Almere, The Netherlands 100%
Tunturi-Hellberg Oy Ltd, Turku, Finland 100%
Vartex AB, Varberg, Sweden 100%
Winora Staiger GmbH, Sennfeld, Germany 100%

132
13) Other financial fixed assets
Participation percentage
Non-consolidated companies 2013 2012In2Sports B.V., Eindhoven, The Netherlands (i) 0% 41%
Jalaccell OÜ, Tallinn, Estonia (ii) 35% 35%
Babboe B.V., Utrecht, The Netherlands (iii) 38% 28%
Atala SpA, Monza, Italy (iv) 50% 50%
Velogic B.V., Genemuiden, The Netherlands (v) 20% 20%
Von Backhaus ApS, Odense, Denmark (vi) 40% 0%
Non-current Current
31-12-2013 31-12-2012 31-12-2013 31-12-2012
A x 1,000 A x 1,000 A x 1,000 A x 1,000
Loans provided to related parties 2,463 2,692 125 125
(i) In2Sports B.V. is a company that is active in the field of information and communication technology and the development of sport and fitness technology.
(ii) Jalaccell OÜ is a joint venture of Tunturi Fitness B.V. set up for the assembly and storage of fitness equipment. Currently, Jalaccell is expanding into other activities in the metal business.
(iii) Babboe B.V. is a company that is active in the sales and marketing of carrier bicycles.(iv) Atala SpA is a trading company active in the development and sales of bicycles under its own
brands.(v) Velogic BV is a company active in the development, production and distribution of softwaresystems
for bicycles and automatic bicycle dispenser systems for rental, parking and managing of bicycles.(vi) Von Backhaus ApS is a trading company active in the development and sales of bicycles under its
own brands.
In 2013 the participation in In2Sports B.V. is sold, reference is made to note 23 ‘Business combinations’.
Summary of the financial data for the interests in non-consolidated companies:
2013 2012A x 1,000 A x 1,000
Total assets 11,119 11,727
Total liabilities 8,058 8,519
Total turnover 17,226 16,521
Total net profit 489 188

ACCELL GROUP NV | ANNUAL REPORT 2013 | FIT FOR A HEALTHY FUTURE FINAN
CIAL
STA
TEME
NTS
133
During 2006, a loan was provided to a non-consolidated company with a term of 10 years. The interest rate on this loan is currently 3% per annum. As security for this loan a mortgage was vested on the building and a right of pledge was established on other assets. Further, in 2012 a loan was provided to a non-consolidated company at 4% interest per annum and with a term of 5 years. Securities are pledged for this loan. Both loans are valued against amortised cost based on the effective interest method. In line with the characteristics of the loans, the nominal value equals the fair value as well as the amortised cost. The current part of the loans is presented under ‘other receivables’.
14) Inventories
Goods in transit relates to shipped goods for which Accell Group had acquired the economic ownership as at the balance sheet date, but which have not yet been received.
As at balance sheet date, inventories with a carrying amount of approximately A 19.1 million are valued at lower net realisable value. The cost of inventories recognised as an expense includes A 2.5 million (2012: A 5.1 million) with respect to write-downs of inventory to net realisable value.
The costs of inventory that are recorded as an expense during the financial year is A 632.5 million (2012: A 568.7 million).
2013 2012A x 1,000 A x 1,000
Goods in transit 34,334 28,904
Raw materials 64,482 84,718
Work in process 2,841 3,793
Trading and finished products 136,651 151,696
238,308 269,111

134
15) Trade receivables
The nominal amount of the trade receivables approximates the fair value. In 2013 Accell Group terminated the factoring agreements. In accordance with IAS 39, the trade receivables transferred to factoring companies are not recognised in the balance sheet. Per balance sheet date, the remaining amount involved is A 10.7 million (2012: A 21.2 million). Total costs in 2013 resulting from the factoring agreement amounts to A 1.1 million and consist of bank charges (A 0.7 million) and financing expenses (A 0.4 million). There are no other gains or losses. Accell Group remains responsible for the collection of the transferred receivables until 60 days after maturity date. In case the conditions of the factoring agreements are not fulfilled, the factoring companies have the option to take over collection of the receivables or not to accept new receivables. The chance this will happen is considered very remote.
Trade receivables are non-interest-bearing and, depending on the season, are governed by a 30-150 day term of payment. The provision for impairment is determined on the basis of an individual assessment of overdue trade receivables. Accell Group has developed a credit policy to maintain control over credit risks relating to trade receivables. The policy regarding credit risks is covered in note 22, ‘Financial instruments and risk management’.
The changes in the provision for the impairment of trade receivables are as follows:
2013 2012A x 1,000 A x 1,000
Trade receivables 105,953 110,357
Provision for impairment of receivables -6,458 -5,864
99,495 104,493
2013 2012A x 1,000 A x 1,000
Balance at 1 January 5,864 5,387
Utilisation -1,409 -1,300
Provided 1,999 2,260
Releases -216 -490
Currency translation differences 220 7
Balance at 31 December 6,458 5,864

ACCELL GROUP NV | ANNUAL REPORT 2013 | FIT FOR A HEALTHY FUTURE FINAN
CIAL
STA
TEME
NTS
135
Accell Group has agreed various specific and, to a limited extent, individual terms of payment with its customers that differ depending on the nature of the customers and that can also differ depending on the country. Due to the seasonal nature of the activities, customers are offered so-called winter terms, whereby the customers can opt for an extra payment discount or a longer payment period. This is customary in the business.
The aging analysis of trade receivables is provided in the overview below:
Gross Impaired trade
receivables
Provision for
impairment
Net
At 31 December 2013 A x 1,000 A x 1,000 A x 1,000 A x 1,000
Current 79,090 488 164 78,926
0-90 days overdue 11,880 783 116 11,764
90-150 days overdue 3,690 637 175 3,515
more than 150 days overdue 11,293 8,277 6,003 5,290
Total 105,953 10,185 6,458 99,495
Gross Impaired trade
receivables
Provision for
impairment
Net
At 31 December 2012 A x 1,000 A x 1,000 A x 1,000 A x 1,000
Current 75,905 1,027 203 75,702
0-90 days overdue 20,092 3,345 209 19,883
90-150 days overdue 4,620 1,807 558 4,062
more than 150 days overdue 9,740 8,086 4,894 4,846
Total 110,357 14,265 5,864 104,493
16) Equity
The consolidated equity is equal to that of the parent company. The explanatory notes and movement overviews of the equity are included in the company financial statements.

136
17) Interest-bearing loans
Early 2013, Accell Group entered into a financing agreement with a syndicate of 6 (international) banks for a total group financing of A 300 million. The participating banks in the syndicate are ABN AMRO Bank, Deutsche Bank, ING Bank, Rabobank, BNP Paribas and HSBC. The financing consists of A 125 million long-term loans (term loans) and working capital financing (revolving credit facility) of A 175 million, of which A 65 million is available during the peak season.
The interest rate for the term loans is fixed and is approximately 4.0% in 2013. With the new financing agreement all existing financing agreements ended, except for the 10-year loan facility from Deutsche Bank of A 15 million. This loan facility is integrated in the new financing agreement and the covenants are harmonised, but the loan has a remaining term of 8 years and has an (in principle fixed) interest rate of 5.9% per annum, whereby the credit rate which is included in this interest rate will be determined once a year.
The financing agreement, initially committed for 3 years with an option to extend to 5 years, has been extended for an additional year in 2013. All participating banks approved the extension.
Accell Group is providing securities in the form of trade receivables and stocks for all Dutch, German, UK and US group companies to the lenders. In connection with the other loans, limited collateral was provided. The average interest rate on the other loans is 3.0%.
The policy regarding interest rate risks is covered in note 22, ‘Financial instruments and risk management’. The financial covenants, which are part of the financing agreement, are also covered in this note.
Non-current Current
31-12-2013 31-12-2012 31-12-2013 31-12-2012
A x 1,000 A x 1,000 A x 1,000 A x 1,000
Roll-over loan 0 0 0 4,548
EURIBOR loans 0 0 0 27,000
Term loans 102,856 0 12,500 0
Other bank loans 457 15,780 217 34,101
Bank overdrafts 0 0 83,370 68,968
103,313 15,780 96,087 134,617

ACCELL GROUP NV | ANNUAL REPORT 2013 | FIT FOR A HEALTHY FUTURE FINAN
CIAL
STA
TEME
NTS
137
The non-current interest-bearing liabilities are due for repayment as follows:
Term less than 5 years
Term more than 5 years Total
A x 1,000 A x 1,000 A x 1,000
Term loans 100,356 15,000 115,356
Other bank loans 674 0 674
Subtotal 101,030 15,000 116,030
Proportion of loans with a term of less than 1 year -12,717 0 -12,717
Balance at 31 December 2013 88,313 15,000 103,313
18) Pension provisions and net pension assets
Defined benefit plans Accell Group sponsors funded defined benefit plans for qualifying employees. The main defined benefit plan is the plan in the United Kingdom, which accounts for approximately 85% of the defined benefit obligation and for more than 90% of the plan assets. This plan is administred by a separate fund that is legally separated from the company. Pension benefits are related to the member’s final salary at retirement and their lenght of service. Since December 2002 the defined benefit section of this pension scheme has been closed to future accrual. The scheme exposes the company to actuarial risks such as market risk, interest rate risk and inflation risk. The scheme does not expose the company to any unusual scheme-specific risk. The scheme’s investment strategy is to invest broadly 67% in return seeking assets (this includes equity linked bonds, absolute return bonds and diversified growth funds) and 33% in matching assets (index-linked gilts and bond like property). This strategy reflects the scheme’s liability profile and the trustees and company’s attitude to risk. The returns from the return seeking assets are not achieved solely by direct investment in return seeking assets, but the equity linked bonds allow exposure to equity type returns using futures backed by collateral in the form of index-linked gilts.
In addition, Accell Group sponsors funded defined benefit plans for qualified employees in Canada and Taiwan, a fixed unfunded defined benefit plan in Germany and an unfunded defined benefit plan in Hongkong. The defined benefit plans of Accell Group have no contributions from employees anymore, because the plans are mainly fixed.
138
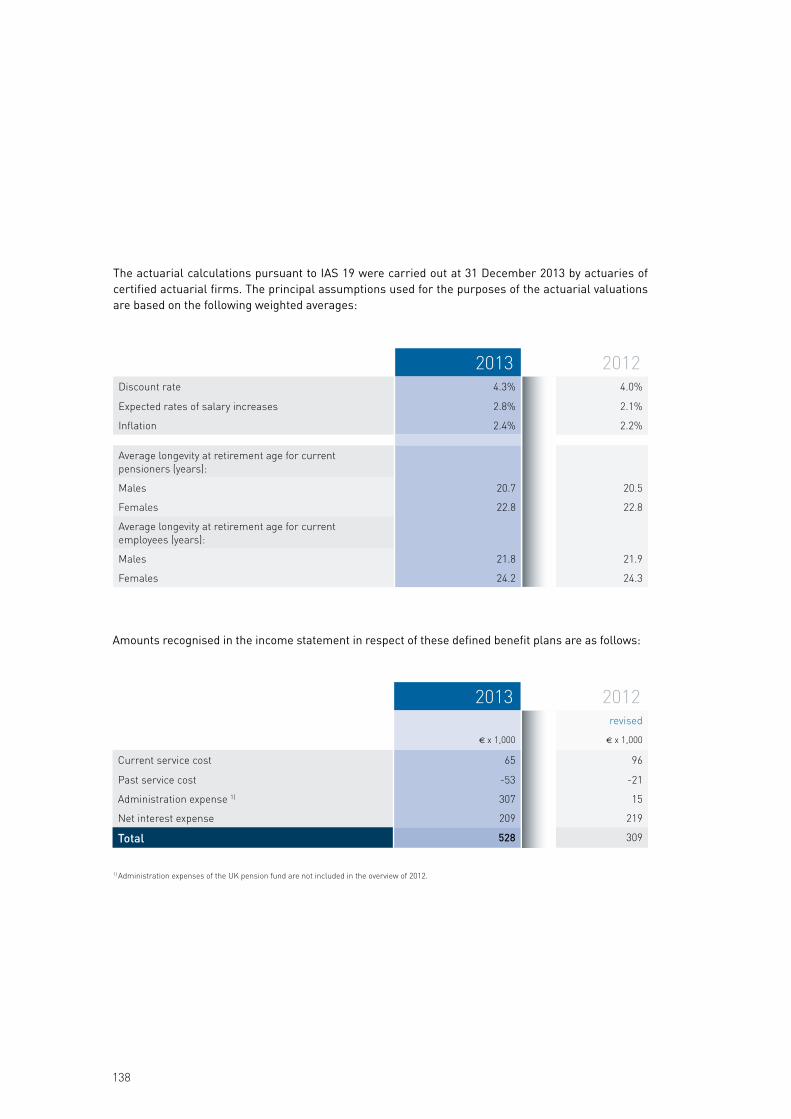
Amounts recognised in the income statement in respect of these defined benefit plans are as follows:
2013 2012revised
A x 1,000 A x 1,000
Current service cost 65 96
Past service cost -53 -21
Administration expense 1) 307 15
Net interest expense 209 219
Total 528 309
2013 2012Discount rate 4.3% 4.0%
Expected rates of salary increases 2.8% 2.1%
Inflation 2.4% 2.2%
Average longevity at retirement age for current pensioners (years):
Males 20.7 20.5
Females 22.8 22.8
Average longevity at retirement age for current employees (years):
Males 21.8 21.9
Females 24.2 24.3
The actuarial calculations pursuant to IAS 19 were carried out at 31 December 2013 by actuaries of certified actuarial firms. The principal assumptions used for the purposes of the actuarial valuations are based on the following weighted averages:
1) Administration expenses of the UK pension fund are not included in the overview of 2012.

ACCELL GROUP NV | ANNUAL REPORT 2013 | FIT FOR A HEALTHY FUTURE FINAN
CIAL
STA
TEME
NTS
139
Amounts recognised in other comprehensive income in respect of these defined benefit plans are as follows:
Amounts recognised in the balance sheet in respect of these defined benefit plans are as follows:
Toelichting (vervolg)
2013 2012revised
A x 1,000 A x 1,000
Remeasurement on the net defined liability:
Return on plan assets (excluding amounts included in net interest expenses) -987 -230
Actuarial (gains) and losses arising from changes in financial adjustments -410 1,511
Actuarial (gains) and losses arising from experience adjustments 66 -27
Contributions from the employer - partly under restrictions on assets recognised 154 0
Total -1,177 1,254
2013 2012revised
A x 1,000 A x 1,000
Net pension assets 1,564 1,022
Pension provisions -5,506 -7,336
Net liability 3,942 6,314
2013 2012revised
A x 1,000 A x 1,000
Present value of funded pension obligation 77,152 82,723
Minus: Fair value of plan assets -88,248 -90,236
Deficit/ (surplus) -11,096 -7,513
Present value of unfunded defined benefit obligation 5,424 5,516
Funded status -5,672 -1,997
Restrictions on assets recognised 9,614 8,311
Net liability 3,942 6,314

140
The movement in the fair value of the plan assets is as follows:
2013 2012revised
A x 1,000 A x 1,000
Balance at 1 January 90,236 584
Interest income 3,487 365
Remeasurement gain (loss):
Return on plan assets (excluding amounts included in net interest expense) 1,013 230
Others 0 21
Contributions from the employer 1,182 29
Administration expense -333 -5
Assets distributed on settlements -852 0
Assets acquired in a business combination 0 89,019
Exchange differences on foreign plans -2,554 0
Benefits paid -3,931 -7
Fair value of the plan assets at 31 December 88,248 90,236
The movement in the present value of the defined benefit obligation is as follows:
2013 2012revised
A x 1,000 A x 1,000
Balance at 1 January 88,239 5,629
Current service cost 65 96
Interest cost 3,290 584
Actuarial (gains) and losses arising from changes in financial adjustments -410 1,511
Actuarial (gains) and losses arising from experience adjustments 66
0
Administration expense 0 -5
Liabilities extinguished on settlements -905 0
Liabilities assumed in a business combination 0 80,700
Exchange differences on foreign plans -2,985 -37
Benefits paid -4,784 -239
Defined benefit obligation at 31 December 82,576 88,239

ACCELL GROUP NV | ANNUAL REPORT 2013 | FIT FOR A HEALTHY FUTURE FINAN
CIAL
STA
TEME
NTS
141
As per year-ending 2013 the fair values of the above equity investments and debt securities consist of: equity-linked bonds (A 20.2 million), diversified growth funds (A 18.1 million), absolute return bonds (A 16.4 million), index-linked gilts (A 20.0 million), property bonds (A 6.6 million) and other investments (A 6.1 million). These fair values are determined based on quoted market prices in active markets. The actual return on plan assets was A 5.0 million in 2013 (2012: A 4.5 million).
The average duration of the defined benefit obligation is 17 years as per 31 December 2013 (2012: 17 years). Significant actuarial assumptions for the determination of the defined benefit obligation are discount rate and expected salary increase. The sensitivity analysis below have been determined based on reasonably possible changes of the respective assumptions holding at the end of the reporting period, while holding all other assumptions constant:- if the discount rate is 1% higher (lower), the defined benefit obligation would decrease by A 8.1
million (increase by A 7.8 million);- if the expected salary growth increases (decreases) by 1%, the defined benefit obligation would
increase by A 5.4 million (decrease by A 5.2 million).
The sensitivity analysis is prepared as per year-ending using the same methods as applied in the defined benefit obigation in the balance sheet. The sensitivity analysis may not be representative of the actual change in the defined benefit obligation. It is unlikely that the change in assumptions would occur in isolation of one another as some of the assumptions are correlated. The net pension assets and restrictions on assets relate to the UK scheme. This scheme is subject to the scheme funding requirements outlined in UK legislation. In 2011, the company agreed with the trustees to strengthen the financial position of the UK pension fund and contribute A 0.8 million per year in order to achieve an independent financial position of the fund based on current UK gilt yields and accounting for unwinding costs. The company will pay these yearly contributions until 2022 or until the date the financial position of the fund has improved sufficiently, if sooner. At least every 3 years a valuation report will be drawn up to review the financial position of the fund. The yearly contribution does not lead to additional costs for the company, because these payments lead to an improvement of the plan assets, which is benificiary to the company when the scheme will gradually run-off or will eventually be winded up.
2013 2012A x 1,000 A x 1,000
Cash and cash equivalents 728 1,433
Equity investments 58,692 34,648
Debt securities 28,712 53,195
Other 116 960
Total 88,248 90,236
The fair value op the plan assets is categorised as follows:

142
In January 2013 a defined benefit plan in the Netherlands is transferred to a defined contribution plan at an insurance company. In 2012 the defined benefit obligations of the Raleigh companies in the United Kingdom, Canada, Taiwan and Hongkong were acquired. Accell Group expects to make a contribution of A 1.3 million in 2014 with regard to the defined benefit plans.
Defined contribution plansThe majority of the Dutch operating companies have set their pension plans to Metalektro, the pension fund for the metal working industry. The Metalektro pension fund informed Accell Group that the pension plans of the members should be included under IAS 19 as a defined contribution plan. Member companies only have an obligation to pay the annual pension premiums due. Member companies do not have any obligation to settle any deficits in the industrial pension fund. Member companies are also not entitled to any surplus. The annual report of Metalektro for 2012 shows a negative general reserve. From press releases issued by Metalektro in early 2014, it appears that cover ratio was below 105% at year-end 2013.
Employees of the company’s foreign subsidiaries generally fall under a local government pension plan. These subsidiaries are only required to contribute a certain percentage of payroll costs to the local pension institutions.
In 2013, an expense of A 4.5 million has been included in the income statement for the defined contribution plans.
19) Deferred taxes
Deferred taxes comprise the following:
2013 2012revised
A x 1,000 A x 1,000
Deferred tax assets 11,285 10,173
Deferred tax liabilities 9,681 9,938
Net deferred taxes 1,604 235

ACCELL GROUP NV | ANNUAL REPORT 2013 | FIT FOR A HEALTHY FUTURE FINAN
CIAL
STA
TEME
NTS
143
The movement in the deferred tax assets and liabilities is as follows:
Loss
car
ry fo
rwar
ds
cons
olid
ated
co
mpa
nies
Rev
alua
tion
of
prop
erty
, pla
nt a
nd
equi
pmen
t
Fina
ncia
l ins
trum
ents
Trad
emar
k va
luat
ion
Oth
er d
efer
red
taxe
s
Tota
l
b x 1,000 b x 1,000 b x 1,000 b x 1,000 b x 1,000 b x 1,000
Revised balance at 1 January 2012 4,652 -1,921 42 -3,310 -1,173 -1,710
Added through business combination 2,364 0 0 -2,576 -1,282 -1,494
Charged through other comprehensive income 0 0 2,767 0 232 2,999
Charged through income statement 400 43 0 4 -2 445
Change in income tax rate -34 61 0 0 -11 16
Transfer from/to current tax 0 0 0 0 0 0
Currency translation differences -18 -15 0 -8 20 -21
Revised balance at 31 December 2012 7,364 -1,832 2,809 -5,890 -2,216 235
Added through business combinations 0 0 0 -220 0 -220
Charged through other comprehensive income 0 0 86 0 -30 56
Charged through income statement 2,105 44 0 16 307 2,472
Change in income tax rate -466 0 0 74 -19 -411
Transfer from/to current tax -454 0 0 0 0 -454
Currency translation differences -159 10 0 77 -2 -74
Balance at 31 December 2013 8,390 -1,778 2,895 -5,943 -1,960 1,604
The deferred tax assets consist of tax loss carry forwards and taxable available depreciations. Only for tax loss carry forwards restrictions for realisation in time may apply. The tax loss carry forwards of Tunturi-Hellberg Oy Ltd are expected to be realised in the period from 2015 to 2022. The tax loss carry forwards incurred with Raleigh America Inc in the period before acquisition, will expected to be realised within the applicable period.
Accell Group and its 100% controlled Dutch subsidiaires form a fiscal unity for Dutch corporate income tax purposes.

144
20) Provisions
Non-current Current
31-12-2013 31-12-2012 31-12-2013 31-12-2012
revised
b x 1,000 A x 1,000 A x 1,000 A x 1,000
Deferred employee benefits 1,672 1,673 318 128
Warranties 2,473 2,487 3,873 2,987
Other provisions 1,185 280 2,444 900
5,330 4,440 6,635 4,015
The movement in provisions is as follows:
Deferred employee
benefits WarrantiesOther
provisions Total
A x 1,000 A x 1,000 A x 1,000 A x 1,000
Balance at 1 January 2013 1,801 5,474 1,180 8,455
Utilisation -52 -2,583 -2,760 -5,395
Provided 284 3,615 5,243 9,142
Release -20 -19 -14 -53
Discounting effect -2 -99 0 -101
Currency translation differences -21 -42 -20 -83
Balance at 31 December 2013 1,990 6,346 3,629 11,965
The deferred employee benefits relate to the provision in certain countries for future anniversary bonuses. The provision is based on contractual obligations and assumptions with respect to expectations of death and resignation. The warranty provision represents the estimated costs under warranty obligations for supplied goods and services as at balance sheet date. The provision is based on estimations of historical warranty information. The provisions for deferred employee benefits and warranty obligations are expected to have a duration between one and five years. Other provisions mainly relate to reorganisation provisions for the activities in the Netherlands and the United States. These provisions are generally expected to have a duration less than one year.

ACCELL GROUP NV | ANNUAL REPORT 2013 | FIT FOR A HEALTHY FUTURE FINAN
CIAL
STA
TEME
NTS
145
21) Deferred income
22) Financial instruments and risk management
The fair value of the ‘other financial instruments’ is determined on the basis of other inputs than quoted prices that are observable (level 2). For the determination general accepted valuation methods are used. The determined value in this way is equal to the price at which the derivative can be sold in a transparent market.
Deferred income consists of receipts in respect of extra warranty rights to be realised in the coming five years.
Non-current Current
31-12-2013 31-12-2012 31-12-2013 31-12-2012
revised
A x 1,000 A x 1,000 A x 1,000 A x 1,000
Deferred income 2,462 2,157 650 1,000
2013 2012A x 1,000 A x 1,000
Assets
Amortised cost
Non-current receivables 2,463 2,692
Trade and other receivables 118,117 120,027
Cash and cash equivalents 15,907 6,552
Fair value through cash flow hedging
Other financial instruments 0 0
Liabilities
Amortised cost
Interest bearing liabilities 199,400 150,397
Trade and other liabilities 87,785 149,326
Fair value through cash flow hedging
Other financial instruments 9,027 8,799
Categories of financial instruments in balance sheet as at 31 December:

146
Movement of the hedging reserve:
The fair value of currency derivatives and interest rate swaps is calculated by the financial institutions concerned using the Mark to Market method (MTM method). In 2013, E 0.6 million was charged to the hedging reserve (2012: E 8.3 million) pursuant to the fair value adjustments of the instruments to cover future cash flows. With respect to cash flow hedging of interest rate risks, it is expected that the underlying cash flows materialise at the time that the interest is due on the loans with a one-month or three-month floating interest rate. The cash flow hedges of the currency and interest rate derivatives were assessed as effective in 2013.
2013 2012A x 1,000 A x 1,000
Balance at 1 January -8,426 -126
amount included in equity -10,570 -10,794
amount included in cost of inventories 8,746 1,455
amount included in interest expenses 1,203 1,039
Balance at 31 December -9,047 -8,426
The other financial instruments comprise:
2013 2012A x 1,000 A x 1,000
Currency derivatives - cash flow hedging -5,201 -3,392
Interest rate swap - cash flow hedging -3,826 -5,407
-9,027 -8,799

ACCELL GROUP NV | ANNUAL REPORT 2013 | FIT FOR A HEALTHY FUTURE FINAN
CIAL
STA
TEME
NTS
147
Currency derivativesThe currency derivatives stated as at the balance sheet date will be settled during 2014. Currency derivatives outstanding as at the balance sheet date can be specified as follows:
Contract valuein b 1,000
Fair valuein b 1,000
Currency derivative Currency 2013 2012 2013 2012Put USD 98,341 78,952 -3,253 -3,041
Call USD 37,500 80,222 107 1,046
Put JPY 12,681 15,881 -1,358 -1,282
Call JPY 9,041 9,972 4 6
Put HUF 0 3,189 0 56
Call HUF 0 0 0 0
Put TWD 5,117 7,127 -258 -177
Call TWD 0 0 0 0
Put CAD 4,075 0 2 0
Call CAD 1,675 0 1 0
Put CHF 0 0 0 0
Call CHF 115 0 0 0
Put TRY 2,400 0 -258 0
Call TRY 0 0 0 0
Put SEK 0 0 0 0
Call SEK 7,420 0 -188 0
-5,201 -3,392
Interest rate swapsAccell Group uses interest rates swaps to convert the floating interest rate on its borrowings into a fixed interest rate. In 2008 and 2013 interest rate swaps were concluded to hedge the term loans. In 2011 and 2013 interest rate swaps were concluded to manage the interest rate risks of the expected drawings under the revolving credit facility in 2014.
The following table lists the nominal value and fair value of the interest rate obligations in connection with the loans in combination with the interest rate swaps as at the balance sheet date:
2013 2012A x 1,000 A x 1,000
Nominal value 4,240 6,837
Fair value 414 1,430

148
The policy of Accell Group regarding financing risks, credit risks, liquidity risks and market risks (currency and interest rate) is outlined below.
Capital management The company operates a funding policy that is based on the continuity of Accell Group. This is reflected in the management of the capital. Following the growth of the company in recent years, Accell Group decided in 2012 to harmonise its financing structure. This led to a fully refinance of the company in 2013. The basis was to achieve the right balance between long-term group financing and the strongly fluctuating seasonal working capital financing. Accell Group is quarterly required to comply with the ratios stipulated by the lenders in the financing agreement; in 2013 all financial covenants have been met.
As at 31 December 2013, on the basis of group equity the solvency amounted to 41.4% (as at 31 December 2012: 40.7%). As explained in the section on currency and interest rate risks, the movement in the hedging reserve has an effect on the solvency per year-end. Accell Group has no control over the changes in the market value of the underlying derivative financial instruments.
Liquidity riskIn managing the liquidity risk, Accell Group takes into account the strongly fluctuating seasonal nature of the activities. Therefore, in the funding of the group a distinction is made between long-term (core) funding and the seasonal credit facility. The financing agreement contains financial covenants on a quarterly basis in 2014 consisting of: - term loan/ EBITDA ratio (debt ratio) at year end 2014 below 2.5;- solvency ratio higher than 30% (whereby equity and balance sheet total at year-end are adjusted for
inter alia, intangible fixed assets and deferred taxes);- interest cover higher than 5;- with regard to the use of the seasonal financing the actual use may not exceed 50% of the qualifying
net working capital.
Total loans and bank overdrafts provided to Accell Group amounted to € 199.5 million at the end of the financial year; 52% of this is of a long-term nature. In addition to bank overdrafts, the group’s other short-term liabilities amounted to € 117.1 million at the end of the financial year.
The table below provides an indication of the total financial liabilities, including the estimated interest payments on long-term loans.
Carrying amount
Contractualcash flows
< 1 year 1- 5 year 5 year
a million a million a million a million a million
Non-current liabilities 121,4 142,1 17,1 107,4 17,7
Current liabilities 200,6 190,9 190,9

ACCELL GROUP NV | ANNUAL REPORT 2013 | FIT FOR A HEALTHY FUTURE FINAN
CIAL
STA
TEME
NTS
149
Credit riskThe activities of Accell Group entail various credit risks. The maximum credit risk is equal to the carrying amount of the trade receivables and other receivables. Risks are mitigated by the sale of trade receivables partly to factoring companies during 2013. No collateral is obtained to cover the credit risk other than a retention of ownership of goods delivered. Bicycles and bicycle parts are sold to a wide network of specialised bicycle shops, whereby many of the customers with whom Accell Group conducts business have a long-standing commercial relationship with Accell Group.
The credit policy stipulates, inter alia, that upon the acceptance of large customers, the creditworthiness of this potential customer must be verified both internally and externally, and a credit limit must also be set. There is no significant concentration of credit risks within Accell Group, as the group has a large number of customers. No customers comprise more than 10% of turnover.
The credit risks are continuously monitored. Outstanding receivables exceeding the due date are assessed individually at the end of the financial year, resulting in a substantiation of the provision for the impairment of receivables. For the total outstanding trade receivables of € 111.7 million, the provision for impairments amounted to € 6.5 million. The actual non-payment in 2013 amounted to € 1.4 million (2012: € 1.3 million). Fitness equipment is also mostly sold to a network of retail stores and distributors. Credit risks are also assessed individually.
Market riskThe market risk encompasses currency risks and interest rate risks. Accell Group uses a variety of instruments to hedge currency and interest rate risks arising from the operating, financing and investment activities. Accell Group’s treasury activities are centralised and carried out in accordance with the objectives and regulations stipulated by Accell Group. Accell Group’s policy stipulates that instruments shall only be kept if there is an actual commercial basis (transactions and obligations). Accell Group’s currency and interest rate risks have not changed during the year. Moreover, Accell Group’s approach to these risks has not changed during the year.
Control of currency risksIn view of the international nature of its activities, Accell Group is exposed to risks when buying and selling in foreign currency. This relates to US dollars (USD), Japanese yen (JPY), Taiwanese dollars (TWD), British pounds (GBP), Canadian dollars (CAD), Turkish lira (TRY), Swedish krona (SEK), Hungarian forint (HUF) and Swiss francs (CHF). Accell Group mitigates the currency risks for all significant exposures, mainly its estimated purchases in USD, JPY and TWD, by hedging a significant percentage of the currency risks prior to each season. This involves the use of currency future contracts and related swaps and options.
Unrealised gains and losses on the derivatives resulting from the concluded cash flow hedge transactions are temporarily included in the hedging reserve of the group equity. The cash flow hedge transactions entered into in 2013 achieved their objective. The hedging reserve is subject to changes as a result of developments in the market value of the concluded currency derivatives and interest rate swaps. Accell Group has no control over these market value developments.
A 1% change in the EUR/USD and EUR/JPY exchange rate from the current year-end exchange rate would result in an approximately € 1.0 million and € 0.1 million respective change in the hedging reserve of the group equity. Covering future cash flows and the use of cash flow hedging causes movements in equity as a result of changes in the market value of the underlying derivatives.
150
All derivative financial instruments are concluded with ABN AMRO Bank, Deutsche Bank, ING Bank, Rabobank or HSBC. The company incurs credit risks with these banks as long as these derivative financial instruments have a positive fair value and are not yet settled. This risk is considered acceptable in view of the creditworthiness of these banks.
Control of interest risksAs at 31 December 2013, the total of the floating interest on the long-term interest-bearing liabilities and a significant part of the floating interest on the short-term interest-bearing liabilities has been fixed with interest-rate swaps. These instruments are generally available, and are not regarded as specialised or as entailing significant risk.
As at 31 December, the term of 52% of the interest-bearing loans is longer than one year. An increase or decrease of 1% in market interest-rate governing short-term bank credit would have resulted in a decrease or increase in the profit before taxes of approximately D 0.2 million. This is taking into consideration that a significant part of the short-term bank credit is hedged with interest-rate swaps.

ACCELL GROUP NV | ANNUAL REPORT 2013 | FIT FOR A HEALTHY FUTURE FINAN
CIAL
STA
TEME
NTS
151
23) Business Combinations
Acquisition of subsidiariesAt the beginning of April 2013, Accell Group completed the acquisition of all the shares of Oy Proway International AB (‘Proway’) in Turku, Finland. Proway is a distributor of among others Raleigh in Finland and is integrated with the Accell Group company Tunturi-Hellberg Oy. The figures of Proway are consolidated as of 1 April 2013.
All transactions are accounted for by the purchase method of accounting. The acquired net assets consist of the following:
Fair value on acquisition
Fair value adjustments
Carrying amount
A x 1,000 A x 1,000 A x 1,000
Fixed assets 913 908 5
Other assets 796 0 796
Cash and cash equivalents 941 0 941
Other liabilities and acquisition obligations -941 -214 -727
1,709
Goodwill 1,291
Cash and cash equivalents acquired -941
Net cash flow of business combinations 2,059
The consideration paid for the business combinations consist of a premium for expected synergies, growth of turnover and the combined workforce. These benefits of the business combinations cannot be measured reliably and are therefore not reported separately from goodwill. The purchased goodwill is tax non-deductible. The other assets consist of gross contractual trade receivables and other receivables. The contributed net sales and net profit of this acquisition is marginal in 2013. Costs relating to the business combinations (legal and due diligence costs) amounted to less than A 0.1 million. The costs are accounted for in other operating expenses in the income statement.
Sale of non-consolidated companiesIn 2013 the participation (41%) in the non-consolidated company In2Sports B.V. was sold. This led to a cash inflow business combinations of A 0.7 million, a reduction of the participation value of A 0.3 million and a reduction of goodwill of A 0.1 million.

152
Operational lease obligationsThe company has financial obligations arising from long-term lease obligations, leases on IT equipment and motor vehicles. The total obligation amounts to approximately A 3.1 million per year and has an average remaining term of 2.2 years. The company also has financial obligations arising from long-term leases. This obligation amounts to approximately A 6.5 million a year and has an average remaining term of 3.4 years. As at balance sheet date, Accell Group has outstanding non-terminable operational lease obligations expiring as follows:
25) Off-balance obligations
2013 2012A x 1,000 A x 1,000
Within one year 1,933 616
Within two to five years 15,713 18,348
After five years 10,969 9,682
28,615 28,646
24) Dividend
The dividend in respect of financial year 2012 was determined at A 0.75 per share or as stock option during the General Meeting of Shareholders of 25 April 2013. After the period in which shareholders could report their preference, 39% chose the stock dividend. On 22 May 2013 A 10,836,000 was distributed as cash dividend and 523,908 shares were issued as stock dividend. With respect to the current year, the Board of Director proposes to make available to the shareholders a dividend with stock option of A 0.55 per share. This dividend proposal is subject to approval by the General Meeting of Shareholders on 24 April 2014 and is not reflected as a liability in these financial statements.

ACCELL GROUP NV | ANNUAL REPORT 2013 | FIT FOR A HEALTHY FUTURE FINAN
CIAL
STA
TEME
NTS
153
Intercompany transactions and balances between Accell Group and its non-consolidated companies have not been eliminated for consolidation purposes.
Trading transactionsDuring the year group companies entered into the following trading transactions with related parties:
26) Transactions with related parties
The following balances were outstanding at the end of the reporting period:
Sales of goods Purchases of goods
2013 2012 2013 2012
A x 1,000 A x 1,000 A x 1,000 A x 1,000
Atala SpA 5,771 5,343 322 0
Amounts owed by Amounts owed to
31-12-2013 31-12-2012 31-12-2013 31-12-2012
A x 1,000 A x 1,000 A x 1,000 A x 1,000
Atala SpA 1,366 1,069 58 50
31-12-2013 31-12-2012
A x 1,000 A x 1,000
Loans to related parties 2,588 2,817
The amounts outstanding are not provided for and will be settled in cash and cash equivalents. No guarantees have been given or received. No expense has been recognised in the current or prior periods for bad or doubtful debts in respect of the amounts owed by related parties.
Loans to related parties consists of both long- and short term financing agreements. At the end of 2013, Tunturi Fitness B.V. had an outstanding amount payable by Jalaccell OÜ of A 2.4 million in connection with the financing of fixed assets and working capital whereby a mortgage right on the business premises and pledge rights on other assets serve as security. In 2013 Accell Group provided a short-term loan to Velogic BV amounting to A 0.2 million.
Loans to related parties

154
Assets/ liabilities held for saleOn 31 January 2014 Accell Group announced that an agreement is reached on the sale of its German Hercules business to Zweirad-Einkaufs-Genossenschaft (ZEG) in Germany. The divestment of Hercules improves the distinctive market positioning of the Accell Group brand portfolio in Germany and optimises Accell Group’s availabe resources for investing in its other German brands.
The agreement reached involves the transfer of the Hercules brand, land and buildings in Neuhof and the entire working capital of the Hercules business to ZEG. The assets and liabilities held for sale are specified as follows:
Classification as assets held for sale did not result in an impairment of the assets, which are included in the segment bicycle & bicycle parts. The sale in 2014 is expected to result in a gain of approximately b 3 million.
27) Events after balance sheet date
31-12-2013
A x 1,000
Property, plant and equipment 1,633
Inventories 12,861
Trade accounts receivable 5,217
Assets held for sale 19,711
Bank overdrafts 147
Trade payables 523
Liabilities held for sale 670
OtherFor explanatory notes on the total of benefits for key management personnel amounting to d 1.9 million, please refer to the notes on the company financial statements on page 160.

ACCELL GROUP NV | ANNUAL REPORT 2013 | FIT FOR A HEALTHY FUTURE FINAN
CIAL
STA
TEME
NTS
155
28) External auditors costs
The total costs for the services provided by Deloitte Accountants B.V. are:
2013 2012A x 1,000 A x 1,000 A x 1,000 A x 1,000 A x 1,000 A x 1,000
Deloitte Accoun-
tantsB.V.
OtherDeloitte network
TotalDeloitte
Deloitte Accoun-
tantsB.V.
OtherDeloitte network
TotalDeloitte
Audit of the financial statements 352 138 490 436 49 485
Other audit assignments 126 40 166 106 0 106
Tax services 0 21 21 0 22 22
Other non-audit services 0 0 0 315 0 315
478 199 677 857 71 928

156
Before profit appropriation (in thousands of euros)
COMPANY BALANCE SHEET AS AT 31 DECEMBER
2013 2012Liabilities revised
Equity b)
Share capital 244 239
Share premium reserve 44,442 44,799
Hedging reserve -9,047 -8,426
Translation reserve -12,735 -4,310
Other statutory reserve 1,530 1,984
Other reserves 196,529 182,207
Net profit for the year 19,020 23,292
239,983 239,785
Long-term liabilitiesInterest-bearing loans 115,356 15,000
Other provisions 0 0
115,356 15,000
Current liabilitiesAmounts owed to group companies 405 600
Interest-bearing loans and bank overdrafts 80,165 107,263
Other current liabilities 10,454 10,798
91,024 118,661
Total liabilities 446,363 373,446
2013 2012Assets revised
Non-current assetsProperty, plant and equipment 133 162
Goodwill 3,110 3,181
Other intangible fixed assets 77 160
Financial fixed assets a) 421,363 328,122
424,683 331,625
Current assetsAmounts receivable from group companies 7,479 15,297
Other receivables 6,136 7,238
Cash and cash equivalents 8,065 19,286
21,680 41,821
Total assets 446,363 373,446
The letters following the various items refer to the notes on pages 158 to 162.

ACCELL GROUP NV | ANNUAL REPORT 2013 | FIT FOR A HEALTHY FUTURE FINAN
CIAL
STA
TEME
NTS
157
Valuation principles and accounting policies relating to the determination of the resultThe company financial statements have been prepared in accordance with Title 9, Book 2 of the Dutch Civil Code. In accordance with article 2:362 (8) of the Dutch Civil Code, the accounting policies for the parent company are identical to the policies that Accell Group NV applies with regard to the consolidated financial statements. Information on the accounting policies is given in the notes to the consolidated financial statements.
The financial data of Accell Group NV are incorporated in the consolidated financial statements. Therefore an abbreviated income statement is presented for the company under article 2:402 of the Dutch Civil Code.
SubsidiariesIn accordance with article 2:362 (8) of the Dutch Civil Code, subsidiaries that are included in the consolidation are stated at net asset value. The equity and results of the subsidiaries have been determined in accordance with the accounting policies of Accell Group NV.
(in thousands of euros)
COMPANY INCOMESTATEMENT
2013 2012revised
Net profit from subsidiaries after taxes 20,029 28,959
Other results -1,009 -5,667
19,020 23,292

158
Investments/divestments in 2013 are mainly related to the transfer of the participation value of the Raleigh companies to the respective holding companies.
b) EquityThe authorised capital amounts to b 650,000, divided into 27,500,000 ordinary shares, 5,000,000 preference shares F and 32,500,000 preference shares B, each with a nominal value of b 0.01. Of these, 24,402,809 ordinary shares have been issued and duly paid, as a result of which the issued and paid-up share capital amounts to b 244,028.49.
a) Financial fixed assetsThe changes in the financial fixed assets are as follows:
(in thousands of euros)
NOTES TO THE COMPANY BALANCE SHEET
2013 2012revised
Subsidiaries
Balance as at 1 January 236,661 167,811
Net profit 20,029 28,959
Investments /divestments -58,538 73,546
Dividend payments -8,182 -32,277
Translation differences -5,678 -356
Other movements 786 -1,022
Balance as at 31 December 185,078 236,661
Receivables from group companies
Balance as at 1 January 91,461 61,161
Loans provided 268,580 43,761
Loans repaid -123,756 -13,461
Balance as at 31 December 236,285 91,461
Total financial fixed assets 421,363 328,122

ACCELL GROUP NV | ANNUAL REPORT 2013 | FIT FOR A HEALTHY FUTURE FINAN
CIAL
STA
TEME
NTS
159
Statement of movements in shareholders’ equityI. Share capital
Balance as at 31 December 2012 239
Stock dividend 5
Options exercised and stock option plan 0
Balance as at 31 December 2013 244
II. Share premium reserve
The share premium reserve includes amounts paid in on the shares over and above the nominal value.
Balance as at 31 December 2012 44,799
Stock dividend -5
Options exercised and stock option plan -352
Balance as at 31 December 2013 44,442
III. Hedging reserve
The hedging reserves comprises of the effective part of the cumulative net movement in the fair value of the cash-flow hedging instrument, after allowing for deferred taxes.
Balance as at 31 December 2012 -8,426
Fair value adjustment of financial instruments -3,516
Movement in deferred taxes 2,895
Balance as at 31 December 2013 -9,047
IV. Translation reserve
The translation reserve comprises of foreign currency exchange differences on thetranslation of the foreign currency balance in participations.
Balance as at 31 December 2012 -4,310
Exchange differences arising on translation of foreign operations -8,425
Balance as at 31 December 2013 -12,735
V. Statutory reserve
The statutory reserve comprises of capitalised development expenditure and statutory reserve participations.
Balance as at 31 December 2012 1,984
Change in intangible fixed assets -313
Other movements -141Balance as at 31 December 2013 1,530
VI. Other reserves
Revised balance as at 31 December 2012 182,207
Movement profit 2012 23,292
Dividend payment 2012 -10,836
Recognition of share-based payments 267
Remeasurement of defined benefit obligations 1,177
Movement in deferred taxes -30
Change in intangible fixed assets 313
Other movements 139
Balance as at 31 December 2013 196,529
VII. Profit for the year
Revised balance as at 31 December 2012 23,292
Movement profit 2012 -23,292
Net profit 2013 19,020
Balance as at 31 December 2013 19,020
Total equity as at 31 December 2013 239,983
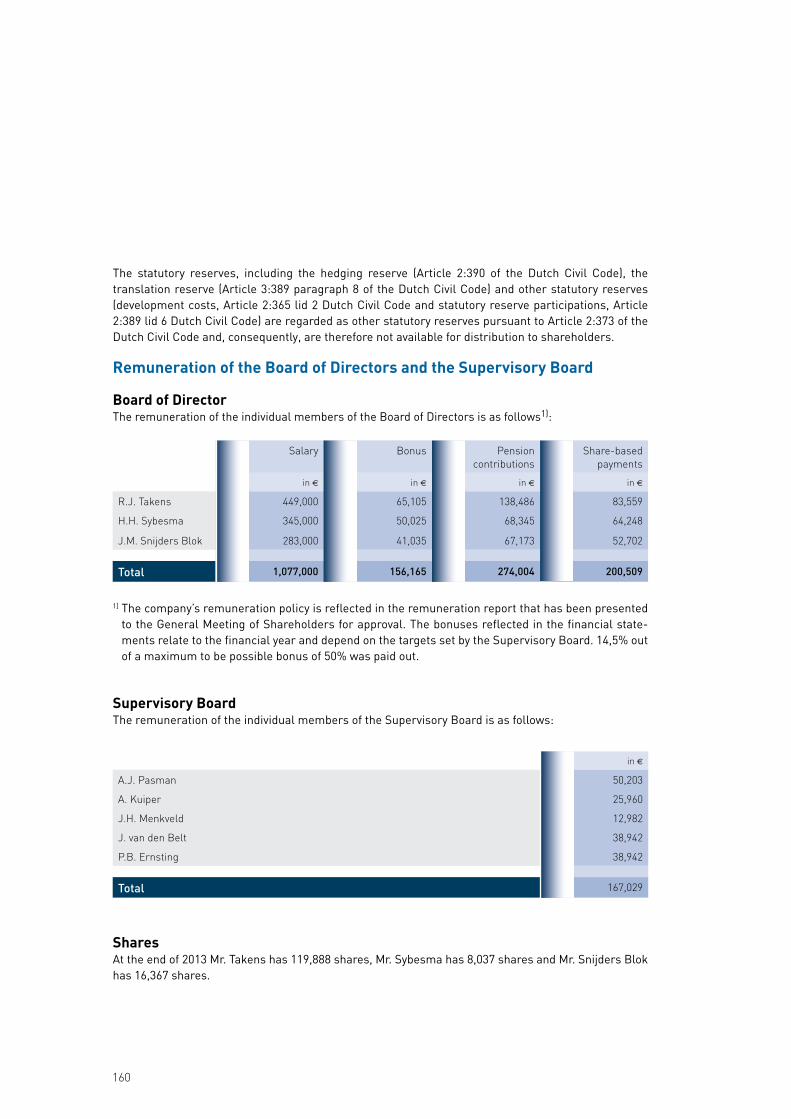
160
The statutory reserves, including the hedging reserve (Article 2:390 of the Dutch Civil Code), the translation reserve (Article 3:389 paragraph 8 of the Dutch Civil Code) and other statutory reserves (development costs, Article 2:365 lid 2 Dutch Civil Code and statutory reserve participations, Article 2:389 lid 6 Dutch Civil Code) are regarded as other statutory reserves pursuant to Article 2:373 of the Dutch Civil Code and, consequently, are therefore not available for distribution to shareholders.
Remuneration of the Board of Directors and the Supervisory Board
Board of DirectorThe remuneration of the individual members of the Board of Directors is as follows1):
Salary Bonus Pensioncontributions
Share-based payments
in A in A in A in A
R.J. Takens 449,000 65,105 138,486 83,559
H.H. Sybesma 345,000 50,025 68,345 64,248
J.M. Snijders Blok 283,000 41,035 67,173 52,702
Total 1,077,000 156,165 274,004 200,509
1] The company’s remuneration policy is reflected in the remuneration report that has been presented to the General Meeting of Shareholders for approval. The bonuses reflected in the financial state-ments relate to the financial year and depend on the targets set by the Supervisory Board. 14,5% out of a maximum to be possible bonus of 50% was paid out.
Supervisory BoardThe remuneration of the individual members of the Supervisory Board is as follows:
in A
A.J. Pasman 50,203
A. Kuiper 25,960
J.H. Menkveld 12,982
J. van den Belt 38,942
P.B. Ernsting 38,942
Total 167,029
SharesAt the end of 2013 Mr. Takens has 119,888 shares, Mr. Sybesma has 8,037 shares and Mr. Snijders Blok has 16,367 shares.

ACCELL GROUP NV | ANNUAL REPORT 2013 | FIT FOR A HEALTHY FUTURE FINAN
CIAL
STA
TEME
NTS
161
At 22 February 2013 8,900 options were exercised, at 11 April 2013 31,100 options and at 10 October 2013 19,200 options.
The stock option entitlements that have been granted comprise of the following:
Number at Granting date Expiry date Exercise price
Fair valueat granting
date
Average exercise
price
Options 31-12-2012 31-12-2013 in A in A in A
Granted in 2008 31,400 0 22-02-08 3-5 year 12.58 2.82 13.65
Granted in 2009 31,800 0 20-02-09 3-5 year 9.08 1.86 14.23
Granted in 2010 25,640 25,640 19-02-10 3-5 year 16.65 2.84
Granted in 2011 24,480 24,480 24-02-11 3-5 year 19.39 3.57
Number at01-01-2013
Issuedin 2013
Exercisedin 2013
Number at 31-12-2013
Average exercise price
beginning ofperiod
Averageexercise price at
year-end
Weightedaverage term at
year-end
Directors in A in A
R.J. Takens 53,280 - 32,800 20,480 13.39 17.99 1.65
H.H. Sybesma 16,260 - - 16,260 17.99 17.99 1.65
J.M. Snijders Blok 43,780 - 30,400 13,380 13.22 17.99 1.65
113,320 - 63,200 50,120
The Supervisory Board awards options to the directors based on the realisation of targets set in agreement with the Board of Directors and the expected contribution that the members of the Board of Directors will make to the further development of the company. After granting, the stock options are unconditional.
Stock option planThe company has a stock option plan for members of the Board of Directors. In the event of full exercise of the option entitlements granted to date the number of issued shares would increase by 0.5%. According to company policy, the option entitlements are not covered by the company’s purchase of its own shares. In case of equity-settlement new shares are issued by the company at the time options are exercised.
Below an overview is provided on the number and movement in stock option entitlements:

162
Off-balance sheet commitmentsThe legal entity is part of the ‘Accell Group N.V.’ fiscal unity, and as such is jointly and severally liable for the tax liability of the fiscal unity as a whole.
In accordance with article 2:403 (1f) of the Dutch Civil Code, the company has accepted joint and several liability for the liabilities arising from acts with legal consequences of the Dutch subsidiaries. Notices to that effect have been filed with the chamber of commerce where the legal entity on whose behalf the notice of liability has been given is registered.
Supervisory BoardA.J. Pasman, chairmanJ. van den Belt, vice-chairmanP.B. ErnstingA. Kuiper
Heerenveen, March 10, 2014
EmployeesAccell Group N.V. has an average of 24 employees in 2013 (2012: 20) of which 2 are employed overseas (2012: 2).Wages and salaries, social security charges and pension contributions amounts to E 3.2 million, E 0.4 million and E 0.4 million in 2013 (2012: E 2.8 million, E 0.4 million and E 0.4 million). In the social security charges an accrual is made for the payment of the Dutch crisis levy amounting to E 0.2 million, which is unexpectedly extended by one year. Accell Group does not consider this crisis levy as remuneration.
Board of DirectorsR.J. Takens, CEOH.H. Sybesma, CFOJ. M. Snijders Blok, COO

ACCELL GROUP NV | ANNUAL REPORT 2013 | FIT FOR A HEALTHY FUTURE FINAN
CIAL
STA
TEME
NTS
163
OTHER INFORMATION
Profit appropriation pursuant to the Articles of Association
Article 25 (partial)
Paragraph 4The Board of Directors, subject to the approval of the Supervisory Board, is authorised to determine which part of the profit shall be allocated to the reserves, after payment of dividends to the holders of both ‘B’ preference shares and ‘F’ preference shares.
Paragraph 5The profit then remaining shall be at the disposal of the general meeting of shareholders for the holders of ordinary shares. Pursuant to a proposal of the Board of Directors that has been approved by the Supervisory Board, the general meeting of shareholders may resolve that all or part of a dividend distribution to the holders of ordinary shares shall be made in shares in the share capital of the company instead of cash.
Dividend proposal
The Board of Directors proposes to pay shareholders a dividend of A 0.55 per share (2012: A 0.75), to be paid in cash or shares at the shareholder’s discretion.
Events after balance sheet date
For events after balance sheet date reference is made to note 27.

164
Independent auditor’s report
To: the General Meeting of Shareholders of Accell Group N.V., Heerenveen, the Netherlands
Report on the financial statements
We have audited the accompanying financial statements 2013 of Accell Group N.V., Heerenveen. The financial statements include the consolidated financial statements and the company financial statements. The consolidated financial statements comprise the consolidated balance sheet as at December 31 2013, consolidated income statement, consolidated statement of comprehensive income, consolidated cash flow statement, consolidated statement of changes in equity for the year then ended and notes, comprising a summary of the significant accounting policies and other explanatory information. The company financial statements comprise the company balance sheet as at December 31 2013, the company profit and loss account for the year then ended and the notes, comprising a summary of the accounting policies and other explanatory information.
Management’s responsibilityManagement is responsible for the preparation and fair presentation of these financial statements in accordance with International Financial Reporting Standards as adopted by the European Union and with Part 9 of Book 2 of the Dutch Civil Code, and for the preparation of the board report in accordance with Part 9 of Book 2 of the Dutch Civil Code. Furthermore management is responsible for such internal control as it determines is necessary to enable the preparation of the financial statements that are free from material misstatement, whether due to fraud or error.
Auditor’s responsibilityOur responsibility is to express an opinion on these financial statements based on our audit. We conducted our audit in accordance with Dutch law, including the Dutch Standards on Auditing. This requires that we comply with ethical requirements and plan and perform the audit to obtain reasonable assurance about whether the financial statements are free from material misstatement. An audit involves performing procedures to obtain audit evidence about the amounts and disclosures in the financial statements. The procedures selected depend on the auditor’s judgment, including the assessment of the risks of material misstatement of the financial statements, whether due to fraud or error.
In making those risk assessments, the auditor considers internal control relevant to the entity’s preparation and fair presentation of the financial statements in order to design audit procedures that are appropriate in the circumstances, but not for the purpose of expressing an opinion on the effectiveness of the entity’s internal control. An audit also includes evaluating the appropriateness of accounting policies used and the reasonableness of accounting estimates made by management, as well as evaluating the overall presentation of the financial statements.
We believe that the audit evidence we have obtained is sufficient and appropriate to provide a basis for our audit opinion.

ACCELL GROUP NV | ANNUAL REPORT 2013 | FIT FOR A HEALTHY FUTURE FINAN
CIAL
STA
TEME
NTS
165
Opinion with respect to the consolidated financial statementsIn our opinion, the consolidated financial statements give a true and fair view of the financial position of Accell Group N.V. as at December 31, 2013 and of its result and its cash flows for the year then ended in accordance with International Financial Reporting Standards as adopted by the European Union and with Part 9 of Book 2 of the Dutch Civil Code.
Opinion with respect to the company financial statementsIn our opinion, the company financial statements give a true and fair view of the financial position of Accell Group N.V. as at December 31, 2013 and of its result for the year then ended in accordance with Part 9 of Book 2 of the Dutch Civil Code.
Report on other legal and regulatory requirements
Pursuant to the legal requirement under Section 2:393 sub 5 at e and f of the Dutch Civil Code, we have no deficiencies to report as a result of our examination whether the board report (page 28 to 81), to the extent we can assess, has been prepared in accordance with Part 9 of Book 2 of this Code, and whether the information as required under Section 2:392 sub 1 at b-h has been annexed. Further we report that the board report, to the extent we can assess, is consistent with the financial statements as required by Section 2:391 sub 4 of the Dutch Civil Code.
Utrecht, March 10, 2014Deloitte Accountants B.V.
Signed by: A.J. Heitink
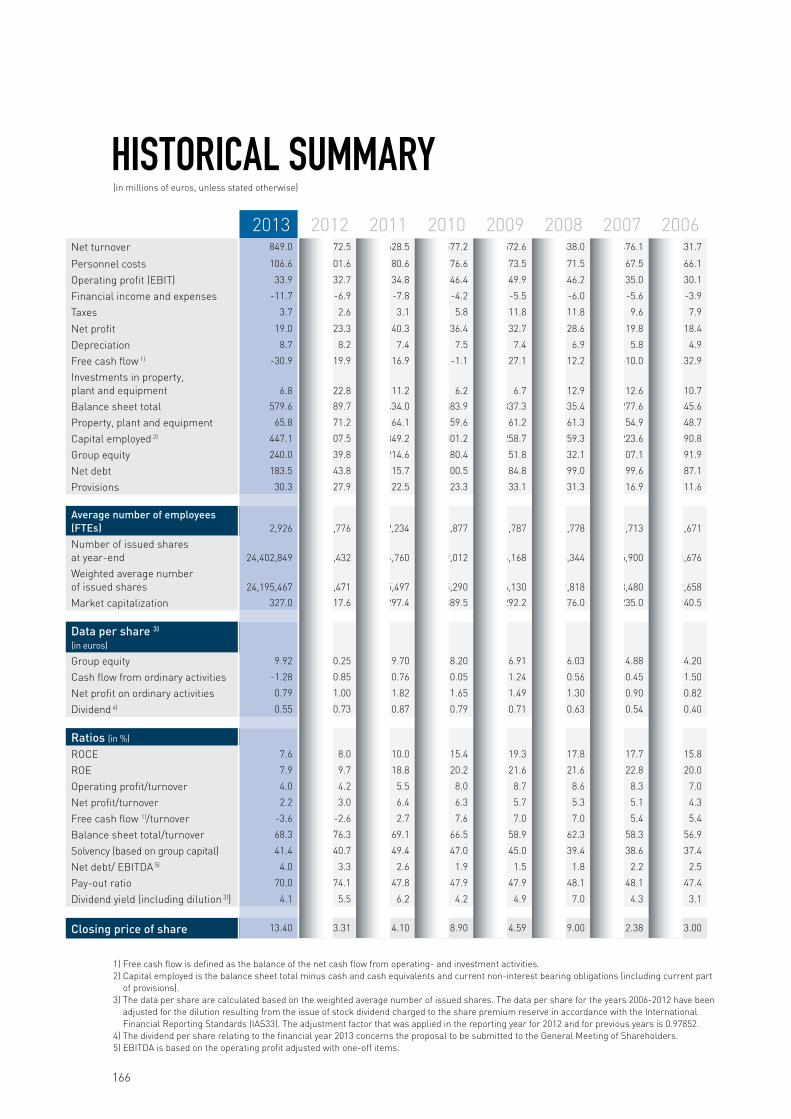
166
2013 2012 2011 2010 2009 2008 2007 2006Net turnover 849.0 772.5 628.5 577.2 572.6 538.0 476.1 431.7
Personnel costs 106.6 101.6 80.6 76.6 73.5 71.5 67.5 66.1
Operating profit (EBIT) 33.9 32.7 34.8 46.4 49.9 46.2 35.0 30.1
Financial income and expenses -11.7 -6.9 -7.8 -4.2 -5.5 -6.0 -5.6 -3.9
Taxes 3.7 2.6 3.1 5.8 11.8 11.8 9.6 7.9
Net profit 19.0 23.3 40.3 36.4 32.7 28.6 19.8 18.4
Depreciation 8.7 8.2 7.4 7.5 7.4 6.9 5.8 4.9
Free cash flow 1) -30.9 -19.9 16.9 -1.1 27.1 12.2 -10.0 -32.9
Investments in property, plant and equipment 6.8 22.8 11.2 6.2 6.7 12.9 12.6 10.7
Balance sheet total 579.6 589.7 434.0 383.9 337.3 335.4 277.6 245.6
Property, plant and equipment 65.8 71.2 64.1 59.6 61.2 61.3 54.9 48.7
Capital employed 2) 447.1 407.5 349.2 301.2 258.7 259.3 223.6 190.8
Group equity 240.0 239.8 214.6 180.4 151.8 132.1 107.1 91.9
Net debt 183.5 143.8 115.7 100.5 84.8 99.0 99.6 87.1
Provisions 30.3 27.9 22.5 23.3 33.1 31.3 16.9 11.6
Average number of employees (FTEs) 2,926 2,776 2,234 1,877 1,787 1,778 1,713 1,671
Number of issued shares at year-end 24,402,849 23,863,432 21,094,760 20,609,012 20,034,168 19,556,344 18,985,900 18,503,676
Weighted average number of issued shares 24,195,467 22,897,471 20,905,497 20,385,290 19,856,130 19,342,818 18,813,480 18,352,658
Market capitalization 327.0 317.6 297.4 389.5 292.2 176.0 235.0 240.5
Data per share 3) (in euros)
Group equity 9.92 10.25 9.70 8.20 6.91 6.03 4.88 4.20
Cash flow from ordinary activities -1.28 -0.85 0.76 -0.05 1.24 0.56 -0.45 -1.50
Net profit on ordinary activities 0.79 1.00 1.82 1.65 1.49 1.30 0.90 0.82
Dividend 4) 0.55 0.73 0.87 0.79 0.71 0.63 0.54 0.40
Ratios (in %)
ROCE 7.6 8.0 10.0 15.4 19.3 17.8 17.7 15.8
ROE 7.9 9.7 18.8 20.2 21.6 21.6 22.8 20.0
Operating profit/turnover 4.0 4.2 5.5 8.0 8.7 8.6 8.3 7.0
Net profit/turnover 2.2 3.0 6.4 6.3 5.7 5.3 5.1 4.3
Free cash flow 1)/turnover -3.6 -2.6 2.7 7.6 7.0 7.0 5.4 5.4
Balance sheet total/turnover 68.3 76.3 69.1 66.5 58.9 62.3 58.3 56.9
Solvency (based on group capital) 41.4 40.7 49.4 47.0 45.0 39.4 38.6 37.4
Net debt/ EBITDA 5) 4.0 3.3 2.6 1.9 1.5 1.8 2.2 2.5
Pay-out ratio 70.0 74.1 47.8 47.9 47.9 48.1 48.1 47.4
Dividend yield (including dilution 3)) 4.1 5.5 6.2 4.2 4.9 7.0 4.3 3.1
Closing price of share 13.40 13.31 14.10 18.90 14.59 9.00 12.38 13.00
HISTORICAL SUMMARY
1) Free cash flow is defined as the balance of the net cash flow from operating- and investment activities.2) Capital employed is the balance sheet total minus cash and cash equivalents and current non-interest bearing obligations (including current part
of provisions). 3) The data per share are calculated based on the weighted average number of issued shares. The data per share for the years 2006-2012 have been
adjusted for the dilution resulting from the issue of stock dividend charged to the share premium reserve in accordance with the International Financial Reporting Standards (IAS33). The adjustment factor that was applied in the reporting year for 2012 and for previous years is 0.97852.
4) The dividend per share relating to the financial year 2013 concerns the proposal to be submitted to the General Meeting of Shareholders.5) EBITDA is based on the operating profit adjusted with one-off items.
(in millions of euros, unless stated otherwise)


168
Accell Group N.V.P.O.Box 435, 8440 AKIndustrieweg 4, 8444 ARHeerenveen, The NetherlandsT +31 (0)513 638 703F +31 (0)513 638 709www.accell-group.com
Juncker Bike Parts B.V.Fokkerstraat 25, 3905 KVVeenendaal, The NetherlandsT +31 (0)318 553 030F +31 (0)318 553 211www.juncker.nl
Sparta B.V.P.O.Box 5, 7300 AAWilmersdorf 37, 7327 ADApeldoorn, The NetherlandsT +31 (0)55 357 87 00F +31 (0)55 357 87 05www.sparta.nl
Brasseur S.A.Rue des Steppes 13 B-4000Liège, BelgiumT +32 4 2 28 72 60F +32 4 2 27 40 78www.brasseur-bicycles.com
Batavus B.V.P.O.Box 515, 8440 AMIndustrieweg 4, 8444 ARHeerenveen, The NetherlandsT +31 (0)513 638 999F +31 (0)513 638 262www.batavus.com
Koga B.V.P.O.Box 167, 8440 ADTinweg 9, 8445 PDHeerenveen, The NetherlandsT +31 (0)513 630 111F +31 (0)513 633 289www.koga.com
Tunturi Fitness B.V.P.O.Box 60001, 1320 AAPurmerweg 1, 1311 XEAlmere, The NetherlandsT +31 (0) 36 539 7102F +31 (0) 36 539 7102www.tunturi.com
Accell Germany GmbHMax-Planck-Straße 4D-97526Sennfeld/Schweinfurt, GermanyT +49 (0)9721 67516-0F +49 (0)9721 67516-99
Winora-Staiger GmbH Max-Planck-Straße 6D-97526Sennfeld, GermanyT +49 (0)9721 6594-0F +49 (0)9721 6594-45www.winora-group.de
Ghost-Bikes GmbHAn der Tongrube 3D-95652Waldsassen, GermanyT +49 (0)9632 9255-0F +49 (0)9632 9255-16www.ghost-bikes.com
ADDRESSES

ACCELL GROUP | JAARVERSLAG 2013 | FIT FOR A HEALTHY FUTURE 169
Tunturi-Hellberg Oy LtdP.O.Box 750 Varusmestarintie 26FIN-20361Turku, FinlandT +358 (0)10 27 33 200F +358 (0)10 27 33 202www.tunturi.com
Seattle Bike Supply Inc.7620 S. 192nd StreetKent, WA 98032 USAT +1 425 251 1516F +1 425 251 52 79www.seattlebikesupply.com
E. Wiener Bike Parts GmbHMax-Planck-Straße 8D-97526Sennfeld, GermanyT +49 (0)9721 6501-0F +49 (0)9721 6501-60www.bike-parts.de
Cycles Lapierre S.A.S.P.O.Box 173Rue Edmond Voisenet, 21005Dijon Cédex, FranceT +33 3 80 525 186F +33 3 80 520 851www.cycles-lapierre.com
Vartex ABBatterivägen 14SE - 432 32Varberg, SwedenT +46 (0) 340 64 60 00F +46 (0) 340 61 11 90www.vartex.se
Accell Bisiklet A.S.Oranize Sanayi Bolgesi 3. kisimAhmet Tütüncüoglu Caddesi No 1Manisa, TurkeyT +90 (0) 236 213 00 45F +90 (0) 236 213 00 50www.accellbisiklet.com.tr
Currie Tech Corp.3850A Royal AvenueSimi Valley, CA 93063USAT +1 805 915 49 00F +1 805 915 43 21www.currietech.com Raleigh UK LtdChurch Street, EastwoodNottingham, NG16 3HTGreat BritainT +44 1773 532 600 F +44 1773 532 601www.raleigh.co.uk Raleigh America Inc.6004 South 190th Street, Suite 101Kent, WA 98032USAT +1 253 395 1100F +1 253 872 9490www.raleighusa.com
Van Nicholas B.V.Energieweg 23, 3281 NH Numansdorp, The NetherlandsT +31 (0)186 65 77 18 F +31 (0)186 65 77 19www.vannicholas.com


Colophon
Text: Accell Group - Heerenveen - The NetherlandsCitigate First Financial - Amsterdam - The Netherlands
Design, lay-out and co-ordination: Boerma Reclame - Gouda - The Netherlands
Production and distribution: Schefferdrukkerij - Dordrecht - The Netherlands
©Accell Group N.V., Heerenveen, The Netherlands, 2014

FIT
ANNUAL REPORT 2013
FOR A
HEALTHYFUTURE
ACCELL GROUP NV | ANNUAL REPORT 2013
Accell Group N.V.
P.O. Box 435, 8440 AKIndustrieweg 4, 8444 ARHeerenveen, The Netherlands
T +31 (0)513 638 703F +31 (0)513 638 709
www.accell-group.com