Embed Size (px)
Citation preview
2
This report has been funded by Sea Fish Industry Authority in partnership with Milford Haven Port Authority to evaluate theseafood supply chain in Wales to inform decision making with regard to future support for the sector in Wales.

3
Contents
1. Management Summary
2. Key Highlights of the Seafood Supply Chain from Study Findings
3. Introduction3.1 Scope3.2 Aims3.3 Approach3.4 Addressing Data Caveats3.5 Mapping the Supply Chain
4. In-Depth Interview Findings
5. Catching and Aquaculture Sector Data5.1 Catching Sector Statistics5.2 Aquaculture Sector Statistics5.3 Gathering Sector Statistics5.4 Sector Summary
6. Seafood Processing and Distribution in Wales6.1 Key Segments in the Onshore Sector6.2 Onshore Business Characteristics6.3 Product Profiles6.4 Product Sales and Markets6.5 Distribution6.6 Industry Outlook
7. Supply Chain Overview
8. Conclusions
9. Recommendations
10. Appendices
4
1. Management Summary
As a key sector identified within the Welsh Government’s Food and Drink Action Plan, the fisheries sector in Wales has been a longstanding contributor to both the maritime and rural economy.
Distinct from other food sectors, the fisheries sector in Wales is made up of a high performing shellfish aquaculture sector and acatching sector characterized by its make up of predominantly under 10m vessels targeting a variety of shellfish species.
As a holistic supply chain study, CamNesa has sought to assess available secondary research and undertake primary researchwith key industry stakeholders by interview with owner managers of businesses operating in the onshore supply chain and asample of fishers across Wales within the catching sector.
Throughout the exercise we have been careful to ensure anonymity of respondents to the survey and have designed the primaryresearch to ensure that information with regard to commercial activities is kept at industry level.
The findings of the study have led to a strong response from the onshore handling and processing sector having providedresponses indicating positivity in this part of the sector looking to the future with business growth and expanding markets.
The handling and processing sector is dominated by micro and small businesses, with just under 60% being well established andtrading for 10 years or more. We have identified that the sector imports product for processing as well as sourcing raw materialwithin Wales. We have also identified large non-SME’s importing fisheries products and adding value as well as wholesaling.
Whilst we have established the number of operators in the onshore sector at 64, we are aware of others operating involved in thehandling of fisheries products who either could not or did not wish to be involved in the study.
We have reported our recommendations at the end of the report for industry to consider how they wish the sector be supported byrelevant agencies. Supply chain co-operation and development is critical to establishing a market position for Welsh fisheriesproducts, but this is set against a production sector feeling under pressure from an increasing regulatory burden and pressured byconflicting interests throughout the marine sector.
5
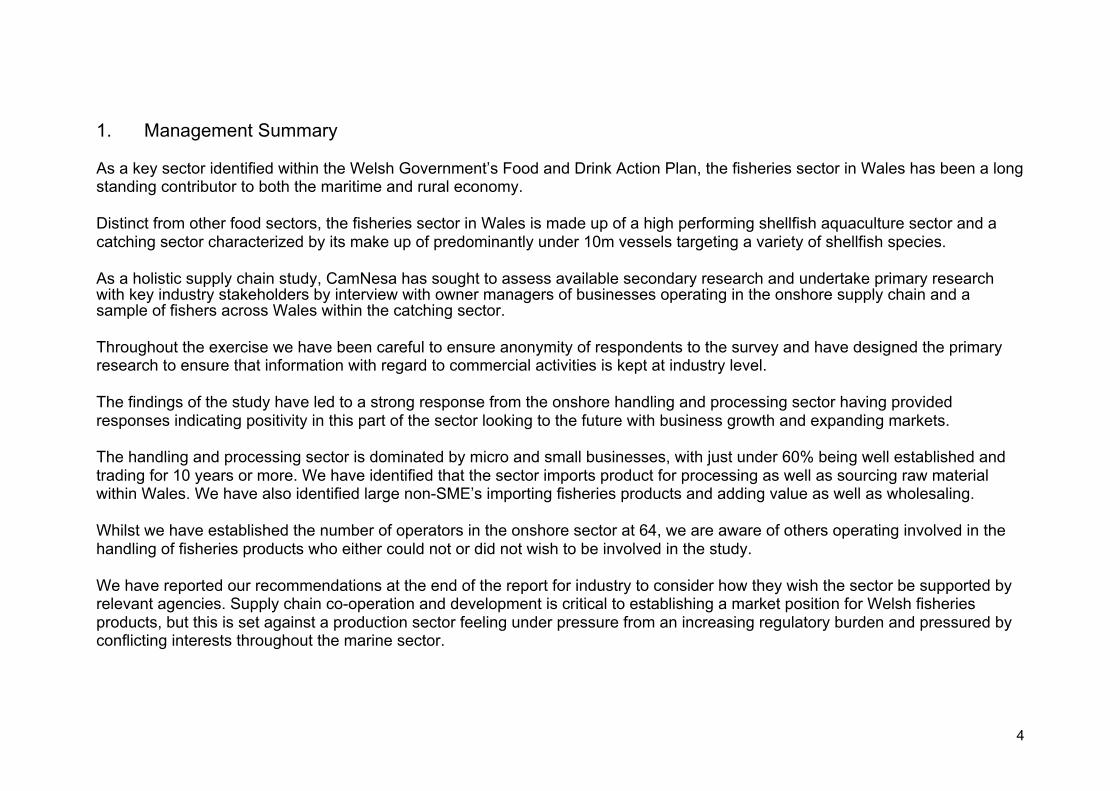
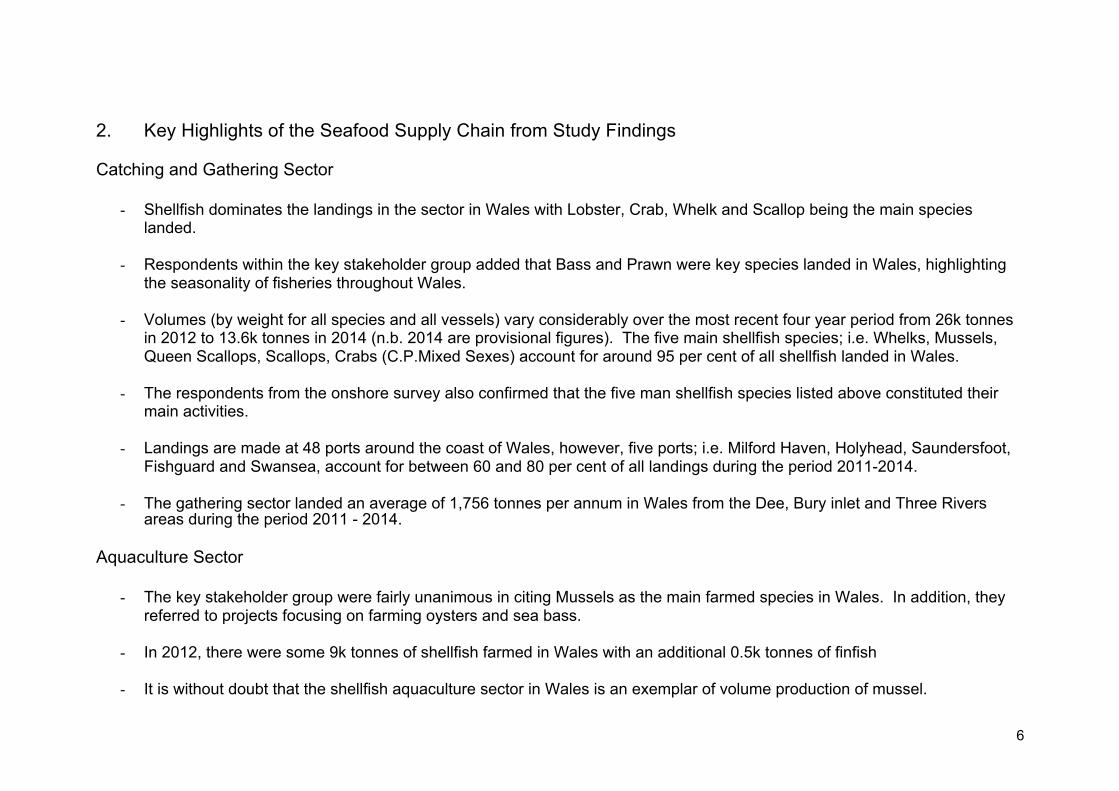
Linkages and organisation within the production, processing and handling sectors will be vital to position Welsh productsdistinctively within the market place and we hope that this study will provide the baseline foundations to build upon this. Theschematic below provides a picture of our study findings in terms of interactions within the sector.
Figure 1
Produc�on First Sale
Welsh
Non Welsh
Wild capture
Aquaculture
Export
Domes�c
Primary Processor
Secondary Processor
Retailers / Fishmongers
Shared Transport
Couriers
Own Transport
Other
Distributors
Merchants
HandlingProcessors
Wholesalers
Retail(Supermarket)
Retail(Independent)
Hospitality
Public
Export
Catching & Aquaculture Sector Onshore Sector
6
2. Key Highlights of the Seafood Supply Chain from Study Findings
Catching and Gathering Sector
- Shellfish dominates the landings in the sector in Wales with Lobster, Crab, Whelk and Scallop being the main specieslanded.
- Respondents within the key stakeholder group added that Bass and Prawn were key species landed in Wales, highlightingthe seasonality of fisheries throughout Wales.
- Volumes (by weight for all species and all vessels) vary considerably over the most recent four year period from 26k tonnesin 2012 to 13.6k tonnes in 2014 (n.b. 2014 are provisional figures). The five main shellfish species; i.e. Whelks, Mussels,Queen Scallops, Scallops, Crabs (C.P.Mixed Sexes) account for around 95 per cent of all shellfish landed in Wales.
- The respondents from the onshore survey also confirmed that the five man shellfish species listed above constituted theirmain activities.
- Landings are made at 48 ports around the coast of Wales, however, five ports; i.e. Milford Haven, Holyhead, Saundersfoot,Fishguard and Swansea, account for between 60 and 80 per cent of all landings during the period 2011-2014.
- The gathering sector landed an average of 1,756 tonnes per annum in Wales from the Dee, Bury inlet and Three Riversareas during the period 2011 - 2014.
Aquaculture Sector
- The key stakeholder group were fairly unanimous in citing Mussels as the main farmed species in Wales. In addition, theyreferred to projects focusing on farming oysters and sea bass.
- In 2012, there were some 9k tonnes of shellfish farmed in Wales with an additional 0.5k tonnes of finfish
- It is without doubt that the shellfish aquaculture sector in Wales is an exemplar of volume production of mussel.
7
The Seafood Processing and Distribution Sector
With regard to the on-shore sector, our original, consolidated list stood at 101 businesses. Following our census survey weestimate there are 64 active businesses in the on-shore supply chain in Wales
Our survey obtained responses from 55 of these 64 businesses and below we can summarise their size, location and activity:
Size: 83.5 per cent 10 or fewer employees
Turnover band: 67 per cent less than or equal to £0.5m pa
Location: 47 per cent South West Wales, 36 per cent North Wales, 13 per cent Mid and South East Wales
Activity: 20 per cent primary processing, 5 per cent secondary processing, 11 per cent mixed processing, 20 per centmerchant or agent, 24 per cent retailing
8
3. Introduction
The purpose of the study has been to provide a holistic review of the fisheries, aquaculture and onshore seafood processing andhandling supply chain in Wales to gain a better understanding of the position of the sector. It is hoped that the results of this reportwill inform future strategy with regard to supporting mechanisms by Government, Sea Fish and other Authorities.
3.1 Scope
The scope of the study brought together the catching, gathering and aquaculture sector, the onshore processing sector in Walesand the onward supply chain. The key outcomes for the project were identified as being:
• A greater understanding of fish and shellfish landings in Wales (including information on species, volumes, where landedand seasonality).
• Identification of the end markets (domestic and international) and distribution routes for fish and shellfish landed in Wales. Toprovide timings/frequency of distribution where possible.
• Information on the total number of businesses involved in the seafood supply chain in Wales, broken down by size, locationand activity. To provide trade data (e.g. volumes, turnover) where possible.
• Practical recommendations on how to ensure effective, on-going collection of relevant data for monitoring sector growth.
3.2 Aims
• To confirm the numbers of businesses operating within the Welsh supply chain
• To establish the level of added value activity taking place in Wales
• Identify market channels and destinations of Welsh seafood products
9
• Via interview with respondents, identify perceived strengths and weaknesses within the supply chain
• Identify the extent to which exports play as a market channel
• To identify the level of activity geographically and spatially map data accordingly
3.3 Approach
The project approach was to consolidate and where required to triangulate data from a number of available sources.
The core methodology for the study was a direct interview process with owner managers of the onshore processing and handlingbusinesses within the sector in Wales.
These interviews were conducted following a detailed research exercise to establish the number of operators in the onshore sectorin Wales, not only from Government held data, but via industry held information and local authorities.
Within the catching, gathering and aquaculture sector we have used data captured from the main Government bodies involved inreceiving data from the sector most notably MMO, CEFAS and Seafish.
The overall approach to the study has been to use both qualitative and quantitative primary research in combination withsecondary research into existing data sources, particularly with reference to the catching, gathering and aquaculture sub-sectors.
This report is structured to emulate the flow of the supply chain, starting with the production and primary product sources of thecatching, gathering and aquaculture sector prior to moving to the onshore handling and processing sector and distribution to finalmarket outlets for consumer purchase.
10
3.4 Addressing Data Caveats
Unlike other food sectors, the fishing sector, particularly in the case of Wales, is diverse in its sources of data. Flows of productthroughout the supply chain including landings from foreign registered vessels as well as the indigenous fleet results in delay in thereturn of information for interpretation.
In comparison to other parts of the UK, in Wales, we do not have traditional auction sales of product at ports where prices achievedfor landed catch are available in effectively real time.
To gain a greater understanding of the supply chain, a number of key stakeholder interviews were undertaken at the beginning ofthe study. These findings supported the methodologies put forward to Sea Fish at the inception stage of the study. The responsesfrom the stakeholders are summarized in the following section of the document.
To address anomalies in catching data, a benchmarking exercise has been undertaken with fishers throughout Wales to assessvessel performance within the fleet, species variation, destination of product and volumes.
To address concerns with regard to confidentiality, data has needed to be anonymised and guarantees of confidentiality provided torespondents of the study. Due to the fact the sector is small in Wales, those operating within it are easily identified, and care hasbeen taken within this document to ensure that the commercial data of individual businesses is not highlighted.
To address concerns with regard to confidentiality, data collated has been at industry level and not individual business level. It hasbeen more focused on the supply chain and not on the performance or capacities of individual businesses.
Out of 64 companies identified in the onshore processing and handling sector,55 gave full interviews to CamNesa researchers. Notall were content in responding to interview for a number of reasons, particularly time constraints and worries with regardconfidentiality.
11
3.5 Mapping the Supply Chain
Mapping the sector is a difficult task with many variables influencing the sporadic nature of the industry
The process of fishing within the catching sector is a form of food production that is difficult to assess due to external factorsincluding weather, tidal conditions, Government interventions with regard to specific fisheries and the nature of movement andcycles of seasonal shell fisheries within Welsh waters.
The industry is complex in terms of regulation, enforcement and the breadth of species landed and farmed within Wales. Thedominance of shellfish and small vessels under 10m characterizes the sector alongside well established mussel aquacultureproduction.
Volumes can differ greatly between years and geographical areas of coastline in Wales. Quality of shellfish can also be an issuedepending on source affecting the ability of the supply chain to pass this product onto the end consumer.
Unlike other sectors where very large processors exist and dominate the supply chain in lamb, beef and dairy for example, theonshore processing and supply chain within Wales is made up of micro businesses processing at a relatively small scaleprocessing in comparison.
The sector is very sensitive with regard to the provision of data and where processing takes place we would not expect businessesto provide information that may affect their trading position. With this in mind, the mapping of the supply chain has taken a generalformat.
Whilst this is the case, we have presented two process flows of the Welsh seafood supply chain of both the catching andaquaculture sector and the onshore handling and processing sector at appendix 1 of the document with explanatory notes.
12
4. In Depth Interviews with Key Industry Stakeholders
To commence the primary research, we undertook a series of in-depth interviews with key individuals with interests within theWelsh fisheries sector. This was to both identify and verify the key sources of information for the sector and gain a generalunderstanding of issues within the supply chain.
As a precursor to the detailed interviews undertaken with the onshore handling and processing sector, structured interviews wereconducted with key stakeholders across the sector to establish views with regard the current trends and attitudes within the sector.
Questions were orientated around the supply of raw material into the sector, market trends, the destination of product andperceived strength and weaknesses in the supply chain.
Identification of major fish and shellfish species landed in Wales
• Whilst respondents agreed that Whelk, Lobster, Crab, Prawn and Bass were the major species landed in Wales, they addeda range of other species (including fin fish) caught around Wales at different times
• Some respondents cited seasonality as a factor (e.g. lobster and spider crab in the summer and prawns and scallop in thewinter) as an influence on which species are caught and others referred to changes from year to year (driven by climatechange, etc).
Have there been changes regarding species landed over recent years?
• Respondents cited a range of forces affecting changes in species landed including environmental factors and legislation.
13
• They report changes in the supply chain (especially the merchants element) and the number of active fishermen (a functionof the economic viability of fishing) engaged in the sector at any one time
What are the major fish and shellfish species farmed in Wales?
• The respondents were fairly unanimous in citing Mussels as the main farmed species in Wales. In addition, respondentsreferred to projects focusing on farming oysters and sea bass (now defunct).
• Respondents had no strong view regarding this question and pointed to the fact that aquaculture was a relatively small partof the Welsh seafood sector. However, some respondents pointed to future opportunities in this sector
Can you define the fisheries supply chain in Wales?
• Excluding the foreign vessels, the majority of respondents see the supply chain for Welsh fishermen as dominated by two orthree main Merchants
• This is a function of the physical location of the Welsh fishing industry (i.e. on the periphery of both the UK and obviouslyEurope) and the desire of Welsh fishermen to focus on fishing and not on the commercial aspects of their business.
What are the main end user segments for Welsh fish/shellfish?
• The majority of respondents cited European markets (especially the hospitality sector) as the main end user segments
• One respondent made the point that catches from Wales are really valued in Europe but our fishermen don’t see the return(because of the supply chain).
• Respondents went on to estimate that the majority of the Welsh catch (around 75-80%) is exported.
14
Who are the main merchants in Wales?
• Respondents were able to cite specific businesses, such as Castle Bay Sea Foods, The Lobster Pot, Syren Seafoods,Aquamar, A&M Fleetwood, WM Shellfish (Holyhead), Mermaid Seafoods (Llandudno), Quay Fresh (New Quay), Falfish(Redruth, Cornwall), Coombes Seafood (Cornwall), and Quay Shellfish.
Who are the main processors in Wales?
• The overriding view was that currently there was very little processing capacity available in Wales
• One respondent pointed out this was a function of the lack of consumer demand for shellfish in Wales
• In addition, it was stated that the infrastructure for processing in Wales had increased and this would lead to furtherprocessing in the short term
Who are the main secondary processors in Wales?
• Various respondents were able to cite (the same) small number of secondary processors however, the general opinion wasthat there was very little secondary processing in Wales.
What are the main strengths of the seafood supply chain in Wales?
• Whilst respondents saw the quality of the product as being a strength, there did seem to be a degree of pessimism about thecurrent state of the sector.
15
What are the main weaknesses of the seafood supply chain in Wales?
• A range of themes was offered, summed up by this quotation:
‘.. [an] increasing burden of legislation, illegal fishing (that isn’t controlled), bad publicity and virtual hostility fromgovernment.’
• In addition, respondents cited insufficient local processing capacity and a lack of an effective market mechanism to providefishermen with a living wage upon which they could build a future for the industry in Wales.
The initial interviews with key industry stakeholders provided us with an understanding of their perceptions and knowledge of thesupply chain and the known sources of data in relation to the industry.
The following sections provides a detailed breakdown of industry information relating to this sector in Wales and following that, theresponses from those interviewed in the onshore product handling and processing sector.
16
5. The Catching, Gathering and Aquaculture Sector in Wales
This first section of the report will provide general statistics in relation to the three main primary production sectors for seafoodproducts in Wales, hand gathering, catching and aquaculture. Information has been collated from secondary research, some ofwhich has been provided on a provisional basis due to factors influencing the flow of information within the supply chain.
The general industry statistics will be followed by a review of the most recent figures available on landings in Wales. These figuresare provided to show a breakdown of UK registered vessel landings and also landings by foreign vessels into Welsh ports. Thesefigures are then broken down into weight and value for the key species sub categories of demersal and shellfish. Pelagic speciesare not included in the breakdown as the volume and value landed into Wales was insignificant.
We have ranked the top sub species categories of shellfish and demersal that form the main value and volume species into Welshports.
This is followed by an overview of the aquaculture sector in Wales including its performance in comparison to other countries withinthe UK and also information on the hand gathering sub sector.
17
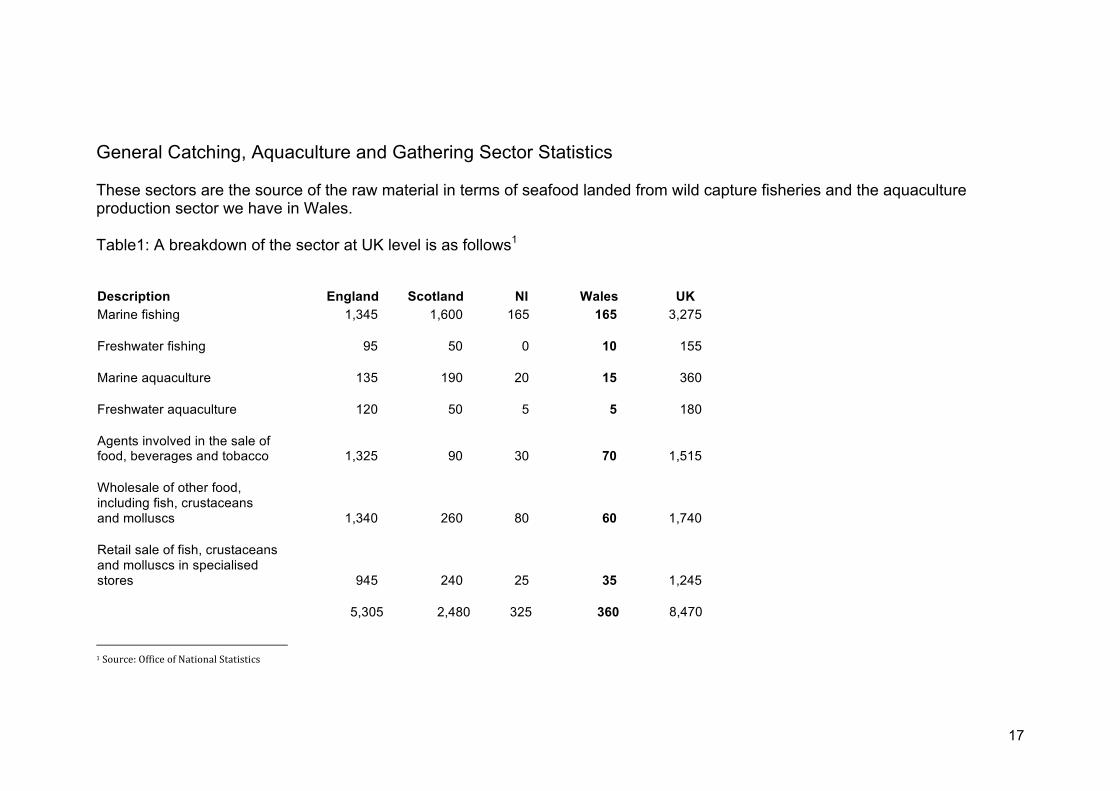
General Catching, Aquaculture and Gathering Sector Statistics
These sectors are the source of the raw material in terms of seafood landed from wild capture fisheries and the aquacultureproduction sector we have in Wales.
Table1: A breakdown of the sector at UK level is as follows1
Description England Scotland NI Wales UKMarine fishing 1,345 1,600 165 165 3,275
Freshwater fishing 95 50 0 10 155
Marine aquaculture 135 190 20 15 360
Freshwater aquaculture 120 50 5 5 180
Agents involved in the sale offood, beverages and tobacco 1,325 90 30 70 1,515
Wholesale of other food,including fish, crustaceansand molluscs 1,340 260 80 60 1,740
Retail sale of fish, crustaceansand molluscs in specialisedstores 945 240 25 35 1,245
5,305 2,480 325 360 8,470
1 Source: Office of National Statistics
18
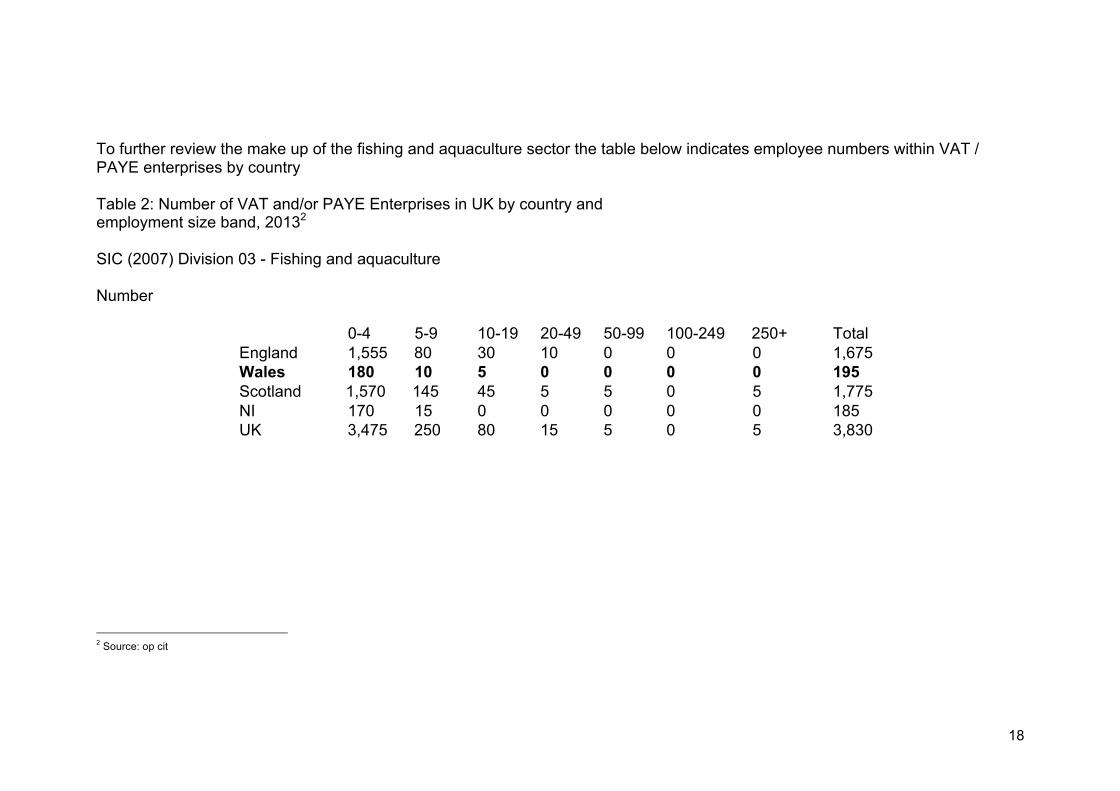
To further review the make up of the fishing and aquaculture sector the table below indicates employee numbers within VAT /PAYE enterprises by country
Table 2: Number of VAT and/or PAYE Enterprises in UK by country andemployment size band, 20132
SIC (2007) Division 03 - Fishing and aquaculture
Number
0-4 5-9 10-19 20-49 50-99 100-249 250+ TotalEngland 1,555 80 30 10 0 0 0 1,675Wales 180 10 5 0 0 0 0 195Scotland 1,570 145 45 5 5 0 5 1,775NI 170 15 0 0 0 0 0 185UK 3,475 250 80 15 5 0 5 3,830
2 Source: op cit
19
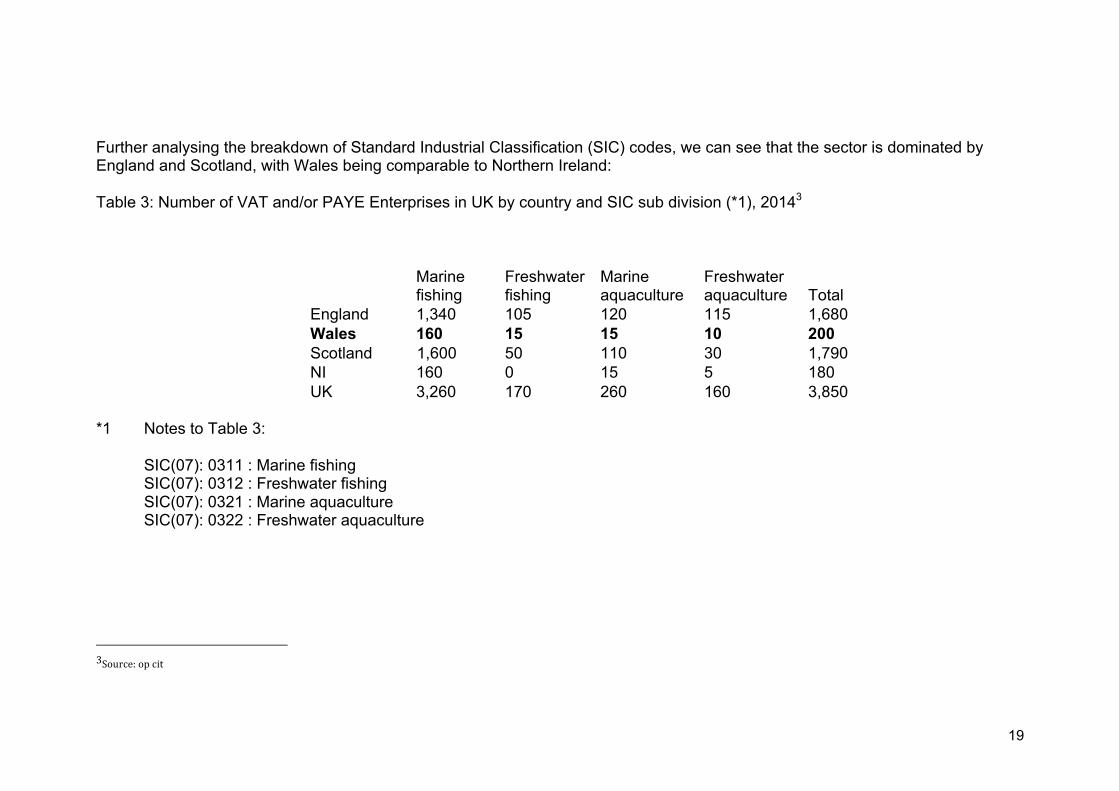
Further analysing the breakdown of Standard Industrial Classification (SIC) codes, we can see that the sector is dominated byEngland and Scotland, with Wales being comparable to Northern Ireland:
Table 3: Number of VAT and/or PAYE Enterprises in UK by country and SIC sub division (*1), 20143
Marinefishing
Freshwaterfishing
Marineaquaculture
Freshwateraquaculture Total
England 1,340 105 120 115 1,680Wales 160 15 15 10 200Scotland 1,600 50 110 30 1,790NI 160 0 15 5 180UK 3,260 170 260 160 3,850
*1 Notes to Table 3:
SIC(07): 0311 : Marine fishingSIC(07): 0312 : Freshwater fishingSIC(07): 0321 : Marine aquacultureSIC(07): 0322 : Freshwater aquaculture
3Source: op cit
20
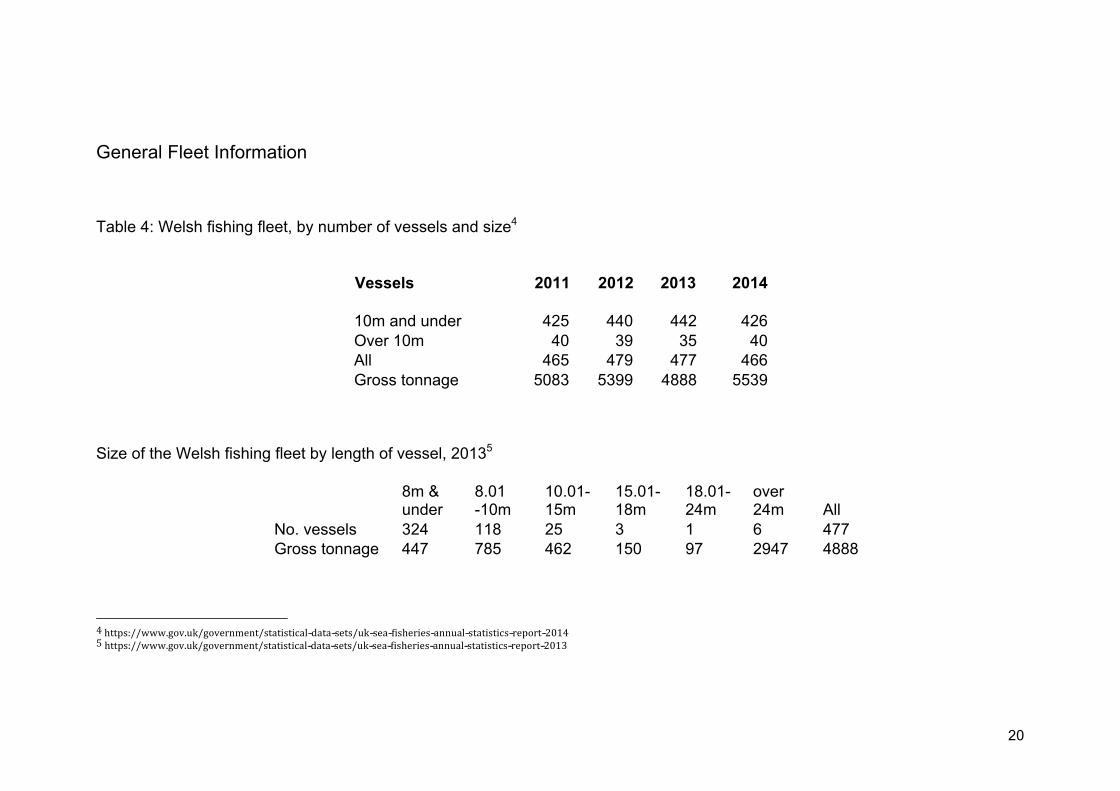
General Fleet Information
Table 4: Welsh fishing fleet, by number of vessels and size4
Vessels 2011 2012 2013 2014
10m and under 425 440 442 426Over 10m 40 39 35 40All 465 479 477 466Gross tonnage 5083 5399 4888 5539
Size of the Welsh fishing fleet by length of vessel, 20135
8m &under
8.01-10m
10.01-15m
15.01-18m
18.01-24m
over24m All
No. vessels 324 118 25 3 1 6 477Gross tonnage 447 785 462 150 97 2947 4888
4 https://www.gov.uk/government/statistical--data--sets/uk--sea--fisheries--annual--statistics--report--20145 https://www.gov.uk/government/statistical--data--sets/uk--sea--fisheries--annual--statistics--report--2013
21
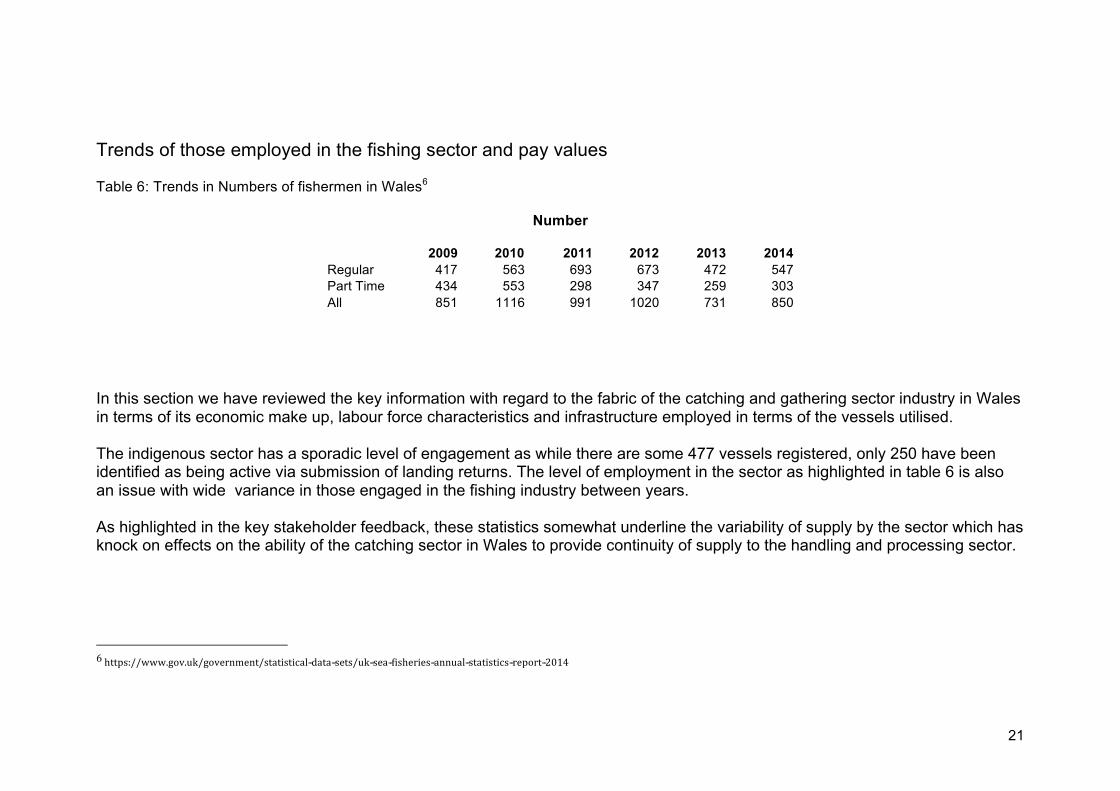
Trends of those employed in the fishing sector and pay values
Table 6: Trends in Numbers of fishermen in Wales6
Number
2009 2010 2011 2012 2013 2014Regular 417 563 693 673 472 547Part Time 434 553 298 347 259 303All 851 1116 991 1020 731 850
In this section we have reviewed the key information with regard to the fabric of the catching and gathering sector industry in Walesin terms of its economic make up, labour force characteristics and infrastructure employed in terms of the vessels utilised.
The indigenous sector has a sporadic level of engagement as while there are some 477 vessels registered, only 250 have beenidentified as being active via submission of landing returns. The level of employment in the sector as highlighted in table 6 is alsoan issue with wide variance in those engaged in the fishing industry between years.
As highlighted in the key stakeholder feedback, these statistics somewhat underline the variability of supply by the sector which hasknock on effects on the ability of the catching sector in Wales to provide continuity of supply to the handling and processing sector.
6 https://www.gov.uk/government/statistical--data--sets/uk--sea--fisheries--annual--statistics--report--2014
22
5.1 Catching Sector Statistics
Catching Sector Overview
The catching sector segment of the supply chain in Wales is made up pre-dominantly of vessels under 10 metres in length.Operators working within what is termed as wild capture fisheries where a number of different methods are used to fish for bothshellfish and fin fish species.
The most common method of fishing for shellfish species such as crab and lobster in Wales is through the use of low impact, staticfishing gear such as pots and static tangle nets for species such as spider crab. The indigenous Welsh fleet is often referred to asthe inshore fleet by its very nature of fishing the waters close to Wales’s coastline.
Alongside the Welsh fleet, Welsh ports provide landings facilities for other vessels from within the UK and foreign registeredvessels. Within the landings section of this document, the impact of landings of these vessels and the diversity of species landedinto Welsh ports will be outlined. From non-Welsh vessels, shellfish landings with the exception of scallop are minimal, with themajority of landings of value being Monks, Anglers and Sole.
23
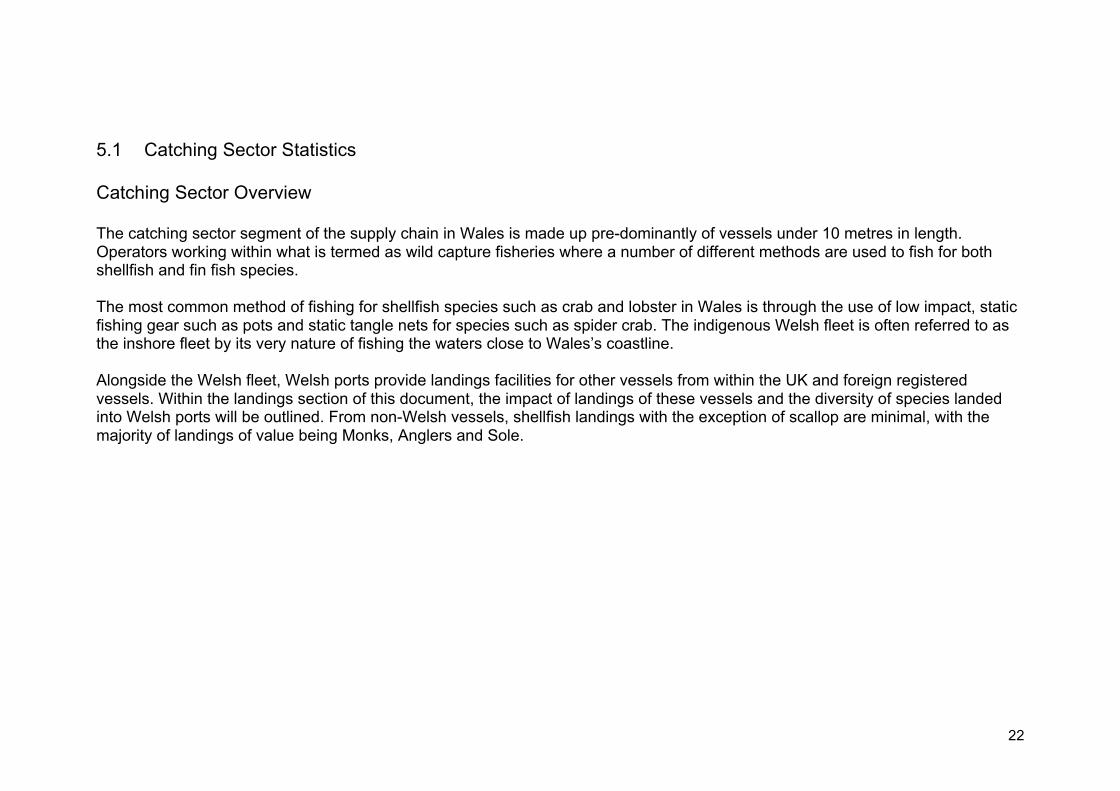
Table 7: Landings (*1) into all Welsh ports by weight & value, 2011 – 20147
Weight (kg) & Value (£)
2011 2012 2013 2014Weight (kg) 20,300,544 26,647,232 19,444,541 13,650,832Value (£) 30,443,775 35,532,879 27,021,997 13,799,417
7 Source: Marine Management Organisation (MMO), 2015
0
10000000
20000000
30000000
40000000
2011 2012 2013 2014
Weight (kg) Value (£)
24
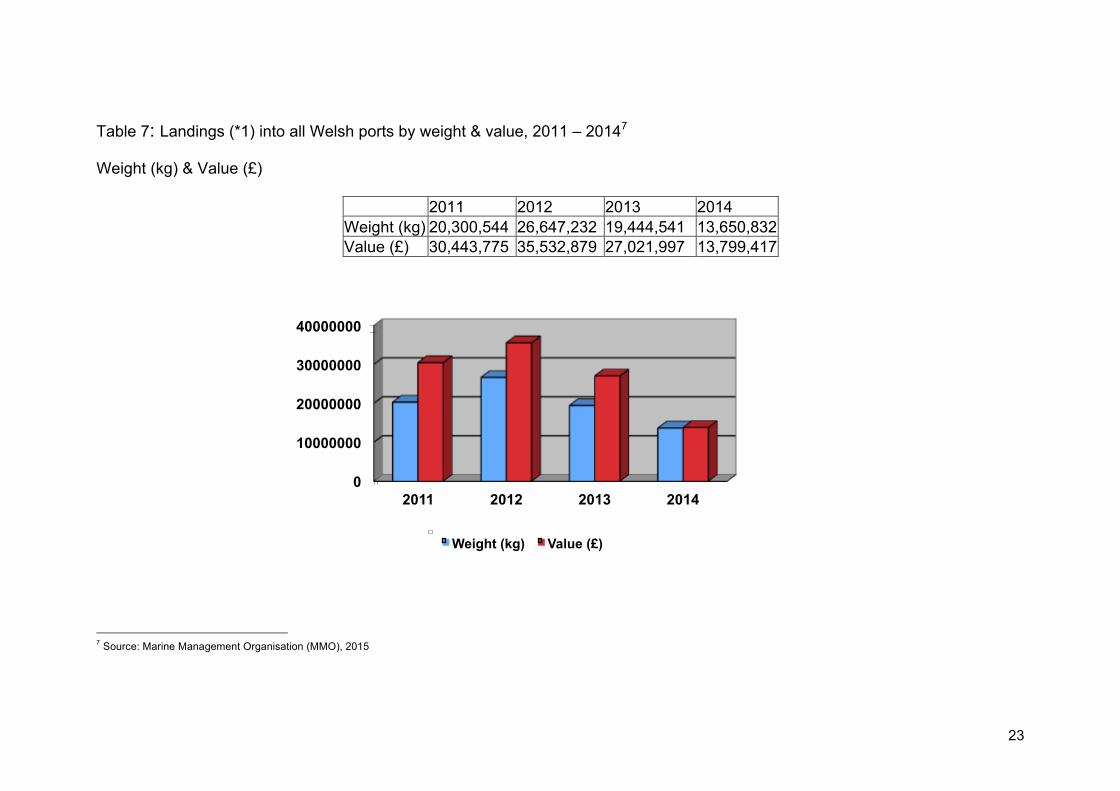
Table 8: Landings (*1) into all Welsh ports by weight, 2011 – 2014
Weight (kg)
2011 2012 2013 2014UK vessels 16,328,125 21,500,283 14,741,948 10,276,784Foreign vessels 3,972,419 5,146,949 4,702,593 3,374,048All 20,300,544 26,647,232 19,444,541 13,650,832
0
5
10
15
20
25
30
2011 2012 2013 2014
UK Vessels
Foreign Vessels
All
Kg
25
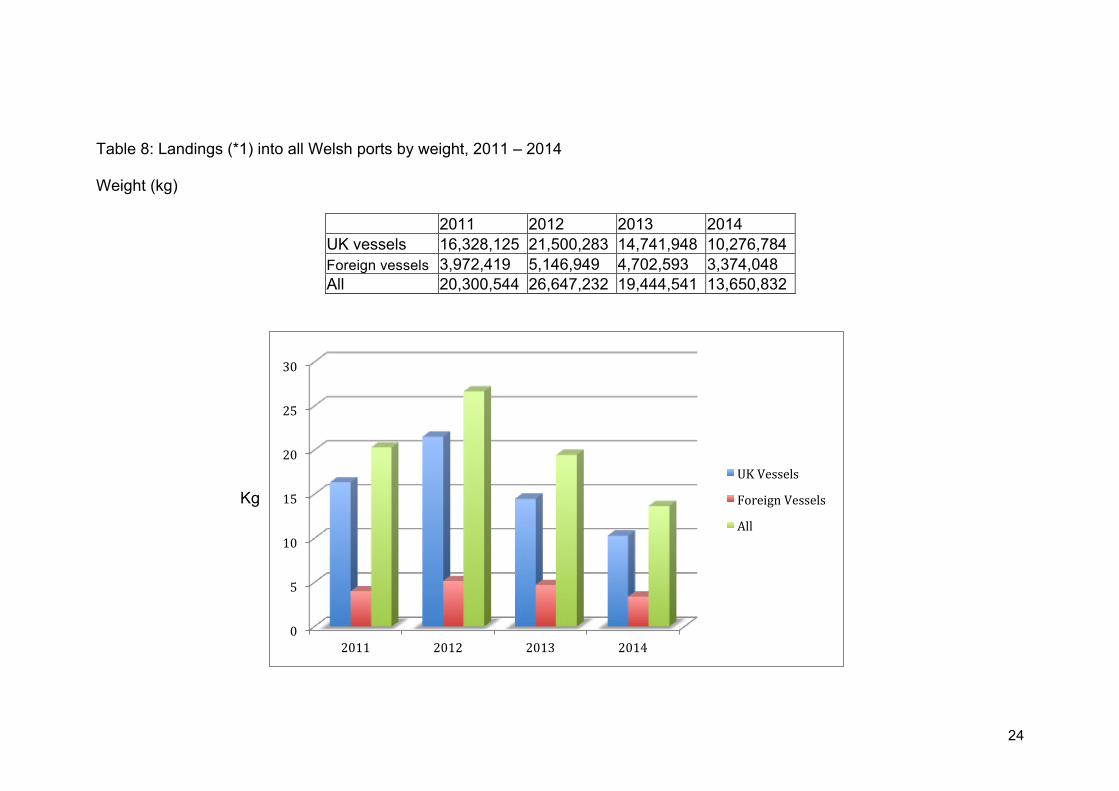
Table 9: Landings (*1) into all Welsh ports by value, 2011 – 2014
Value (£)
*This is an extrapolation and we must advise the reader that there are a number of variables that would influence the actual value.
2011 2012 2013 2014UK vessels £16,091,235 £20,544,495 £16,640,684 £13,420,439Foreign vessels £14,352,540 £14,988,383 £10,381,313 £7,448,593*
All £30,443,775 £35,532,879 £27,021,997 £13,799,417
0
5
10
15
20
25
30
35
40
2011 2012 2013 2014
Uk Vessels
Foreign Vessels
All
£
26
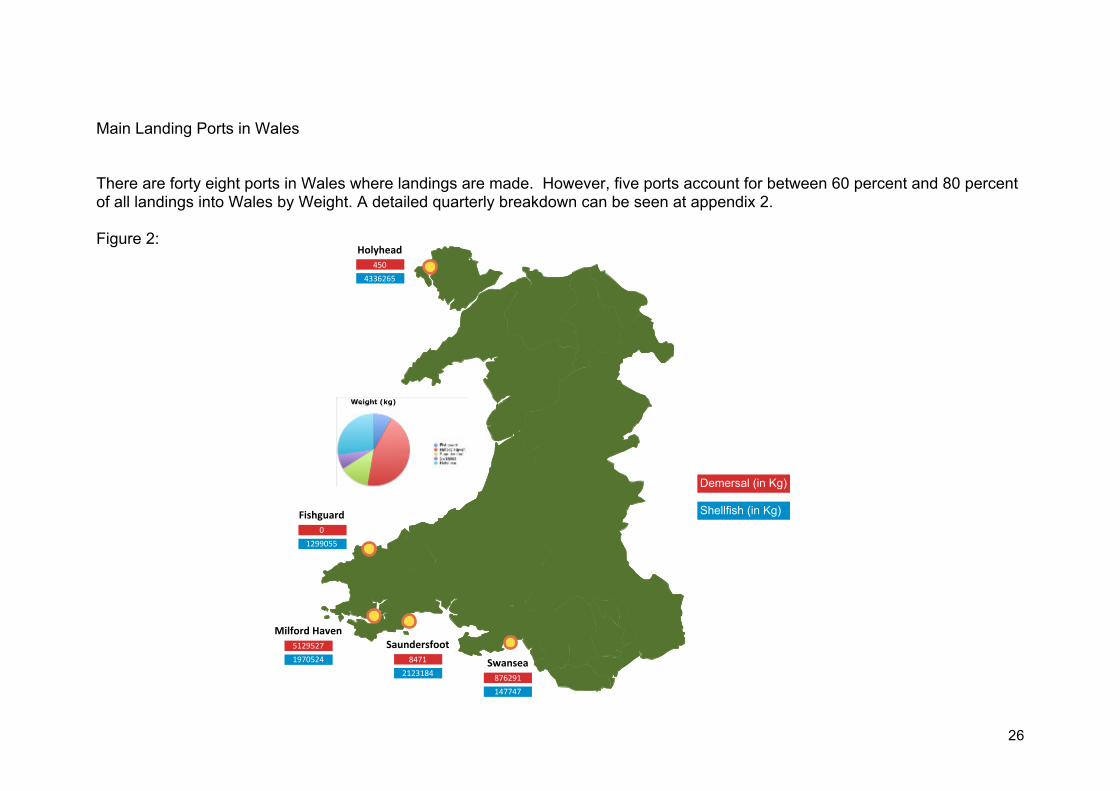
Main Landing Ports in Wales
There are forty eight ports in Wales where landings are made. However, five ports account for between 60 percent and 80 percentof all landings into Wales by Weight. A detailed quarterly breakdown can be seen at appendix 2.
Figure 2:
Swansea876291
147747
Saundersfoot8471
2123184
Milford Haven5129527
1970524
Holyhead450
4336265
Fishguard0
1299055
Demersal (in Kg)
Shellfish (in Kg)
27
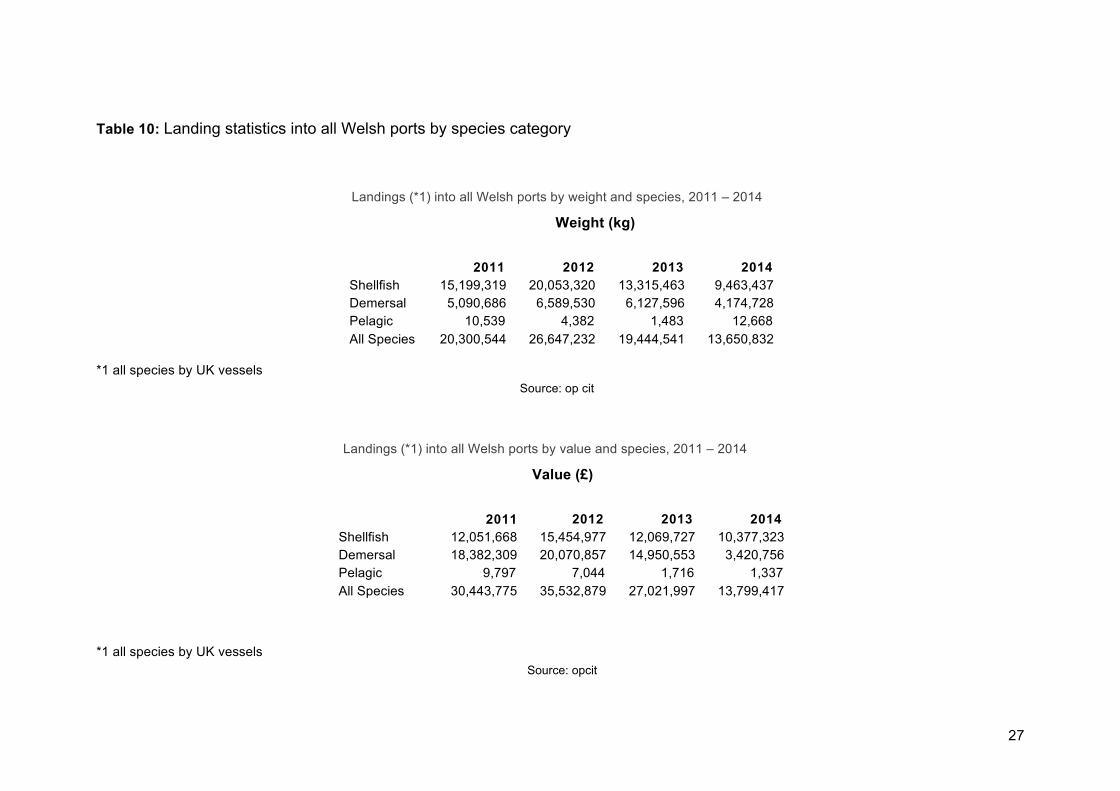
Table 10: Landing statistics into all Welsh ports by species category
Landings (*1) into all Welsh ports by weight and species, 2011 – 2014
Weight (kg)
2011
2011
2012 2013 2014Shellfish 15,199,319 20,053,320 13,315,463 9,463,437Demersal 5,090,686 6,589,530 6,127,596 4,174,728Pelagic 10,539 4,382 1,483 12,668All Species 20,300,544 26,647,232 19,444,541 13,650,832
*1 all species by UK vesselsSource: op cit
Landings (*1) into all Welsh ports by value and species, 2011 – 2014
Value (£)
2012 2013 2014Shellfish 12,051,668 15,454,977 12,069,727 10,377,323Demersal 18,382,309 20,070,857 14,950,553 3,420,756Pelagic 9,797 7,044 1,716 1,337All Species 30,443,775 35,532,879 27,021,997 13,799,417
*1 all species by UK vesselsSource: opcit
28
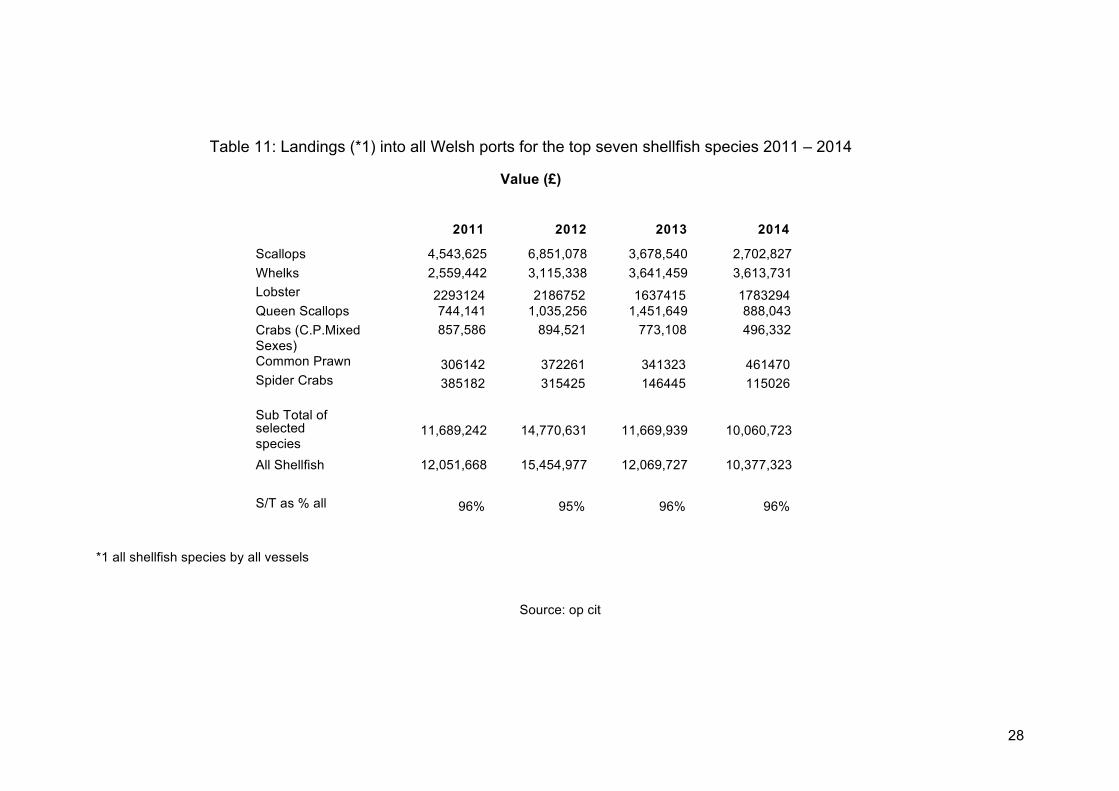
Table 11: Landings (*1) into all Welsh ports for the top seven shellfish species 2011 – 2014
Value (£)
20122011 2013 2014
Scallops 4,543,625 6,851,078 3,678,540 2,702,827
Whelks 2,559,442 3,115,338 3,641,459 3,613,731
Lobster 2293124 2186752 1637415 1783294Queen Scallops 744,141 1,035,256 1,451,649 888,043
Crabs (C.P.MixedSexes)
857,586 894,521 773,108 496,332
Common Prawn 306142 372261 341323 461470Spider Crabs 385182 315425 146445 115026
Sub Total ofselectedspecies
11,689,242 14,770,631 11,669,939 10,060,723
All Shellfish 12,051,668 15,454,977 12,069,727 10,377,323
S/T as % all 96% 95% 96% 96%
*1 all shellfish species by all vessels
Source: op cit
29
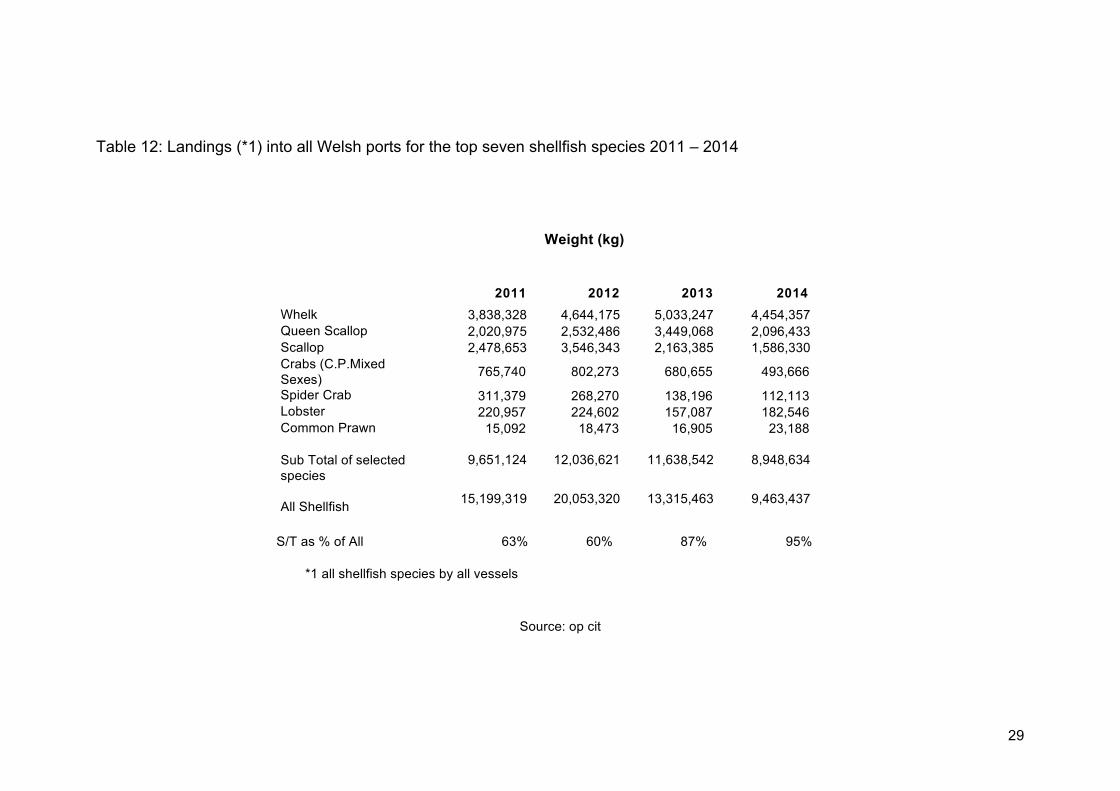
Table 12: Landings (*1) into all Welsh ports for the top seven shellfish species 2011 – 2014
Weight (kg)
2011 2012 2013 2014
Whelk 3,838,328 4,644,175 5,033,247 4,454,357Queen Scallop 2,020,975 2,532,486 3,449,068 2,096,433Scallop 2,478,653 3,546,343 2,163,385 1,586,330Crabs (C.P.MixedSexes)
765,740 802,273 680,655 493,666
Spider Crab 311,379 268,270 138,196 112,113Lobster 220,957 224,602 157,087 182,546Common Prawn 15,092 18,473 16,905 23,188
Sub Total of selectedspecies
9,651,124 12,036,621 11,638,542 8,948,634
All Shellfish15,199,319 20,053,320 13,315,463 9,463,437
S/T as % of All 63% 60% 87% 95%
*1 all shellfish species by all vessels
Source: op cit
30
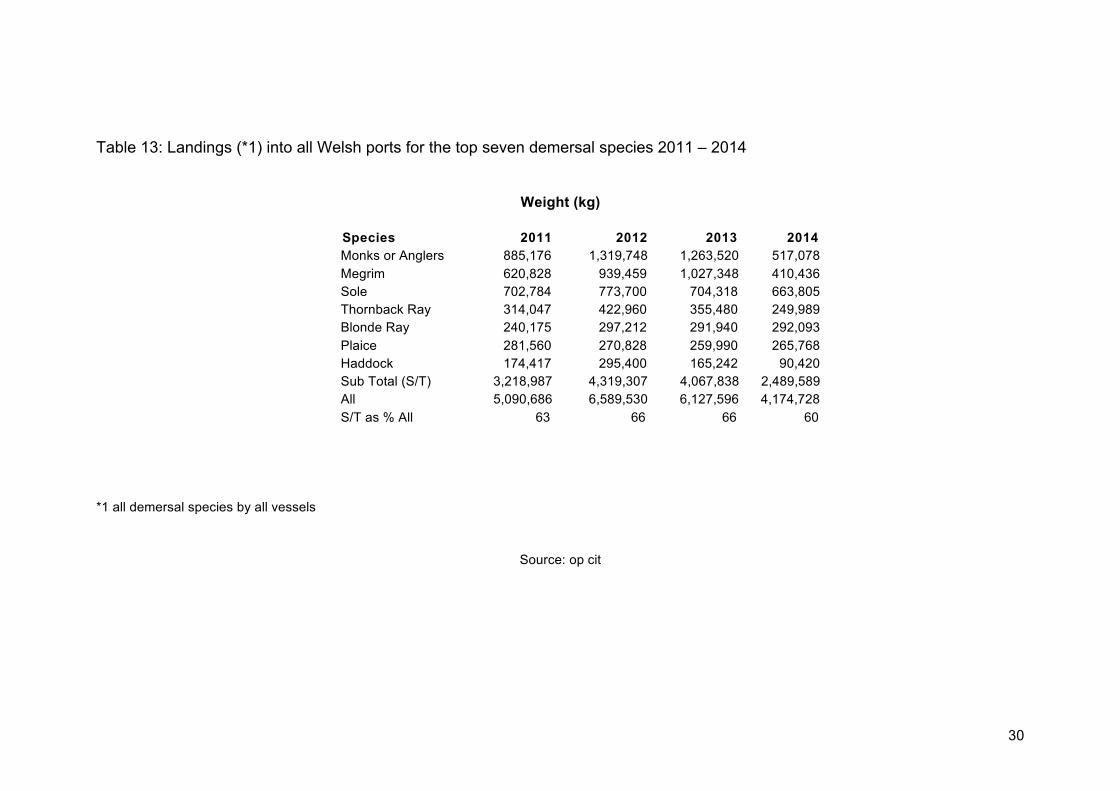
Table 13: Landings (*1) into all Welsh ports for the top seven demersal species 2011 – 2014
Weight (kg)
Species 2011 2012 2013 2014Monks or Anglers 885,176 1,319,748 1,263,520 517,078Megrim 620,828 939,459 1,027,348 410,436Sole 702,784 773,700 704,318 663,805Thornback Ray 314,047 422,960 355,480 249,989Blonde Ray 240,175 297,212 291,940 292,093Plaice 281,560 270,828 259,990 265,768Haddock 174,417 295,400 165,242 90,420Sub Total (S/T) 3,218,987 4,319,307 4,067,838 2,489,589All 5,090,686 6,589,530 6,127,596 4,174,728S/T as % All 63 66 66 60
*1 all demersal species by all vessels
Source: op cit
31
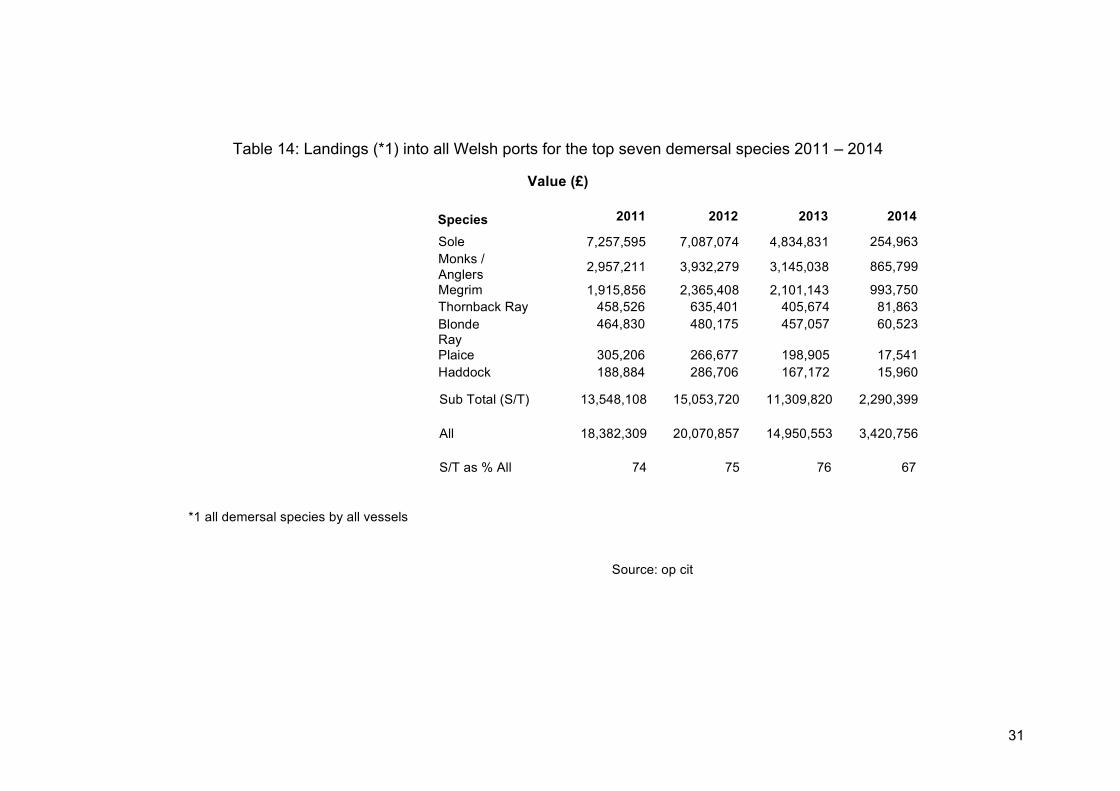
Table 14: Landings (*1) into all Welsh ports for the top seven demersal species 2011 – 2014
Value (£)
Species 2011 2012 2013 2014
Sub Total (S/T) 13,548,108 15,053,720 11,309,820 2,290,399
All 18,382,309 20,070,857 14,950,553 3,420,756
S/T as % All 74 75 76 67
*1 all demersal species by all vessels
Source: op cit
Sole 7,257,595 7,087,074 4,834,831 254,963Monks /Anglers
2,957,211 3,932,279 3,145,038 865,799
Megrim 1,915,856 2,365,408 2,101,143 993,750Thornback Ray 458,526 635,401 405,674 81,863BlondeRay
464,830 480,175 457,057 60,523
Plaice 305,206 266,677 198,905 17,541Haddock 188,884 286,706 167,172 15,960
32
5.2 Aquaculture Statistics
Aquaculture Overview
The United Nations Food and Agriculture Organisation defines aquaculture as ‘the farming of aquatic organisms including fish,molluscs, crustaceans and aquatic plants with some sort of intervention in the rearing process to enhance production, such asregular stocking, feeding, protection from predators etc. Farming also implies individual or corporate ownership of the stock beingcultivated.’8
The shellfish aquaculture sector in Wales is dominated by mussel production in both north and south Wales. The sector is of suchscale that up until 2012 Wales produced the greatest volume of shellfish of any of the home nations accounting for almost a third ofproduction.
By comparison, the finfish aquaculture sector in Wales accounts for just 0.3% of production for the UK, yet there have beeninnovative re-circulatory aquaculture businesses in North Wales for example involved in the production of farmed sea bass.
Small scale oyster farming takes place along the banks of the Menai Strait and renovation of the oyster beds in Swansea Bay isalso underway.
With the UK consumption of shellfish being low in comparison to our European neighbours, mussel for example produced in Walesrelies on the export market for sales. UK consumption of mussels in 2010 from Seafish data was approximately 4000 tons.
While the output of the Welsh aquaculture sector is high, the number of employees within the sector in 2012 stood at 34, with 705employed within the UK as a whole. Finfish production supports 100 employees within the Welsh aquaculture sector.
8 : www.fao.org/fishery/staistics/glocal--aquaculture--production
33
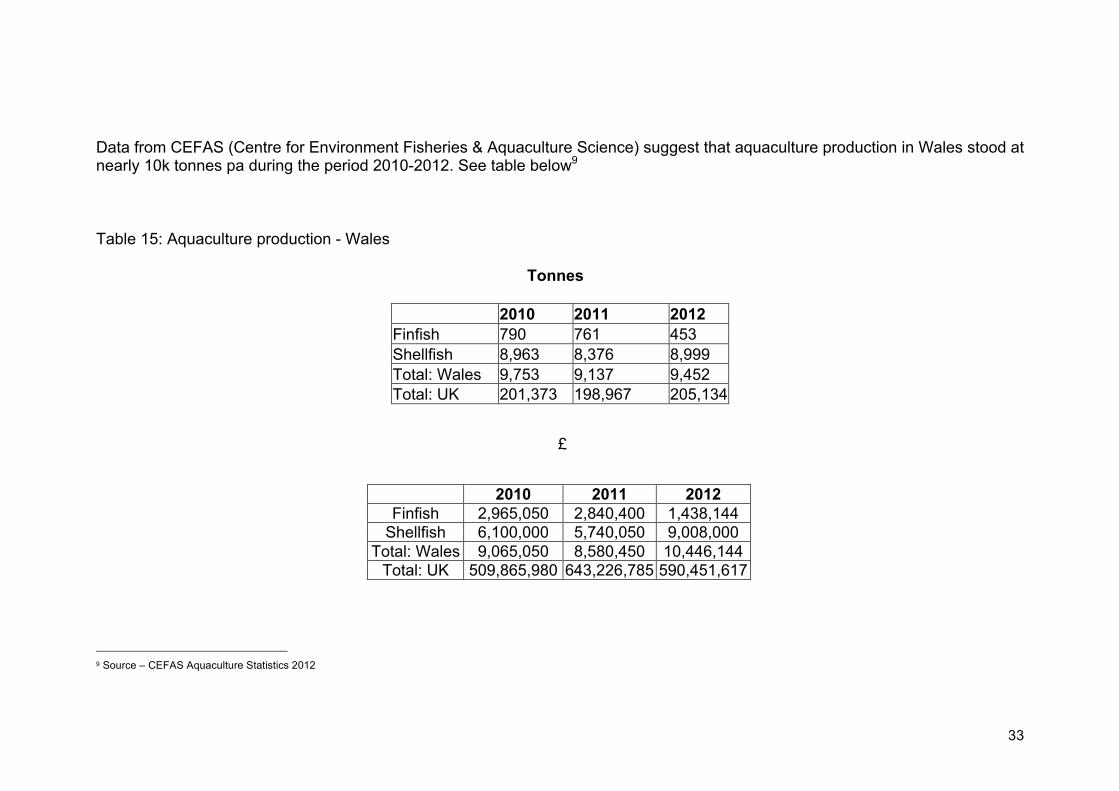
Data from CEFAS (Centre for Environment Fisheries & Aquaculture Science) suggest that aquaculture production in Wales stood atnearly 10k tonnes pa during the period 2010-2012. See table below9
Table 15: Aquaculture production - Wales
Tonnes
2010 2011 2012Finfish 790 761 453Shellfish 8,963 8,376 8,999Total: Wales 9,753 9,137 9,452Total: UK 201,373 198,967 205,134
£
9 Source – CEFAS Aquaculture Statistics 2012
2010 2011 2012Finfish 2,965,050 2,840,400 1,438,144Shellfish 6,100,000 5,740,050 9,008,000
Total: Wales 9,065,050 8,580,450 10,446,144Total: UK 509,865,980 643,226,785 590,451,617
34
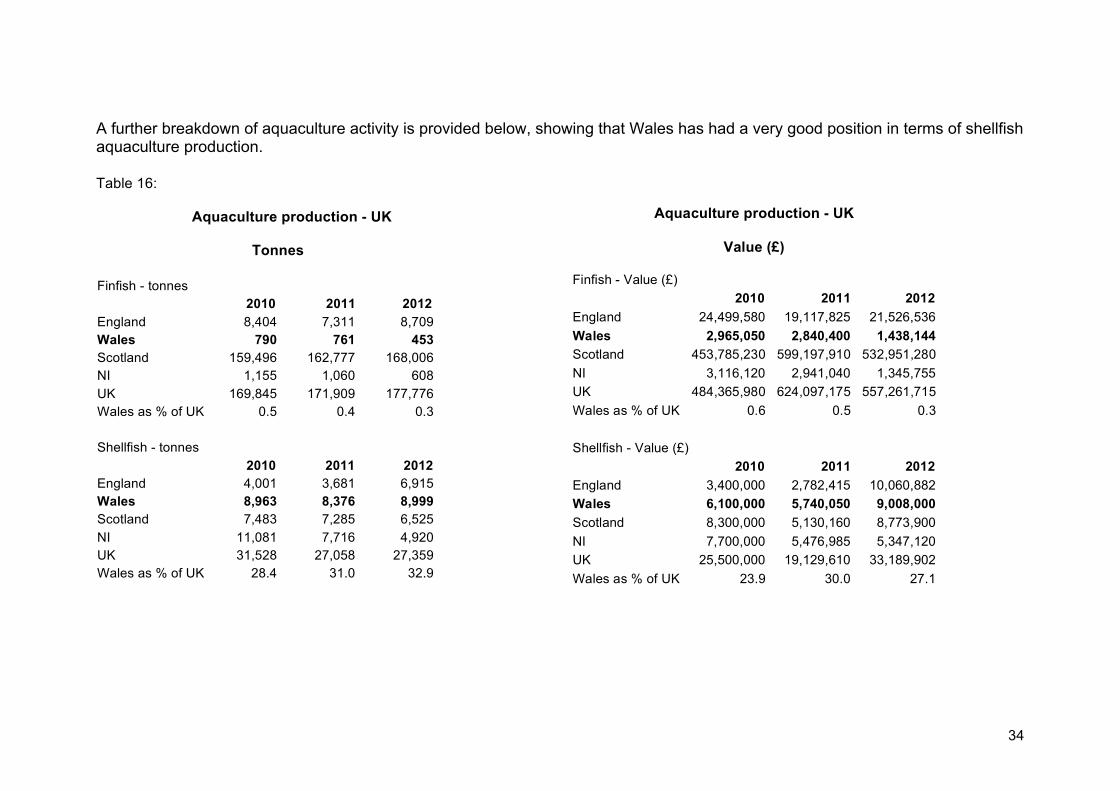
A further breakdown of aquaculture activity is provided below, showing that Wales has had a very good position in terms of shellfishaquaculture production.
Table 16:
Aquaculture production - UK
Tonnes
Finfish - tonnes2010 2011 2012
England 8,404 7,311 8,709Wales 790 761 453Scotland 159,496 162,777 168,006NI 1,155 1,060 608UK 169,845 171,909 177,776Wales as % of UK 0.5 0.4 0.3
Shellfish - tonnes2010 2011 2012
England 4,001 3,681 6,915Wales 8,963 8,376 8,999Scotland 7,483 7,285 6,525NI 11,081 7,716 4,920UK 31,528 27,058 27,359Wales as % of UK 28.4 31.0 32.9
Aquaculture production - UK
Value (£)
Finfish - Value (£)
2010 2011 2012
England 24,499,580 19,117,825 21,526,536
Wales 2,965,050 2,840,400 1,438,144
Scotland 453,785,230 599,197,910 532,951,280
NI 3,116,120 2,941,040 1,345,755
UK 484,365,980 624,097,175 557,261,715
Wales as % of UK 0.6 0.5 0.3
Shellfish - Value (£)
2010 2011 2012
England 3,400,000 2,782,415 10,060,882
Wales 6,100,000 5,740,050 9,008,000
Scotland 8,300,000 5,130,160 8,773,900
NI 7,700,000 5,476,985 5,347,120
UK 25,500,000 19,129,610 33,189,902
Wales as % of UK 23.9 30.0 27.1
35
5.3 Gathering Sector Statistics
Intertidal and Hand Gathering Fisheries Overview
Wales has a long history of hand gathering fisheries in both the North and South of the country. From the hand gathered musselfishery in Conwy and cockle gathering in the Dee Estuary in the North to the gathering of the iconic Laverbread seaweed in SouthWales alongside the cockle fisheries of the Burry Inlet. Mussel seed and winkles are also gathered on a small scale.
Both fisheries operate on the licence basis with the Dee fishery being capped at 53 issued each year and 36 issued on the BurryInlet.
Our intertidal fisheries have supported well established Welsh processing businesses such as Selwyn’s Seafoods and Parson’sPickles and as such are an important part of the supply chain.
Laverbread has gained somewhat of a resurgence of late with Pembrokeshire Beach Food Company using it as a cornerstone of itsproduct offer and recently winning BBC Food and Farming Awards Best Street Food award in 2014 and Selwyns Seafoodslaunching an innovative seaweed snack product.
Finally, in this section on landings, we can look at a recent study of the cockle sector conducted in 2015 in response to therecurring mortality rate of 2 and 3 year-classes on the Burry Inlet (Loughour) Estuary (BI) since 2002 and on the nearby ThreeRivers Estuary (TR) since 200510
10 http://www.seafish.org/media/1458283/seafish_economic_impact_report_cockle_mortality_burry_inlet_2sep2015_final_report_hw.pdf
36
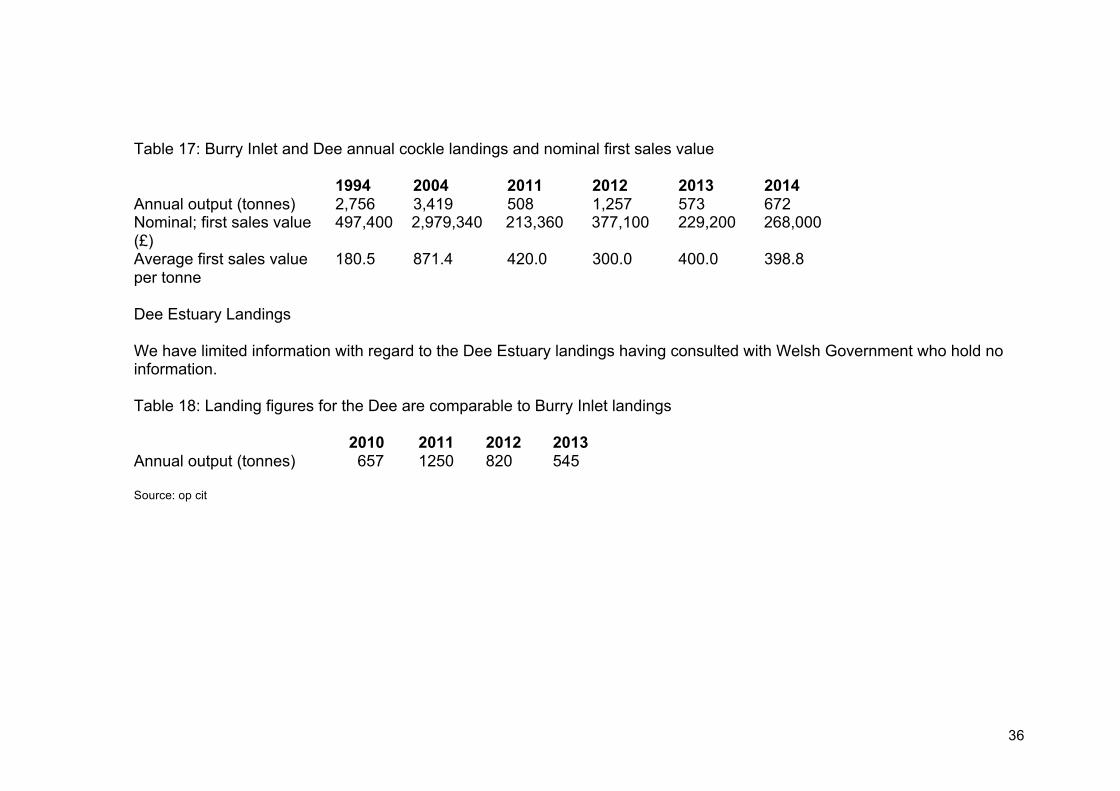
Table 17: Burry Inlet and Dee annual cockle landings and nominal first sales value
1994 2004 2011 2012 2013 2014Annual output (tonnes) 2,756 3,419 508 1,257 573 672Nominal; first sales value(£)
497,400 2,979,340 213,360 377,100 229,200 268,000
Average first sales valueper tonne
180.5 871.4 420.0 300.0 400.0 398.8
Dee Estuary Landings
We have limited information with regard to the Dee Estuary landings having consulted with Welsh Government who hold noinformation.
Table 18: Landing figures for the Dee are comparable to Burry Inlet landings
20112010 2012 2013Annual output (tonnes) 657 1250 820 545
Source: op cit
37
5.4 Catching, Gathering and Aquaculture Sector Summary
Both the catching and aquaculture sector in Wales provide a broad range of fish and shellfish species for consumption. Havingreviewed the data at our disposal, we would place a reliable estimate on the sector value as being £33.7m, noting that this figure isbased on data up to 3 years old.
In the catching sector we have identified issues within the labour market with broad variations in those working in the sector on afull and part time basis, alongside vessel that operate on a part time basis. Indeed, of the 477 domestic vessels operating in Waleswe identified that in 2013 only 250 were recorded as active.
Of particular interest via the independent survey we undertook of a sample of domestic vessels operating throughout Wales is thevariety of species landed throughout Wales. This has included a broad range of finfish, but in low volumes per vessel.
One of the main challenges from the perspective of the catching sector is the landings by foreign vessels and access to thesespecies by operators in the Welsh onshore handling and processing sector.
From the perspective of supply chain co-ordination and efficiency, the gathering and collation of data across both the aquacultureand catching sectors is not kept up to date sufficiently to allow for informed decision making with regard to the sector. Incomparison to other sectors such as dairy and red meat, data capture structures are complex and at a minimum, data is up to twoyears old.
Whilst outside the scope of this study, but raised within the perceptions of the key stakeholders, we would note the regulatory andlegislative burden on the industry at production and catching level which is becoming more challenging. Current and robust datawith regard to the output of the sector should allow for more informed decision making not only with regard to supply chaindevelopment, but the role of the this part of the sector in the food chain.
38
6. Seafood Processing and Distribution in Wales
Having analysed the provision of raw materials produced and landed by the Welsh catching and aquaculture sector, the mainprimary research of this supply study focused on identifying the businesses operating in the onshore handling and processingsector in Wales.
It should be noted from the outset that the analysis of the onshore sector is on the basis of assessing the characteristics of thehandling and processing sector. It includes information with regard to the processing, handling and distribution of Welsh, UK, EUand non-EU fisheries products and where possible we have provided a breakdown of this.
Numbers operating in the sector has been difficult to ascertain and as part of the assignment we were required to identify a samplepopulation which led to effective population of 64 fisheries related businesses operating in the sector. Of the 64 businessesidentified, 55 engaged with the study and responded to telephone interview.
Unlike other industry sectors in Wales, the on-shore side of the fisheries processing and distribution is fragmented, with thepresence of:
• Merchants acting distributors• Merchants as pure logistics providers• Fishmongers• Fishmongers involved in processing and added value• Specialist artisan processors• Wholesalers• Food Service Providers• Retailers• Fishers Co-operatives• Producer Organisations• Direct Sales to Hospitality Trade via Registered Buyers and Sellers (RBS) Scheme.• Direct Sales to European Buyers
39
6.1 Key Segments Within the Onshore Sector
Table 19 below provides a breakdown of the main types of businesses operating in the onshore sector. As outlined, we haveidentified a broad range of businesses operating in the sector as described on page 39, but we have wanted to consolidate thesetypes of businesses into a more defined range of segments operating in the sector:
Processors
Processor operating in the Welsh onshore sector are involved in both primary and secondary processing of product withexamples of the processes employed broken down in the descriptors of table 19. Of the sample population those involved in theprocessing sector in Wales constituted just over two thirds of the onshore sector. Whilst the percentage of those involved insecondary processing is just 5.5%, the number of processors in Wales is encouraging, particularly then set against the view ofthe key stakeholder respondents that there is insufficient local processing capacity
Merchants
Merchants are defined as those operators in the sector who are engaged in the business of purchasing and sale of fin fish andshellfish to trade customers in either live or dead formats. Representing 20% of the onshore sector, those identifying themselvesas merchants in the survey correlated well with the responses of the key stakeholder group. It is without doubt that merchantsare a key buying group of Welsh landed fish and shellfish and have a key role in the movement of primary product
Retail
Retail is simply defined as the act of selling fish and shellfish products to the consumer. Within the sample population, 23.5%identified themselves as retail operators with the most obvious group being fishmongers.
Other
Of particular interest and described within the note to table 19 below are those involved in what we classified as ‘other’ businesstypes where a mix of activities exist.
40
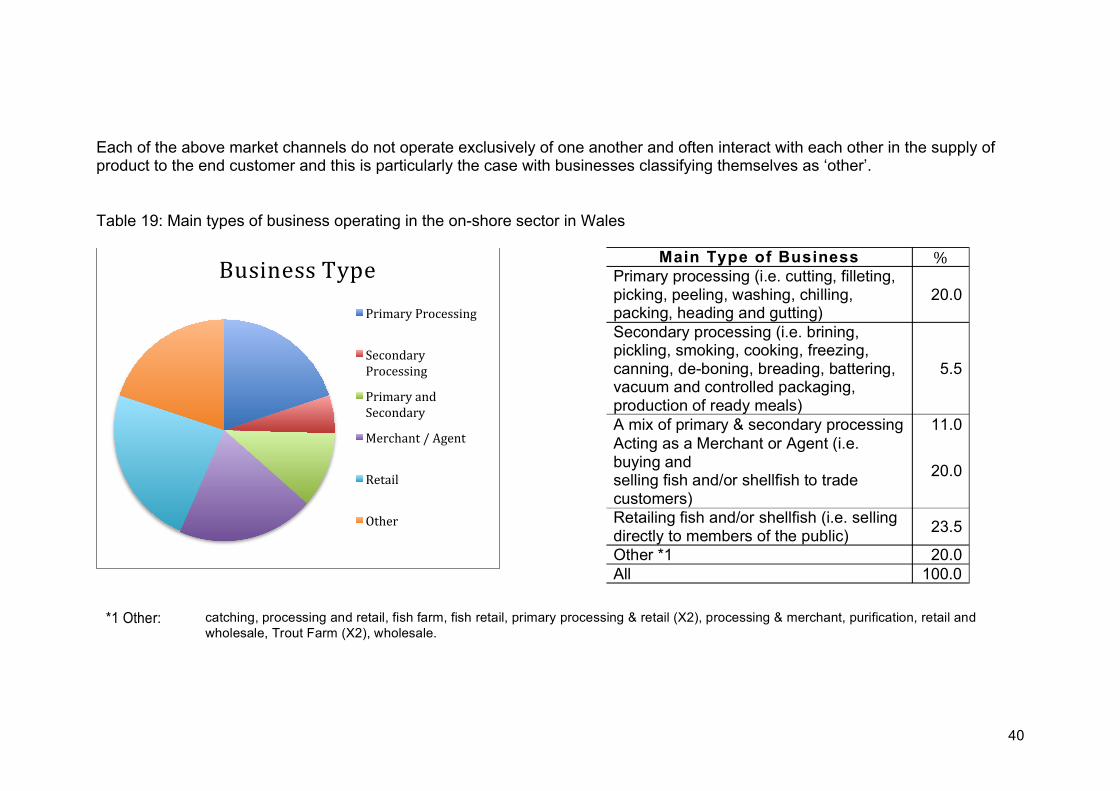
Each of the above market channels do not operate exclusively of one another and often interact with each other in the supply ofproduct to the end customer and this is particularly the case with businesses classifying themselves as ‘other’.
Table 19: Main types of business operating in the on-shore sector in Wales
Business Type
Primary Processing
SecondaryProcessing
Primary andSecondary
Merchant / Agent
Retail
Other
Main Type of Business %Primary processing (i.e. cutting, filleting,picking, peeling, washing, chilling,packing, heading and gutting)
20.0
Secondary processing (i.e. brining,pickling, smoking, cooking, freezing,canning, de-boning, breading, battering,vacuum and controlled packaging,production of ready meals)
5.5
A mix of primary & secondary processing 11.0Acting as a Merchant or Agent (i.e.buying andselling fish and/or shellfish to tradecustomers)
20.0
Retailing fish and/or shellfish (i.e. sellingdirectly to members of the public)
23.5
Other *1 20.0All 100.0
*1 Other: catching, processing and retail, fish farm, fish retail, primary processing & retail (X2), processing & merchant, purification, retail andwholesale, Trout Farm (X2), wholesale.
41
6.2 Onshore Business Characteristics
To further expand on the key features of the businesses operating in the Welsh onshore sector, we sought to understand their keycharacteristics in terms of employment, trading history and their financial performance.
Employment
• 20% of the businesses interviewed had one full time (FTE) employee
• 45.3% employed between two and five FTE
• 18.2% employed between six to ten FTE
• 14.2% employed between eleven and twenty five FTE
• One business stated employing over 251 FTE
Trading History
• Almost 60% of businesses had been trading for 10 years or more
• 23.6% have been trading for more than three years but less than 10
• 18.2% have been trading for less than three years but more than one year
42
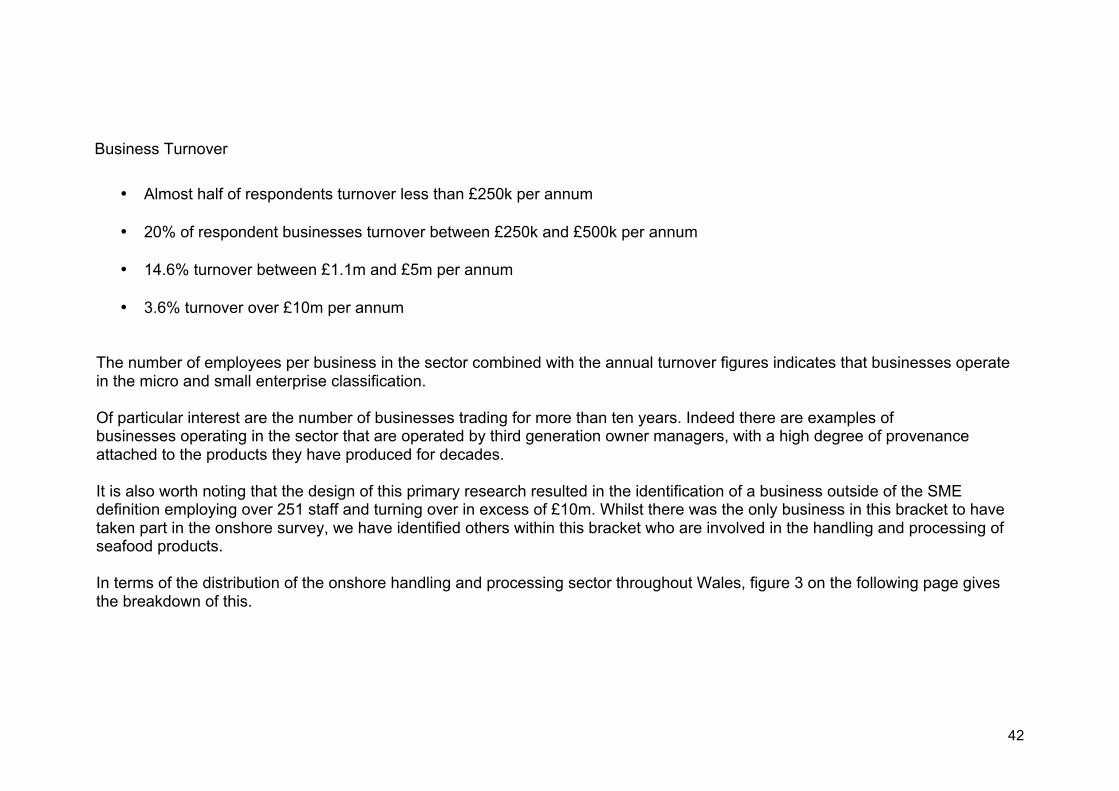
• Almost half of respondents turnover less than £250k per annum
• 20% of respondent businesses turnover between £250k and £500k per annum
• 14.6% turnover between £1.1m and £5m per annum
• 3.6% turnover over £10m per annum
The number of employees per business in the sector combined with the annual turnover figures indicates that businesses operatein the micro and small enterprise classification.
Of particular interest are the number of businesses trading for more than ten years. Indeed there are examples ofbusinesses operating in the sector that are operated by third generation owner managers, with a high degree of provenanceattached to the products they have produced for decades.
It is also worth noting that the design of this primary research resulted in the identification of a business outside of the SMEdefinition employing over 251 staff and turning over in excess of £10m. Whilst there was the only business in this bracket to havetaken part in the onshore survey, we have identified others within this bracket who are involved in the handling and processing ofseafood products.
In terms of the distribution of the onshore handling and processing sector throughout Wales, figure 3 on the following page givesthe breakdown of this.
Business Turnover
43
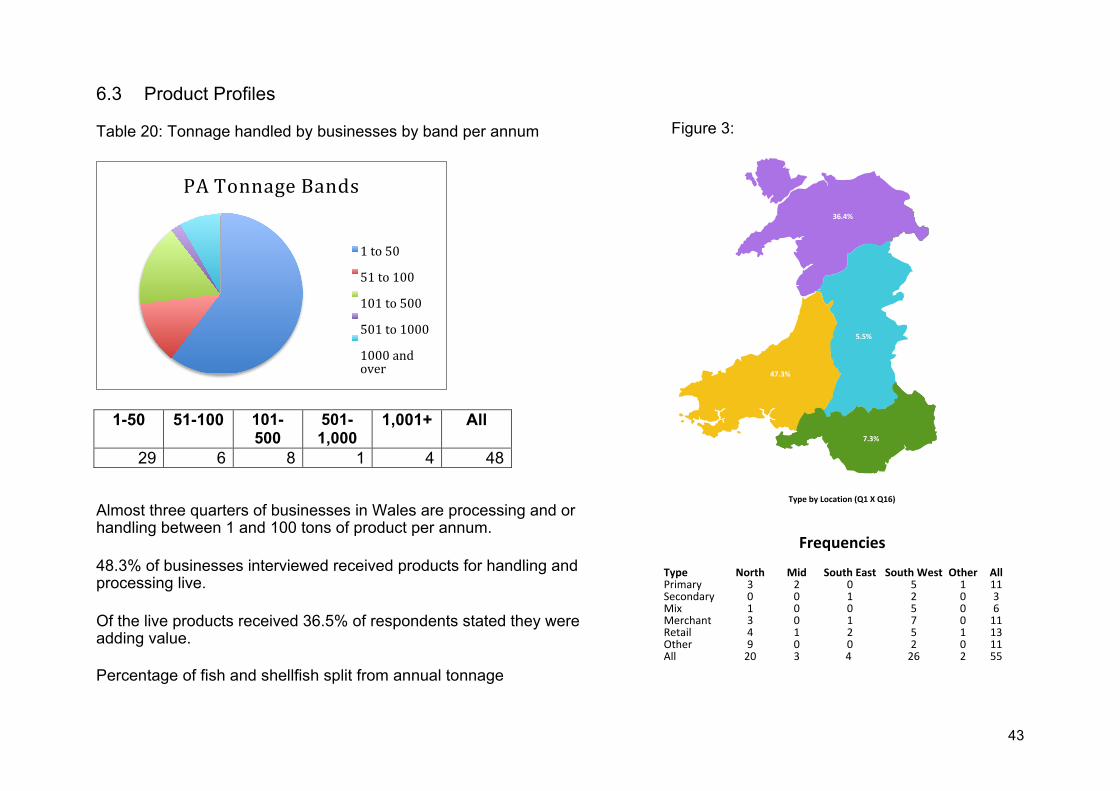
6.3 Product Profiles
Table 20: Tonnage handled by businesses by band per annum
Almost three quarters of businesses in Wales are processing and orhandling between 1 and 100 tons of product per annum.
48.3% of businesses interviewed received products for handling andprocessing live.
Of the live products received 36.5% of respondents stated they wereadding value.
Percentage of fish and shellfish split from annual tonnage
Figure 3:
PA Tonnage Bands
1 to 50
51 to 100
101 to 500
501 to 1000
1000 andover
1-50 51-100 101-500
501-1,000
1,001+ All
29 6 8 1 4 48
36.4%
5.5%
47.3%
7.3%
Type by Location (Q1 X Q16)
Frequencies
Type North Mid South East South West Other AllPrimary 3 2 0 5 1 11Secondary 0 0 1 2 0 3Mix 1 0 0 5 0 6Merchant 3 0 1 7 0 11Retail 4 1 2 5 1 13Other 9 0 0 2 0 11All 20 3 4 26 2 55
44
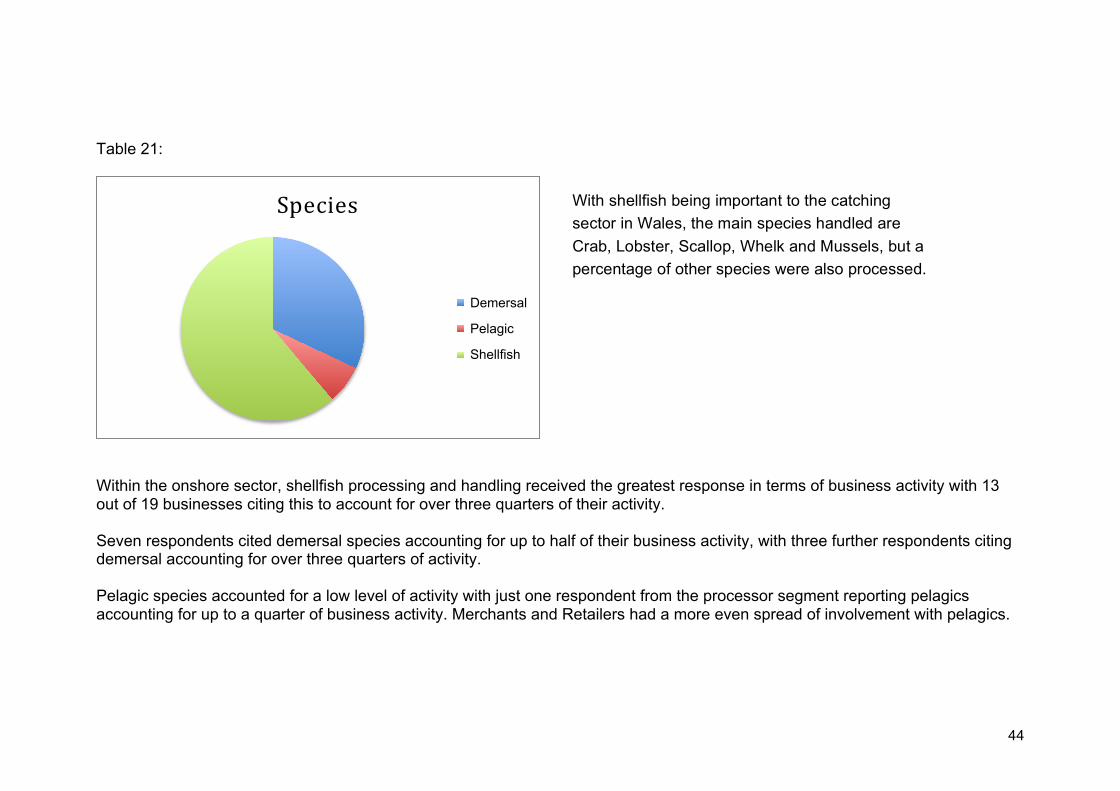
Table 21:
Within the onshore sector, shellfish processing and handling received the greatest response in terms of business activity with 13out of 19 businesses citing this to account for over three quarters of their activity.
Seven respondents cited demersal species accounting for up to half of their business activity, with three further respondents citingdemersal accounting for over three quarters of activity.
Pelagic species accounted for a low level of activity with just one respondent from the processor segment reporting pelagicsaccounting for up to a quarter of business activity. Merchants and Retailers had a more even spread of involvement with pelagics.
Species
Demersal
Pelagic
ShellŠish
With shellfish being important to the catching
sector in Wales, the main species handled are
Crab, Lobster, Scallop, Whelk and Mussels, but a
percentage of other species were also processed.
Demersal
Pelagic
Shellfish
45
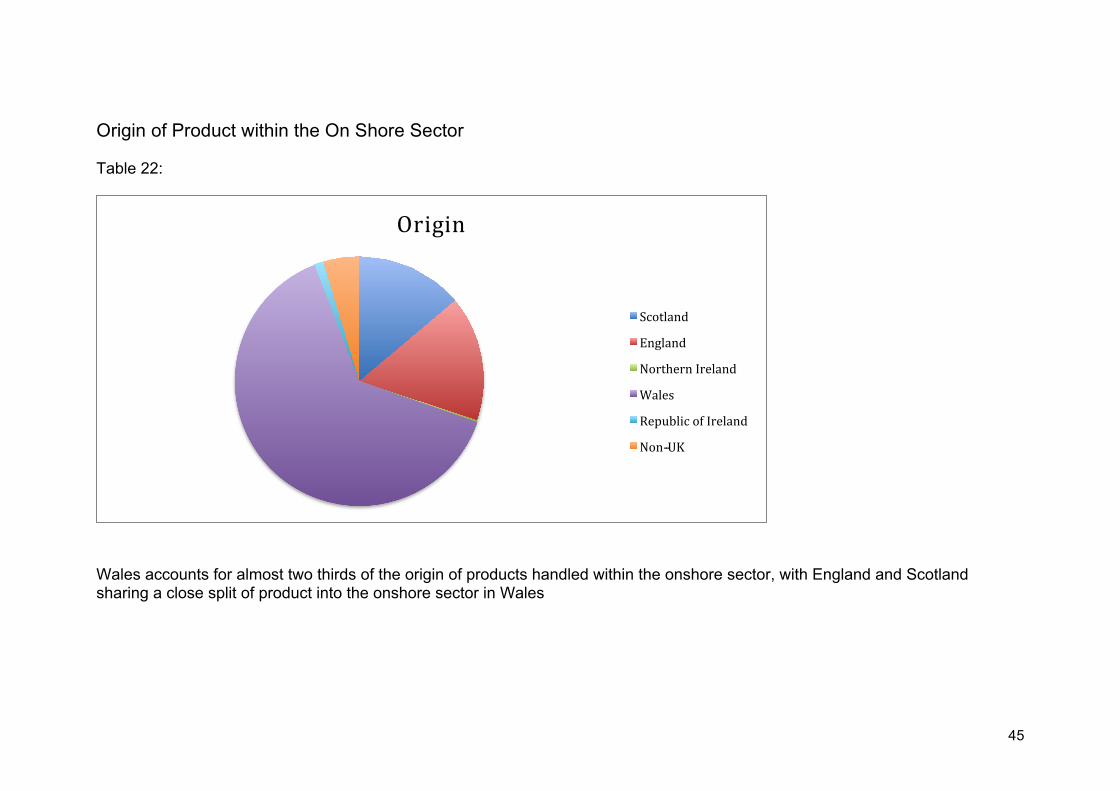
Origin of Product within the On Shore Sector
Table 22:
Wales accounts for almost two thirds of the origin of products handled within the onshore sector, with England and Scotlandsharing a close split of product into the onshore sector in Wales
Origin
Scotland
England
Northern Ireland
Wales
Republic of Ireland
Non--UK
46
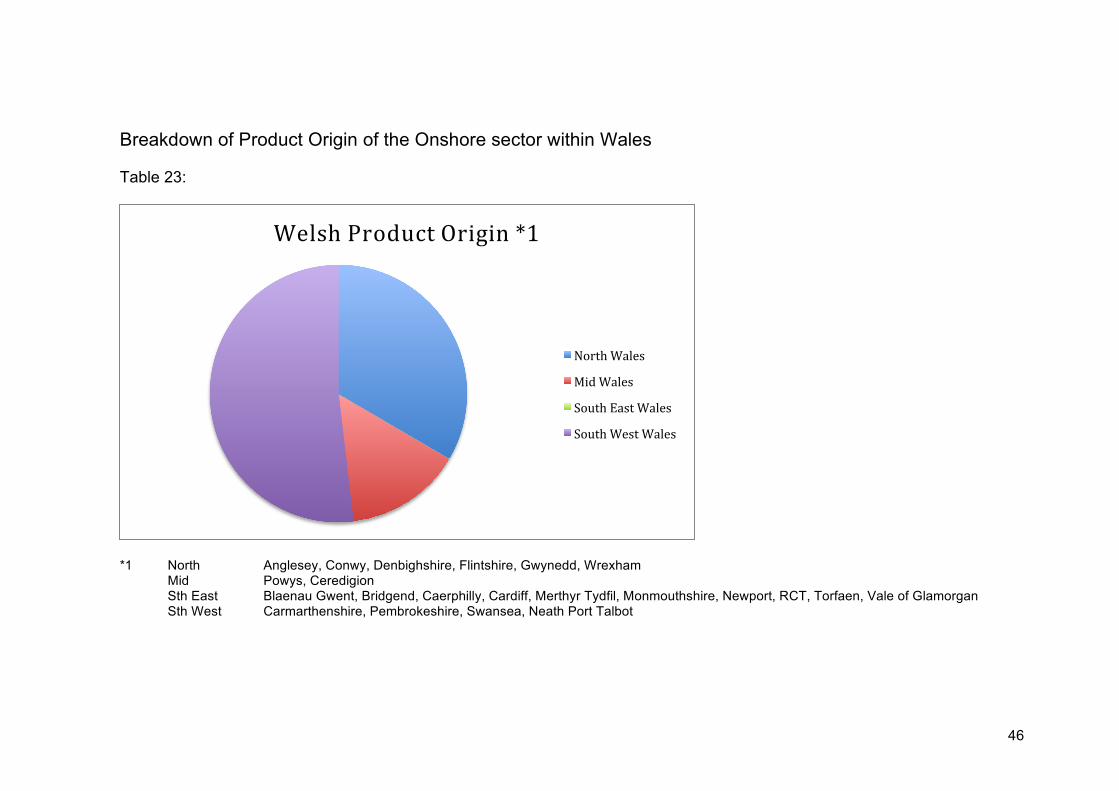
Breakdown of Product Origin of the Onshore sector within Wales
Table 23:
*1 North Anglesey, Conwy, Denbighshire, Flintshire, Gwynedd, WrexhamMid Powys, CeredigionSth East Blaenau Gwent, Bridgend, Caerphilly, Cardiff, Merthyr Tydfil, Monmouthshire, Newport, RCT, Torfaen, Vale of GlamorganSth West Carmarthenshire, Pembrokeshire, Swansea, Neath Port Talbot
Welsh Product Origin *1
North Wales
Mid Wales
South East Wales
South West Wales
47
6.4 Product Sales and Markets
Of the businesses operating in the sector, we sought to identify the total sales of product within the onshore sector being exportedoutside of the UK
• 24.4% of sales were made to customers outside of the UK.
• Of this percentage, Spain was the main export destination for product sold directly from Wales
• By less than 0.1% France was the next export destination for product sold directly from Wales
• The Netherlands accounted for 2.7%
• Of the other export destinations provided by respondents, these included other European countries including Belgium andSweden
• South Korea, Asia and the Far East were also destinations for product
48
Exports
• Overall, eighteen (18) out of the fifty five (55) respondents reported that they were involved in exporting with twelverespondents (12) citing that export accounted for over three quarters of their activity
• Spain was the country that dominated the export of crab, with overall nine (9) respondents citing this country and two (2)respondents citing 76-100% of their crab exports went to Spain
• France was the next most important country for crab, with seven (7) respondents citing this country as an export destinationand two citing 51-75% of their crab exports went to France
• Lobster export similar in export destination profile to crab
We would highlight that in the structure of our research the onshore sector has not accounted for the export of product direct fromthe catching sector or aquaculture sector.
The mussel aquaculture sector in Wales is high in terms of volume production and exports to the Dutch, French and Belgianmarkets.
Export figures provided by HMRC do not break down product origin sufficiently to provide either species specific information or theorigin of the product exported from the processing sector in Wales.
Of those businesses interviewed involved in the sale of Scallop, Whelk and Mussels, the Netherlands, Spain and France were citedas destinations of export. We would note however that this may be for further processing prior to consumption.
49
Identification of Markets
As stated, shellfish dominates the Welsh seafood sector and at a UK level, the main destination countries in 2013 were,France, Spain, Netherlands, Italy and the Republic of Ireland. These five countries account for some 79 per cent of the total (88.6ktonnes) of shellfish exported from the UK in 2013.
The majority of key stakeholder respondents cited European markets (especially the hospitality sector) as the main end customersegments; with one respondent making the point that catches from Wales are really valued in Europe ‘but our fishermen don’t seethe return (because of the length of the supply chain)’. They went on to estimate that the majority of the Welsh catch (around 75-80%) is exported.
The respondents from the on-shore survey reported that some 24 per cent of their total sales were from exports . However, itshould be noted this respondent group was made up of on-shore business types rather than exclusively fishermen.
When reviewing the length of the supply chain, product handling and the business to business sales identified within the survey, wecan make an assumption that while the onshore business export market percentage is low, Welsh product will find its way intoexport markets as it travels the supply chain.
The respondents from the on-shore survey reported that their main type of customer was the wholesaler followed by independentretailers and the hospitality (hotels/restaurants, etc) and direct to the general public.
The respondents from the catching sector sample report that their main customers are Merchants (59 to 69 percent) andWholesalers (16 to 29 percent). In addition, the majority of these customers (59 to 76 percent) are based in Wales.
Table 24 on the following page breaks down the types of customer receiving product from the onshore sector businesses, withfurther analysis of this provided in the narrative, including the seasonal distribution of product from the sector. To take this furtherwe have also provided two supply chain schematics with detail accompanying notes in appendix 1 to demonstrate the product flowswithin the supply chain.
50
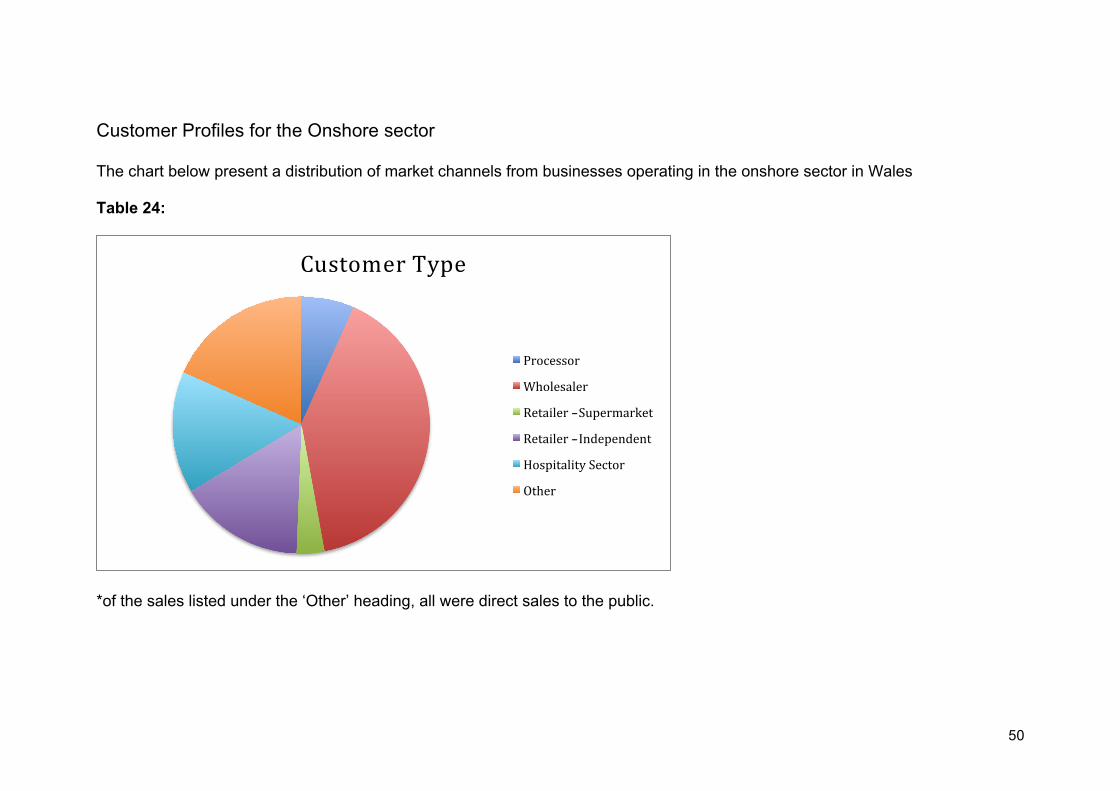
Customer Profiles for the Onshore sector
The chart below present a distribution of market channels from businesses operating in the onshore sector in Wales
Table 24:
*of the sales listed under the ‘Other’ heading, all were direct sales to the public.
Customer Type
Processor
Wholesaler
Retailer --Supermarket
Retailer --Independent
Hospitality Sector
Other
51
Of those respondents within the onshore sector, we sought to ascertain the level of business to business (B2B) sales within andfrom the Welsh sector.
• Few business to business sales were made to processors within the sector, although three respondents cited that over threequarters of their business was selling onto other processors
• Of particular interest was that one merchant cited selling onto processors accounting for up to a quarter of sales
• Wholesalers are an important customer group with twelve processors citing them as a customer and seven processors citingthem as accounting for over three quarters of their business
• Wholesalers are also an important customer group for merchants with seven reporting that they account for up to threequarter of their business
• Retail (supermarkets) is a small customer group within the sector
• Retail (independent) is more active with six respondents selling into this segment
• The hospitality sector is serviced across the onshore sector with all selling into this market channel
• Other types of customer is dominated by direct sales to the public
52
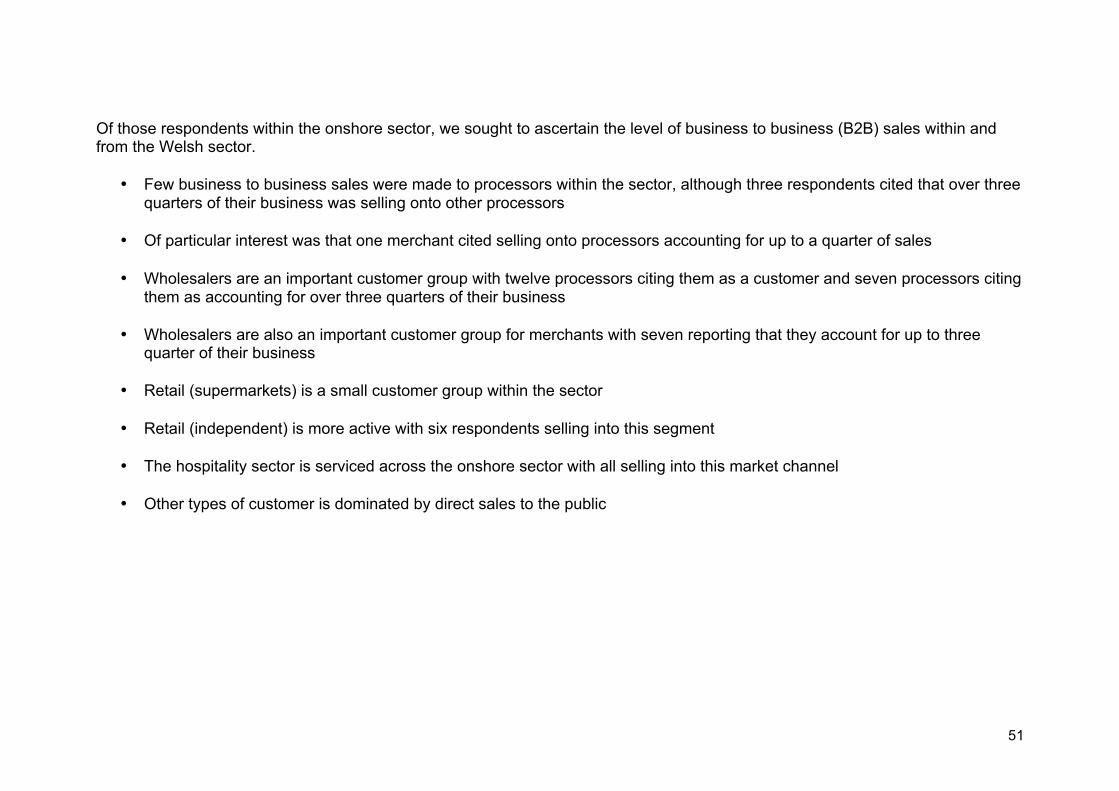
6.5 Distribution
Table 25
Of note on the responses to air transport, this is a well used method of distribution of both live and chilled premium food products.While interview respondents did not cite air transport as a logistics solution, we are aware of at least two operators in the sectorwho openly market their use of this method to access distant export markets.
A number of respondents stated the use of wholesaler and merchant transportation, well known to the sector as the means ofmoving live product to traditional continental markets
Other methods were sea containerisation, haulage contractor and hired transport
Transportation Type
Own road transport
Shared road transport
Courier
Air
Other
53
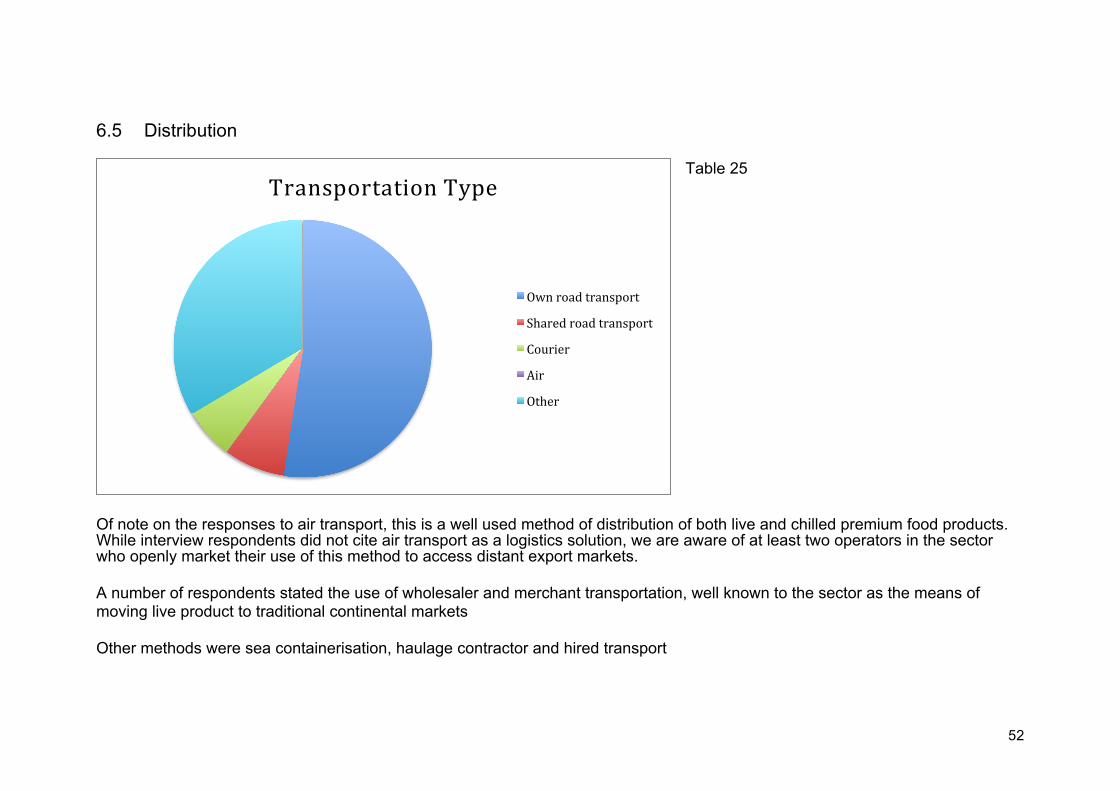
Distribution within the Supply Chain
The key stakeholders responded that the catching sector for shellfish is dominated by a small number of merchants. Thesebusinesses by their nature are well developed in providing a logistical solution to the movement of live product.
The respondents from the on-shore survey reported that around half of their product was transported on the own transport withsome respondents citing shared transport, wholesaler/merchant transport and customers’ transport. However, it should be notedthis respondent group was made up of on-shore business types rather than fishermen.
In terms of the timing of distribution of product the respondents from the on-shore survey reported the following seasonality:
Q1 - 15 per centTable 26:Q2 - 27 per cent
Q3 - 35 per centQ4 - 22 per cent
54
6.6 Industry Outlook - Onshore Handling and Processing Sector
As part of the survey and to assess the strengths and weaknesses in the sector as we did with the industry stakeholder interviews,we sought views with regard to sector performance and confidence, the results of which are below:
• The number of businesses operating in the onshore sector has been established at 65
• Within the onshore business sector 36.5% of businesses are adding value to product
• Market channels for products landed and farmed in Wales are diverse, often with long supply chains
Strengths and Weaknesses of the Onshore Business Sector
- Almost two thirds of the onshore sector agreed that their turnover had grown in over the last few years
- Over two thirds felt that there had been an increased consumer interest in fish and shellfish
- 58% of respondents felt that business had become more difficult in the last few years
- Whilst home market consumer interest has grown, 30% of businesses saw export markets as being vital, with 25% ofbusinesses actively reviewing new overseas markets to support growth
- Over half felt that legislative issues were affecting their businesses
- Over a third were planning to grow their businesses in the next 3 to 5 years
55
7. Supply Chain Overview
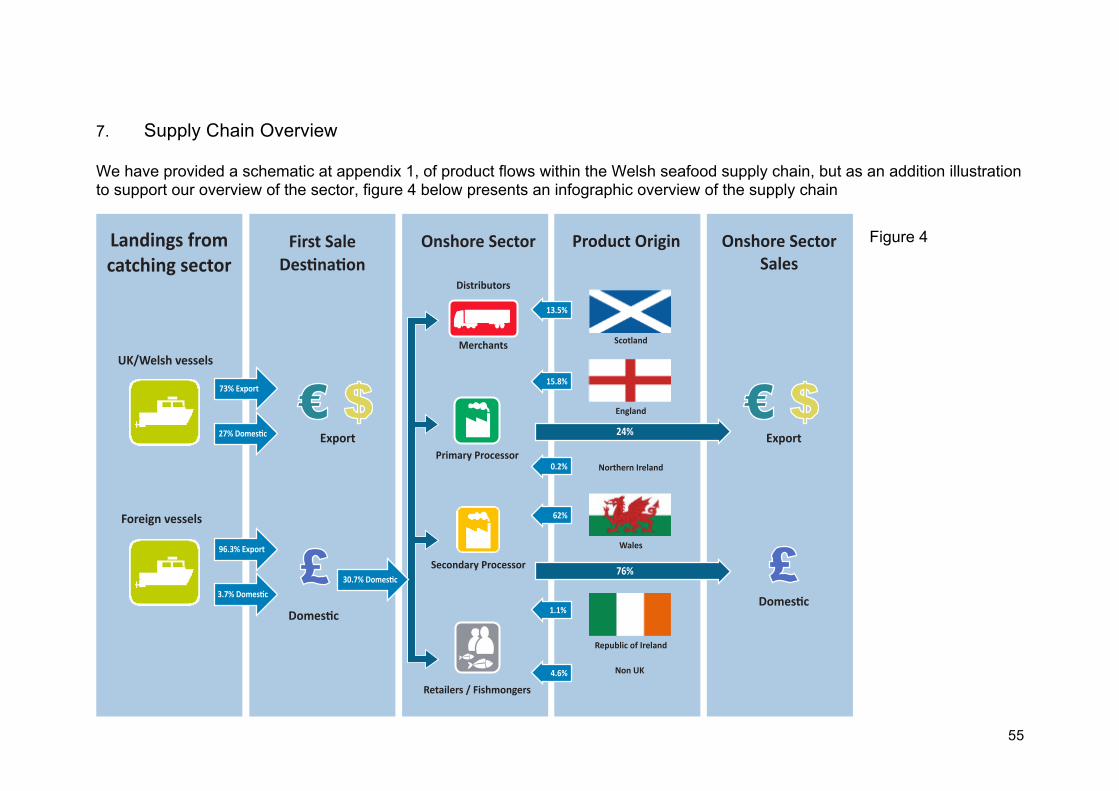
We have provided a schematic at appendix 1, of product flows within the Welsh seafood supply chain, but as an addition illustrationto support our overview of the sector, figure 4 below presents an infographic overview of the supply chain
Figure 4Landings fromcatching sector
First SaleDes�na�on
UK/Welsh vessels
Foreign vessels
Export
Domes�c
Export
Domes�c
Scotland
England
Northern Ireland
Wales
Republic of Ireland
Non UK
Onshore SectorSales
Product Origin
73% Export
13.5%
15.8%
0.2%
62%
1.1%
4.6%
96.3% Export
27% Domes�c 24%
76%
3.7% Domes�c
Primary Processor
Secondary Processor
Retailers / Fishmongers
Distributors
Merchants
Onshore Sector
30.7% Domes�c
56
To inform the figure 4 infographic CamNesa used the data gathered from the independent catching sector survey we commissionedas part of this study to understand the destination market for their product.
The onshore sector column shows that the product remaining in Wales is supplemented with product from the wider UK industryand then distributed for onward sale into the export and domestic market. As has been identified in table 21 we are able to validateinward product flows of pelagic species for example due to the negligible landings of this species category into Welsh ports.
The responses from the catching sector survey also validated the views of the key stakeholders that a high proportion of landedcatch is destined for export markets, The survey also confirmed the importance of the shellfish merchants role in Wales as a keybuyer of product with approximately two thirds of respondents citing this market channel.
When considered against the initial perceptions held within the industry identified by the key stakeholder interviews, the flows ofproduct within the supply chain in Wales are both complex and potentially inefficient.
Setting aside the aquaculture sector for a moment, the catching and gathering sector is characterised by an industry which feels atodds with how its fisheries are managed and how they are perceived. Responses to the stakeholder interviews showed fewpositive messages with regard to the sector, citing legislative burdens and bad publicity as factors leading to pessimism within thesector.
One key finding of this study however has been the existence of a positive onshore sector which, whilst expressing difficulties intheir businesses over recent times there is confidence in the future, with growth planning and identification of new markets.
The extent to which exports play a role as a market channel is viewed strongly by the production and catching sector. The researchindicates that within the onshore business community in Wales, market channels are diverse, with exports playing a lesser role totheir sales profiles. While the HMRC data for the sector shows a high level of export from the onshore sector, it does not breakdown into product of Welsh origin.
57
8. Conclusions
Having outlined data challenges at the beginning of this report, for supply chain and trade development activity to exist, industryrequires timely and accurate information with regard to the state of the supply of raw and live product. Accepting that fishing outputis subject to a great number of variables, we accept that this will most likely be based on annual trends rather than monthlyanalysis as opposed to other food sectors.
With this in mind, table 8 shows a decline in the landings over the three years leading to 2015 for both the foreign and domesticfleet into Welsh ports. Given the issue we identified with the data for foreign vessel values in 2014, even discounting this, it is aworrying decline of landings into Wales.
If we are to generalise, we have found that the landings of demersal species of volume and value are largely landed by foreignregistered vessels and is almost entirely destined for export. The indigenous fleet are orientated around the landing of shellfishspecies, but certain fin fish species such as sea bass are important alongside a broad range of species identified in small volumesas part of the catching sector survey CamNesa undertook.
It was of interest that the gathering sector in Wales was not noted by the key stakeholder respondents. While the hand gathersector is low in terms of volume across the cockle, seaweed and mussel gathering activities, the history and provenance of thesefisheries alongside our iconic coracle fishermen are hugely important in identifying key characteristics of the Welsh seafood offer.
Moving to the aquaculture sector, as previously stated, in terms of shellfish and particularly mussel, Wales certainly stands outits weight in terms of production and it is important to highlight its contribution to the seafood sector in Wales
The key element of this study was to undertake a primary research exercise into the seafood processing and distribution supplychain in Wales. With the fisheries and seafood sector in Wales being identified as a key sector within Welsh Government’s Foodand Drink Action Plan it was timely to develop an understanding of the sector and the supply chain.
58
Of the 64 active businesses we identified in the sector and the 55 responses were received, we were able to present researchfindings that indicated a sector of predominantly small businesses involved very much in the processing and handling of shellfishand demersal species in Wales.
Indeed, the research has countered what was perceived as a lack of processing activity in Wales and adding value to landed catchas well as the traditional roles of the merchants in product handling. When the landing figures for common shellfish species such ascrab and lobster are considered against the activity of the onshore processing sector, we would take the view that the sector isoperating close to limits of primary product availability and this is highlighted by the inflows of product from other areas of the UKand non-UK product for processing.
As highlighted within the industry outlook, there is positivity within the onshore processing and handling sector with regard to thefuture, both in terms of growth and seeking new markets for products. Our recommendations will be formed around this positivityand how it may support those operating in the catching, gathering and aquaculture sector in the creation of a more cohesive supplychain.
59
9. Recommendations
Data Collection and the Establishment of a Market Information System
We are aware of the statutory requirements for data collection by Welsh Government within the sector, but we have identified theneed to ensure that industry is able to receive timely information with regard to all parts of the supply chain and particularly haveaccess to trends in particular target markets such as export. This will enable the onshore sector in particular to make informeddecisions with regard to where they target their sales resource.
Seafish already promotes UK Trade and Investment guides to exporting to specific markets such as Denmark, but further workcould be undertaken by Seafish Wales on consumer requirements for specific products within target export markets.
As part of this study, we have provided Seafish with a framework for a Market Information System to take forward, defining datasources, an outline design for information processing and how this information may be disseminated to industry.
Supply Chain Efficiency and Co-operation
Supply chain efficiency and co-operation have been key components of the Rural Development Plan supporting the agriculture andprocessing sector in Wales for some years.
The are clear similarities between the fisheries and agriculture sector in terms of what is perceived to be low prices for primaryproduct and within the catching sector at least, a volatile labour market and varying frequency of vessel operation to be able tosupply. A key ingredient of potential co-operation is communication and integration throughout the supply chain.
We have touched on a key element of this in the development of the Market Information System, but to support the primaryproduction part of the fisheries supply chain, we would recommend the further support to take early stage partnerships of primaryproducers through barriers which can lead to shorter and more efficient supply chains with better returns for themselves. There hasbeen some success of this within the delivery of the programmes in Wales under European Fisheries Fund.
60
As we have commented upon in the conclusions, it is important to achieve a balance between the actual output of the catching,gathering and aquaculture sector in Wales and the onshore handling and processing sector. As has been highlighted in the keystakeholder interviews, the primary production sector is one under pressure from multiple factors. Our findings from the interviewsconducted correlate with other studies undertaken at regional level in Wales that have included focus group work with the fishingcommunity and the messages have been consistent.
Supply chain efficiency and co-operation support, provided in a structured format with full engagement of the industry could gosome way to building as positive a view as the onshore sector has of the short to medium term aspirations for the sector. We feelthat this will be key to establishing what the Welsh seafood offer is to both the trade and consumer which brings us onto our finalrecommendation
A Welsh Seafood Strategic Plan
To bring together the findings of this report, we believe that in line with the ambitions of the Welsh Government’s ambition for 30%growth within the food and drink sector by 2020, a strategic plan focusing on how the fisheries sector can grow sustainably is vital.It is vital from the viewpoint of having an industry group such as the Seafish Wales Advisory Group engaged in the process ofdeveloping such a plan, maximising the use of limited European Maritime and Fisheries Funding available in Wales to achievegrowth.
We are aware that much work has already been undertaken on the development of an industry development strategy by Sea Fishin conjuction with industry representatives in 2014/15 in preparation for EMFF and this should be incorporated into forwardplanning for the Seafood Plan to inform a holistic supply chain approach
61
10. Appendices
Appendix 1 – Schematic of the Seafood Supply Chain
Appendix 2 – Quarterly breakdown of landings at the top 5 Welsh ports
62
Appendix 2 - Schematic of the Welsh Seafood Supply Chain
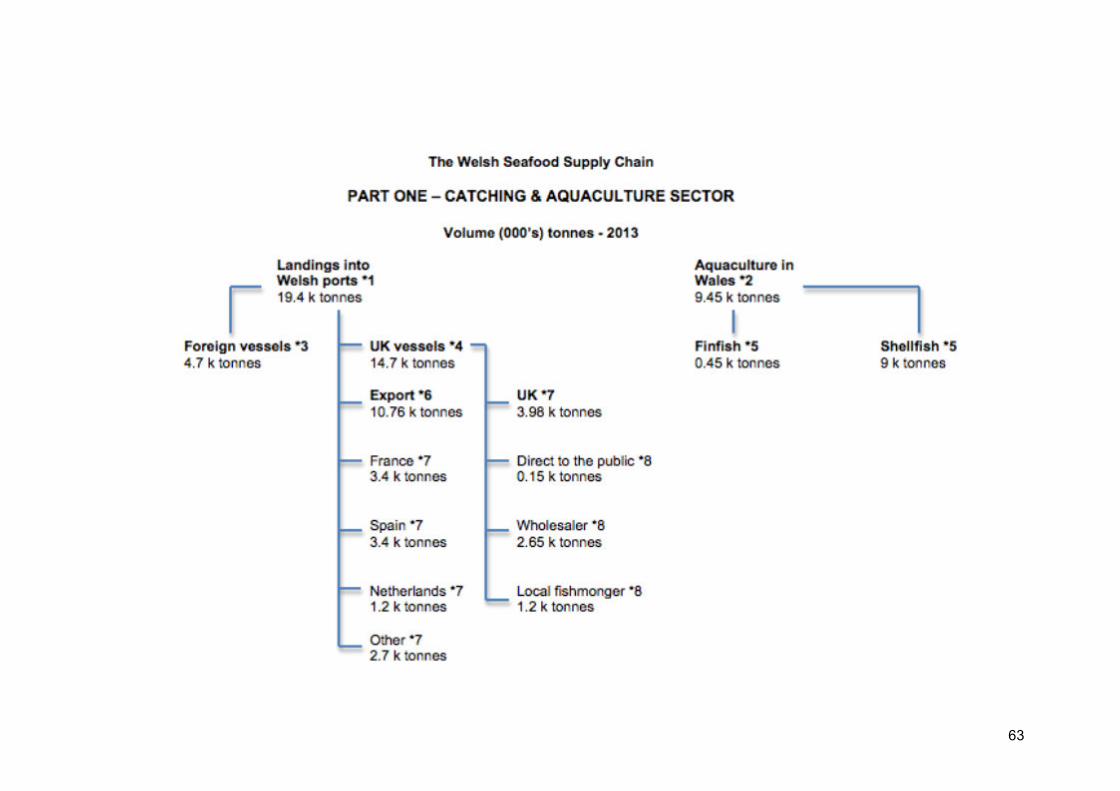
We have developed a series of schematics of the Welsh Seafood Supply Chain from a combination of secondary research data(e.g. Marine Management Organisation, etc) and original primary quantitative research undertaken by CamNesa Consulting withrespondents drawn from the Welsh seafood supply chain.
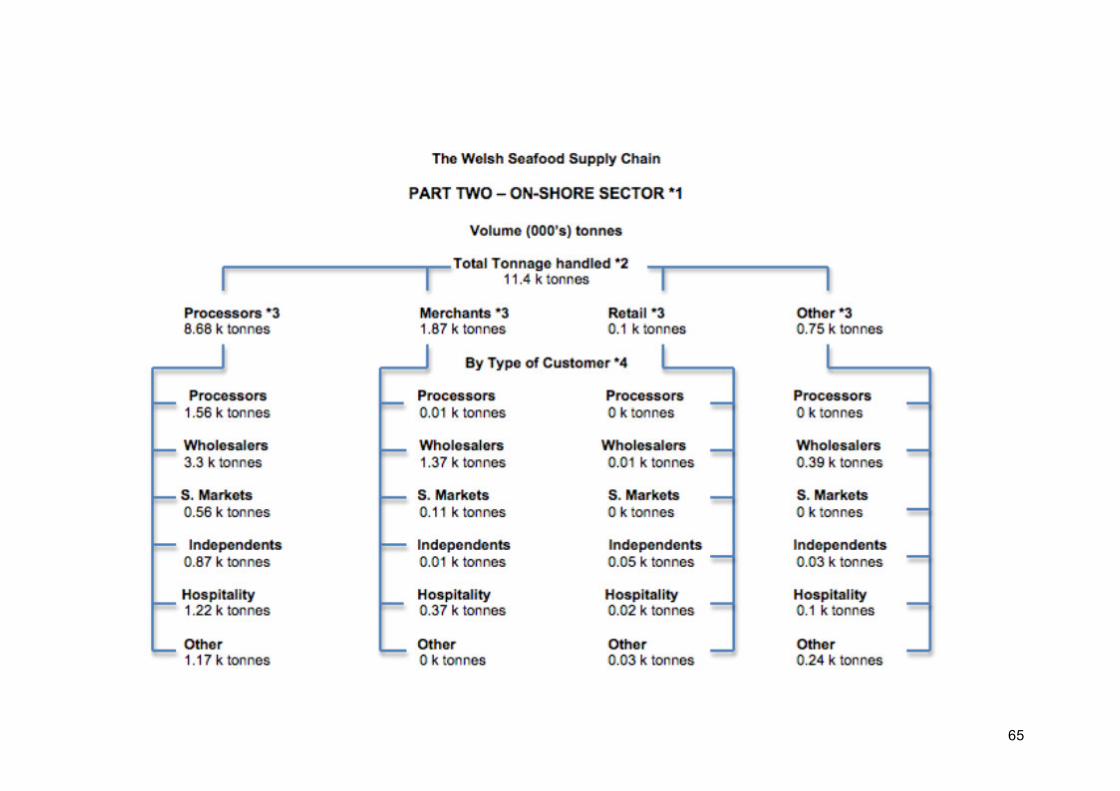
We have presented our findings in the form of two schematics, Part One focusing on the Catching & Aquaculture sector and PartTwo on the On-Shore sector. We have done this because whilst there is a link between the catching (or off-shore) sector and theWelsh aquaculture sector and the on-shore supply chain, the two sectors are really related, but separate markets rather than acohesive whole. For instance, the on-shore sector reports that some 62 percent of its supply is sourced from Wales (i.e. 7.1 ktonnes) with the balance for elsewhere. In addition, we have identified cross trading of product within the defined on-shoresegments (e.g. from processor to wholesaler, and even processor to processor).
Consequently, to provide the most accurate representation and clearest picture of the nature of the supply chain, we haveconstructed two schematics as described above.
Each schematic is presented below with a set of notes supporting each entry in each schematic and we would ask that the notesare read carefully when interpreting the data and consideration of the supply of product for processing from outside of Wales in theonshore sector.
63
64
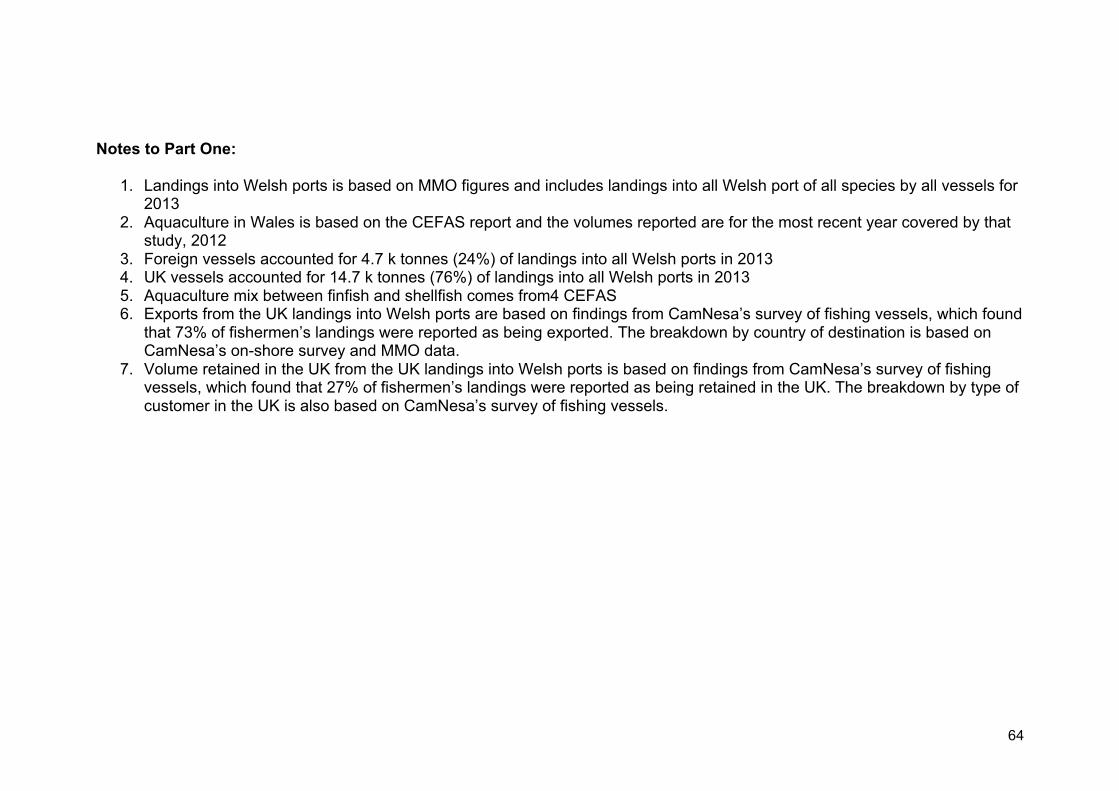
Notes to Part One:
1. Landings into Welsh ports is based on MMO figures and includes landings into all Welsh port of all species by all vessels for2013
2. Aquaculture in Wales is based on the CEFAS report and the volumes reported are for the most recent year covered by thatstudy, 2012
3. Foreign vessels accounted for 4.7 k tonnes (24%) of landings into all Welsh ports in 20134. UK vessels accounted for 14.7 k tonnes (76%) of landings into all Welsh ports in 20135. Aquaculture mix between finfish and shellfish comes from4 CEFAS6. Exports from the UK landings into Welsh ports are based on findings from CamNesa’s survey of fishing vessels, which found
that 73% of fishermen’s landings were reported as being exported. The breakdown by country of destination is based onCamNesa’s on-shore survey and MMO data.
7. Volume retained in the UK from the UK landings into Welsh ports is based on findings from CamNesa’s survey of fishingvessels, which found that 27% of fishermen’s landings were reported as being retained in the UK. The breakdown by type ofcustomer in the UK is also based on CamNesa’s survey of fishing vessels.
65
66
Notes to Part Two:
1. The source for this stage of the market mapping is based on the primary quantitative research undertaken by CamNesaConsulting in the Autumn of 2015
2. Total tonnage handled is taken from respondents’ answers. The total tonnage reported here understates the true tonnagefor the sector because a small number of potential respondents did participate in the study. Of the reported total tonnage, 62percent is sourced from Wales (i.e. 7.1 k tonnes) and 4.3 k tonnes (38%) from elsewhere
3. Tonnage handled by each type of respondents is drawn from a cross tabulation of ‘Type’ and total tonnage handled is takenfrom respondents’ answers.
4. Tonnage by type of customer is drawn from respondents’ reporting of their sales by type of customer.
67
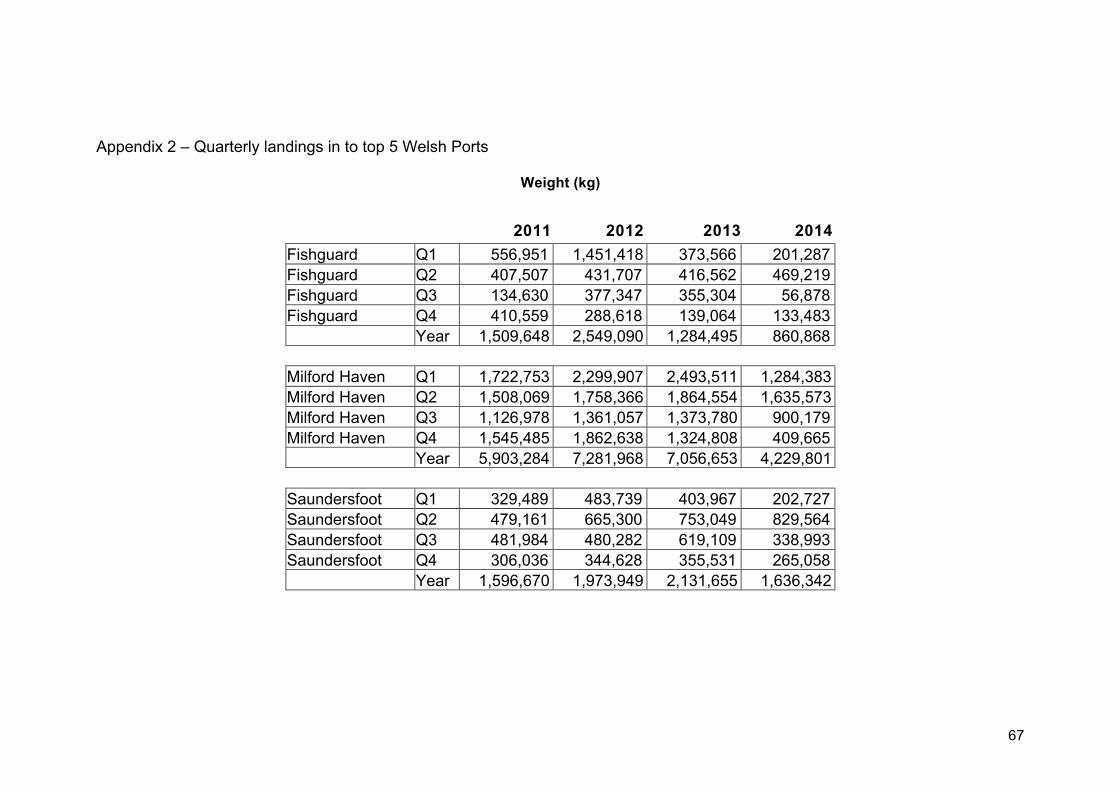
Appendix 2 – Quarterly landings in to top 5 Welsh Ports
Weight (kg)
2011 2012 2013 2014
Fishguard Q1 556,951 1,451,418 373,566 201,287Fishguard Q2 407,507 431,707 416,562 469,219Fishguard Q3 134,630 377,347 355,304 56,878Fishguard Q4 410,559 288,618 139,064 133,483
Year 1,509,648 2,549,090 1,284,495 860,868
Milford Haven Q1 1,722,753 2,299,907 2,493,511 1,284,383Milford Haven Q2 1,508,069 1,758,366 1,864,554 1,635,573Milford Haven Q3 1,126,978 1,361,057 1,373,780 900,179Milford Haven Q4 1,545,485 1,862,638 1,324,808 409,665
Year 5,903,284 7,281,968 7,056,653 4,229,801
Saundersfoot Q1 329,489 483,739 403,967 202,727Saundersfoot Q2 479,161 665,300 753,049 829,564Saundersfoot Q3 481,984 480,282 619,109 338,993Saundersfoot Q4 306,036 344,628 355,531 265,058
Year 1,596,670 1,973,949 2,131,655 1,636,342
68
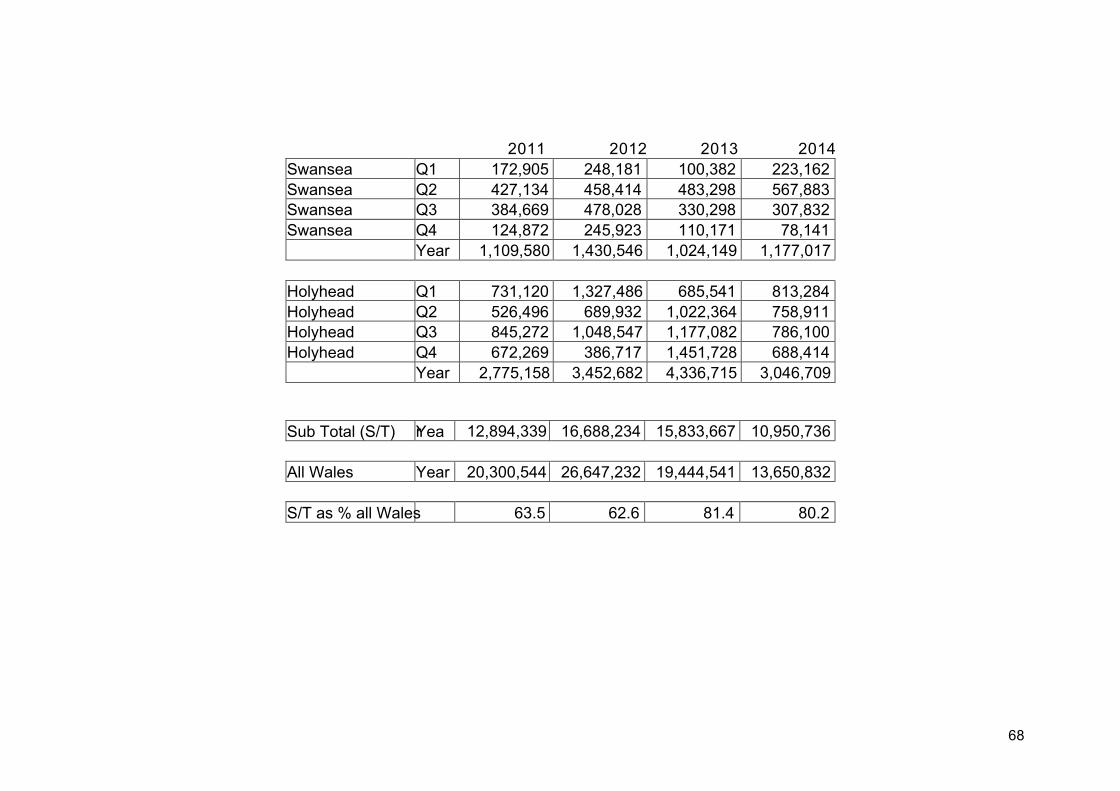
2011 2012 2013 2014Swansea Q1 172,905 248,181 100,382 223,162Swansea Q2 427,134 458,414 483,298 567,883Swansea Q3 384,669 478,028 330,298 307,832Swansea Q4 124,872 245,923 110,171 78,141
Year 1,109,580 1,430,546 1,024,149 1,177,017
Holyhead Q1 731,120 1,327,486 685,541 813,284Holyhead Q2 526,496 689,932 1,022,364 758,911Holyhead Q3 845,272 1,048,547 1,177,082 786,100Holyhead Q4 672,269 386,717 1,451,728 688,414
Year 2,775,158 3,452,682 4,336,715 3,046,709
Sub Total (S/T) Year 12,894,339 16,688,234 15,833,667 10,950,736
All Wales Year 20,300,544 26,647,232 19,444,541 13,650,832
S/T as % all Wales 63.5 62.6 81.4 80.2

69
Acknowledgments
We would like to thank key contributors to this study:
- Key Stakeholders
- Seafish Economics
- Welsh Government officials within Marine and Fisheries Division
- Marine Management Organisation
- Welsh Fishermen’s Association
- The data providers consisting of active fishers throughout Wales and respondents to the onshore survey
- Milford Haven Port Authority
70
This report has been produced by CamNesa Consulting Ltd. on behalf of Seafish Industry Authority
CamNesa Consulting
Glanwern
Llanddeiniol
Llanrhystud
Ceredigion
SY23 5AN
Disclaimer
The information contained within this report is based on a range of sources including Government and Government Agenciespubilcations and feedback from individuals and businesses operating in the Welsh seafood and fisheries sector. CamNesaconsulting accepts no responsibility for the accuracy or completeness of such information or for loss or damage caused by any usethereof. The opinions held within this report are those of the author and do not necessarily reflect or represent those of the fundingorganisations of this report.


![配布資料 190508 - Koito [小糸製作所]...当 期 (18/4~19/3) 製作グループKIグループ国内計海外計除く上海 除く上海 売 上 高 3,641 1,972 463 2,435](https://img.pdfslide.net/doc/110x75/6029d9c1ec8b6754c86f846b/efe-190508-koito-ceoe-oe-184i193-eoefffkifffeee.jpg)


