Embed Size (px)
Citation preview

Princeton University Consolidated Financial Statements June 30, 2015 and 2014

PricewaterhouseCoopers LLP, PricewaterhouseCoopers Center, 300 Madison Avenue, New York, NY 10017 T: (646) 471 3000, F: (813) 286 6000, www.pwc.com/us
Independent Auditor’s Report To the Trustees of Princeton University: We have audited the accompanying consolidated financial statements of Princeton University (the “University”), which comprise the consolidated statements of financial position as of June 30, 2015 and 2014 and the related consolidated statements of activities and consolidated statements of cash flows for the years then ended. Management’s Responsibility for the Consolidated Financial Statements Management is responsible for the preparation and fair presentation of the consolidated financial statements in accordance with accounting principles generally accepted in the United States of America; this includes the design, implementation and maintenance of internal control relevant to the preparation and fair presentation of consolidated financial statements that are free from material misstatement, whether due to fraud or error. Auditor’s Responsibility Our responsibility is to express an opinion on the consolidated financial statements based on our audits. We conducted our audits in accordance with auditing standards generally accepted in the United States of America. Those standards require that we plan and perform the audit to obtain reasonable assurance about whether the consolidated financial statements are free from material misstatement. An audit involves performing procedures to obtain audit evidence about the amounts and disclosures in the consolidated financial statements. The procedures selected depend on our judgment, including the assessment of the risks of material misstatement of the consolidated financial statements, whether due to fraud or error. In making those risk assessments, we consider internal control relevant to the University’s preparation and fair presentation of the consolidated financial statements in order to design audit procedures that are appropriate in the circumstances, but not for the purpose of expressing an opinion on the effectiveness of the University’s internal control. Accordingly, we express no such opinion. An audit also includes evaluating the appropriateness of accounting policies used and the reasonableness of significant accounting estimates made by management, as well as evaluating the overall presentation of the consolidated financial statements. We believe that the audit evidence we have obtained is sufficient and appropriate to provide a basis for our audit opinion. Opinion In our opinion, the consolidated financial statements referred to above present fairly, in all material respects, the financial position of Princeton University at June 30, 2015 and 2014, and the changes in their net assets and their cash flows for the years then ended in accordance with accounting principles generally accepted in the United States of America.
November 24, 2015

2
(dollars in thousands) 2015 2014
AssetsCash $ 11,544 $ 4,788Accounts receivable 98,816 84,014Receivables associated with investments 126,671 -Educational and mortgage loans receivable 378,230 366,435Contributions receivable 186,430 209,861Inventories and deferred charges 23,482 29,320Managed investments at market value 22,472,966 20,769,281Funds held in trust by others 154,163 161,027Other investments 685,436 670,156Property, net of accumulated depreciation 3,753,676 3,501,543
Total assets $ 27,891,414 $ 25,796,425
LiabilitiesAccounts payable $ 116,608 $ 99,564Liabilities associated with investments 308,367 192,920Deposits, advance receipts, and accrued liabilities 125,025 105,132Deposits held in custody for others 158,716 142,324Deferred revenues 39,520 39,900Liability under planned giving agreements 101,657 102,719Federal loan programs 8,454 6,671Indebtedness to third parties 3,314,444 3,231,753Accrued postretirement benefi ts 382,648 367,254
Total liabilities $ 4,555,439 $ 4,288,237
Net assetsUnrestricted $ 9,928,976 $ 8,354,141Temporarily restricted 11,535,371 11,334,911 Permanently restricted 1,871,628 1,819,136
Total net assets $ 23,335,975 $ 21,508,188
Total liabilities and net assets $ 27,891,414 $ 25,796,425
See notes to consolidated fi nancial statements.
Consolidated Statements of Financial PositionJune 30, 2015 and 2014

3
Temporarily Permanently (dollars in thousands) Unrestricted Restricted Restricted 2015 Total
Operating revenuesTuition and fees $ 336,826 - - $ 336,826Less scholarships and fellowships (224,766) - - (224,766) Net tuition and fees 112,060 - - 112,060
Government grants and contracts 274,973 - - 274,973Private gifts, grants, and contracts 88,023 - - 88,023Auxiliary sales and services 86,599 - - 86,599Other sources 178,281 - - 178,281Investment earnings distributed 271,793 $ 609,346 - 881,139
Operating revenues 1,011,729 609,346 - 1,621,075Net assets released from restrictions 613,214 (613,214) - -
Total operating revenues 1,624,943 (3,868) - 1,621,075Operating expensesEducational and general: Academic departments and programs 677,927 - - 677,927 Academic support 102,014 - - 102,014 Student services 109,131 - - 109,131 Library 88,930 - - 88,930 General administration and institutional support 165,147 - - 165,147 Other student aid 55,322 - - 55,322 Plasma Physics Laboratory 119,488 - - 119,488
Total educational and general 1,317,959 - - 1,317,959
Auxiliary activities 79,709 - - 79,709Interest on indebtedness 143,952 - - 143,952
Total operating expenses 1,541,620 - - 1,541,620 Results of operations 83,323 (3,868) - 79,455
Nonoperating activitiesAdjustments to planned giving agreements - (18,549) - (18,549)Decrease in value of assets held in trust by others - (4,686) $ (2,179) (6,865)Private gifts, noncurrent 62,763 13,674 65,826 142,263Net realized and unrealized appreciation on investments 1,697,880 821,251 - 2,519,131Distribution of investment earnings (271,793) (609,346) - (881,139)Reclassifi cations, transfers, and other nonoperating 2,662 1,984 (11,155) (6,509)
Increase from nonoperating activities 1,491,512 204,328 52,492 1,748,332
Increase in net assets 1,574,835 200,460 52,492 1,827,787 Net assets at the beginning of the year 8,354,141 11,334,911 1,819,136 21,508,188
Net assets at the end of the year $ 9,928,976 $ 11,535,371 $ 1,871,628 $23,335,975
See notes to consolidated fi nancial statements.
Consolidated Statements of ActivitiesYear ended June 30, 2015

4
Temporarily Permanently (dollars in thousands) Unrestricted Restricted Restricted 2014 Total
Operating revenuesTuition and fees $ 311,426 - - $ 311,426Less scholarships and fellowships (203,586) - - (203,586) Net tuition and fees 107,840 - - 107,840
Government grants and contracts 272,280 - - 272,280Private gifts, grants, and contracts 83,873 - - 83,873Auxiliary sales and services 101,378 - - 101,378Other sources 160,015 - - 160,015Investment earnings distributed 334,944 $ 505,937 - 840,881
Operating revenues 1,060,330 505,937 - 1,566,267Net assets released from restrictions 536,806 (536,806) - -
Total operating revenues 1,597,136 (30,869) - 1,566,267Operating expensesEducational and general: Academic departments and programs 669,040 - - 669,040 Academic support 91,417 - - 91,417 Student services 124,125 - - 124,125 Library 75,592 - - 75,592 General administration and institutional support 143,331 - - 143,331 Other student aid 37,850 - - 37,850 Plasma Physics Laboratory 98,323 - - 98,323
Total educational and general 1,239,678 - - 1,239,678
Auxiliary activities 130,123 - - 130,123Interest on indebtedness 125,429 - - 125,429
Total operating expenses 1,495,230 - - 1,495,230 Results of operations 101,906 (30,869) - 71,037
Nonoperating activitiesAdjustments to planned giving agreements - 7,653 $ 4,096 11,749Increase in value of assets held in trust by others - - 18,436 18,436Private gifts, noncurrent - 78,778 30,325 109,103Net realized and unrealized appreciation on investments 1,326,542 2,068,886 - 3,395,428Distribution of investment earnings (334,944) (505,937) - (840,881)
Increase from nonoperating activities 991,598 1,649,380 52,857 2,693,835
Increase in net assets 1,093,504 1,618,511 52,857 2,764,872 Net assets at the beginning of the year 7,260,637 9,716,400 1,766,279 18,743,316
Net assets at the end of the year $ 8,354,141 $ 11,334,911 $ 1,819,136 $ 21,508,188
See notes to consolidated fi nancial statements.
Consolidated Statements of ActivitiesYear ended June 30, 2014

5
(dollars in thousands) 2015 2014
Cash fl ows from operating activitiesChange in net assets $ 1,827,787 $ 2,764,872Adjustments to reconcile change in net assets to net cash used by operating activities: Depreciation expense 138,124 127,040 Amortization of bond issuance costs and premiums (6,495) (5,100) Property gifts-in-kind (2,982) (1,384) Adjustments to planned giving agreements 18,554 (11,749) Net realized and unrealized appreciation on investments (2,373,809) (3,216,397) Loss on disposal of fi xed assets 2,229 3,046 Decrease (increase) in value of assets held in trust by others 6,864 (18,436) Contributions received for long-term investment (65,826) (28,941) Changes in operating assets and liabilities: Receivables (3,166) 49,805 Inventory and deferred charges 5,838 (6,757) Accounts payable 995 (22,298) Deposits, advance receipts, and accrued liabilities 19,893 (8,252) Deposits held in custody for others 16,392 23,359 Deferred revenue (380) (344) Accrued postretirement benefi ts 15,394 72,444
Net cash used by operating activities (400,588) (279,092)
Cash fl ows from investing activities Purchases of property, plant, and equipment (379,077) (409,429) Proceeds from disposal of property, plant, and equipment 5,622 5,523 Purchases of investments (13,143,769) (4,067,703) Proceeds from maturities/sales of investments 13,787,389 4,502,638
Net cash provided by investing activities 270,165 31,029
Cash fl ows from fi nancing activities Issuance of indebtedness to third parties, net of drawdowns 336,817 265,255 Payment of debt principal (247,631) (63,969) Contributions received for long-term investment 65,826 30,325 Transactions on planned giving agreements (19,616) 17,729 Net additions under federal loan programs 1,783 62
Net cash provided by fi nancing activities 137,179 249,402
Net increase in cash 6,756 1,339Cash at the beginning of the year 4,788 3,449
Cash at the end of the year $ 11,544 $ 4,788
Supplemental disclosures Interest paid $ 147,717 $ 141,203
See notes to consolidated fi nancial statements.
Consolidated Statements of Cash FlowsYears ended June 30, 2015 and 2014

6
1. N AT U R E O F O P E R AT I O N S
Princeton University (the “University”) is a privately endowed, nonsectarian institution of higher learning. When originally chartered in 1746 as the College of New Jersey, it became the fourth college in British North America. It was renamed Princeton University in 1896. First located in Elizabeth, and briefl y in Newark, the school moved to Princeton in 1756.
The student body numbers approximately 5,275 undergraduates and 2,670 graduate students in more than 90 departments and programs. The University offers instruction in the liberal arts and sciences and in professional programs of the School of Architecture, the School of Engineering and Applied Science, and the Woodrow Wilson School of Public and International Affairs. The faculty numbers approximately 1,180, including visitors and part-time appointments.
2 . S U M M A R Y O F S I G N I F I C A N T AC C O U N T I N G P O L I C I E S
The consolidated fi nancial statements of Princeton University (now legally known as “The Trustees of Princeton University”) are prepared on the accrual basis and include the accounts of its wholly owned subsidiaries, foundation, and investments controlled by the University. Financial information conforms to the statements of accounting principles of the Financial Accounting Standards Board (FASB) and to the American Institute of Certifi ed Public Accountants Audit and Accounting Guide for Not-for-Profit Entities. Relevant pronouncements include FASB Accounting Standards Codifi cation (ASC) 958-310, Not-for-Profit Entities—Receivables, and ASC 958-205, Not-for-Profit Entities—Presentation of Financial Statements.
Unconditional promises to give are recognized as revenues in the year made, not in the yearin which the cash is received. The amounts are discounted based on timing of expected collections.Amounts received from donors to planned giving programs are shown in part as a liability for the present value of annuity payments to the donor; the balance is shown as a gift of either temporarily or permanently restricted net assets.
External fi nancial statements of not-for-profi t organizations require the preparation of a statement of fi nancial position, a statement of activities, and a statement of cash fl ows. The classifi cation of the organization’s net assets and its revenues and expenses into three categories according to the existence or absence of donor-imposed restrictions—permanently restricted, temporarily restricted, or unrestricted—is also required. Changes, including reclassifi cation and transfers, in each category are refl ected in the statement of activities, certain of which are further categorized as nonoperating. Such nonoperating activities primarily refl ect transactions of a long-term investment or capital nature, including contributions receivable in future periods, contributions subject to donor-imposed restrictions, and gains and losses on investments in excess of the University’s spending rule.
Other signifi cant accounting policies are described elsewhere in these notes.The preparation of the University’s fi nancial statements in conformity with generally accepted
accounting principles (GAAP) requires management to make estimates and assumptions that affect the reported amounts of assets and liabilities and disclosure of contingent assets and liabilities at the dates of the consolidated statements of fi nancial position, and the reported amounts of revenue and expense included in the consolidated statements of activities. Actual results could differ from such estimates.
In May 2015, the Financial Accounting Standards Board issued Accounting Standard Update (ASU) 2015-07, Fair Value Measurement (Topic 820), Disclosure for Investments in Certain Entities That Calculated Net Asset Value per Share (or its Equivalent). The ASU removes the requirement to categorize within the fair value hierarchy all investments for which fair value
Notes to Consolidated Financial StatementsYears ended June 30, 2015 and 2014

7
is measured using the practical expedient. The ASU further removes the requirement to make certain disclosures for all investments that are eligible to be measured at fair value using the practical expedient. This ASU is effective for annual periods beginning after December 15, 2015. The University is evaluating the disclosure, and it is not expected to have a material impact on the University fi nancial statements.
Certain prior-year balances have been reclassifi ed to conform to the current year presentation.
3 . I N V E S T M E N T S
Managed InvestmentsAll managed investments are reported at fair value. The fair value of marketable equity, debt, and certain derivative securities (which includes both domestic and foreign issues) is generally based upon a combination of published current market prices and exchange rates. The fair value of restricted securities and other investments for which published market prices are not available is based on estimated values using discounted cash fl ow analysis and other industry standard methodologies. Where applicable, independent appraisers and engineers assist in the valuation. The fair value of limited partnerships and similar investment vehicles is generally estimated by external investment managers, including general partners or valuation committees. These valuations necessarily involve assumptions and methods that are reviewed, evaluated, and adjusted, if necessary, by the University. Changes in assumptions could have a signifi cant effect on the fair values of these investments. Actual results could differ from these estimates and could have a material impact on the fi nancial statements. These investments are generally less liquid than other investments, and the values reported may differ from the values that would have been reported had a ready market for these securities existed. Securities transactions are reported on a trade-date basis.
A summary of managed investments by asset category at fair value at June 30, 2015 and 2014, is presented below. The managed investment categories are presented on a “manager-mandate” basis, that is, all of the assets and market value of the underlying funds and accounts are included in the asset class which is the primary focus of the fund or account. (Many funds and accounts have contractual fl exibility to invest across more than one asset class.)
(dollars in millions) 2015 2014Managed investments: Domestic equity $ 2,191.8 $ 1,815.7 International equity 3,471.6 3,034.6 Independent return 5,535.1 5,178.2 Private equity 6,844.2 6,326.5 Real assets 3,290.5 3,499.7 Fixed income 752.5 81.5 Cash and other 387.3 833.1
Gross managed investments $ 22,473.0 $ 20,769.3Receivables (liabilities) associated with investments —net (181.7) (192.9)
Net managed investments $ 22,291.3 $ 20,576.4
The Princeton University Investment Company (PRINCO) manages investments for a foundation that the University controls, the Stanley J. Seeger Hellenic Fund, and deposits held
Notes to Consolidated Financial Statements(Continued)
8
in custody for others. The investment balances managed by PRINCO for these entities as of June 30, included in the University’s consolidated fi nancial statements, are as follows:
(dollars in millions) 2015 2014Princeton University $ 22,270.8 $ 20,586.7Stanley J. Seeger Hellenic Fund 43.5 40.3 Deposits held in custody for others 158.7 142.3
Gross managed investments $ 22,473.0 $ 20,769.3
The composition of net investment return from managed and other investments for the years ended June 30 was as follows:
(dollars in thousands) 2015 2014Net realized and unrealized gains $ 2,373,809 $ 3,216,397Interest, dividends, and other income 145,322 179,031
Total $ 2,519,131 $ 3,395,428
Princeton University investments together with the Stanley J. Seeger Hellenic Fund and deposits held in custody for others are invested in a single unitized pool. The market value of each unit was $10,902.38 and $10,099.61 at June 30, 2015 and 2014, respectively. The average value of a unit during the years ending June 30, 2015 and 2014, was $10,264.36 and $9,309.36, respectively.
The average invested market balance in the unitized pool during the years ending June 30, 2015 and 2014, was $20.899 billion and $18.856 billion, respectively.
The University follows a spending rule for its unitized investments, including funds functioning as endowment, that provides for regular increases in spending while preserving the long-term purchasing power of the endowment. Earnings available for spending are shown in operating revenue, and the balance is shown as nonoperating revenue. Amounts distributed per unit under that rule were $427.78 and $407.41 for fi scal years 2015 and 2014, respectively.
The University invests in various investment instruments. Investment securities, in general, are exposed to various risks, such as interest rate, credit, and overall market volatility. Due to the level of risk associated with certain investment securities, it is reasonably possible that changes in the values of investment securities will occur in the near term and that such changes could materially affect the amounts reported in the fi nancial statements.
As part of its investment strategy, the University enters into transactions utilizing a variety of fi nancial instruments and strategies, including futures, swaps, options, short sales, and forward foreign currency contracts. These fi nancial instruments and strategies allow the University to fi ne-tune the asset allocation of the investment portfolio. In all cases except forward foreign currency exchange and swap contracts, these instruments are traded through securities and commodities exchanges. The forward foreign currency and swap contracts are executed with creditworthy banks and brokerage fi rms. These fi nancial instruments are subject to an enforceable master netting arrangement or similar agreement, and are presented on a net basis on the consolidated statement of fi nancial position. In January 2013, FASB issued Accounting Standards Update (ASU) 2013-01, Balance Sheet (Topic 210): Clarifying the Scope of Disclosures about Offsetting Assets and Liabilities, which clarifi es the scope of ASU 2011-11 as it applies to derivatives accounted for in accordance with Topic 815, Derivatives and Hedging, requiring additional disclosures for derivative portfolios including disclosing the gross amounts of recognized fi nancial assets and fi nancial liabilities that are offset in the balance sheet and subject to an enforceable master netting arrangement. The University adopted the standard in fi scal year
Notes to Consolidated Financial Statements(Continued)

9
2014 and disclosures pertaining to this topic have been included below.At June 30, 2015, the aggregate notional value of futures contracts was $250.2 million
held with one counterparty, with an aggregate unrealized gain of $2.0 million on a gross basis. At June 30, 2015, the aggregate notional value of swaps was $557.0 million held with two counterparties, with an aggregate unrealized gain of $1.7 million and unrealized loss of $31.6 millions on a gross basis; and $11.3 million has been pledged as collateral. No other contracts were held during the year ended June 30, 2015. At June 30, 2014, the aggregate notional value of futures contracts was $303.5 million held with one counterparty, with an aggregate unrealized gain of $0.4 million and unrealized loss of $4.8 million on a gross basis. At June 30, 2014, the aggregate notional value of swaps was $331.0 million held with two counterparties, with an aggregate unrealized gain of $31.2 million and unrealized loss of $4.2 million on a gross basis; and $16.2 million had been pledged as collateral. These instruments, when recognized, are recorded at fair value and are included as either an asset or a liability depending on the rights or obligations of the contract. Realized gains or losses are recorded at the time the contract is closed.
Funds Held in Trust by OthersThe University is the income benefi ciary of various trusts that are held and controlled by independent trustees. In addition, the University is the income benefi ciary of entities that qualify as supporting organizations under Section 509(a)(3) of the U.S. Internal Revenue Code. Funds held in trust by others are recognized at the estimated fair value of the assets or the present value of the future cash fl ows when the irrevocable trust is established or the University is notifi ed of its existence. Funds held in trust by others, stated at fair value, amounted to $154.2 million in 2015 and $161.0 million in 2014.
Other InvestmentsOther investments include working capital (consisting primarily of U.S. Treasury bonds), a small number of funds that must be separately invested due to donor or legal restrictions, planned giving investments, proceeds from debt, and local real estate holdings expected to be liquidated strategically over several years. A summary of other investments at fair value at June 30, 2015 and 2014, is as follows:
(dollars in millions) 2015 2014Working capital $ 378.7 $ 342.7Planned giving investments 178.4 198.8Proceeds from debt 75.4 81.5Strategic real estate investments 47.2 46.1Other 5.7 1.0
Total $ 685.4 $670.1
4 . FA I R VA L U E M E A S U R E M E N T S
ASC 820, Fair Value Measurements and Disclosures, defi nes fair value, establishes a framework for measuring fair value in GAAP, and expands disclosure about fair value measurements. Fair value is defi ned as the price that would be received to sell an asset or paid to transfer a liability (exit price) in an orderly transaction between market participants at the measurement date. Fair value should be based on assumptions that market participants would use when pricing an asset or liability, including assumptions about risk and the risks inherent in valuation techniques and the inputs to valuations. Fair value measurements assume that the transaction occurs in the
Notes to Consolidated Financial Statements(Continued)

10
principal market for the asset or liability (the market with the most volume and activity for theasset or liability from the perspective of the reporting entity), or in the absence of a principal market, the most advantageous market for the asset or liability (the market in which the reporting entity would be able to maximize the amount received or minimize the amount paid). The University applies fair value measurements to certain assets and liabilities, including the University’s managed investments, other investments, and funds held in trust by others, in accordance with the requirements described above.
The University maximizes the use of observable inputs and minimizes the use of unobservable inputs when measuring fair value. Fair value is based on actively quoted market prices, if available. In the absence of actively quoted market prices, price information from external sources, including broker quotes and industry publications, is used. If pricing information from external sources is not available, or if observable pricing is not indicative of fair value, judgment is required to develop the estimates of fair value using discounted cash fl ow and other income valuation approaches.
The University utilizes the following fair value hierarchy, which prioritizes, into three broad levels, the inputs to valuation techniques used to measure fair value:Level 1: Quoted prices (unadjusted) in active markets for identical assets and liabilities that the University has the ability to access at the measurement date. Instruments categorized in Level 1 primarily consist of a broadly traded range of equity and debt securities.Level 2: Inputs other than quoted prices included within Level 1 that are either directly or indirectly observable for the asset or liability, including quoted prices for similar assets or liabilities in active markets, quoted prices for identical or similar assets or liabilities in inactive markets, inputs other than quoted prices that are observable for the asset or liability, and inputs that are derived from observable market data by correlation or other means. Instruments categorized in Level 2 consist primarily of investments in certain entities that calculate net asset value per share (or its equivalent) and can be redeemed in the near term.Level 3: Unobservable inputs for the asset or liability, including situations where there is little, if any, market activity for the asset or liability. Instruments categorized in Level 3 consist primarily of limited partnership interests and other similar investment vehicles.
The fair value hierarchy gives the highest priority to quoted prices in active markets (Level 1) and the lowest priority to unobservable data (Level 3). In some cases, the inputs used to measure fair value might fall in different levels of the fair value hierarchy. The lowest level input that is signifi cant to a fair value measurement in its entirety determines the applicable level in the fair value hierarchy. Assessing the signifi cance of a particular input to the fair value measurement in its entirety requires judgment, considering factors specifi c to the asset or liability. Fair value measurements are categorized as Level 3 when a signifi cant amount of price or other inputs that are considered to be unobservable are used in their valuations. Where the University has the ability to redeem its investment with the investee at net asset value per share (or its equivalent) at the measurement date, such investments have been categorized under Level 2 fair value measurements. Certain of these investments may be subject to modest holdback provisions to cover audit and other potential expenses or adjustments in the event of a complete withdrawal.
The University has various processes and controls in place to ensure investment fair value is reasonable and performs due diligence procedures on its investments including an assessment of applicable accounting policies, a review of the valuation procedures employed, and consideration of redemption features and price transparency. The University holds direct real estate investments categorized as Level 3. Valuation for material directly held real estate investments is determined from periodic valuations prepared by independent appraisers or broker opinions.
Notes to Consolidated Financial Statements(Continued)

11
The following tables present the University’s assets that are measured at fair value for each hierarchy level, at June 30, 2015 and 2014.
Fair Value Measurements at Reporting Date Using Quoted Prices in Active Signifi cant Other Signifi cant(dollars in millions) Markets for Identical Observable Inputs Unobservable 2015 Total Assets (Level 1) (Level 2) Inputs (Level 3)Assets at fair valueManaged investments (gross): Domestic equity $ 2,191.8 $ (83.6) $ 87.9 $ 2,187.5 International equity 3,471.6 695.8 663.60 2,112.2 Independent return 5,535.1 - 787.6 4,747.5 Private equity 6,844.2 0.7 - 6,843.5 Real assets 3,290.5 123.8 243.3 2,923.4 Fixed income 752.5 752.5 - - Cash and other 387.3 479.6 (92.3) -Total managed investments (gross) 22,473.0 1,968.8 1,690.1 18,814.1Funds held in trust by others 154.2 - - 154.2Other investments 685.4 461.1 - 224.3
Total $ 23,312.6 $ 2,429.9 $ 1,690.1 $ 19,192.6
2014 Assets at fair valueManaged investments (gross): Domestic equity $ 1,815.7 $ (58.3) $ 254.4 $ 1,619.6 International equity 3,034.6 499.1 730.8 1,804.7 Independent return 5,178.2 - 529.3 4,648.9 Private equity 6,326.5 - - 6,326.5 Real assets 3,499.7 87.0 149.4 3,263.3 Fixed income 81.5 81.5 - - Cash and other 833.1 1,074.1 (241.4) 0.4Total managed investments (gross) 20,769.3 1,683.4 1,422.5 17,663.4Funds held in trust by others 161.0 - - 161.0Other investments 670.2 424.2 - 246.0
Total $ 21,600.5 $ 2,107.6 $ 1,422.5 $ 18,070.4
Assets and liabilities of a majority-owned investment fund have been consolidated for reporting purposes at June 30, 2015 and 2014. Managed investments, specifi cally the independent return asset class, includes consolidated investment fund assets of $962.5 million and $948.5 million at June 30, 2015 and 2014, respectively, and liabilities associated with investments includes consolidated investment fund liabilities of $185.7 million and $192.9 million at June 30, 2015 and 2014, respectively.
Notes to Consolidated Financial Statements(Continued)

12
The following tables present the net change in the assets measured at fair value on a recurring basis and included in the Level 3 fair value category for the years ended June 30, 2015 and 2014:
Fair Value Measurements Using Signifi cant Unobservable Inputs (Level 3) Total gains or losses included in Transfers Transfers June 30, changes in Sales and into out of June 30,(dollars in millions) 2014 net assets Purchases settlements Level 3 Level 3 2015Assets at fair valueManaged investments (gross): Domestic equity $ 1,619.6 $ 600.0 $ 73.1 $ (105.2) - - $ 2,187.5 International equity 1,804.7 273.0 1,328.5 (1,294.0) - - 2,112.2 Independent return 4,648.9 189.0 217.6 (168.3) - $ (139.7) 4,747.5 Private equity 6,326.5 1,248.1 814.4 (1,545.5) - - 6,843.5 Real assets 3,263.3 69.5 500.4 (909.8) - - 2,923.4 Fixed income - - - - - - - Cash and other 0.4 0.5 - (0.9) - - -Funds held in trust by others 161.0 (7.4) 2.1 (1.5) - - 154.2Other investments 246.0 (21.8) 5.5 (5.4) - - 224.3
Total Level 3 investments $ 18,070.4 $ 2,350.9 $ 2,941.6 $ (4,030.6) - $ (139.7) $ 19,192.6
Fair Value Measurements Using Signifi cant Unobservable Inputs (Level 3) Total gains or losses included in Transfers Transfers June 30, changes in Sales and into out of June 30,(dollars in millions) 2013 net assets Purchases settlements Level 3 Level 3 2014Assets at fair valueManaged investments (gross): Domestic equity $ 1,188.4 $ 335.6 $ 266.9 $ (171.3) - - $ 1,619.6 International equity 1,298.0 406.2 298.6 (229.3) $ 31.2 - 1,804.7 Independent return 4,090.8 461.4 455.4 (358.7) - - 4,648.9 Private equity 5,592.8 1,419.0 654.4 (1,339.7) - - 6,326.5 Real assets 3,128.6 326.2 294.6 (486.1) - - 3,263.3 Fixed income 7.8 0.1 - (7.9) - - - Cash and other 0.5 (0.1) - - - - 0.4Funds held in trust by others 130.4 17.9 - - 12.7 - 161.0Other investments 238.0 24.0 2.3 (8.8) 2.6 $ (12.1) 246.0
Total Level 3 investments $ 15,675.3 $ 2,990.3 $ 1,972.2 $ (2,601.8) $ 46.5 $ (12.1) $ 18,070.4
The University assesses the valuation hierarchy for each asset or liability measured on an annual basis. From time to time, assets or liabilities will be transferred within hierarchy levels as a result of changes in valuation methodologies, liquidity, and/or redemption terms. In the year ended June 30, 2015, four managed investments transferred from Level 3 to Level 2. In the year ended June 30, 2014, one managed investment transferred from Level 2 to Level 3. The University’s policy is to recognize transfers at the beginning of the reporting period.
Realized gains of $1,836.3 million and $1,202.6 million related to Level 3 investments and unrealized gains of $514.6 million and $1,787.7 million related to Level 3 investments are included in net realized and unrealized appreciation on investments in the consolidated statements of activities for the years ended June 30, 2015 and 2014, respectively.
Notes to Consolidated Financial Statements(Continued)
13
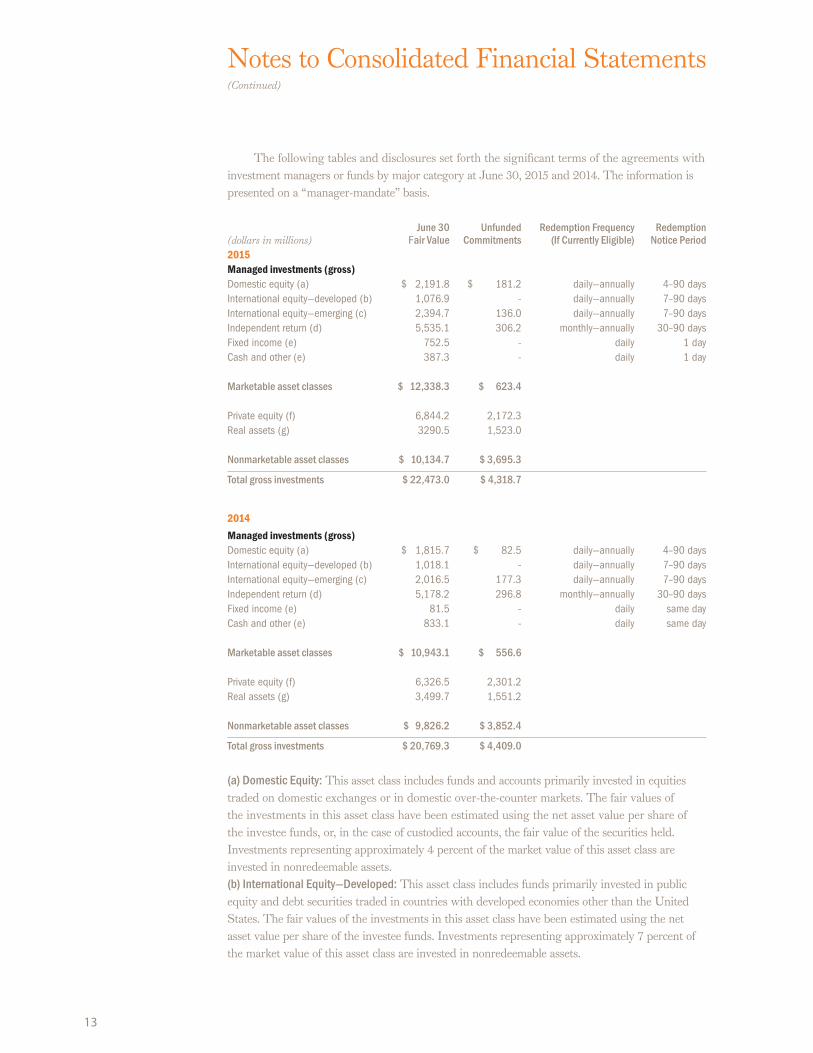
The following tables and disclosures set forth the signifi cant terms of the agreements with investment managers or funds by major category at June 30, 2015 and 2014. The information is presented on a “manager-mandate” basis.
June 30 Unfunded Redemption Frequency Redemption(dollars in millions) Fair Value Commitments (If Currently Eligible) Notice Period2015Managed investments (gross)Domestic equity (a) $ 2,191.8 $ 181.2 daily—annually 4–90 daysInternational equity—developed (b) 1,076.9 - daily—annually 7–90 daysInternational equity—emerging (c) 2,394.7 136.0 daily—annually 7–90 daysIndependent return (d) 5,535.1 306.2 monthly—annually 30–90 daysFixed income (e) 752.5 - daily 1 dayCash and other (e) 387.3 - daily 1 day
Marketable asset classes $ 12,338.3 $ 623.4
Private equity (f) 6,844.2 2,172.3Real assets (g) 3290.5 1,523.0
Nonmarketable asset classes $ 10,134.7 $ 3,695.3
Total gross investments $ 22,473.0 $ 4,318.7
2014Managed investments (gross)Domestic equity (a) $ 1,815.7 $ 82.5 daily—annually 4–90 daysInternational equity—developed (b) 1,018.1 - daily—annually 7–90 daysInternational equity—emerging (c) 2,016.5 177.3 daily—annually 7–90 daysIndependent return (d) 5,178.2 296.8 monthly—annually 30–90 daysFixed income (e) 81.5 - daily same dayCash and other (e) 833.1 - daily same day
Marketable asset classes $ 10,943.1 $ 556.6
Private equity (f) 6,326.5 2,301.2Real assets (g) 3,499.7 1,551.2
Nonmarketable asset classes $ 9,826.2 $ 3,852.4
Total gross investments $ 20,769.3 $ 4,409.0
(a) Domestic Equity: This asset class includes funds and accounts primarily invested in equities traded on domestic exchanges or in domestic over-the-counter markets. The fair values of the investments in this asset class have been estimated using the net asset value per share of the investee funds, or, in the case of custodied accounts, the fair value of the securities held. Investments representing approximately 4 percent of the market value of this asset class are invested in nonredeemable assets.(b) International Equity—Developed: This asset class includes funds primarily invested in public equity and debt securities traded in countries with developed economies other than the United States. The fair values of the investments in this asset class have been estimated using the net asset value per share of the investee funds. Investments representing approximately 7 percent of the market value of this asset class are invested in nonredeemable assets.
Notes to Consolidated Financial Statements(Continued)

14
(c) International Equity—Emerging: This asset class includes funds primarily invested in public equity and debt securities traded in countries with emerging economies. The fair values of the investments in this asset class have been estimated using the net asset value per share of the investee funds or, in the case of custodied accounts, the fair value of the securities held, at prevailing exchange rates. Investments representing approximately 5 percent of the market value of this asset class are invested in nonredeemable assets.(d) Independent Return: This asset class includes funds invested in equity and debt securities and fi nancial instruments such as options, swaps, futures, and other derivatives. Funds in this asset class may hold both long and short positions in any of these instruments and pursue a variety of investment strategies based upon the fund’s investment mandate and the current opportunity set. In general terms, approximately 33 percent of market value is invested in funds principally focused on long/short equity investments, 24 percent is invested in event-driven/arbitrage strategies, and 43 percent is invested in funds that opportunistically engage in both strategies. Investments representing approximately 20 percent of the market value of this asset class are invested in nonredeemable assets.(e) Fixed Income and Cash: On a combined basis, these asset classes include primarily U.S. government and U.S. government–guaranteed securities held in separate accounts at the custodial bank. Virtually all of the investments in these asset classes can be liquidated on a daily basis.(f) Private Equity: This asset class includes funds invested primarily in buyouts or venture capital. The fair values of the investments in this asset class have generally been estimated using partners’ capital statements issued by the funds, which refl ect the University’s ownership interest. Generally, investments in this asset class are not redeemable. Distributions from investee funds in the portfolio are received as the underlying investments of the funds are liquidated.(g) Real Assets: This asset class includes funds invested primarily in real estate, energy, and timber. The fair values of the investments in this asset class have been estimated using partners’ capital statements issued by the funds, which refl ect the University’s ownership interest. Generally, investments in this asset class are not redeemable. However, a small portion, $196.2 million at June 30, 2015, and $194.6 million at June 30, 2014, was invested in redeemable funds. More broadly, distributions from investee funds are received as the underlying investments of the funds are liquidated.
Investments in the marketable asset classes are generally redeemable, made in entities that allow the University to request withdrawals in specifi ed circumstances. However, approximately $1.3 billion of the marketable asset classes are invested in “nonredeemable assets,” which are not eligible for redemption by the University. Nonredeemable assets are specifi c investments within a fund designated by the fund manager as ineligible for withdrawal. Due to the illiquid nature of nonredeemable assets, it is impossible for the University to predict when these assets will liquidate and the proceeds distributed to investors.
In addition to nonredeemable assets, the University may be limited in its ability to effect a withdrawal if a fund manager invokes a “gate” provision restricting redemptions from its fund. Gates are generally triggered when aggregate fund withdrawal requests exceed a contractually predetermined threshold. No withdrawal requests were impacted by a gate in the year ended June 30, 2015.
Notes to Consolidated Financial Statements(Continued)

15
The University is obligated under certain agreements to fund capital calls periodically up to specifi ed commitment amounts. At June 30, 2015, the University had unfunded commitments of $4.3 billion. Such commitments are generally called over periods of up to 10 years and contain fi xed expiration dates or other termination clauses.
5 . E N D O W M E N T
The University’s endowment consists of approximately 4,300 individual funds established for a variety of purposes. The endowment includes both donor-restricted endowment funds and funds designated by the University to function as endowments. As required by GAAP, net assets associated with endowment funds, including funds designated by the University to function as endowments, are classifi ed and reported based on the existence or absence of donor-imposed restrictions.
ASC 958-205-45-28, Not-for-Profit Entities—Presentation of Financial Statements—Other Presentation Matters—Classification of Donor-Restricted Endowment Funds Subject to the Uniform Prudent Management of Institutional Funds Act, provides guidance on the net asset classifi cation of donor-restricted endowment funds for a not-for-profi t organization that is subject to an enacted version of the Uniform Prudent Management of Institutional Funds Act of 2006 (UPMIFA), which was enacted in the state of New Jersey in June 2009.
Interpretation of relevant law —The University interprets the UPMIFA as requiring the preservation of the fair value at the original gift date of the donor-restricted endowment funds, absent explicit donor stipulations to the contrary. As a result of this interpretation, the University classifi es as permanently restricted net assets: (a) the original value of gifts donated to the permanent endowment, (b) the original value of subsequent gifts to the permanent endowment, and (c) accumulations to the permanent endowment made in accordance with the direction of the applicable donor gift instrument at the time the accumulation is added to the fund. The remaining portion of the donor-restricted net assets is classifi ed as temporarily restricted net assets until those amounts are appropriated for expenditure by the University in a manner consistent with the standard of prudence prescribed by UPMIFA. The University considers the following factors in making a determination to appropriate or accumulate donor-restricted endowment funds:
(1) The duration and preservation of the fund(2) The purposes of the University and the donor-restricted endowment fund(3) General economic conditions(4) The possible effect of infl ation and defl ation(5) The expected total return from income and the appreciation of investments(6) Other resources of the University(7) The investment policies of the University
Notes to Consolidated Financial Statements(Continued)

16
Endowment net asset composition by type of fund as of June 30, 2015 and 2014, is:
Temporarily Permanently2015 (dollars in thousands) Unrestricted Restricted Restricted TotalDonor-restricted endowment funds - $ 11,219,923 $ 1,649,703 $ 12,869,626Board-designated endowment funds $ 9,278,348 - - 9,278,348
Total $ 9,278,348 $ 11,219,923 $ 1,649,703 $ 22,147,974
2014 (dollars in thousands) Donor-restricted endowment funds - $ 10,721,605 $ 1,697,187 $ 12,418,792Board-designated endowment funds $ 8,023,126 - - 8,023,126
Total $ 8,023,126 $ 10,721,605 $ 1,697,187 $ 20,441,918
Changes in endowment net assets for the years ended June 30, 2015 and 2014, are:
Temporarily Permanently 2015 (dollars in thousands) Unrestricted Restricted Restricted 2015 TotalEndowment net assets, beginning of the year $ 8,023,126 $ 10,721,605 $ 1,697,187 $ 20,441,918Investment return: Net realized and unrealized appreciation 1,574,425 821,251 - 2,395,676 Contributions 14,616 1,460 72,608 88,684Appropriation of endowment assets for expenditure (262,253) (602,799) - (865,052)Reclassifi cations, transfers, and board designations (71,566) 278,406 (120,092) 86,748
Endowment net assets, end of the year $ 9,278,348 $ 11,219,923 $ 1,649,703 $ 22,147,974
Temporarily Permanently2014 (dollars in thousands) Unrestricted Restricted Restricted 2014 TotalEndowment net assets, beginning of the year $ 6,838,057 $ 9,209,214 $ 1,632,818 $ 17,680,089Investment return: Net realized and unrealized appreciation 1,304,881 2,068,948 - 3,373,829 Reclassifi cation for funds with defi ciencies 62 (62) - -
Total investment return 1,304,943 2,068,886 - 3,373,829
Contributions - - 30,325 30,325Appropriation of endowment assets for expenditure (318,084) (504,337) - (822,421)Reclassifi cations, transfers, and board designations 198,210 (52,158) 34,044 180,096
Endowment net assets, end of the year $ 8,023,126 $ 10,721,605 $ 1,697,187 $ 20,441,918
Funds with deficiencies—From time to time, the fair value of assets associated with individual donor-restricted endowment funds may fall below the level that the donor or UPMIFA requires the University to retain as a fund of perpetual duration. Defi ciencies of this nature are reportedin unrestricted net assets, although there were no funds with defi ciencies at June 30, 2015 or 2014. Defi ciencies can result from unfavorable market fl uctuations that occur shortly after the investment of new permanently restricted contributions while continued appropriations are deemed prudent by the Board of Trustees.
In accordance with the terms of donor gift instruments, the University is permitted to reduce the balance of restricted endowments below the original amount of the gift. Subsequent investment gains are then used to restore the balance up to the fair market value of the original amount of the gift. Subsequent gains above that amount are recorded in temporarily restricted net assets.
Notes to Consolidated Financial Statements(Continued)

17
Return objectives and risk parameters—The University has adopted investment and spending policies for endowment assets that attempt to support the University’s current and future operating needs, while preserving intergenerational equity. Endowment assets include those assets of donor-restricted funds that the University must hold in perpetuity or for donor-specifi ed periods as well as University-designated funds. Under these policies, the endowment assets are invested in a manner that is intended to produce returns that exceed both the annual rate of spending and university infl ation.
Strategies employed for achieving objectives—The vast majority of the endowment assets are actively managed by PRINCO, which is structured as a University offi ce, but maintains its own Board of Directors, and operates under the fi nal authority of the University’s Board of Trustees (the “Trustees”).
In pursuit of the investment return objectives, PRINCO maintains an equity-biased portfolio and seeks to partner with best-in-class investment management fi rms across diverse asset categories.
Spending policy and how the investment objectives relate to spending policy—Each year the Trustees decide upon an amount to be spent from the endowment for the following fi scal year. In their deliberations, the Trustees use a spending framework that is designed to enable sizable amounts to be spent in a reasonably stable fashion, while allowing for reinvestment suffi cient to preserve purchasing power in perpetuity. The framework targets annual spending rates of between 4.0 percent and 6.25 percent.
The endowment must seek investment returns suffi cient to meet spending policy targets as well as to maintain future purchasing power without deterioration of corpus resulting from university infl ation.
6 . E D U C AT I O N A L A N D M O R T G AG E L OA N S
Educational loans include donor-restricted and federally sponsored educational loans that bear mandated interest rates and repayment terms, and are subject to signifi cant restrictions on their transfer and disposition. These loans totaled $64.8 million and $68.3 million at June 30, 2015 and 2014, respectively. Determination of the fair value of educational loans receivable could not be made without incurring excessive costs.
Through a program to attract and retain excellent faculty and senior staff, the University provides home acquisition and fi nancing assistance on residential properties in the area surrounding the University. Notes receivable from faculty and staff and co-ownership interests in the properties are included in mortgage loans and are collateralized by mortgages on those properties. These loans and interests totaled $313.7 million and $299.0 million at June 30, 2015 and 2014, respectively.
Allowance for Doubtful Loans Management assesses the adequacy of the allowance for doubtful loans by performing evaluations of the loan portfolio, including such factors as the differing economic risks associated with each loan category, the fi nancial condition of borrowers, the economic environment, the level of delinquent
Notes to Consolidated Financial Statements(Continued)

18
loans, and the value of any collateral associated with the loans. In addition to general economic conditions and other factors described above, a detailed review of the aging of loans receivable is considered in management’s assessment. The level of the allowance is adjusted according to the results of management’s analysis.
Loans less than 120 days delinquent are deemed to have a minimal delay in payment and are generally not written off. Loans more than 120 days delinquent are subject to standard collection practices, including litigation. Only loans that are deemed uncollectible are written off, and this occurs only after several unsuccessful collection attempts, including placement at an external collection agency. Considering the other factors discussed herein, management considers the allowance for doubtful loans at June 30, 2015 and 2014, to be prudent and reasonable.
Educational and mortgage loans receivable at June 30, 2015 and 2014, are reported net of allowances for doubtful loans of $0.3 million and $0.9 million, respectively.
7. P RO M I S E S T O G I V E
At June 30, 2015 and 2014, the University had received from donors unconditional promises to give contributions of amounts receivable in the following periods:
(dollars in thousands) 2015 2014Less than one year $ 89,043 $ 95,907One to fi ve years 94,525 103,885More than fi ve years 14,319 22,501
Total 197,887 222,293Less unamortized discount and reserve 11,457 12,432
Net amount $ 186,430 $ 209,861
The amounts promised have been recorded after discounting the future cash fl ows to the present value. Current-year promises are included in revenue as additions to temporarily or permanently restricted net assets, as determined by the donors, and are included in contributions receivable at fair value based on observable ASC 820 Level 2 inputs.
In addition, at June 30, 2015, the University had received from donors promises to give of $11.4 million, conditioned upon the raising of matching gifts from other sources and other criteria. These amounts will be recognized as income in the periods in which the conditions have been fulfi lled.
8 . P RO P E R T Y
Land additions are reported at estimated market value at the date of gift, or on a cost basis. Buildings and improvements are stated at cost. Expenditures for operation and maintenance of physical plant are expensed as incurred.
Notes to Consolidated Financial Statements(Continued)

19
Items classifi ed as property at June 30, 2015 and 2014, consisted of the following:
(dollars in thousands) 2015 2014Land $ 113,891 $ 108,910Buildings and improvements 3,815,443 3,513,322Construction in progress 353,023 364,110Equipment and systems 342,446 295,228Rare books 98,878 94,610Library books, periodicals, and bindings 281,844 275,488Fine art objects 126,805 118,079
Total property 5,132,330 4,769,747Accumulated depreciation (1,378,654) (1,268,204)
Total $ 3,753,676 $ 3,501,543
Equipment, library books, periodicals, and bindings are stated at cost net of accumulated depreciation. Equipment includes items purchased with federal government funds; an indeterminate portion of those items are expected to be transferred to the University at the termination of the respective grant or contract.
In addition to making purchases with University funds, the University, since its inception, has received a substantial number of fi ne art objects and rare books from individual gifts and bequests. Art objects and rare books acquired through June 30, 1973, are carried at insurable values at that date because it is not practicable to determine the historical cost or market value at the date of gift. Art objects and rare books acquired subsequent to June 30, 1973, are recorded at cost or fair value at the date of gift. Works of art, literary works, historical treasures and artifacts that are part of a collection are protected, preserved and held for public exhibition, education, and research in futherance of public service. Collections are not capitalized and contributed collection items are not recognized as revenues in the University's fi nancial statements.
The University uses componentized depreciation for buildings and building improvements used for research. The costs of research facilities are separated into building shell, service system, and fi xed equipment components that are separately depreciated.
Annual depreciation is calculated on the straight-line method over useful lives ranging from 15 to 50 years for buildings and improvements, 30 years for library books, and 10 and 15 years for equipment. Art objects and rare books having cultural, asthetic, or historical value are not depreciated.
9 . C O N D I T I O N A L A S S E T R E T I R E M E N T O B L I G AT I O N S
Under ASC 410-20, Asset Retirement and Environmental Obligations—Asset Retirement Obligations, companies must accrue for costs related to legal obligations to perform certain activities in connection with the retirement, disposal, or abandonment of assets. The obligation to perform the asset retirement activity is not conditional even though the timing or method may be conditional.
The University has identifi ed asbestos abatement as a conditional asset retirement obligation. Asbestos abatement was estimated using site-specifi c surveys where available and a per-square-foot estimate based on historical cost where surveys were unavailable. The estimate is recorded as a liability and as an increase to the asset, and the capitalized portion is depreciated over the remaining useful life of the asset. The asset retirement obligation included in accrued liabilities was $12.8 million and $14.8 million at June 30, 2015 and 2014, respectively, and accretion
Notes to Consolidated Financial Statements(Continued)

20
expense on the asset retirement obligation was $0.4 million and $0.5 million for the years ended June 30, 2015 and 2014, respectively.
10 . I N C O M E TA X E S
ASC 740, Income Taxes, prescribes the minimum recognition threshold a tax position must meet in connection with accounting for uncertainties in income tax positions taken or expected to be taken by an entity before being measured and recognized in the fi nancial statements. The University continues to evaluate its tax positions pursuant to the principles of ASC 740, and has determined that there is no material impact on the University’s fi nancial statements.
The University is a not-for-profi t organization as described in Section 501(c)(3) of the Internal Revenue Code and is exempt from income taxes on related income. The University fi les U.S. federal and various state and local tax returns. The statute of limitations on the University’s U.S. federal tax returns remains open for the years ended June 30, 2012, through the present.
11. D E F E R R E D R E V E N U E S
Deferred revenues primarily represent advance receipts relating to the University’s real estate leasing activities. Such amounts are amortized over the term of the related leases.
1 2 . I N D E B T E D N E S S T O T H I R D PA R T I E S
At June 30, 2015 and 2014, the University’s debt consisted of taxable bonds, taxable notes, loans through the New Jersey Educational Facilities Authority (NJEFA), commercial paper, various parent loans, and a note as follows:
(dollars in thousands) 2015 2014Taxable Revenue Bonds2009 Series A, 4.95% and 5.70%, due March 2019 and March 2039, net of unamortized
discount of $2,636 and $2,746 $ 997,364 $ 997,254
Taxable Notes
2012, 3.372%, due July 2042 170,000 170,0002013, 4.72%, due July 2044 75,000 75,000
NJEFA Revenue Bonds2003 Series D, 3.73%, due July 2019, including unamortized premium of $2,739 and $3,424 45,119 55,349
2005 Series A, 4.40%, due July 2030, including unamortized premium of $0.00 and $2,138 - 125,188
2005 Series B, 4.24% due July 2035, including unamortized premium of $0.00 and $1,271 - 70,076
2006 Series D, 4.39%, due July 2031, including unamortized premium of $603 and $641 58,258 60,745
2006 Series E, 4.50%, due July 2027, including unamortized premium of $57 and $62 91,727 91,887
2007 Series E, 4.53%, due July 2037, including unamortized premium of $3,781 and $3,953 278,866 286,103
2007 Series F, 4.39%, due July 2030, including unamortized premium of $599 and $639 67,354 67,529
2008 Series J, 4.39%, due July 2038, including unamortized premium of $3,620 and $3,778 224,355 229,883
2008 Series K, 4.36%, due July 2023, including unamortized premium of $3,961 and $4,456 124,766 139,616
2010 Series B, 4.03%, due July 2040, including unamortized premium of $10,137 and $10,543 241,207 246,558
2011 Series B, 4.09%, due July 2041, including unamortized premium of $14,179 and $14,724 250,929 256,094
2014 Series A, 3.77%, due July 2044, including unamortized premium of $18,613 and $19,255 218,613 219,255
2015 Series A, 2.32% due July 2035, including unamortized premium of $30,293 187,083 -
2015 Series D, 3.40% due July 2045, including unamortized premium of $19,793 169,793 -
Notes to Consolidated Financial Statements(Continued)

21
2015 2014NJEFA Dormitory Safety Trust Fund Bonds2001 Series A, due January 2016 832 1,664
NJEFA Capital Improvement Fund Bonds2005 Series A, 4.12%, 2000 Series A, 5.72%, due September 2020 702 823
2006 Series A, 4.42%, 2000 Series A, 5.72%, due September 2020 166 166
2014 Series B, 3.67%, due September 2033, including unamortized premium of $211 and $222 3,215 3,226
Commercial Paper
Taxable, .12% and .08% with maturities up to one year 5,700 65,200
Tax-exempt (NJEFA), .08% and .04% with maturities up to one year 59,000 24,500
Parent Loans, 0.5% to 5.4% with maturities up to nine years 43,489 44,562
Notes 906 1,075
Total $ 3,314,444 $ 3,231,753
The proceeds of NJEFA loans are used primarily to fi nance the costs of acquisition, construction, renovation and installation of capital assets of the University.
In May 2015 the University issued the 2015 Series A Bonds and the 2015 Series D Bonds. The 2015 Series A Bonds were issued for the purpose of the current refunding and defeasance of the 2005 Series A and 2005 Series B Bonds. The 2015 Series D Bonds were issued for the purpose of funding new construction and renovations, and for the refunding of portions of the taxable and tax-exempt commercial papers notes. The University is authorized by the Board of Trustees to issue new debt up to $350 million annually. The University intends to issue additional debt in the future.
The full faith and credit of the University is pledged in all loan agreements with the NJEFA.In fi scal 1999, the University entered into a loan facility with a national bank to fund its
parent loan program which is currently authorized by the Board of Trustees up to $100 million. Fixed or variable rates may be selected on a pass-through basis to the borrowers; terms may be as long as 14 years.
In fi scal year 1998, a commercial paper program was authorized as an initial step of fi nancing to provide construction funds for approved capital projects. The commercial paper proceeds are primarily used to fi nance construction expenditures until permanent fi nancing from gifts or other sources is made available. The program is currently authorized to a maximum level of $300 million.
Principal payments for each of the next fi ve years and thereafter on debt outstanding at June 30, 2015, excluding commercial paper, are as follows:
(dollars in thousands) Principal Payments2016 67,9812017 96,2882018 83,3682019 583,1512020 85,272Thereafter 2,227,733
Subtotal 3,143,793Unamortized premium 105,951
Net long-term debt $ 3,249,744
Notes to Consolidated Financial Statements(Continued)

22
The fair value of the University’s long-term debt is estimated based on current notes offered for the same or similar issues with similar security, terms, and maturities. At June 30, 2015, the carrying value and the estimated fair value of the University’s long-term debt, excluding commercial paper, were $3,249.7 million and $3,602.5 million, respectively. At June 30, 2014, the carrying value and the estimated fair value of the University’s long-term debt, excluding commercial paper, were $3,142.1 million and $3,509.5 million, respectively.
The University has committed bank lines of credit totaling $250 million, under which the University may borrow on an unsecured basis at agreed-upon rates. There were $16.9 million and $15.5 million in letters of credit outstanding under these credit facilities at June 30, 2015 and 2014, respectively.
13 . E M P L O Y E E B E N E F I T P L A N S
All faculty and staff who meet specifi c employment requirements participate in a defi ned contribution plan, which invests in the Teachers Insurance and Annuity Association and College Retirement Equities Fund and Vanguard Fiduciary Trust Funds. The University’s contributions were $53.5 million and $53.3 million for the years ended June 30, 2015 and 2014, respectively.
Postretirement Benefits Other Than PensionsASC 715, Compensation—Retirement Benefits, requires the recognition of a defi ned benefi t postretirement plan’s funded status as either an asset or a liability on the statement of fi nancial position. Actuarial gains or losses and prior service costs or credits that arise during the period must be recognized as a component of unrestricted net assets. The University calculates its Accumulated Postretirement Benefi t Obligation (APBO) in accordance with ASC 715, which was initially elected in 1993 and amortized over 20 years. The University continues to recognize the cost of providing postretirement benefi ts for employees over the period of their working years.
The University provides single coverage health insurance to its retirees who meet certain eligibility requirements. Participants may purchase additional dependent or premium coverage. The accounting for the plan anticipates future cost-sharing changes to the written plan that are consistent with the University’s expressed intent to increase retiree contributions in line with medical costs.
The benefi t costs for the years ended June 30, 2015 and 2014, consisted of the following:
(dollars in thousands) 2015 2014Service cost $ 17,479 $ 13,270Interest cost 15,416 13,803
Total $ 32,895 $ 27,073
The APBO at June 30, 2015 and 2014, consisted of actuarially determined obligations to the following categories of employees:
(dollars in thousands) 2015 2014Retirees $ 130,175 $ 125,046Active employees eligible to retire 98,822 95,279Other active participants 153,651 146,929
Total $ 382,648 $ 367,254
Notes to Consolidated Financial Statements(Continued)
23
Notes to Consolidated Financial Statements(Continued)
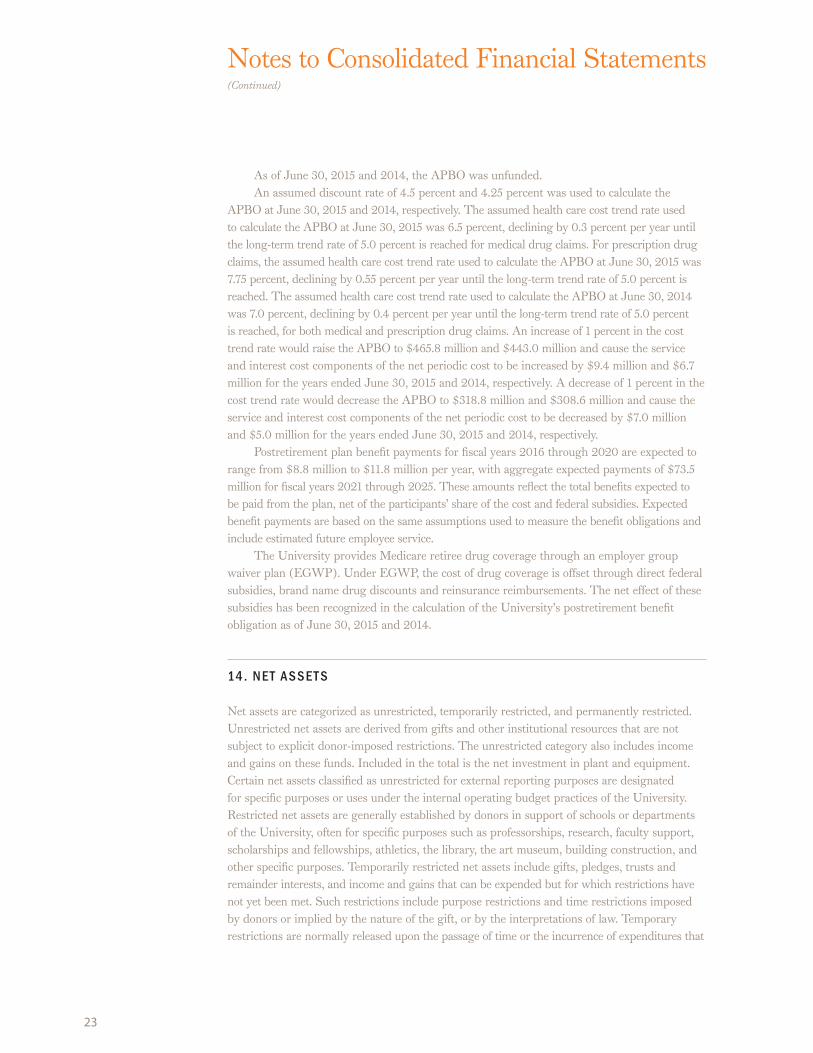
As of June 30, 2015 and 2014, the APBO was unfunded.An assumed discount rate of 4.5 percent and 4.25 percent was used to calculate the
APBO at June 30, 2015 and 2014, respectively. The assumed health care cost trend rate used to calculate the APBO at June 30, 2015 was 6.5 percent, declining by 0.3 percent per year until the long-term trend rate of 5.0 percent is reached for medical drug claims. For prescription drug claims, the assumed health care cost trend rate used to calculate the APBO at June 30, 2015 was 7.75 percent, declining by 0.55 percent per year until the long-term trend rate of 5.0 percent is reached. The assumed health care cost trend rate used to calculate the APBO at June 30, 2014 was 7.0 percent, declining by 0.4 percent per year until the long-term trend rate of 5.0 percent is reached, for both medical and prescription drug claims. An increase of 1 percent in the cost trend rate would raise the APBO to $465.8 million and $443.0 million and cause the service and interest cost components of the net periodic cost to be increased by $9.4 million and $6.7 million for the years ended June 30, 2015 and 2014, respectively. A decrease of 1 percent in the cost trend rate would decrease the APBO to $318.8 million and $308.6 million and cause the service and interest cost components of the net periodic cost to be decreased by $7.0 million and $5.0 million for the years ended June 30, 2015 and 2014, respectively.
Postretirement plan benefi t payments for fi scal years 2016 through 2020 are expected to range from $8.8 million to $11.8 million per year, with aggregate expected payments of $73.5 million for fi scal years 2021 through 2025. These amounts refl ect the total benefi ts expected to be paid from the plan, net of the participants’ share of the cost and federal subsidies. Expected benefi t payments are based on the same assumptions used to measure the benefi t obligations and include estimated future employee service.
The University provides Medicare retiree drug coverage through an employer group waiver plan (EGWP). Under EGWP, the cost of drug coverage is offset through direct federal subsidies, brand name drug discounts and reinsurance reimbursements. The net effect of these subsidies has been recognized in the calculation of the University's postretirement benefi t obligation as of June 30, 2015 and 2014.
14 . N E T A S S E T S
Net assets are categorized as unrestricted, temporarily restricted, and permanently restricted. Unrestricted net assets are derived from gifts and other institutional resources that are not subject to explicit donor-imposed restrictions. The unrestricted category also includes income and gains on these funds. Included in the total is the net investment in plant and equipment. Certain net assets classifi ed as unrestricted for external reporting purposes are designated for specifi c purposes or uses under the internal operating budget practices of the University. Restricted net assets are generally established by donors in support of schools or departments of the University, often for specifi c purposes such as professorships, research, faculty support, scholarships and fellowships, athletics, the library, the art museum, building construction, and other specifi c purposes. Temporarily restricted net assets include gifts, pledges, trusts and remainder interests, and income and gains that can be expended but for which restrictions have not yet been met. Such restrictions include purpose restrictions and time restrictions imposed by donors or implied by the nature of the gift, or by the interpretations of law. Temporary restrictions are normally released upon the passage of time or the incurrence of expenditures that

24
fulfi ll the donor-specifi ed purpose. Permanently restricted net assets include gifts, pledges, trusts and remainder interests, and income and gains that are required by donor-imposed restrictions to be permanently retained. Investment earnings are spent for general or specifi c purposes in accordance with donor wishes, based on the University’s endowment spending rule.
15 . N AT U R A L C L A S S I F I C AT I O N O F E X P E N S E S
Operating expenses incurred for the years ended June 30 were as follows:
(dollars in thousands) 2015 2014Salaries and wages $ 625,757 $ 583,475Employee benefi ts 180,712 223,713Purchased services 172,604 146,104Supplies and materials 107,843 64,467Space and occupancy 73,495 85,661Sub-recipient agreements 25,333 33,988Other expenses 17,765 67,503Other student aid 55,321 37,850Depreciation 138,838 127,040Interest 143,952 125,429
Total $ 1,541,620 $ 1,495,230
Certain prior-year balances have been reclassifi ed to conform to the current year presentation.
16 . C O M M I T M E N T S A N D C O N T I N G E N C I E S
At June 30, 2015, the University had authorized major renovation and capital construction projectsfor more than $1,300.6 million. Of the total, approximately $491.1 million had not yet been expended.
Minimum operating lease commitments at June 30, 2015, for space and e quipment are as follows:
(dollars in thousands) Lease Payments2016 $ 6,5252017 6,5252018 6,5252019 6,5252020 6,765Thereafter 19,142
Total $ 52,007
The University has entered into certain agreements to guarantee the debt of others. Under these agreements, if the principal obligor defaults on the debt, the University may be required to satisfy all or part of the remaining obligation. The total amount of these guarantees was $21.9 million at June 30, 2015.
Notes to Consolidated Financial Statements(Continued)

25
The University is subject to certain legal claims that have arisen in the normal course of operations. In the opinion of management, the ultimate outcome of these actions will not have a material effect on the University’s fi nancial position, statement of activities, or cash fl ows.
17. S U B S E Q U E N T E V E N T S
The University has evaluated subsequent events through November 24, 2015, and determined that there were no subsequent events requiring adjustment or disclosure in the consolidated fi nancial statements.