Embed Size (px)
Citation preview

FINANCIAL
TRANSPARENCY
REPORT
ST. LOUIS COUNTY,
MISSOURI
FOR YEAR ENDED DECEMBER 31, 2018
2018

FROM THE
COUNTY
EXECUTIVE
November 18, 2019
Dear St. Louis County residents,
St. Louis County has faced its share of challenges this year. For good reason, many
of us lost trust in county government. So, when I became County Executive, I knew
that our first order of business was restoring trust.
Restoring trust requires being open, honest, and forthright in communicating what we
have done, are doing, and will do. We must both tell the truth in a way our residents
can verify and give our residents the tools to verify that what we say is
true. Transparency empowers all of you to hold your government accountable.
Every November, the County Executive sends the County Council a budget. But all
too often the county government’s financial information is difficult to decipher. So this
year – for the first time – we’re publishing this Financial Transparency Report. This
report makes the County’s finances easier to understand and is part of our broader
effort to increase transparency throughout County government.
Sincerely,
Sam Page
County Executive

This Financial Transparency report will serve as
St. Louis County’s Popular Annual Financial
Report (PAFR) which is an unaudited summary
report of the financial activities of the County
and is prepared primarily from detailed
information contained in the County’s
Comprehensive Annual Financial Report (CAFR).
The CAFR is prepared in accordance with general
accepted accounting principles (GAAP) and
provides detailed information and includes an
audit from an independent accounting firm. The
GAAP presentation also includes the County’s
component units and other information on the
various County funds.
The information in the CAFR can be technical
and complex and as such not as useful to
residents wishing to gain an overview of the
County’s finances. The PAFR has been prepared
to simplify the information in the CAFR, without
the use of technical accounting terms or
excessive detail.
Questions or feedback concerning the
information contained in this report or requests
for additional information may be directed to the
County’s Department of Fiscal Management at
41 South Central Avenue, 8th Floor, Clayton, MO
63105.
The CAFR and PAFR are available online at:
stlouisco.com/fiscalmanagement
ABOUT
THIS
REPORT
PAGE 1
FINANCIAL TRANSPARENCY
REPORT

ST. LOUIS COUNTY
GOVERNMENTA COMPLEX COUNTY
THE CHARTER & BUDGET PROCESS
St. Louis County government’s budget is large and complex, much like the
county itself. St. Louis County has the most people, roads, houses, jobs, work
force, and cities than any other county in Missouri. If a budget is viewed as a
funding plan to carry out an organization’s mission, then it is not surprising that
the county’s budget reflects the size and diversity of the constituency it serves.
Unique among counties, St. Louis County provides countywide services to its
nearly one million residents, local services to more than 300,000 residents in
unincorporated areas, and specialized contractual services to other jurisdictions,
including the 88 municipalities within St. Louis County. Additionally, St. Louis
County owns and operates Spirit of St. Louis Airport as a self-supporting
enterprise.
St. Louis County’s Charter requires the County Executive to submit a balanced
budget to the County Council by November 1st, prior to the start of the County’s
fiscal year in January. The budget must include a complete financial plan for all
county funds and activities, including proposed tax rates, an estimate of all
income and revenue, and all proposed expenditures for current operations, debt
service and a capital program.
PAGE 2
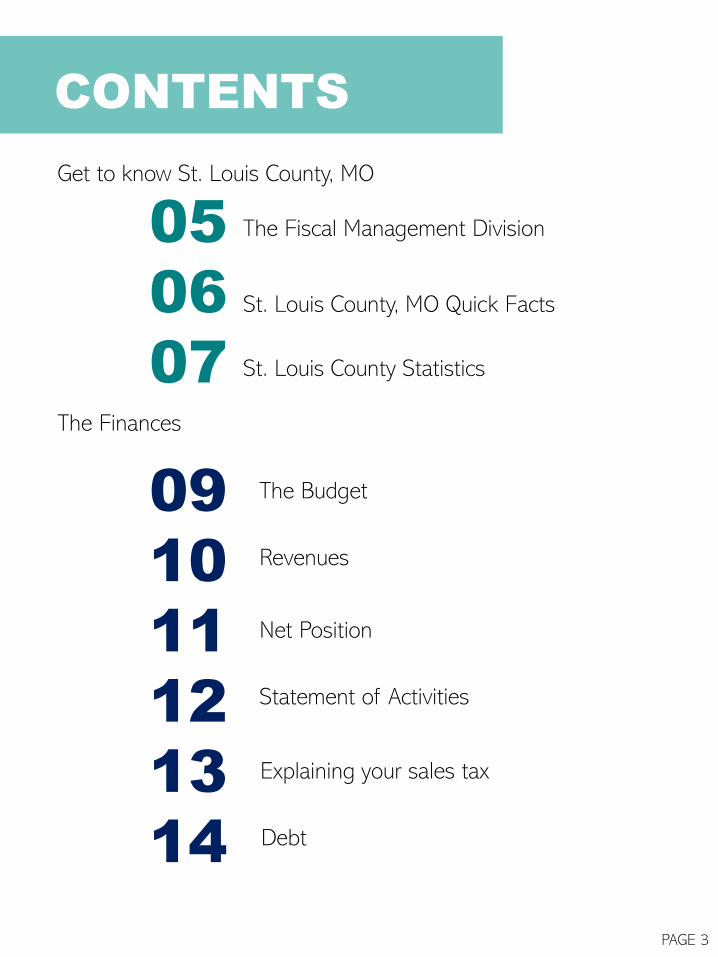
CONTENTS
05
06
07
Get to know St. Louis County, MO
The Fiscal Management Division
The Finances
St. Louis County, MO Quick Facts
St. Louis County Statistics
09
10
11
12
13
14
PAGE 3
The Budget
Revenues
Statement of Activities
Net Position
Debt
Explaining your sales tax

ST. LO
UIS
C
OU
NT
Y, M
O

FISCAL
MANAGEMENT
DIVISION
The Fiscal Management Division is
responsible for operating and
supervising the County's accounting
systems, preparing the Comprehensive
Annual Financial Report (CAFR); and
taking an annual inventory of all County
property.
The GFOA awarded a Certificate of
Achievement for Excellence in Financial
Reporting to St. Louis County, Missouri
for its CAFR for the fiscal year ended
December 31, 2017. To receive this
award, a government unit must publish
an easily readable and efficiently
organized CAFR that satisfied both
accounting principles generally
accepted in the United States of
America and applicable legal
requirements.
PAGE 5

QUICK FACTS
ST. LOUIS COUNTY
FOUNDED 1812
DEMOGRAPHICS
GEOGRAPHY
524 square miles
St. Louis County is the 43rd most populous county
in the Nation and the largest county in Missouri
36% of the bi-state region lives in St. Louis
County
PAGE 6

STATISTICS
ST. LOUIS COUNTY
PAGE 7
Employer EmployeesPercentage of Total County
Employment
Washington University in St. Louis 15,818 3.1%
SSM Healthcare 14,926 2.9%
Mercy Healthcare 14,195 2.8%
Boeing Defense, Space & Security 14,000 2.7%
Schnucks Markets Inc. 9,956 1.9%
Special School District of St Louis County 6,272 1.2%
Edward Jones 6,100 1.2%
Enterprise Holdings 5,500 1.1%
Express Scripts Holding Co. 5,323 1.0%
St. Louis County Government 4,216 0.8%
Total 96,306 18.7%
PER CAPITA INCOME
UNEMPLOYMENT
MAJOR EMPLOYERS
2.9%UNEMPLOYMENT RATE
$67,029PER CAPITA
PERSONAL INCOME
$54,830
$50,701$52,528
$54,074
$59,799$58,401
$60,540$62,194
$62,777$67,029
2008 2009 2010 2011 2012 2013 2014 2015 2016 2017
U.S. Department of Commerce, Bureau of Economic Analysis
Missouri Economic Research and Information Center, Missouri Department of Economic
Development
5.9
2.9

CO
UN
TY
FIN
AN
CE
S

STLCO’s
BUDGET
General Fund - The General Fund is the general operating fund of the County. It is used to account for all
financial resources except those required to be accounted for in another fund. The General Fund is divided
into four separate departments under the captions General Government, Department of Highways and Traffic,
Department of Health, and Department of Parks and Recreation in order to reflect the County's financial
administration and organization as currently required by ordinance. Certain transactions between the General
Fund departments have been eliminated for presentation in the financial statements.
Public Mass Transit Fund - A Special Revenue Fund used to record the countywide one-half percent
transportation sales tax, the one-half percent Prop A, and the MetroLink light rail Prop M one-quarter percent
sales tax receipts and related expenditures for public mass transportation purposes.
Emergency Communications Fund - A Special Revenue Fund used to record the countywide one-tenth percent
sales tax receipts and related expenditures for a countywide emergency communications system.
Community Children’s Services Fund - A Special Revenue Fund used to record the countywide one-quarter
percent sales tax receipts and related expenditures for support of children services.
Convention and Recreation Trust Fund - A Special Revenue Fund used to record revenue received from a
three and one-half percent hotel/motel tax used to fund the County's share of the debt service payments and
preservation payments of the St. Louis Regional Convention and Sports Complex Authority and debt service
payments for the St. Louis Cardinals Ballpark Site and Ballpark Project.
Debt Service Fund - The Debt Service Fund is used to account for the accumulation of resources for, and the
payment of, long-term debt principal, interest, and related costs.
Capital Projects Fund - The Capital Projects Fund accounts for financial resources used for the acquisition or
construction of major capital facilities, other than those financed by proprietary funds. The Capital Projects
Fund consists of the aggregation of various individual capital projects.
Other Governmental Funds – These funds include Special Revenue Funds, which account for the proceeds of
specific revenue sources that are legally restricted to expenditures for specific purposes.
Enterprise Funds - Enterprise Funds are used to account for operations that are financed and operated in a
manner similar to private business enterprises, where the intent of the governing body is that the costs
(including depreciation) of operations are financed primarily through user charges. An Enterprise Fund has
been established for the Airport. The Airport Fund is defined as a major fund and is used to account for
activities of the County's airport operation financed primarily from fuel sales and facility leases
PAGE 9

REVENUES
$831.8 milin total revenue
$388.3 milSales tax
$118.4 milProperty tax
Nearly 70% of the
County’s $831.8 million in
revenue is generated by
taxes, including property,
sales, utility gross receipts,
and casino taxes
PAGE 10

NET POSITION
STATEMENT OF
The Statement of Net Position presents information on all
of the County’s assets and liabilities, with the difference
between the two reported as net position. These
increases and decreases in net position may serve as a
useful indicator of whether or not the financial position of
the County is improving or worsening.
Governmental
Activities
Business-type
ActivitiesTotal 2018 Total 2017
Assets
Current and other assets 870,085,130 20,966,636 891,051,766 845,281,821
Capital assets, net 1,119,097,703 51,714,140 1,170,811,843 1,163,459,258
Total assets 1,989,182,833 72,680,776 2,061,863,609 2,008,741,079
Deferred Outflows 81,695,422 365,358 82,060,780 95,144,599
Liabilities
Current liabilities 154,166,046 837,209 155,003,255 154,784,829
Noncurrent liabilities 842,699,004 1,363,574 844,062,578 924,907,753
Total liabilities 996,865,050 2,200,783 999,065,833 1,079,692,582
Deferred Inflows 74,760,630 2,243,672 20,117,472 20,117,472
Net Position
Net investment in capital
assets 824,737,774 51,714,140 876,451,914 852,433,219
Restricted 501,948,359 - 501,948,359 452,851,167
Unrestricted (deficit) (327,433,558) 16,887,539 (310,546,019) (301,208,762)
Total net position 999,252,575 68,601,679 1,067,854,254 1,004,075,624
+6.4%from 2017
PAGE 11

REVENUES &
EXPENSES
ACTIVITIES
STATEMENT OF
PAGE 12
The table above quantifies the revenue and expenses of St. Louis County and shows the overall change in net position (revenues
less expenses). Revenues are summarized by source and expenses are shown to reflect the various functions of the County
government. Again, increases and decreases in net position may serve as an indicator of whether or not the financial position of
the County is improving or worsening. The table is divided into three columns: Governmental Activities, Business Activities and
Total Primary Government.
Governmental Activities encompasses all governmental funds through which most governmental functions are financed. These
funds include the General Fund, Public Mass Transit Fund, Emergency Communications Fund, Community Children’s Service Fund,
Convention and Recreation Trust Fund, Debt Service Fund, Capital Projects Fund, and Other Non-Major Funds.
The Business-type Activities are solely related to the County’s operations of Spirit of St. Louis Airport, which is financed primarily
from fuel sales and facility leases.
2017
Revenues
Program revenues:
Charges for services $ 125,303,853 $ 114,415,641 $ 19,843,876 $ 16,314,451 $ 145,147,729 $ 130,730,092
Operating grants and contributions 56,957,076 60,650,512 - 219,821 56,957,076 60,870,333
Capital grants and contributions 39,511,350 31,398,484 1,718,612 937,186 41,229,962 32,335,670
General revenues:
Property taxes 118,357,835 115,986,304 - - 118,357,835 115,986,304
Other taxes 445,158,705 399,706,113 - - 445,158,705 399,706,113
Other revenue 13,885,074 10,495,563 7,732 - 13,892,806 10,495,563
Investment earnings 10,727,950 5,301,323 323,372 143,869 11,051,322 5,445,192
Total revenues 809,901,843 737,953,940 21,893,592 17,615,327 831,795,435 755,569,267
Expenses
General government 131,560,618 125,739,182 - - 131,560,618 125,739,182
Public safety 222,257,843 202,794,822 - - 222,257,843 202,794,822
Human services 49,420,528 61,878,091 - - 49,420,528 61,878,091
Highways and traffic 83,923,176 82,764,065 - - 83,923,176 82,764,065
Health 47,679,526 47,596,313 - - 47,679,526 47,596,313
Parks and recreation 29,264,221 33,418,355 - - 29,264,221 33,418,355
Transportation 159,804,977 146,149,154 - - 159,804,977 146,149,154
Convention and recreation - 100,000 - - - 100,000
Interest and fiscal charges 23,908,677 23,512,083 - - 23,908,677 23,512,083
Spirit of St. Louis Airport - - 21,161,488 17,425,014 21,161,488 17,425,014
Total expenses 747,819,566 723,952,065 21,161,488 17,425,014 768,981,054 741,377,079
Change in net position 62,082,277 14,001,875 732,104 190,313 62,814,381 14,192,188
Beginning net position 936,206,049 922,204,174 67,869,575 67,679,262 1,004,075,624 989,883,436
Prior period adjustment 964,249 - - - - 964,249 -
Beginning net position, as restated 937,170,298 922,204,174 67,869,575 67,679,262 1,005,039,873 989,883,436
Ending net position $ 999,252,575 $ 936,206,049 $ 68,601,679 $ 67,869,575 $ 1,067,854,254 $ 1,004,075,624
2018 2018 2017 2018 2017
Total
Primary Government
Business-type
Activities
Governmental
Activities

0.25%
0.50%0.25%
SALES TAX
EXPLAINING YOUR
7.615%Total sales tax rate in St. Louis
County
2018 sales tax revenue
generated for St. Louis County
$388.3 mil
MO: 4.225%STLCO: 3.39%
9Separate sales taxes to
finance both general
government operations
and specialized functions
QUICK FACTS
Sales tax rate
4.225%
1.00%
0.50%0.10%
0.19%
0.10%
State of Missouri
General
Public Safety
Metro Parks
Transportation
Mass Transit (Prop M)
Children’s Services
Emergency Comm.
Arch/River
0.50% Mass Transit (Prop A)
PAGE 13

NET POSITION
DEBT
2018 2017
General obligation bonds $ 92,215,000 $ 96,850,000
Contractual obligations 62,755,000 69,140,000
Bond payable - Tax increment financing 15,140,000 16,100,000
Note payable - Tax increment financing 103,058,315 80,729,225
Bond payable - Special obligation - Refunding COP - 3,325,000
Bond payable - Special obligation - 2010 issue 149,975,000 156,410,000
Bond payable - Special obligation - 2011 issue 1,120,000 1,275,000
Bond payable - Special obligation - 2012 issue 1,560,000 1,710,000
Bond payable - Special obligation - 2013 issue 42,950,000 43,690,000
Bond payable - Special obligation - 2015 issue 29,205,000 31,290,000
Bond payable - Special obligation - 2016 issue 10,730,000 11,815,000
Bond payable - Special obligation - 2017 issue 31,435,000 32,940,000
Loan payable - Section 108 - 3,000,000
Bond payable - Special obligation - NID 320,000 340,000
Bond payable - Special obligation - Hazelwood 4,810,000 5,110,000
Capital Leases 31,900 -
Unamortized bond premium 10,586,842 11,548,928
Compensated absences 41,343,910 36,958,301
Claims payable 14,942,109 17,714,135
$ 612,178,076 $ 619,945,589
The County’s long term debt obligations, or debt, totaled $612,178,076 in 2018; a net decrease of $7.8M or -1.3% from the prior year’s balance of
$619,945,589.
PAGE 14

QUESTIONS
COMMENTS AND
Fiscal Management Division
Attention: Chief Accounting Officer, Vickie Fredrick
41 S. Central
Clayton, MO 63105