Embed Size (px)
Citation preview

101
4Financing Higher Education
Solid fi nancing is the backbone of a well-functioning higher education system, but the systems in East Asia’s low- and
middle-income countries are not delivering the skill and research outcomes they need, as seen in the disconnects—often funding related—discussed earlier. In part this is because public fi nancing goes to institutions regardless of whether they are addressing public goods such as research, externalities, or equity concerns. Public funding can then address the disconnects. For instance, it can help tackle the disconnect with early educa-tion by supporting student transitions from secondary to tertiary education through scholarships and loans. Or it can tackle the disconnects between universities and fi rms in research and technology by supporting higher funding for research in universities. The region thus needs to identify prior-ity areas for support and strategies to fund them. Public funding will have a critical role to support research, science, technol-ogy, education, and mathematics (STEM) fields, and equity measures in lower- and middle-income East Asia. But because public resources are scarce, countries will also need to use them more effi ciently and effectively and be innovative in mobilizing additional resources. This chapter has three parts.
It starts with a broad review of financing needs, continues with a review of funding strategies with emphasis on the role and effi -ciency of public fi nancing and strategies to mobilize additional resources, and concludes with a brief summary of policy options.
Financing needs
Many of the outcome gaps and related dis-connects and constraints are related to fund-ing. This section investigates how costly it would be to achieve better outcomes in a sample of lower- and middle-income East Asian countries and, in light of the high costs, suggests priority areas for fund-ing. Before proceeding, a brief caveat is in order: the aim of this section is to provide a broad order-of-magnitude estimate of fi nancing needs if countries were to ramp up investments in quality and quantity, with-out regard to current budget constraints. The estimates are not public investments but should be thought of as overall fi nanc-ing needs that could be covered by myriad sources (public, private, philanthropic). This section highlights the trade-offs between quality and quantity that countries will face when fi nancing their systems. Pursuing both quality and quantity in equal measure would
PHEWEA.indb 101 10/11/11 7:37:08 PM

1 0 2 F I N A N C I N G H I G H E R E D U C A T I O N
be very costly without greater effi ciency of expenditures, a strong sense of priorities, and private fi nance leveraging.
Simulation analysis
A demographic-based model, in which cov-erage targets and quality-improvement poli-cies are independent variables, can estimate education expenditures in light of achieving these targets. In performing these simula-tions, this chapter has adapted the United Nations Educational, Scientifi c and Cultural Organization’s Education Policy and Strat-egy Simulation Model to estimate fi nancing needs for four regional countries. (Details of the architecture of the model are in appen-dix M.)
This chapter presents the model’s results for two scenarios: (a) expanding coverage and improving quality (illustrative for countries with lower tertiary gross enrollment ratios, or GERs, using Indonesia and Vietnam) and (b) maintaining coverage and improving quality (illustrative for countries with higher tertiary GERs, using the Philippines and Mongolia).
All scenarios have ambitious targets and interventions to provide an upper fi nancing bound, though student-teacher ratios and student-classroom ratios were maintained, saving on costs.
Expanding coverage and improving quality: Indonesia and VietnamFinancing simulations for Indonesia show that a steep ramp-up of tertiary investment will be required to expand coverage and improve quality. Interventions to increase faculty qualifi cations, salary and adminis-trative costs, and faculty training costs—as well as costs for central administration, cur-riculum development, and monitoring and evaluation—all imply larger fi nancing gaps over current public expenditure.
Recurrent expenditures make up more than 95 percent of the projected quality improvement interventions. They rise over time from nearly US$2,000 per student per year to nearly US$8,000 over the decade. While the majority of these recurrent costs
finance salaries, improving faculty qualifi-cations through fellowships also constitutes a robust share of recurrent expenditure at nearly 10 percent.
The fi nancing gaps that these projections imply for Indonesia over current expendi-tures are large. Indeed, Indonesia will need to increase expenditure per student dra-matically over the near term, since in 2008 it was spending only about 13 percent of gross domestic product (GDP) per capita per student (in public money). If public expendi-tures are maintained, to institute these inter-ventions the financing gap will grow from about 150 percent of GDP per capita to more than 500 percent by 2019 (table 4.1).
To widen access and raise quality, Viet-nam also will have to mobilize significant additional resources, mainly on increased recurrent expenditures (about four-fi fths on salaries, followed by training, upgrading fac-ulty qualifi cations, and administration). Per student expenditure will need to increase from US$1,500 to about US$4,000 over the next decade.
If 2007 public expenditure levels are main-tained, these projections imply a large fi nanc-ing gap. Tertiary expenditure per student, measured as a percentage of GDP per capita, will likely need to increase by three to four times its current levels by 2015, and by several orders of magnitude thereafter (table 4.2).
Maintaining coverage and improving quality: The Philippines and Mongolia The financing simulation for the Philip-pines similarly projects large and increasing recurrent expenditures. The model pro-jects that expenditures need to grow from nearly US$6,000 per student per year to about US$10,000. More than 95 percent of these expenditures are recurrent, and of those recurrent expenditures, salaries con-stitute by far the largest share (over 88 per-cent of recurrent expenditure), followed by administrative costs and costs for faculty qualifi cation upgrading (both estimated at about 5 percent of recurrent expenditure). As with Indonesia and Vietnam, these fi g-ures represent expenditures several orders of
PHEWEA.indb 102 10/11/11 7:37:09 PM

F I N A N C I N G H I G H E R E D U C A T I O N 1 0 3
TABLE 4.1 Gap between projected per-student expenditure needed
and current levels, Indonesia
percentage of GDP per capita
Year
2008 tertiary
expenditure
Projected tertiary
expenditure needed
Gap between
projected levels
needed and
2009 levels
2011 13.3 156.9 143.6
2013 13.3 222.1 208.9
2015 13.3 325.9 314.6
2017 13.3 778.3 765.0
2019 13.3 579.8 518.1
Source: Authors’ calculations based on model presented in appendix M.
TABLE 4.2 Gap between projected per-student expenditure needed
and current levels, Vietnam
percentage of GDP per capita
Year
2007 tertiary
expenditure
Projected tertiary
expenditure needed
Gap between
projected levels
needed and
2009 levels
2011 61.7 151.8 90.1
2013 61.7 186.9 125.2
2015 61.7 236.3 174.6
2017 61.7 321.2 259.5
2019 61.7 579.8 518.1
Source: Authors’ calculations based on model presented in appendix M.
TABLE 4.3 Gap between projected per-student expenditure needed
and current levels, the Philippines
percentage of GDP per capita
Year
2007 tertiary
expenditure
Projected tertiary
expenditure needed
Gap between
projected levels
needed and
2009 levels
2011 11.6 303.1 291.5
2013 11.6 359.6 125.2
2015 11.6 430.7 174.6
2017 11.6 536.4 259.5
2018 11.6 633.6 341.1
Source: Authors’ calculations based on model presented in appendix M.
magnitude above what the Philippines cur-rently spends. If 2007 per student expendi-ture levels are maintained as a share of GDP per capita, the fi nancing gap between needs and budgetary outlays is projected to reach about 300 percent of GDP per capita over the coming decade (table 4.3).
Mongolia’s smaller volume of tertiary enrollments and higher student-teacher ratios place recurrent expenditure pro-jections slightly lower than those for the Philippines. In later years, the simulation projects recurrent expenditures per stu-dent to rise to more than US$7,000 per year, while capital expenditures remain low. Recurrent expenditures rise abruptly as more faculty complete fellowships and training. Overall, these figures imply a fi nancing gap of 335 percent of GDP per capita by 2018 (table 4.4).
SummaryWhile these estimates are several orders of magnitude above what Indonesia, Mongolia, the Philippines, Vietnam, and most other countries in the region are now spending on tertiary education, they should be put in context. The estimates are broadly in line with what neighboring countries and other middle-income countries are spend-ing on higher education. Per student tertiary spending is more than US$12,000 in Japan, nearly US$10,000 in Brazil, and nearly US$7,000 in Chile.1 The United States spends US$24,370 per tertiary student per year, and the Organisation for Economic Co-operation and Development (OECD) average is US$11,512.2
Funding priorities
Attaining these spending targets appears very challenging in the short to medium term for all countries and should not be the cost norm for higher education in lower- and middle-income East Asia. This suggests the need for greater selectivity in the targets and in the activities to fi nance.
In line with the analysis of chapter 2, it is clear that not all countries need broad
coverage increases in the short to medium term, notably Indonesia and the Philippines. Increasing coverage is costly, raising quantity-quality trade-offs. It may also be diffi cult to reduce student-faculty ratios across the board, implying that the higher differentiation of the
PHEWEA.indb 103 10/11/11 7:37:10 PM

1 0 4 F I N A N C I N G H I G H E R E D U C A T I O N
higher education system in colleges and other short-term institutions required by the labor market of some countries may be achievable only gradually. And increasing faculty quali-fi cations may be possible only selectively, so only a few universities will probably ever develop credible research capacity (given the high requirements for faculty qualifi cations). Realistic targets will also vary by income-technology cluster.
In line with being more selective in the tar-gets is setting priorities for what higher edu-cation activities countries should spend on. Chapter 3 suggested that activities with high externalities or market failures are probably underfunded in the region and thus need to be prioritized. This is further supported in this chapter through an analysis of funding for research, cost constraints, and equity-enhancing interventions in the region. No sep-arate analysis is made for investment in STEM fi elds, but the low enrollment shares in several countries of the lower and middle technology clusters suggest that this is also an area with high positive externalities (for its links with innovation) that is being underfunded. While the focus here is on underfunded activities, spending also needs to continue or even be boosted on gradually increasing coverage in some countries, maintaining support to social science fi elds, and allowing for greater curric-ulum and degree diversifi cation when needed.
Funding for research The tight relationship between journals and tertiary research spending shows the benefi ts
of research in higher education (acknowledg-ing that journals are not the best metric to capture the desirable effects of research) and that obtaining results has a cost (fi gure 4.1). Chapter 1 showed that there is at least poten-tial and need for better supporting small and medium enterprises in technological devel-opment in lower-income countries, thus jus-tifying higher focus on research. Without investment in tertiary research, disconnects between research and teaching in higher education will continue.
Lower- and middle-income East Asia spend much less than upper-income East Asia in university research (figure 4.2). Overall, the low research spending of most lower- and middle-income East Asian countries points to a lack of priorities for research in higher education spending, low overall spending on research and develop-ment (science and technology), and low allocations of this spending for higher education. They also spend less than other lower- and middle-income countries out-side the region.
Cost constraints for poor and disadvantaged groups and country responsesWith large education needs and little lee-way in public funding, most countries in the region are starting to rely more on student fees to fi nance their institutions.3 Although positive from the perspective of state budgeting, using this source brings inclusiveness challenges.
This section documents the fee structures and related cost constraints that students in the region face—as well as the coun-try fi nancing policies to address these con-straints. The aim is to show that countries are still underspending on inclusiveness-en-hancing measures and to set the context for further discussion of what approaches could tackle inclusiveness.
Rich and poor countries operate with limited fiscal means and less than optimal institutional capacity, using a familiar mix of funding sources to fi nance higher educa-tion: tuition fees, government subsidies, and
TABLE 4.4 Gap between projected per-student expenditure needed
and current levels, Mongolia
percentage of GDP per capita
Year
2007 tertiary
expenditure
Projected tertiary
expenditure
needed
Gap between
projected levels
needed and
2009 levels
2011 17.1 117.5 100.4
2013 17.1 151.0 133.9
2015 17.1 199.3 182.2
2017 17.1 280.2 263.1
2018 17.1 352.6 335.5
Source: Authors’ calculations based on model presented in appendix M.
PHEWEA.indb 104 10/11/11 7:37:13 PM

F I N A N C I N G H I G H E R E D U C A T I O N 1 0 5
income from other sources. Tuition fees are equivalent to about a third or half of public university revenue in four of the fi ve countries, but only around a tenth in the Philippines (table 4.5).
The costs of tertiary education (tuition fees and associated living costs) affect how much a cash constraint can discourage oth-erwise talented students from enrolling and completing higher education. But financial aid can reduce that constraint.
The variables infl uencing the decision to pursue a tertiary education can be classifi ed as monetary and nonmonetary, with three types of monetary barriers (box 4.1). While these barriers will be affected by many vari-ables, fi nancial aid—in the form of assistance programs, scholarships, or loans—could address at least some of these constraints. It is the “net” costs (the costs less the fi nancial aid) that really matter.
Several East Asian countries have fi nan-cial aid policies to help students overcome the cost constraint. It is important to assess the full extent of the constraint. But the data do not allow a calculation of “net costs” because few household surveys include information on, say, scholarships. Secondary quantitative information can help in assessing the likely true costs.
Mongolia and Vietnam have used a fairly effective combination of instruments to increase access among the poor, and Thailand has been a pioneer in the use of student loans. But all lower- and middle-income countries in the region could implement more and better fi nancial aid policies. Beginning with a review of countries that have a combina-tion of instruments to tackle inclusiveness (Vietnam, Mongolia, China), this section then reviews countries that have more spe-cific instruments (Indonesia, Cambodia, Thailand, Malaysia).
Vietnam. In 2009, tertiary education costs (tuition fees, extra-class fees, living and accommodation costs) based on fees were estimated at 70 percent of household income for the poorest quintile, and 30 percent for the richest quintile (table 4.6).4
FIGURE 4.1 Research and development spending in tertiary
education as a share of GDP and journals, latest available year
Vietnam
China
ThailandMalaysia
Korea, Rep.
Singapore
Japan
0
.10
.20
.30
.40
.50
.60
.70
0 200 400 600 800 1,000journals per million people
R&D
sp
end
ing
in t
erti
ary
edu
cati
on
(%)
Sources: EdStats database; UIS (UNESCO Institute for Statistics) Data Centre.
FIGURE 4.2 Research and development spending in tertiary
education as a share of GDP, latest available year
0 .10 .20 .30 .40 .50 .60
Lao PDRVietnamMongolia
PhilippinesIndonesia
ChinaThailandMalaysia
Korea, Rep.Hong Kong SAR, China
SingaporeJapan
R&D spending in tertiary education (% of GDP)
Source: UIS Data Centre.
TABLE 4.5 Snapshot of public university revenue breakdown by
proportion of funding source, selected economies
percent
Economy
Government
subsidies Tuition fees Other income
China (2004) 47 30 23
Indonesia (2009) 56 38 6
Mongolia (2008)a 35 54 11
Philippines (2006) 73 11 16
Vietnam 50 45 5
Sources: China: OECD 2009a; Indonesia: World Bank 2010c (average of 82 universities); Mongolia: World Bank 2010d; Philippines: Orbeta 2008; Vietnam: World Bank 2010f.a. The government subsidy for Mongolia comprises funds from the state budget and the State Training Fund.
PHEWEA.indb 105 10/11/11 7:37:15 PM

1 0 6 F I N A N C I N G H I G H E R E D U C A T I O N
To address these constraints, Vietnam has a comprehensive package of strategies and instruments, including the expansion of the student loan scheme and the applica-tion of several other aid mechanisms.5 It has encouraged fee deductions and exemptions for the poor, revamped its aid scheme, and fi ne-tuned its loan program. Cost-recovery mechanisms rapidly increased the share of
tuition fees in the total revenue of higher edu-cation institutions. While this strategy has helped Vietnam expand the subsector rapidly without creating a heavy burden on the state budget, it has also jeopardized the capacity of some students and their families to pay. This risk has been mitigated to an extent: access to higher education by income quintile has become more equitable over time, as the gap
BOX 4.1 Determinants of higher education access
Both the academic literature and available data (mainly household surveys) show that the decision to attend tertiary education has monetary and non-monetary variables.
Monetary variables
Family income determines whether the student can afford the costs of the college. There are three mon-etary barriers to entry into tertiary education: the cost-benefi t barrier, the cash-constraint barrier, and the debt-aversion barrier.
Cost-benefit barrier: A certain segment of the population (usually, lower-income or minority groups), when deciding on whether to attend uni-versity or not, performs a cost-benefi t analysis of the costs of and expected returns to higher educa-tion. The barrier arises when the group decides that the cost of attending university is greater than its expected return to the education investment.
Cash-constraint barrier: Also known as the “liquidity” constraint, it occurs when students who have decided that the returns to education outweigh the costs still cannot put together the resources to obtain entry to universities. They believe in the value
of higher education but simply cannot afford to attend university even after pooling internal (family funds, savings, and wages) and external (grants and loans) funds. Financial aid, particularly the amount of aid, will increase liquidity.
Debt-aversion barrier: Described by the econo-mist Richard Thaler as an “internalized liquidity constraint,” debt aversion arises when an individual does not want to borrow even if he or she believes that the benefits of higher education outweigh the costs. Debt aversion occurs when this individ-ual refuses to use the funds at his or her disposal because part of the funds might be loans, which at some point will have to be repaid.
Nonmonetary variables
Parental education, race and ethnicity, gender, and geographical location—all play a role in the college decision-making process. So does prior academic achievement, measured by the rigor of secondary courses and the quality of that education.
Sources: Johnstone 2004; Usher 2005.
TABLE 4.6 Vietnam: Tertiary education costs per month, 2009
Income quintile
Average monthly
costs (US$)
Average monthly
income (US$)
Higher education costs
(% of income)
Poorest 67 95 70.1
Near poorest 83 152 54.2
Middle 95 212 44.8
Near richest 108 264 41.1
Richest 126 461 29.6
Source: Linh, Thuy, and Long 2010.
PHEWEA.indb 106 10/11/11 7:37:17 PM

F I N A N C I N G H I G H E R E D U C A T I O N 1 0 7
between the number enrolled from the poor-est quintile and the number enrolled from the top income quintile has signifi cantly declined, particularly in comparison to its middle-in-come neighbors (fi gure 4.3). This is not the result only of policies for higher education. Vietnam has also been active in supporting more equitable access to higher-quality pri-mary and secondary education, providing a larger potential pool for tertiary education.6 But tertiary education policies have comple-mented these efforts by supporting the higher transition of secondary graduates to tertiary education.
Since 1998 Vietnam has instituted policies to encourage fee deductions and exemptions, benefi ting poor and ethnic minority students. In 2006 about 22 percent of disadvantaged university students were benefi ting from sig-nifi cant fee deductions of up to 50 percent of tuition.7
Vietnam has also had student aid schemes since the mid-1990s. Since 2006 stu-dents from ethnic minorities have received lump-sum assistance of about D470,000 (US$25) a month—about a third of their overall monthly higher education costs. Recent evidence from household surveys con-fi rms that the program is well targeted, with benefi ts accruing largely to poor and ethnic minority groups.8 Since 2007 scholarships for poor students were also revised to cover the full tuition fees.
In addition to scholarships, Vietnam reformed its student loan scheme in 2006, increasing the amount of the loan by more than 250 percent (from D300,000 per month to D800,000 per month, or US$15 to US$41 per month) and lengthening the repayment period. The scheme now supports 29 percent of students enrolled in 103 universities.
Despite these positive steps, challenges remain, mainly to support greater equity in the access and completion of ethnic minor-ity groups. Persistent inequity in comple-tion rates indicates that the mechanisms are better at supporting initial enrollment than retention, which may require an examina-tion of the way these mechanisms support students while enrolled. Tying some of these
aid instruments to performance (or at least completion) could also be worth exploring, as would focusing more on pretertiary educa-tion and increasing the scholarship amount.
Mongolia. Mongolian bachelor’s degree students pay an average of US$270 per aca-demic year, roughly 16 percent of gross national income per capita, higher than in most OECD countries, on par with the Republic of Korea, and lower than in Chile. The fees in private tertiary institutions are similar. When living expenses are included, an average student has to spend nearly US$400 a year.9
Like Vietnam, Mongolia has also relied on a fairly effective mix of loans and scholarships to improve access to higher education. The State Training Fund provides about 28 per-cent of funding to tertiary education through grants and loans, with a need-based compo-nent.10 On average, a recipient student would
FIGURE 4.3 Change in ratio of tertiary enrollments and
completions for the poorest and richest quintiles, selected
East Asian economies
–100
–80
–60p
erce
nt
–40
–20
0
20
40
60
Cambodia Vietnam Indonesia Mongolia Thailand
low-income economies middle-income economies
enrollment completion
Source: Sakellariou 2010a.Note: Cambodia data are from 2009 and 1999; Indonesia data are from 2009 and 1998; Vietnam data are from 2008 and 1998; Mongolia data are from 2007 and 1998; Thailand data are from 2006 and 1996. Vietnam data include junior colleges and Indonesia data include tertiary diplomas.
PHEWEA.indb 107 10/11/11 7:37:18 PM

1 0 8 F I N A N C I N G H I G H E R E D U C A T I O N
receive 80 percent of tuition. These instru-ments help offset the cost of education for about 40 percent of students in the subsector, which may explain the higher coverage and relatively lower inequity in Mongolia. While a signifi cant fraction of the grants are need-based, they could be better targeted because of legislation that expanded eligibility to the children of civil servants. Today, about 40 percent of recipients are the children of civil servants (table 4.7), though this propor-tion has been declining slightly. If loan recipi-ents are employed for eight consecutive years, fi ve in a rural area, the loans are forgiven.
China . Tuit ion fees in 2004 were prominent sources of fi nancing and in the absence of financial aid could present a large cash-constraint barrier to enrollment and completion, particularly for the poor-est students. In Beijing average university tuition fees per year range from US$615 to US$806.11 Tuition fees are set differently for different courses and programs. The tuition for science and engineering ranges from US$674 to US$806 in these univer-sities, and for languages and medicine,
between US$732 and US$879. In addition to these fees, associated living costs are also high in China.
A combination of monetary instruments eases the barriers for the disadvantaged, but the outcomes have been mixed.12 The govern-ment has instituted both need-based and merit-based scholarship programs to cover tuition and living expenses. A national school-based loan program offers loans through commer-cial banks, to be repaid within six years of graduation. And loans by the National Devel-opment Bank must be repaid within 10 years after graduation.
Universities have the autonomy to admin-ister fi nancial aid—based on need or merit. But researchers have noted shortcomings. Need-based aid, administered by the state and by universities, is granted only to stu-dents majoring in the sciences or attending a fi rst- or second-tier university. And the aver-age scholarship amount, only about 15 per-cent of the average tuition fee, is too small to really make a difference (table 4.8). The stu-dent loan program, not income contingent, covers only a small proportion of students. A short repayment period is also taxing for
TABLE 4.7 Mongolia: State Training Fund recipients, by program area
Grants
2003 2004 2005
Number Percentage Number Percentage Number Percentage
Need-based grants 8,119 23.3 13,294 33.5 13,831 33.5
Disadvantaged group
grants 2,216 6.4 2,454 6.2 2,149 5.2
Merit-based grants 153 0.4 149 0.3 126 0.3
Public employee family
grants 15,915 45.7 16,335 41.2 16,428 39.8
Loans 8,409 24.2 7,390 18.6 8,696 21
Total 34,812 100 39,622 100 41,230 100
Source: World Bank 2010d.
TABLE 4.8 China: Net payment in regular universities, 2008
Average
tuition (US$)
Living cost
(US$)
Scholarship
(US$) Loan (US$)
Work study
(US$)
Net payment
(US$)
Net payment
(% of gross
family income)
895 141 138 62 37 799 30
Source: Min et al. 2009 in Ma 2010.
PHEWEA.indb 108 10/11/11 7:37:19 PM

F I N A N C I N G H I G H E R E D U C A T I O N 1 0 9
many recipients. Overall, even after scholar-ships and loans, students still need to spend on average about 30 percent of their gross family income on higher education (fees and living costs), a ratio that is certainly higher for lower-income families.
Other lower- and middle-income coun-tries in the region have had a more piecemeal approach to tackling inclusiveness issues. Indonesia and Cambodia have relied mostly on scholarships, and Thailand and Malaysia mostly on loans, with mixed effects.13
Indonesia. Private spending, primarily for tuition fees and levies, constitutes the bulk of financing for higher education.14 In 2009 the average spending per student per year was about US$2,200 in public institutions (tuition fees, student fees, and living expenses) and about US$1,200 in pri-vate institutions. Supporting one tertiary education student can cost up to a third of yearly income (fi gure 4.4), a share likely to be much higher for the poorest quintile, and even higher if the student is in a public institution.
To spur demand among the poor, the government introduced a full and partial scholarship scheme, but the scheme is tar-geted to students already enrolled in tertiary education, ignoring high school leavers who do not have the economic means to enroll. This may explain why enrollments in ter-tiary education remain very inequitably dis-tributed in the country. Moreover, fi nancial aid awarded to students enrolled in tertiary education covers only 3 percent of the cost,15 even though, according to national law, stu-dents are required to cover only up to 33 per-cent of tertiary educational costs. This may explain why Indonesia is the only country where completion gaps between the poorest and wealthiest population quintiles have been increasing (fi gure 4.4). While 20 percent of students from the poorest quintile are eligible for scholarships, these groups rarely receive scholarships because of narrow eligibility criteria (scholarships are also merit based). Overall, scholarships cover only 5.6 percent of the student population.16
Cambodia. Scholarships are the primary means of helping students overcome cost constraints. In 2000 a circular from the prime minister was issued to regulate the proportion of fee-paying students in public higher education institutions and stated that a third of students enrolled in public higher education institutions could be fee paying, with the remaining two-thirds on schol-arship.17 Scholarship students do not pay tuition fees, but the share of scholarships is modest and declining: 15.3 percent of students held scholarships in 2004–05 and 12.3 percent in 2007–08.
Over the past few years, Cambodia’s Department of Higher Education has devel-oped the selection processes to use the schol-arship scheme to promote equitable access to higher education, improving the equity of access for the poorest (see figure 4.3). But much more remains to be done. Of the scholarships awarded, 60 percent are based on merit and 40 percent go to priority can-didates. Of the priority scholarships, females receive 15 percent, the poor 15 percent, and those from rural areas 10 percent. So the pro-portion of need-based scholarships remains low. Moreover, the financial support has been signifi cantly less than the cost of study
45
26
32
0
5
10
15
20
25
30
35
40
45
50
public education private education all education
% o
f ho
use
ho
ld in
com
e
FIGURE 4.4 Indonesia: Tertiary education expenditure as a
percentage of annual household income
Source: World Bank 2010c.
PHEWEA.indb 109 10/11/11 7:37:27 PM

1 1 0 F I N A N C I N G H I G H E R E D U C A T I O N
and living (in effect, this is merely a tuition-free mechanism).
Thailand. The poorest household spends on average US$112 per month in higher educa-tion, about one-eighth of the spending of the richest household.18 But for the poorest fam-ilies, private spending on education is about 60 percent of their total income, and for the wealthiest, less than 1 percent (fi gure 4.5). Sending a child to school thus represents a signifi cant fi nancial burden for poor fami-lies, not only because of high costs associ-ated with attending higher education but also because of the opportunity costs of for-gone earnings.
These fi gures do not include loans, and Thailand has increased access to higher edu-cation through student loan programs.19 Thailand has also instituted a grant and scholarship scheme to increase tertiary access among the poor, such as the One District Scholarship and scholarships for low-income students, but coverage has remained very limited. It is Thailand’s stu-dent loan program for needy students that
has increased participation. To help lower-income students, government loans have to be repaid over 15 years at a 1 percent inter-est rate. To faciliate administration, the loans can be provided directly by universi-ties (box 4.2).
Results have been encouraging: there is evidence of significant effects on the par-ticipation of the poorest to higher education. These results could be improved with better targeting. There is also evidence suggest-ing that universities have extended loans to underqualified applicants to boost enroll-ment.20 The government is now attempting again to introduce an income-contingent loan system.
Malaysia. Tuition fees tend to be lower than in other countries, but total living costs are higher. Loans are the primary form of fi nancial aid for higher education, but the mechanism does not work equally well across fi elds and could be better targeted. A study to assess the effects of socioeconomic status on university education and social and economic mobility at the University of
FIGURE 4.5 Thailand: Private expenditure in higher education, by income quintile
Source: Socio-Economic Survey 2006, as cited in World Bank 2009a.
0
500
1,000
1,500
2,000
bah
t
2,500
3,000
poorest second third fourth richestincome quintile
0
10
20
30
% o
f to
tal e
xpen
dit
ure
40
50
60
70
monthly expenditure on education (left axis)
educational expenditure (right axis)
PHEWEA.indb 110 10/11/11 7:37:28 PM

F I N A N C I N G H I G H E R E D U C A T I O N 1 1 1
Malaya concluded that lower-income stu-dents were bound for certain disciplines, whereas upper-income students dominated fi elds with traditionally higher returns.21
While benefiting both public and pri-vate sector institutions, a positive feature rather unusual for the region, Malaysia’s student loan program could also be better targeted. The National Higher Education Fund Act 1997 provides for student loans to faciliate access to public and private higher education: full loans to students with fam-ily incomes below US$900, partial loans to cover tuition fees and part of living expenses to students with family incomes between US$1,001 and US$1,380, and partial loans to cover tuition fees for students with family income greater than US$1,381.22 Together with affirmative action policies pursued since 1971, these loans were instrumental in increasing Bumiputera enrollment in univer-sities (reaching 60 percent of overall enroll-ment in 2006). But while the coverage of the scheme and the volume of loans dispensed have increased, it is not means tested, imply-ing that there could be signifi cant leakages to the nonpoor. Very few loan recipients are not Bumiputera.23
Summary. First, countries should move to need-based scholarships , because merit-based ones do not promote inclusive-ness. Second, comprehensive packages—including fee deductions for disadvantaged groups, need-based scholarships, and stu-dent loans—have been more effective in addressing inclusiveness than more piece-meal approaches. Third, the effectiveness of specifi c instruments (separate or in a wider package) has varied significantly across countries depending on design and imple-mentation. Scholarships and loans have been more effective when covering a signifi -cant proportion of tuition costs and at least some living costs. Broad-based application across universities and fields has worked better than more selective application, when carefully targeted to disadvantaged groups.
How to fund priority activities
How should underfunded activities be financed? There is a clear case for public financing to support research and STEM capacity—and to address inclusiveness. Research and STEM are two areas with high positive externalities. While the initial
BOX 4.2 Evaluating the Student Loan Fund in Thailand
The Student Loan Fund, instituted by the Thai gov-ernment in 1996, was to increase access for low-income upper-secondary, vocational, and under-graduate students. The loans cover tuition fees, education-related costs, and living expenses. Only students from households earning less than US$4,300 a year are eligible for the need-based fund. Over the fi rst decade of implementation, US$5.7 billion was disbursed to more than 2.6 million students.
A recent evaluation examined the fund’s target-ing and whether it increased access for low-income students. Upper-secondary students were better tar-geted than undergraduate students. Only 7 percent of student loan recipients in upper secondary were
nonpoor, compared with 19 percent of undergradu-ate student loan recipients. The success in targeting upper-secondary students can be attributed partly to the closer relationships schools have with students and their families.
There were signifi cant effects on the decision to participate in higher education for those students whose family income was close to the poverty line,a but few effects on students with somewhat higher income, implying that the income limit for the loan was set too high.
Source: Tangkitvanich and Manasboonphempool 2010.a. The poverty line is approximately US$888 (B28,650) per year.
PHEWEA.indb 111 10/11/11 7:37:29 PM

1 1 2 F I N A N C I N G H I G H E R E D U C A T I O N
costs can be high, the social benefi ts are even higher, particularly in relation to their link with innovation. Private fi nancing tends to underfund these activities. For inclusiveness the case is based on the failures in capital markets: cost constraints are binding. So far, most scholarships have indeed been fi nanced with public money in the region. Countries thus need to assess their ability to allocate more public spending to higher edu-cation and, even more important, to fi nance key activities. This will help higher educa-tion institutions address skill and research disconnects—providing students with better skills and increasing the talent pool entering tertiary education, and building the capacity of institutions for research.
The scarcity of public resources requires better targeted resources and performance-based allocations. More efficient financing will also improve the match between skill provision and needs (first disconnect) and research provision and firm needs (second disconnect) by tying funds to relevant skills and research.
To maximize the leverage of public funds, it will be important to attract more private funds and correct market failures by provid-ing student loans. Within a coherent fi nanc-ing framework, private funding would not only complement public funding in fi nancing some of the above activities but also focus on system expansion and diversifi cation (target-ing some other country priorities, such as increasing enrollment or service-related disci-plines) through public and private delivery.
Increasing and prioritizing public spending
Public spending ratios vary substantially in East Asia and are not necessarily lower than in high-income East Asia (fi gure 4.6). Ter-tiary spending in relation to GDP is lowest in the Lao People’s Democratic Republic, Cambodia, and the Philippines. Ratios are higher in Vietnam, Indonesia, and particu-larly Malaysia. Spending ratios also differ substantially across high-income East Asia, with Hong Kong SAR, China, and Singapore
spending signifi cantly more than Japan and Korea.
These trends are the result of how coun-tries deal with funding trade-offs and tight budgets for the allocation of public funding across levels of education. In a few high-income economies in the region, Japan and Korea, for example, the long-standing policy has been to prioritize public funds for earlier levels of education, a policy stance that has had important implications for the strategies to expand and improve higher education over the years. Japan and Korea have relied heav-ily on private funding (both through public and private delivery). Middle- and lower-income countries in the region have not mobi-lized similar absolute levels of private sector fi nance for their systems. While they should strive to do more, public funding will remain critical.
Comparing public expenditure per tertiary pupil as a share of GDP per capita with coun-tries outside East Asia, spending is generally on the low side in East Asia’s middle-income countries even compared with other middle-income countries in other regions: Brazil, India, and Mexico all outspend them, apart from Malaysia (fi gure 4.7).
In a troubling trend, expenditure mea-sured this way has also tended to decrease across the region, especially in Cambodia and Lao PDR, where absolute per pupil tertiary expenditure was already low (figure 4.8). Middle-income countries have also reduced such spending but, except for Malaysia, by much smaller margins.
These data suggest that several countries may have scope for further public spending in tertiary education, but do they have the potential? A look at the ratios of tertiary spending to total education spending and of total education spending to GDP casts light on this issue. According to these two indica-tors, Mongolia and Thailand are the coun-tries with most potential.
Hong Kong SAR, China; Singapore; and Malaysia spend the most on tertiary educa-tion as a share of total education, at around 30 percent (figure 4.9). Japan and Korea allocate less than 20 percent of their public
PHEWEA.indb 112 10/11/11 7:37:30 PM

F I N A N C I N G H I G H E R E D U C A T I O N 1 1 3
education spending to tertiary education, as do the Philippines, Thailand, Mongolia, Lao PDR, and Cambodia. A comparison with lower- and middle-income countries outside the region can suggest some room for real-location within education budgets.
But the real room for intrasectoral reallo-cation in favor of tertiary education is proba-bly not very large, given the many competing needs in other parts of the education system24 and the fairly low overall education spending as a share of GDP in several countries (fi gure 4.10). This is particularly so for Lao PDR, Cambodia, and the Philippines. Thailand and Mongolia may have more leeway. (Ter-tiary education shares have also been grow-ing in most countries since the beginning of the decade, thus providing less scope for reallocation.)
To increase spending in tertiary education, Lao PDR, Cambodia, and the Philippines should consider increasing their education spending in relation to GDP. High tax shares to GDP would suggest more potential for public spending increases.
Given the many competing needs, pri-oritizing public spending and improving effi ciency in the allocation and use of pub-lic funding will be critical. In cases such as Vietnam, Indonesia, and Malaysia, which already spend above the average in tertiary education, a fi rst imperative will be to ensure higher public spending shares for research, STEM, and scholarships. Further evidence comes from comparing overall public ter-tiary spending in relation to GDP with ter-tiary research spending in relation to GDP (figure 4.11) across East Asian economies. While these two indicators are not strictly comparable (research and development funds include both public and private funds), they offer insights into the different priority given to research within public budgets for higher education. It is definitely much lower in lower- and middle-income economies than in upper-income ones. In the middle technology cluster, China leads.
Lower- and middle-income East Asia need to increase public spending for research in ter-tiary education. There is no ideal benchmark,
FIGURE 4.6 Public tertiary expenditure as a share of GDP, latest
available year
0.05
0.21
1.18
0.93
0.34
1.2
0.71
1.69
0.63
1.03
1.07
0.61
0 0.5 1.0 1.5 2.0
Cambodia
Lao PDR
Vietnam
Mongolia
Philippines
Indonesia
Thailand
Malaysia
Korea, Rep.
Hong Kong SAR, China
Singapore
Japan
share of GDP (%)
Source: UIS Data Centre.
and lower-income and lower technology clus-ter countries clearly do not have the same room or even scope for increases in research as other countries. But further effort is needed. And in a broader sense, funding for research can also support the development of future researchers for both universities and the private sector. Scholarships for talented students in Thailand illustrate this option well (box 4.3).
Increasing effi ciency of public spending
Prioritizing public spending will be neither successful nor suffi cient without effi ciency improvements.
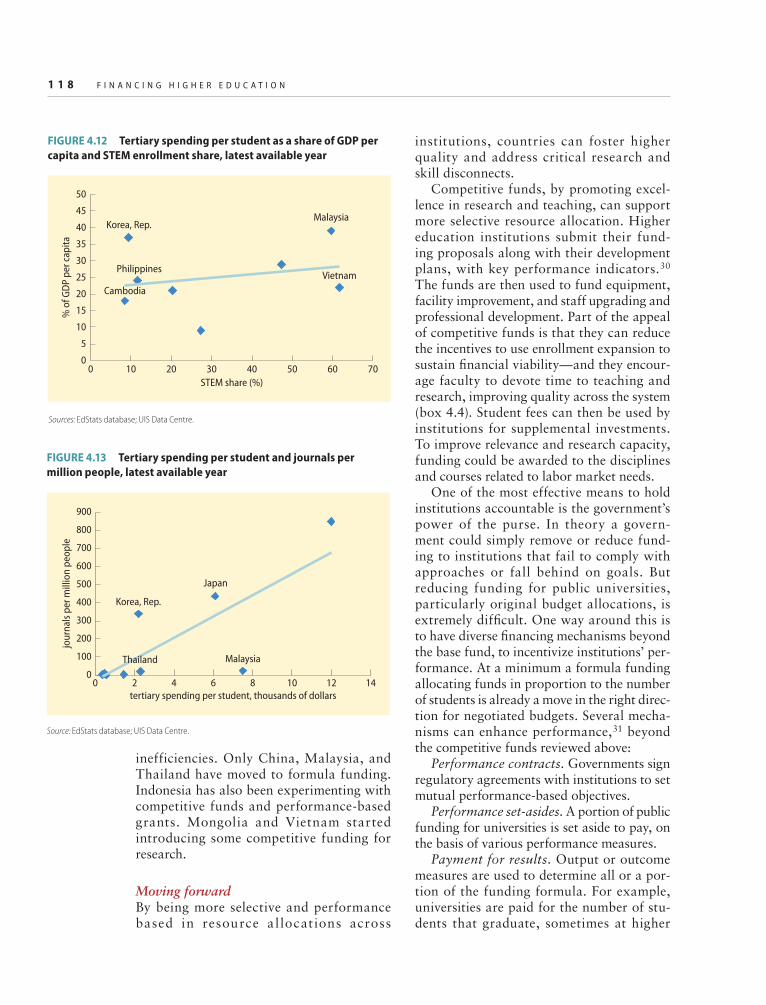
Effi ciency gapsMost countries could be more efficient in the way they use and allocate public resources—as is also evident from the large spending gaps. For example, a very simple comparison of higher education outcomes—the STEM share and the number of journal articles—and spending indicators25 suggests that Cambodia, Malaysia, the Philippines, and Vietnam are less efficient than Korea in supplying STEM, and that Malaysia and Thailand are less efficient in translating
PHEWEA.indb 113 10/11/11 7:37:32 PM

1 1 4 F I N A N C I N G H I G H E R E D U C A T I O N
funds into journal articles than Japan and Korea (fi gures 4.12 and 4.13).
Some of these differences may simply be caused by different levels of private resources invested into the system, either through fees in public institutions or private delivery. And they suggest different uses of funds as much as ineffi cient use and allocation of these funds (for instance, a limited priority on STEM spending). But there is no obvious relation between private fees in public institutions and results, and private delivery tends to be more focused on teaching than research and
within teaching on non-STEM fi elds. Malay-sia’s high spending indicators in relation to the outcomes suggest some ineffi ciency.
Beyond the poor targeting of their schol-arships, most countries spread their public resources for teaching and research too thinly among institutions, and few have competitive (or other performance-driven) funding to trigger systemic change.
Governments across the world are turn-ing to allocating resources to develop premier research (and teaching) universities. This move toward directing substantial resources
FIGURE 4.7 Public expenditure per tertiary pupil as a share of GDP per capita, 2006–07
Source: UIS Data Centre.Note: Although some countries have 2008 data, the 2006–07 range was maintained for comparability across countries.
b. Middle-income economies, East Asia
0
20
40
60
80
Malaysia Mongolia Philippines Thailand
shar
e o
f GDP
per
cap
ita
(%)
a. Low-income economies, East Asia
shar
e o
f GDP
per
cap
ita
(%)
0
10
20
30
40
50
60
70
Cambodia Lao PDR Vietnam
c. Other middle-income economies
shar
e o
f GDP
per
cap
ita
(%)
0
20
40
60
80
Brazil Chile India Mexico
d. High-income economies, East Asia
shar
e o
f GDP
per
cap
ita
(%)
0
20
40
60
80
Hong Kong SAR,
ChinaJapan Korea, Rep.
e. Other high-income economies
shar
e o
f GDP
per
cap
ita
(%)
0
20
40
60
80
Finland United Kingdom United States
PHEWEA.indb 114 10/11/11 7:37:33 PM

F I N A N C I N G H I G H E R E D U C A T I O N 1 1 5
a. Low-income economies
0
30
60
90
120
150
1998 2000 2002 2004 2006 2008 2009sh
are
of G
DP
per
cap
ita
(%)
Lao PDR Nepal Bangladesh Cambodia
b. Middle-income economies
0
30
60
90
120
150
1998 2000 2002 2004 2006 2008 2009
shar
e o
f GDP
per
cap
ita
(%)
India Mexico Malaysia Brazil Thailand
Mongolia Indonesia Chile Philippines
c. High-income economies
0
30
60
90
120
150
1998 2000 2002 2004 2006 2008 2009
shar
e o
f GDP
per
cap
ita
(%)
Hong Kong SAR, China Finland Singapore United Kingdom
United States Japan Korea, Rep.
FIGURE 4.8 Public expenditure per tertiary pupil as a share
of GDP per capita, 1998–2009
Source: EdStats database.
to a few premier institutions is partly a response to the large resources universities need to undertake high-level research (and teaching), which makes selectivity impor-tant. Harvard University had an endowment of US$37 billion, and annual spending of US$3.2 billion, and per student spending of US$105,041 before the crisis. Other top uni-versities have expenditures in similar orders of magnitude.
Dedicating substantial resources to a few premier institutions that attain international standards, in teaching or research, can be one way to reverse a trend of low-cost and low-quality education. Pursuing this path, governments need to identify programs or departments (not necessarily an entire insti-tution) that have good potential.
Most high-income (and a few middle-income) East Asian economies have started moving this way. Through the World Premier International Research Center Initiative, Japan intends to make Tokyo, Tohoku, Kyoto, and Osaka universities, as well as the National Institute for Material Sciences, a public research institute, its core research bodies.26 Korea is raising the caliber of its universities through the Brain Korea 21 Project.27 The government in Hong Kong SAR, China, has set up fi ve research centers under the Hong Kong SAR, China, Research and Development Centers Program to lead and focus research on 13 priority sectors.28 In Taiwan, China, the authorities have allocated a budget of NT$65 billion for the Developing Top Grade Universities and Research Centers to be spent between 2008 and 2015.
Some middle-income countries also have started to move in this direction. Malaysia identified four universities as its main research universities. China identified 100 research universities for increased support (about 6 percent of its universities). With these exceptions, however, most countries in the lower and middle technology cluster are still thinking of roughly equal allocation of resources across institutions. Illustrating a new mindset, the Philippine government will spend US$70 million in 10 years to set up the Engineering Research and Development for
PHEWEA.indb 115 10/11/11 7:37:34 PM

1 1 6 F I N A N C I N G H I G H E R E D U C A T I O N
a. Low-income economies, East Asia
0
10
20
30
40
Cambodia Lao PDR Vietnam
shar
e o
f pu
blic
edu
cati
on
exp
end
itu
re (%
)
b. Other low-income economies
0
10
20
30
40
Bangladesh Ghana Nepal
shar
e o
f pu
blic
edu
cati
on
exp
end
itu
re (%
)
d. Other middle-income economies
0
10
20
30
40
Brazil Chile India Mexico South Africa
c. Middle-income economies, East Asia
0
10
20
30
40
Malaysia Mongolia Philippines Thailand
shar
e o
f pu
blic
edu
cati
on
exp
end
itu
re (%
)
shar
e o
f pu
blic
edu
cati
on
exp
end
itu
re (%
)
e. High-income economies, East Asia
0
10
20
30
40
Hong Kong
SAR, China
Japan Korea, Rep. Singapore
shar
e o
f to
tal p
ub
lic
edu
cati
on
exp
end
itu
re (%
) f. Other high-income economies
0
10
20
40
30
Finland United Kingdom United States
shar
e o
f to
tal p
ub
lic
edu
cati
on
exp
end
itu
re (%
)
FIGURE 4.9 Public tertiary education expenditure as a share of total public education expenditure, 2006–07
Source: UIS Data Centre.Note: Although some countries have 2008 data, the 2006–07 range was maintained for comparability across countries.
1.60
2.27
5.34
5.60
2.80
2.82
1.91
4.12
4.13
4.23
4.49
3.28
3.46
4.53
0 1 2 3 4 5 6
Cambodia
Lao PDR
Vietnam
Mongolia
Philippines
Indonesia
China
Thailand
Malaysia
Korea, Rep.
Hong Kong SAR, China
Singapore
Japan
World
share of GDP (%)
FIGURE 4.10 Overall public education expenditure as a share of GDP, latest year
Source: WDI database.
PHEWEA.indb 116 10/11/11 7:37:35 PM

F I N A N C I N G H I G H E R E D U C A T I O N 1 1 7
FIGURE 4.11 Research and development spending and
total public spending in tertiary education, latest available
year
0 0.2 0.4 0.6 0.8 1.0 1.2 1.4 1.6 1.8
Lao PDR
Vietnam
Mongolia
Philippines
Indonesia
China
Thailand
Malaysia
Korea, Rep.
Hong Kong SAR, China
Singapore
Japan
% of GDP
tertiary spending tertiary R&D spending
Source: UIS Data Centre.Note: Data on tertiary spending as a share of GDP for China are estimates.
Technology Program, a consortium of eight top engineering universities.29
Some gradualism for investing in centers of excellence is warranted. It is important to create an environment that allows excellence to emerge, and once identifi ed, to build on the comparative strengths of various institutions and their academic offerings. This requires setting up a more autonomous and competi-tive governance framework for all universi-ties (discussed in the next chapters). Also useful is a competitive (or other performance-driven) process to target the resources at the best research institutions. In Japan research funding is allocated through competitive bid-ding rather than being distributed in prede-termined amounts. More generally, perfor-mance-based allocations can trigger systemic changes in quality—improving the effective-ness of both teaching and research (even in fi elds that have less scope to be fi nanced with public funds).
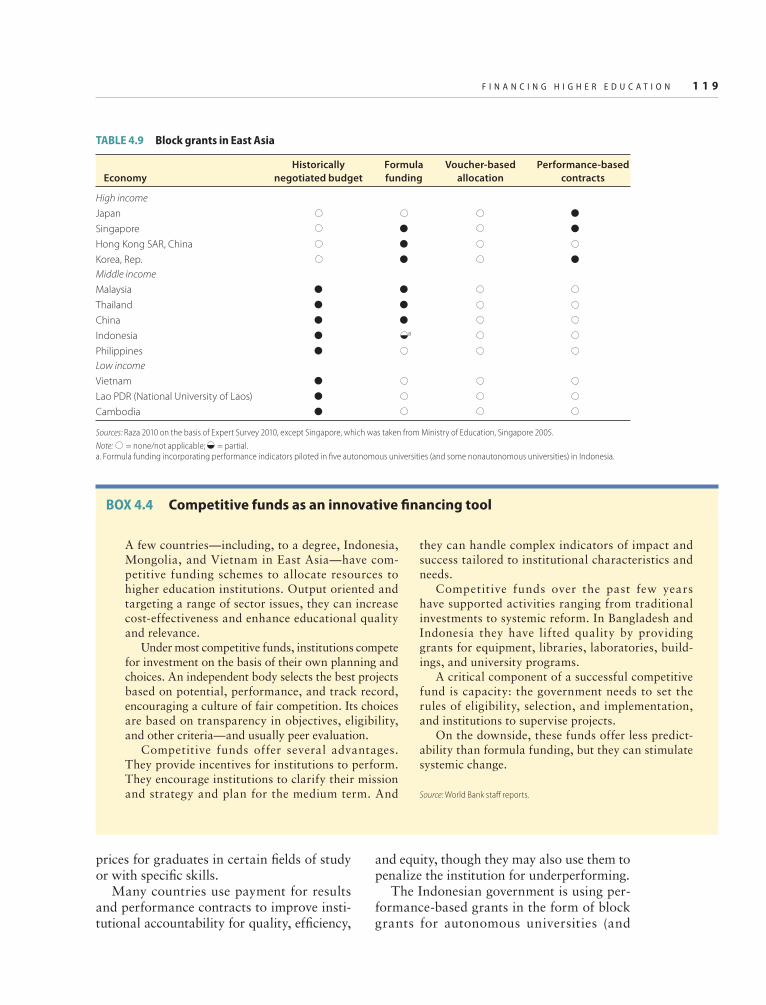
Lower- and middle-income East Asia still have a long way to go to improve alloca-tion mechanisms of public funds to improve skills and research. Most countries, usually in a centralized system, still use historically negotiated budgets (table 4.9), leading to
BOX 4.3 Overseas scholarships for outstanding students from Thailand
The Thai government has various scholarship and loan programs. Some are explicitly targeted at the poor to increase access among disadvantaged groups. Others are merit based and aim to develop the techni-cal skills of the next generation of Thai leaders, both in academia and government. Among the two most prestigious of these types of scholarships are the King Scholarships and the Anandamahidol Scholarships.
King Scholarships. The King Scholarships were established in 1897 by King Rama V and are awarded to outstanding students every year. The scholarship presentation was stopped in 1932 because of politi-cal instability but was restored in 1964 by the cur-rent king, Rama IX. Several scholarships are given
to secondary school graduates each year to continue undergraduate study in foreign countries. The candi-dates are selected by academic performance, writing tests, and interviews.
Anandamahidol Scholarships. The Anandama-hidol Foundation was established by King Rama IX to provide graduate-level study scholarships for students willing to continue postgraduate studies in high-income countries. The scholarships’ main goal is to support students pursuing degrees in one of the eight fi elds identifi ed as crucial for national develop-ment, including science and technology.
Source: World Bank 2009a.
PHEWEA.indb 117 10/11/11 7:37:37 PM
1 1 8 F I N A N C I N G H I G H E R E D U C A T I O N
inefficiencies. Only China, Malaysia, and Thailand have moved to formula funding. Indonesia has also been experimenting with competitive funds and performance-based grants. Mongolia and Vietnam started introducing some competitive funding for research.
Moving forwardBy being more selective and performance based in resource al locations across
institutions, countries can foster higher quality and address critical research and skill disconnects.
Competitive funds, by promoting excel-lence in research and teaching, can support more selective resource allocation. Higher education institutions submit their fund-ing proposals along with their development plans, with key performance indicators.30 The funds are then used to fund equipment, facility improvement, and staff upgrading and professional development. Part of the appeal of competitive funds is that they can reduce the incentives to use enrollment expansion to sustain fi nancial viability—and they encour-age faculty to devote time to teaching and research, improving quality across the system (box 4.4). Student fees can then be used by institutions for supplemental investments. To improve relevance and research capacity, funding could be awarded to the disciplines and courses related to labor market needs.
One of the most effective means to hold institutions accountable is the government’s power of the purse. In theory a govern-ment could simply remove or reduce fund-ing to institutions that fail to comply with approaches or fall behind on goals. But reducing funding for public universities, particularly original budget allocations, is extremely diffi cult. One way around this is to have diverse fi nancing mechanisms beyond the base fund, to incentivize institutions’ per-formance. At a minimum a formula funding allocating funds in proportion to the number of students is already a move in the right direc-tion for negotiated budgets. Several mecha-nisms can enhance performance,31 beyond the competitive funds reviewed above:
Performance contracts. Governments sign regulatory agreements with institutions to set mutual performance-based objectives.
Performance set-asides. A portion of public funding for universities is set aside to pay, on the basis of various performance measures.
Payment for results. Output or outcome measures are used to determine all or a por-tion of the funding formula. For example, universities are paid for the number of stu-dents that graduate, sometimes at higher
FIGURE 4.12 Tertiary spending per student as a share of GDP per
capita and STEM enrollment share, latest available year
Cambodia
VietnamPhilippines
MalaysiaKorea, Rep.
0
5
10
15
20
25
30
35
40
45
50
0 10 20 30 40 50 60 70
STEM share (%)
% o
f GDP
per
cap
ita
Sources: EdStats database; UIS Data Centre.
FIGURE 4.13 Tertiary spending per student and journals per
million people, latest available year
Source: EdStats database; UIS Data Centre.
Thailand Malaysia
Korea, Rep.
Japan
0
100
200
300
400
500
600
700
800
900
0 2 4 6 8 10 12 14tertiary spending per student, thousands of dollars
jou
rnal
s p
er m
illio
n p
eop
le
PHEWEA.indb 118 10/11/11 7:37:38 PM
F I N A N C I N G H I G H E R E D U C A T I O N 1 1 9
prices for graduates in certain fi elds of study or with specifi c skills.
Many countries use payment for results and performance contracts to improve insti-tutional accountability for quality, effi ciency,
and equity, though they may also use them to penalize the institution for underperforming.
The Indonesian government is using per-formance-based grants in the form of block grants for autonomous universities (and
TABLE 4.9 Block grants in East Asia
Economy
Historically
negotiated budget
Formula
funding
Voucher-based
allocation
Performance-based
contracts
High income
Japan ●
Singapore ● ●
Hong Kong SAR, China ●
Korea, Rep. ● ●
Middle income
Malaysia ● ●
Thailand ● ●
China ● ●
Indonesia ● a
Philippines ●
Low income
Vietnam ●
Lao PDR (National University of Laos) ●
Cambodia ●
Sources: Raza 2010 on the basis of Expert Survey 2010, except Singapore, which was taken from Ministry of Education, Singapore 2005.
Note: = none�not applicable; = partial.a. Formula funding incorporating performance indicators piloted in fi ve autonomous universities (and some nonautonomous universities) in Indonesia.
BOX 4.4 Competitive funds as an innovative fi nancing tool
A few countries—including, to a degree, Indonesia, Mongolia, and Vietnam in East Asia—have com-petitive funding schemes to allocate resources to higher education institutions. Output oriented and targeting a range of sector issues, they can increase cost-effectiveness and enhance educational quality and relevance.
Under most competitive funds, institutions compete for investment on the basis of their own planning and choices. An independent body selects the best projects based on potential, performance, and track record, encouraging a culture of fair competition. Its choices are based on transparency in objectives, eligibility, and other criteria—and usually peer evaluation.
Competitive funds offer several advantages. They provide incentives for institutions to perform. They encourage institutions to clarify their mission and strategy and plan for the medium term. And
they can handle complex indicators of impact and success tailored to institutional characteristics and needs.
Competitive funds over the past few years have supported activities ranging from traditional investments to systemic reform. In Bangladesh and Indonesia they have lifted quality by providing grants for equipment, libraries, laboratories, build-ings, and university programs.
A critical component of a successful competitive fund is capacity: the government needs to set the rules of eligibility, selection, and implementation, and institutions to supervise projects.
On the downside, these funds offer less predict-ability than formula funding, but they can stimulate systemic change.
Source: World Bank staff reports.
PHEWEA.indb 119 10/11/11 7:37:39 PM
1 2 0 F I N A N C I N G H I G H E R E D U C A T I O N
some nonautonomous universities). This allows flexibility and some accountability. Performance-based grants provide budget-ary support, conditional on the universities’ meeting certain performance targets at the department and unit level.32
In Singapore, to accompany the cor-poratization of the National University of Singapore and the National Techno-logical University in 2006, the govern-ment adopted new ways of holding them accountable. Besides requiring an external quality assurance process, the government mandates policy agreements and perfor-mance contracts. Policy agreements allow the Ministry of Education to provide stra-tegic direction to the higher education sec-tor with clear goals for universities to guide them in formulating policy and ensure that they are following the necessary conditions to receive government funding. Performance contracts are established with each univer-sity for fi ve years. These set out the goals for teaching, research, service, and organi-zational development. Linked to each goal are clear targets and performance indica-tors. The ministry also sets workforce tar-gets linked to public fi nancing.33
Korea has also focused more on account-ability for public fi nancing. In 1995 all major funding programs were restructured along the lines of performance contracts. The gov-ernment evaluates the institutions’ achieve-ments against preset criteria. Under the Brain Korea 21 project and the New Universities for Regional Innovation project, contracts are established between participating institutions and the government. If the institutions breach the contract, they face government-imposed penalties, usually fi nancial.
These mechanisms may, however, have led to excessive regulation in Korea, highlight-ing the diffi culty of achieving the right bal-ance between accountability and autonomy (see chapter 5).34 More generally, there may be some tension between performance con-tracts and higher accountability to university boards if the contracts limit the capacity of the boards to freely fi x at least some institu-tional objectives.
Performance-based funding requires cau-tion in its design, particularly performance set-asides, if there are no clear precedents. The value of performance set-asides depends on the amount and the indicators to assess institutional success. The set-aside can vary from 5 percent to 100 percent, and indica-tors can also vary from 1 to 12 or more. But South Carolina provides a cautionary tale in the United States. South Carolina allocated 100 percent of its recurrent budget on numer-ous performance indicators. The program failed simply because institutions could not comprehend a clear vision of success because of the many indicators and standards built into the system.35
Countries can also improve the targeting of scholarships and loans to the poorest and disadvantaged groups. Targeting is a par-ticularly serious issue in Cambodia, Indo-nesia, and Mongolia. To improve targeting, governments need the capacity to identify disadvantaged students, inform them of aid opportunities, and monitor their perfor-mance once enrolled.
Finally, efficiency gains can be made at the level of individual public institutions. Scholars have noted two main ways for governments to promote internal effi ciency and sustainability: by moderating costs to conserve resources and by maintaining or increasing the rate at which students com-plete their programs and receive degrees.36
Mobilizing private funding and developing student loans
Recent research points to two interrelated elements of successful pro-equity financ-ing for higher education: variable fees for students and income-contingent loans. Where these instruments have been imple-mented well, higher education systems have increased access for the poor and disadvan-taged while recovering costs.
Variable fees Countries across the globe charge vary-ing tuition fees, depending on their higher education structure. Japan, Korea, and the
PHEWEA.indb 120 10/11/11 7:37:41 PM

F I N A N C I N G H I G H E R E D U C A T I O N 1 2 1
United States, all countries with steep pri-vate sector participation in higher education, charge fairly high tuition fees as measured by percentage of GDP per capita. Canada and the United Kingdom, by contrast, have larger public sector financing and lower tuition fees.
Variable (or liberalized) fees—set by uni-versities—offer several benefi ts over a fl at fee. They can increase the resources entering the higher education system by being open ended, and they can increase competition among universities, increasing quality and relevance, as well as the effi ciency of resource use.37 And by being akin to income transfers to targeted income groups, they have the potential to be more equitable than other approaches to rev-enue generation, especially when they are set at higher rates for those who can afford them and are combined with redistributive policies to help poorer students pay those fees.38
In most variable fee schemes, the govern-ment usually places a ceiling on the maxi-mum39 and has most students make at least some contribution toward their education, though exempting qualified poor students from fees based on need and equity helps ensure that they are not excluded or sent to low-cost and possibly low-quality institu-tions. Otherwise, requiring students to pay at least some of the cost generally improves their motivation and performance. Of course, governments will differ in what the variable fee structures and ceilings should be to ensure access, equity, and cost-recovery.40
East Asia has more scope for using variable fee schemes, by applying more
systematically differentiated fee structures, determined either by the government or by the universities. Vietnam has a partly dif-ferentiated fee structure (through partial fee deductions, and liberty to fi x higher fees for students enrolled outside the regular stu-dent quota), a strategy applied with some success. Combined with redistributive poli-cies to promote access, variable fees can be progressive. Despite lack of formal evalu-ations, Mongolia and Vietnam argue for need-based scholarships. Supporting stron-ger university-industry links and nontuition private resources are other ways to leverage private funds (box 4.5).
Income-contingent loans A second pillar of an effective financing scheme for higher education is income-contingent loans. Traditionally, student loan programs have been either a conventional mortgage-type loan (the loan of choice in many countries, which usually requires repayment after graduation with varying repayment periods) or an income-contingent loan. Capital for a mortgage-type loan41 may come from the government or a lend-ing institution. If the government is not the lender underwriting the loan, it can provide interest subsidies and default assurance, while allowing the lender to administer the loan. These types of loans can be means tested, and target students below a certain income threshold, or they can be academic merit loans, which target students who score high on entrance or exit exams. To ensure equity, loan designers also need to take into account the choice of higher education insti-tution (public or private, accredited or not), location (in state, out of state, foreign), and status of study (full time or part time)—all factors that may affect loan access.
More governments recognize that income-contingent loans are better for access (box 4.6). Repayment is contingent on the future income of the borrower: people with low earnings make low repayments, and peo-ple with low lifetime earnings do not repay the loan principal in full. Such a loan pro-tects a student from excessive risk and can
TABLE 4.10 Average tertiary tuition fees
percentage of GDP per capita
Economy Tuition fees
Australia 34.8
Canada 20.6
Japan 60.3
Korea, Rep. 56.7
New Zealand 38.5
United Kingdom 18.5
United States 36.7
Source: OECD 2008b.
PHEWEA.indb 121 10/11/11 7:37:43 PM
1 2 2 F I N A N C I N G H I G H E R E D U C A T I O N
promote effi ciency (by the protection from risk) and access (fees fi nanced by the loans free resources for access).
How large should loan entitlement be? Experts argue that it should be enough to cover tuition fees and living expenses.42 And it should carry an interest rate similar to the
government’s cost of borrowing. For students (only while they are students), this means that their tertiary education is effectively free, financed through taxation and an income-related government contribution. While they are students, they pay nothing at the time, a fact compatible with government efforts
BOX 4.5 Matching funds in Hong Kong SAR, China, and Singapore
One of the key reasons Hong Kong SAR, China, and Singapore have mobilized public and private funding for university research is that they both have effec-tive government matching-fund programs and favor-able tax incentives. By using public-private partner-ships, they have strengthened the capacity for raising the independent income of colleges and universities and contributed to a philanthropic culture support-ing higher education.
Starting in 2002, Hong Kong SAR, China, pro-vided nearly HK$7 million of seed money to 12 institutions to improve fund-raising capacity. To encourage private donations to higher education, the government also raised the ceiling for tax-exempt donations from 10 percent of income or profi ts to 25 percent. And to support research in universities, it created a national fund of HK$1 billion for match-ing grants on a ratio of 1 to 1. Under the scheme, the government set a fl oor—a guaranteed minimum that
each institution could access by raising donations to that amount. This structure gave smaller institutions a fair chance to raise funds while encouraging com-petition among institutions and raising the profi le of private philanthropy.
Singapore has also mobilized large funds for uni-versity research through its matching-fund program. Although the government has traditionally invested a relatively larger share of public resources in university research, it has augmented this investment by encour-aging private participation. Starting in 1991, it began encouraging philanthropic support to research uni-versities with a matching ratio of 3 to 1. Private dona-tions were also eligible for double tax deductions.
The success of both schemes points to strong institutional capabilities, as well as conducive legis-lative climates and applicable tax laws.
Source: Sutton Trust 2004.
BOX 4.6 Advantages of income-contingent loans
Income-contingent loans have three main advan-tages over conventional mortgage-type loans.
Credit reputation. A bank- or government-guaranteed mortgage-type student loan protects the bank or the government in case of default but offers no protection to the borrowers. If a student is unable to fi nd employment that enables him or her to repay the loan, he or she may have to declare bankruptcy, impairing access to credit later in life.
Access to loans. Conventional mortgage-type bank loans usually are available only to students
of threshold economic means, whereas govern-ment income-contingent loans are available to most students.
Repayment. Conventional mortgage-type loans are generally characterized by a repayment period where the borrower makes set payments over a spec-ifi ed period. Without the income-contingent part of the loan, a borrower may have diffi culty in repaying the borrowed amount plus interest.
Source: Johnstone 2004.
PHEWEA.indb 122 10/11/11 7:37:44 PM
F I N A N C I N G H I G H E R E D U C A T I O N 1 2 3
to improve access. Ministries of fi nance, of course, bear the burden of upfront costs and receive repayments only later. Income-contin-gent loans have been applied with varying suc-cess across the world, starting with Australia (box 4.7). Most other countries with income-contingent loan programs are in Europe.
But student loan schemes are not with-out financial risk. They may differ in the underlying objectives and in organizational structure, sources of initial funding, student coverage, loan allocation procedures, and collection methods. However, they almost always share a common trait: they are highly subsidized by governments. Unlike commer-cial loans, a sizable proportion of the total student loan outlay usually is not paid back. Experts note that this gap between total loan disbursements and overall loan recovery is the result of two elements: (a) built-in inter-est rate subsidies, incorporated in the design of the loan scheme, and (b) ineffi ciencies in running the scheme, in substantial repayment default and high administration costs. Lend-ing conditions for almost all government-sponsored loans are “softer” than those for regular commercial loans. This is a student
subsidy in the sense that the borrower is not required to pay back the full value of the loan received, thanks to below-market interest rates on the loan, periods when no interest is levied on outstanding debt (both during study and in grace periods after study), and repayments not linked to infl ation.
Some general steps can improve the fi nancial viability and cost recovery of loan schemes. Governments can reduce the built-in subsidies (hidden grants). They can improve the effi ciency of loan schemes through con-taining administration costs. Or they can reduce repayment leaks caused by default.
Some countries have taken steps in these directions. The Canada Student Loan Pro-gram, for example, charges a zero nominal interest rate, subsidized by the government, during the period of study, whereas the post-study repayment rate of interest is high (prime plus 2.5 percent), resulting in an overall loan system repayment ratio that nears 100 per-cent.43 In the Czech Republic the interest rate charged throughout the period of the loan is fairly high (above 12 percent), resulting in an overall system repayment ratio of more than 108 percent. Japan’s loan programs have
BOX 4.7 The higher education contribution scheme in Australia
Australia became the first country to adopt a national income-contingent loan policy to fi nance higher education, in 1989. Under the Higher Edu-cation Contribution Scheme, all Australian under-graduates pay a uniform tuition fee (in 1989, the fee was $A 2,250 a year), to be repaid in propor-tion to future income. The fee could be either an upfront fee, in which case students received a dis-count, or a deferred fee, in which case repayment was delayed until after graduation. The minimum income threshold for repaying the loan was set at $A 27,700 in 1989, with graduates paying 2 per-cent of their taxable income; the rate was progres-sive, rising to 4 percent for those at higher incomes. In 1997, average charges for courses increased by 40 percent, and more important, a differential fee
structure was introduced. And the income threshold at which repayment was mandatory was decreased to $A 23,000.
Apart from revenue generation, the main aim of the scheme was to improve access, particularly among disadvantaged youth. It partly succeeded because—though overall higher education participa-tion increased when it was introduced, and though students from higher income levels were more likely to attend university—the participation rate for students from lower-income backgrounds did not decrease. And the differential fee structure initiated in 1997 increased higher education enrollment for students from all backgrounds.
Source: Johnstone 2004.
PHEWEA.indb 123 10/11/11 7:37:45 PM

1 2 4 F I N A N C I N G H I G H E R E D U C A T I O N
charged higher interest rates and achieved an overall recovery ratio of 68.3 percent (imply-ing a 30 percent government subsidy).
Clearly, these options may not be the most attractive for countries confronting the ten-sion between cost recovery and equitable inclusion. The key issue is cost-effectiveness. At what level should the built-in loan subsidy be set for student groups, particularly the poor and disadvantaged, to ensure adequate revenue, appropriate opportunity, and desired outcomes?
Hong Kong SAR, China, and Korea offer useful lessons for how to reconcile fi scal sus-tainability with equity through tiered student loans. Korea enacts no fewer than six differ-ent types of student loan schemes—targeted to different segments of the population—to increase access and promote cost recovery.44 The separate loan schemes administered by Korea’s Ministry of Education, the Human Resources Development Fund, and the Korea Research Foundation aim to increase access of poor students to higher education. These loans target poor students, particularly from farming and fishing villages; offer interest rates of less than 1 percent; are administered through private commercial banks; and are guaranteed by the government. Schemes administered by the Government Employ-ees’ Pension Corporation, the Korea Teach-ers’ Pension, and the Korea Labor Welfare Corporation target the children of govern-ment employees, teachers and their children, and industrial accident victims, respectively. While still highly subsidized by the govern-ment, they are offered at higher interest rates and strongly enforce repayment after gradu-ation. With their emphasis on cost recovery, they cross-subsidize the equity-focused loan schemes, helping ensure sustainability.
Hong Kong SAR, China, is also well known for its multitiered student loan sys-tem. In the early 1990s, when Hong Kong SAR, China, decided to recover more higher education costs through tuition fees, the Local Student Finance Scheme was separated into two tracks.45 An Extended Loan Scheme (not income contingent), charging a higher interest rate of 4–5 percent a year, targeted
applicants who failed the means test by a slim margin; applicants less able to pay for their university education received more assistance. A separate non-means-tested loan was devel-oped for other students in public universities who passed the means test. The interest rate for these loans is the government’s no-gain-no-loss rate, 1.5 percentage points below the average best lending rate of note-issuing banks. This rate covers the government’s risk in disbursing unsecured loans. An adminis-trative fee is charged annually to cover the full cost of processing and administering the loans, further enhancing cost recovery.
If the region expanded such programs more widely, governments would have to upgrade the fi nancial management and fi du-ciary capacity of the agencies charged with administering and monitoring. These pro-grams would require governments to have systems for identifying qualifi ed individuals and calculating their repayment amounts—and ensuring collection. This could require coordination with the social security or tax authority (together with interventions tar-geted to earlier education levels).
For most countries in East Asia, the com-bination of fees, scholarships, and loans46 can increase equity and access to tertiary educa-tion. While fees are a necessary form of cost recovery, they should ensure the equality of opportunity for poorer and more vulnerable groups. There is clear potential for scholar-ships when living costs are high and returns are lower for some disadvantaged groups. But fairly high higher education returns and cost-saving considerations make loans particularly attractive.
Summary of policy priorities
East Asia’s low- and middle-income coun-tries are not delivering the skills and research outcomes they need. Many of the discon-nects are related to funding. The precise challenges and related priorities differ for individual countries, but all countries face some common imperatives.
First, they need to be selective in deciding their targets and priorities. In line with the
PHEWEA.indb 124 10/11/11 7:37:47 PM

F I N A N C I N G H I G H E R E D U C A T I O N 1 2 5
analysis of chapter 2, it is clear that enroll-ment increases are not urgent or even advis-able in all countries. Only a few universities will ever be able to develop credible research capacity (given the high requirements for faculty qualifications). By contrast, most research, STEM fi elds, and scholarships are underfunded, making them a priority area.
Second, countries need strategies to fund priority activities. There is a clear case for pub-lic fi nancing to fi nance research, STEM fi elds, and inclusiveness. (Private funding would complement public funding in fi nancing some activities and focus on increasing coverage and diversifi cation.) Countries could consider continuing to mobilize public resources, while prioritizing them better. And because public funds are scarce, countries should fi nd ways to allocate them more effi ciently, attract more private funds, and correct the source of mar-ket failures by offering student loans.
Mobilizing and prioritizing public funding. Countries should assess the scope for increas-ing public spending. The ratios of tertiary spending to total education spending, of total education spending to GDP, and of taxes to GDP show the potential for increasing public spending. On the fi rst two indicators, Mon-golia and Thailand have more potential than the others. All countries should increase their shares of public spending for research, STEM fi elds, and scholarships.
Increasing the effi ciency of public fund-ing. Because few countries have much fl ex-ibility to ramp up their tertiary expenditures quickly, more efficient use and allocation of public funds applies particularly in the short and medium terms. Greater effi ciency requires being more selective and perfor-mance based in the way public funds for teaching and research are allocated across institutions and better targeting of equity-enhancing measures.
Leveraging private funds and correcting the source of market failures. One way to increase private funds is to design more effi -cient and equitable fee structures. Combined with loan schemes, these policies can increase access for the poor and disadvantaged while helping to recover costs.
Lower- and middle-income countries face the challenge of improving and prioritizing their fi nancing policy for their higher educa-tion systems. Meeting this critical challenge will bear fruit only within a more flexible and competitive higher education system—the topic of the next two chapters.
Notes
1. OECD 2008b. 2. OECD 2008b. 3. As visible from the snapshot presented in
table 4.5 and further evidence from Salmi (2009).
4. Linh, Thuy, and Long 2010. 5. Linh, Thuy, and Long 2010. 6. For instance, fee exemptions introduced at
secondary education have been shown to have increased enrollment and completion of secondary school in Vietnam according to rigorous econometric analysis (World Bank 2010g).
7. Sakellariou 2010b. 8. World Bank 2008. 9. World Bank 2010d.10. World Bank 2010d.11. Ma 2010. The fi gures have been converted
from renminbi (RMB) to U.S. dollars at a rate of US$1 = 6.83 RMB as of May 2010.
12. Loyalka 2009 as cited in Ma 2010; Ziderman 2004.
13. The Philippines has done very little overall in terms of equity (Orbeta 2008).
14. World Bank 2010c.15. Directorate General for Higher Education,
Ministry of National Education [Indonesia] 2009.
16. Moeliodihardjo 2010.17. World Bank 2010e.18. These fi gures are not directly comparable
with the amounts in fi gure 4.5, which are cal-culated in Thai baht.
19. World Bank 2009a.20. Ziderman 2004.21. Singh 1973 cited in Mukherjee 2010.22. World Bank 2007a.23. Mukherjee 2010.24. For a richer discussion of the trade-offs
involved in funding various levels of educa-tion, see Mingat, Ledoux, and Rakotomalala (2010). The authors provide fi nancing simu-lations for Sub-Saharan Africa under fi ve
PHEWEA.indb 125 10/11/11 7:37:49 PM

1 2 6 F I N A N C I N G H I G H E R E D U C A T I O N
varying scenarios for progress toward univer-sal primary education under the Education for All Fast-Track Initiative Framework, as well as tertiary education expansion. The authors draw attention to the implications of such scenarios, such as raising the share of education in the national budget, reforming the service delivery arrangements to manage costs, diversifying the fl ow of students beyond lower-secondary education, and enlarging the role of private fi nance in postsecondary education.
25. Tertiary spending per student as a share of GDP per capita is used for the STEM share, given that the cost of providing these courses is likely to be quite dependent on local condi-tions; simple tertiary spending per student is used for the journal indicator, given the closer correlation with international salary costs.
26. Mok 2010.27. Mok 2010.28. Mok 2010.29. Tan 2010.30. These indicators include faculty strengths
in course offerings, academic qualifi cation, research and publications, student graduation rates, employment rates, and student evalua-tion results.
31. World Bank 2007.32. Raza 2010.33. Ministry of Education, Singapore 2005.34. Byun 2008.
35. Salmi and Hauptman 2006.36. Salmi 2006.37. Barr 2008.38. Barr 2008.39. This is true at least for public institutions.
Private institutions are generally—and should be—exempt from fee caps.
40. The use of fees can be maximized by charg-ing variable fees at the institutional and course level; higher-quality institutions and in-de-mand or higher-paying disciplines can charge greater fees.
41. This section draws heavily on a review on student loan design by Johnstone (2004).
42. Johnstone 2004.43. Ziderman 2006.44. Ziderman 2003. 45. Ping Chung 2007.46. Programs to increase access to high-quality
secondary schools and courses, particularly targeted at vulnerable groups, could have a par-ticularly high payoff, as shown by the example of the Urban Systemic Initiative in the United States. This initiative, which was designed to provide opportunities for disadvantaged youth to participate in high-level math and science courses, showed positive effects on access to advanced math and science courses, as well as reductions in disparities between (a) African Americans and whites and (b) Latinos and whites in science and mathematics course enrollment (Martinez and Klopott 2005).
PHEWEA.indb 126 10/11/11 7:37:51 PM