Embed Size (px)
Citation preview
Finding locations of Flickr resources using languagemodels and similarity search
Olivier Van LaereDepartment of Information
Technology, IBBTGhent University, Belgium
Steven Schockaert∗
Dept. of Applied Mathematicsand Computer Science
Ghent University, [email protected]
Bart DhoedtDepartment of Information
Technology, IBBTGhent University, [email protected]
ABSTRACTWe present a two-step approach to estimate where a givenphoto or video was taken, using only the tags that a userhas assigned to it. In the first step, a language modeling ap-proach is adopted to find the area which most likely containsthe geographic location of the resource. In the subsequentsecond step, a precise location is determined within the areathat was found to be most plausible. The main idea of thisstep is to compare the multimedia object under consider-ation with resources from the training set, for which theexact coordinates are known, and which were taken in thatarea. Our final estimation is then determined as a func-tion of the coordinates of the most similar among these re-sources. Experimental results show this two-step approachto improve substantially over either language models or sim-ilarity search alone.
Categories and Subject DescriptorsH.4 [INFORMATION SYSTEMS APPLICATIONS]: Miscellaneous; H.3.7 [INFORMATION STORAGEAND RETRIEVAL]: Digital libraries
General TermsExperimentation, Measurement
KeywordsGeographic information retrieval, Language models, Semi-structured knowledge, Geo-annotation
1. INTRODUCTIONWeb 2.0 systems such as Flickr bring structure in collec-
tions of shared multimedia objects by taking advantage of
∗Postdoctoral Fellow of the Research Foundation – Flanders(FWO).
Permission to make digital or hard copies of all or part of this work forpersonal or classroom use is granted without fee provided that copies arenot made or distributed for profit or commercial advantage and that copiesbear this notice and the full citation on the first page. To copy otherwise, torepublish, to post on servers or to redistribute to lists, requires prior specificpermission and/or a fee.ICMR ’11, April 17-20, Trento, ItalyCopyright c©2011 ACM 978-1-4503-0336-1/11/04 ...$10.00.
both structured and unstructured forms of metadata. Un-structured metadata is mainly available in the form of tags,i.e. short (but otherwise unconstrained) textual descriptionsthat are provided by users, although in the case of Flickr,only owners can add tags. Such tags help users to organizethe resources they find interesting or to otherwise facilitateretrieval of such resources (by themselves or by others) inthe future [2]. In the case of photos and videos, most ofthe structured metadata is provided automatically by thecamera, without any involvement of the user. These typesof metadata usually include the type of camera, the settingsthat were used (e.g. aperture, focal distance, etc.) and thetime and date. In a limited number of cases, cameras alsoprovide geographic coordinates, using a built-in or exter-nally connected GPS device. Flickr additionally offers thepossibility of manually indicating on a map where a photowas taken.
The availability of location metadata is important for atleast two reasons. First, it allows users to easily retrieve pho-tos or videos that were taken at a particular location, e.g.by explicitly supporting spatial constraints in queries [13],or by displaying the resources on a map which users canexplore [14]. Second, by analyzing the correlation betweengeographic location and the occurrence of certain tags, wemay discover geographic knowledge beyond what is usuallydescribed in gazetteers [5, 7]. As a result of these considera-tions, and given that only a small fraction of Flickr resourcesare currently geo-annotated, there has been a recent interestin techniques that could automatically estimate the geogra-phic location of photos and videos [4]. More generally, thereseems to be a trend towards leveraging user-contributed, un-structured information to structured, semantic annotations,e.g. automatically completing Wikipedia infoboxes [16] orbuilding ontologies from user tags [12].
Several kinds of information are available to estimate thegeographic location of a photo or video: visual features, userprofiles, and tags. Visual features may be useful to recog-nize certain types of landmarks, or to differentiate photoor videos that were taken e.g. at the beach from resourcestaken in a city center. In general, however, visual infor-mation alone is not likely to be sufficient for determining aspecific location. Similarly, user profiles may be useful tointroduce a bias (e.g. users are more likely to take photoscloser to the place where they live), but they do not containsufficient information to pinpoint where a photo or videowas taken. In this paper, we exclusively focus on the thirdtype of available information, viz. the tags associated with aresource. Indeed, before the value of visual features or user
profiles for this task can be assessed, in our opinion, a morethorough understanding is needed of the kind of geographicinformation that can be extracted from tags.
To estimate the location of a multimedia object based onits tags, three natural strategies present themselves. First,we may use gazetteers to find the locations of those tags thatcorrespond to toponyms. Although intuitive, this strategyhas proven to be particularly challenging in practice, amongothers due to the fact that no capitalization occurs in tags,making it difficult to identify the toponyms (e.g. nice vs.Nice), as well as due to the high ambiguity of toponyms andthe limited amount of context information that is availablefor disambiguation. Second, we may interpret the problemof georeferencing as a classification problem, by partitioningthe locations on earth into a finite number of areas. Stan-dard language modeling approaches can then be used to de-termine the most likely area for a given resource, representedas its set of tags. This method eliminates the problem of de-termining which tags are toponyms, or any form of (explicit)disambiguation. A drawback, however, is that it results inan entire area, rather than a precise coordinate. The moreareas in the partition, the more fine-grained our conclusionwill be, but, the higher the chances of classification errorbecome. Third, we may resort to similarity search, and esti-mate the location of a given resource as a weighted average ofthe locations of the most similar objects in our training set,e.g. using a form of similarity that is based on the overlapbetween tag sets. In this case, we do obtain precise coordi-nates, but the performance of the method may be limited bythe fact that it treats spatially relevant tags in the same wayas others. For instance, a resource tagged with paris,bridgewill be considered as similar to a resource tagged with lon-don,bridge as to a resource tagged with paris,cathedral. Inthis paper, we propose to combine the best of the latter twostrategies: first use a classifier to find the most likely area inwhich a photo or video was taken, and then use similaritysearch to find the most likely location within that area.
We have participated in the Placing Task of the 2010MediaEval benchmarking initiative [4] using a system basedon this two-step approach. Our system came out best, local-izing about 44% of the videos in the test collection within1km of their true location. In this paper, we present thedetails of our system, and we analyze which aspects are re-sponsible for its performance, focusing on two crucial points.First, we stress the importance of combining classification(e.g. using language models) with interpolation (e.g. usingsimilarity search), revealing that neither method alone is ca-pable of producing equally good results. Second, we analyzethe influence of user-specific tags. In particular, in case ofthe Placing Task, it turns out that most of the users thatown a video from the test collection also own one or morephotos in the training data: among the 4576 test videos withat least one tag, 923 different users appear of whom 873 ownat least one photo in the training set. We analyze to whatextent the availability of such previous geo-annotations bythe same user influences the performance of the system.
The paper is structured as follows. First, we detail the na-ture of the data sets that have been used, as well as the pre-processing methods that were applied. The subsequent twosections individually consider the two strategies that lie atthe basis of our system: finding the most plausible area, us-ing a standard language modeling approach, and finding themost likely location within that area, using similarity search.
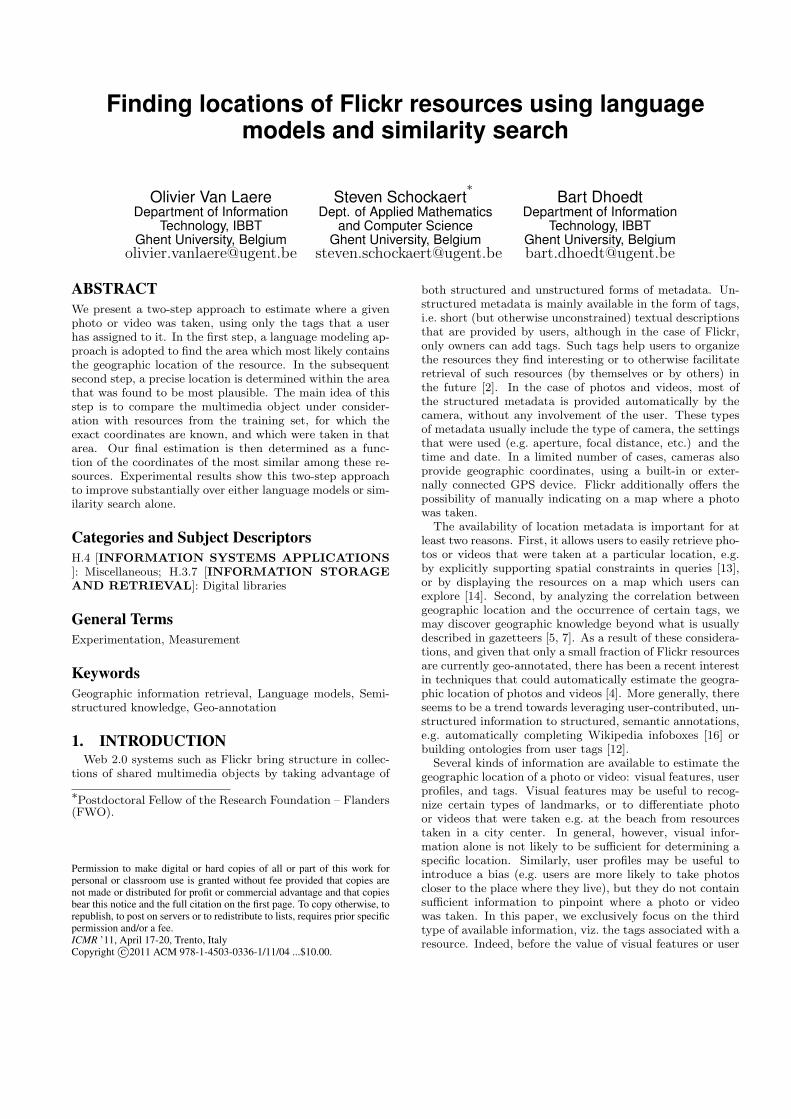
Figure 1: Plot of all the photos in the training set
Next, in Section 5 we explain how these two methods can becombined, and show that this combination performs betterthan the two components on which it is based. Finally, weprovide an overview of related work and conclude.
2. DATA ACQUISITION AND PREPROCESS-ING
As training data, we used a collection of 8 685 711 photos,containing the 3 185 258 georeferenced Flickr photos thatwere provided to participants of the Placing Task, togetherwith an additional crawl of 5 500 368 georeferenced Flickrphotos. In addition to the coordinates themselves, Flickrprovides information about the accuracy of coordinates as anumber between 1 (world-level) and 16 (street level). Whencrawling the additional data, we only crawled Flickr photoshaving an accuracy of at least 12, to ensure that all coor-dinates were meaningful w.r.t. within-city location. Onceretrieved, photos that did not contain tags or valid coordi-nates were removed from the collection. Next, we ensuredthat at most one photo was retained in the collection with agiven tag set and user name, in order to reduce the impactof bulk uploads [14]. Once filtered, the remaining datasetcontained 3 271 022 photos. A visual representation of thisdataset is shown in Figure 1.
The test videos provided for the Placing Task containvideos that are part of bulk uploads, in the sense that somevideos were uploaded around the same time as some photosin the training set by the same user, often resulting in avery high similarity between the tag set of the correspond-ing videos and photos. To avoid any undesirable effects ofbulk uploads in our evaluation, we crawled a collection of10 000 Flickr videos that have been uploaded later than themost recent photo from the training set. We furthermorerestricted ourselves to videos with an accuracy level of 16,to ensure that our gold standard was as accurate as possible.This data set was then split into 7 400 videos that are ownedby a user who also has at least one photo in our training set,and 2 600 videos by users who do not appear in the trainingset.
Next, the locations of the photos in the training set wereclustered in a set of disjoint areas A using the k-medoids al-gorithm with geodesic distance, considering a varying num-ber of clusters k. We consider ten different resolutions andthus ten different sets of areas Ak. The datasets were clus-tered into 50, 500, 2 500, 5 000, 7 500, 10 000, 12 500, 15
000, 17 500 and 20 000 disjoint areas respectively.Subsequently, a vocabulary V consisting of ‘interesting’
tags is compiled, which are tags that are likely to be indica-tive of geographic location. We used χ2 feature selection todetermine for each area in A the m most important tags.Let A be the set of areas that is obtained after clustering.Then for each area a in A and each tag t occurring in photosfrom a, the χ2 statistic is given by:
χ2(a, t) =(Ota − Eta)2
Eta+
(Ota − Eta)2
Eta+
(Ota − Eta)2
Eta
+(Ota − Eta)2
Eta
where Ota is the number of photos in area a in which tag toccurs, Ota is the number of photos outside area a in whichtag t occurs, Ota is the number of photos in area a in whichtag t does not occur, and Ota is the number of photos outsidearea a in which tag t does not occur. Furthermore, Eta isthe number of occurrences of tag t in photos of area a thatcould be expected if occurrence of t were independent of thelocation in area a, i.e. Eta = N ·P (t) ·P (a) with N the totalnumber of photos, P (t) the percentage of photos containingtag t and P (a) the percentage of photos that are located inarea a, i.e.:
P (a) =|Xa|Pb∈A |Xb|
(1)
where, for each area a ∈ A, we write Xa to denote the setof images from our training set that were taken in area a.Similarly, Eta = N ·P (t)·(1−P (a)), Eta = N ·(1−P (t))·P (a),Eta = N · (1 − P (t)) · (1 − P (a)). The vocabulary V wasthen obtained by taking for each area a, the m tags withhighest χ2 value. In the default configuration of our system,the m values are 640 000 for the coarsest clustering, 6 400,256, 64, 28, 16, 10, 7, 5 for the intermediate resolutionsand 4 for the finest clustering level. This choice of featuresensures that the language models, introduced next, requireapproximately the same amount1 of space for each clusteringlevel. In Section 6, we will analyze the impact of the choiceof the m values.
3. LANGUAGE MODELS
3.1 OutlineGiven a previously unseen resource x, we try to determine
in which area x was most likely taken by comparing its tagswith those of the images in the training set. Specifically,using standard generative unigram language modeling, theprobability of area a, given the tags that are available forresource x is given by
P (a|x) ∝ P (a) ·Yt∈x
P (t|a) (2)
where we identify the resource x with its set of tags. Theprior probability P (a) of area a can be estimated using max-imum likelihood, as in (1), which means that in absence ofother information, resources are assigned to the area con-taining the largest number of photos from the training set.
1Space requirements increase quadratically with the numberof clusters.
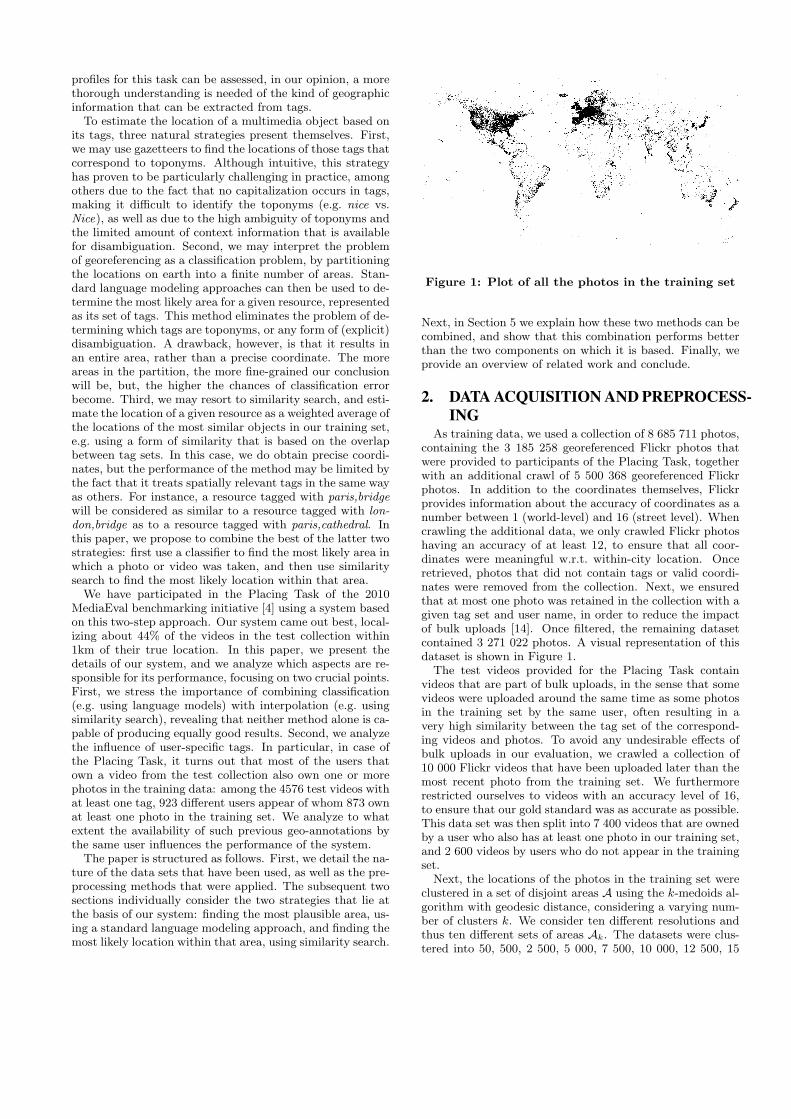
Figure 2: Median error between the medoid of thefound cluster and the true location of the videos inthe test set.
To obtain a reliable estimate of P (t|a), some form of smooth-ing is needed, to avoid a zero probability when x is as-sociated with a tag that does not occur with any of thephotos in area a from the training set. We have exper-imented with Laplace smoothing, Jelinek-Mercer smooth-ing, and Bayesian smoothing with Dirichlet priors, the lat-ter yielding the best results in general (with Jelink-Mercerproducing similar results). These findings conform to ex-perimental results in other areas of information retrieval[17], and to earlier work on georeferencing Flickr photos [14].Specifically, using Bayesian smoothing with Dirichlet priors,we take:
P (t|a) =Ota + µ
“ Pa′∈A Ota′P
a′∈AP
t′∈V Ot′a′
”(Pt′∈V Ot′a) + µ
where, as before, we write Ota for the number of occurrencesof term t in area a, and V is the vocabulary (after featureselection). The parameter µ takes a value in ]0,+∞[ andwas set to 1750, although good results were found for a largerange of values. The area ax assigned to resource x is thenthe area maximizing the right-hand side of (2):
ax = arg maxa∈A
P (a) ·Yt∈x
P (t|a) (3)
Thus an area is found which is assumed to contain the truelocation of x. It may be useful to convert this area to aprecise location, e.g. for comparison with other methods. Tothis end, an area a can be represented as its medoid med(a):
med(a) = arg minx∈a
Xy∈a
d(x, y) (4)
where d(x, y) represents the geodesic distance. Note that themedoid is the most central element of an area, rather thanits center-of-gravity. The latter is avoided here because it istoo sensitive to outliers.
3.2 Experimental resultsWhether or not (4) provides a good estimation depends on
the number of clusters that are considered. If this numberis too small, the clusters will be too coarse, and the medoidwill not be a good approximation of the true location ingeneral. If this number is too large, however, the chances ofclassification error increase. Thus there is a trade-off to be
found, as can clearly be seen in Figure 2. This figure depictsthe median error that was obtained for a variety of clus-ter sizes, i.e. the median of the geodesic distance betweenthe medoid of the cluster that was found by (3) and thetrue location. The figure reports the results of three exper-imental set-ups: one experiment considers the 7 400 videoswhose owner appears in our training set (Overlap), one ex-periment considers the results for these same videos whenthe photos from these video owners have been excluded fromthe training set (Filtered), and one experiment considers the2 600 videos whose owners are distinct from the owners ofthe photos in the (complete) training set (Distinct).
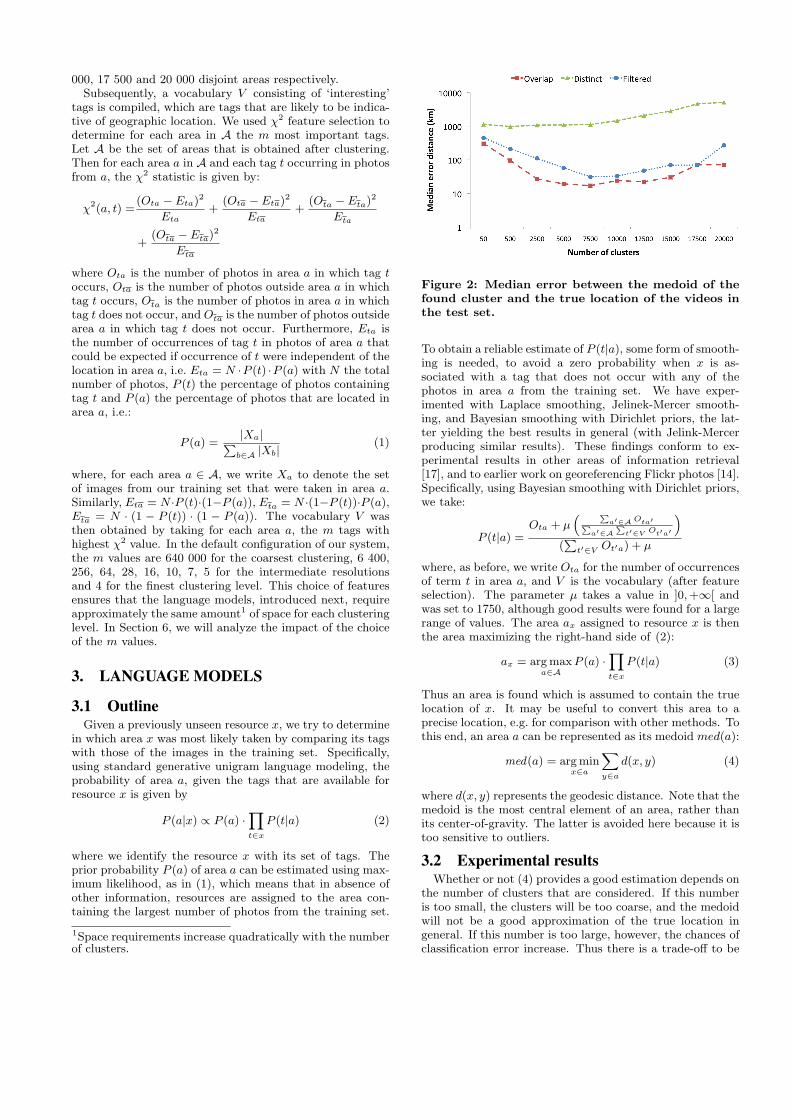
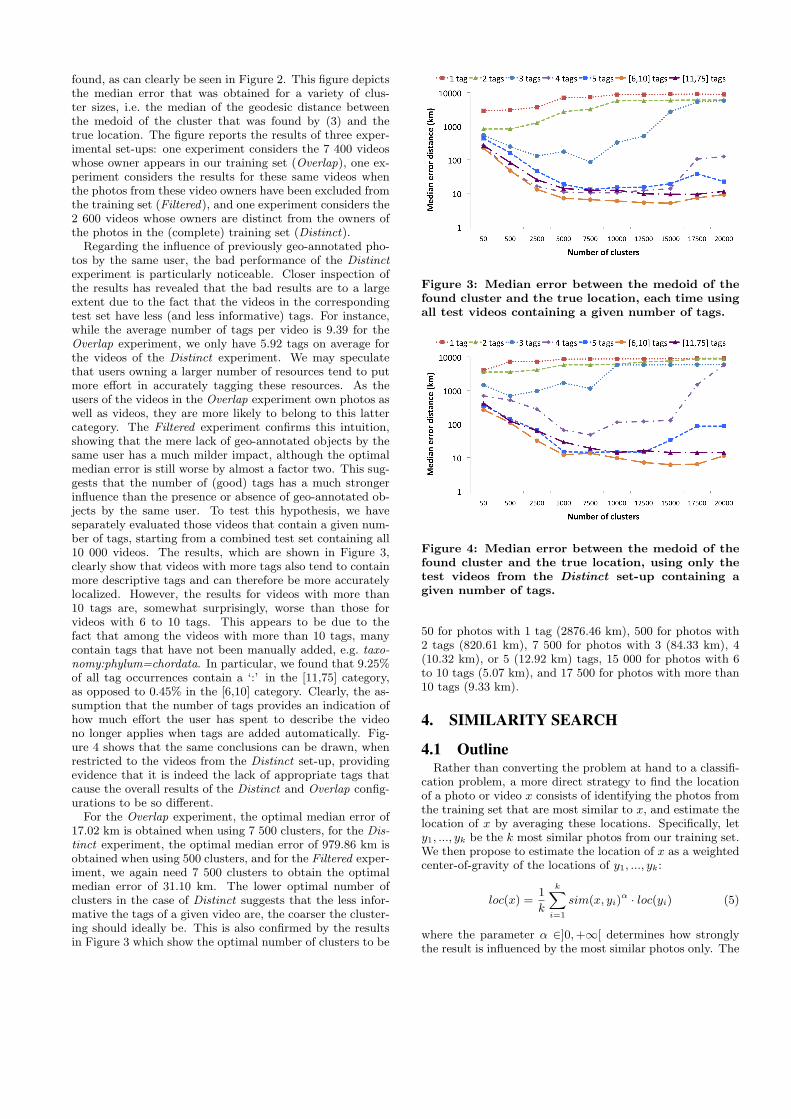
Regarding the influence of previously geo-annotated pho-tos by the same user, the bad performance of the Distinctexperiment is particularly noticeable. Closer inspection ofthe results has revealed that the bad results are to a largeextent due to the fact that the videos in the correspondingtest set have less (and less informative) tags. For instance,while the average number of tags per video is 9.39 for theOverlap experiment, we only have 5.92 tags on average forthe videos of the Distinct experiment. We may speculatethat users owning a larger number of resources tend to putmore effort in accurately tagging these resources. As theusers of the videos in the Overlap experiment own photos aswell as videos, they are more likely to belong to this lattercategory. The Filtered experiment confirms this intuition,showing that the mere lack of geo-annotated objects by thesame user has a much milder impact, although the optimalmedian error is still worse by almost a factor two. This sug-gests that the number of (good) tags has a much strongerinfluence than the presence or absence of geo-annotated ob-jects by the same user. To test this hypothesis, we haveseparately evaluated those videos that contain a given num-ber of tags, starting from a combined test set containing all10 000 videos. The results, which are shown in Figure 3,clearly show that videos with more tags also tend to containmore descriptive tags and can therefore be more accuratelylocalized. However, the results for videos with more than10 tags are, somewhat surprisingly, worse than those forvideos with 6 to 10 tags. This appears to be due to thefact that among the videos with more than 10 tags, manycontain tags that have not been manually added, e.g. taxo-nomy:phylum=chordata. In particular, we found that 9.25%of all tag occurrences contain a ‘:’ in the [11,75] category,as opposed to 0.45% in the [6,10] category. Clearly, the as-sumption that the number of tags provides an indication ofhow much effort the user has spent to describe the videono longer applies when tags are added automatically. Fig-ure 4 shows that the same conclusions can be drawn, whenrestricted to the videos from the Distinct set-up, providingevidence that it is indeed the lack of appropriate tags thatcause the overall results of the Distinct and Overlap config-urations to be so different.
For the Overlap experiment, the optimal median error of17.02 km is obtained when using 7 500 clusters, for the Dis-tinct experiment, the optimal median error of 979.86 km isobtained when using 500 clusters, and for the Filtered exper-iment, we again need 7 500 clusters to obtain the optimalmedian error of 31.10 km. The lower optimal number ofclusters in the case of Distinct suggests that the less infor-mative the tags of a given video are, the coarser the cluster-ing should ideally be. This is also confirmed by the resultsin Figure 3 which show the optimal number of clusters to be
Figure 3: Median error between the medoid of thefound cluster and the true location, each time usingall test videos containing a given number of tags.
Figure 4: Median error between the medoid of thefound cluster and the true location, using only thetest videos from the Distinct set-up containing agiven number of tags.
50 for photos with 1 tag (2876.46 km), 500 for photos with2 tags (820.61 km), 7 500 for photos with 3 (84.33 km), 4(10.32 km), or 5 (12.92 km) tags, 15 000 for photos with 6to 10 tags (5.07 km), and 17 500 for photos with more than10 tags (9.33 km).
4. SIMILARITY SEARCH
4.1 OutlineRather than converting the problem at hand to a classifi-
cation problem, a more direct strategy to find the locationof a photo or video x consists of identifying the photos fromthe training set that are most similar to x, and estimate thelocation of x by averaging these locations. Specifically, lety1, ..., yk be the k most similar photos from our training set.We then propose to estimate the location of x as a weightedcenter-of-gravity of the locations of y1, ..., yk:
loc(x) =1
k
kXi=1
sim(x, yi)α · loc(yi) (5)
where the parameter α ∈]0,+∞[ determines how stronglythe result is influenced by the most similar photos only. The
similarity sim(x, yi) between resources x and yi was quan-tified using the Jaccard measure:
sjacc(x, y) =|x ∩ y||x ∪ y|
where we identify a resource with its set of tags withoutfeature selection. In principle, Jaccard similarity may becombined with other types of similarity, e.g. based on visualfeatures.
In (5), locations are assumed to be represented as Carte-sian (x, y, z) coordinates rather than as (lat, lon) pairs2. Inpractice, we thus need to convert the (lati, loni) coordinatesof each photo yi to its Cartesian coordinates:
xi = cos(lati) · cos(loni)yi = cos(lati) · sin(loni)
zi = sin(lati)
Subsequently, the right-hand side of (5) is evaluated, yield-ing a point (x∗, y∗, z∗), which is usually not on the surface ofthe earth. Unless this point is exactly the center of the earth,its latitude lat∗ and longitude lon∗ can be determined:
lat∗ = atan2(z∗,px∗2 + y∗2)
lon∗ = atan2(y∗, x∗)
In addition to the choice of the parameter α, the perfor-mance of (5) depends on the set of resources Rx that is con-sidered when determining the k most similar photos y1, ..., yk.In principle, we could take Rx to be the entire training set.However, we also experiment with putting a threshold onthe similarity with x, considering in Rx only those resourcesthat are sufficiently similar. This restriction is motivatedby the fact that center-of-gravity methods are sensitive tooutliers. Note that using medoids to alleviate the influenceof outliers is not appropriate when the number of points issmall. Also note that as a result of this restriction, some-times less than k similar photos may be used. In each caseRx will contain the most similar photo, even if its similarityis below the threshold. Other photos are added only if theyare sufficiently similar.
4.2 Experimental resultsThree parameters influence the performance of the simi-
larity search: the threshold on the similarity with the objectto be classified, the number k of similar photos to consider,and the exponent α in (5). Table 1 displays the result fordifferent choices of the threshold on similarity, and differentvalues of k, in case of the Overlap configuration. Regardingthe similarity threshold, we find that a small threshold of0.05 slightly improves the results for the smaller values ofk. Indeed, the smaller the value of k, the more the resultmay be influenced by outliers, and the more important itthus becomes to avoid them. Surprisingly, small values of kappear to be better than larger values, although the optimalchoice k = 2 is substantially better than k = 1.
Tables 2 illustrates the influence of varying the exponentα in (5), where we take the similarity threshold fixed at0.05. Choosing a higher value of α essentially serves thesame purpose as choosing a higher similarity threshold, i.e.
2See http://www.geomidpoint.com/calculation.html foran explanation of this coordinate transformation, and a com-parison with alternative methods to calculate “average loca-tions”.
Table 1: Influence of the similarity threshold on themedian error distance for the Overlap configuration(using an exponent α of 1).
threshold 0 0.05 0.10 0.15 0.20
k
1 2528 2528 2528 2528 25282 477 424 477 773 11503 685 604 662 880 11504 748 741 773 899 11815 790 821 835 952 12426 824 799 837 954 12387 808 823 850 961 12478 843 829 856 980 12469 855 856 871 971 124210 863 868 872 968 1243
Table 2: Influence of the exponent α on the medianerror distance for the Overlap configuration (usinga similarity threshold of 0.05).
α 1 25 50 75 100
k
1 2528 2528 2528 2528 25282 424 343 341 341 3413 604 435 413 411 4104 741 417 383 370 3705 821 410 368 350 3496 799 419 399 395 3937 823 422 400 395 3958 829 440 427 420 4199 856 459 450 441 44010 868 475 459 451 449
reducing the impact of potential outliers on the result. Wecan observe that higher values of α tend to produce betterresults. Again the choice of k = 2 turns out to be optimal.
In general, it seems that similarity search performs a lotworse than the language models, yielding an optimal errorof 340.69 km, as opposed to 17.02 km in the case of languagemodels. Similar effects are witnessed for the Distinct andFiltered configurations (not shown), where we respectivelyfind an optimal error of 1302.95 km (instead of 979.86 km)and 578.22 km (instead of 31.10 km). However, as we willsee in the next section, when combined with the languagemodels, similarity search may be of great value.
5. A HYBRID APPROACH
5.1 OutlineThe two methods that have been presented in the previ-
ous sections can be combined in a natural way: first an areais determined using the language modeling approach fromSection 3 and then the similarity based method from Sec-tion 4 is applied, but restricted to the photos in the foundarea. When no photo in the clustering satisfies the chosensimilarity threshold, the medoid of the found cluster can beused instead. Thus, we may take advantage of the languagemodeling’s ability to implicitly discriminate between occur-rences of more and less important tags, while keeping theadvantage of the similarity search that a precise coordinateis obtained.
A second extension is related to choosing the right numberof clusters. In particular, when we discover that a given re-
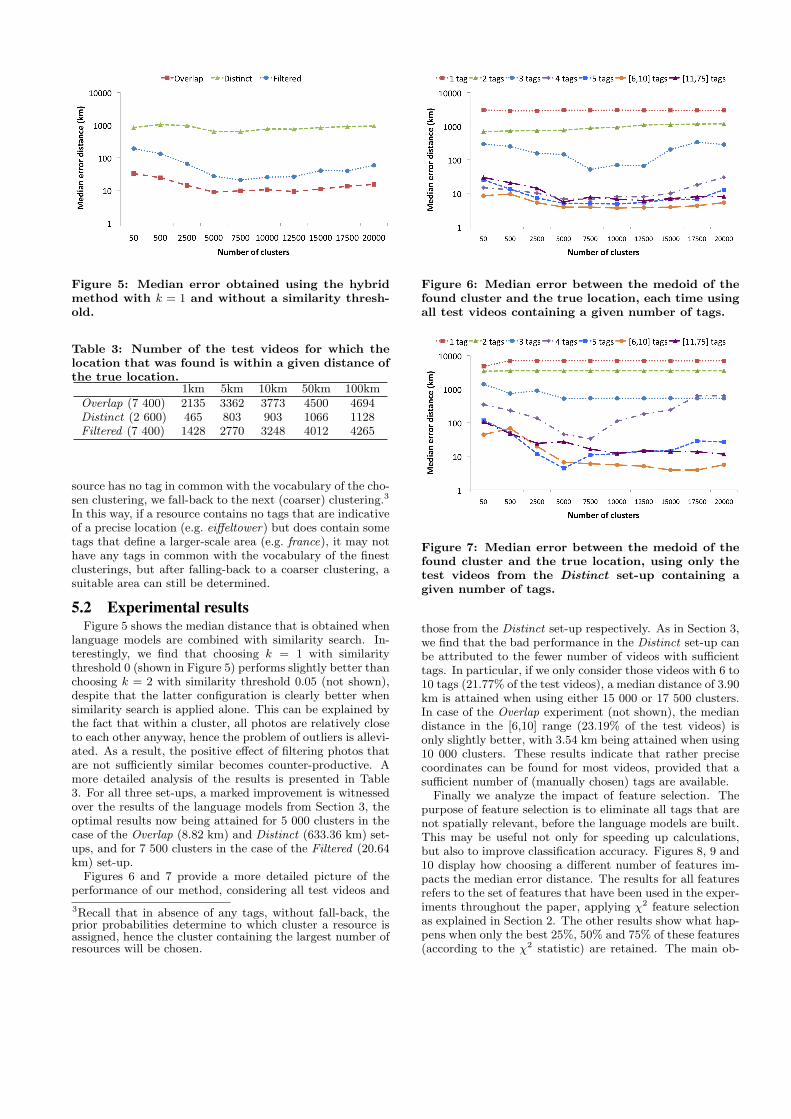
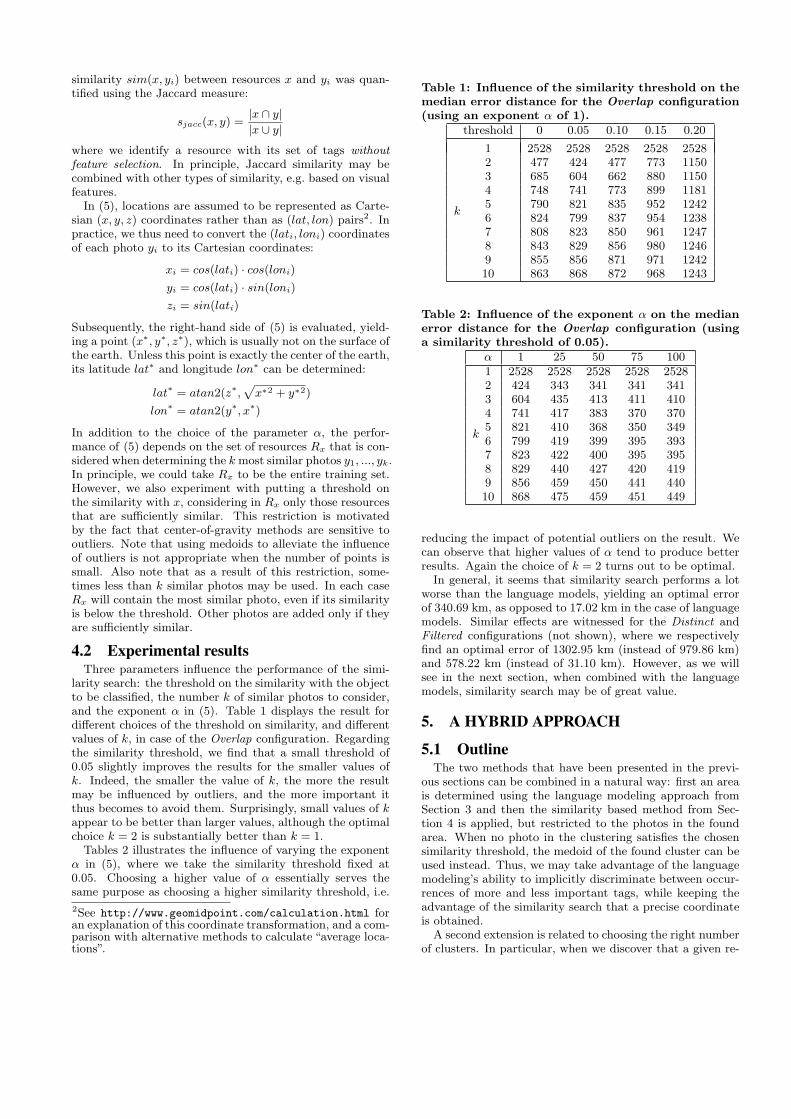
Figure 5: Median error obtained using the hybridmethod with k = 1 and without a similarity thresh-old.
Table 3: Number of the test videos for which thelocation that was found is within a given distance ofthe true location.
1km 5km 10km 50km 100kmOverlap (7 400) 2135 3362 3773 4500 4694Distinct (2 600) 465 803 903 1066 1128Filtered (7 400) 1428 2770 3248 4012 4265
source has no tag in common with the vocabulary of the cho-sen clustering, we fall-back to the next (coarser) clustering.3
In this way, if a resource contains no tags that are indicativeof a precise location (e.g. eiffeltower) but does contain sometags that define a larger-scale area (e.g. france), it may nothave any tags in common with the vocabulary of the finestclusterings, but after falling-back to a coarser clustering, asuitable area can still be determined.
5.2 Experimental resultsFigure 5 shows the median distance that is obtained when
language models are combined with similarity search. In-terestingly, we find that choosing k = 1 with similaritythreshold 0 (shown in Figure 5) performs slightly better thanchoosing k = 2 with similarity threshold 0.05 (not shown),despite that the latter configuration is clearly better whensimilarity search is applied alone. This can be explained bythe fact that within a cluster, all photos are relatively closeto each other anyway, hence the problem of outliers is allevi-ated. As a result, the positive effect of filtering photos thatare not sufficiently similar becomes counter-productive. Amore detailed analysis of the results is presented in Table3. For all three set-ups, a marked improvement is witnessedover the results of the language models from Section 3, theoptimal results now being attained for 5 000 clusters in thecase of the Overlap (8.82 km) and Distinct (633.36 km) set-ups, and for 7 500 clusters in the case of the Filtered (20.64km) set-up.
Figures 6 and 7 provide a more detailed picture of theperformance of our method, considering all test videos and
3Recall that in absence of any tags, without fall-back, theprior probabilities determine to which cluster a resource isassigned, hence the cluster containing the largest number ofresources will be chosen.
Figure 6: Median error between the medoid of thefound cluster and the true location, each time usingall test videos containing a given number of tags.
Figure 7: Median error between the medoid of thefound cluster and the true location, using only thetest videos from the Distinct set-up containing agiven number of tags.
those from the Distinct set-up respectively. As in Section 3,we find that the bad performance in the Distinct set-up canbe attributed to the fewer number of videos with sufficienttags. In particular, if we only consider those videos with 6 to10 tags (21.77% of the test videos), a median distance of 3.90km is attained when using either 15 000 or 17 500 clusters.In case of the Overlap experiment (not shown), the mediandistance in the [6,10] range (23.19% of the test videos) isonly slightly better, with 3.54 km being attained when using10 000 clusters. These results indicate that rather precisecoordinates can be found for most videos, provided that asufficient number of (manually chosen) tags are available.
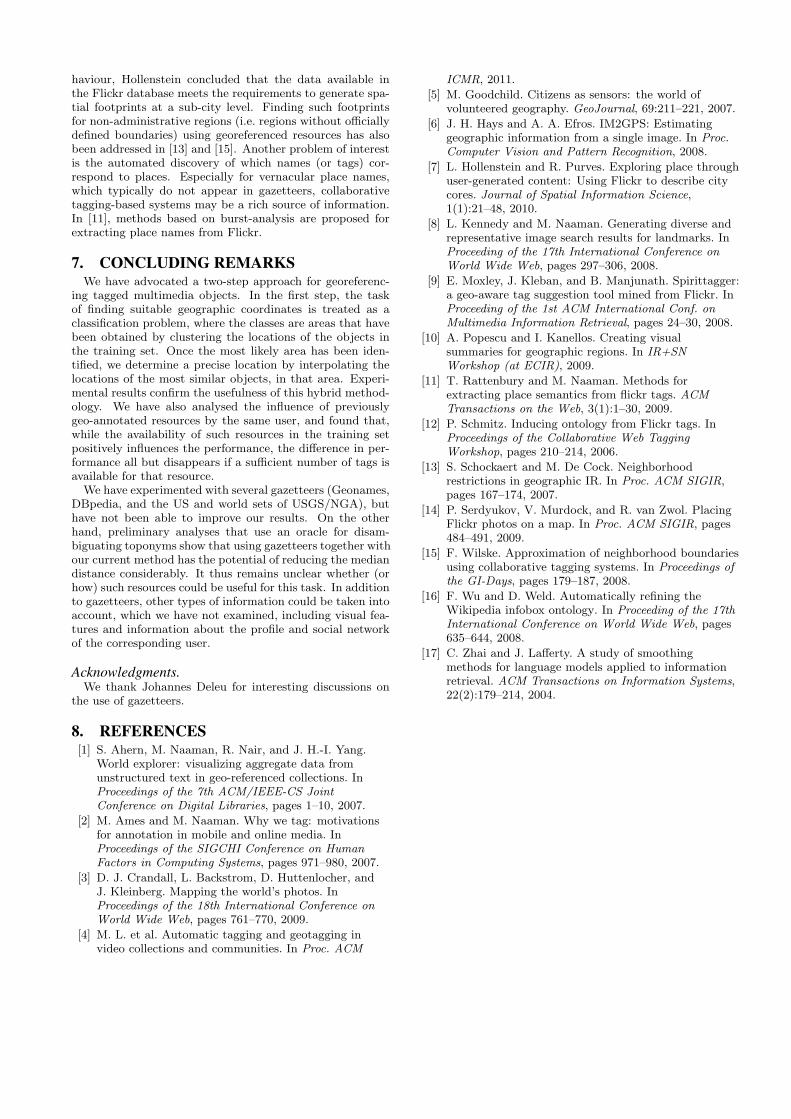
Finally we analyze the impact of feature selection. Thepurpose of feature selection is to eliminate all tags that arenot spatially relevant, before the language models are built.This may be useful not only for speeding up calculations,but also to improve classification accuracy. Figures 8, 9 and10 display how choosing a different number of features im-pacts the median error distance. The results for all featuresrefers to the set of features that have been used in the exper-iments throughout the paper, applying χ2 feature selectionas explained in Section 2. The other results show what hap-pens when only the best 25%, 50% and 75% of these features(according to the χ2 statistic) are retained. The main ob-
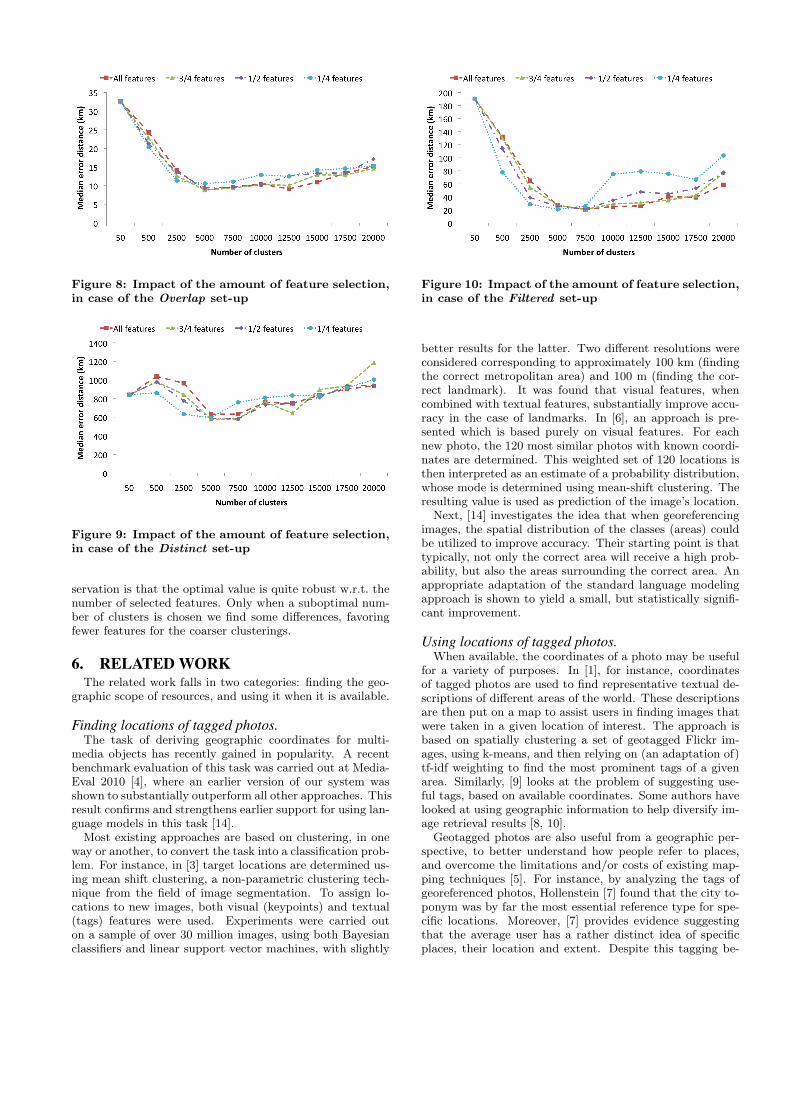
Figure 8: Impact of the amount of feature selection,in case of the Overlap set-up
Figure 9: Impact of the amount of feature selection,in case of the Distinct set-up
servation is that the optimal value is quite robust w.r.t. thenumber of selected features. Only when a suboptimal num-ber of clusters is chosen we find some differences, favoringfewer features for the coarser clusterings.
6. RELATED WORKThe related work falls in two categories: finding the geo-
graphic scope of resources, and using it when it is available.
Finding locations of tagged photos.The task of deriving geographic coordinates for multi-
media objects has recently gained in popularity. A recentbenchmark evaluation of this task was carried out at Media-Eval 2010 [4], where an earlier version of our system wasshown to substantially outperform all other approaches. Thisresult confirms and strengthens earlier support for using lan-guage models in this task [14].
Most existing approaches are based on clustering, in oneway or another, to convert the task into a classification prob-lem. For instance, in [3] target locations are determined us-ing mean shift clustering, a non-parametric clustering tech-nique from the field of image segmentation. To assign lo-cations to new images, both visual (keypoints) and textual(tags) features were used. Experiments were carried outon a sample of over 30 million images, using both Bayesianclassifiers and linear support vector machines, with slightly
Figure 10: Impact of the amount of feature selection,in case of the Filtered set-up
better results for the latter. Two different resolutions wereconsidered corresponding to approximately 100 km (findingthe correct metropolitan area) and 100 m (finding the cor-rect landmark). It was found that visual features, whencombined with textual features, substantially improve accu-racy in the case of landmarks. In [6], an approach is pre-sented which is based purely on visual features. For eachnew photo, the 120 most similar photos with known coordi-nates are determined. This weighted set of 120 locations isthen interpreted as an estimate of a probability distribution,whose mode is determined using mean-shift clustering. Theresulting value is used as prediction of the image’s location.
Next, [14] investigates the idea that when georeferencingimages, the spatial distribution of the classes (areas) couldbe utilized to improve accuracy. Their starting point is thattypically, not only the correct area will receive a high prob-ability, but also the areas surrounding the correct area. Anappropriate adaptation of the standard language modelingapproach is shown to yield a small, but statistically signifi-cant improvement.
Using locations of tagged photos.When available, the coordinates of a photo may be useful
for a variety of purposes. In [1], for instance, coordinatesof tagged photos are used to find representative textual de-scriptions of different areas of the world. These descriptionsare then put on a map to assist users in finding images thatwere taken in a given location of interest. The approach isbased on spatially clustering a set of geotagged Flickr im-ages, using k-means, and then relying on (an adaptation of)tf-idf weighting to find the most prominent tags of a givenarea. Similarly, [9] looks at the problem of suggesting use-ful tags, based on available coordinates. Some authors havelooked at using geographic information to help diversify im-age retrieval results [8, 10].
Geotagged photos are also useful from a geographic per-spective, to better understand how people refer to places,and overcome the limitations and/or costs of existing map-ping techniques [5]. For instance, by analyzing the tags ofgeoreferenced photos, Hollenstein [7] found that the city to-ponym was by far the most essential reference type for spe-cific locations. Moreover, [7] provides evidence suggestingthat the average user has a rather distinct idea of specificplaces, their location and extent. Despite this tagging be-
haviour, Hollenstein concluded that the data available inthe Flickr database meets the requirements to generate spa-tial footprints at a sub-city level. Finding such footprintsfor non-administrative regions (i.e. regions without officiallydefined boundaries) using georeferenced resources has alsobeen addressed in [13] and [15]. Another problem of interestis the automated discovery of which names (or tags) cor-respond to places. Especially for vernacular place names,which typically do not appear in gazetteers, collaborativetagging-based systems may be a rich source of information.In [11], methods based on burst-analysis are proposed forextracting place names from Flickr.
7. CONCLUDING REMARKSWe have advocated a two-step approach for georeferenc-
ing tagged multimedia objects. In the first step, the taskof finding suitable geographic coordinates is treated as aclassification problem, where the classes are areas that havebeen obtained by clustering the locations of the objects inthe training set. Once the most likely area has been iden-tified, we determine a precise location by interpolating thelocations of the most similar objects, in that area. Experi-mental results confirm the usefulness of this hybrid method-ology. We have also analysed the influence of previouslygeo-annotated resources by the same user, and found that,while the availability of such resources in the training setpositively influences the performance, the difference in per-formance all but disappears if a sufficient number of tags isavailable for that resource.
We have experimented with several gazetteers (Geonames,DBpedia, and the US and world sets of USGS/NGA), buthave not been able to improve our results. On the otherhand, preliminary analyses that use an oracle for disam-biguating toponyms show that using gazetteers together withour current method has the potential of reducing the mediandistance considerably. It thus remains unclear whether (orhow) such resources could be useful for this task. In additionto gazetteers, other types of information could be taken intoaccount, which we have not examined, including visual fea-tures and information about the profile and social networkof the corresponding user.
Acknowledgments.We thank Johannes Deleu for interesting discussions on
the use of gazetteers.
8. REFERENCES[1] S. Ahern, M. Naaman, R. Nair, and J. H.-I. Yang.
World explorer: visualizing aggregate data fromunstructured text in geo-referenced collections. InProceedings of the 7th ACM/IEEE-CS JointConference on Digital Libraries, pages 1–10, 2007.
[2] M. Ames and M. Naaman. Why we tag: motivationsfor annotation in mobile and online media. InProceedings of the SIGCHI Conference on HumanFactors in Computing Systems, pages 971–980, 2007.
[3] D. J. Crandall, L. Backstrom, D. Huttenlocher, andJ. Kleinberg. Mapping the world’s photos. InProceedings of the 18th International Conference onWorld Wide Web, pages 761–770, 2009.
[4] M. L. et al. Automatic tagging and geotagging invideo collections and communities. In Proc. ACM
ICMR, 2011.
[5] M. Goodchild. Citizens as sensors: the world ofvolunteered geography. GeoJournal, 69:211–221, 2007.
[6] J. H. Hays and A. A. Efros. IM2GPS: Estimatinggeographic information from a single image. In Proc.Computer Vision and Pattern Recognition, 2008.
[7] L. Hollenstein and R. Purves. Exploring place throughuser-generated content: Using Flickr to describe citycores. Journal of Spatial Information Science,1(1):21–48, 2010.
[8] L. Kennedy and M. Naaman. Generating diverse andrepresentative image search results for landmarks. InProceeding of the 17th International Conference onWorld Wide Web, pages 297–306, 2008.
[9] E. Moxley, J. Kleban, and B. Manjunath. Spirittagger:a geo-aware tag suggestion tool mined from Flickr. InProceeding of the 1st ACM International Conf. onMultimedia Information Retrieval, pages 24–30, 2008.
[10] A. Popescu and I. Kanellos. Creating visualsummaries for geographic regions. In IR+SNWorkshop (at ECIR), 2009.
[11] T. Rattenbury and M. Naaman. Methods forextracting place semantics from flickr tags. ACMTransactions on the Web, 3(1):1–30, 2009.
[12] P. Schmitz. Inducing ontology from Flickr tags. InProceedings of the Collaborative Web TaggingWorkshop, pages 210–214, 2006.
[13] S. Schockaert and M. De Cock. Neighborhoodrestrictions in geographic IR. In Proc. ACM SIGIR,pages 167–174, 2007.
[14] P. Serdyukov, V. Murdock, and R. van Zwol. PlacingFlickr photos on a map. In Proc. ACM SIGIR, pages484–491, 2009.
[15] F. Wilske. Approximation of neighborhood boundariesusing collaborative tagging systems. In Proceedings ofthe GI-Days, pages 179–187, 2008.
[16] F. Wu and D. Weld. Automatically refining theWikipedia infobox ontology. In Proceeding of the 17thInternational Conference on World Wide Web, pages635–644, 2008.
[17] C. Zhai and J. Lafferty. A study of smoothingmethods for language models applied to informationretrieval. ACM Transactions on Information Systems,22(2):179–214, 2004.