Embed Size (px)
Citation preview
The Journal of Values-Based LeadershipVolume 8Issue 2 Summer/Fall 2015 Article 7
July 2015
Finding Truth in Cause-Related Advertising: ALexical Analysis of Brands’ Health, Environment,and Social Justice Communications on TwitterAron CulottaIllinois Institute of Technology, [email protected]
Jennifer CutlerIllinois Institute of Technology, [email protected]
Junzhe ZhengIllinois Institute of Technology
Follow this and additional works at: http://scholar.valpo.edu/jvbl
Part of the Business Commons
This Article is brought to you for free and open access by the College of Business at ValpoScholar. It has been accepted for inclusion in The Journal ofValues-Based Leadership by an authorized administrator of ValpoScholar. For more information, please contact a ValpoScholar staff member [email protected].
Recommended CitationCulotta, Aron; Cutler, Jennifer; and Zheng, Junzhe (2015) "Finding Truth in Cause-Related Advertising: A Lexical Analysis of Brands’Health, Environment, and Social Justice Communications on Twitter," The Journal of Values-Based Leadership: Vol. 8: Iss. 2, Article 7.Available at: http://scholar.valpo.edu/jvbl/vol8/iss2/7
1
______________________________________________________________________________
ARON CULOTTA, PH.D. , JENNIFER CUTLER, PH.D., & JUNZHE ZHENG
ILLINOIS INSTITUTE OF TECHNOLOGY
CHICAGO, ILLINOIS
______________________________________________________________________________
Abstract
Consumers increasingly desire to make purchasing decisions based on factors such as
health, the environment, and social justice. In response, there has been a commensurate
rise in cause-related marketing to appeal to socially-conscious consumers. However, a lack
of regulation and standardization makes it difficult for consumers to assess marketing
claims; this is further complicated by social media, which firms use to cultivate a personality
for their brand through frequent conversational messages. Yet, little empirical research has
been done to explore the relationship between cause-related marketing messages on social
media and the true cause alignment of brands. In this paper, we explore this by pairing the
marketing messages from the Twitter accounts of over 1,000 brands with third-party ratings
of each brand with respect to health, the environment, and social justice. Specifically, we
perform text regression to predict each brand’s true rating in each dimension based on the
lexical content of its tweets, and find significant held-out correlation on each task,
suggesting that a brand’s alignment with a social cause can be somewhat reliably signaled
through its Twitter communications — though the signal is weak in many cases. To aid in the
identification of brands that engage in misleading cause-related communication as well as
terms that more likely indicate insincerity, we propose a procedure to rank both brands and
terms by their volume of “conflicting” communications (i.e., “greenwashing”). We further ex-
plore how cause-related terms are used differently by brands that are strong vs. weak in
actual alignment with the cause. The results provide insight into current practices in cause-
related marketing in social media, and provide a framework for identifying and monitoring
misleading communications. Together, they can be used to promote transparency in cause-
related marketing in social media, better enabling brands to communicate authentic values-
based policy decisions, and consumers to make socially responsible purchase decisions.
Introduction Consumers increasingly make purchasing decisions based on factors such as health, the en-
vironment, and social justice — a recent survey reports that 71% of Americans consider the
environment when they shop. In response, there has been a commensurate rise in cause-
related marketing to appeal to these socially-conscious consumers (Aaker, 1999; Sonnier &
Ainslie, 2011). However, because there is little standardization of terminology used in mar-
keting communications, vague and misleading terms (e.g., “greenwashing”) can make it very
Finding Truth in Cause-Related
Advertising:
A Lexical Analysis of Brands’ Health,
Environment, and Social Justice
Communications on Twitter
2
difficult for consumers to make informed decisions (Kangun, et al., 1991; Laufer, 2003;
Furlow, 2010).
This problem is amplified by the growth of social media, which provide a cost-effective
platform for firms to cultivate brand personalities with frequent conversation-like messages,
the volume of which complicates regulatory enforcement. The informal nature of Twitter
makes it particularly easy to cultivate an association between a brand and a cause, without
necessarily making concrete statements or claims.
Despite substantial theorizing on the prevalence and implications of such greenwashing,
little empirical work has been done to broadly examine the nature of cause-related
marketing messages in relation to a brand’s true alignment with the cause. In this paper, we
investigate the relationship between the lexical content of a brand’s Twitter communications
and the quality of that brand with respect to three cause-related dimensions: health, the
environment, and social justice. We collect nearly three million tweets from over one
thousand brands across two different sectors (Food & Beverage and Personal Care) and pair
them with independent ratings from GoodGuide.com, which provides in-depth ratings of
brands for social causes based on product contents, corporate policy, certifications, and
awards. With these data, we explore several questions:
RQ1. Can we estimate the health, environment, and social justice ratings of brands based
on their Twitter communications? We find that the lexical content of a brand’s Twitter feed
is significantly correlated with its rating, most strongly for health. A text regression model
produces out-of-sample error rates between 1 and 2 points on a 10-point scale, suggesting
that high-rated brands do indeed communicate differently than low-rated brands.
RQ2. Can we detect brands that potentially engage in misleading Twitter marketing?
Selecting the brands for which the model overestimates the ratings quickly reveals
instances of cause-related marketing that may conflict with the properties of the product.
While explicit false advertising is uncommon, we instead find a concerted effort to cultivate a
brand personality that suggests a stronger cause alignment than the ratings indicate.
RQ3. Can we identify cause-related terms that are used most frequently by brands in
misleading contexts? We perform a variant of feature selection to identify terms that overall
correlate with high ratings, but also appear often in tweets from low-rated brands. This
analysis identifies cause-related marketing terms on Twitter that are most susceptible to
“greenwashing” and may have reduced communication value.
RQ4. Can we further classify misleading cause-related terms based on context? We train a
classifier to distinguish tweets containing terms like organic as originating from high-rated or
low-rated brands, based on the context in which they are used. We find that retweets
containing such salient terms are strong indicators of low-rated brands.
Background and Related Work It is well established that brand image and personality associations constitute an important
component of brand equity (Aaker, 1999; Sonnier & Ainslie, 2011). Brands serve not only to
signal functional product attributes, but also to provide consumers with an identity
association they can use for self-congruence and social signaling (Aaker, 1999). Marketing
activities designed to cultivate such image and personality associations have been referred
to as brand image advertising (Kuksov, et al., 2013) and cause-related marketing
(Varadarajan & Menon, 1988) when the desired association is with a social cause. Because
3
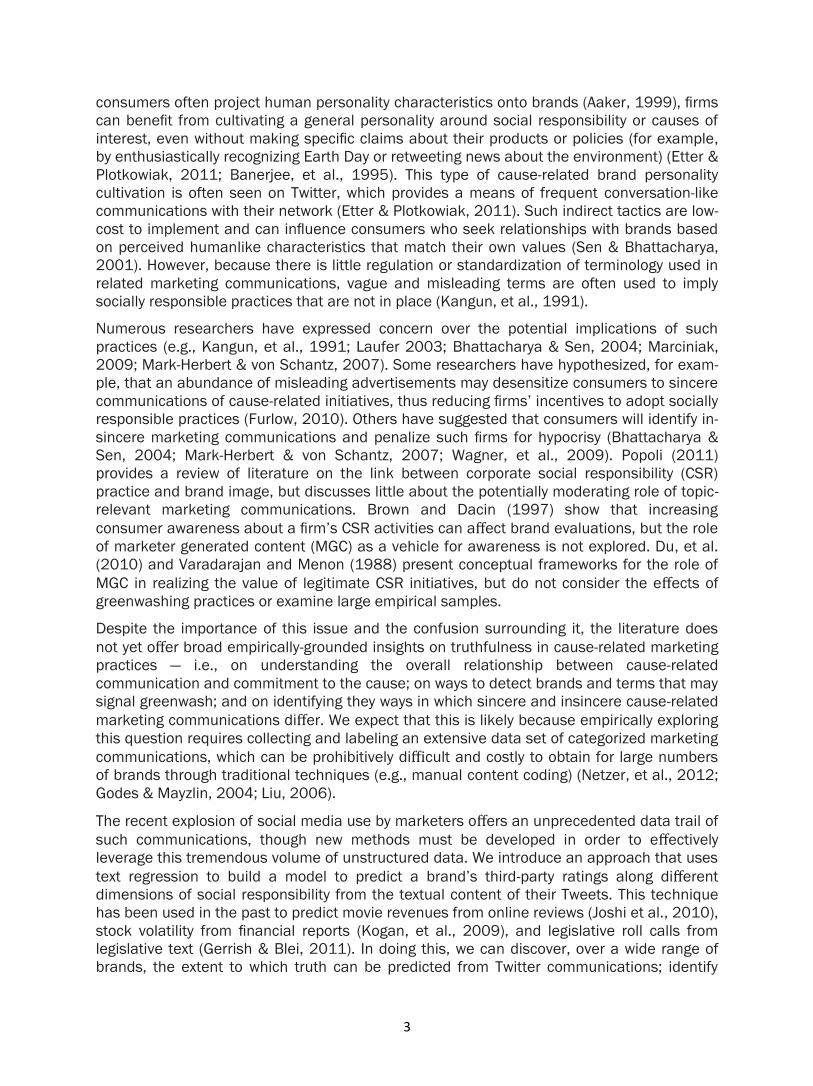
consumers often project human personality characteristics onto brands (Aaker, 1999), firms
can benefit from cultivating a general personality around social responsibility or causes of
interest, even without making specific claims about their products or policies (for example,
by enthusiastically recognizing Earth Day or retweeting news about the environment) (Etter &
Plotkowiak, 2011; Banerjee, et al., 1995). This type of cause-related brand personality
cultivation is often seen on Twitter, which provides a means of frequent conversation-like
communications with their network (Etter & Plotkowiak, 2011). Such indirect tactics are low-
cost to implement and can influence consumers who seek relationships with brands based
on perceived humanlike characteristics that match their own values (Sen & Bhattacharya,
2001). However, because there is little regulation or standardization of terminology used in
related marketing communications, vague and misleading terms are often used to imply
socially responsible practices that are not in place (Kangun, et al., 1991).
Numerous researchers have expressed concern over the potential implications of such
practices (e.g., Kangun, et al., 1991; Laufer 2003; Bhattacharya & Sen, 2004; Marciniak,
2009; Mark-Herbert & von Schantz, 2007). Some researchers have hypothesized, for exam-
ple, that an abundance of misleading advertisements may desensitize consumers to sincere
communications of cause-related initiatives, thus reducing firms’ incentives to adopt socially
responsible practices (Furlow, 2010). Others have suggested that consumers will identify in-
sincere marketing communications and penalize such firms for hypocrisy (Bhattacharya &
Sen, 2004; Mark-Herbert & von Schantz, 2007; Wagner, et al., 2009). Popoli (2011)
provides a review of literature on the link between corporate social responsibility (CSR)
practice and brand image, but discusses little about the potentially moderating role of topic-
relevant marketing communications. Brown and Dacin (1997) show that increasing
consumer awareness about a firm’s CSR activities can affect brand evaluations, but the role
of marketer generated content (MGC) as a vehicle for awareness is not explored. Du, et al.
(2010) and Varadarajan and Menon (1988) present conceptual frameworks for the role of
MGC in realizing the value of legitimate CSR initiatives, but do not consider the effects of
greenwashing practices or examine large empirical samples.
Despite the importance of this issue and the confusion surrounding it, the literature does
not yet offer broad empirically-grounded insights on truthfulness in cause-related marketing
practices — i.e., on understanding the overall relationship between cause-related
communication and commitment to the cause; on ways to detect brands and terms that may
signal greenwash; and on identifying they ways in which sincere and insincere cause-related
marketing communications differ. We expect that this is likely because empirically exploring
this question requires collecting and labeling an extensive data set of categorized marketing
communications, which can be prohibitively difficult and costly to obtain for large numbers
of brands through traditional techniques (e.g., manual content coding) (Netzer, et al., 2012;
Godes & Mayzlin, 2004; Liu, 2006).
The recent explosion of social media use by marketers offers an unprecedented data trail of
such communications, though new methods must be developed in order to effectively
leverage this tremendous volume of unstructured data. We introduce an approach that uses
text regression to build a model to predict a brand’s third-party ratings along different
dimensions of social responsibility from the textual content of their Tweets. This technique
has been used in the past to predict movie revenues from online reviews (Joshi et al., 2010),
stock volatility from financial reports (Kogan, et al., 2009), and legislative roll calls from
legislative text (Gerrish & Blei, 2011). In doing this, we can discover, over a wide range of
brands, the extent to which truth can be predicted from Twitter communications; identify
4
brands and terms that may be using or used in greenwashing practices; and glean insight
into how cause-related terms are used differently in sincere vs. misleading contexts.
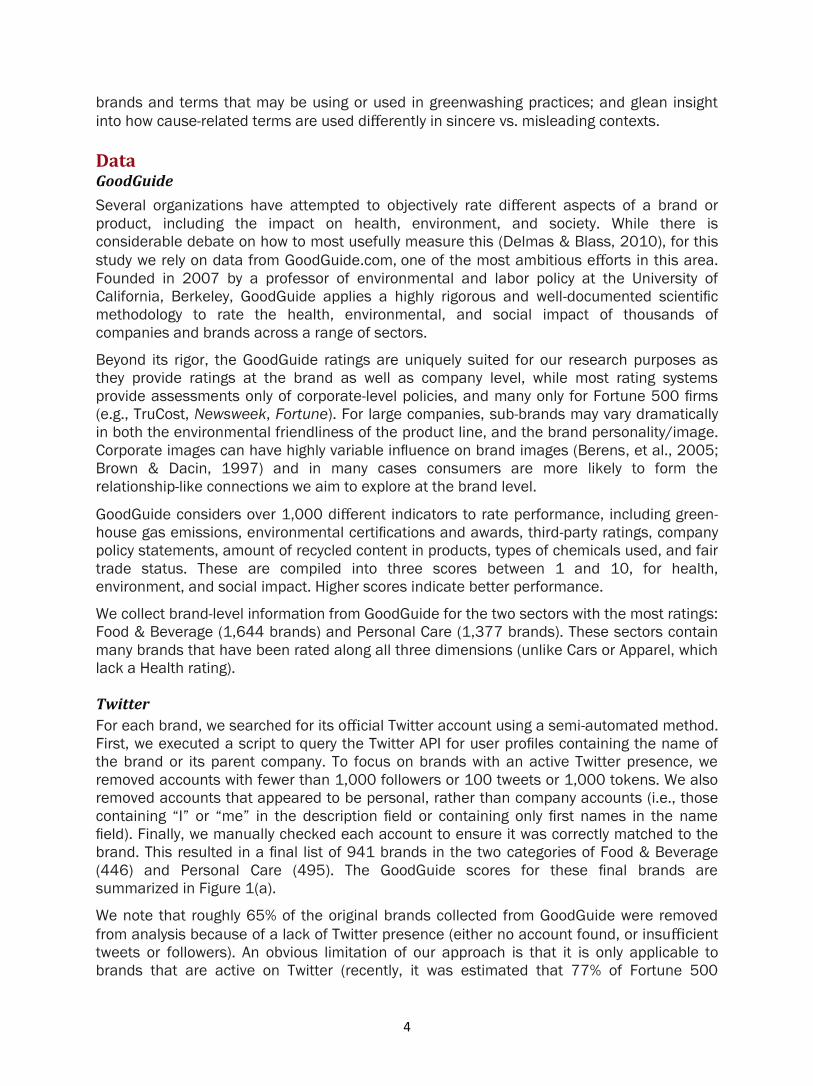
Data GoodGuide
Several organizations have attempted to objectively rate different aspects of a brand or
product, including the impact on health, environment, and society. While there is
considerable debate on how to most usefully measure this (Delmas & Blass, 2010), for this
study we rely on data from GoodGuide.com, one of the most ambitious efforts in this area.
Founded in 2007 by a professor of environmental and labor policy at the University of
California, Berkeley, GoodGuide applies a highly rigorous and well-documented scientific
methodology to rate the health, environmental, and social impact of thousands of
companies and brands across a range of sectors.
Beyond its rigor, the GoodGuide ratings are uniquely suited for our research purposes as
they provide ratings at the brand as well as company level, while most rating systems
provide assessments only of corporate-level policies, and many only for Fortune 500 firms
(e.g., TruCost, Newsweek, Fortune). For large companies, sub-brands may vary dramatically
in both the environmental friendliness of the product line, and the brand personality/image.
Corporate images can have highly variable influence on brand images (Berens, et al., 2005;
Brown & Dacin, 1997) and in many cases consumers are more likely to form the
relationship-like connections we aim to explore at the brand level.
GoodGuide considers over 1,000 different indicators to rate performance, including green-
house gas emissions, environmental certifications and awards, third-party ratings, company
policy statements, amount of recycled content in products, types of chemicals used, and fair
trade status. These are compiled into three scores between 1 and 10, for health,
environment, and social impact. Higher scores indicate better performance.
We collect brand-level information from GoodGuide for the two sectors with the most ratings:
Food & Beverage (1,644 brands) and Personal Care (1,377 brands). These sectors contain
many brands that have been rated along all three dimensions (unlike Cars or Apparel, which
lack a Health rating).
For each brand, we searched for its official Twitter account using a semi-automated method.
First, we executed a script to query the Twitter API for user profiles containing the name of
the brand or its parent company. To focus on brands with an active Twitter presence, we
removed accounts with fewer than 1,000 followers or 100 tweets or 1,000 tokens. We also
removed accounts that appeared to be personal, rather than company accounts (i.e., those
containing “I” or “me” in the description field or containing only first names in the name
field). Finally, we manually checked each account to ensure it was correctly matched to the
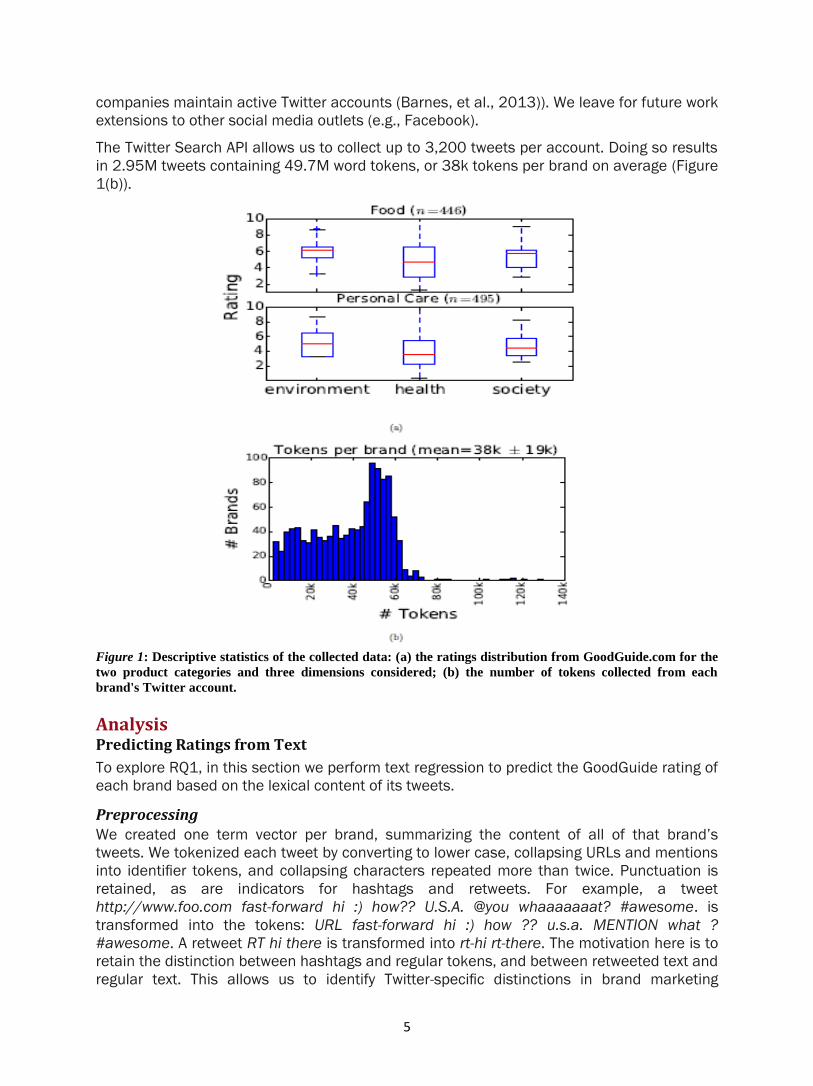
brand. This resulted in a final list of 941 brands in the two categories of Food & Beverage
(446) and Personal Care (495). The GoodGuide scores for these final brands are
summarized in Figure 1(a).
We note that roughly 65% of the original brands collected from GoodGuide were removed
from analysis because of a lack of Twitter presence (either no account found, or insufficient
tweets or followers). An obvious limitation of our approach is that it is only applicable to
brands that are active on Twitter (recently, it was estimated that 77% of Fortune 500
5
companies maintain active Twitter accounts (Barnes, et al., 2013)). We leave for future work
extensions to other social media outlets (e.g., Facebook).
The Twitter Search API allows us to collect up to 3,200 tweets per account. Doing so results
in 2.95M tweets containing 49.7M word tokens, or 38k tokens per brand on average (Figure
1(b)).
Figure 1: Descriptive statistics of the collected data: (a) the ratings distribution from GoodGuide.com for the
two product categories and three dimensions considered; (b) the number of tokens collected from each
brand's Twitter account.
Analysis Predicting Ratings from Text
To explore RQ1, in this section we perform text regression to predict the GoodGuide rating of
each brand based on the lexical content of its tweets.
Preprocessing
We created one term vector per brand, summarizing the content of all of that brand’s
tweets. We tokenized each tweet by converting to lower case, collapsing URLs and mentions
into identifier tokens, and collapsing characters repeated more than twice. Punctuation is
retained, as are indicators for hashtags and retweets. For example, a tweet
http://www.foo.com fast-forward hi :) how?? U.S.A. @you whaaaaaaat? #awesome. is
transformed into the tokens: URL fast-forward hi :) how ?? u.s.a. MENTION what ?
#awesome. A retweet RT hi there is transformed into rt-hi rt-there. The motivation here is to
retain the distinction between hashtags and regular tokens, and between retweeted text and
regular text. This allows us to identify Twitter-specific distinctions in brand marketing
6
strategy.
Next, these tokens were converted into a binary representation, where 1 indicates that a
term is used by a brand, 0 otherwise. We removed from the vocabulary terms not used by at
least 10 different brands, to help identify terms that are generalizable across brands. This
resulted in 54,958 unique terms. Finally, to downweight common terms, we transformed
these into tf-idf vectors by dividing by one plus the number of brands that use each term.
Regression
Given the list of brand vectors paired with three ratings from GoodGuide, we fit six separate
ridge regression models (one for each category/rating pair). We performed 10-fold cross-
validation to assess the out-of-sample error rate of the model, reporting two quality metrics:
Pearson’s r: We collect all the predicted values from the held-out data in each fold
and compute the correlation with the true values; r ∈ [−1, 1]; larger is better.
nrmsd: Normalized root-mean-square deviation computes the square root of the
mean square error, normalized by the range of true values:
where y is the vector of true ratings and y is the vector of predicted ratings. nrmsd ∈
[0, 1]; smaller is better.
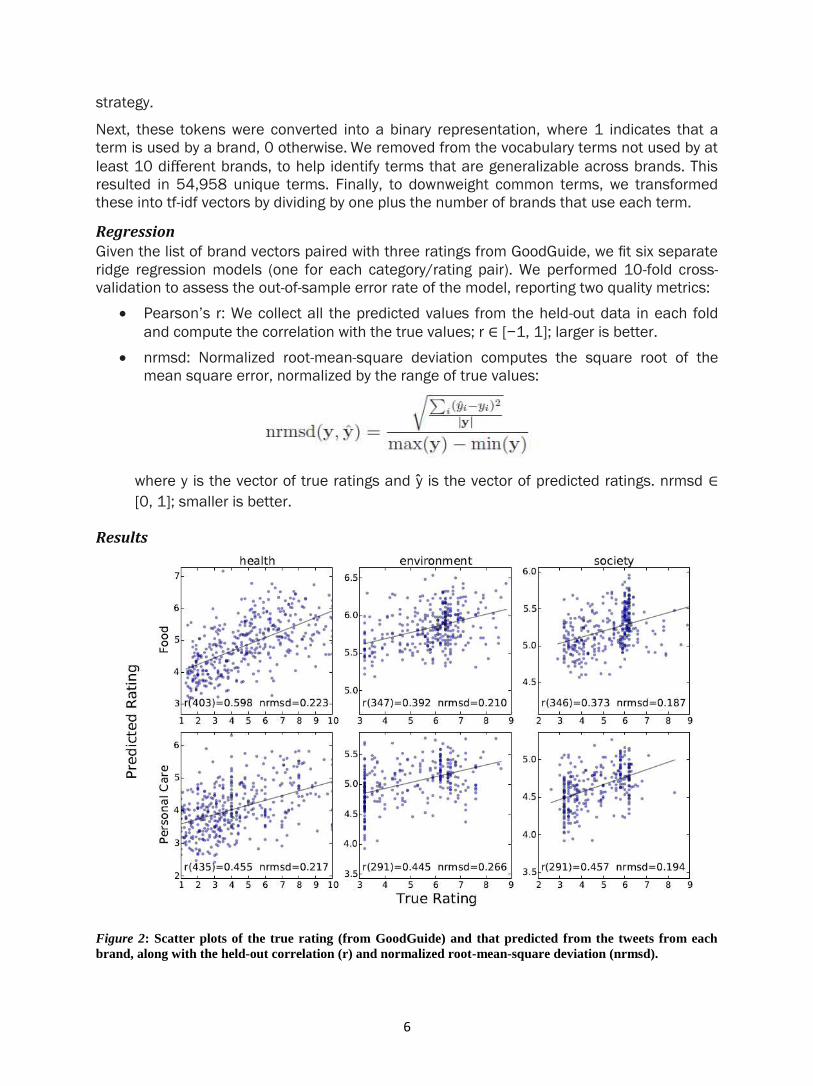
Results
Figure 2: Scatter plots of the true rating (from GoodGuide) and that predicted from the tweets from each
brand, along with the held-out correlation (r) and normalized root-mean-square deviation (nrmsd).
7
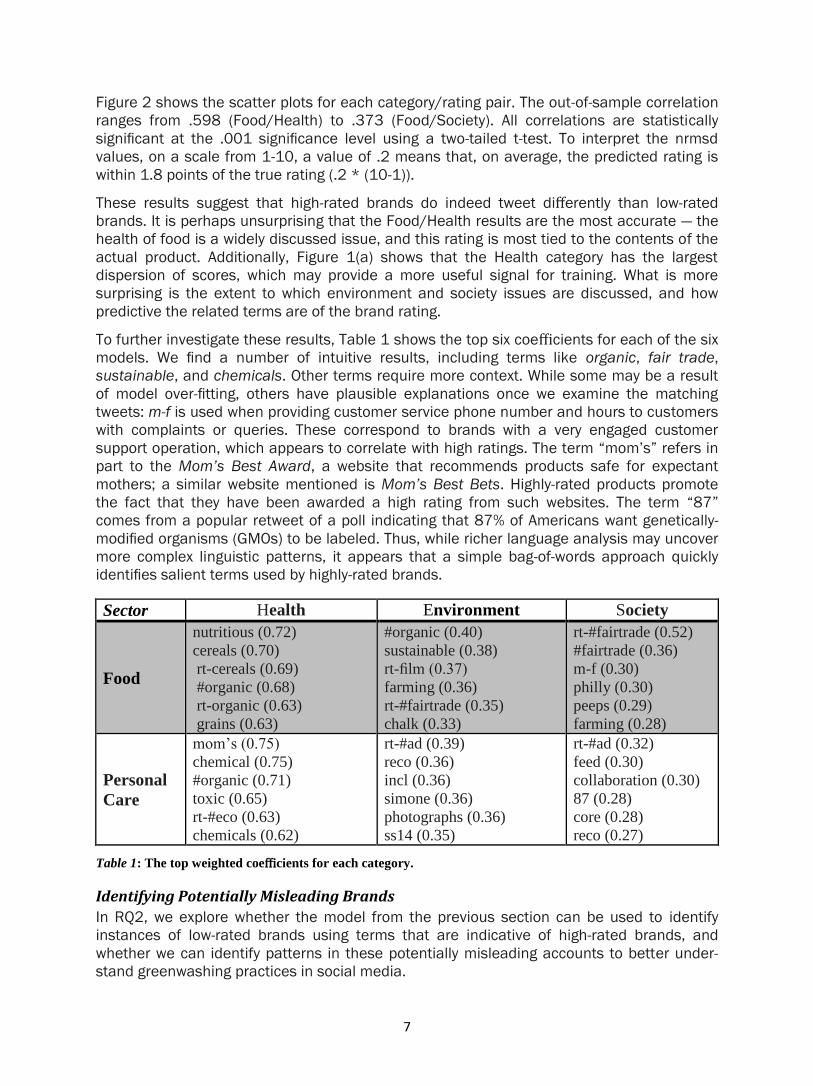
Figure 2 shows the scatter plots for each category/rating pair. The out-of-sample correlation
ranges from .598 (Food/Health) to .373 (Food/Society). All correlations are statistically
significant at the .001 significance level using a two-tailed t-test. To interpret the nrmsd
values, on a scale from 1-10, a value of .2 means that, on average, the predicted rating is
within 1.8 points of the true rating (.2 * (10-1)).
These results suggest that high-rated brands do indeed tweet differently than low-rated
brands. It is perhaps unsurprising that the Food/Health results are the most accurate — the
health of food is a widely discussed issue, and this rating is most tied to the contents of the
actual product. Additionally, Figure 1(a) shows that the Health category has the largest
dispersion of scores, which may provide a more useful signal for training. What is more
surprising is the extent to which environment and society issues are discussed, and how
predictive the related terms are of the brand rating.
To further investigate these results, Table 1 shows the top six coefficients for each of the six
models. We find a number of intuitive results, including terms like organic, fair trade,
sustainable, and chemicals. Other terms require more context. While some may be a result
of model over-fitting, others have plausible explanations once we examine the matching
tweets: m-f is used when providing customer service phone number and hours to customers
with complaints or queries. These correspond to brands with a very engaged customer
support operation, which appears to correlate with high ratings. The term “mom’s” refers in
part to the Mom’s Best Award, a website that recommends products safe for expectant
mothers; a similar website mentioned is Mom’s Best Bets. Highly-rated products promote
the fact that they have been awarded a high rating from such websites. The term “87”
comes from a popular retweet of a poll indicating that 87% of Americans want genetically-
modified organisms (GMOs) to be labeled. Thus, while richer language analysis may uncover
more complex linguistic patterns, it appears that a simple bag-of-words approach quickly
identifies salient terms used by highly-rated brands.
Sector Health Environment Society
Food
nutritious (0.72)
cereals (0.70)
rt-cereals (0.69)
#organic (0.68)
rt-organic (0.63)
grains (0.63)
#organic (0.40)
sustainable (0.38)
rt-film (0.37)
farming (0.36)
rt-#fairtrade (0.35)
chalk (0.33)
rt-#fairtrade (0.52)
#fairtrade (0.36)
m-f (0.30)
philly (0.30)
peeps (0.29)
farming (0.28)
Personal
Care
mom’s (0.75)
chemical (0.75)
#organic (0.71)
toxic (0.65)
rt-#eco (0.63)
chemicals (0.62)
rt-#ad (0.39)
reco (0.36)
incl (0.36)
simone (0.36)
photographs (0.36)
ss14 (0.35)
rt-#ad (0.32)
feed (0.30)
collaboration (0.30)
87 (0.28)
core (0.28)
reco (0.27)
Table 1: The top weighted coefficients for each category.
Identifying Potentially Misleading Brands
In RQ2, we explore whether the model from the previous section can be used to identify
instances of low-rated brands using terms that are indicative of high-rated brands, and
whether we can identify patterns in these potentially misleading accounts to better under-
stand greenwashing practices in social media.
8
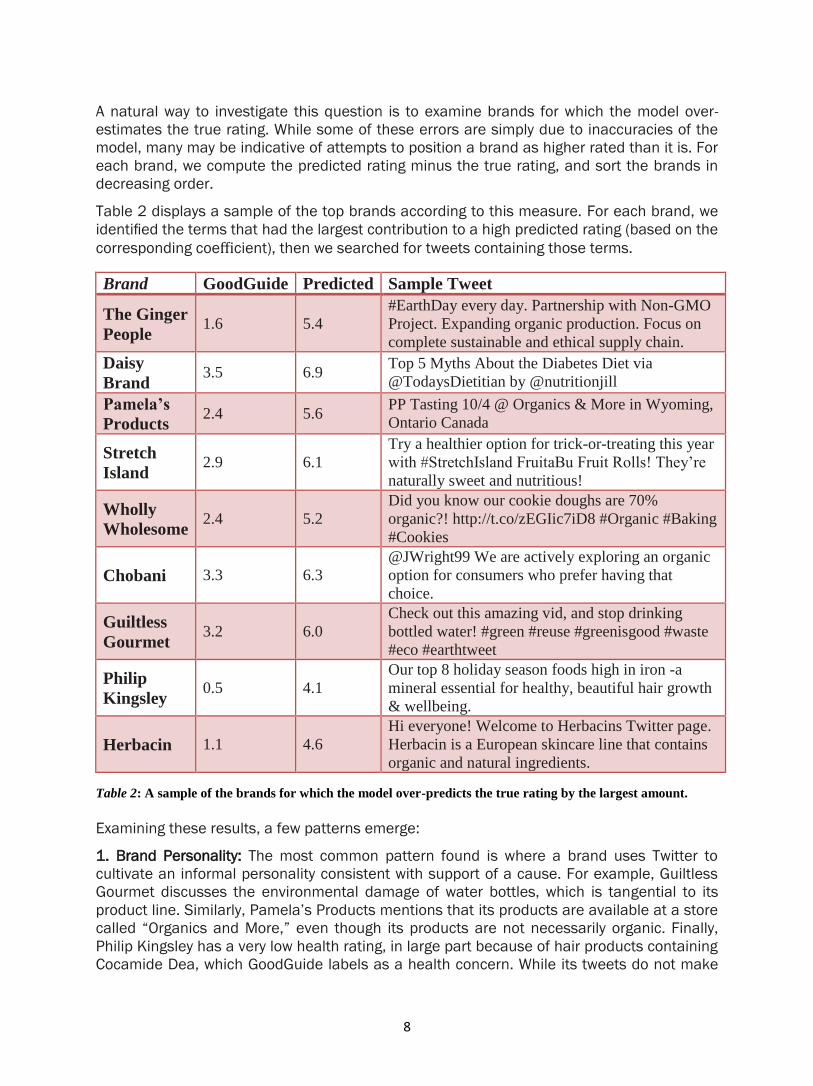
A natural way to investigate this question is to examine brands for which the model over-
estimates the true rating. While some of these errors are simply due to inaccuracies of the
model, many may be indicative of attempts to position a brand as higher rated than it is. For
each brand, we compute the predicted rating minus the true rating, and sort the brands in
decreasing order.
Table 2 displays a sample of the top brands according to this measure. For each brand, we
identified the terms that had the largest contribution to a high predicted rating (based on the
corresponding coefficient), then we searched for tweets containing those terms.
Brand GoodGuide Predicted Sample Tweet
The Ginger
People 1.6 5.4
#EarthDay every day. Partnership with Non-GMO
Project. Expanding organic production. Focus on
complete sustainable and ethical supply chain.
Daisy
Brand 3.5 6.9
Top 5 Myths About the Diabetes Diet via
@TodaysDietitian by @nutritionjill
Pamela’s
Products 2.4 5.6
PP Tasting 10/4 @ Organics & More in Wyoming,
Ontario Canada
Stretch
Island 2.9 6.1
Try a healthier option for trick-or-treating this year
with #StretchIsland FruitaBu Fruit Rolls! They’re
naturally sweet and nutritious!
Wholly
Wholesome 2.4 5.2
Did you know our cookie doughs are 70%
organic?! http://t.co/zEGIic7iD8 #Organic #Baking
#Cookies
Chobani 3.3 6.3
@JWright99 We are actively exploring an organic
option for consumers who prefer having that
choice.
Guiltless
Gourmet 3.2 6.0
Check out this amazing vid, and stop drinking
bottled water! #green #reuse #greenisgood #waste
#eco #earthtweet
Philip
Kingsley 0.5 4.1
Our top 8 holiday season foods high in iron -a
mineral essential for healthy, beautiful hair growth
& wellbeing.
Herbacin 1.1 4.6
Hi everyone! Welcome to Herbacins Twitter page.
Herbacin is a European skincare line that contains
organic and natural ingredients.
Table 2: A sample of the brands for which the model over-predicts the true rating by the largest amount.
Examining these results, a few patterns emerge:
1. Brand Personality: The most common pattern found is where a brand uses Twitter to
cultivate an informal personality consistent with support of a cause. For example, Guiltless
Gourmet discusses the environmental damage of water bottles, which is tangential to its
product line. Similarly, Pamela’s Products mentions that its products are available at a store
called “Organics and More,” even though its products are not necessarily organic. Finally,
Philip Kingsley has a very low health rating, in large part because of hair products containing
Cocamide Dea, which GoodGuide labels as a health concern. While its tweets do not make
9
direct claims about the health of its products, the brand personality promotes health and
well-being.
2. Product Labeling. A second common case arises when low-ranked brands attempt to
label their products with terms popularly associated with a cause, most notably for health
and the environment. For example, some brands with low GoodGuide ratings have
advocated for voluntary labeling of genetically-modified organisms (GMOs) or have
advertised their products as GMO-free. Similarly, many brands highlight that their products
are gluten-free or vegan. For example, in Table 2, Wholly Wholesome, which makes organic
desserts, receives a low health rating from GoodGuide (due to high sugar content), but the
model predicts a high score due to the term “organic.” Additionally, Herbacin, which makes
skincare products, highlights its organic ingredients, though GoodGuide assigns a low health
rating due to the presence of Propyl Paraben in some of its products, which GoodGuide
views as a health risk.
3. Explicit Health Marketing: A third category contains direct attempts to promote the health
of a line of products. For example, Daisy Brand, known most for sour cream and cottage
cheese, often posts tweets promoting the health value of its products, e.g.: “Our mission is
to make the highest-quality & healthiest cottage cheese on the planet.” The sample tweet in
Table 2 cites an article clarifying that not all white foods are unhealthy (in response to the
guidance to encourage people to eat more whole grains).
This analysis provides insight into the most common ways in which brands may be engaging
in greenwashing practices on Twitter and cultivating a brand image that is more in line with
a social cause than independent ratings suggest.
Identifying Potentially Misleading Terms
10
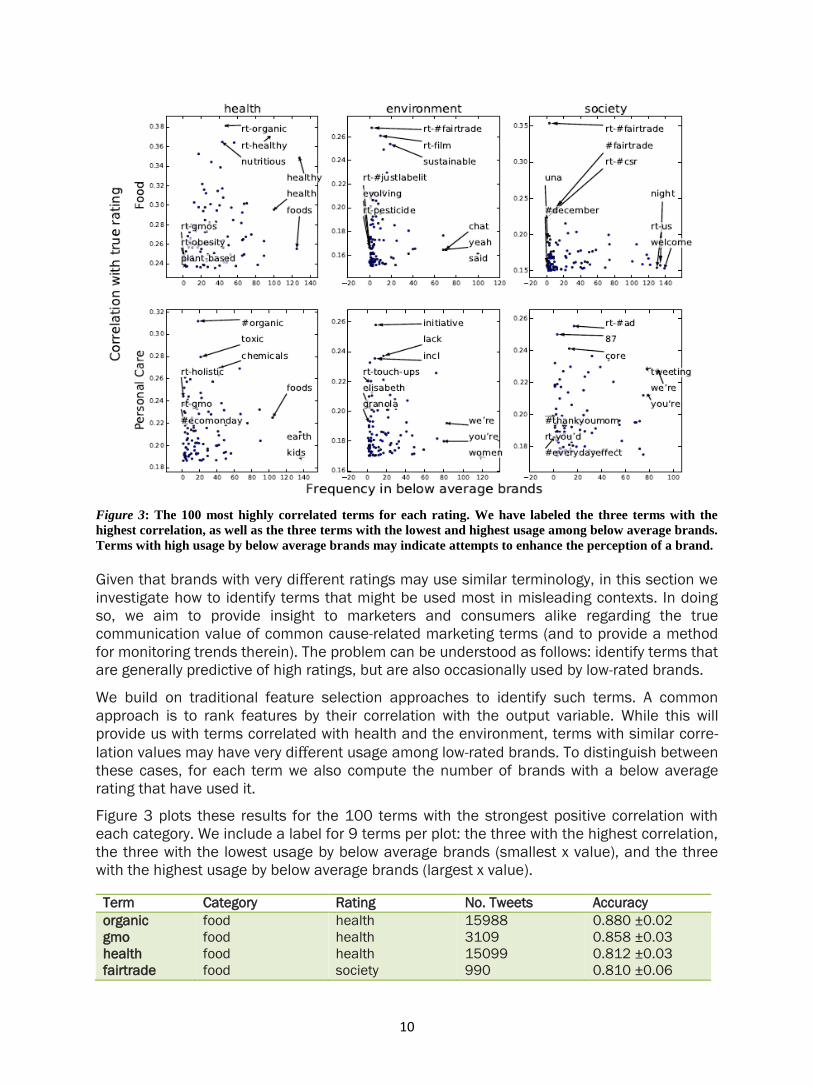
Figure 3: The 100 most highly correlated terms for each rating. We have labeled the three terms with the
highest correlation, as well as the three terms with the lowest and highest usage among below average brands.
Terms with high usage by below average brands may indicate attempts to enhance the perception of a brand.
Given that brands with very different ratings may use similar terminology, in this section we
investigate how to identify terms that might be used most in misleading contexts. In doing
so, we aim to provide insight to marketers and consumers alike regarding the true
communication value of common cause-related marketing terms (and to provide a method
for monitoring trends therein). The problem can be understood as follows: identify terms that
are generally predictive of high ratings, but are also occasionally used by low-rated brands.
We build on traditional feature selection approaches to identify such terms. A common
approach is to rank features by their correlation with the output variable. While this will
provide us with terms correlated with health and the environment, terms with similar corre-
lation values may have very different usage among low-rated brands. To distinguish between
these cases, for each term we also compute the number of brands with a below average
rating that have used it.
Figure 3 plots these results for the 100 terms with the strongest positive correlation with
each category. We include a label for 9 terms per plot: the three with the highest correlation,
the three with the lowest usage by below average brands (smallest x value), and the three
with the highest usage by below average brands (largest x value).
Term Category Rating No. Tweets Accuracy
organic
gmo
health
fairtrade
food
food
food
food
health
health
health
society
15988
3109
15099
990
0.880 ±0.02
0.858 ±0.03
0.812 ±0.03
0.810 ±0.06
11
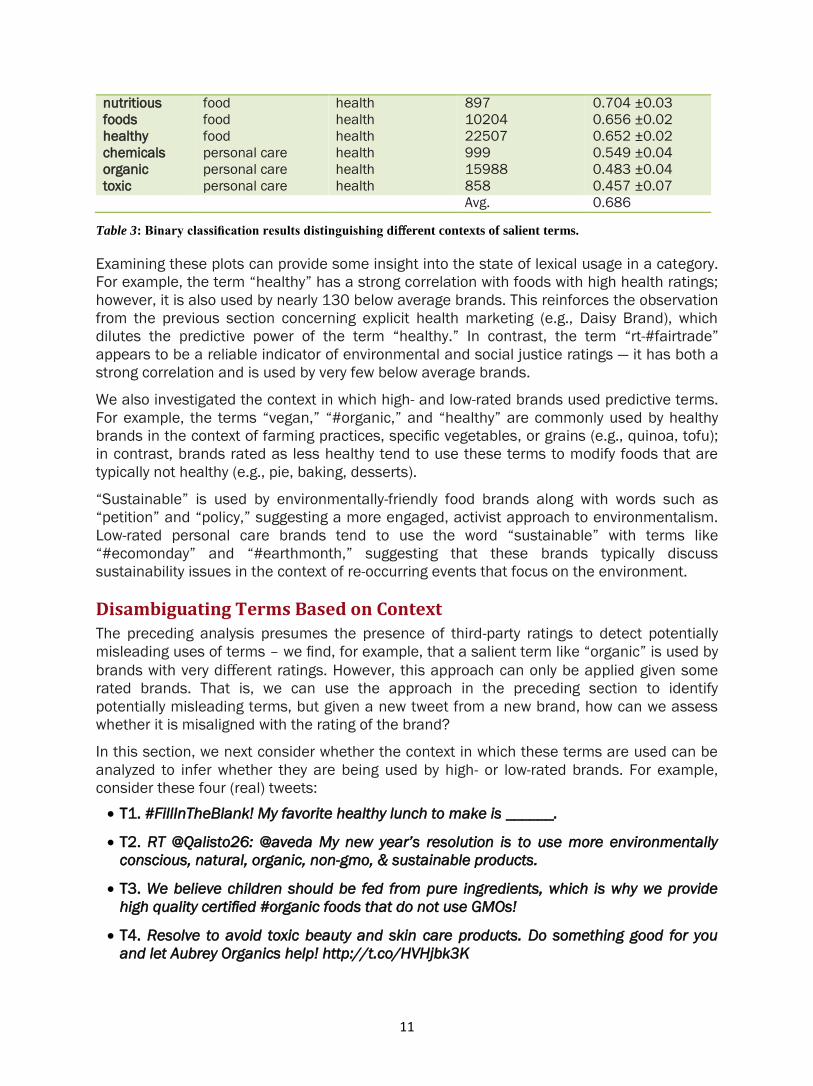
Table 3: Binary classification results distinguishing different contexts of salient terms.
Examining these plots can provide some insight into the state of lexical usage in a category.
For example, the term “healthy” has a strong correlation with foods with high health ratings;
however, it is also used by nearly 130 below average brands. This reinforces the observation
from the previous section concerning explicit health marketing (e.g., Daisy Brand), which
dilutes the predictive power of the term “healthy.” In contrast, the term “rt-#fairtrade”
appears to be a reliable indicator of environmental and social justice ratings — it has both a
strong correlation and is used by very few below average brands.
We also investigated the context in which high- and low-rated brands used predictive terms.
For example, the terms “vegan,” “#organic,” and “healthy” are commonly used by healthy
brands in the context of farming practices, specific vegetables, or grains (e.g., quinoa, tofu);
in contrast, brands rated as less healthy tend to use these terms to modify foods that are
typically not healthy (e.g., pie, baking, desserts).
“Sustainable” is used by environmentally-friendly food brands along with words such as
“petition” and “policy,” suggesting a more engaged, activist approach to environmentalism.
Low-rated personal care brands tend to use the word “sustainable” with terms like
“#ecomonday” and “#earthmonth,” suggesting that these brands typically discuss
sustainability issues in the context of re-occurring events that focus on the environment.
Disambiguating Terms Based on Context
The preceding analysis presumes the presence of third-party ratings to detect potentially
misleading uses of terms – we find, for example, that a salient term like “organic” is used by
brands with very different ratings. However, this approach can only be applied given some
rated brands. That is, we can use the approach in the preceding section to identify
potentially misleading terms, but given a new tweet from a new brand, how can we assess
whether it is misaligned with the rating of the brand?
In this section, we next consider whether the context in which these terms are used can be
analyzed to infer whether they are being used by high- or low-rated brands. For example,
consider these four (real) tweets:
T1. #FillInTheBlank! My favorite healthy lunch to make is ______.
T2. RT @Qalisto26: @aveda My new year’s resolution is to use more environmentally
conscious, natural, organic, non-gmo, & sustainable products.
T3. We believe children should be fed from pure ingredients, which is why we provide
high quality certified #organic foods that do not use GMOs!
T4. Resolve to avoid toxic beauty and skin care products. Do something good for you
and let Aubrey Organics help! http://t.co/HVHjbk3K
nutritious
foods
healthy
chemicals
organic
toxic
food
food
food
personal care
personal care
personal care
health
health
health
health
health
health
897
10204
22507
999
15988
858
0.704 ±0.03
0.656 ±0.02
0.652 ±0.02
0.549 ±0.04
0.483 ±0.04
0.457 ±0.07
Avg. 0.686
12
Each tweet contains one or more terms correlated with a high rating. However, the usage
and context is quite different. T1 asks users to respond with healthy lunch items, but does
not make any claims about a specific product. T2 is a retweet of a user who has mentioned
a personal care product (Aveda), listing many desirable properties of the brand. This is an
interesting and common case of a brand retweeting a customer’s tweet to promote a
product. These differ from T3 and T4, which provide direct statements about the health of a
product. Indeed, the GoodGuide ratings for the brands of T1 and T2 are lower than those for
T3 and T4.
In this section, we build a classifier to distinguish between these two types of contexts. We
borrow ideas from word-sense disambiguation (Stevenson and Wilks, 2003), a common
natural language processing task to identify the sense of a term (e.g., bass the fish or bass
the musical instrument). While here the terms are not expected to have different senses in
the NLP sense, we do expect the contexts to differ based on the rating of the brand.
Thus, we can view this as a supervised learning task: the training data consist of a list of
(term, context) pairs; each point is assigned a label that is positive if the term is used by a
high-rated brand, and negative if the term is used by a low-rated brand. Once we fit a
classifier, we can then apply it to new tweets (with unknown ratings) in order to determine
whether the author is a brand with a high or low rating.
To binarize the ratings, we consider brands with ratings above 5.5 to be positive, and those
below 4.5 to be negative (to filter neutral ratings). We then fit a logistic regression classifier7
using the same term list use in the previous regression analysis. The primary difference is
that here we are classifying individual tweets containing a specific keyword, rather than
estimating the rating of a brand based on all of that brand’s tweets.
Table 3 displays the average accuracy of 10-fold cross-validation. To better estimate
generalization accuracy, we have ensured that a tweet from the same brand cannot occur in
both a training and testing split in the same fold. (This is to confirm the classifier is not
simply learning to associate brand-identifying terms with the class label.)
We can see that the difficulty of this classification task varies by keyword, ranging from 88%
accuracy for tweets containing the word “organic,” to only 46% accuracy for tweets
containing the term “toxic.” Averaged over all terms, the classifier is 68.6% accurate at
determining whether a tweet originated from a high- or low-rated brand, given that the tweet
contains a keyword known to correlate with high ratings. This indicates that there exist
contextual clues that may sometimes reveal the rating of a brand.
We also examined how Twitter-specific behavior differs between the two contexts. Specif-
ically, we investigate whether usage of retweets, hashtags, urls, and mentions differs
between high- and low-rated brands. Table 4 displays how often each Twitter feature was
among the top 10 most highly-correlated features for high- and low-rated brands. We can
see that the behavior varies considerably depending on the term. For example, the use of
hashtags is strongly correlated with high-rated food brands mentioning the term “organic,”
but the use of hashtags is correlated with low-rated food brands mentioning the term
“health.” We can see that the feature that displays the most consistent signal is retweeting
— for 7 of 10 terms, it is strongly correlated with low-rated brands. For example, if the term
“organic” appears in a retweet, it is more likely to be from a low-rated brand. This suggests
that retweets may be a way for low-rated brands to align themselves with a particular cause.
Examining other highly weighted terms reveals another interesting insight: for the term
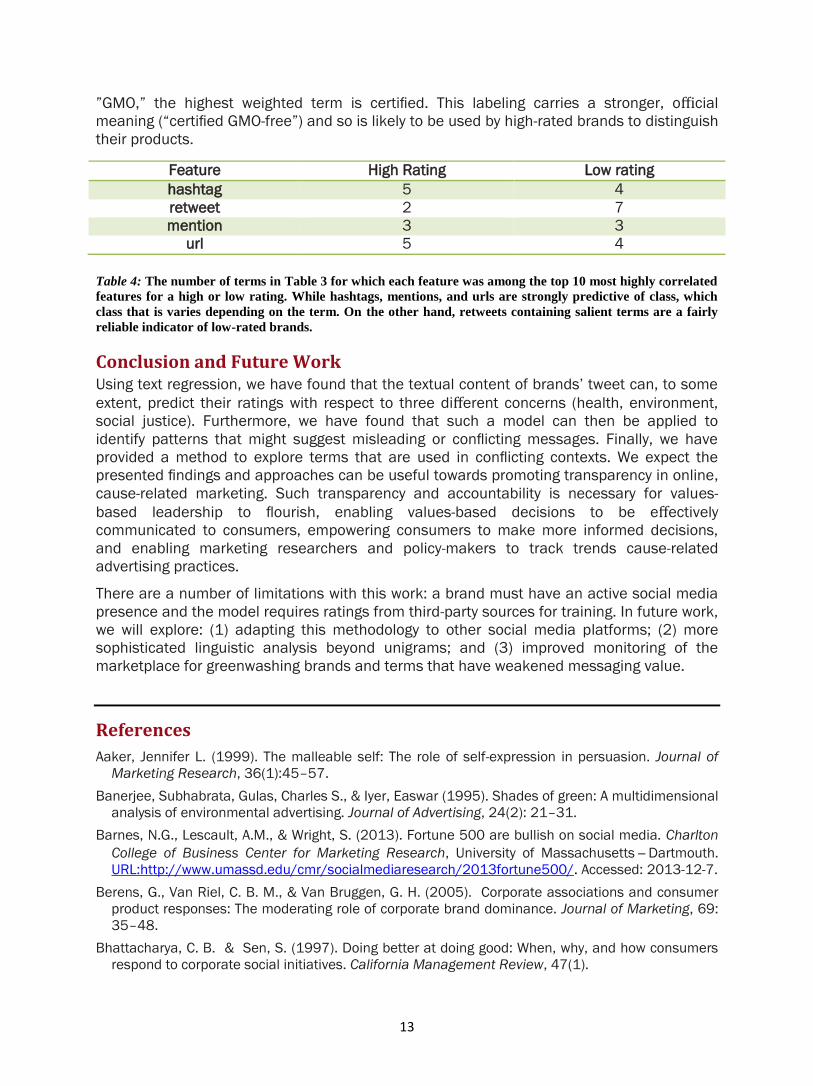
13
”GMO,” the highest weighted term is certified. This labeling carries a stronger, official
meaning (“certified GMO-free”) and so is likely to be used by high-rated brands to distinguish
their products.
Table 4: The number of terms in Table 3 for which each feature was among the top 10 most highly correlated
features for a high or low rating. While hashtags, mentions, and urls are strongly predictive of class, which
class that is varies depending on the term. On the other hand, retweets containing salient terms are a fairly
reliable indicator of low-rated brands.
Conclusion and Future Work Using text regression, we have found that the textual content of brands’ tweet can, to some
extent, predict their ratings with respect to three different concerns (health, environment,
social justice). Furthermore, we have found that such a model can then be applied to
identify patterns that might suggest misleading or conflicting messages. Finally, we have
provided a method to explore terms that are used in conflicting contexts. We expect the
presented findings and approaches can be useful towards promoting transparency in online,
cause-related marketing. Such transparency and accountability is necessary for values-
based leadership to flourish, enabling values-based decisions to be effectively
communicated to consumers, empowering consumers to make more informed decisions,
and enabling marketing researchers and policy-makers to track trends cause-related
advertising practices.
There are a number of limitations with this work: a brand must have an active social media
presence and the model requires ratings from third-party sources for training. In future work,
we will explore: (1) adapting this methodology to other social media platforms; (2) more
sophisticated linguistic analysis beyond unigrams; and (3) improved monitoring of the
marketplace for greenwashing brands and terms that have weakened messaging value.
References
Aaker, Jennifer L. (1999). The malleable self: The role of self-expression in persuasion. Journal of
Marketing Research, 36(1):45–57.
Banerjee, Subhabrata, Gulas, Charles S., & Iyer, Easwar (1995). Shades of green: A multidimensional
analysis of environmental advertising. Journal of Advertising, 24(2): 21–31.
Barnes, N.G., Lescault, A.M., & Wright, S. (2013). Fortune 500 are bullish on social media. Charlton
College of Business Center for Marketing Research, University of Massachusetts Dartmouth.
URL:http://www.umassd.edu/cmr/socialmediaresearch/2013fortune500/. Accessed: 2013-12-7.
Berens, G., Van Riel, C. B. M., & Van Bruggen, G. H. (2005). Corporate associations and consumer
product responses: The moderating role of corporate brand dominance. Journal of Marketing, 69:
35–48.
Bhattacharya, C. B. & Sen, S. (1997). Doing better at doing good: When, why, and how consumers
respond to corporate social initiatives. California Management Review, 47(1).
Feature High Rating Low rating
hashtag 5 4
retweet 2 7
mention 3 3
url 5 4
14
Brown, Tom J. & Dacin, Peter A. (1997). The company and the product: Corporate associations and
consumer product responses. Journal of Marketing, 68–84.
Delmas, Magali & Blass, Vered Doctori (2010). Measuring corporate environmental performance:
The trade-offs of sustainability ratings. Business Strategy and the Environment, 19(4): 245–260.
Du, Shuili, Bhattacharya, C.B., & Sen, Sankar (2010). Maximizing business returns to corporate
social responsibility (CSR): The role of CSR communication, 12(1):8–1.
Etter, Michael & Plotkowiak, Thomas (2011). CSR communication strategies for Twitter. URL:
http://hdl.handle.net/10398/8529. Accessed 2013-12-06.
Furlow, Nancy E. Greenwashing in the new millennium (2010). Journal of Applied Business and
Economics, 10(6):22–26.
Gerrish, Sean & Blei, David M. (2011). Predicting legislative roll calls from text. In Proceedings of the
28th International Conference on Machine Learning (icml-11), 489–496.
Godes, D. & Mayzlin, D. (2004). Using online conversations to study word-of-mouth communication.
Marketing Science, 23(4): 545–560.
Joshi, Mahesh, Das, Dipanjan, Gimpel, Kevin, & Smith, Noah A. (2010). Movie reviews and revenues:
An experiment in text regression. In Human Language Technologies: The 2010 Annual Conference
of the North American Chapter of the Association for Computational Linguistics, 293–296.
Association for Computational Linguistics.
Kangun, Norman, Carlson, Les, & Grove, Stephen J. (1991). Environmental advertising claims: A
preliminary investigation. Journal of Public Policy & Marketing, 10(2): 47–58.
Kogan, Shimon, Levin, Dimitry, Routledge, Bryan R., Sagi, Jacob S., & Smith, Noah A. (2009). Pre-
dicting risk from financial reports with regression. In Proceedings of Human Language
Technologies: The 2009 Annual Conference of the North American Chapter of the Association for
Computational Linguistics, 272–280. Association for Computational Linguistics.
Kuksov, D., Shachar, R., & Wang, K. (2013). Advertising and consumers’ communications. Marketing
Science, 32(2):294–309.
Laufer, William S. (2003). Social accountability and corporate greenwashing. Journal of Business
Ethics, 43(3):253–261.
Liu, Yong (2006). Word of mouth for movies: Its dynamics and impact on box office revenue. Journal
of Marketing, 70(3):74–89.
Marciniak, Adam (2009). Greenwashing as an example of ecological marketing misleading practices.
Comparative Economic Research, 12(1):49–59.
Mark-Herbert, C. & von Schantz, C. (2007). Communicating corporate social responsibility — brand
management. Journal of Business Ethics and Organizations Studies, 12(2).
Netzer, O., Feldman, R., Goldenberg, J., & Fresko, M. (2012). Mine your own business: Market-
structure surveillance through text mining. Marketing Science, 31(3):521–543.
Popoli, Paolo (2011). Linking CSR strategy and brand image different approaches in local and global
markets. Marketing Theory, 11(4):419–433.
Sen, S. & Bhattacharya, C.B. (2001). Does doing good always lead to doing better? Consumer
reactions to corporate social responsibility. Journal of Marketing Research, 38(2):225–43.
Sonnier, Garrett & Ainslie, Andrew (2011). Estimating the value of brand-image associations: The
role of general and specific brand image. Journal of Marketing Research, 48(3):518–531.
Stevenson, Mark & Wilks, Yorick (2003). Word-sense disambiguation. The Oxford Handbook of
Computational Linguistics, 249–265.
Varadarajan, P. R. & Menon, A. (1988). Cause-related marketing: A coalignment of marketing
strategy and corporate philanthropy. Journal of Marketing, 52(3):58–74.
15
Wagner, T., Lutz, Richard J., & Weitz, Barton (2009). Corporate hypocrisy: Overcoming the threat of
inconsistent corporate social responsibility perceptions. Journal of Marketing, 73(6):77–91.
About the Authors
Aron Culotta is an Assistant Professor of Computer Science at
the Illinois Institute of Technology in Chicago, where he leads
the Text Analysis in the Public Interest lab (http://tapilab.
github.io/). He obtained his Ph.D. in Computer Science from the
University of Massachusetts, Amherst in 2008, advised by Dr.
Andrew McCallum, where he developed machine learning
algorithms for natural language processing. He was a Microsoft
Live Labs Fellow from 2006-2008, and completed research
internships at IBM, Google, and Microsoft Research. His work
has received best paper awards at AAAI and CSCW.
Jennifer Cutler is an Assistant Professor of Marketing at the
Illinois Institute of Technology Stuart School of Business, where
her research and teaching focus on social media marketing
analytics. She obtained her Ph.D. in Business Administration
with a focus on quantitative marketing in 2013 from Duke
University. Prior to her graduate studies, she worked at
Microsoft.
Junzhe Zheng is a Master’s student in the Computer Science
Department at the Illinois Institute of Technology. His research
investigates machine learning, NLP, and text mining on social
networks.