Embed Size (px)
Citation preview
Finite-Element Limit Analysis of the Tucker High School Gymnasium Roof Failure
Peter T Laursen and Edmond P Saliklis
Abstract The Randolph Tucker High School gymnasium roof failure of 1970 has received much scholarly attention This study will provide a conclusion to a large body of previously published works by means of limit state analysis of the roof failure using state of the art parametric finite-element modeling Parametric modeling within a general purpose finite-element analysis program allows for extremely rapid changes to the model because key terms are objects or parameters that can be adjusted internally by the program rather than laboriously entered by the user The failure of the roof was investigated by means of a limit state analysis which accurately captured the cracking of the concrete and the yielding of the reinforcing steel Concrete creep and shrinkage and relaxation of the prestressing steel were also accounted for Finally the authors also studied the idea that camber in the roof geometry might have prevented collapse
Author keywords Finite-element method Limit analysis Failure modes Hyperbolic parabolic shells
Introduction
The purpose of this paper is threefold One of its purposes is to introduce the capabilities of a new state-of-the-art parametric finite-element tool which can perform accurate limit state analyses of concrete structures The other is to use this tool to perform a limit state study of the failure of a shallow gabled hyperbolic paraboloid (hypar) roof that has garnered much scholarly attention The final purpose is to explore the idea that slightly altering the geometry of the structure specifically the ridge beam camber may have prevented its collapse
The tool we present is a sophisticated finite-element model that accurately accounts for the myriad of components making up a reinforced concrete structure including the type of aggregate used the amount of prestressing the relaxation of the prestressing and the shrinkage and creep of the concrete Furthermore this tool can explore large deformations and it can perform true limit state analyses wherein the internal forces are redistributed as needed to achieve equilibrium as more and more of the concrete cracks or crushes and steel begins to yield
The case study researched was the collapse of the Tucker High School gymnasium roof in 1970 This failure was examined to demonstrate convincingly the engineering mechanisms that caused this collapse and to propose a convincing conclusion to a number of scholarly papers devoted to this case
Another compelling reason to study this roof collapse ties into the final purpose of this paper namely to explore an idea proposed
by a prominent thin shell designer about this structure Milo Ketchum Jr suggested in his memoirs (Ketchum 1990) written shortly before his death that the collapse of this structure may have been prevented if the roof ridge beams had been cambered thus obtaining a potentially stronger load carrying member in both bending and arching action The camber of the roof ridge beams became a parameter that could be explored through the parametric finite-element modeling tool and Ketchumrsquos suggestion was extensively explored
Background
The Randolph Tucker High School gymnasium was completed in 1963 in Henrico County Virginia The roof concrete was placed in November of 1962 In 1970 it collapsed after significant sagging of the roof was noticed Fortunately the students in the gym escaped without injury (ldquoStudentsrdquo 1970) The investigative forenshysic team recorded enormous deformations in companion shells built at the same time as Tucker (ldquoDesignrdquo 1970) deformations on the order of 045 m (18 in) (Ketchum 1990) This was not the only shallow gabled hypar collapse of the 1970s a similar design colshylapsed at the Cheyenne Municipal Airport in 1975 (ldquo15-year-old HPrdquo 1970)
Investigations of the cause of the Tucker roof failure have to this date produced suggestive evidence Edwards and Billington (1998) summarized previous investigations and postulated that failure was because of the design error of not taking secondary moments and time effects such as concrete creep and shrinkage into account They concluded that creep and shrinkage contribute greatly to the roof deflection and therefore affected the roof strength A large-scale NSF funded study concurred with this asshysessment (Gallegros-Cazares and Schnobrich 1988) but it also suggested that camber in the design of such shallow gabled hypars may have been beneficial Lateral movement of the supporting columns of shallow hypars has also been implicated in such failures (Simmonds 1989)
Milo Ketchum Jr a prominent engineer and early advocate of thin-shelled concrete hypar roofs in the United States pondered
the failure of the Tucker High School roof ldquoIt was a good 10 yearsrdquo he stated in his memoir (Ketchum 1990) ldquobefore it finally occurred to me what the real design fault was It shows that when you design shells all your normal instincts flee The center point should have been cambered upwardrdquo Ketchum was familiar with the Tucker High School roof collapse because he was a consultant to one of the investigating teams This paper will conclude with an invesshytigation of Ketchumrsquos camber hypothesis
The Tucker Gym hypar roof was designed according to the thin membrane theory that was widely accepted at the time Later investigations have shown the membrane theory to be inappropriate for such structures (Billington 1990) Even a simple arch analogy for arching diagonally across the Tucker roof aligns well with reshysults obtained by finite-element models (Edwards and Billington 1998) The lesson from the arch analogy is that the lateral thrust from the roof to be restrained by the tie beams (refer to Figs 1 and 2) may have been twice as high as the thrust predicted from the thin membrane theory applied at the time of design
This paper presents new and more definitive answers to the cause of failure based on state-of-the-art finite-element analysis Use of the proprietary FEM software package ldquoIBDASrdquo (Integrated Bridge Design and Analysis System) (Andersen et al 1994) deshyveloped by the international engineering consultant COWI AS Denmark allowed for sophisticated failure analysis of the roof
Results presented herein aim to quantify 1) the effects of creep and shrinkage on the roof behavior 2) the maximum roof load capacity using limit state analysis and 3) the effect that camber of the ridge center point has on the roof strength
Modeling
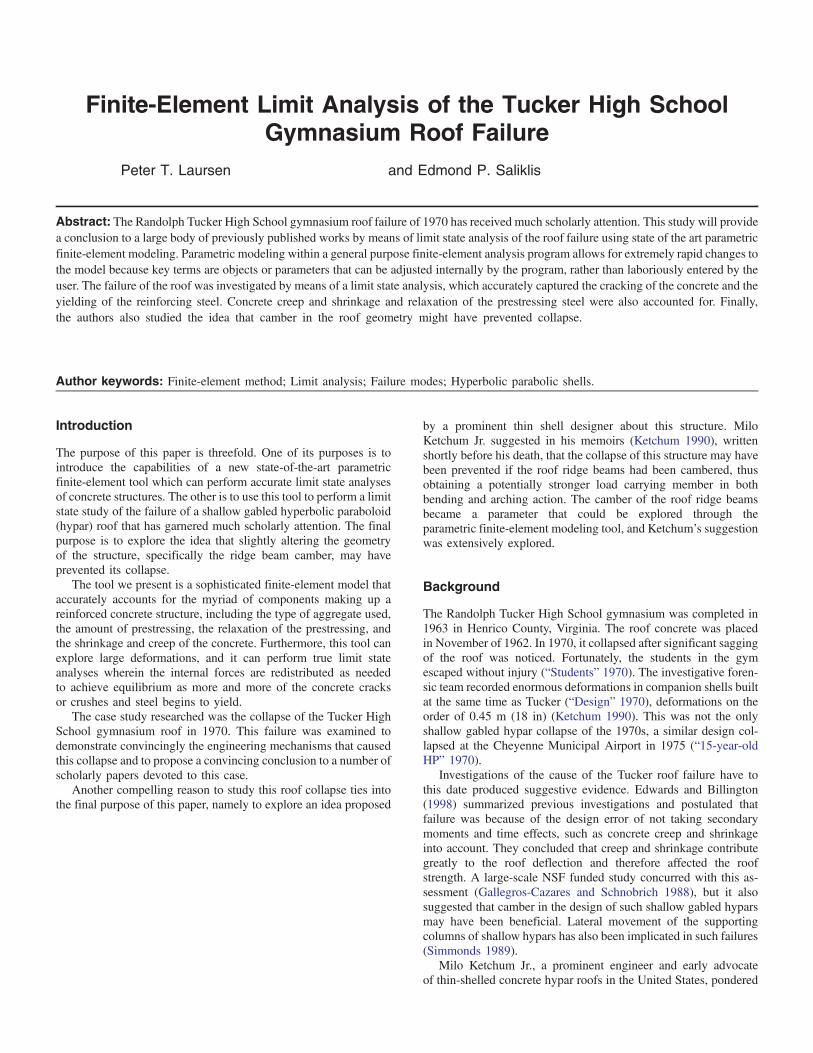
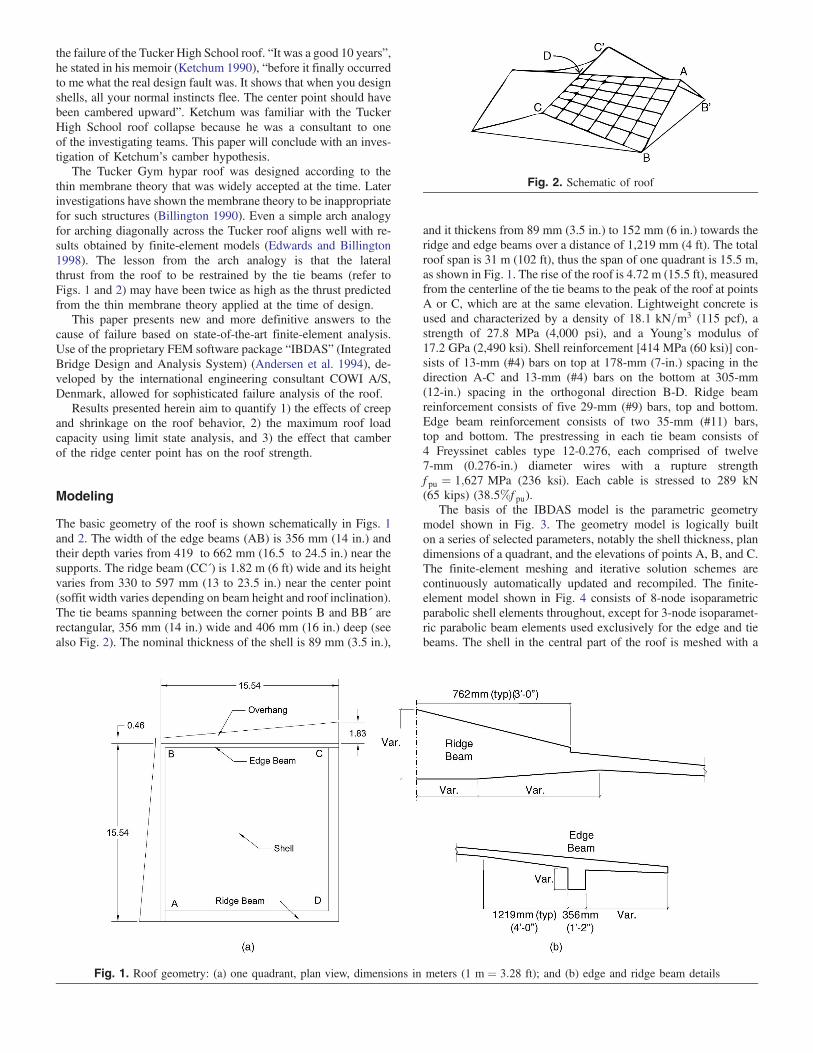
The basic geometry of the roof is shown schematically in Figs 1 and 2 The width of the edge beams (AB) is 356 mm (14 in) and their depth varies from 419 to 662 mm (165 to 245 in) near the supports The ridge beam (CCacute) is 182 m (6 ft) wide and its height varies from 330 to 597 mm (13 to 235 in) near the center point (soffit width varies depending on beam height and roof inclination) The tie beams spanning between the corner points B and BBacute are rectangular 356 mm (14 in) wide and 406 mm (16 in) deep (see also Fig 2) The nominal thickness of the shell is 89 mm (35 in)
Fig 2 Schematic of roof
and it thickens from 89 mm (35 in) to 152 mm (6 in) towards the ridge and edge beams over a distance of 1219 mm (4 ft) The total roof span is 31 m (102 ft) thus the span of one quadrant is 155 m as shown in Fig 1 The rise of the roof is 472 m (155 ft) measured from the centerline of the tie beams to the peak of the roof at points A or C which are at the same elevation Lightweight concrete is used and characterized by a density of 181 kN=m3 (115 pcf) a strength of 278 MPa (4000 psi) and a Youngrsquos modulus of 172 GPa (2490 ksi) Shell reinforcement [414 MPa (60 ksi)] conshysists of 13-mm (4) bars on top at 178-mm (7-in) spacing in the direction A-C and 13-mm (4) bars on the bottom at 305-mm (12-in) spacing in the orthogonal direction B-D Ridge beam reinforcement consists of five 29-mm (9) bars top and bottom Edge beam reinforcement consists of two 35-mm (11) bars top and bottom The prestressing in each tie beam consists of 4 Freyssinet cables type 12-0276 each comprised of twelve 7-mm (0276-in) diameter wires with a rupture strength f pu frac14 1627 MPa (236 ksi) Each cable is stressed to 289 kN (65 kips) (385f pu)
The basis of the IBDAS model is the parametric geometry model shown in Fig 3 The geometry model is logically built on a series of selected parameters notably the shell thickness plan dimensions of a quadrant and the elevations of points A B and C The finite-element meshing and iterative solution schemes are continuously automatically updated and recompiled The finite-element model shown in Fig 4 consists of 8-node isoparametric parabolic shell elements throughout except for 3-node isoparametshyric parabolic beam elements used exclusively for the edge and tie beams The shell in the central part of the roof is meshed with a
Fig 1 Roof geometry (a) one quadrant plan view dimensions in meters (1 m frac14 328 ft) and (b) edge and ridge beam details
Fig 3 IBDAS Geometry model
Fig 4 IBDAS finite-element model plan and isometric views
5 times 5 grid of shell elements in each quadrant Concrete creep and shrinkage and prestressing steel relaxation are accounted for using the CEB-FIP Model Code 1990 (Comite Euro-International Du Beton 1993) as an integral part of the IBDAS material model Calculations include second-order effects (large deformation forshymulation) Prestressing cables in the tie beams are fully accounted for which is an improvement over previous modeling of the Tucker High School roof found in the literature Lateral restraint of the reinforced concrete shell is provided exclusively by the prestressed tie beams Our analysis showed that the reinforced concrete piers supporting the roof corners provided negligible lateral restraint The total self-weight of the model excluding the tie beams is 277 MN (622 kips)
Perhaps the most significant model improvement over previous studies is that IBDAS allows for true strength limit state analysis In such analyses all elements in the model representing the concrete are assigned reinforcement (mild or prestressing as described preshyviously) true to the reinforcing amount and to location and direcshytion in the cross section In the strength limit state analyses the actual state of each cross section (specifically at each Gauss point) is determined by using the strength limit state material descriptions and safety factors according to the American Concrete Institute (ACI) 318-08 building code (ACI 2008) all of which are paramshyeters embedded in the IBDAS standard material model This natshyurally limits the capacity of any cross section as the reinforcement yields or the concrete crushes and results in a modified (reduced) stiffness of each element depending on the level of flexural
cracking which directly modifies the global stiffness matrix of the finite-element model Subsequent iterations will result in redisshytribution of internal forces as possible In other words as cracking develops in the reinforced concrete cross sections as a result of bending moment and axial force the effective stiffness of the strucshyture tends to reduce significantly thus causing redistribution of inshyternal forces and larger deflections The overall structural capacity is calculated as the highest load at which convergence (equilibrium) can be achieved
Analysis Matrix
Two series of analysis were conducted elastic analysis (EL)mdash which included analyses of creep and shrinkage and second-order effects for the roof subjected to nominal self-weight (10 SW) and limit state analysis (LS)mdashwhich increased the applied load until failure was induced Assessment of the effect of camber of the center point D was conducted only for the limit state analyses Table 1 shows the matrix of all model variants in which short term (ST) means no creep and shrinkage and long term (LT) includes creep and shrinkage First and second refer to without (1ST) and with (2ND) second-order effects C is the camber of point D with respect to points A and C [C00 means zero C12 means 305 mm (12 in) and C18 means 457 mm (18 in)]
The IBDAS creep and shrinkage calculations were based on a time span of 100 years and a concrete age of 30 days at load
Table 1 Finite-Element Models
Series Model Analysis type Time span Calculation order Self-weight multiplier Camber
1 EL-ST-1ST EL ST 1ST 100 mdash
EL-ST-2ND EL ST 2ND 100 mdash
EL-LT-1ST EL LT 1ST 100 mdash
EL-LT-2ND EL LT 2ND 100 mdash
2 LS-100SW-C00 LS LT 2ND 100 C00
LS-134SW-C00 LS LT 2ND 134 C00
LS-180SW-C12 LS LT 2ND 180 C12
LS-222SW-C18 LS LT 2ND 222 C18
Fig 5 Vertical deformation elastic analyses (a) ridge beam (DA) (b) edge beam (AB) and (c) shell along diagonal (DB)
transfer The expected creep and shrinkage at the time of collapse about 8 years after construction were assessed to be 92 and 99 respectively of the 100 year values thus the authors concluded that the 100-year value was acceptably accurate (CEB-FIP 1990)
Results
Elastic Analysis
Fig 5 shows the vertical deformation of the ridge beam (line DA in Fig 2) the edge beam (line AB in Fig 2) and the diagonal line of the shell (line DB in Fig 2) respectively for the roof subjected to
nominal self-weight in four conditions immediately after construcshytion (ST) and after all losses (LT) without and with second-order effects accounted for (1ST2ND)
Looking at the ridge beam deflection in Fig 5(a) and comparing EL-ST-1ST to EL-LT-1ST the center point deformations are 17 mm (066 in) and 48 mm (189 in) respectively Creep and shrinkage contribute significantly to the shell deformation by inshycreasing it approximately three-fold Comparing the second-order analyses to the first-order ones (EL-ST-1ST to EL-ST-2ND for exshyample) in Fig 5(a) second-order effects increase the deformation of the center point approximately 25 Both creep and shrinkage have significant influence on the roof deflections however the
Fig 6 Roof deformed shape elastic analysis model EL-LT-2ND 20 times scale
long-term deformation of the center point of 60 mm (236 in) under nominal self-weight does not indicate imminent failure of the structure The edge beam deformation plotted in Fig 5(b) shows similar behavior for EL ST versus the EL LT behavior Fig 5(c) illustrates the vertical displacement of the roof along the diagonal between the roof center and a corner (Line DB in Fig 2) The results of Fig 5(c) demonstrate that the shell tends to deflect upwards towards the corners and downwards toward the center and that contributions from creep shrinkage and second-order effects increase the deformations three- to four-fold No snap-through tendency was observed even for loading of more than 50 times the self weight Fig 6 shows a deformation plot of the shell after all losses magnified 20 times
Table 2 summarizes the total tie beam force (external equilibshyrium force) and contributions from the prestressing steel and concrete (negative indicates compression)
A significant finding is that the total tie beam force exceeds the prestressing forces after all losses because of creep shrinkage and relaxation causing the concrete to decompress (ie zero concrete force) The total tension force in the tie beam was found to be 105 MN (236 kips) The prestressing force was 113 MN (254 kips) immediately after stressing and 105 MN (236 kips) after all losses had occurred The loss of prestress effectively puts the concrete of the tie beam into tension and it is expected to eventually crack The implication of this is that the tie beams will offer a far lower degree of axial rigidity for tying the roof corners together than expected The tension in the tie beam of 106 MN (239 kips) corresponds well with the expected thrust from the arch analogy
Limit State Analysis
Limit state analysis was executed for the four configurations given in Table 1 Series 2 all taking into account creep and shrinkage and
Table 2 Tie Beam Forces
second-order effects The four cases represent the original structure (no camber) subjected to 10 SW the original structure with 134 SW a structure with 305-mm (12-in) camber subjected to 180 SW and finally a structure with 457-mm (18-in) camber of the center point subjected to 222 SW The SW multipliers of 134 180 and 222 are not arbitrary they are the highest loads for which the IBDAS model found convergence for a given camber and thus represent the overall strength of the structure
As seen in Table 2 the limit state analyses revealed that the concrete in the tie beams cracks Effectively the tie beam rigidity is solely provided by the prestressing steel itself because the concrete is no longer in compression This inefficiency allowed lateral expansion of the shell corners that resulted in further vertical shell deformation and associated cracking These additive effects contributed to the reduction of the overall strength of the roof
Fig 7 shows the roof deformations for the four limit state analyses with the elastic long-term second-order plot superimposed as a reference plot in light gray Fig 7(a) shows the ridge beam deformation and the limit state analysis for the original structure experiencing 10Self Weight increases the center point deformashytion to 149 mm from the 60 mm found in the elastic analysis Clearly the cracked concrete sections have softened the structure significantly and redistributed the internal forces The limit state analyses indicated steel yielding and inelastic concrete deformation in the edge beams near the supports and in the ridge beam at the center and at quarter points No inelastic deformations were obshyserved in the 89-mm (35-in) thickness shell regions
Pushing the original structure to near failure with 134Self Weight results in a center point deformation of about 417 mm (164 in) a 28-fold increase in comparison to the 10Self Weight results The limit state analyses indicate that steel yielding and inelastic concrete deformation has spread to most parts of the edge and ridge beams and furthermore had spread into thin part of the shell about 6 m (197 ft) from the corner support (the area where the shell bubbles up in Fig 8)
The roof structure is essentially barely capable of carrying its self-weight once all losses have occurred Other sources of load could have come from additional roofing materials and items mounted to the ceiling The center deformation of 417 mm (164 in) corresponds well with visual observation of the roof sag shortly before failure
Significantly we found that increasing the camber by 12 in inshycreases the roof strength by 34 and an 18-in camber increases the roof strength by 66 These models show identical failure patterns as LS-134SW-C00 Fig 8 shows a deformation plot of the roof in its original configuration under 134Self Weight at 20x magnishyfication scale
Series Model Total MN (kips) PrestMN (kips) Concrete MN (kips)
1 EL-ST-1ST 106 (239) 113 (254) -007eth-16THORN EL-ST-2ND 106 (239) 113 (254) -007eth-16THORN EL-LT-1ST 105 (236) 105 (236) 000
EL-LT-2ND 105 (236) 105 (236) 000
2 LS-100SW-C00 105 (236) 105 (236) 000
LS-134SW-C00 140 (315) 140 (315) 000
LS-180SW-C12 186 (419) 186 (419) 000
LS-222SW-C18 230 (518) 230 (518) 000
Fig 7 Vertical deformation limit state analyses (a) ridge beam (DA) (b) edge beam (AB) and (c) shell along diagonal (DB)
Fig 8 Roof deformed shape limit state analysis model LS-134SWshyC00 20 times scale
Conclusions
Creep and shrinkage effects clearly contribute to the roof deformashytion However concrete cracking and second-order effects appear to contribute to a far higher degree to the roof deformation Limit state analyses show that extensive concrete cracking occurs in the roof subjected to self-weight only causing redistribution of forces and a three- to four-fold increase of vertical deformation
in comparison to purely elastic modeling In the 10Self Weight condition steel yielding and inelastic concrete deformation occurs in the edge beams near the supports and in the ridge beam at the center and at quarter points The ability to track the redisshytribution of stresses as concrete and steel elements fail is a signifishycant feature of the powerful limit state analysis
Limit state analysis shows that the original structure can sustain only 134 SW or 34 more weight than the nominal structural concrete weight This suggests that the structure had little or no spare capacity for any superimposed dead load unintended dead load or environmental loads such as wind and snow The failure mode was attributed to flexural failure of the ridge beam The tie beams are critical members for the structure and appear to be under designed perhaps because the design forces arose from the inapshyplicable thin membrane theory The concrete tie beams became ineffective once they became overburdened and what was meant to be prestressed concrete no longer experienced any compression
Introducing a roof camber of 12 or 18 in clearly increases the roof capacity and possibly may have prevented the catastrophic failure Ketchumrsquos thesis of introducing camber in the ridge beam to increase the overall strength appears warranted
Further and perhaps more reasonable design improvements would be to prestress the edge and ridge beams and to ensure that the tie beams remain in compression at any given time for any given load combination A parametric modeling tool can be used to detect the redistribution of forces in a concrete structure that experiences
cracking and imminent failure This tool was used to definitively study a well-documented roof failure and to provide new insights into the hypothesis that camber of the ridge beam would indeed have significantly increased the capacity of the roof
Acknowledgments
The authors are grateful to COWI AS Denmark for providing access to IBDAS and to PF Jakobsen for modeling assistance
References
American Concrete Institute (ACI) (2008) ldquoBuilding code requirements for structural concrete and commentaryrdquo ACI 318-08 Farmington Hills MI
Andersen G B Jakobsen P F and Soslashrensen K A (1994) ldquoIntegrated design and analysis of cable supported bridgesrdquo Proc 3rd Symp on Strait Crossings lsquo94 Taylor amp Francis Oxford UK 258ndash291
Billington D P (1990) Thin shell concrete structures McGraw-Hill
New York 275ndash283 Comite Euro-International Du Beton (1993) ldquoCEB-FIP model code 1990
Thomas Telford Londonrdquo Lausanne Switzerland ldquoDesign errors blamed for gym collapserdquo (1970) Engineering News Reshy
cord 20 Edwards N P and Billington D P (1998) ldquoFE analysis of tucker
high school roof using nonlinear geometry and creeprdquo J Struct Eng 124(9) 984ndash991
Gallegros-Cazares S and Schnobrich W C (1988) ldquoEffects of creep and shrinkage on the behavior of reinforced concrete gable roof hyperbolic-paraboloidsrdquo Rep SRS 543 Dept of Civil Engn Univ of Illinois Urbana IL
Ketchum M S (1990) ldquoCareer memories A significant failurerdquo Milo Ketchum archives Manuscripts by Milo Ketchum langhttpwww ketchumorg-milofailurehtmlrang (Feb 2 2009)
Simmonds S (1989) ldquoEffect of support movement on hyperbolic paraboshyloid shellsrdquo J Struct Eng 115(1) 19ndash31
ldquoStudents clear gym moments before roof failsrdquo (1970) Engineering News Record 11
ldquo15-year-old HP roof fails injuring 18rdquo (1970) Engineering News Record 12
the failure of the Tucker High School roof ldquoIt was a good 10 yearsrdquo he stated in his memoir (Ketchum 1990) ldquobefore it finally occurred to me what the real design fault was It shows that when you design shells all your normal instincts flee The center point should have been cambered upwardrdquo Ketchum was familiar with the Tucker High School roof collapse because he was a consultant to one of the investigating teams This paper will conclude with an invesshytigation of Ketchumrsquos camber hypothesis
The Tucker Gym hypar roof was designed according to the thin membrane theory that was widely accepted at the time Later investigations have shown the membrane theory to be inappropriate for such structures (Billington 1990) Even a simple arch analogy for arching diagonally across the Tucker roof aligns well with reshysults obtained by finite-element models (Edwards and Billington 1998) The lesson from the arch analogy is that the lateral thrust from the roof to be restrained by the tie beams (refer to Figs 1 and 2) may have been twice as high as the thrust predicted from the thin membrane theory applied at the time of design
This paper presents new and more definitive answers to the cause of failure based on state-of-the-art finite-element analysis Use of the proprietary FEM software package ldquoIBDASrdquo (Integrated Bridge Design and Analysis System) (Andersen et al 1994) deshyveloped by the international engineering consultant COWI AS Denmark allowed for sophisticated failure analysis of the roof
Results presented herein aim to quantify 1) the effects of creep and shrinkage on the roof behavior 2) the maximum roof load capacity using limit state analysis and 3) the effect that camber of the ridge center point has on the roof strength
Modeling
The basic geometry of the roof is shown schematically in Figs 1 and 2 The width of the edge beams (AB) is 356 mm (14 in) and their depth varies from 419 to 662 mm (165 to 245 in) near the supports The ridge beam (CCacute) is 182 m (6 ft) wide and its height varies from 330 to 597 mm (13 to 235 in) near the center point (soffit width varies depending on beam height and roof inclination) The tie beams spanning between the corner points B and BBacute are rectangular 356 mm (14 in) wide and 406 mm (16 in) deep (see also Fig 2) The nominal thickness of the shell is 89 mm (35 in)
Fig 2 Schematic of roof
and it thickens from 89 mm (35 in) to 152 mm (6 in) towards the ridge and edge beams over a distance of 1219 mm (4 ft) The total roof span is 31 m (102 ft) thus the span of one quadrant is 155 m as shown in Fig 1 The rise of the roof is 472 m (155 ft) measured from the centerline of the tie beams to the peak of the roof at points A or C which are at the same elevation Lightweight concrete is used and characterized by a density of 181 kN=m3 (115 pcf) a strength of 278 MPa (4000 psi) and a Youngrsquos modulus of 172 GPa (2490 ksi) Shell reinforcement [414 MPa (60 ksi)] conshysists of 13-mm (4) bars on top at 178-mm (7-in) spacing in the direction A-C and 13-mm (4) bars on the bottom at 305-mm (12-in) spacing in the orthogonal direction B-D Ridge beam reinforcement consists of five 29-mm (9) bars top and bottom Edge beam reinforcement consists of two 35-mm (11) bars top and bottom The prestressing in each tie beam consists of 4 Freyssinet cables type 12-0276 each comprised of twelve 7-mm (0276-in) diameter wires with a rupture strength f pu frac14 1627 MPa (236 ksi) Each cable is stressed to 289 kN (65 kips) (385f pu)
The basis of the IBDAS model is the parametric geometry model shown in Fig 3 The geometry model is logically built on a series of selected parameters notably the shell thickness plan dimensions of a quadrant and the elevations of points A B and C The finite-element meshing and iterative solution schemes are continuously automatically updated and recompiled The finite-element model shown in Fig 4 consists of 8-node isoparametric parabolic shell elements throughout except for 3-node isoparametshyric parabolic beam elements used exclusively for the edge and tie beams The shell in the central part of the roof is meshed with a
Fig 1 Roof geometry (a) one quadrant plan view dimensions in meters (1 m frac14 328 ft) and (b) edge and ridge beam details
Fig 3 IBDAS Geometry model
Fig 4 IBDAS finite-element model plan and isometric views
5 times 5 grid of shell elements in each quadrant Concrete creep and shrinkage and prestressing steel relaxation are accounted for using the CEB-FIP Model Code 1990 (Comite Euro-International Du Beton 1993) as an integral part of the IBDAS material model Calculations include second-order effects (large deformation forshymulation) Prestressing cables in the tie beams are fully accounted for which is an improvement over previous modeling of the Tucker High School roof found in the literature Lateral restraint of the reinforced concrete shell is provided exclusively by the prestressed tie beams Our analysis showed that the reinforced concrete piers supporting the roof corners provided negligible lateral restraint The total self-weight of the model excluding the tie beams is 277 MN (622 kips)
Perhaps the most significant model improvement over previous studies is that IBDAS allows for true strength limit state analysis In such analyses all elements in the model representing the concrete are assigned reinforcement (mild or prestressing as described preshyviously) true to the reinforcing amount and to location and direcshytion in the cross section In the strength limit state analyses the actual state of each cross section (specifically at each Gauss point) is determined by using the strength limit state material descriptions and safety factors according to the American Concrete Institute (ACI) 318-08 building code (ACI 2008) all of which are paramshyeters embedded in the IBDAS standard material model This natshyurally limits the capacity of any cross section as the reinforcement yields or the concrete crushes and results in a modified (reduced) stiffness of each element depending on the level of flexural
cracking which directly modifies the global stiffness matrix of the finite-element model Subsequent iterations will result in redisshytribution of internal forces as possible In other words as cracking develops in the reinforced concrete cross sections as a result of bending moment and axial force the effective stiffness of the strucshyture tends to reduce significantly thus causing redistribution of inshyternal forces and larger deflections The overall structural capacity is calculated as the highest load at which convergence (equilibrium) can be achieved
Analysis Matrix
Two series of analysis were conducted elastic analysis (EL)mdash which included analyses of creep and shrinkage and second-order effects for the roof subjected to nominal self-weight (10 SW) and limit state analysis (LS)mdashwhich increased the applied load until failure was induced Assessment of the effect of camber of the center point D was conducted only for the limit state analyses Table 1 shows the matrix of all model variants in which short term (ST) means no creep and shrinkage and long term (LT) includes creep and shrinkage First and second refer to without (1ST) and with (2ND) second-order effects C is the camber of point D with respect to points A and C [C00 means zero C12 means 305 mm (12 in) and C18 means 457 mm (18 in)]
The IBDAS creep and shrinkage calculations were based on a time span of 100 years and a concrete age of 30 days at load
Table 1 Finite-Element Models
Series Model Analysis type Time span Calculation order Self-weight multiplier Camber
1 EL-ST-1ST EL ST 1ST 100 mdash
EL-ST-2ND EL ST 2ND 100 mdash
EL-LT-1ST EL LT 1ST 100 mdash
EL-LT-2ND EL LT 2ND 100 mdash
2 LS-100SW-C00 LS LT 2ND 100 C00
LS-134SW-C00 LS LT 2ND 134 C00
LS-180SW-C12 LS LT 2ND 180 C12
LS-222SW-C18 LS LT 2ND 222 C18
Fig 5 Vertical deformation elastic analyses (a) ridge beam (DA) (b) edge beam (AB) and (c) shell along diagonal (DB)
transfer The expected creep and shrinkage at the time of collapse about 8 years after construction were assessed to be 92 and 99 respectively of the 100 year values thus the authors concluded that the 100-year value was acceptably accurate (CEB-FIP 1990)
Results
Elastic Analysis
Fig 5 shows the vertical deformation of the ridge beam (line DA in Fig 2) the edge beam (line AB in Fig 2) and the diagonal line of the shell (line DB in Fig 2) respectively for the roof subjected to
nominal self-weight in four conditions immediately after construcshytion (ST) and after all losses (LT) without and with second-order effects accounted for (1ST2ND)
Looking at the ridge beam deflection in Fig 5(a) and comparing EL-ST-1ST to EL-LT-1ST the center point deformations are 17 mm (066 in) and 48 mm (189 in) respectively Creep and shrinkage contribute significantly to the shell deformation by inshycreasing it approximately three-fold Comparing the second-order analyses to the first-order ones (EL-ST-1ST to EL-ST-2ND for exshyample) in Fig 5(a) second-order effects increase the deformation of the center point approximately 25 Both creep and shrinkage have significant influence on the roof deflections however the
Fig 6 Roof deformed shape elastic analysis model EL-LT-2ND 20 times scale
long-term deformation of the center point of 60 mm (236 in) under nominal self-weight does not indicate imminent failure of the structure The edge beam deformation plotted in Fig 5(b) shows similar behavior for EL ST versus the EL LT behavior Fig 5(c) illustrates the vertical displacement of the roof along the diagonal between the roof center and a corner (Line DB in Fig 2) The results of Fig 5(c) demonstrate that the shell tends to deflect upwards towards the corners and downwards toward the center and that contributions from creep shrinkage and second-order effects increase the deformations three- to four-fold No snap-through tendency was observed even for loading of more than 50 times the self weight Fig 6 shows a deformation plot of the shell after all losses magnified 20 times
Table 2 summarizes the total tie beam force (external equilibshyrium force) and contributions from the prestressing steel and concrete (negative indicates compression)
A significant finding is that the total tie beam force exceeds the prestressing forces after all losses because of creep shrinkage and relaxation causing the concrete to decompress (ie zero concrete force) The total tension force in the tie beam was found to be 105 MN (236 kips) The prestressing force was 113 MN (254 kips) immediately after stressing and 105 MN (236 kips) after all losses had occurred The loss of prestress effectively puts the concrete of the tie beam into tension and it is expected to eventually crack The implication of this is that the tie beams will offer a far lower degree of axial rigidity for tying the roof corners together than expected The tension in the tie beam of 106 MN (239 kips) corresponds well with the expected thrust from the arch analogy
Limit State Analysis
Limit state analysis was executed for the four configurations given in Table 1 Series 2 all taking into account creep and shrinkage and
Table 2 Tie Beam Forces
second-order effects The four cases represent the original structure (no camber) subjected to 10 SW the original structure with 134 SW a structure with 305-mm (12-in) camber subjected to 180 SW and finally a structure with 457-mm (18-in) camber of the center point subjected to 222 SW The SW multipliers of 134 180 and 222 are not arbitrary they are the highest loads for which the IBDAS model found convergence for a given camber and thus represent the overall strength of the structure
As seen in Table 2 the limit state analyses revealed that the concrete in the tie beams cracks Effectively the tie beam rigidity is solely provided by the prestressing steel itself because the concrete is no longer in compression This inefficiency allowed lateral expansion of the shell corners that resulted in further vertical shell deformation and associated cracking These additive effects contributed to the reduction of the overall strength of the roof
Fig 7 shows the roof deformations for the four limit state analyses with the elastic long-term second-order plot superimposed as a reference plot in light gray Fig 7(a) shows the ridge beam deformation and the limit state analysis for the original structure experiencing 10Self Weight increases the center point deformashytion to 149 mm from the 60 mm found in the elastic analysis Clearly the cracked concrete sections have softened the structure significantly and redistributed the internal forces The limit state analyses indicated steel yielding and inelastic concrete deformation in the edge beams near the supports and in the ridge beam at the center and at quarter points No inelastic deformations were obshyserved in the 89-mm (35-in) thickness shell regions
Pushing the original structure to near failure with 134Self Weight results in a center point deformation of about 417 mm (164 in) a 28-fold increase in comparison to the 10Self Weight results The limit state analyses indicate that steel yielding and inelastic concrete deformation has spread to most parts of the edge and ridge beams and furthermore had spread into thin part of the shell about 6 m (197 ft) from the corner support (the area where the shell bubbles up in Fig 8)
The roof structure is essentially barely capable of carrying its self-weight once all losses have occurred Other sources of load could have come from additional roofing materials and items mounted to the ceiling The center deformation of 417 mm (164 in) corresponds well with visual observation of the roof sag shortly before failure
Significantly we found that increasing the camber by 12 in inshycreases the roof strength by 34 and an 18-in camber increases the roof strength by 66 These models show identical failure patterns as LS-134SW-C00 Fig 8 shows a deformation plot of the roof in its original configuration under 134Self Weight at 20x magnishyfication scale
Series Model Total MN (kips) PrestMN (kips) Concrete MN (kips)
1 EL-ST-1ST 106 (239) 113 (254) -007eth-16THORN EL-ST-2ND 106 (239) 113 (254) -007eth-16THORN EL-LT-1ST 105 (236) 105 (236) 000
EL-LT-2ND 105 (236) 105 (236) 000
2 LS-100SW-C00 105 (236) 105 (236) 000
LS-134SW-C00 140 (315) 140 (315) 000
LS-180SW-C12 186 (419) 186 (419) 000
LS-222SW-C18 230 (518) 230 (518) 000
Fig 7 Vertical deformation limit state analyses (a) ridge beam (DA) (b) edge beam (AB) and (c) shell along diagonal (DB)
Fig 8 Roof deformed shape limit state analysis model LS-134SWshyC00 20 times scale
Conclusions
Creep and shrinkage effects clearly contribute to the roof deformashytion However concrete cracking and second-order effects appear to contribute to a far higher degree to the roof deformation Limit state analyses show that extensive concrete cracking occurs in the roof subjected to self-weight only causing redistribution of forces and a three- to four-fold increase of vertical deformation
in comparison to purely elastic modeling In the 10Self Weight condition steel yielding and inelastic concrete deformation occurs in the edge beams near the supports and in the ridge beam at the center and at quarter points The ability to track the redisshytribution of stresses as concrete and steel elements fail is a signifishycant feature of the powerful limit state analysis
Limit state analysis shows that the original structure can sustain only 134 SW or 34 more weight than the nominal structural concrete weight This suggests that the structure had little or no spare capacity for any superimposed dead load unintended dead load or environmental loads such as wind and snow The failure mode was attributed to flexural failure of the ridge beam The tie beams are critical members for the structure and appear to be under designed perhaps because the design forces arose from the inapshyplicable thin membrane theory The concrete tie beams became ineffective once they became overburdened and what was meant to be prestressed concrete no longer experienced any compression
Introducing a roof camber of 12 or 18 in clearly increases the roof capacity and possibly may have prevented the catastrophic failure Ketchumrsquos thesis of introducing camber in the ridge beam to increase the overall strength appears warranted
Further and perhaps more reasonable design improvements would be to prestress the edge and ridge beams and to ensure that the tie beams remain in compression at any given time for any given load combination A parametric modeling tool can be used to detect the redistribution of forces in a concrete structure that experiences
cracking and imminent failure This tool was used to definitively study a well-documented roof failure and to provide new insights into the hypothesis that camber of the ridge beam would indeed have significantly increased the capacity of the roof
Acknowledgments
The authors are grateful to COWI AS Denmark for providing access to IBDAS and to PF Jakobsen for modeling assistance
References
American Concrete Institute (ACI) (2008) ldquoBuilding code requirements for structural concrete and commentaryrdquo ACI 318-08 Farmington Hills MI
Andersen G B Jakobsen P F and Soslashrensen K A (1994) ldquoIntegrated design and analysis of cable supported bridgesrdquo Proc 3rd Symp on Strait Crossings lsquo94 Taylor amp Francis Oxford UK 258ndash291
Billington D P (1990) Thin shell concrete structures McGraw-Hill
New York 275ndash283 Comite Euro-International Du Beton (1993) ldquoCEB-FIP model code 1990
Thomas Telford Londonrdquo Lausanne Switzerland ldquoDesign errors blamed for gym collapserdquo (1970) Engineering News Reshy
cord 20 Edwards N P and Billington D P (1998) ldquoFE analysis of tucker
high school roof using nonlinear geometry and creeprdquo J Struct Eng 124(9) 984ndash991
Gallegros-Cazares S and Schnobrich W C (1988) ldquoEffects of creep and shrinkage on the behavior of reinforced concrete gable roof hyperbolic-paraboloidsrdquo Rep SRS 543 Dept of Civil Engn Univ of Illinois Urbana IL
Ketchum M S (1990) ldquoCareer memories A significant failurerdquo Milo Ketchum archives Manuscripts by Milo Ketchum langhttpwww ketchumorg-milofailurehtmlrang (Feb 2 2009)
Simmonds S (1989) ldquoEffect of support movement on hyperbolic paraboshyloid shellsrdquo J Struct Eng 115(1) 19ndash31
ldquoStudents clear gym moments before roof failsrdquo (1970) Engineering News Record 11
ldquo15-year-old HP roof fails injuring 18rdquo (1970) Engineering News Record 12
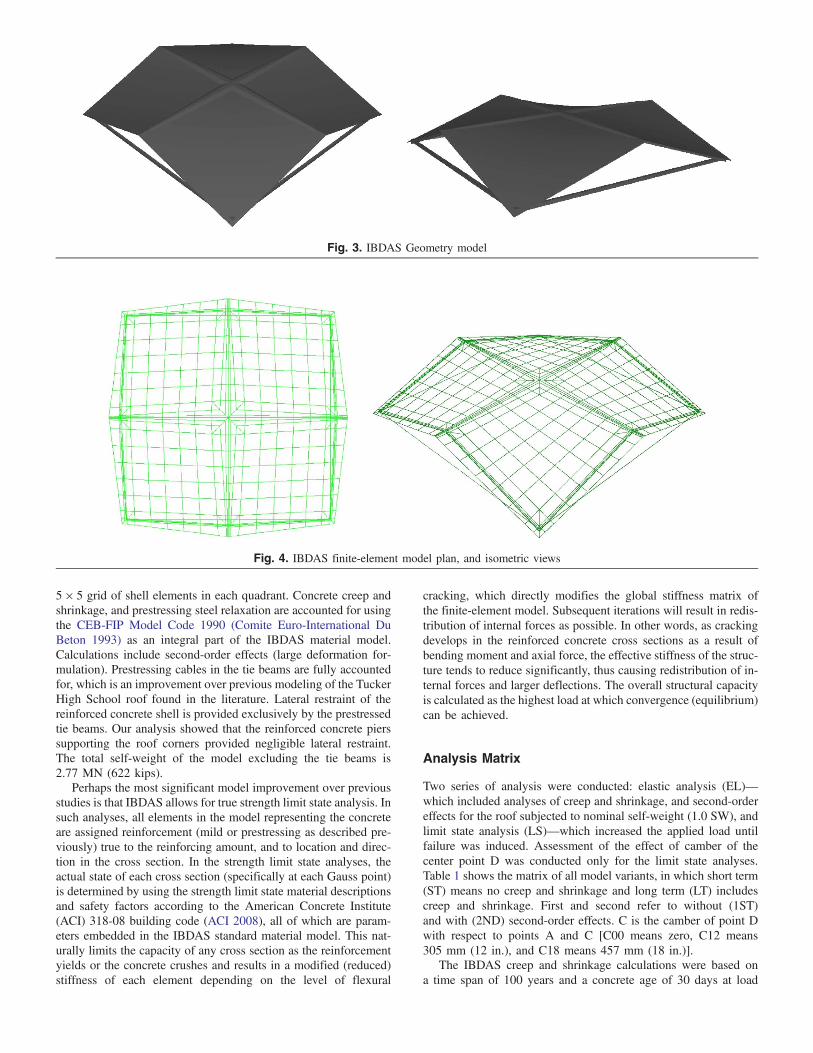
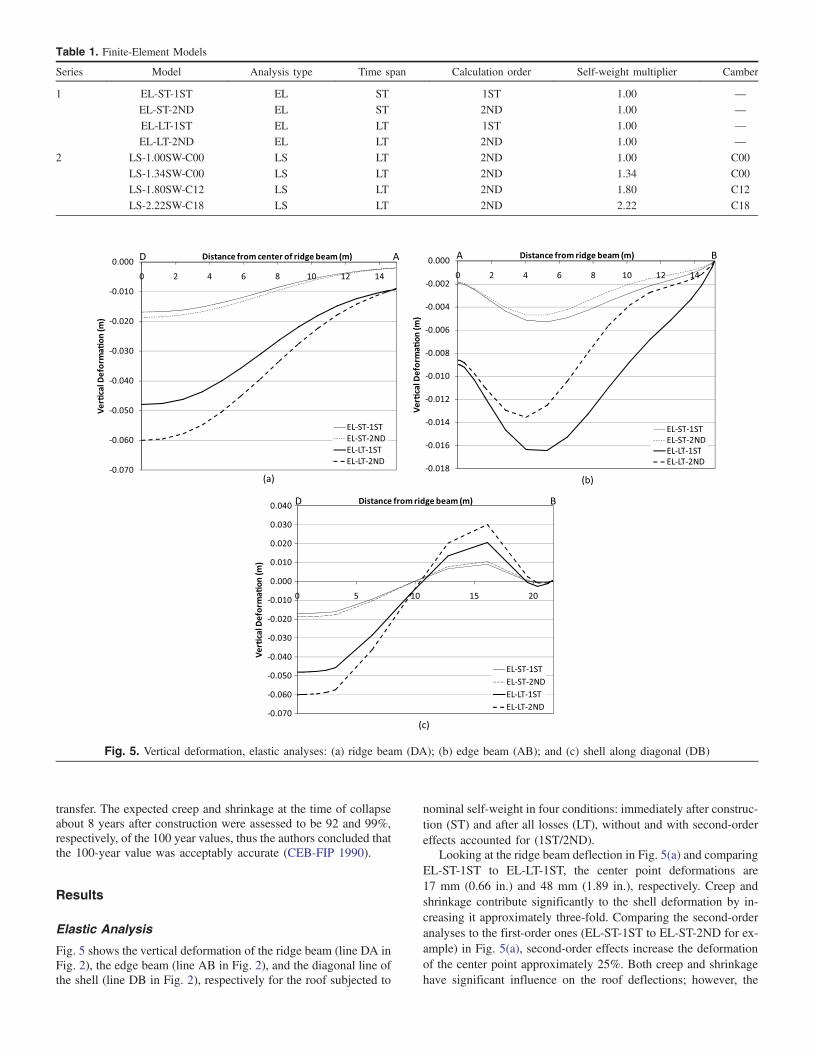
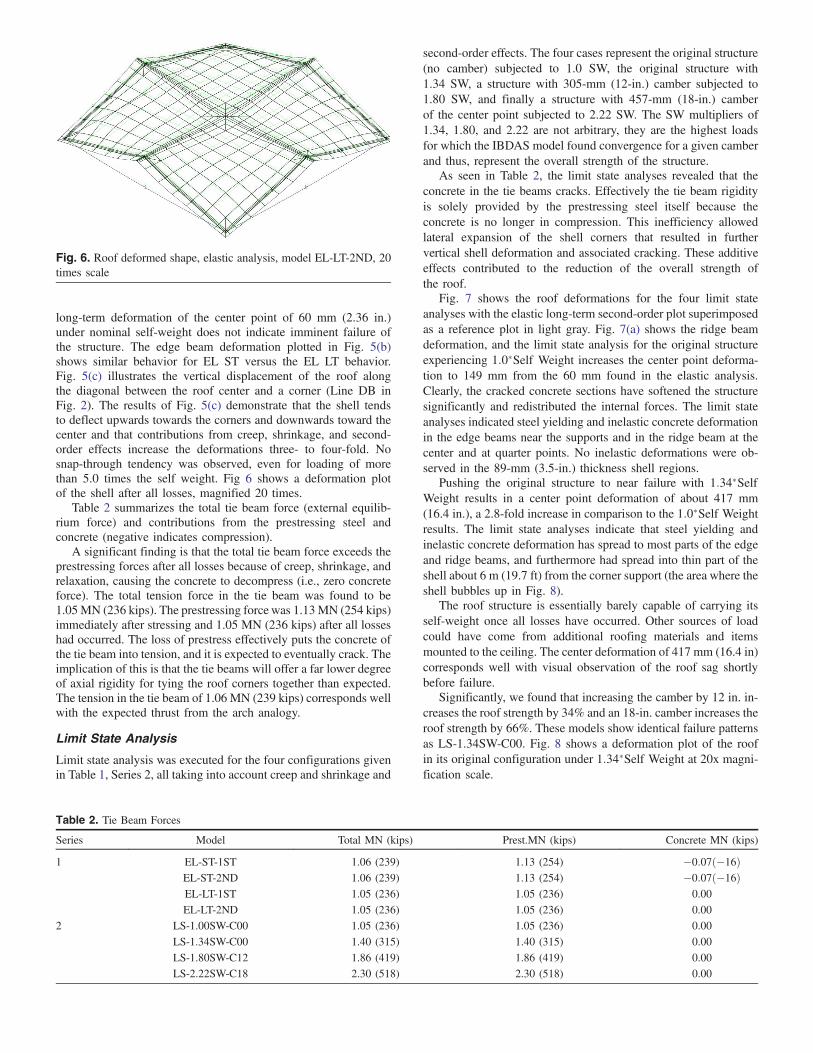
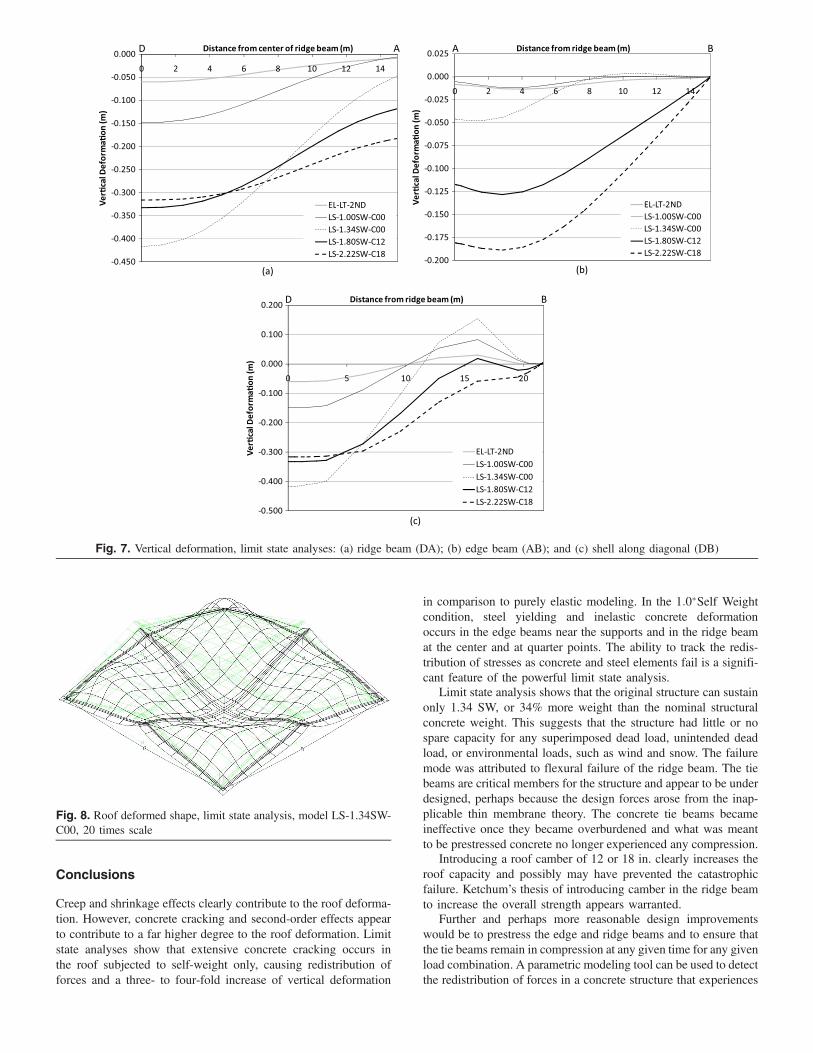