Embed Size (px)
Citation preview
1
FINITE ELEMENT MODELING OF T-STUB CONNECTIONS
REINFORCED WITH THREADED BARS
Sethi1 ABDELAZIZ 11 and Badis2 WARDA2
2
The objective of study relates to steel structures which are mostly using bolted end plate connections
as pinned or rigid connections joints between structural members. With these form of connections the
beam tension force is transferred, through the bolts, to the column. The prospective complexity is that
the column may be not strong to develop the required force for satisfying strength and stability checks.
A new mean of providing local column reinforcement, using a system of threaded bars, were analysed.
A finite element analysis of eight t-stub connection were undertaken in order to check the behaviour of
connections reinforced in that manner. A finite element code ABAQUS was used to develop the
various connections models. A finite element representing un-reinforced end plate connection was
validated against an experimental test data by comparing force-displacement curves of both finite
element model and test data. Adjustments were done on the finite element model to reflect test
experimental data curve. To the un-reinforced finite element model, different non welded stiffeners
such as backing plate, channel reinforcement to threaded bars etc. were added to improve connection
strength. Connection strength improvements in order of 231% were observed when the model threaded
bars compared to the un-reinforced model and 251% when using threaded bars with channels.
Introduction
Bolted connections are primarily used to connect a beam to a column or to splice two beams
together, they are also used to transfer the forces supported by a structural member to other parts of a
structure or to the supports. End plate connections are increasingly used as moment resistant
connections in steel structures because of their simple fabrication techniques and speedy site erections.
The end plate connections consist of a plate welded in the fabrication shop to the end of the beam, the
plate is predrilled and then bolted at the site in the column flange using rows of high strength bolts.
For this connection type, the tension zone is formed by the deformation of the column flange and end
plate under tension and elongation of bolts, this zone can be represented using a T-stub model.
Although simple in their use, bolted endplates are extremely complex in their analysis and behavior.
The most accurate method of analysis is of course, to fabricate full scale connections and test these to
destruction, which requires a wide range of experimental studies. Unfortunately this is time consuming
and expensive to undertake. On the other hand, conducting experiments is a compulsion for the
research to progress. The problem gets enormously simplified with the use of a general purpose finite
element analysis programs such ABAQUS and ANSYS……………..etc. ABAQUS has several
features which are readily applicable to the problem of connection characterization.
Statement of problem
The column flange thickness necessary to resist the force from the bolts frequently conducted to
a column section heavier than would be required to satisfy strength and stability checks. So as to
reduce the column section, the column flange is usually reinforced by a plate welded between
opposing column flanges at beam tension flange level. Conventional welded plate stiffening is difficult
1 Senior lecture, Civil engineering departement, Blida (ALGERIA), [email protected]
2 Post graduation researcher , Civil engineering departement, Blida (ALGERIA), [email protected]
2
to fabricate by automatic processes and is particularly expensive when used on site. A more recently
suggested form of reinforcement consists of backing plates in form of channel which have been
investigated by different researches. This paper present another mean of providing local column
reinforcement by using a system of threaded bars locked against inner flange faces of the column in
tension zones of bolted end plate moment connections. The t-stub to column connections was the focus of this research. The ABAQUS finite element program was used to model the connections. The
dimensions of the validation connection were the same as the dimensions of the model tested in the
laboratory by Sethi [11]. The finite element results were compared to the laboratory test results. A
series of nine tests were undertaken based on that test to investigate the use of threaded bars on overall
behaviour of a connection.
Finite element modeling
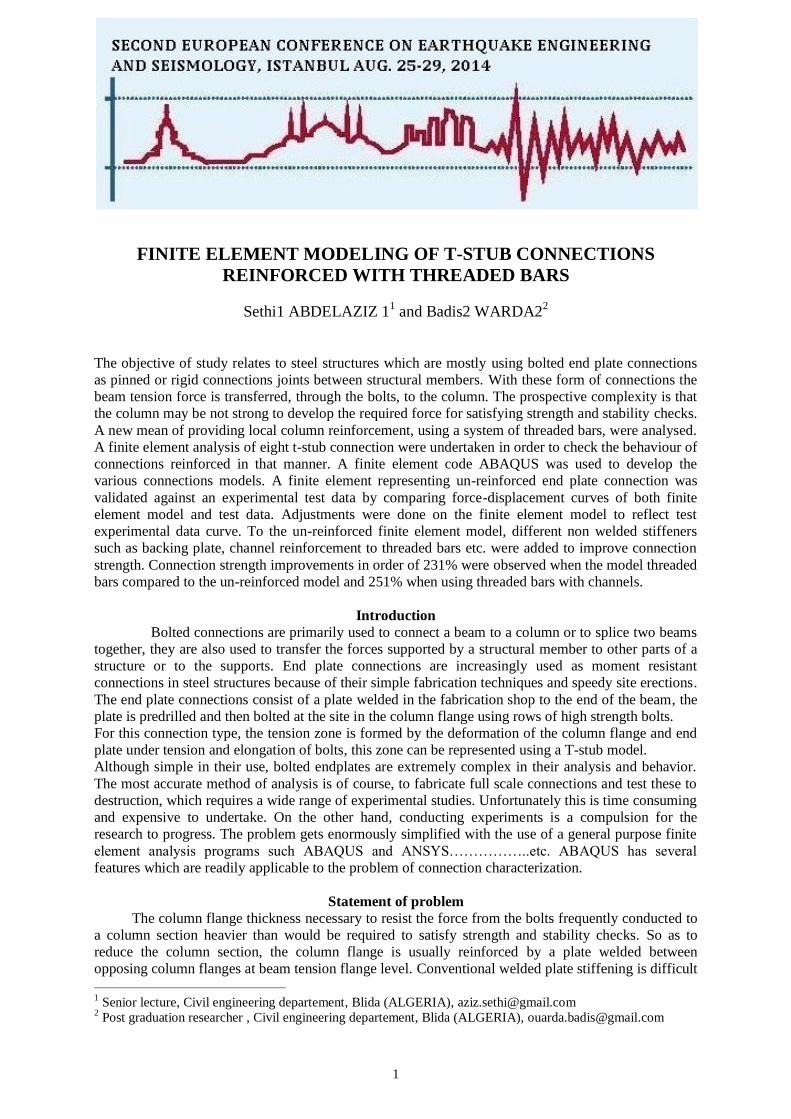
Structural idealization of the tension zone
To investigate the behavior of the tension zone of beam to column connection as shown in the
next figure, the column flange and the end plate can be considered to act as an equivalent t-stub with
an effective length.
Figure 1: representation for tension zone of end plate moment connections.
Type of element
All the parts were modeled using C3D8R witch refer to continuum three dimensional 8-noded
brick element with reduced order integration. This element has three degrees of freedom at each node.
The solid (or continuum) elements in Abaqus can be used for linear analysis and for complex
nonlinear analyses involving contact, plasticity, and large deformations. Reduced integration reduces
running time, especially in three dimensions.
Materiel properties
The material properties for the various components of the numerical tests are presented in table
1 and 2.
Table 1: Column and t-stub material proprieties.
column T-stub
flange web flange web
Yield stress Б (N/mm2) 319 326 260 240
Young‟s Modulus E (N/mm2) 205*103 205*103 205*103 205*103
Table 2: Stiffeners and bolts material properties.
Yield stress (N/mm2) Ultimate stress (N/mm2) Young’s modulus (N/mm2) Poisson ratio
S355 355 550 205*103 0.3
M20 640 800 205*103 0.3

3
Contact modelling and boundary condition
Small sliding surface-to-surface contact was considered for all the contacts in the connection
.Frictional contact using penalty stiffness formulation was considered for the tangential contact
between the end-plate to and the column flange whereas the tangential contact between the bolt hole
and the bolt shank is considered to be frictionless. The normal contact was considered as hard using
augmented Lagrange formulation. Tie constraint is used for the connection of bolt head/nut to the t-
stub/column. Master surfaces represent the surfaces of column and beam flanges, bolt head, bolt
shank, whereas the surfaces interacting master surfaces are defined as slave surfaces. Both the ends of
the column are fully restrained.
Steps of modelling
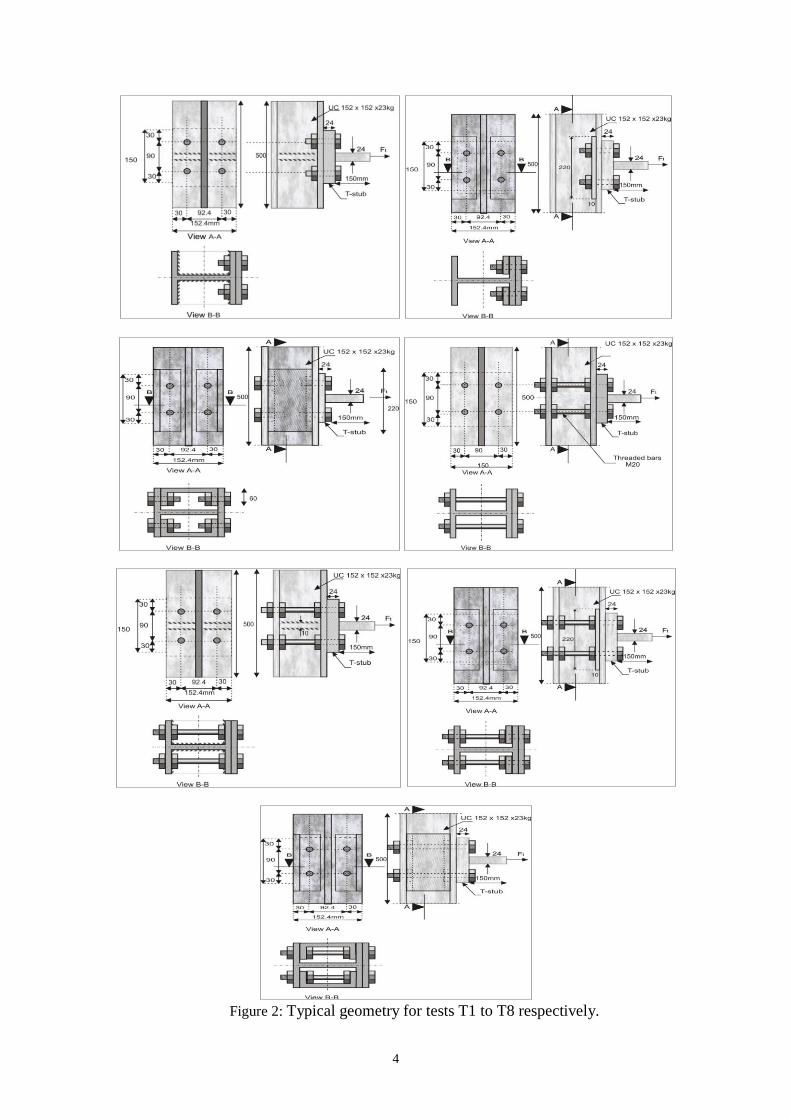
A series of nine t-stub end plate connections are undertaken. To achieve the objectives of this
work, the modeling of these tests were divided into two steps.
First series of tests
For this step three aims were to be met the first is to develop a finite element model identified
test V1, based on the specimen test of the experimental study presented by Sethi []; then to find a
force-displacement curve characteristics and mode of failure for the finite element model; lastly is to
validate the finite element model by comparing the results to the experiment test.
Second series of tests
These tests are a combination of a reference test T1 and different element of reinforcement
added as shown in table 3.
Table 3: Second series tests list.
Dimensions and geometry of the models
For all the tests, the size of the column used is UC 152×152×23 kg where its dimensions are
illustrated in next figures. The thickness of the t-stub is 24 mm. The flange of the t-stub is bolted to the
flange of the column by two rows of high strength bolts, two bolts by row. The size of the bolts is M20
grade 8.8.
Identification test Test identification Stiffening element
T1 Without
T2 Welded plates
T3 Backing plates
T4 Channels
T5 Threaded bars
T6 Threaded bars + Welded plate
T7 Threaded bars + Backing plate
T8 Threaded bars + Channels
4
Figure 2: Typical geometry for tests T1 to T8 respectively.

5
Results discussion and comparisons
Comparison between the experimental test and ABAQUS (First series of tests)
Figure 3 shows non-linear response curve obtained from the laboratory compared with the load-
displacement curve obtained from ABAQUS. It is apparent that the performance of the FE model was
found to be in close agreement with the experimental test. The trends of both the curves are similar
although there was some difference in the initial elastic stage; the experimental test has lower
displacement than the finite element model at the same load, which signifies that FE model is less
stiffer than the experimental test. This may be the results of an inexactitude of the input materials
properties and boundary conditions for the model.
Figure 3: Load-Displacement curve for the test V1 and the test of Sethi [11].
Comparisons on the second series tests
The deformed shapes of the finite element models and the relationship load versus displacement
for the models T1 to T8 are presented in the next figures.
Figure 4: Load-Displacement plot for the numerical test T1.
Figure 5 : Deformed shape for the numerical test T1.

6
Figure 6: Load-Displacement plot for the numerical test T2.
Figure 7 : Deformed shape for the numerical test T2.
Figure 8: Load-Displacement plot for the numerical test T3.
Figure 9 : Deformed shape for the numerical test T3.

7
Figure 10: Load-Displacement plot for the numerical test T4.
Figure 11 : Deformed shape for the numerical test T4.
Figure 12: Load-Displacement plot for the numerical test T5.
Figure 13 : Deformed shape for the numerical test T5.

8
Figure 14: Load-Displacement plot for the numerical test T6.
Figure 15 : Deformed shape for the numerical test T6.
Figure 16: Load-Displacement plot for the numerical test T7.
Figure 17 : Deformed shape for the numerical test T7.

9
Figure 18: Load-Displacement plot for the numerical test T8.
Figure 19 : Deformed shape for the numerical test T8.
From the graphs illustrated earlier, it can be observed that all the tests respond in the same way
with increasing loads and have two dissimilar regions. At the beginning the curves are linear and while
the load attain to a certain point become non-linear which give an idea that initially the connections
behave elastically and when they achieve a resistance load the connection gradually lost stiffness and
act as plastic.
The resistance load, called also the yield load, is the minimal value of the applied traction force on
which the plastic hinges start to produce ; its value can be obtained by the intersection of the tangent
lines traced on both linear and non-linear ranges as shown in the previous figures. The results obtained
are summarized in the next table.
Table 4: The connections resistance load.
Identification Test Yield load (Kn) Reinforcement element
Test T1 135 Without
Test T2 290 Welded plates
Test T3 260 Backing plates
Test T4 340 Channels
Test T5 320 Threaded bars
Test T6 335 Threaded bars + welded plates
Test T7 335 Threaded bars + backing plates
Test T8 340 Threaded bars + Channels

10
Comparison on the reinforced tests against the un-reinforced test
The numerical results comparaisons can be exposed in the figure 20. Of the results
examination, it seems to be reasonable to say that in term of the overall behavior , the load
displacement curves were affected by the employing of the stiffners . By increasing in the load the
deformation capacity reduces for all stiffened connections. The initial stiffness increase.A remarkable
improvement in the strength is necessary to cite and it is practically the same for the tests T4,
T6,T7,T8.

11
Figure 20: Comparison on the reinforced tests against the un-reinforced test.
Comparaison on the threaded bars stiffened tests
Numerical tests T2,T5,T6
Figure 21: Load-displacement comparison for the numerical tests T2,T5,T6.
It is apparent from the figure that the using of the threaded bars and the welded plate together
yields to more stiffer and strengthened connection. The improvement of the strength is 17.24 %
compared to the test T2 and 6.25% compared to the test T5. The behavoir of the the test T2 and T5 is
identical in term of stiffness, the difference arises in the strength . A negligeble difference in the
deformation capacity is also observed for the three tests.
Numerical tests T3,T5,T7
Figure 22: Load-displacement comparison for the numerical tests T3,T5,T7.

12
The tests clearly yield differente responses. The comparison between the load-displacement
curves of the connections shows that test T7 is stiffer than the test T5, which is by itself more stiffer
than the test T3. Although the maximum applied load for the test T3 is 320 kN , but it is shown from
the trend of the curve that the deformation capacity of the connections was reduced significantly from
the test T3 to T7.It shoud be also noted that the resistance load of the test T7 is higher than both the
other tests.
Numerical tests T4,T5,T8
Figure 23: Load-displacement comparison for the numerical tests T2,T5,T6.
The numerical results plotted by the test T4 and those plotted by the test T8 are extremely
coincident and they are similar in term of stiffness, strength and deformation capacity. Although the
test T5 is less stiffer than both the tests T4 and T8 but it is still has the higher deformation capacity.
The percentage of difference for the strength of the test T5 against the tests T4 and T8 is in order of
6.25%.
Conclusion
A series of nine t-stubs to column connections are studied in order to analyse the behavior of
threaded bars in tension zone.
A t-stub to column connection experimentally tested by Sethi [] was undertaken .The
experimental behaviour was compared with built up finite element model.
A finite element connection model was successfully constructed using the C3D8R element type
The load-displacement curve plotted from ABAQUS analysis results had shown a similar trend
as that of the experimental load-displacement curve.
The different element of reinforcement added for the second series of tests were improved the
strength and the stiffness of the connections but decrease the deformation capacity.
Resistance improvement was shown if using the threaded bars and the welded plate together and
it was more important than using the welded plate alone. The same remark was noted for the use of the
threaded bars and the backing plate together.
For the test T8, it wasn‟t useful to apply the threaded bars and the channels together because
using these two reinforcement element didn‟t bring any improvement in term of overall behavior of
the connection.
Finite element analysis can be used as analysis tool to predict the nonlinear behaviour of t-stub
to column connections, it can also provide advantages in terms of time and expense over full scale
tests.
References
[1] ABAQUS 6.9, “Getting Started with Abaqus”.
[2] ABAQUS 6.9,” Analysis user manual”.
[3] Aliane Yasmina,” Non welded reinforcement in end plate beam to column connection ‟‟,
Magistere thesis, University of Saad Dehlab of Blida,2003

13
[4] Ana M. Girão Coelho; Luís Simões da Silva; and Frans S. K. Bijlaard “Finite-element modeling
of the nonlinear behavior of bolted T-Stub connections”, Journal of structural engineering ©
ASCE. June 2006.
[5] Chemin Lim. “Low cycle fatigue life prediction of four bolt extended unstiffened end plate
moment connections” Ph.D. Dissertation, North Carolina State University, 2009.
[6] D.B. Moore and P.A.C. Sims, “„Preliminary Investigations into the Behaviour of Extended End-
Plate Steel Connections with Backing Plates”, Journal of Constructional Steel Research
7(1987)297-310,1987.
[7] H B Kaushik and Dr D C Rai “An Insight into the flexibility of light beam-to-column
connections”, February 2006.
[8] Jeon Kim, Joo-Cheol Yoon, Beom Soo Kang,”Finite element analysis and modeling of structure
with bolted joints”,Applied mathematical modeling 31 (2007) 895 911,2007.
[9] K.S. Al-Jabri a ,A.Seibi b ,A.Karrechc,” Modelling of unstiffened flush end-plate bolted
connections in fire “,Journal of Constructional Steel Research 62 (2006) 151–159,2006.
[10] P.Prabha, S.Seetharaman, S.Arul Jayachandran and V. Marimuthu,” Mimicking expensive
experiments by Abaqus”, Scientists, Structural Engineering Research Centre, CSIR campus,
Taramani, Chennai - 600 113.
[11] Packer,J.A. and Morris,L.J.,”A Limit state design method for the tension region of bolted beam
column connections”, The Structural Engineer Vol 55, Oct.1977.
[12] Sethi A. “Non-welded reinforcement in bolted steel beam/column connections”. Doctoral
dissertation, University of Leeds, 1989.
[13] Sumner, E. A “Unified design of extended end-plate moment connections subject to cyclic
Loading", Ph.D. Dissertation, Virginia Polytechnic Institute and State University, Blacksburg,
June 2003.
[14] Tagawa and Gurel,” Strength evaluation of bolted moment connections stiffening with channels”
[15] Tapan Sabuwala. “Finite element analysis of steel beam to column connections subjected to
blast loads”, The Pennsylvania State University, August 2001.
[16] T. F. Nip and J. O. Surtees , “threaded bar compression stiffening for moment connections”,
School of Civil Engineering, University of Leeds, Leeds LS2 9JT, UK. 2001
[17] T. F. Nip and J. O. Surtees ,”Use of threaded rod compression stiffening in end plate
connections”, the structural engineer Vol 79/N0, 11 June 2011.
[18] W. Grogan , J.O. ,” Experimental behaviour of end plate connections reinforced with bolted
backing angles Surtees”, Journal of Constructional Steel Research 50 (1999) 71–96,1999.
[19] Wong Jyie Yiee. “Finite Element Analysis of Flush End Plate beam to column bolted steel
Connection on Minor axis using Lusas software” , University of Malysia, 2007.
[20] Ying Hu, Buick Davison, Ian Burgess and Roger Plank,” Multi-Scale Modelling of Flexible End
Plate Connections under Fire ” , The Open Construction and Building Technology Journal, 4,
88-104,2010.
[21] Zoetemeijer,P,”A design method for the tension side of statically loaded bolted beam to column
connections”, Heron Vol 20(1),1974.
[22] Z. Al-Khataba, A. Bouchair , “Analysis of a bolted T-stub strengthened by backing-plates with
regard to Eurocode 3”, Journal of Constructional Steel Research 63 (2007) 1603–1615,2007.
[23] Ying Hu, Buick Davison, Ian Burgess and Roger Plank,” Multi-Scale Modelling of Flexible End
Plate Connections under Fire ” , The Open Construction and Building Technology Journal, 4,
88-104,2010.


![Malware-Techniken und Malware-Analyse [MM-108] · Header Entpacker-Stub Header Entpacker-Stub Entpacker-Stub UPX0 UPX1 .rsrc UPX0 UPX1 .rsrc Header .text .data .rsrc Zertifikatsprogramm](https://img.pdfslide.net/doc/110x75/5bdd6f6a09d3f2f6568cd013/malware-techniken-und-malware-analyse-mm-108-header-entpacker-stub-header.jpg)