Embed Size (px)
Citation preview
Fire detection & fire alarm systems in heavy duty vehicles
WP5 – Fire detection in bus and coach toilet compartments and driver sleeping compartments
Ola Willstrand, Jonas Brandt, Robert Svensson
This project was funded by FFI
Fire Research
SP Report 2014:28
SP
Technic
al R
ese
arc
h I
nstitu
te o
f S
weden
Fire detection & fire alarm systems in heavy duty vehicles WP5 – Fire detection in bus and coach toilet compartments and driver sleeping compartments
Ola Willstrand, Jonas Brandt, Robert Svensson
3
Abstract
The work presented in this report is part of a larger project about fire detection and fire
alarm systems in heavy duty vehicles. The work presented here covers fire detection in
bus and coach toilet compartments and driver sleeping compartments. The purpose is to
provide recommendations on how to install fire detection systems in these spaces. The
recommendations also cover what type of detection system is most suited for the
compartments analyzed. As a basis for the recommendations, full scale fire tests were
performed with different detection systems. The fire tests were conducted in realistic
mockups of a toilet compartment and a sleeping compartment. Detection systems were
analyzed at different positions for different fire scenarios to provide information on how
to best install detection systems in these compartments. As a part of the work some tests
were also simulated with FDS (Fire Dynamic Simulator) to verify whether computer
simulations can be used for detector placement guidance.
Key words: fire detection, buses, toilet compartments, sleeping compartments, full-scale
tests, FDS
SP Sveriges Tekniska Forskningsinstitut
SP Technical Research Institute of Sweden
SP Report 2014:28
ISBN 978-91-87461-75-0
ISSN 0284-5172
Borås 2014
4
Contents
Abstract 3
Contents 4
Preface 5
Summary 6
1 Introduction 7
2 Detection systems 7 2.1 Linear heat detector 8 2.2 Point smoke detector 8 2.3 Point smoke/heat detector 8 2.4 Aspirating box smoke/heat detector 9 2.5 Aspirating smoke detector 9
3 Testing 10 3.1 Mockups 10 3.1.1 Shape and dimensions 10 3.1.2 Ventilation 13 3.2 Full scale test results 17 3.2.1 Toilet compartment tests 19 3.2.2 Sleeping compartment tests 22 3.3 Simulation results 24
4 Conclusions and recommendations 25
References 27
Appendix A: Experimental results 28
Appendix B: Simulation results 37

5
Preface
This work was financed by the FFI program of the Swedish Governmental Agency for
Innovation Systems, VINNOVA. Fire detection systems were provided by Dafo Brand
AB and Consilium Marine & Safety AB. All support is gratefully acknowledged.
6
Summary
This report summarizes the results from the fifth work package (WP5) of the project “Fire
detection & fire alarm systems in heavy duty vehicles – research and development of
international standard and guidelines”. The purpose of WP5 is to provide
recommendations on what type of fire detection system should be used and how these
systems should be installed in bus1 toilet compartments and driver sleeping
compartments. In July 2014 a new UNECE requirement comes into effect which states
that excess temperature or smoke shall be detected in these compartments. Therefore, this
work provides timely information on the installation of fire detection systems in toilet
compartments and driver sleeping compartments.
The recommendations are mainly based on full scale fire tests performed in mockups of a
bus toilet compartment and driver sleeping compartment. A total of 26 different buses
from a variety of suppliers were investigated to obtain input for the construction of
realistic mockups. Five different fire detection systems were tested: a linear heat detector,
a point smoke detector, a point smoke/heat detector, an aspirating smoke/heat detector,
and an aspirating smoke detector. These detectors were placed at several different
positions in the mockups to evaluate how such detectors are best installed. The detectors
were exposed to different fire scenarios and different fire sources were used such as:
paper hand towels in the trash can, plastics and rubber representing fire in electrical
components and cables, and a mattress in the sleeping compartment. In total 18 different
full scale fire tests were performed.
The results show that smoke detectors are much faster than heat detectors. However, in
narrow spaces and when the detector is close to a potential fire source heat detectors will
also react relatively quickly. The benefits of using heat detectors instead of smoke
detectors can be that they are usually cheaper, more robust, and require less maintenance.
The most interesting finding in this work was the large impact of the ventilation fan
inside bus toilet compartments. In several fire scenarios the impact of the fan was so great
that a fire detector in the ceiling of the toilet compartment would not give a fire alarm in
the early stage of a fire. This report suggests that fire detectors be installed both in the
ceiling and in the concealed space of the fan in toilet compartments.
If smoke detectors are used in many spaces, either in different compartments or in
different spaces inside e.g. the toilet compartment, the use of an aspirating system should
be considered instead of point smoke detectors. An aspirating system samples air from
several positions to one detector. These systems also have the advantage that the detector
is hidden and protected.
For the sleeping compartment, the mattress fire source was analyzed regarding toxic
elements in the fumes. The results show that the time of evacuation from the activation of
the fire alarm until the conditions tested are immediately dangerous to life and health
inside the compartment is approximately 30-60 seconds. However, the response times of
the detectors, depending on position and type, vary significantly.
Some of the full scale fire tests were also simulated in FDS (Fire Dynamic Simulator).
The results show that computer simulations may be used for detector placement guidance
in these kinds of compartments. For complex geometries this tool may be effective for
evaluation of where to position the detectors.
1 In this report “buses” implies both buses and coaches.
7
1 Introduction
In June 2013 a project entitled “Fire detection & fire alarm systems in heavy duty
vehicles – research and development of international standard and guidelines” was
launched. The project is financed by the Swedish FFI-program (Strategic Vehicle
Research and Innovation) which is a partnership between the Swedish Governmental
Agency for Innovation Systems, VINNOVA, and the automotive industry. The aim of the
project is to develop an international test method for fire detection systems in the engine
compartment of buses1 and other heavy duty vehicles. All work packages of the project
are listed below:
WP1: Survey of fire detection in vehicles
WP2: Factors influencing detector performance in vehicles
WP3: Fire causes and risk analysis for heavy duty vehicles
WP4: Fire detection systems for engine compartments
WP5: Fire detection in bus and coach toilet compartments and driver sleeping
compartments
WP6: Development of international standard
WP1-WP4 are mainly focused on producing background material for the overall goal of
defining an international test standard for fire detection in engine compartments, WP6.
The fifth work package (WP5), documented in this report, stands alone and covers fire
detection in toilet compartments and driver sleeping compartments of buses. This is
highly relevant since in July 2014 a new UNECE requirement regarding fire detection in
such spaces comes into effect [1].
The purpose of WP5 is to provide recommendations when developing and installing
detection systems in these compartments. The new UNECE requirement states that excess
temperature or smoke shall be detected, therefore only heat and smoke detectors will be
considered in this report. Compared to other types of detectors, e.g. flame detectors, video
detectors, or gas detectors, heat and smoke detectors should also be the most suitable for
the areas in question, both regarding application and price. In this work package only
photoelectric smoke detectors are tested and no ionization smoke detector. This is due to
the fact that the photoelectric detectors are more common among the vehicle fire alarm
and suppression system suppliers. The photoelectric smoke detectors have become the
preferred choice because of cost reductions in components and better technology in
combination with incurred regulatory cost for manufacturing, transport and disposal of
ionization smoke detectors [2]. In addition, the aim of the tests conducted was not to
compare the response time of different photoelectric or ionization smoke detectors, but
rather to compare different detector placements and to compare point smoke detectors to
aspirating systems and heat detectors.
The report consists of three parts: a description of the different detection systems used in
the tests, a description of the test setups and test results, and finally some conclusions and
recommendations regarding type of detection method and how the systems should be
installed.
2 Detection systems
In the full scale tests five different fire detection systems, provided from two suppliers,
were used at several locations. The results of these tests serve as a basis for the
1 In this report “buses” implies both buses and coaches.
8
conclusions and recommendations in chapter 4. The five detection systems are briefly
presented below.
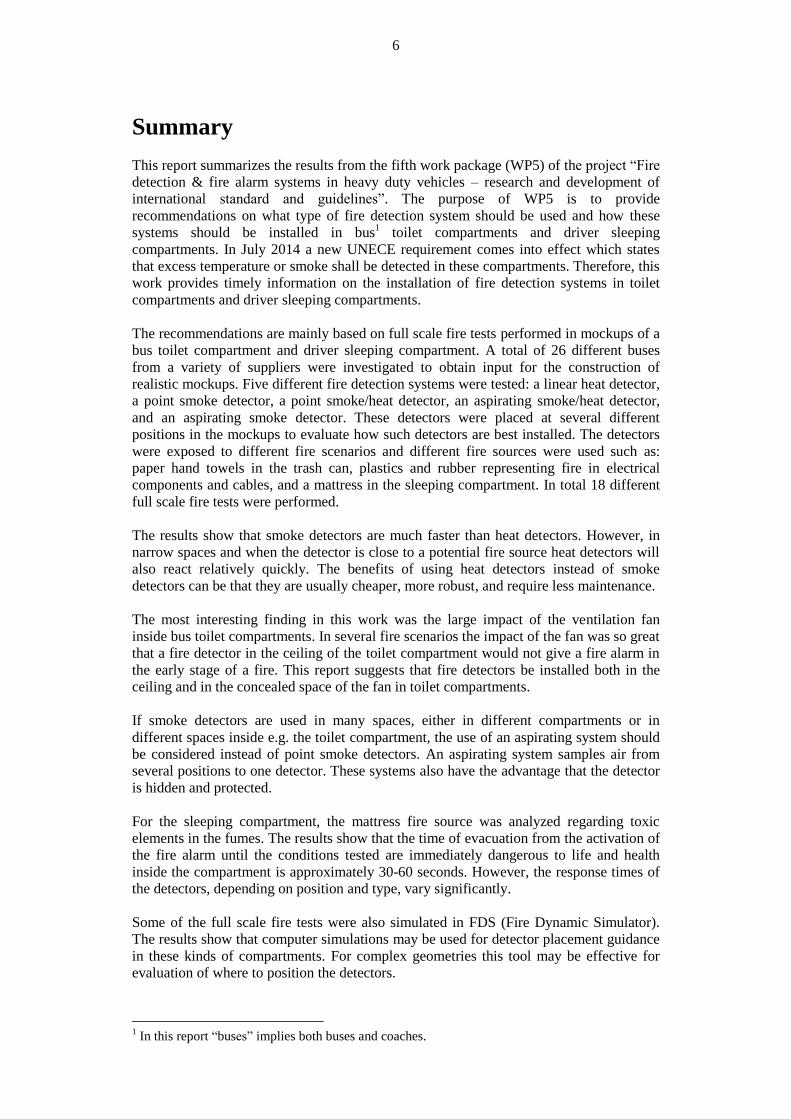
2.1 Linear heat detector
The linear heat detector used is a fixed temperature sensor, which means that an alarm
signal is initiated when a fixed activation temperature is reached. The sensor cable
consists of two steel conductors, each insulated with a heat sensitive polymer, see Figure
1. The insulated conductors are covered by an outer jacket as can be seen in the picture.
At the activation temperature the heat sensitive polymer will melt and the conductors will
short circuit, initiating an alarm.
The sensor cable used in the tests is typically used for engine compartments or similar
areas, which means that the activation temperature was 180 °C for this cable. In a toilet
compartment or sleeping compartment a much lower activation temperature can be used,
but this detector was included for comparisons with point heat detectors and smoke
detectors.
Figure 1. Linear heat detector, stripped to see the inner steel conductors.
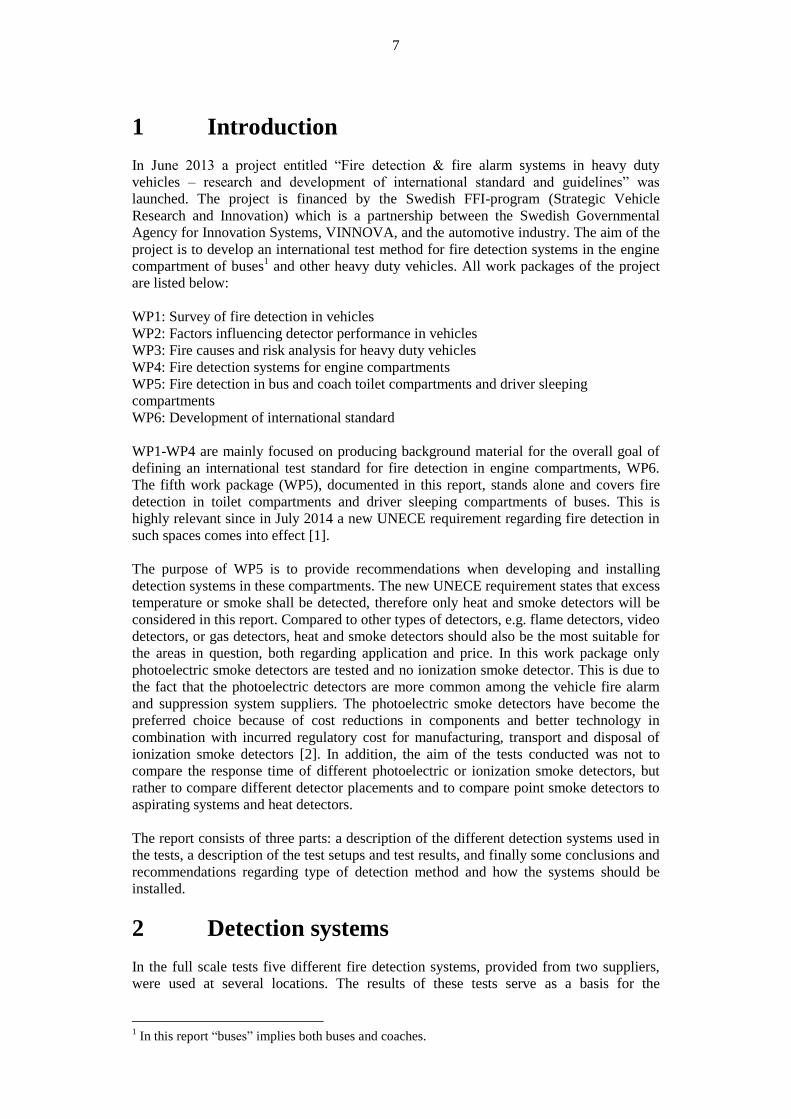
2.2 Point smoke detector
The optical point smoke detector applied in these tests, Figure 2, operates on the light
scatter principle, which means that light is scattered from the smoke particles and
detected by a photo-diode. The wavelength of the light is in the infrared region and the
photo-diode detects back-scattered light as well as forward-scattered light due to a wide
field of view of the photo-diode. According to the manufacturer this should improve the
sensitivity to black smoke. The sensing chamber is designed to keep out dust and other
contaminants with larger particles than fire smoke particles.
The detector has a microprocessor which uses company confidential algorithms to
process the information from the sensor chamber. This methodology has been developed
to decrease the rate of false alarms, while maintaining rapid detection of real fires. One
way to prevent false alarms is the use of drift compensation, i.e. the ability of the detector
to compensate for changes in the sensing chamber environment, caused e.g. by dirt. At a
certain point the drift may be too great and the detector is unable to compensate anymore
at which point it will give a warning signal at startup. Therefore, the detector should be
switched off and on to see whether the drift compensation is functioning at regular
intervals.
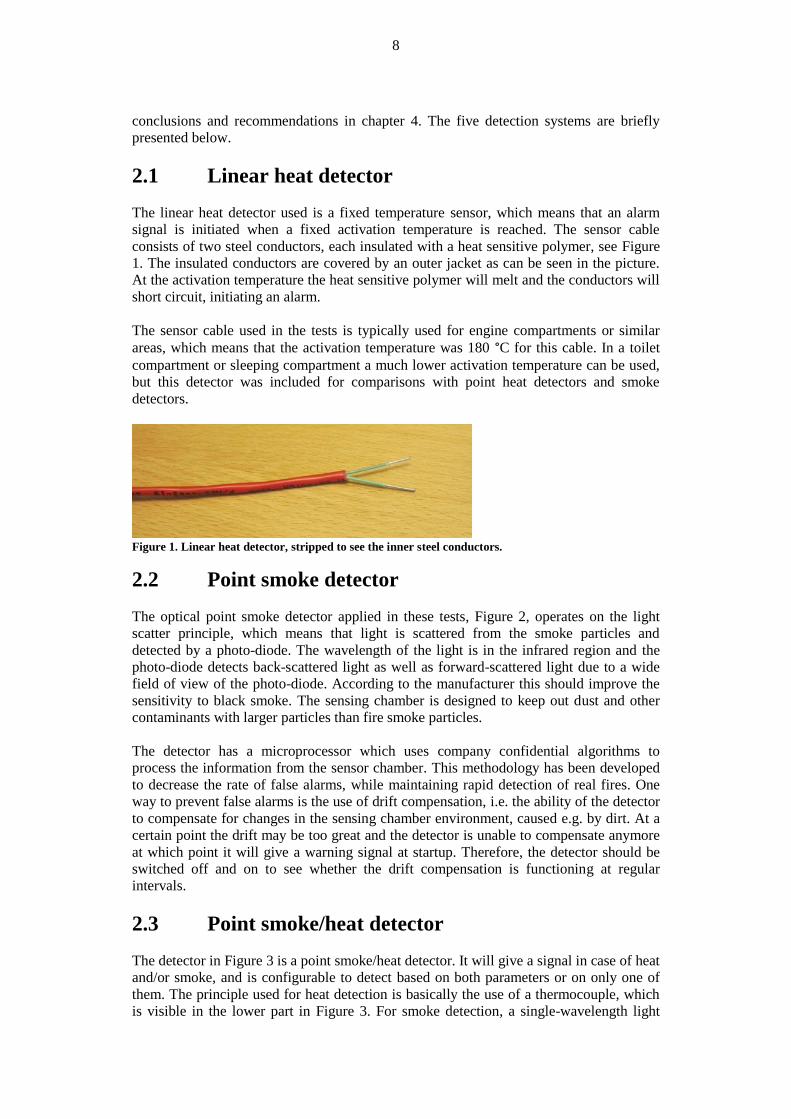
2.3 Point smoke/heat detector
The detector in Figure 3 is a point smoke/heat detector. It will give a signal in case of heat
and/or smoke, and is configurable to detect based on both parameters or on only one of
them. The principle used for heat detection is basically the use of a thermocouple, which
is visible in the lower part in Figure 3. For smoke detection, a single-wavelength light
9
scatter principle is used similar to that described for the smoke detector in the above
section.
The detector uses algorithms to distinguish between false alarms and real fires, and has
the ability for automatic pollution compensation such that the difference between
background level and alarm level is constant. Lastly this detector has a 360° LED
indication for quick localization of the alarm unit.
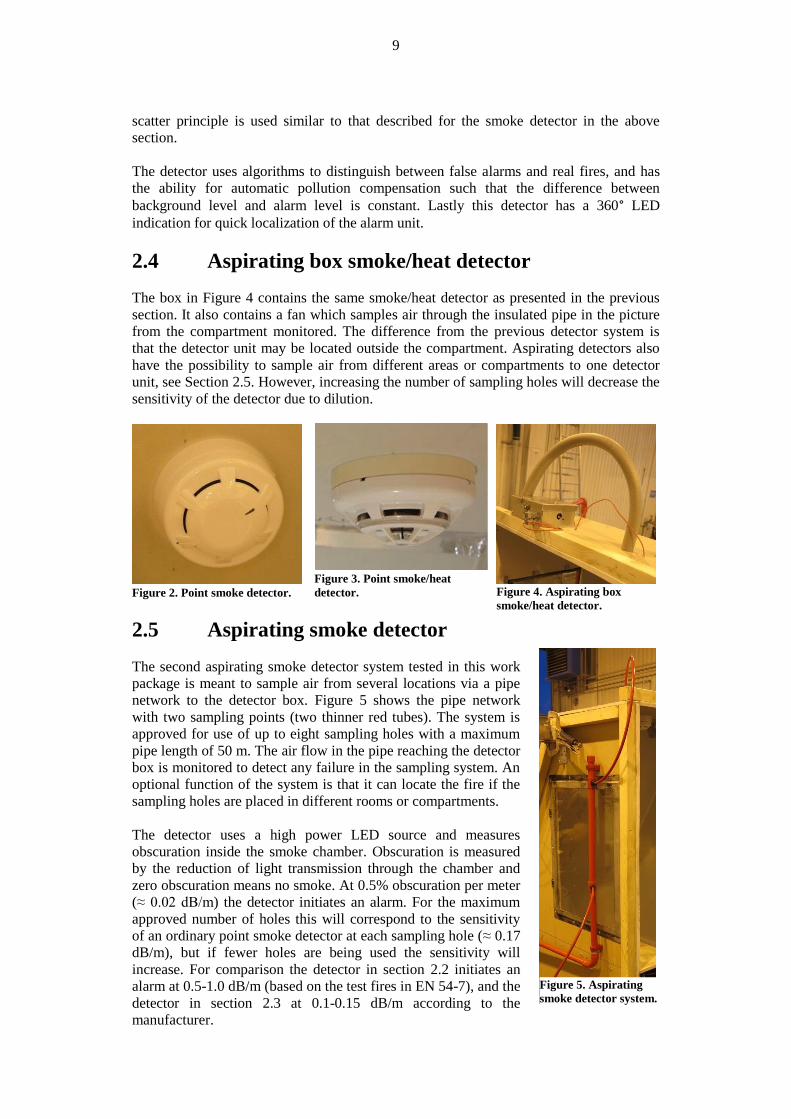
2.4 Aspirating box smoke/heat detector
The box in Figure 4 contains the same smoke/heat detector as presented in the previous
section. It also contains a fan which samples air through the insulated pipe in the picture
from the compartment monitored. The difference from the previous detector system is
that the detector unit may be located outside the compartment. Aspirating detectors also
have the possibility to sample air from different areas or compartments to one detector
unit, see Section 2.5. However, increasing the number of sampling holes will decrease the
sensitivity of the detector due to dilution.
Figure 2. Point smoke detector.
Figure 3. Point smoke/heat
detector.
Figure 4. Aspirating box
smoke/heat detector.
2.5 Aspirating smoke detector
The second aspirating smoke detector system tested in this work
package is meant to sample air from several locations via a pipe
network to the detector box. Figure 5 shows the pipe network
with two sampling points (two thinner red tubes). The system is
approved for use of up to eight sampling holes with a maximum
pipe length of 50 m. The air flow in the pipe reaching the detector
box is monitored to detect any failure in the sampling system. An
optional function of the system is that it can locate the fire if the
sampling holes are placed in different rooms or compartments.
The detector uses a high power LED source and measures
obscuration inside the smoke chamber. Obscuration is measured
by the reduction of light transmission through the chamber and
zero obscuration means no smoke. At 0.5% obscuration per meter
(≈ 0.02 dB/m) the detector initiates an alarm. For the maximum
approved number of holes this will correspond to the sensitivity
of an ordinary point smoke detector at each sampling hole (≈ 0.17
dB/m), but if fewer holes are being used the sensitivity will
increase. For comparison the detector in section 2.2 initiates an
alarm at 0.5-1.0 dB/m (based on the test fires in EN 54-7), and the
detector in section 2.3 at 0.1-0.15 dB/m according to the
manufacturer.
Figure 5. Aspirating
smoke detector system.
10
3 Testing
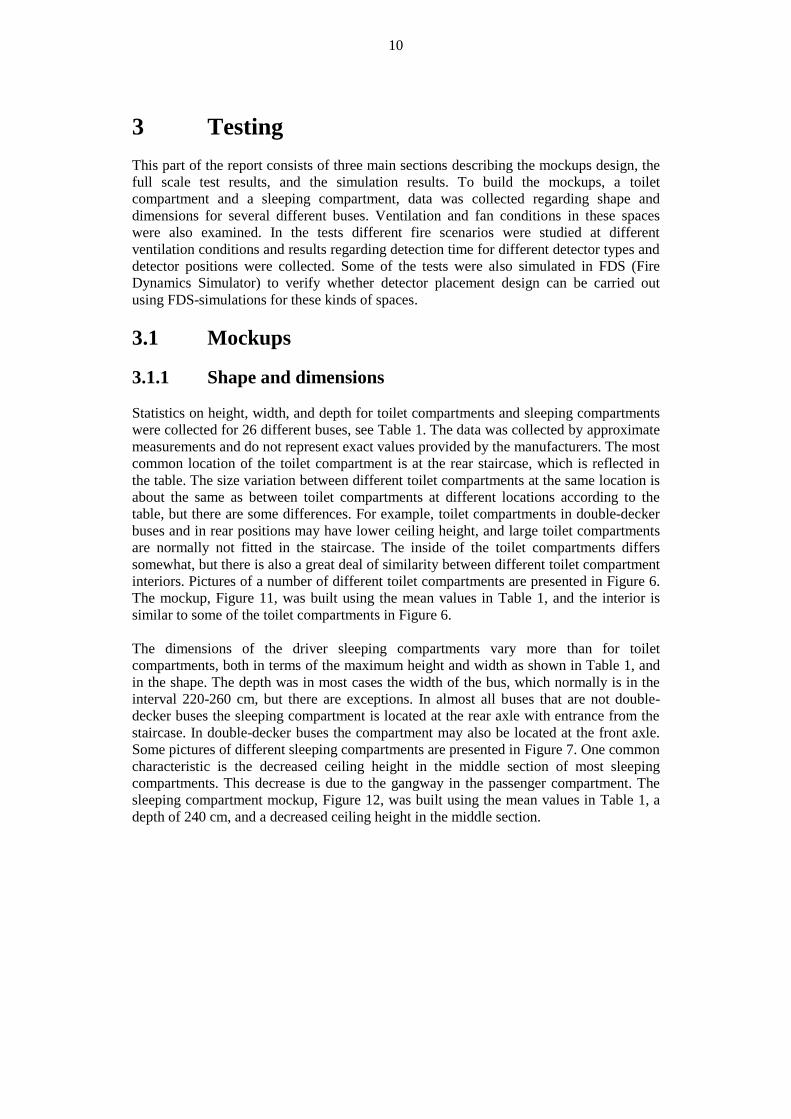
This part of the report consists of three main sections describing the mockups design, the
full scale test results, and the simulation results. To build the mockups, a toilet
compartment and a sleeping compartment, data was collected regarding shape and
dimensions for several different buses. Ventilation and fan conditions in these spaces
were also examined. In the tests different fire scenarios were studied at different
ventilation conditions and results regarding detection time for different detector types and
detector positions were collected. Some of the tests were also simulated in FDS (Fire
Dynamics Simulator) to verify whether detector placement design can be carried out
using FDS-simulations for these kinds of spaces.
3.1 Mockups
3.1.1 Shape and dimensions
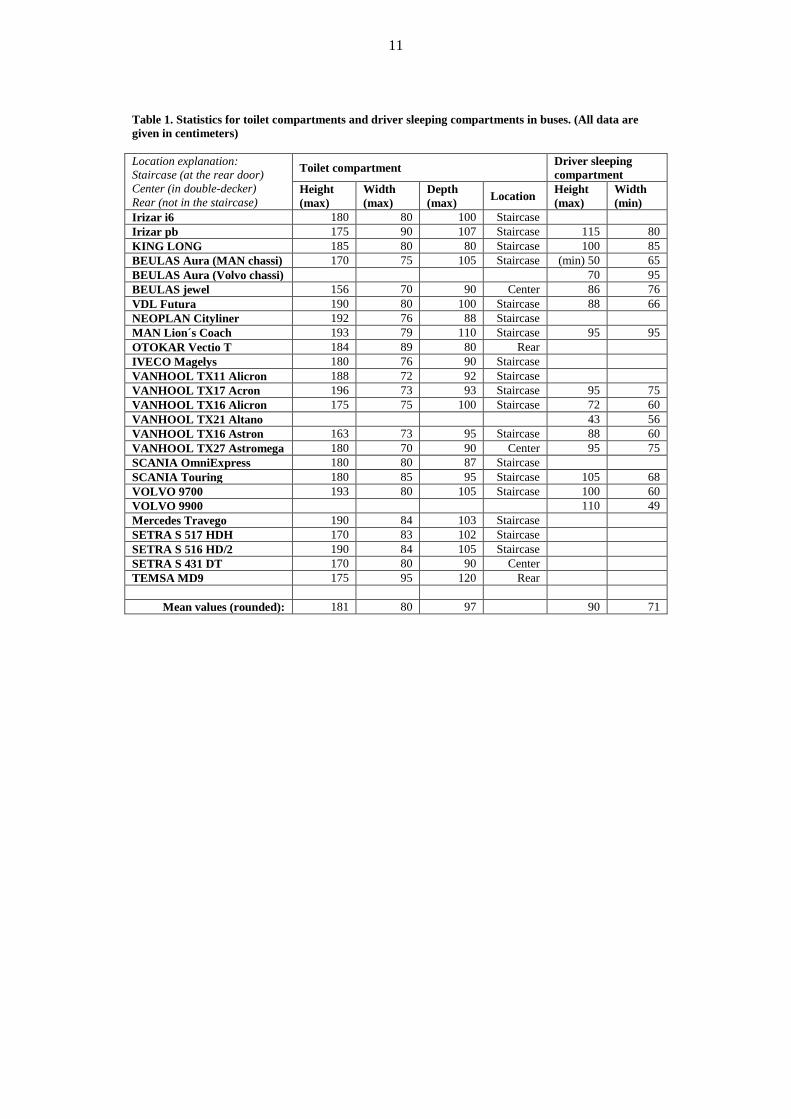
Statistics on height, width, and depth for toilet compartments and sleeping compartments
were collected for 26 different buses, see Table 1. The data was collected by approximate
measurements and do not represent exact values provided by the manufacturers. The most
common location of the toilet compartment is at the rear staircase, which is reflected in
the table. The size variation between different toilet compartments at the same location is
about the same as between toilet compartments at different locations according to the
table, but there are some differences. For example, toilet compartments in double-decker
buses and in rear positions may have lower ceiling height, and large toilet compartments
are normally not fitted in the staircase. The inside of the toilet compartments differs
somewhat, but there is also a great deal of similarity between different toilet compartment
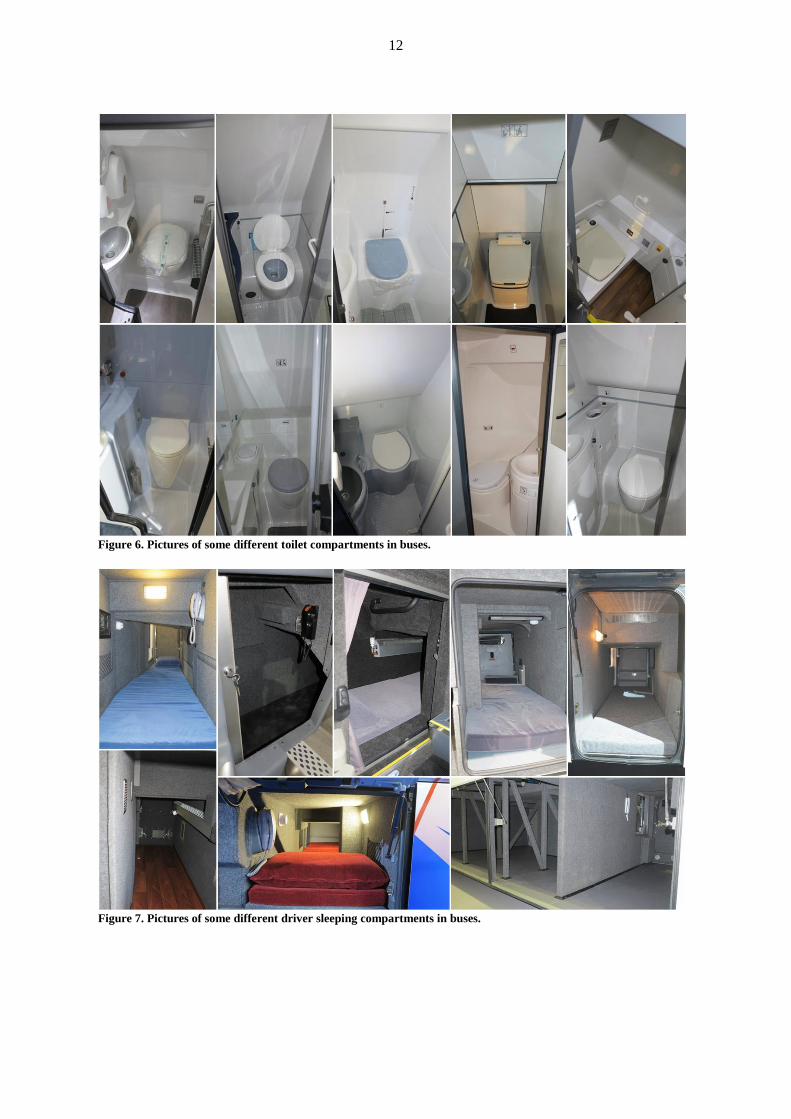
interiors. Pictures of a number of different toilet compartments are presented in Figure 6.
The mockup, Figure 11, was built using the mean values in Table 1, and the interior is
similar to some of the toilet compartments in Figure 6.
The dimensions of the driver sleeping compartments vary more than for toilet
compartments, both in terms of the maximum height and width as shown in Table 1, and
in the shape. The depth was in most cases the width of the bus, which normally is in the
interval 220-260 cm, but there are exceptions. In almost all buses that are not double-
decker buses the sleeping compartment is located at the rear axle with entrance from the
staircase. In double-decker buses the compartment may also be located at the front axle.
Some pictures of different sleeping compartments are presented in Figure 7. One common
characteristic is the decreased ceiling height in the middle section of most sleeping
compartments. This decrease is due to the gangway in the passenger compartment. The
sleeping compartment mockup, Figure 12, was built using the mean values in Table 1, a
depth of 240 cm, and a decreased ceiling height in the middle section.
11
Table 1. Statistics for toilet compartments and driver sleeping compartments in buses. (All data are
given in centimeters)
Location explanation:
Staircase (at the rear door)
Center (in double-decker)
Rear (not in the staircase)
Toilet compartment Driver sleeping
compartment
Height
(max)
Width
(max)
Depth
(max) Location
Height
(max)
Width
(min)
Irizar i6 180 80 100 Staircase
Irizar pb 175 90 107 Staircase 115 80
KING LONG 185 80 80 Staircase 100 85
BEULAS Aura (MAN chassi) 170 75 105 Staircase (min) 50 65
BEULAS Aura (Volvo chassi) 70 95
BEULAS jewel 156 70 90 Center 86 76
VDL Futura 190 80 100 Staircase 88 66
NEOPLAN Cityliner 192 76 88 Staircase
MAN Lion´s Coach 193 79 110 Staircase 95 95
OTOKAR Vectio T 184 89 80 Rear
IVECO Magelys 180 76 90 Staircase
VANHOOL TX11 Alicron 188 72 92 Staircase
VANHOOL TX17 Acron 196 73 93 Staircase 95 75
VANHOOL TX16 Alicron 175 75 100 Staircase 72 60
VANHOOL TX21 Altano 43 56
VANHOOL TX16 Astron 163 73 95 Staircase 88 60
VANHOOL TX27 Astromega 180 70 90 Center 95 75
SCANIA OmniExpress 180 80 87 Staircase
SCANIA Touring 180 85 95 Staircase 105 68
VOLVO 9700 193 80 105 Staircase 100 60
VOLVO 9900 110 49
Mercedes Travego 190 84 103 Staircase
SETRA S 517 HDH 170 83 102 Staircase
SETRA S 516 HD/2 190 84 105 Staircase
SETRA S 431 DT 170 80 90 Center
TEMSA MD9 175 95 120 Rear
Mean values (rounded): 181 80 97 90 71
12
Figure 6. Pictures of some different toilet compartments in buses.
Figure 7. Pictures of some different driver sleeping compartments in buses.
13
3.1.2 Ventilation
Accurate air flows and air velocities in the toilet compartment, sleeping compartment,
and luggage compartment of buses are generally not known. Therefore measurements
were performed of the ventilation conditions in the toilet compartment, the driver
sleeping compartment, and the luggage compartment of a SCANIA Touring bus. For the
toilet compartment some additional measurements were performed in a VOLVO 9700
and a SCANIA OmniExpress. A toilet system manufacturer also provided some input
regarding the ventilation conditions. The bus manufacturers were only able to provide
information about the air flow entering the passenger and driver compartment, and how
the air is evacuated.
Air velocity measurements in a SCANIA Touring The air conditioning and ventilation system differs between buses and the air evacuation
may be solved in different ways. The measurements performed in a SCANIA touring are
therefore only indicative rather than generic. In this bus the air is evacuated from the
passenger compartment through the luggage compartment and then out under the bus at
the front axle. In the toilet compartment, air is drawn out via a separate fan and straight
out under the bus, which applies to all bus toilet compartments since odors are prevented
from reaching other areas of the bus. The air enters via gaps around the door, which also
applies to most toilet compartments. However, some toilet compartments, especially rear
compartments, do have a feed from the air conditioning system. In the sleeping
compartment in the bus examined, the air entered from the passenger compartment at the
gangway and exited via a fan back to the passenger compartment at the rear staircase. The
sleeping compartment also contained a circulating heater.
Available information about the bus examined states that nominally approximately
1000 m3/h fresh air is circulated through the passenger and luggage compartment, not
accounting for air leakage. This is consistent with the results of our examination.
Measurements of air velocities in the luggage compartment combined with approximate
calculation of the total air flow shows that 1000-1100 m3/h air circulates through the
luggage compartment. In the air stream close to the inlets, air velocities as high as 10 m/s
were measured in the ceiling of the luggage compartment, but air velocities in the
compartment were about 0.2-0.8 m/s on average.
Both in the luggage compartment and in the toilet compartment the air velocity was
logged at different positions during mixed driving conditions. Since the air from these
two compartments is evacuated under the bus, different driving conditions could affect
the ventilation conditions. However, the results show that this effect is minimal, see
diagram in Figure 8 for the toilet compartment measurements. The bus started from
idling, before driving at different speeds with entrance onto the highway between 4-10
minutes (90 km/h), and before finally returning to the starting position. The difference
measured in air velocities were very small, although there was a slight difference noted
when driving on the highway (4-10 minutes). The air velocity was found to decrease at
that point which was not expected, since the pressure under the bus should decrease when
driving at higher speed.
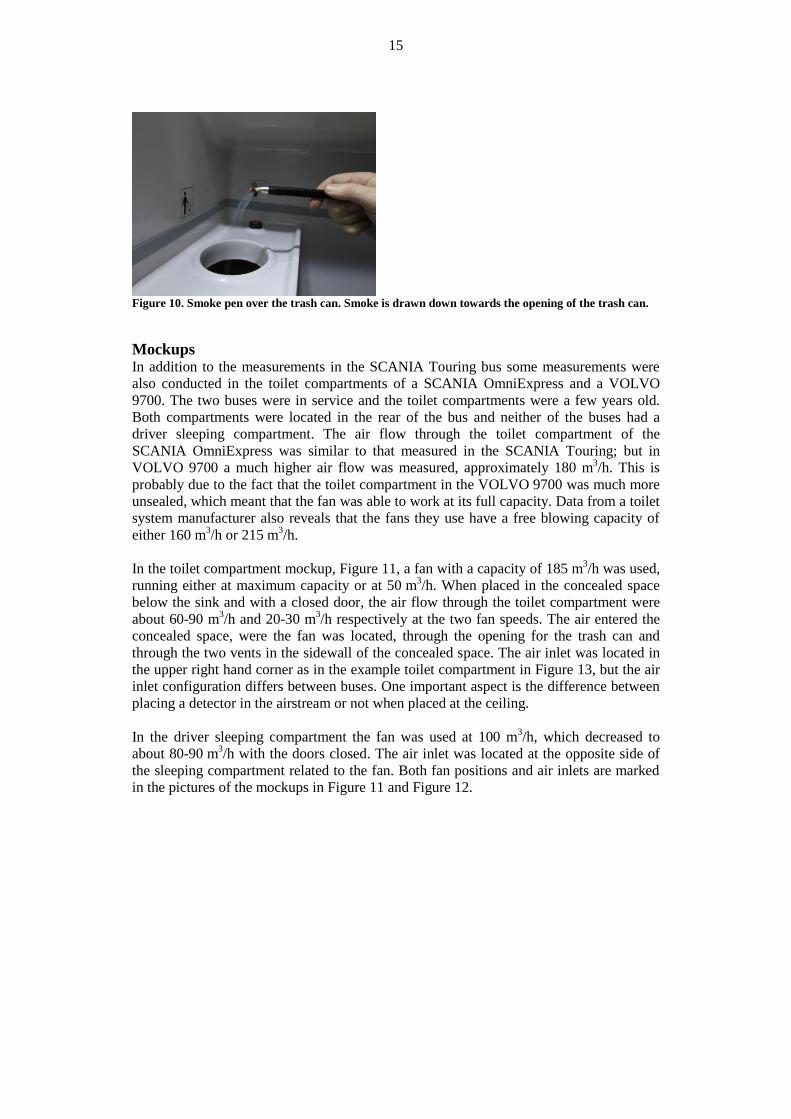
The air was extracted from the toilet compartment via a fan placed in the concealed space
below the sink. This space extends to the trash can and air entered this space through the
opening over the trash can and through two air vents in the sidewall. From the graph in
Figure 8 we can see that there was a significant air flow down towards the trash can
which was visualized using a smoke pen, see Figure 10. The fan in the toilet compartment
had two modes, when the toilet compartment is occupied it runs at a higher speed than
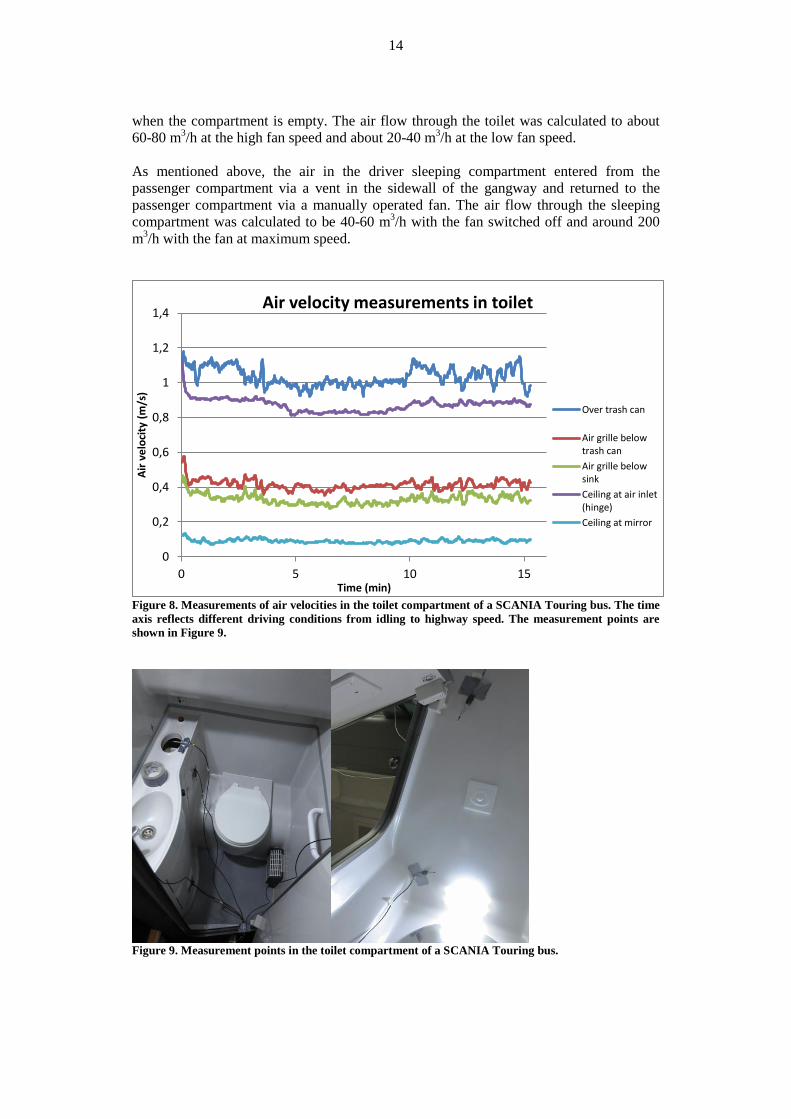
14
when the compartment is empty. The air flow through the toilet was calculated to about
60-80 m3/h at the high fan speed and about 20-40 m
3/h at the low fan speed.
As mentioned above, the air in the driver sleeping compartment entered from the
passenger compartment via a vent in the sidewall of the gangway and returned to the
passenger compartment via a manually operated fan. The air flow through the sleeping
compartment was calculated to be 40-60 m3/h with the fan switched off and around 200
m3/h with the fan at maximum speed.
Figure 8. Measurements of air velocities in the toilet compartment of a SCANIA Touring bus. The time
axis reflects different driving conditions from idling to highway speed. The measurement points are
shown in Figure 9.
Figure 9. Measurement points in the toilet compartment of a SCANIA Touring bus.
0
0,2
0,4
0,6
0,8
1
1,2
1,4
0 5 10 15
Air
ve
loci
ty (
m/s
)
Time (min)
Air velocity measurements in toilet
Over trash can
Air grille belowtrash can
Air grille belowsink
Ceiling at air inlet(hinge)
Ceiling at mirror
15
Figure 10. Smoke pen over the trash can. Smoke is drawn down towards the opening of the trash can.
Mockups In addition to the measurements in the SCANIA Touring bus some measurements were
also conducted in the toilet compartments of a SCANIA OmniExpress and a VOLVO
9700. The two buses were in service and the toilet compartments were a few years old.
Both compartments were located in the rear of the bus and neither of the buses had a
driver sleeping compartment. The air flow through the toilet compartment of the
SCANIA OmniExpress was similar to that measured in the SCANIA Touring; but in
VOLVO 9700 a much higher air flow was measured, approximately 180 m3/h. This is
probably due to the fact that the toilet compartment in the VOLVO 9700 was much more
unsealed, which meant that the fan was able to work at its full capacity. Data from a toilet
system manufacturer also reveals that the fans they use have a free blowing capacity of
either 160 m3/h or 215 m
3/h.
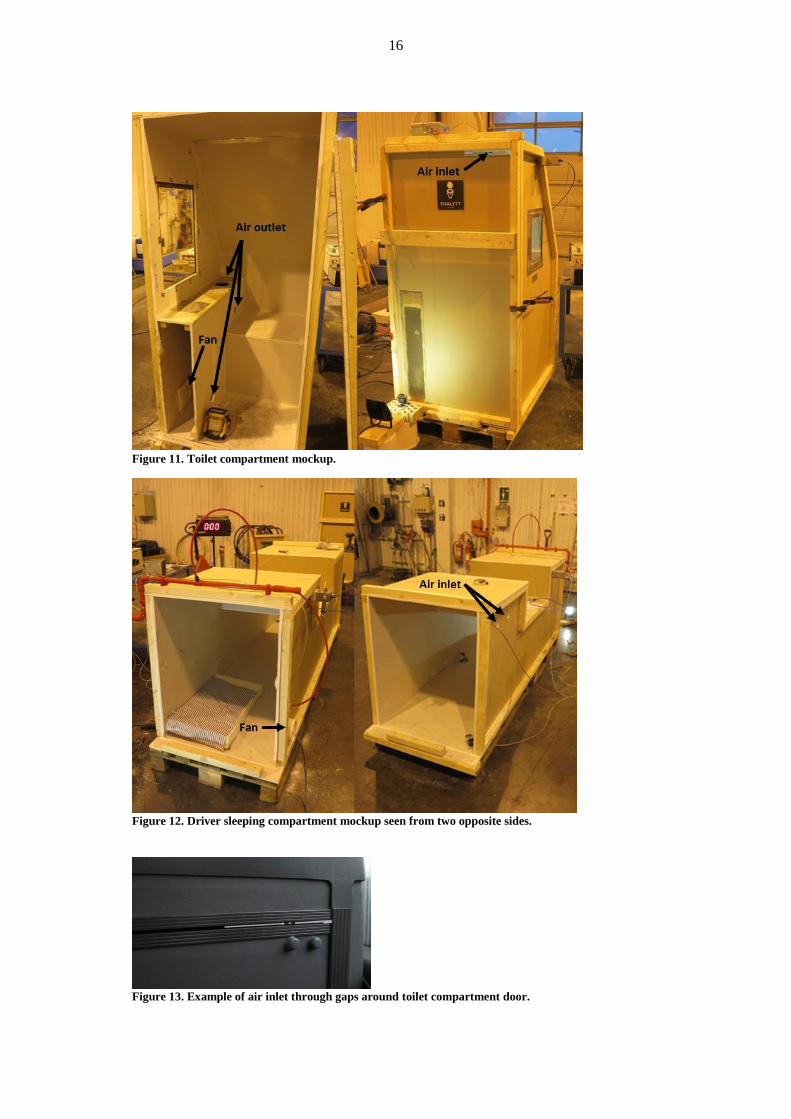
In the toilet compartment mockup, Figure 11, a fan with a capacity of 185 m3/h was used,
running either at maximum capacity or at 50 m3/h. When placed in the concealed space
below the sink and with a closed door, the air flow through the toilet compartment were
about 60-90 m3/h and 20-30 m
3/h respectively at the two fan speeds. The air entered the
concealed space, were the fan was located, through the opening for the trash can and
through the two vents in the sidewall of the concealed space. The air inlet was located in
the upper right hand corner as in the example toilet compartment in Figure 13, but the air
inlet configuration differs between buses. One important aspect is the difference between
placing a detector in the airstream or not when placed at the ceiling.
In the driver sleeping compartment the fan was used at 100 m3/h, which decreased to
about 80-90 m3/h with the doors closed. The air inlet was located at the opposite side of
the sleeping compartment related to the fan. Both fan positions and air inlets are marked
in the pictures of the mockups in Figure 11 and Figure 12.
16
Figure 11. Toilet compartment mockup.
Figure 12. Driver sleeping compartment mockup seen from two opposite sides.
Figure 13. Example of air inlet through gaps around toilet compartment door.
17
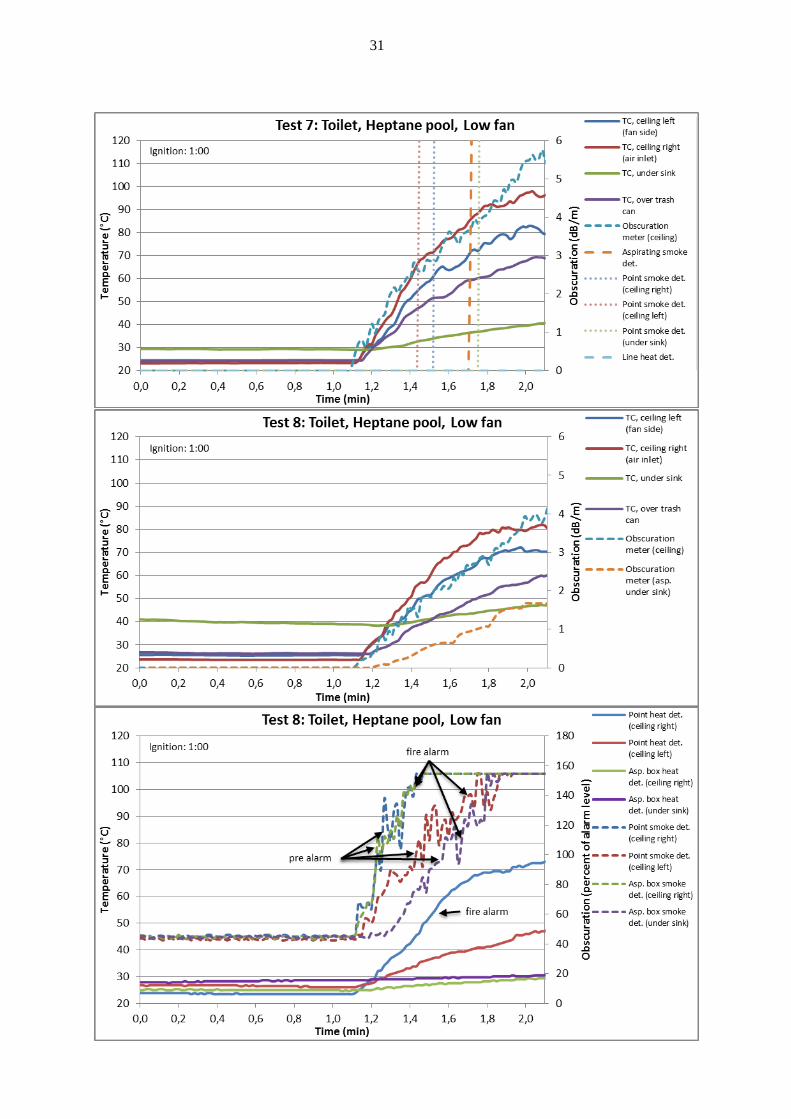
3.2 Full scale test results
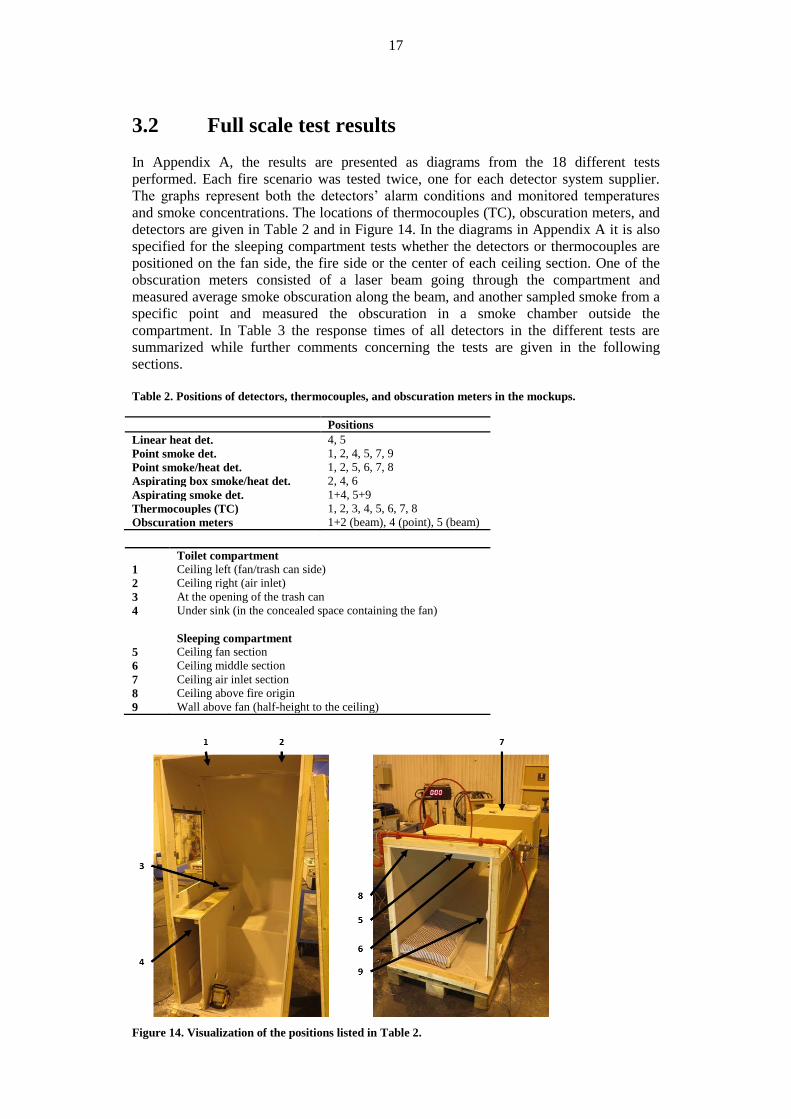
In Appendix A, the results are presented as diagrams from the 18 different tests
performed. Each fire scenario was tested twice, one for each detector system supplier.
The graphs represent both the detectors’ alarm conditions and monitored temperatures
and smoke concentrations. The locations of thermocouples (TC), obscuration meters, and
detectors are given in Table 2 and in Figure 14. In the diagrams in Appendix A it is also
specified for the sleeping compartment tests whether the detectors or thermocouples are
positioned on the fan side, the fire side or the center of each ceiling section. One of the
obscuration meters consisted of a laser beam going through the compartment and
measured average smoke obscuration along the beam, and another sampled smoke from a
specific point and measured the obscuration in a smoke chamber outside the
compartment. In Table 3 the response times of all detectors in the different tests are
summarized while further comments concerning the tests are given in the following
sections.
Table 2. Positions of detectors, thermocouples, and obscuration meters in the mockups.
Positions
Linear heat det. 4, 5
Point smoke det. 1, 2, 4, 5, 7, 9
Point smoke/heat det. 1, 2, 5, 6, 7, 8
Aspirating box smoke/heat det. 2, 4, 6
Aspirating smoke det. 1+4, 5+9
Thermocouples (TC) 1, 2, 3, 4, 5, 6, 7, 8
Obscuration meters 1+2 (beam), 4 (point), 5 (beam)
Toilet compartment
1 Ceiling left (fan/trash can side)
2 Ceiling right (air inlet)
3 At the opening of the trash can
4 Under sink (in the concealed space containing the fan)
Sleeping compartment
5 Ceiling fan section
6 Ceiling middle section
7 Ceiling air inlet section
8 Ceiling above fire origin
9 Wall above fan (half-height to the ceiling)
Figure 14. Visualization of the positions listed in Table 2.
18
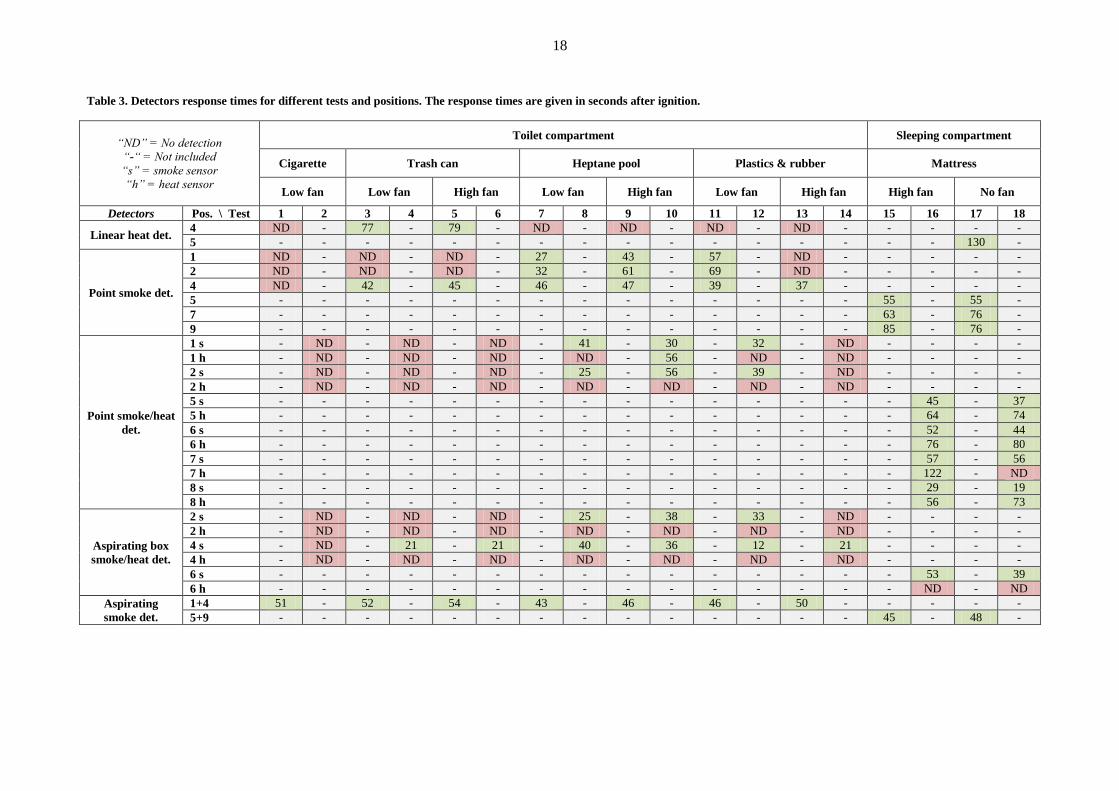
Table 3. Detectors response times for different tests and positions. The response times are given in seconds after ignition.
“ND” = No detection
“-“ = Not included
“s” = smoke sensor
“h” = heat sensor
Toilet compartment Sleeping compartment
Cigarette Trash can Heptane pool Plastics & rubber Mattress
Low fan Low fan High fan Low fan High fan Low fan High fan High fan No fan
Detectors Pos. \ Test 1 2 3 4 5 6 7 8 9 10 11 12 13 14 15 16 17 18
Linear heat det. 4 ND - 77 - 79 - ND - ND - ND - ND - - - - -
5 - - - - - - - - - - - - - - - - 130 -
Point smoke det.
1 ND - ND - ND - 27 - 43 - 57 - ND - - - - -
2 ND - ND - ND - 32 - 61 - 69 - ND - - - - -
4 ND - 42 - 45 - 46 - 47 - 39 - 37 - - - - -
5 - - - - - - - - - - - - - - 55 - 55 -
7 - - - - - - - - - - - - - - 63 - 76 -
9 - - - - - - - - - - - - - - 85 - 76 -
Point smoke/heat
det.
1 s - ND - ND - ND - 41 - 30 - 32 - ND - - - -
1 h - ND - ND - ND - ND - 56 - ND - ND - - - -
2 s - ND - ND - ND - 25 - 56 - 39 - ND - - - -
2 h - ND - ND - ND - ND - ND - ND - ND - - - -
5 s - - - - - - - - - - - - - - - 45 - 37
5 h - - - - - - - - - - - - - - - 64 - 74
6 s - - - - - - - - - - - - - - - 52 - 44
6 h - - - - - - - - - - - - - - - 76 - 80
7 s - - - - - - - - - - - - - - - 57 - 56
7 h - - - - - - - - - - - - - - - 122 - ND
8 s - - - - - - - - - - - - - - - 29 - 19
8 h - - - - - - - - - - - - - - - 56 - 73
Aspirating box
smoke/heat det.
2 s - ND - ND - ND - 25 - 38 - 33 - ND - - - -
2 h - ND - ND - ND - ND - ND - ND - ND - - - -
4 s - ND - 21 - 21 - 40 - 36 - 12 - 21 - - - -
4 h - ND - ND - ND - ND - ND - ND - ND - - - -
6 s - - - - - - - - - - - - - - - 53 - 39
6 h - - - - - - - - - - - - - - - ND - ND
Aspirating
smoke det.
1+4 51 - 52 - 54 - 43 - 46 - 46 - 50 - - - - -
5+9 - - - - - - - - - - - - - - 45 - 48 -
19
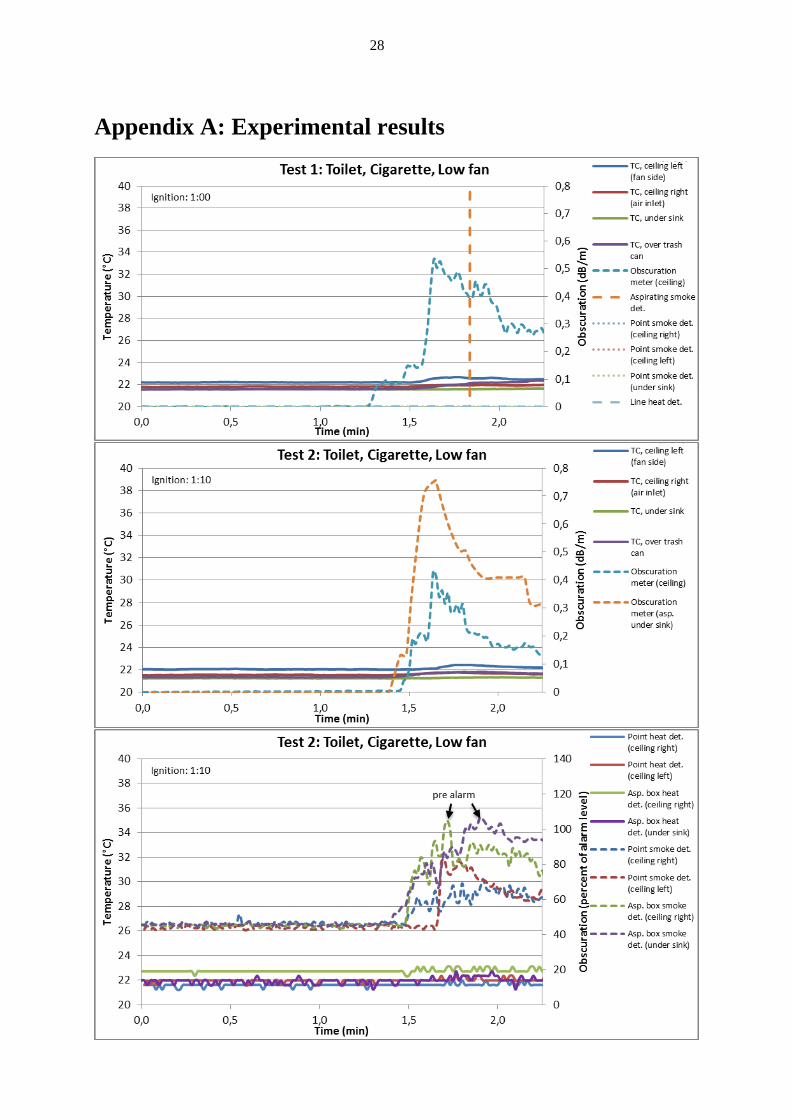
3.2.1 Toilet compartment tests
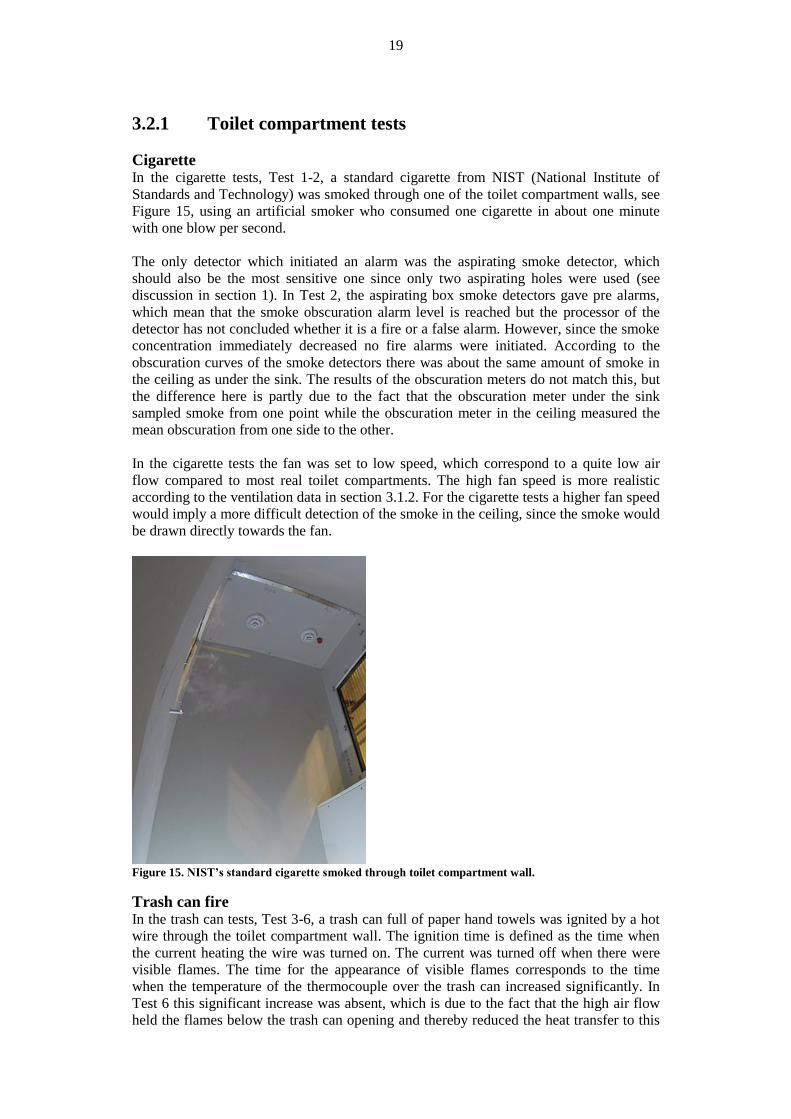
Cigarette In the cigarette tests, Test 1-2, a standard cigarette from NIST (National Institute of
Standards and Technology) was smoked through one of the toilet compartment walls, see
Figure 15, using an artificial smoker who consumed one cigarette in about one minute
with one blow per second.
The only detector which initiated an alarm was the aspirating smoke detector, which
should also be the most sensitive one since only two aspirating holes were used (see
discussion in section 1). In Test 2, the aspirating box smoke detectors gave pre alarms,
which mean that the smoke obscuration alarm level is reached but the processor of the
detector has not concluded whether it is a fire or a false alarm. However, since the smoke
concentration immediately decreased no fire alarms were initiated. According to the
obscuration curves of the smoke detectors there was about the same amount of smoke in
the ceiling as under the sink. The results of the obscuration meters do not match this, but
the difference here is partly due to the fact that the obscuration meter under the sink
sampled smoke from one point while the obscuration meter in the ceiling measured the
mean obscuration from one side to the other.
In the cigarette tests the fan was set to low speed, which correspond to a quite low air
flow compared to most real toilet compartments. The high fan speed is more realistic
according to the ventilation data in section 3.1.2. For the cigarette tests a higher fan speed
would imply a more difficult detection of the smoke in the ceiling, since the smoke would
be drawn directly towards the fan.
Figure 15. NIST’s standard cigarette smoked through toilet compartment wall.
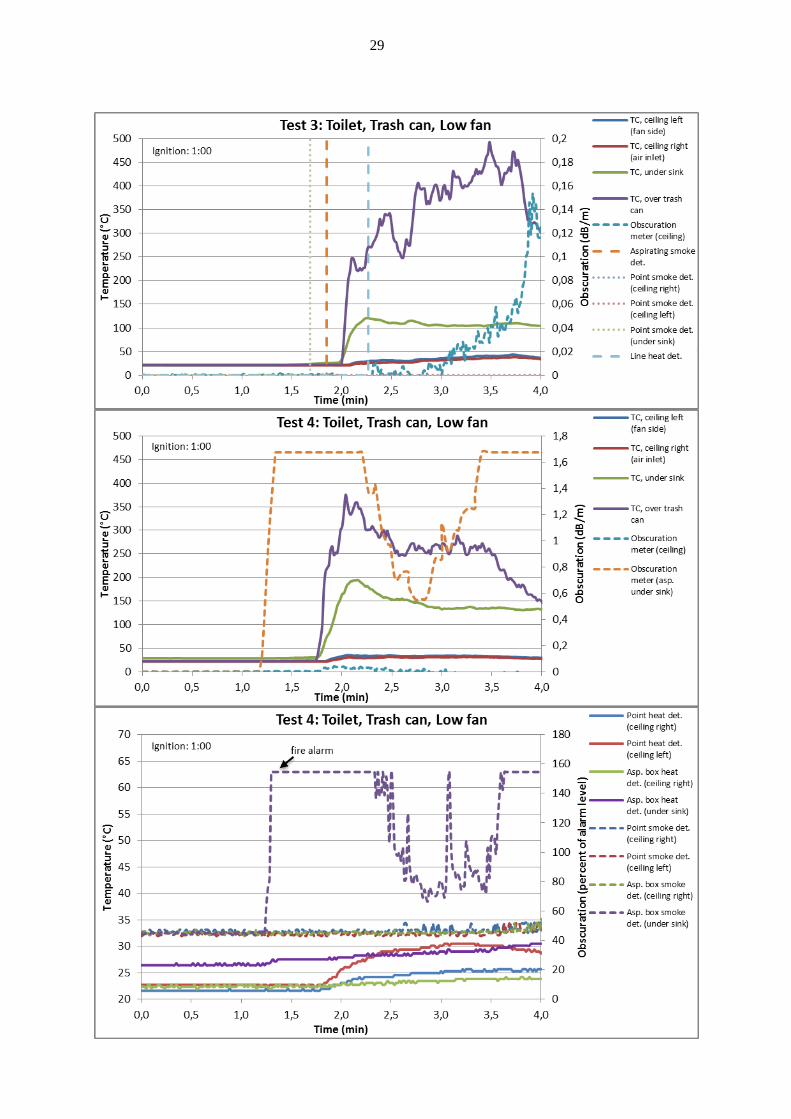
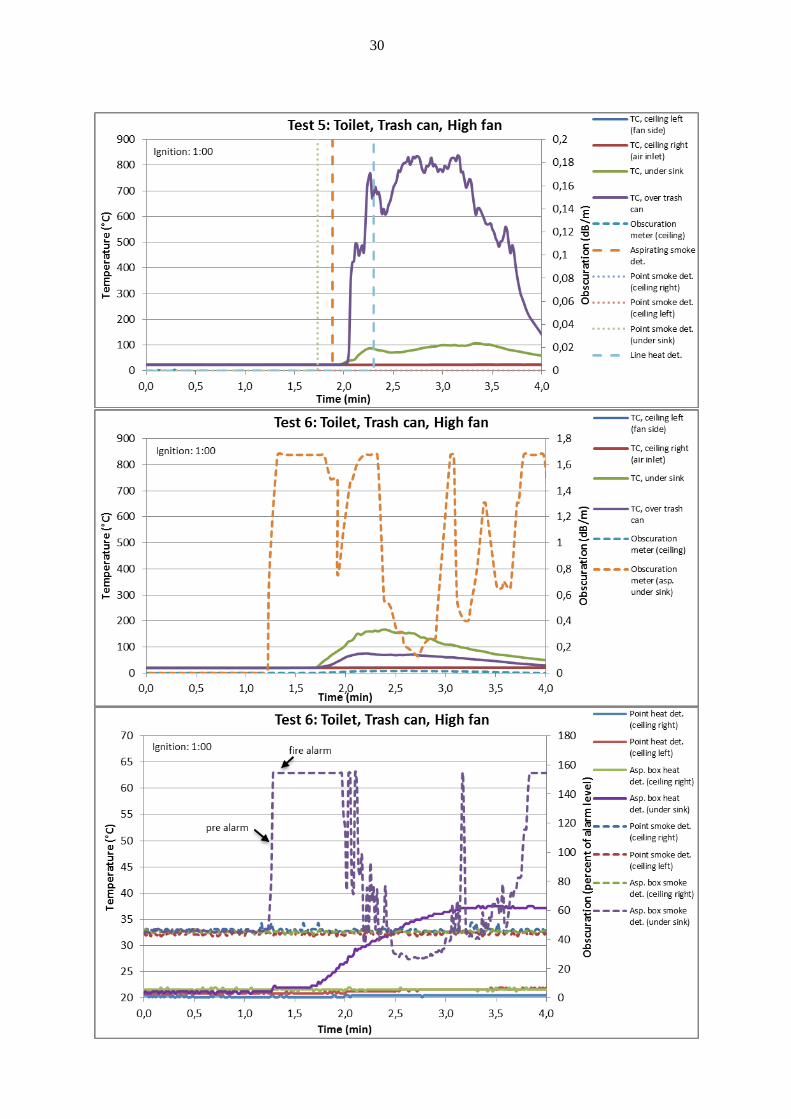
Trash can fire In the trash can tests, Test 3-6, a trash can full of paper hand towels was ignited by a hot
wire through the toilet compartment wall. The ignition time is defined as the time when
the current heating the wire was turned on. The current was turned off when there were
visible flames. The time for the appearance of visible flames corresponds to the time
when the temperature of the thermocouple over the trash can increased significantly. In
Test 6 this significant increase was absent, which is due to the fact that the high air flow
held the flames below the trash can opening and thereby reduced the heat transfer to this
20
thermocouple. The thermocouple was probably also positioned slightly higher than in
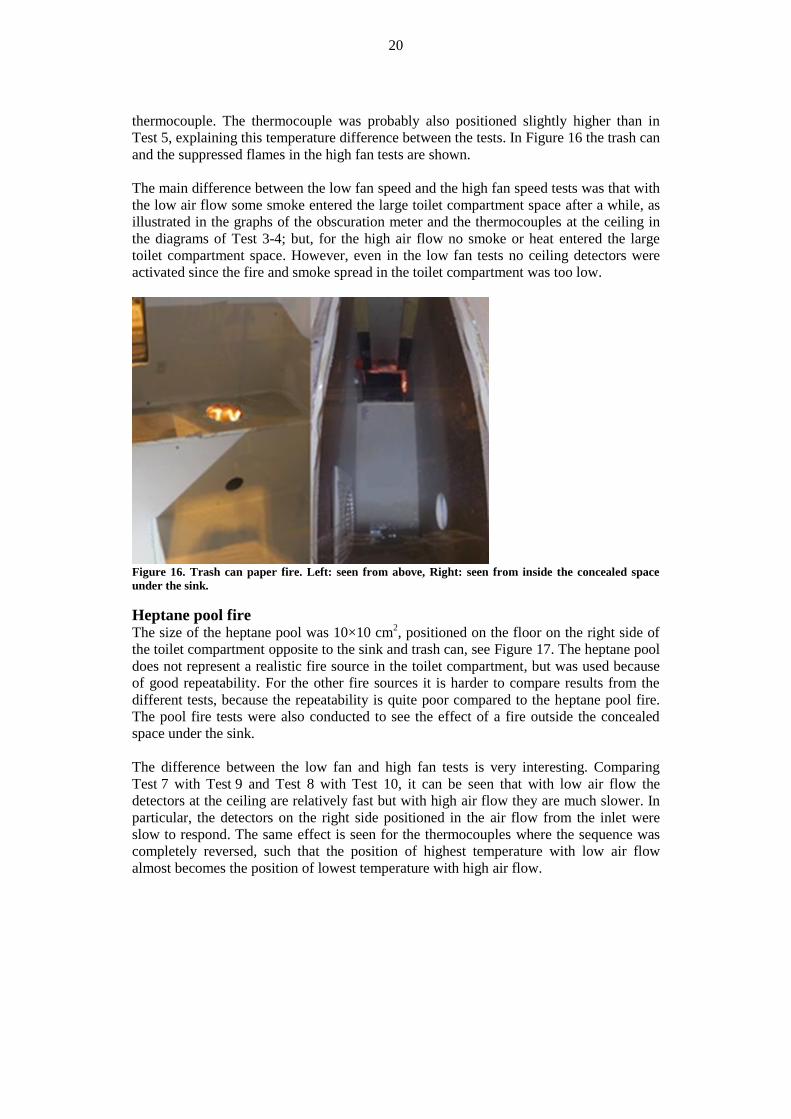
Test 5, explaining this temperature difference between the tests. In Figure 16 the trash can
and the suppressed flames in the high fan tests are shown.
The main difference between the low fan speed and the high fan speed tests was that with
the low air flow some smoke entered the large toilet compartment space after a while, as
illustrated in the graphs of the obscuration meter and the thermocouples at the ceiling in
the diagrams of Test 3-4; but, for the high air flow no smoke or heat entered the large
toilet compartment space. However, even in the low fan tests no ceiling detectors were
activated since the fire and smoke spread in the toilet compartment was too low.
Figure 16. Trash can paper fire. Left: seen from above, Right: seen from inside the concealed space
under the sink.
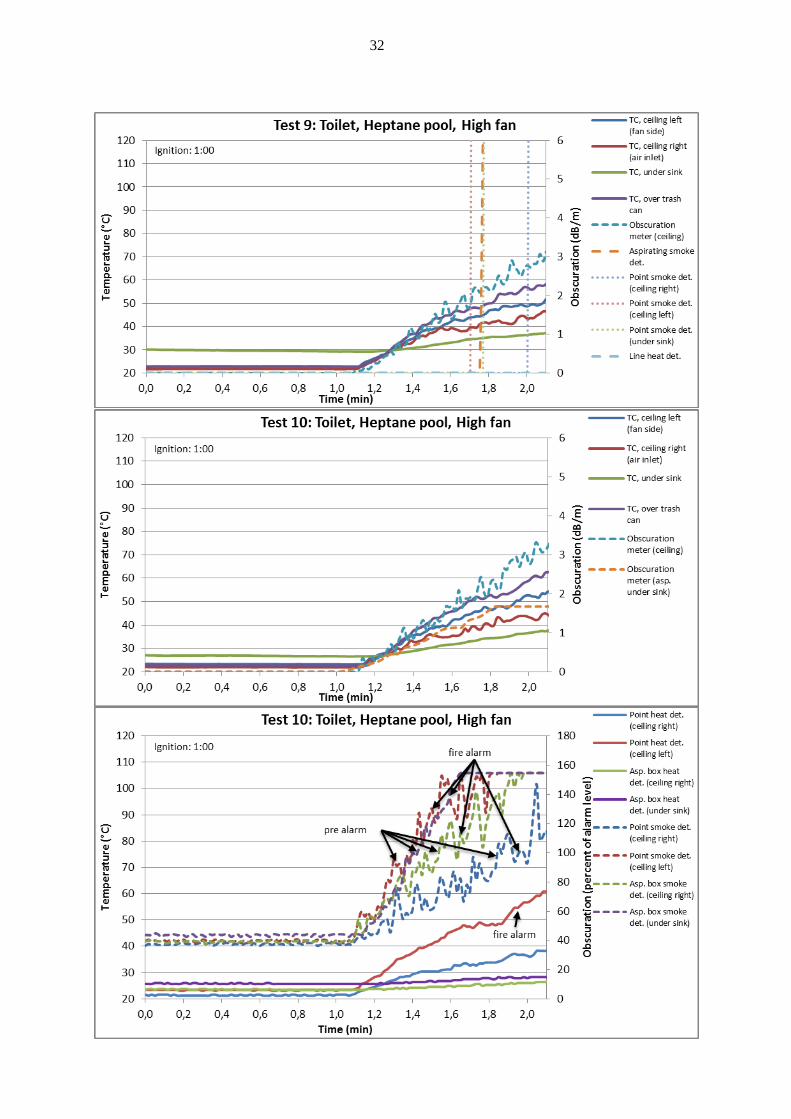
Heptane pool fire The size of the heptane pool was 10×10 cm
2, positioned on the floor on the right side of
the toilet compartment opposite to the sink and trash can, see Figure 17. The heptane pool
does not represent a realistic fire source in the toilet compartment, but was used because
of good repeatability. For the other fire sources it is harder to compare results from the
different tests, because the repeatability is quite poor compared to the heptane pool fire.
The pool fire tests were also conducted to see the effect of a fire outside the concealed
space under the sink.
The difference between the low fan and high fan tests is very interesting. Comparing
Test 7 with Test 9 and Test 8 with Test 10, it can be seen that with low air flow the
detectors at the ceiling are relatively fast but with high air flow they are much slower. In
particular, the detectors on the right side positioned in the air flow from the inlet were
slow to respond. The same effect is seen for the thermocouples where the sequence was
completely reversed, such that the position of highest temperature with low air flow
almost becomes the position of lowest temperature with high air flow.
21
Figure 17. Heptane pool fire. Seen through the window to the left in Figure 14.
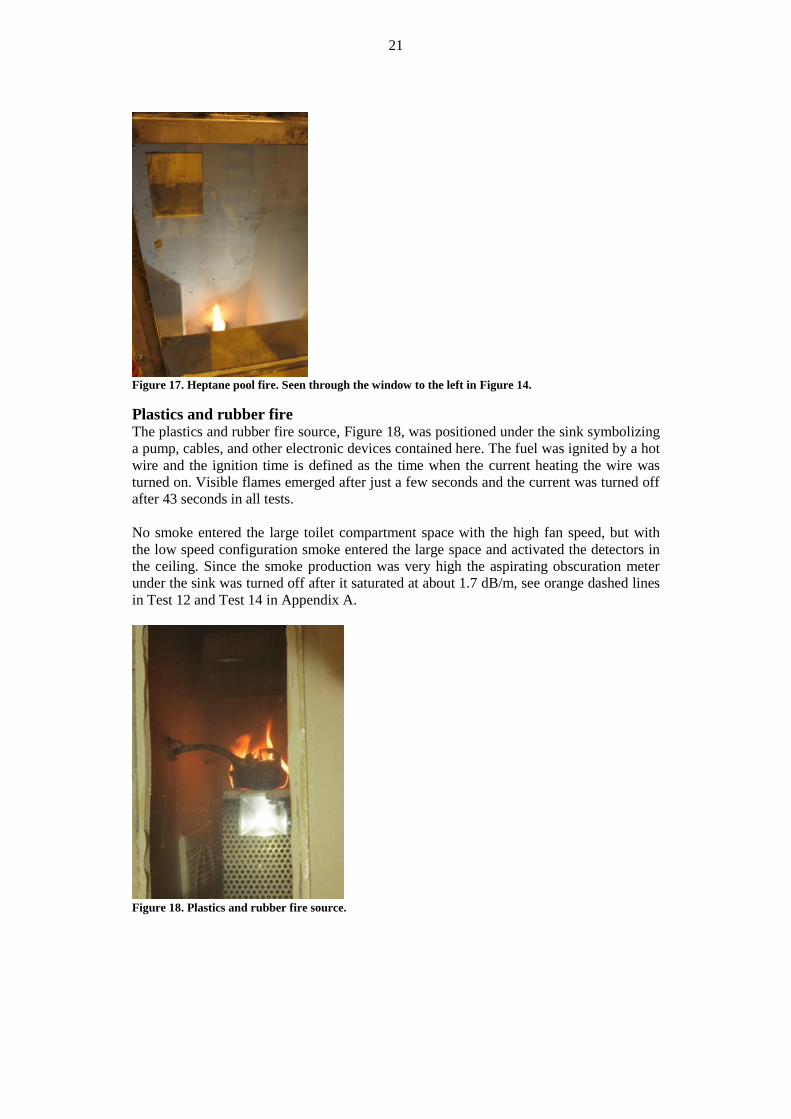
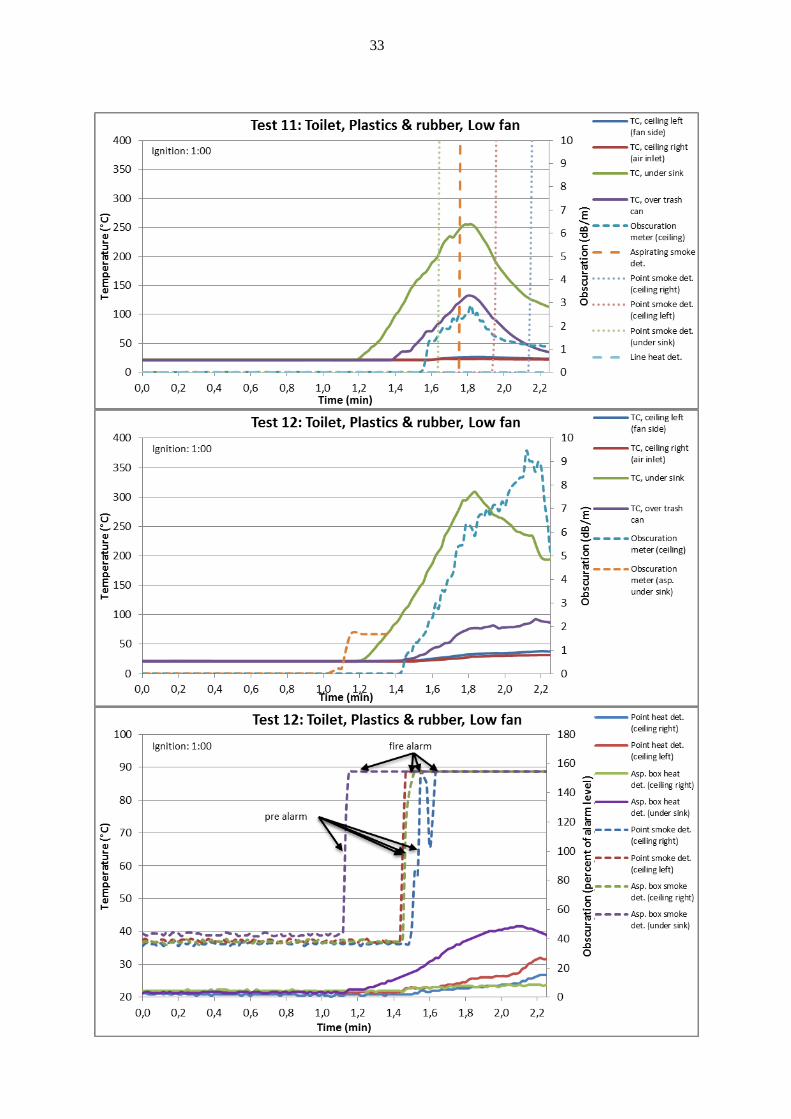
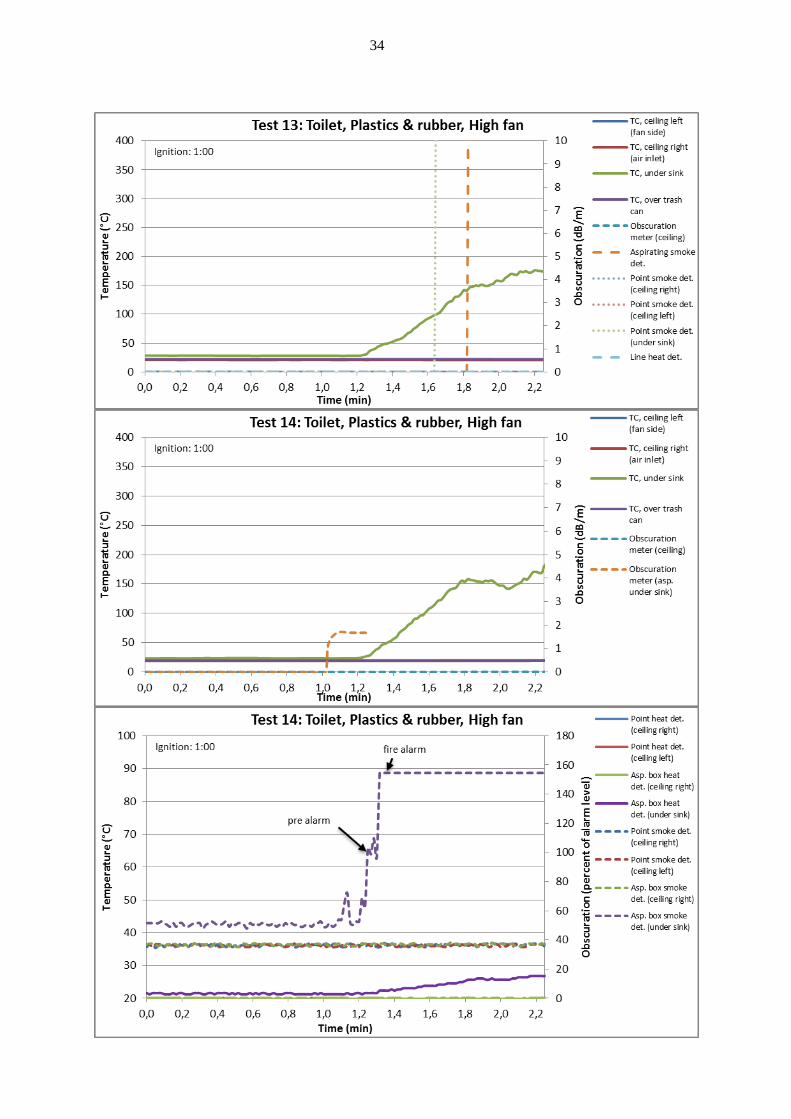
Plastics and rubber fire The plastics and rubber fire source, Figure 18, was positioned under the sink symbolizing
a pump, cables, and other electronic devices contained here. The fuel was ignited by a hot
wire and the ignition time is defined as the time when the current heating the wire was
turned on. Visible flames emerged after just a few seconds and the current was turned off
after 43 seconds in all tests.
No smoke entered the large toilet compartment space with the high fan speed, but with
the low speed configuration smoke entered the large space and activated the detectors in
the ceiling. Since the smoke production was very high the aspirating obscuration meter
under the sink was turned off after it saturated at about 1.7 dB/m, see orange dashed lines
in Test 12 and Test 14 in Appendix A.
Figure 18. Plastics and rubber fire source.
22
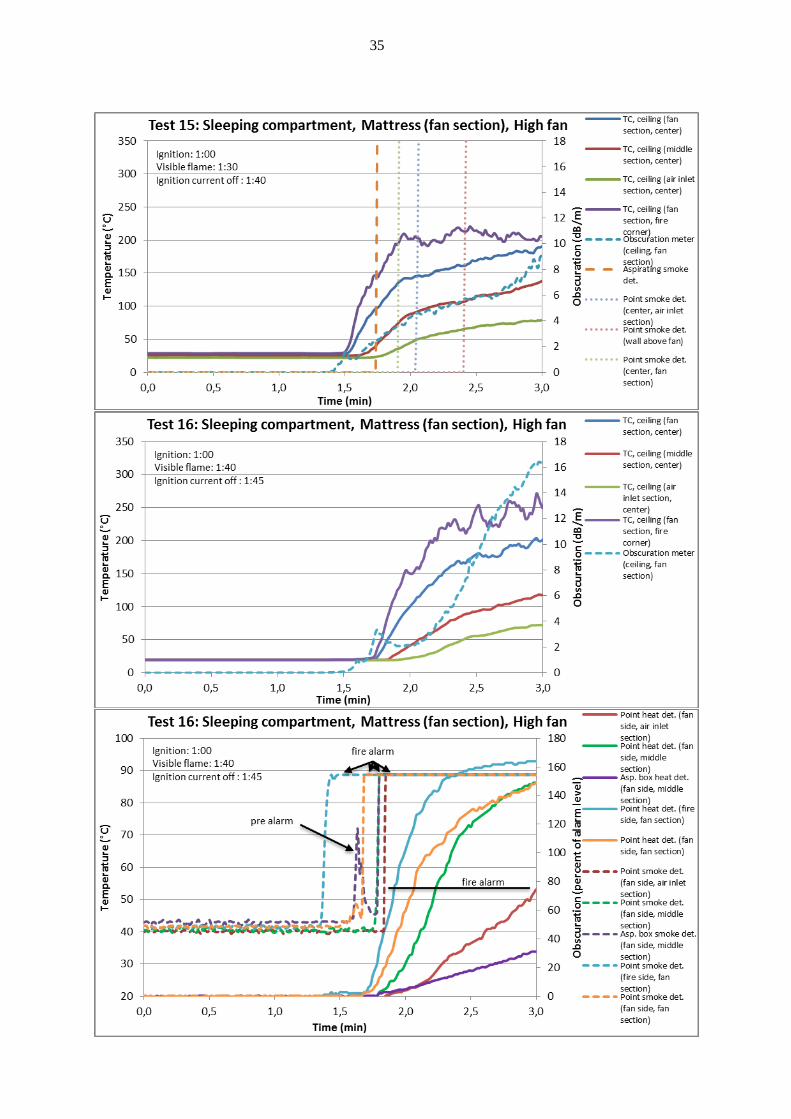
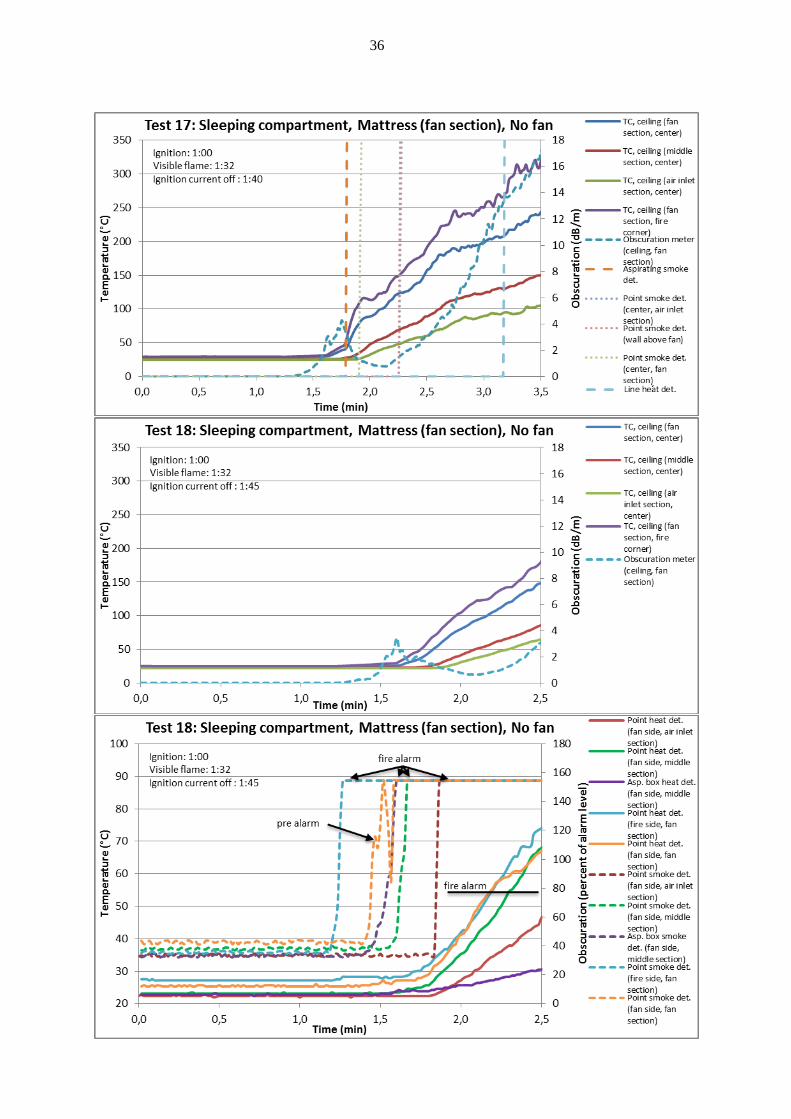
3.2.2 Sleeping compartment tests
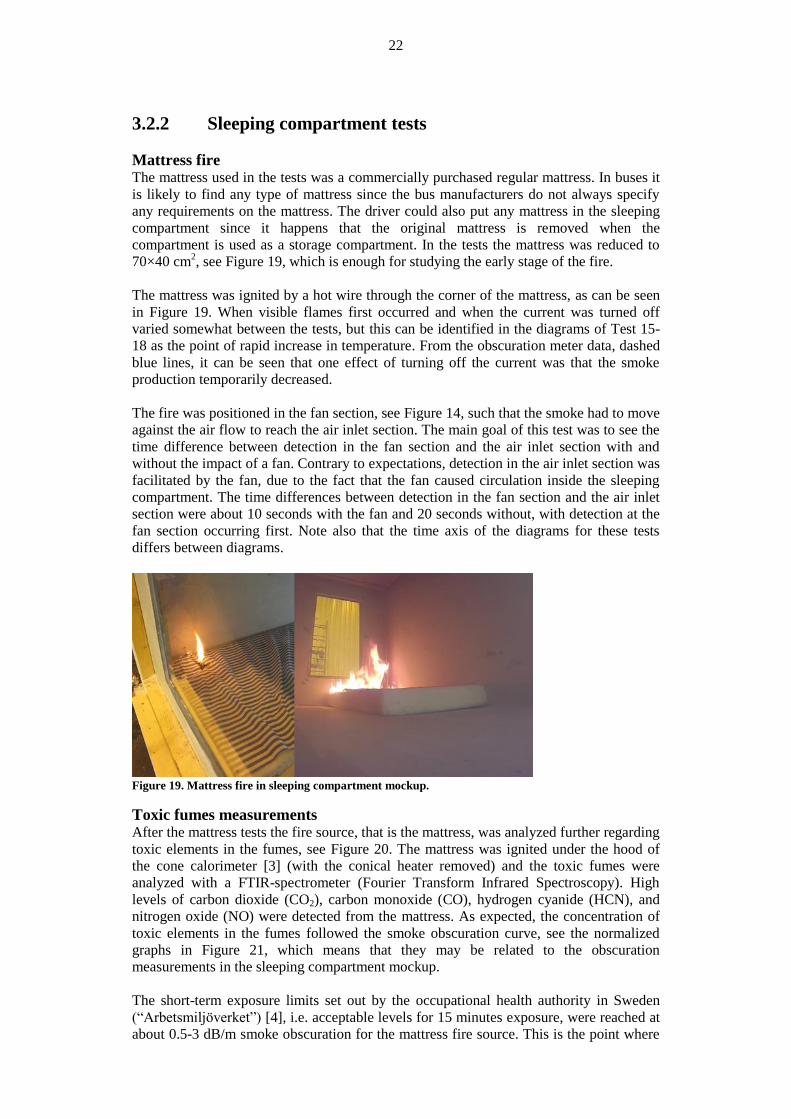
Mattress fire The mattress used in the tests was a commercially purchased regular mattress. In buses it
is likely to find any type of mattress since the bus manufacturers do not always specify
any requirements on the mattress. The driver could also put any mattress in the sleeping
compartment since it happens that the original mattress is removed when the
compartment is used as a storage compartment. In the tests the mattress was reduced to
70×40 cm2, see Figure 19, which is enough for studying the early stage of the fire.
The mattress was ignited by a hot wire through the corner of the mattress, as can be seen
in Figure 19. When visible flames first occurred and when the current was turned off
varied somewhat between the tests, but this can be identified in the diagrams of Test 15-
18 as the point of rapid increase in temperature. From the obscuration meter data, dashed
blue lines, it can be seen that one effect of turning off the current was that the smoke
production temporarily decreased.
The fire was positioned in the fan section, see Figure 14, such that the smoke had to move
against the air flow to reach the air inlet section. The main goal of this test was to see the
time difference between detection in the fan section and the air inlet section with and
without the impact of a fan. Contrary to expectations, detection in the air inlet section was
facilitated by the fan, due to the fact that the fan caused circulation inside the sleeping
compartment. The time differences between detection in the fan section and the air inlet
section were about 10 seconds with the fan and 20 seconds without, with detection at the
fan section occurring first. Note also that the time axis of the diagrams for these tests
differs between diagrams.
Figure 19. Mattress fire in sleeping compartment mockup.
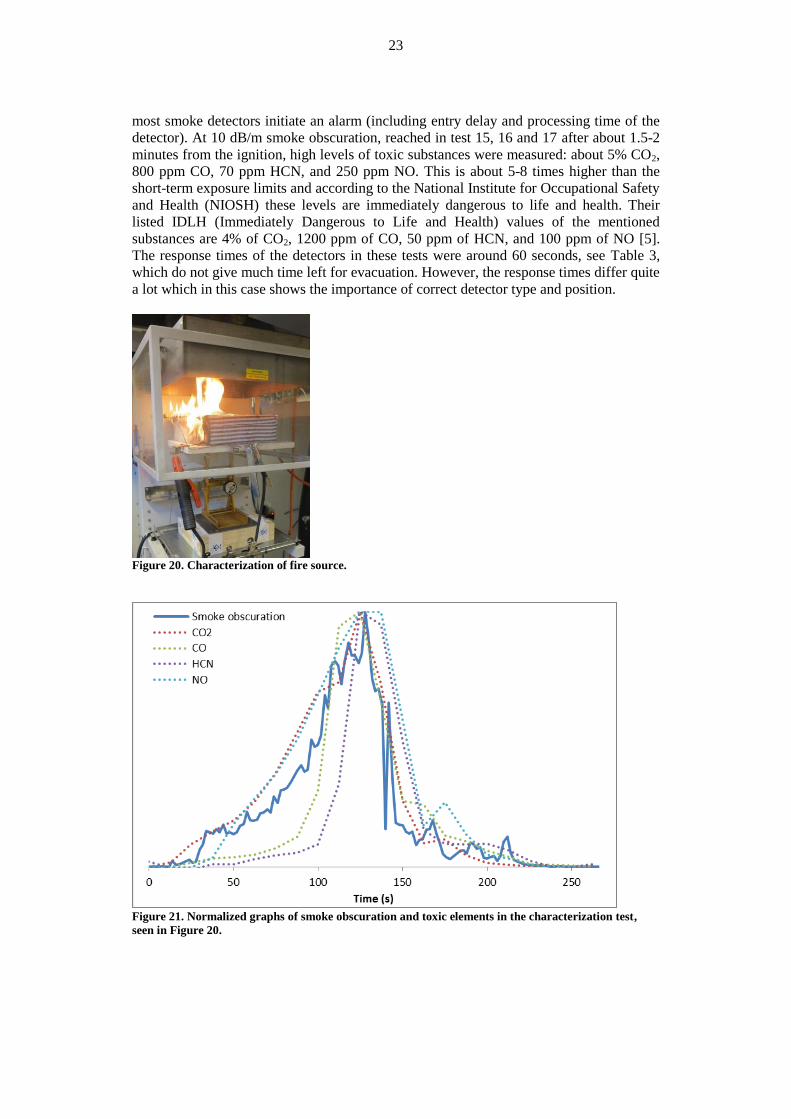
Toxic fumes measurements After the mattress tests the fire source, that is the mattress, was analyzed further regarding
toxic elements in the fumes, see Figure 20. The mattress was ignited under the hood of
the cone calorimeter [3] (with the conical heater removed) and the toxic fumes were
analyzed with a FTIR-spectrometer (Fourier Transform Infrared Spectroscopy). High
levels of carbon dioxide (CO2), carbon monoxide (CO), hydrogen cyanide (HCN), and
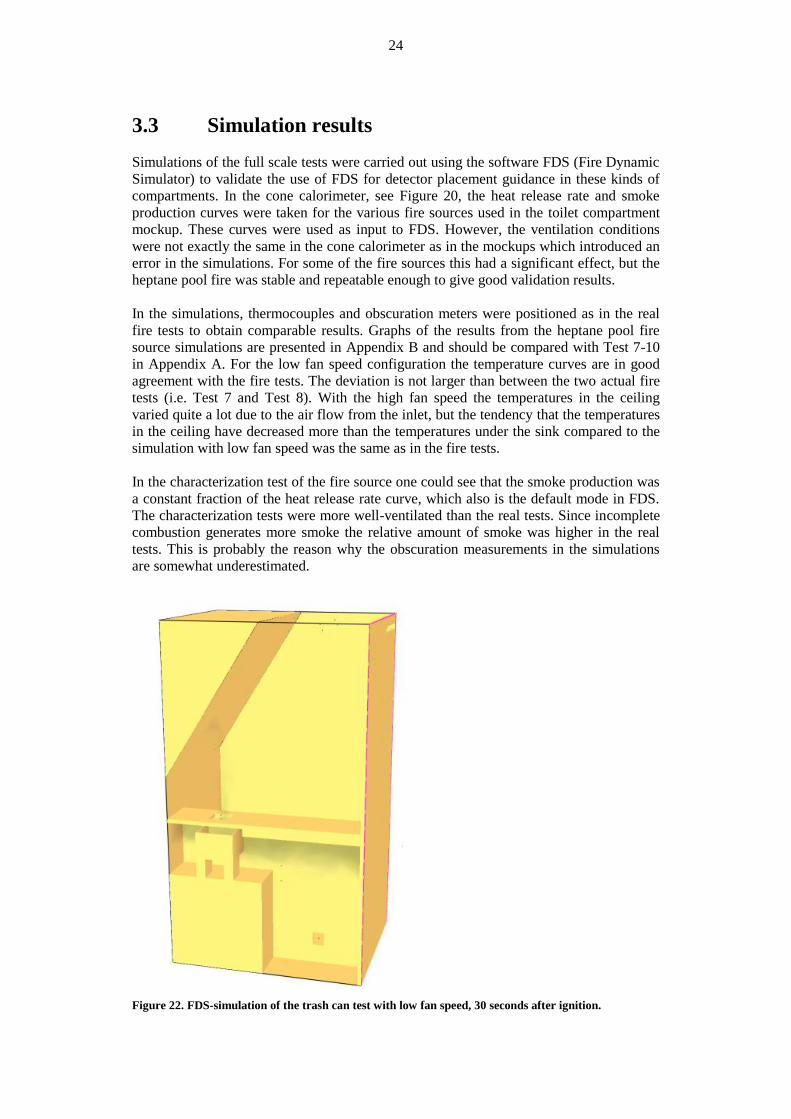
nitrogen oxide (NO) were detected from the mattress. As expected, the concentration of
toxic elements in the fumes followed the smoke obscuration curve, see the normalized
graphs in Figure 21, which means that they may be related to the obscuration
measurements in the sleeping compartment mockup.
The short-term exposure limits set out by the occupational health authority in Sweden
(“Arbetsmiljöverket”) [4], i.e. acceptable levels for 15 minutes exposure, were reached at
about 0.5-3 dB/m smoke obscuration for the mattress fire source. This is the point where
23
most smoke detectors initiate an alarm (including entry delay and processing time of the
detector). At 10 dB/m smoke obscuration, reached in test 15, 16 and 17 after about 1.5-2
minutes from the ignition, high levels of toxic substances were measured: about 5% CO2,
800 ppm CO, 70 ppm HCN, and 250 ppm NO. This is about 5-8 times higher than the
short-term exposure limits and according to the National Institute for Occupational Safety
and Health (NIOSH) these levels are immediately dangerous to life and health. Their
listed IDLH (Immediately Dangerous to Life and Health) values of the mentioned
substances are 4% of CO2, 1200 ppm of CO, 50 ppm of HCN, and 100 ppm of NO [5].
The response times of the detectors in these tests were around 60 seconds, see Table 3,
which do not give much time left for evacuation. However, the response times differ quite
a lot which in this case shows the importance of correct detector type and position.
Figure 20. Characterization of fire source.
Figure 21. Normalized graphs of smoke obscuration and toxic elements in the characterization test,
seen in Figure 20.
24
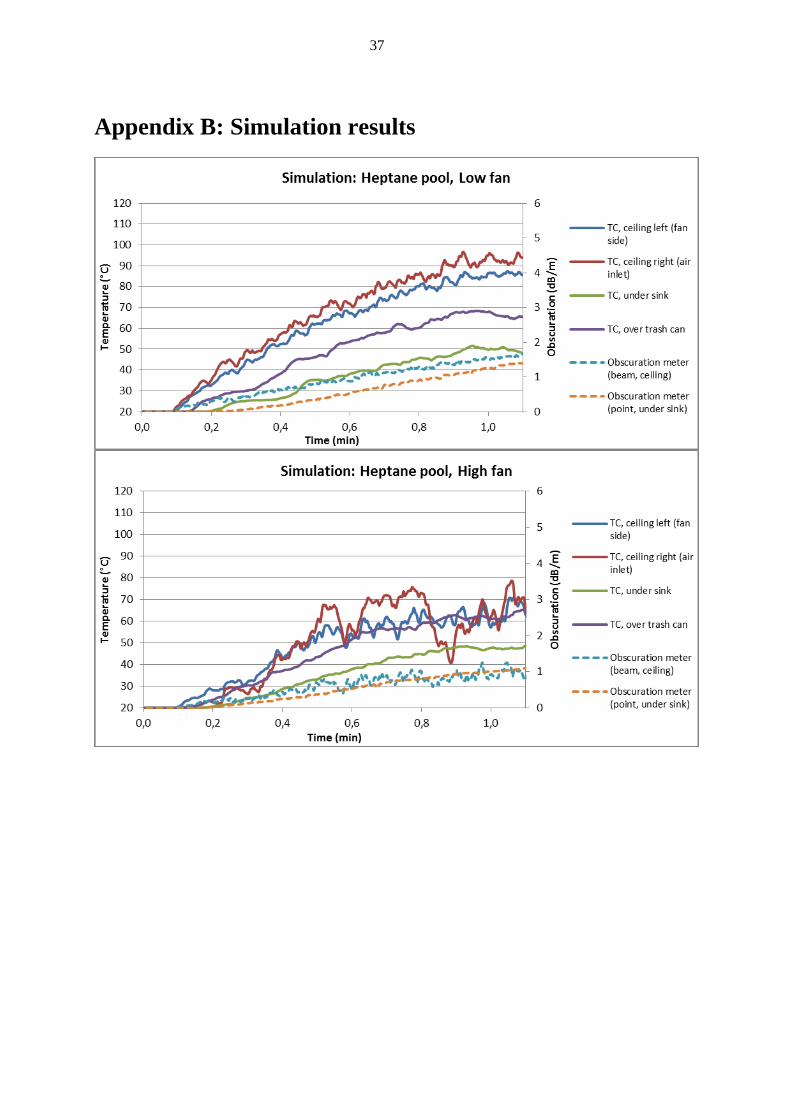
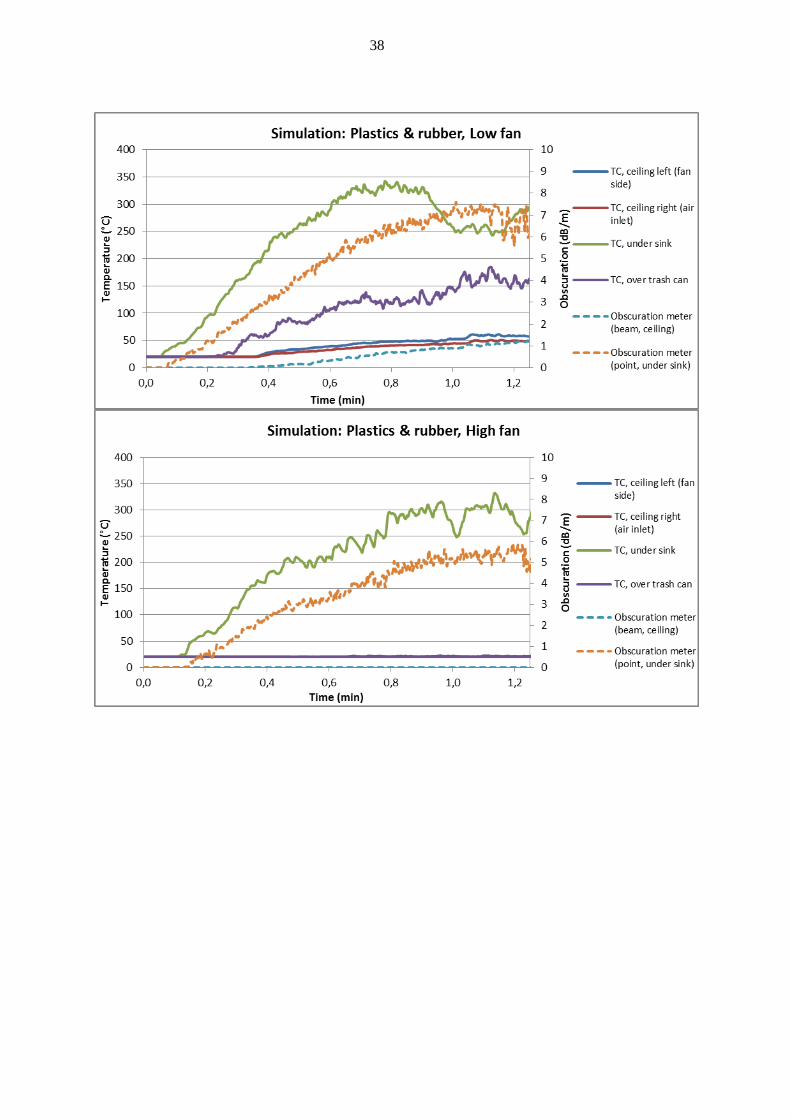
3.3 Simulation results
Simulations of the full scale tests were carried out using the software FDS (Fire Dynamic
Simulator) to validate the use of FDS for detector placement guidance in these kinds of
compartments. In the cone calorimeter, see Figure 20, the heat release rate and smoke
production curves were taken for the various fire sources used in the toilet compartment
mockup. These curves were used as input to FDS. However, the ventilation conditions
were not exactly the same in the cone calorimeter as in the mockups which introduced an
error in the simulations. For some of the fire sources this had a significant effect, but the
heptane pool fire was stable and repeatable enough to give good validation results.
In the simulations, thermocouples and obscuration meters were positioned as in the real
fire tests to obtain comparable results. Graphs of the results from the heptane pool fire
source simulations are presented in Appendix B and should be compared with Test 7-10
in Appendix A. For the low fan speed configuration the temperature curves are in good
agreement with the fire tests. The deviation is not larger than between the two actual fire
tests (i.e. Test 7 and Test 8). With the high fan speed the temperatures in the ceiling
varied quite a lot due to the air flow from the inlet, but the tendency that the temperatures
in the ceiling have decreased more than the temperatures under the sink compared to the
simulation with low fan speed was the same as in the fire tests.
In the characterization test of the fire source one could see that the smoke production was
a constant fraction of the heat release rate curve, which also is the default mode in FDS.
The characterization tests were more well-ventilated than the real tests. Since incomplete
combustion generates more smoke the relative amount of smoke was higher in the real
tests. This is probably the reason why the obscuration measurements in the simulations
are somewhat underestimated.
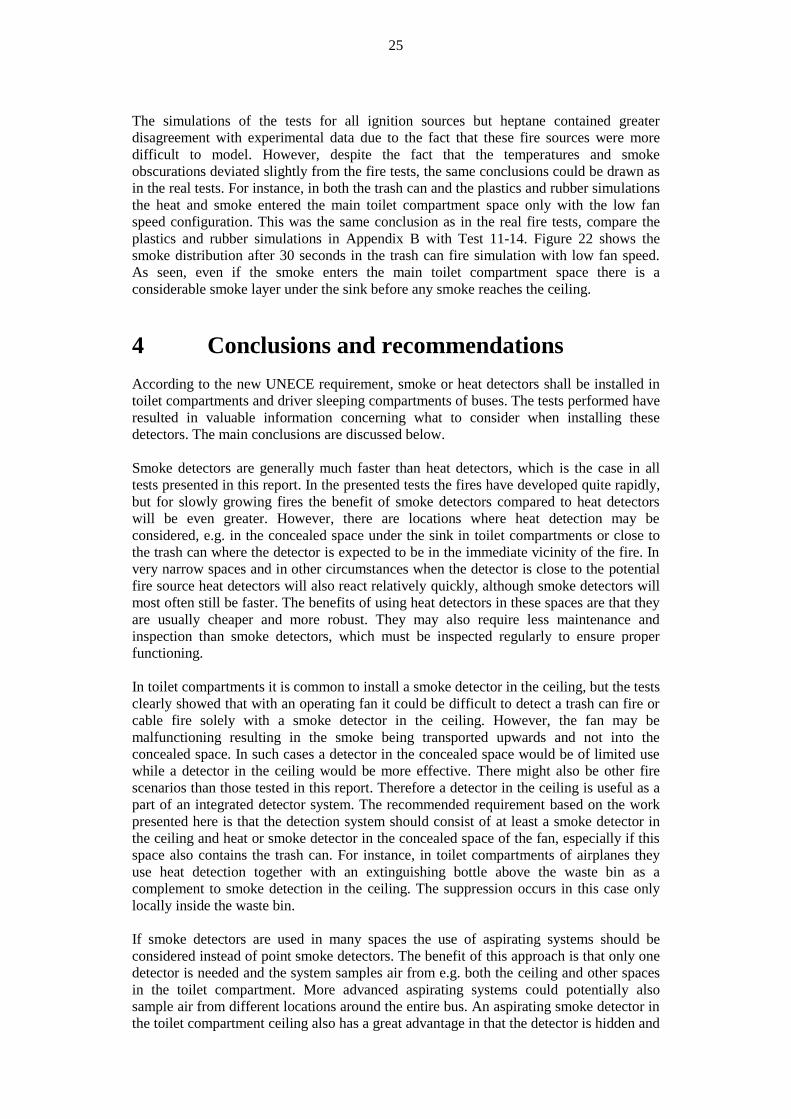
Figure 22. FDS-simulation of the trash can test with low fan speed, 30 seconds after ignition.
25
The simulations of the tests for all ignition sources but heptane contained greater
disagreement with experimental data due to the fact that these fire sources were more
difficult to model. However, despite the fact that the temperatures and smoke
obscurations deviated slightly from the fire tests, the same conclusions could be drawn as
in the real tests. For instance, in both the trash can and the plastics and rubber simulations
the heat and smoke entered the main toilet compartment space only with the low fan
speed configuration. This was the same conclusion as in the real fire tests, compare the
plastics and rubber simulations in Appendix B with Test 11-14. Figure 22 shows the
smoke distribution after 30 seconds in the trash can fire simulation with low fan speed.
As seen, even if the smoke enters the main toilet compartment space there is a
considerable smoke layer under the sink before any smoke reaches the ceiling.
4 Conclusions and recommendations
According to the new UNECE requirement, smoke or heat detectors shall be installed in
toilet compartments and driver sleeping compartments of buses. The tests performed have
resulted in valuable information concerning what to consider when installing these
detectors. The main conclusions are discussed below.
Smoke detectors are generally much faster than heat detectors, which is the case in all
tests presented in this report. In the presented tests the fires have developed quite rapidly,
but for slowly growing fires the benefit of smoke detectors compared to heat detectors
will be even greater. However, there are locations where heat detection may be
considered, e.g. in the concealed space under the sink in toilet compartments or close to
the trash can where the detector is expected to be in the immediate vicinity of the fire. In
very narrow spaces and in other circumstances when the detector is close to the potential
fire source heat detectors will also react relatively quickly, although smoke detectors will
most often still be faster. The benefits of using heat detectors in these spaces are that they
are usually cheaper and more robust. They may also require less maintenance and
inspection than smoke detectors, which must be inspected regularly to ensure proper
functioning.
In toilet compartments it is common to install a smoke detector in the ceiling, but the tests
clearly showed that with an operating fan it could be difficult to detect a trash can fire or
cable fire solely with a smoke detector in the ceiling. However, the fan may be
malfunctioning resulting in the smoke being transported upwards and not into the
concealed space. In such cases a detector in the concealed space would be of limited use
while a detector in the ceiling would be more effective. There might also be other fire
scenarios than those tested in this report. Therefore a detector in the ceiling is useful as a
part of an integrated detector system. The recommended requirement based on the work
presented here is that the detection system should consist of at least a smoke detector in
the ceiling and heat or smoke detector in the concealed space of the fan, especially if this
space also contains the trash can. For instance, in toilet compartments of airplanes they
use heat detection together with an extinguishing bottle above the waste bin as a
complement to smoke detection in the ceiling. The suppression occurs in this case only
locally inside the waste bin.
If smoke detectors are used in many spaces the use of aspirating systems should be
considered instead of point smoke detectors. The benefit of this approach is that only one
detector is needed and the system samples air from e.g. both the ceiling and other spaces
in the toilet compartment. More advanced aspirating systems could potentially also
sample air from different locations around the entire bus. An aspirating smoke detector in
the toilet compartment ceiling also has a great advantage in that the detector is hidden and
26
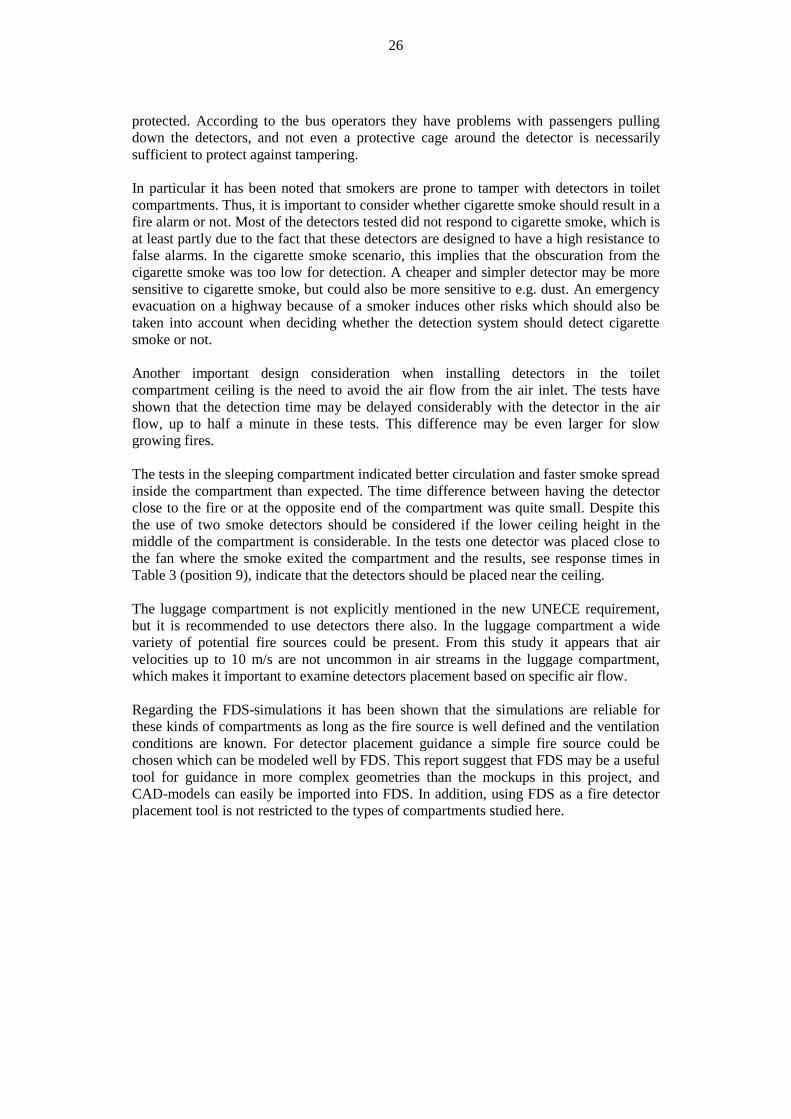
protected. According to the bus operators they have problems with passengers pulling
down the detectors, and not even a protective cage around the detector is necessarily
sufficient to protect against tampering.
In particular it has been noted that smokers are prone to tamper with detectors in toilet
compartments. Thus, it is important to consider whether cigarette smoke should result in a
fire alarm or not. Most of the detectors tested did not respond to cigarette smoke, which is
at least partly due to the fact that these detectors are designed to have a high resistance to
false alarms. In the cigarette smoke scenario, this implies that the obscuration from the
cigarette smoke was too low for detection. A cheaper and simpler detector may be more
sensitive to cigarette smoke, but could also be more sensitive to e.g. dust. An emergency
evacuation on a highway because of a smoker induces other risks which should also be
taken into account when deciding whether the detection system should detect cigarette
smoke or not.
Another important design consideration when installing detectors in the toilet
compartment ceiling is the need to avoid the air flow from the air inlet. The tests have
shown that the detection time may be delayed considerably with the detector in the air
flow, up to half a minute in these tests. This difference may be even larger for slow
growing fires.
The tests in the sleeping compartment indicated better circulation and faster smoke spread
inside the compartment than expected. The time difference between having the detector
close to the fire or at the opposite end of the compartment was quite small. Despite this
the use of two smoke detectors should be considered if the lower ceiling height in the
middle of the compartment is considerable. In the tests one detector was placed close to
the fan where the smoke exited the compartment and the results, see response times in
Table 3 (position 9), indicate that the detectors should be placed near the ceiling.
The luggage compartment is not explicitly mentioned in the new UNECE requirement,
but it is recommended to use detectors there also. In the luggage compartment a wide
variety of potential fire sources could be present. From this study it appears that air
velocities up to 10 m/s are not uncommon in air streams in the luggage compartment,
which makes it important to examine detectors placement based on specific air flow.
Regarding the FDS-simulations it has been shown that the simulations are reliable for
these kinds of compartments as long as the fire source is well defined and the ventilation
conditions are known. For detector placement guidance a simple fire source could be
chosen which can be modeled well by FDS. This report suggest that FDS may be a useful
tool for guidance in more complex geometries than the mockups in this project, and
CAD-models can easily be imported into FDS. In addition, using FDS as a fire detector
placement tool is not restricted to the types of compartments studied here.

27
References
[1] UNECE Regulation No. 107 - Rev. 3 - Amend. 4, "General construction of buses and
coaches," 2012. [Online]. Available:
http://www.unece.org/fileadmin/DAM/trans/main/wp29/wp29regs/R107r3am4e.pdf.
[2] Fire Industry Association (FIA), "Ionisation Chamber Smoke Detectors (ICSD):
Applicable regulations for manufacturing, transport and disposal," 2005.
[3] The International Organization for Standardization (ISO), ISO 5660-1, "Reaction-to-
fire tests - Heat release, smoke production and mass loss rate - Part 1: Heat release
rate (cone calorimeter method)," 2002.
[4] Arbetsmiljöverket, "Kemiska arbetsmiljörisker AFS 2011:19," [Online]. Available:
http://www.av.se/dokument/afs/afs2011_19.pdf. [Accessed 10 March 2014].
[5] National Institute for Occupational Safety and Health (NIOSH), "Documentation for
Immediately Dangerous To Life or Health Concentrations (IDLHs)," 1995. [Online].
Available: http://www.cdc.gov/niosh/idlh/intridl4.html. [Accessed 2 April 2014].
28
Appendix A: Experimental results
29
30
31
32
33
34
35
36
37
Appendix B: Simulation results
38

SP Technical Research Institute of Sweden
Box 857, SE-501 15 BORÅS, SWEDEN
Telephone: +46 10 516 50 00, Telefax: +46 33 13 55 02
E-mail: [email protected], Internet: www.sp.se
www.sp.se
Fire Research
SP Report 2014:28
ISBN 978-91-87461-75-0
ISSN 0284-5172
More information about publications published by SP: www.sp.se/publ
SP Sveriges Tekniska Forskningsinstitut
Vi arbetar med innovation och värdeskapande teknikutveckling. Genom att vi har
Sveriges bredaste och mest kvalificerade resurser för teknisk utvärdering, mätteknik,
forskning och utveckling har vi stor betydelse för näringslivets konkurrenskraft och
hållbara utveckling. Vår forskning sker i nära samarbete med universitet och
högskolor och bland våra cirka 10000 kunder finns allt från nytänkande småföretag
till internationella koncerner.
SP Technical Research Institute of Sweden
Our work is concentrated on innovation and the development of value-adding technology.
Using Sweden's most extensive and advanced resources for technical evaluation,
measurement technology, research and development, we make an important contribution to
the competitiveness and sustainable development of industry. Research is carried out in close
conjunction with universities and institutes of technology, to the benefit of a customer base of
about 10000 organisations, ranging from start-up companies developing new technologies or
new ideas to international groups.