Embed Size (px)
Citation preview

Fire Induced Thermal and Structural Response of the World Trade Center Towers.
KULDEEP PRASAD, ANTHONY HAMINS, THERESE McALLISTER and JOHN GROSS Building and Fire Research Laboratory National Institute of Standards and Technology Gaithersburg, MD 20899, USA.
ABSTRACT
Over the past several years, there has been a resurgence of interest in studying the response of building structures to fires. Simulations of the effects of severe fires on the structural integrity of buildings requires a close coupling between the gas phase energy release and transport phenomena and the stress analysis in the load bearing materials. A methodology has been developed for coupling CFD simulations of fire growth with finite element models for thermal analysis and for using the thermal data to compute the demand-to-capacity ratio in a multi-story structure. A simple radiative transport model that assumes the compartment is divided locally into a hot, soot laden upper layer and a cool, relatively clear lower layer is employed to predict radiative fluxes incident on sub-grid scale structural members. Thermal response coupled with realistic fire simulations of various steel structural components on floors of World Trade Center Tower 1 that were subjected to aircraft impact damage and fires are presented. The thermal response was used to compute the reduction in load carrying capacity of the structural components as a function of time, which ultimately results in global collapse of the towers. KEYWORDS: structural response, modeling, structural design
INTRODUCTION
Following the collapse of the World Trade Center (WTC) towers, there was an active debate in the engineering community on the maximum temperature reached in the steel structure and on the role of the fires in inducing structural collapse. Some speculated that the temperatures were high enough to melt the structural steel. However, the melting point of steel is about 1,500 °C (2,800 °F). Normal building fires and hydrocarbon (e.g., jet fuel) fires generate temperatures up to about 1,100 °C (2,000 °F). NIST reported maximum upper layer air temperatures of about 1,000 °C (1,800 °F) in the WTC towers [1]. Thus, the temperatures in the towers were not sufficient as the fires burned to melt the structural steel.
Quintiere [2] considered the effect of different fireproofing thickness on steel temperature in the floor truss web members of the towers for assumed uniform temperatures. Usmani et al. [3] developed a non-linear finite element analysis of a 2-D model of the WTC tower structural frame and proposed a progressive collapse mechanism due to low membrane capacity of the composite floor system. Choi et al. [4 ]also carried out a 2-D finite element analysis of the behavior of light-weight floor trusses and studied the role of connections. The Usmani and Choi studies were limited to the use of a generalized exponential curve to represent the structural time-temperature relationship and did not include a cooling phase.
Buchanan [5], Bailey et al. [6] and Franssen et al. [7] have made a significant and noteworthy contribution in the general area of structural design for fire safety, although their work is not directly relevant to the fire induced thermal and structural response of WTC 1. Detailed analysis of the WTC towers was difficult due to the complexity associated with the aircraft impact and multi-floor, spatially and temporally evolving fires. There was clearly a need to develop a methodology to predict the thermal response of the structural components coupled to the realistic fires observed on Sept. 11, fires that were ignited by the jet fuel and were subsequently fueled by the furnishings and other combustibles on each floor.
The study by FEMA and ASCE of the collapse of the WTC towers under impact and fire loading [8] identified the importance of conducting detailed analyses of additional structural loads caused by thermal effects. The National Institute of Standards and Technology (NIST) completed a technical investigation [9] into the collapse of the WTC towers in 2005. NIST determined that there was a need for an integrated methodology based on realistic thermal loading. The investigation relied heavily on four major modeling tasks: the initial aircraft impact analysis, the fire dynamic simulations, the thermal analysis of the load bearing structure, and the analysis of the structural response to impact damage and fire effects. The initial
1267FIRE SAFETY SCIENCE–PROCEEDINGS OF THE NINTH INTERNATIONAL SYMPOSIUM, pp. 1267-1278
COPYRIGHT © 2008 INTERNATIONAL ASSOCIATION FOR FIRE SAFETY SCIENCE / DOI:10.3801/IAFSS.FSS.9-1267

impact simulation was provided as input into the subsequent analyses. It partially defined the geometry used for the fire dynamics simulations, provided guidance about the extent of insulation damage, and determined the extent of the structural damage from the aircraft impact. The fire dynamics [10] provided the thermal environment in the gas phase needed to determine the radiative fluxes to the exposed building surfaces. The thermal analysis [11], [12] determined the temperature distribution in the structural components. Finally, the structural analysis [13] integrated all the previous information to analyze the changing force distribution and deflections up to the point of collapse initiation.
The methodology and results presented in this paper were a part of the NIST Investigation [9] into the collapse of the WTC towers. The objective of this paper is to describe the approach used to couple the fire simulations with the thermal and structural response of the building assemblies. The coupling methodology was validated by comparing numerical predictions with data from large scale experiments. Uncertainty analysis on important model parameters was performed. The predicted thermal response of the structural components of floors subjected to fire in WTC 1 is presented. The thermal data was used to compute the reduction in load carrying capacity of the structural components as a function of time. The response of the columns is discussed as an example of the structural response.
FIRE STRUCTURE INTERFACE
The coupling of fire modeling and structural analysis of a burning building is dominated by radiative heat transfer from the gas phase to the structural elements. The radiation field must be determined from solutions of the radiative transport equation, which relates the incident flux to the spatial distribution of temperature and combustion products (particularly the distribution of soot particulates) as well as the enclosure geometry. Such calculations are typically performed as part of a CFD-based simulation of the fire dynamics. However, the ability to couple such codes as the NIST Fire Dynamics Simulator (FDS) [10] directly to a suitable structural analysis code does not yet exist. The enormous differences in spatial and temporal length scales, differences in numerical techniques, and the complexity of the computer codes make the development of an efficient fully coupled analysis of fire-structure interactions a daunting task. In the NIST study, FDS simulations of fire growth and spread on one floor of the WTC tower were performed with a grid spacing of 50 cm (Resolution of the fire simulations is approximately 1-2 m). Typical structural components of the WTC tower such as truss rods had a 2.5 cm diameter and the perimeter columns were 35 cm wide. It is clear that FDS could not resolve the individual structural components, if it was to examine the growth and spread of the fire over the entire floor of a large structure. Since the structural components were not modeled in the FDS simulation, the radiative fluxes to the structural elements were not computed directly. A methodology was needed to predict the radiative fluxes from the hot combustion products to the sub-grid scale structural elements. The approach used for the WTC structural analysis took advantage of the fact that the WTC floor compartments could be divided into a hot, soot laden upper layer and a cool, relatively clear lower layer [11], [12] much like a zone model. The temperature gradients in the horizontal directions were much smaller than those in the vertical direction. The properties of the two layers were taken from suitably chosen temporal and spatial averages of the output generated by FDS. The time averages were chosen to be compatible with the time scales associated with thermal diffusion through the smallest structural members of interest. The spatial averages replaced the detailed vertical temperature and absorption coefficient profiles with an effective “zone model” profile.
The layered thermal and optical properties in the gas phase allow simplification of the radiative transport equations. Length scales in the horizontal directions x were scaled with a length L (typically over 60 meters in the WTC towers), while the grey gas absorption coefficient κ and the length scales in the vertical direction z were scaled with H, the height of an individual floor (less than 4 meters in the WTC towers). Finally, the integrated intensity ),,,( zxzxI ΩΩ was normalized with respect to 4
rTσ , where σ
is the Stefan-Boltzmann constant, ),( zx ΩΩ=Ω denotes the local direction of the radiation field, and rT is a suitable reference temperature. Then, the radiative transport equation takes the form:
( ) ⎟⎟⎠
⎞⎜⎜⎝
⎛−=
∂∂
Ω+∇Ω ITzIILH zxx
~)~(~~~./
4
πκ (1)
1268

where dimensionless quantities are denoted by a tilde, Since the ratio 1/ <<LH , the first term on the left hand side of Eq. 1 can be ignored. The remaining terms are those associated with the problem of radiative transport between plane parallel layers. For this simplified geometry, the radiative transport equation can be solved exactly and explicit formulae for the heat flux were obtained as a function of the temperatures, hot layer depth, soot concentration, as well as the location and orientation of the structural element.
Fig. 1 is a schematic representation of the methodology employed to couple the fire simulations with the thermal and structural response of WTC 1. The methodology is demonstrated for a single floor. The structural and fireproofing damage due to the aircraft impact was incorporated in the various modeling tasks. Fire dynamic simulations were performed for a full floor of the World Trade Center tower, and the left image shows a contour plot of gas phase temperature (maximum gas temperature of 1100 oC is shaded red). Properties of the hot layer were transferred to the thermal finite element model for application of radiative fluxes to the sub-grid scale structural elements (modeled with 3-D solid finite elements). The radiative fluxes served as boundary conditions for the three-dimensional time dependent thermal response of the full floor structural assembly. The thermal analysis (middle image) used the specified fire-proofing thickness for the various structural components and included the effects of damage to the fire-proofing due to the aircraft impact. The computed thermal data (generated from models that are constructed from brick finite-elements) was mapped onto the structural model (constructed from beam and shell finite-elements). The structural models (right image) were used to predict the fire-induced structural response [13].
Fig. 1. Schematic representation of the coupling between the demand-to-capacity ratio analysis to the fire
simulations and the thermal response analysis.
LARGE FIRE LABORATORY EXPERIMENTS
A series of large scale fire experiments was conducted at the NIST Large Fire Laboratory [14] to validate the methodology, as described in the previous section, for determining the thermal loading on various structural components exposed to a large fire in a compartment. The structural components were not externally loaded nor were they constrained for thermal expansion. Sensitivity to changes in various experimentally derived model input parameters was also assessed.
A steel-frame compartment (3.60 m by 7.04 m by 3.82 m high) lined with 25 mm thick calcium silicate board was constructed. Several steel components (two bar-joist trusses, one thin-walled tubular column, and a simple rod) were placed in the compartment. The components were either left bare or had a spray applied fire-resistive material (SFRM) applied in two nominal thicknesses, 17 mm and 34 mm. The coefficient of variation (COV=Standard deviation / Mean Value) of the SFRM thickness ranged from 0.17 to 0.27 for the structural components The fire was generated using liquid hydrocarbon fuels introduced by a two-nozzle spray burner onto a 1 m by 2 m pan (0.1 m deep). The fire sizes tested were between 1.9 MW and 3.4 MW to assure that the structural components were immersed in flames and hot gases. Fuels included heptane and a mixture composed of 60 percent heptane and 40 percent toluene by mass, the latter being representative of fires that yield elevated amounts of soot.
The agreement between the calculated and the measured values of the peak temperature for the various steel components are summarized in Table 1 and Table 2 for the un-insulated and insulated tests, respectively. Each table lists the difference between the peak values of the measured and the simulated steel
1269

surface temperatures normalized by the average of those temperatures, with results listed for the hottest and the coolest temperatures locations for each element. For the un-insulated components (Table 1), the simulated results generally under-predicted the measurements by a small percentage (average difference is 1.7% and 3.3% for the hottest and coolest location, respectively). The difference was attributed to the uncertainty in the heat release rate used in the fire model. For the insulated structural components (Table 2), the numerical predictions also under-predict the measurements. The average difference was 9% and 11 % in the hottest and coolest location, respectively. In general, the difference between measured and predicted response of the steel was larger for the insulated structural components as compared to the un-insulated components. The larger difference for the insulated structural components was attributed primarily to the variability in the SFRM coating thickness. In the large fire experiments the fireproofing was spray applied and its thickness was not uniform. The COV (Coefficient of Variance) for the SFRM thickness in the experiments ranged from 0.17 to 0.27 [14]. Since the exact distribution of the fireproofing thickness on the various structural components could not be determined, the numerical modeling was performed with a mean specified fireproofing thickness. The variability in fireproofing thickness was the primarily reason for observed differences in the measured and predicted steel temperature. The comparison between experimental data and model predictions (especially for the un-insulated structural components) yielded confidence in the analyses of the thermal environment in compartments and provided estimates of the uncertainty in the model simulations.
Table 1. Percentage difference between peak values of the measured and the simulated steel surface temperatures at the hottest and coolest locations on un-insulated components.
Element (Vertical Position) Hottest Location Coolest Location Bar A -10 % 3 % Bar B 8 % -2 % Column (2.13 m above floor) 2 % -2 % Column (3.69 m above floor) -3 % -6 % Truss A (2.89 m above floor) -4 % 2 % Truss A (3.29 m above floor) -6 % -8 % Truss A (3.70 m above floor) 1 % -10 %
Average -1.7 % -3.3 %
Table 2. Percentage difference between peak values of the measured and the simulated steel temperatures for the hottest and coolest locations for components with SFRM.
Element Hottest Location Coolest Location Bar a 8 % 3 % Column (0.77 m above floor) -20 % 3 % Column (2.13 m above floor) -11 % -13 % Column (3.69 m above floor) -30 % 25 % Truss A (2.89 m above floor) 15 % -15 % Truss A (3.29 m above floor) -15 % -33 % Truss A (3.70 m above floor) -10 % -30 %
Average -9 % -11 % a. Only one bar was used in Test 5.
1270

FIRE INDUCED RESPONSE OF WORLD TRADE CENTER TOWER 1
During the course of the investigation, hundreds of preliminary calculations were performed to study the thermal response of individual structural components and full floor systems coupled with realistic fire simulations [12]. The preliminary studies, photographic and visual evidence, and published literature helped guide the development of global models. This section describes an application of the Fire-Structure Interface methodology described earlier to predict the global thermal response of WTC 1 for a specific set of aircraft impact damage and fire dynamics simulations.
Thermal Response of Perimeter Columns
Fig. 2 shows the thermal response of the perimeter columns that form the exterior walls of the North Tower at 6000 s after the aircraft impact. The fire induced thermal analysis for WTC 1 covered eight floors ranging from floors 92 through 99. Each perimeter column was modeled as a three-dimensional box-shaped column with brick finite elements (see Fig. 2 inset). Steel (cyan colored elements) was covered with 2.2 cm of vermiculite plaster on the interior faces (pink colored elements) and 3.0 cm of Blazeshield Cafco D C/F spray-on fireproofing (violet colored elements) on the exterior faces. The perimeter columns were connected by a spandrel plate (see Fig. 2 inset). The fireproofing thickness on the spandrel plate was relatively small (1.3 cm) which can result in rapid heating of the spandrel plate and gradual heat conduction into the column.
Fig. 2. Computed fire induced thermal response of perimeter columns on floors 92-99, WTC 1, at 6000 s after the aircraft impact. Figures inset on the right show the finite element model for the box shaped
perimeter column, including the construction of the spandrel plates and fireproofing.
1271

There were no significant fires observed on floors below floor 92 and above floor 99. The aircraft impact on the North face of WTC 1 severed several perimeter columns and these columns were not included in the analysis. The fireproofing on the interior faces of some columns on the South face were damaged due to the debris field (created by the aircraft impact) moving through the various floors. The thermal response of the perimeter column is governed by the status of the fireproofing (damaged or un-damaged), duration and intensity of the fire in the vicinity of the column and the size and shape of the columns. For the perimeter columns with no damage to fireproofing, the thermal response is governed by the smallest fireproofing thickness found on the spandrel plate. The columns with the damaged fireproofing heated quickly and had significantly higher temperatures (>600 oC) than the columns with intact fireproofing, which had moderate temperatures in the 200-300 oC range. The box shaped perimeter columns are heated by the fires on the inside face, while the three external faces were exposed to ambient temperature. Heating of the perimeter column from one side only and convective cooling on the other three sides, results in a temperature gradient through the cross-section of the column (approximately 10-20 oC/in). The heating of the perimeter column can degrade its material properties. At the same time, thermally induced stresses can result in bowing of the column and can further reduce the load carrying capacity of the columns [12], [13].
Thermal Response of Floor Trusses, Concrete Slabs and Core Columns
Fig. 3 shows the thermal response of the floor trusses and core beams that supported the 96th floor concrete slab at 6000 s after the aircraft impact. The figure also includes the perimeter and core columns for one floor above and below the concrete slab. Portion of the floor that was damaged due to the impact of the aircraft is not shown in the figure. The concrete slab has not been included in the figure to help visualize the floor trusses and beams, but is included in the overall analysis. The thermal response includes input from the fire simulations and the structural and fireproofing damage due to aircraft impact. The figures inset on the right show a finite element model of the floor truss. Cyan colored elements have material attributes of steel while violet colored elements have material attributes of fireproofing. Based on measurements of fireproofing thickness, the equivalent uniform fireproofing thickness on the trusses in WTC 1 was estimated to be 5.6 cm. The thermal response of the floor trusses is governed by the status of the fireproofing (damaged or un-damaged) as well as the intensity and duration of fires in the immediate vicinity. Numerical simulations indicated that truss elements that have intact fireproofing do not heat up appreciably and their temperature is less than 100 oC. Steel truss elements with locally damaged fireproofing heated up very rapidly and had temperatures in the 1000 oC to 1100 oC range (depending on fire location and intensity).
Fig. 3 also shows the thermal response of the core columns as well as the core beams that support the 96th floor concrete slab. The fireproofing thickness of the core beams was less than that for the floor truss, but they have a larger thermal mass and as a result their thermal response is significantly different from that of the trusses. The response of the core columns was also quite different from that for the perimeter columns. The core columns are subjected to a fire environment from all four sides while the perimeter columns were heated from one side only. The thermal response of the core columns is dependent on fire intensity, status of the fireproofin as well as the size and shape of the column.
Fig. 4 (left sub-figure) shows the computed time-temperature response for eight of the core column (501-508). These columns are located closest to the North Face of WTC 1. Each plot shows the maximum temperature of the steel of the columns between floor 97 and floor 98. Each of the columns has a different shape and size, [15]and the fire intensity in the vicinity of these columns changes with time. It should be noted that the predicted time-temperature profiles has no relation to the profile that one would obtain if the column was subjected to an ASTM E-119 furnace test. Fig. 4 (right sub-figure)shows a similar time-temperature response at four locations on the steel truss. The floor truss supports the 96th floor of WTC 1. The time-temperature curve at any location on the steel trusses is highly variable and again bears no relation to the profile that one would obtain if the structural component was subjected to an ASTM E119 time-temperature curve[3]. Since the predicted thermal response varies significantly from one location to another, the structural response of the floor system will also be significantly different from that measured in a standard furnace test.
1272

Fig. 3. Computed fire induced thermal response of floor trusses and core beams supporting the concrete
slab on the 96th floor of the North Tower at 6000 s after aircraft impact. Figure inset on the right shows the finite element model for the floor trusses.
The floor trusses and core beams support the concrete slab on each floor of WTC 1. The concrete slab was 11.0 cm thick on the floors of interest and was heated by fires on two sides. The concrete slab on the 96th floor was heated by fires on the 96th floor from the top and by fires on the 95th floor at the bottom. Thermal response of the concrete slab (computed using 16 elements through its depth) showed significant temperature gradients through the slab thickness. The concrete slab was radiatively and convectively heated on the top and bottom faces, which resulted in very high surface temperatures but lower temperatures in the middle layers. The severe temperature gradients cause differential thermal expansion and out-of-plane bending in the concrete slab [9]. The temperatures in the concrete slab respond more slowly to the spatially and temporally evolving fires as compared to the lighter floor trusses.
1273

Fig. 4. Numerically simulated time-temperature response of the core columns 501-508 (left sub-figure). The left sub-figure shows the maximum temperature (steel) of the core columns 501-508 between floor 97
and floor 98 in WTC1. The right sub-figure shows the response of the steel truss that supports the 96th floor, WTC 1.
Structural Response to Elevated Temperatures
The core columns in the towers carried approximately one half of the building gravity loads. Core column instability can be caused by overload or by a reduction in the column strength. The NIST aircraft impact analysis estimated that nine of the core columns in WTC 1 were severed or severely damaged and fireproofing was stripped from approximately 40 percent to 50 percent of the 47 core columns on four floors. WTC 1 fireproofing damage from the aircraft impact was centered on the north face and extended through the core into the south floor area between Floors 94 to 98. The gravity loads in the severed or severely damaged columns were redistributed either to adjacent core columns or to the exterior columns through the hat truss. The global analysis results showed that WTC 1 did not collapse following aircraft impact, as was observed, and had considerable reserve capacity. The core columns were loaded to approximately 50 percent of their capacity prior to impact.
(a) before aircraft impact.
0.41 0.38 0.37 0.42 0.43 0.38 0.38 0.42
0.63 0.51 0.50 0.52 0.50 0.48 0.52 0.61
0.43 0.47 0.48 0.56 0.61 0.50 0.48 0.38
0.42 0.48 0.36 0.60 0.51 0.48 0.50
0.60 0.52 0.46 0.57 0.56 0.53 0.53 0.62
0.41 0.48 0.44 0.45 0.47 0.49 0.48 0.41
N
1274

(b) after aircraft impact
Fig. 5. Maximum demand-to-capacity ratio for axial loads in WTC 1 core columns between floor 93 and floor 98, shown with and without aircraft impact damage.
Only two columns adjacent to severed or heavily damaged core columns had a demand-to-capacity (D/C) ratio greater than 1.0, as shown in Fig. 4. The capacity of the columns was computed as the plastic (or inelastic) buckling load according the American Institute of Steel Construction (AISC) Load and Resistance Factor Design (LRFD) Specification procedures [15] using an effective length factor of K=1.0 and a resistance factor of φ=1.0 . Ratios less than 1.0 indicate that the column can carry additional gravity loads, whereas ratios greater than 1.0 indicate that the column is carrying more than its computed capacity and, therefore, has plastic strains. While the two columns with a D/C greater than 1.0 may have been close to buckling (there is some uncertainty in calculating the failure load for column buckling), the core subsystem was stable and had a substantial reserve capacity at this stage.
The fires that followed the aircraft impact heated the columns with damaged fireproofing. A column with elevated temperatures had a reduced load capacity, which depended on the temperature of the column. To analyze the effect of the elevated temperatures on the column capacity and the overall structural stability of the building, temperature histories were applied to each node that was subject to heating. The nodal temperatures were calculated from the thermal analysis. The finite element model for the thermal analysis used solid elements an element length on the order of inches (or centimeters); the structural finite element models used beam and shell elements with an element length on the order of feet (or decimeters). The difference in meshing and nodal locations required a translator to be developed, which was described in the previous section. A linear temperature gradient was assumed across the cross sections and along the length of column members. The temperature data were input as piecewise linear time histories. Examination of temperature histories in the thermal analysis indicated that no significant fluctuations occurred for 10 min interval periods (i.e., the time history was well represented by data points at 10 min increments). Thus, 10 min intervals for temperature data input were selected for the structural analysis. A temperature state for all structural components was input at a given time and temperatures were linearly ramped to the next temperature state 10 min later. Temperature data were provided up to 100 min for WTC 1.
Structural steel mechanical properties, such as yield strength, tensile strength, and the modulus of elasticity, are temperature dependent and decrease with increasing temperature. For example, at temperatures of about 300 oC, the yield strength is reduced by about 20 percent. At temperatures above 600 oC, the yield strength is reduced by about 60 percent [9]. As discussed earlier, the temperature of the columns strongly depends on the condition of the fireproofing, the fire intensity in the vicinity of the column, and the shape and size of the columns (see Fig. 2 and Fig. 3).
0.45 0.60 0.58 0.49
0.69 0.64 0.95 1.20 0.93 0.63 0.66
0.48 0.51 0.59 0.67 0.55 0.41
0.44 0.51 0.44 1.15 0.50 0.53
0.60 0.52 0.48 0.78 0.53 0.52 0.64
0.38 0.45 0.41 0.46 0.45 0.45 0.44 0.39
N
Severed or highly damaged columns
1275
Column Inelastic Buckling Capacity vs Length and Temperature
0
0.2
0.4
0.6
0.8
1
1.2
0 1 2 3 4 5 6 7 8 9
Column length (stories)
Pcr /
Py 20 C
200 C400 C600 C
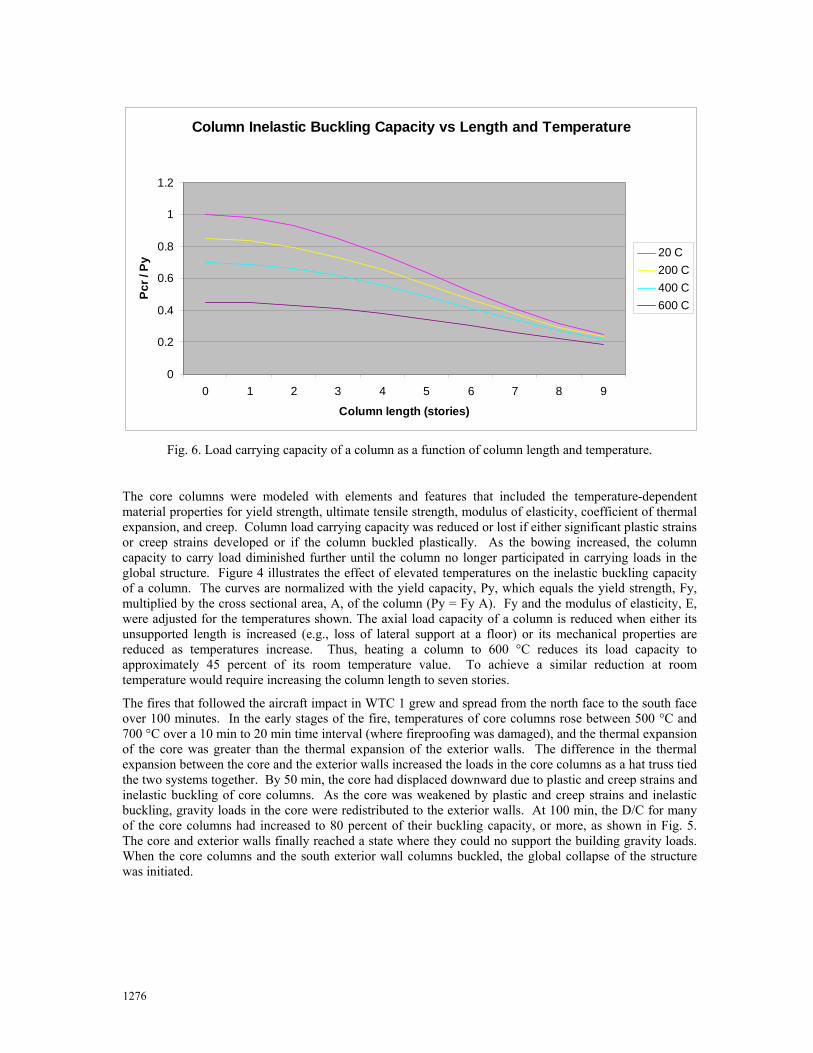
Fig. 6. Load carrying capacity of a column as a function of column length and temperature.
The core columns were modeled with elements and features that included the temperature-dependent material properties for yield strength, ultimate tensile strength, modulus of elasticity, coefficient of thermal expansion, and creep. Column load carrying capacity was reduced or lost if either significant plastic strains or creep strains developed or if the column buckled plastically. As the bowing increased, the column capacity to carry load diminished further until the column no longer participated in carrying loads in the global structure. Figure 4 illustrates the effect of elevated temperatures on the inelastic buckling capacity of a column. The curves are normalized with the yield capacity, Py, which equals the yield strength, Fy, multiplied by the cross sectional area, A, of the column (Py = Fy A). Fy and the modulus of elasticity, E, were adjusted for the temperatures shown. The axial load capacity of a column is reduced when either its unsupported length is increased (e.g., loss of lateral support at a floor) or its mechanical properties are reduced as temperatures increase. Thus, heating a column to 600 °C reduces its load capacity to approximately 45 percent of its room temperature value. To achieve a similar reduction at room temperature would require increasing the column length to seven stories.
The fires that followed the aircraft impact in WTC 1 grew and spread from the north face to the south face over 100 minutes. In the early stages of the fire, temperatures of core columns rose between 500 °C and 700 °C over a 10 min to 20 min time interval (where fireproofing was damaged), and the thermal expansion of the core was greater than the thermal expansion of the exterior walls. The difference in the thermal expansion between the core and the exterior walls increased the loads in the core columns as a hat truss tied the two systems together. By 50 min, the core had displaced downward due to plastic and creep strains and inelastic buckling of core columns. As the core was weakened by plastic and creep strains and inelastic buckling, gravity loads in the core were redistributed to the exterior walls. At 100 min, the D/C for many of the core columns had increased to 80 percent of their buckling capacity, or more, as shown in Fig. 5. The core and exterior walls finally reached a state where they could no support the building gravity loads. When the core columns and the south exterior wall columns buckled, the global collapse of the structure was initiated.
1276
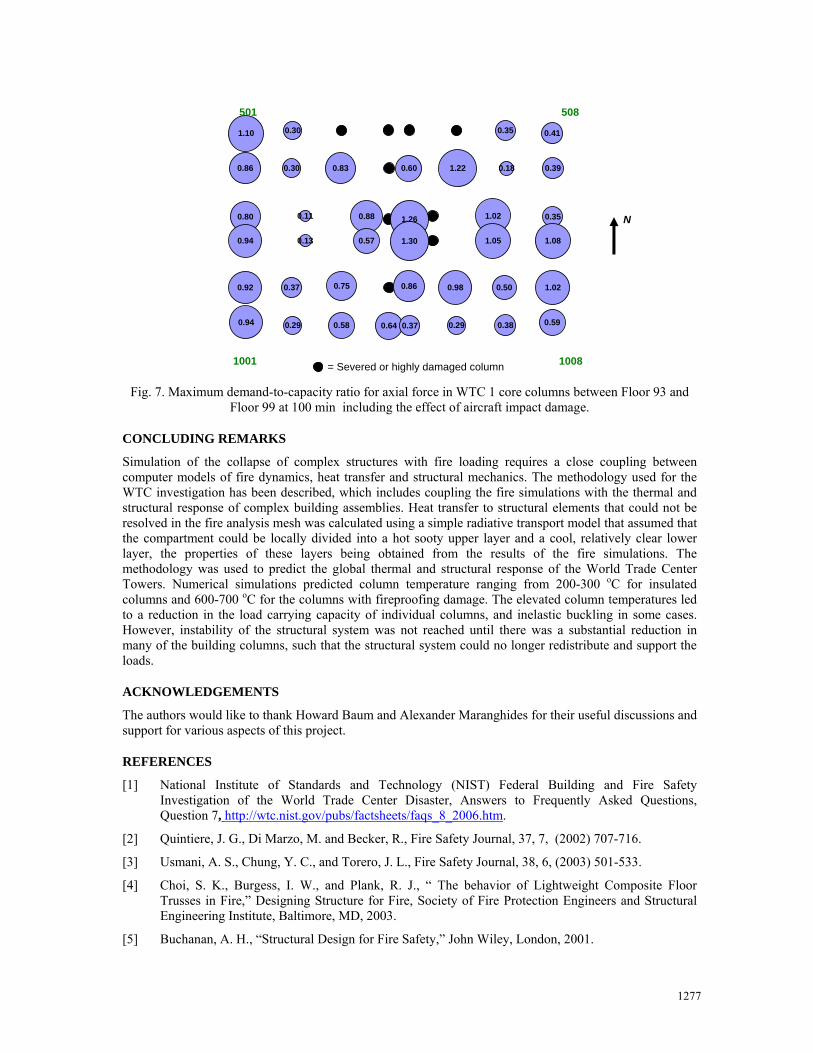
Fig. 7. Maximum demand-to-capacity ratio for axial force in WTC 1 core columns between Floor 93 and
Floor 99 at 100 min including the effect of aircraft impact damage.
CONCLUDING REMARKS
Simulation of the collapse of complex structures with fire loading requires a close coupling between computer models of fire dynamics, heat transfer and structural mechanics. The methodology used for the WTC investigation has been described, which includes coupling the fire simulations with the thermal and structural response of complex building assemblies. Heat transfer to structural elements that could not be resolved in the fire analysis mesh was calculated using a simple radiative transport model that assumed that the compartment could be locally divided into a hot sooty upper layer and a cool, relatively clear lower layer, the properties of these layers being obtained from the results of the fire simulations. The methodology was used to predict the global thermal and structural response of the World Trade Center Towers. Numerical simulations predicted column temperature ranging from 200-300 oC for insulated columns and 600-700 oC for the columns with fireproofing damage. The elevated column temperatures led to a reduction in the load carrying capacity of individual columns, and inelastic buckling in some cases. However, instability of the structural system was not reached until there was a substantial reduction in many of the building columns, such that the structural system could no longer redistribute and support the loads.
ACKNOWLEDGEMENTS
The authors would like to thank Howard Baum and Alexander Maranghides for their useful discussions and support for various aspects of this project.
REFERENCES
[1] National Institute of Standards and Technology (NIST) Federal Building and Fire Safety Investigation of the World Trade Center Disaster, Answers to Frequently Asked Questions, Question 7, http://wtc.nist.gov/pubs/factsheets/faqs_8_2006.htm.
[2] Quintiere, J. G., Di Marzo, M. and Becker, R., Fire Safety Journal, 37, 7, (2002) 707-716.
[3] Usmani, A. S., Chung, Y. C., and Torero, J. L., Fire Safety Journal, 38, 6, (2003) 501-533.
[4] Choi, S. K., Burgess, I. W., and Plank, R. J., “ The behavior of Lightweight Composite Floor Trusses in Fire,” Designing Structure for Fire, Society of Fire Protection Engineers and Structural Engineering Institute, Baltimore, MD, 2003.
[5] Buchanan, A. H., “Structural Design for Fire Safety,” John Wiley, London, 2001.
1.10 0.30 0.35 0.41
0.86 0.30 0.83 0.60 1.22 0.18 0.39
0.80 0.11 0.88 1.26 1.02 0.35
0.94 0.13 0.57 1.30 1.05 1.08
0.92 0.37 0.75 0.86 0.98 0.50 1.02
0.94 0.29 0.58 0.64 0.37 0.29 0.38 0.59
N
501 508
1008 1001 = Severed or highly damaged column
1277

[6] Bailey, C. G., and Moore, D. B., The Structural Engineer, London, 78, 11, (2000) 19-27.
[7] Franssen, J. M., Kodur, V.K.R and Mason, J., “User’s Manual for SAFIR 2002-A Computer Program for Analysis of Structures Submitted to the Fire,” University of Liege, Belgium, 2000.
[8] McAllister, T.P., ed., World Trade Center Building Performance Study: Data Collection, preliminary observations and recommendations, Technical report FEMA 403, Federal Emergency Management Agency, (2002).
[9] NIST (National Institute of Standards and Technology). 2005. Federal Building and Fire Safety Investigation of the World Trade Center Disaster: Final Report of the National Construction Safety Team on the Collapses of the World Trade Center Towers. NIST NCSTAR 1. Gaithersburg, MD, September, http://wtc.nist.gov/NISTNCSTAR1CollapseofTowers.pdf.
[10] McGrattan, K. B., Baum H. R., Rehm, R. G., Hamins, A., Forney, G. P., Floyd, J. E., Hostikka, S., and Prasad, K., “Fire Dynamics Simulator (Version 3) – Technical Reference Guide” National Institute of Standards and Technology Report NISTIR 6783, (2002).
[11] Prasad, K. and Baum, H. R., Proc. Combust. Inst., 30 (2005) 2255-2262, doi:10.1016/j.proci.2004.08.118
[12] Prasad, K. R., and H. R. Baum. 2005. Federal Building and Fire Safety Investigation of the World Trade Center Disaster: Fire Structure Interface and Thermal Response of the World Trade Center Towers. NIST NCSTAR 1-5G. National Institute of Standards and Technology. Gaithersburg, MD, September, http://wtc.nist.gov/NISTNCSTAR1-5G.pdf.
[13] Gross, J. L., and T. McAllister. 2005. Federal Building and Fire Safety Investigation of the World Trade Center Disaster: Structural Fire Response and Probable Collapse Sequence of the World Trade Center Towers. NIST NCSTAR 1-6. National Institute of Standards and Technology. Gaithersburg, MD, September, http://wtc.nist.gov/NISTNCSTAR1-6.pdf.
[14] Hamins, A., A. Maranghides, K. B. McGrattan, E. Johnsson, T. J. Ohlemiller, M. Donnelly, J. Yang, G. Mulholland, K. R. Prasad, S. Kukuck, R. Anleitner and T. McAllister. 2005. Federal Building and Fire Safety Investigation of the World Trade Center Disaster: Experiments and Modeling of Structural Steel Elements Exposed to Fire. NIST NCSTAR 1-5B. National Institute of Standards and Technology. Gaithersburg, MD, September, http://wtc.nist.gov/NISTNCSTAR1-5B.pdf.
[15] American Institute of Steel Construction (AISC) Steel Construction Manual, 13th Edition, 2005.
1278