Embed Size (px)
Citation preview

FIREARMS AND AMMUNITION INDUSTRY
ECONOMIC IMP ACTREPORT | 2019
THE FIREARMS INDUSTRY TRADE ASSOCIATION | NSSF.ORG |
Who is the National Shooting Sports Foundation?
The National Shooting Sports Foundation (NSSF) is the
trade association for the firearms industry. Its mission is to promote, protect and preserve hunting and the shooting sports. Formed in 1961, NSSF has a membership of about 10,000 manufacturers, distributors, firearms retailers, shooting ranges, sportsmen’s organizations and publishers. For more than 200 years, America’s firearms and ammunition industry has made products that have been part of our country’s tradition of freedom, self-reliance and enjoyment of the outdoors.
NSSF has led the way in promoting responsible ownership of firearms. NSSF concentrates its efforts on measurably advancing
participation in and understanding of hunting and the shooting sports; reaffirming and strengthening our members’ commitment to the safe and responsible use of their
products, and promoting a political climate supportive of America’s traditional firearms rights. NSSF’s expanding government relations program responds to the ever-changing political environment that threatens the lawful commerce in our industry’s products, the future of hunting, recreational shooting and our firearms freedoms. NSSF works on both state and federal issues, along with working with many state and federal regulatory agencies, to protect the firearms industry and make sure their business interests are appropriately represented.
This report details the significant economic impact
the firearms and ammunition industry has on the nation’s and each state’s economy. The economic growth America’s firearms and ammunition industry has experienced in recent years has been nothing short
of remarkable. Over the past decade, the industry’s growth has been driven by an unprecedented number of Americans choosing to exercise their fundamental right to keep and bear arms and purchase a firearm and ammunition. NSSF, representing America’s firearms and ammunition
manufacturers, takes great pride in supporting wildlife conservation efforts. Noted in the economic impact report is the significant taxes paid by our industry to federal and state governments and the Pittman-Robertson excise tax the industry pays on the products it sells – this tax is the major source of wildlife conservation funding in America. Regardless of economic conditions across the country, our industry has grown and created about 146,000 new, well-paying jobs over the past decade. Our industry is proud to be one of the bright spots in this economy. Take a look for yourself and see the impact we have nationally and on your home state. (See center spread.)
The Firearms and Ammunition Industry Economic Impact Report
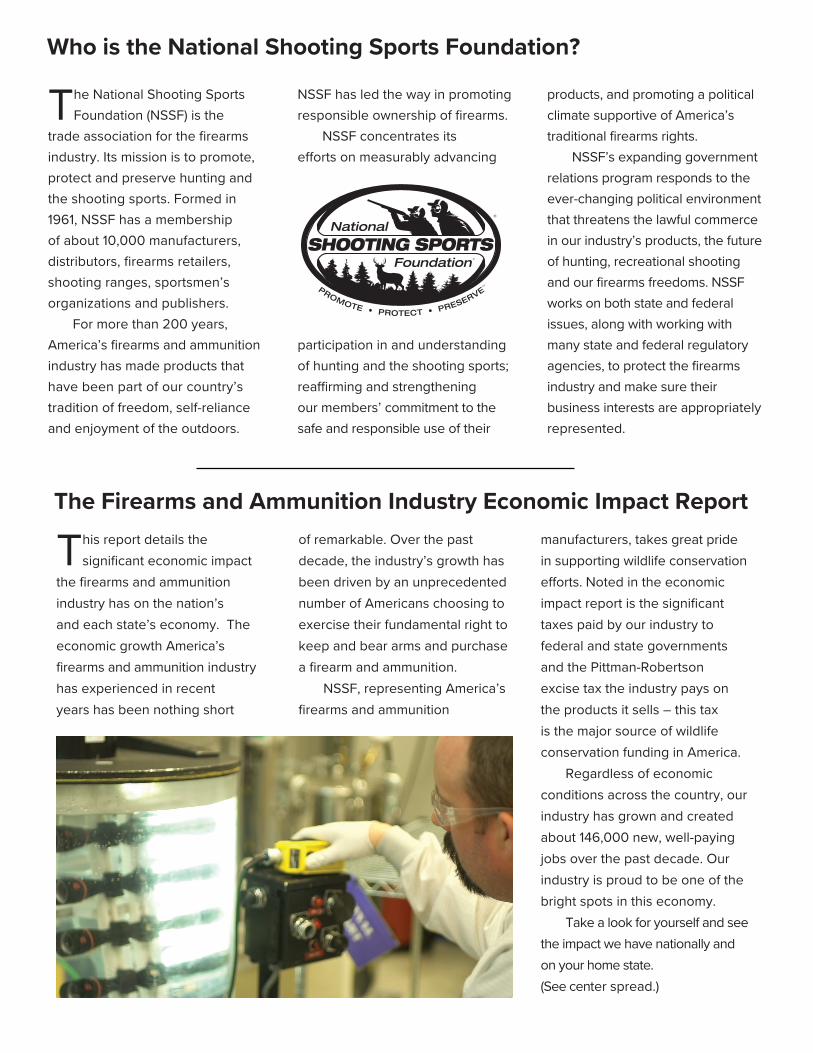
THE FIREARMS INDUSTRY CREATES JOBS IN AMERICA
United States companies that manufacture, distribute, and sell sporting firearms,ammunition, and supplies are an important part of the country’s economy. Manufacturers of firearms, ammunition, and supplies, along with the companies that sell and distribute these products, provide well paying jobs in America and pay significant amounts in tax to the state and Federal governments.
1 John Dunham & Associates, New York, December 2018. Direct impacts include those jobs in firearms and ammunition manufacturers, as well as companies that manufacture products such as ammunition holders and magazines, cases, decoys, game calls, holsters, hunting equipment, scopes, clay pigeons and targets. Direct impacts also include those resulting from the wholesale distribution and retailing of these products.
2 The Bureau of Labor Statistics. Available online at: www.bls.gov/lau/home.htm. Data for November-18 .3 This is in addition to over $653.76 million in federal excise taxes.
Source: John Dunham and Associates, Inc.New York, New York 2017
Economic Impact of the Sporting Arms and Ammunition Industry in the United States
Direct Supplier Induced Total
Jobs (FTE) 149,146 62,827 100,018 311,991
Wages $6,227,108,200 $4,342,966,200 $5,161,711,300 $15,731,785,700
Economic Impact $21,361,163,600 $14,320,977,800 $16,405,365,000 $52,087,506,400
The Firearms & Ammunition Industry is an Important Part of America’s EconomyCompanies in the United States that manufacture, distribute, and sell firearms, ammunition, and hunting equipment employ as many as 149,146 people in the country and generate an additional 162,845 jobs in supplier and ancillary industries. These include jobs in supplying goods and services to manufacturers, distributors, and retailers, and those that depend on sales to workers in the firearms and ammunition industry.1
These are good jobs paying an average of $50,400 in wages and benefits. And today,every job is important. The United States currently has an unemployment rate of 3.77percent. This means that there are already 6,132,000 people trying to find jobs in the nation and collecting unemployment benefits.2
The Economic Benefit of the Industry Spreads Throughout the CountryNot only does the manufacture and sale of firearms and hunting supplies create good jobs in the United States, but the industry also contributes to the economy as a whole. In fact, in 2018 the firearms and ammunition industry was responsible for as much as $52.09 billion in total economic activity in the country.
The broader economic impact flows throughout the economy, generating business for firms seemingly unrelated to firearms. Real people, with real jobs, working in industries as varied as banking, retail, accounting, metal working, even in printing, all depend on the firearms and ammunition industry for their livelihood.
The Country Also Benefits From the Taxes Paid By The IndustryNot only does the industry create jobs, it also generates sizeable tax revenues. In the United States, the industryand its employees pay over $6.82 billion in taxes including property, income, and sales based levies.3
Tax Impact Business Taxes Excise TaxesFederal Taxes $3,965,700,800 $653,764,800
State Taxes $2,855,813,500Total Taxes $6,821,514,300 $653,764,800
Taxes Generated in the United States
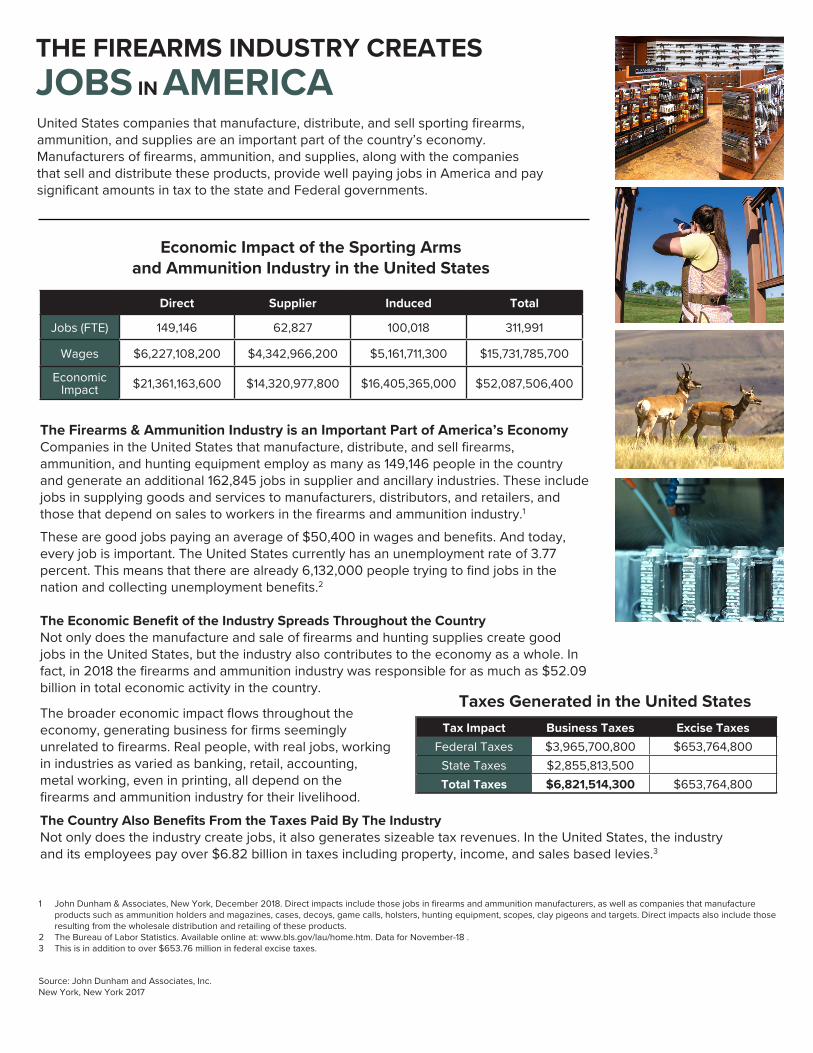
ECONOMIC CONTRIBUTION OF ARMS AND AMMUNITION INDUSTRIES, 2018
Source: John Dunham and Associates, Inc.New York, New York 2017
Jobs Wages Output Jobs Wages Output Jobs Wages Output Jobs
Alabama 3,105 $109,636,200 $384,359,200 1,137 $64,133,300 $240,912,100 1,628 $69,077,900 $249,073,000 5,870Alaska 717 $20,023,200 $45,430,900 197 $10,700,600 $36,316,100 241 $12,724,400 $40,154,600 1,155Arizona 3,476 $180,699,200 $643,856,700 1,635 $108,168,000 $353,318,100 2,932 $138,687,100 $428,734,800 8,043Arkansas 3,101 $127,077,000 $640,237,000 1,408 $78,964,100 $313,450,300 1,946 $78,840,800 $278,411,700 6,455California 9,196 $419,042,200 $1,185,500,300 4,056 $331,934,200 $1,032,530,300 6,910 $430,413,100 $1,316,689,500 20,162Colorado 2,471 $90,281,000 $273,144,800 1,109 $78,764,200 $244,616,200 1,604 $83,610,200 $250,997,500 5,184Connecticut 2,289 $172,328,300 $597,457,600 972 $96,066,700 $256,595,200 2,216 $145,529,800 $369,334,100 5,477District of Columbia 4 $117,800 $276,600 6 $819,000 $2,431,400 6 $435,800 $1,171,400 16Delaware 163 $3,935,300 $8,630,300 58 $4,107,400 $14,465,800 72 $4,066,300 $16,674,300 293Florida 7,107 $265,748,000 $1,036,599,600 3,528 $213,474,900 $777,254,000 5,056 $234,973,600 $746,876,400 15,691Georgia 4,519 $163,820,400 $684,618,900 1,940 $128,475,100 $439,534,400 2,915 $140,206,600 $475,158,300 9,374Hawaii 178 $5,966,100 $14,753,900 60 $2,970,400 $12,006,600 90 $4,193,200 $15,097,800 328Idaho 3,610 $147,785,900 $581,482,600 1,611 $83,098,900 $323,545,100 2,215 $88,876,800 $290,508,200 7,436Illinois 5,286 $305,673,000 $1,104,282,600 2,751 $212,471,000 $664,539,600 5,149 $285,586,900 $883,866,200 13,186Indiana 3,037 $78,166,900 $212,649,900 962 $65,969,300 $224,519,100 1,431 $71,725,300 $279,660,500 5,430Iowa 1,171 $31,958,200 $84,556,900 385 $24,223,700 $87,116,300 587 $28,246,900 $120,050,100 2,143Kansas 2,713 $74,149,500 $282,072,200 1,053 $63,262,300 $221,155,800 1,249 $56,935,600 $203,996,400 5,015Kentucky 2,069 $64,633,400 $185,720,900 689 $42,996,300 $156,296,600 1,021 $45,733,900 $178,962,200 3,779Louisiana 2,437 $72,335,000 $226,730,800 799 $46,086,100 $157,098,700 1,020 $47,129,800 $182,279,500 4,256Maine 1,376 $42,552,600 $142,666,600 463 $24,803,400 $91,955,600 654 $27,910,200 $92,472,200 2,493Maryland 1,599 $92,440,100 $328,527,500 640 $47,845,400 $144,733,300 1,245 $68,516,100 $202,240,400 3,484Massachusetts 3,676 $269,994,500 $1,292,773,700 1,794 $162,960,600 $459,436,200 3,818 $245,622,900 $642,540,400 9,288Michigan 4,230 $142,655,900 $404,035,000 1,609 $106,386,800 $357,404,600 2,434 $120,051,200 $417,705,500 8,273Minnesota 4,757 $311,105,300 $1,117,393,900 2,741 $212,950,500 $655,626,400 5,262 $272,807,500 $793,328,600 12,760Mississippi 2,324 $96,581,800 $405,025,100 1,080 $52,945,500 $223,689,700 1,430 $53,115,500 $201,611,800 4,834Missouri 5,513 $162,723,800 $511,027,300 2,035 $131,476,400 $459,369,700 2,833 $131,357,800 $437,597,500 10,381Montana 1,427 $43,826,200 $171,271,500 534 $25,770,400 $96,703,600 661 $26,650,200 $87,143,300 2,622Nebraska 1,831 $69,451,200 $274,769,500 762 $56,506,800 $177,307,300 1,175 $55,849,400 $191,279,500 3,768Nevada 1,405 $39,219,500 $130,238,800 501 $29,467,900 $104,443,500 586 $28,474,300 $92,812,200 2,492New Hampshire 2,551 $197,303,700 $743,438,700 1,214 $89,369,900 $261,343,500 2,705 $143,111,400 $399,700,400 6,470New Jersey 1,145 $71,305,400 $222,521,200 529 $45,982,600 $130,782,000 1,069 $68,374,000 $206,338,200 2,743New Mexico 733 $15,013,500 $49,287,000 232 $10,740,600 $47,875,400 245 $10,115,900 $38,595,900 1,210New York 3,745 $252,328,200 $855,783,100 1,837 $176,202,700 $485,636,100 3,404 $226,637,500 $653,852,900 8,986North Carolina 5,146 $188,586,000 $639,672,600 2,173 $131,956,300 $462,943,800 3,190 $148,995,600 $519,704,600 10,509North Dakota 529 $14,984,700 $33,473,200 160 $8,805,500 $29,419,300 212 $9,717,600 $35,020,800 901Ohio 6,407 $194,015,800 $508,055,300 2,215 $146,179,500 $520,897,300 3,359 $159,697,500 $570,729,900 11,981Oklahoma 2,216 $56,343,000 $162,730,000 804 $52,066,700 $173,332,000 986 $45,910,700 $149,775,700 4,006Oregon 2,885 $195,063,800 $642,840,300 1,646 $105,358,500 $335,808,500 2,811 $135,690,200 $409,864,100 7,342Pennsylvania 6,107 $236,627,500 $719,860,200 2,424 $193,684,000 $588,827,900 4,044 $224,996,600 $683,404,100 12,575Rhode Island 197 $17,275,200 $43,815,700 102 $6,479,400 $19,036,200 215 $11,024,600 $34,510,500 514South Carolina 2,957 $124,263,400 $444,007,100 1,259 $71,002,100 $254,082,100 1,848 $79,437,100 $274,454,100 6,064South Dakota 1,028 $33,370,000 $129,924,300 367 $22,815,300 $74,805,900 510 $23,240,000 $77,816,300 1,905Tennessee 3,175 $110,217,100 $293,773,200 1,139 $73,610,800 $255,571,300 1,811 $94,302,100 $303,520,200 6,125Texas 11,467 $413,027,400 $1,234,838,800 4,825 $355,015,000 $1,145,366,400 7,313 $399,395,200 $1,271,005,500 23,605Utah 3,108 $138,663,900 $411,757,500 1,385 $78,322,600 $285,830,400 2,176 $94,173,800 $319,655,600 6,669Vermont 357 $16,838,100 $61,658,100 125 $6,994,600 $24,123,000 235 $10,436,800 $34,935,600 717Virginia 2,806 $98,632,800 $395,998,700 1,076 $77,403,500 $256,776,700 1,549 $78,454,700 $260,605,300 5,431Washington 3,688 $121,338,200 $381,589,600 1,299 $92,783,100 $314,654,400 1,846 $103,266,800 $318,483,900 6,833West Virginia 817 $17,942,900 $61,034,000 267 $14,587,100 $59,892,400 294 $12,422,600 $49,396,800 1,378Wisconsin 2,619 $89,429,400 $279,630,800 1,010 $63,371,200 $219,889,400 1,558 $74,139,700 $267,685,100 5,187Wyoming 676 $20,610,700 $75,383,600 224 $12,436,000 $45,712,200 252 $10,821,800 $39,881,600 1,152United States 149,146 $6,227,108,200 $21,361,163,600 62,827 $4,342,966,200 $14,320,977,800 100,018 $5,161,711,300 $16,405,365,000 311,991
Direct Suppliers Induced Total
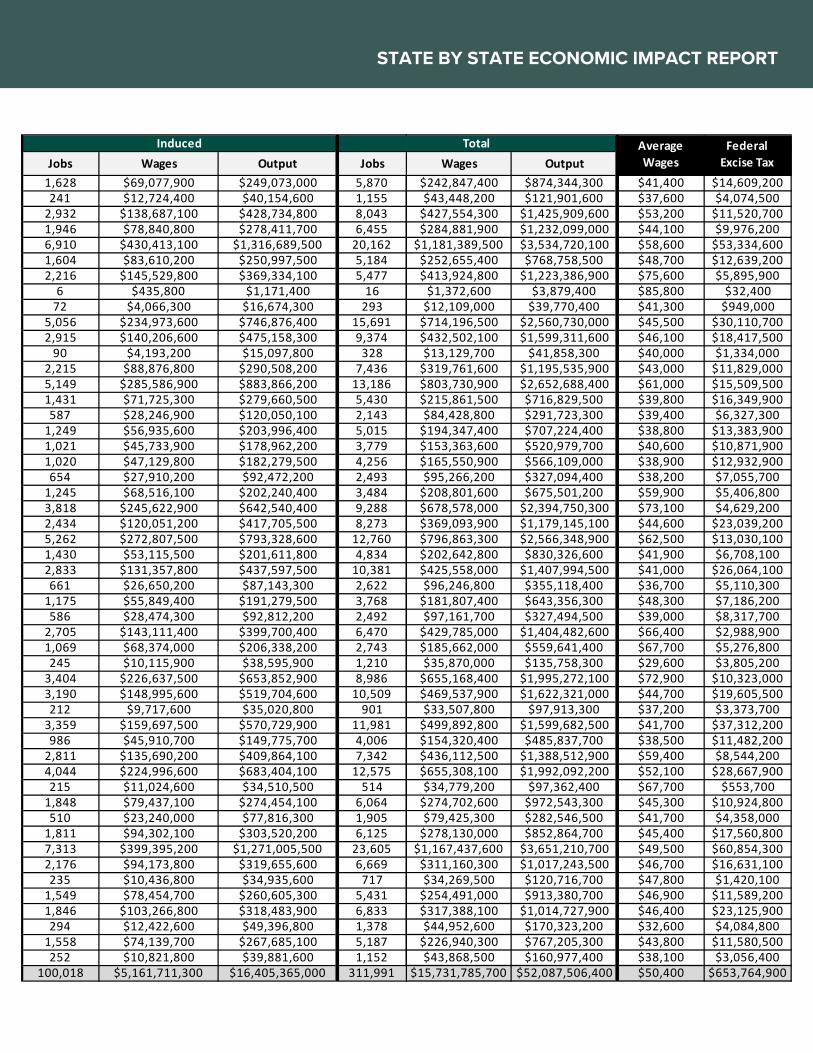
Wages Output$242,847,400 $874,344,300 $41,400 $14,609,200$43,448,200 $121,901,600 $37,600 $4,074,500$427,554,300 $1,425,909,600 $53,200 $11,520,700$284,881,900 $1,232,099,000 $44,100 $9,976,200$1,181,389,500 $3,534,720,100 $58,600 $53,334,600$252,655,400 $768,758,500 $48,700 $12,639,200$413,924,800 $1,223,386,900 $75,600 $5,895,900$1,372,600 $3,879,400 $85,800 $32,400$12,109,000 $39,770,400 $41,300 $949,000$714,196,500 $2,560,730,000 $45,500 $30,110,700$432,502,100 $1,599,311,600 $46,100 $18,417,500$13,129,700 $41,858,300 $40,000 $1,334,000$319,761,600 $1,195,535,900 $43,000 $11,829,000$803,730,900 $2,652,688,400 $61,000 $15,509,500$215,861,500 $716,829,500 $39,800 $16,349,900$84,428,800 $291,723,300 $39,400 $6,327,300$194,347,400 $707,224,400 $38,800 $13,383,900$153,363,600 $520,979,700 $40,600 $10,871,900$165,550,900 $566,109,000 $38,900 $12,932,900$95,266,200 $327,094,400 $38,200 $7,055,700$208,801,600 $675,501,200 $59,900 $5,406,800$678,578,000 $2,394,750,300 $73,100 $4,629,200$369,093,900 $1,179,145,100 $44,600 $23,039,200$796,863,300 $2,566,348,900 $62,500 $13,030,100$202,642,800 $830,326,600 $41,900 $6,708,100$425,558,000 $1,407,994,500 $41,000 $26,064,100$96,246,800 $355,118,400 $36,700 $5,110,300$181,807,400 $643,356,300 $48,300 $7,186,200$97,161,700 $327,494,500 $39,000 $8,317,700$429,785,000 $1,404,482,600 $66,400 $2,988,900$185,662,000 $559,641,400 $67,700 $5,276,800$35,870,000 $135,758,300 $29,600 $3,805,200$655,168,400 $1,995,272,100 $72,900 $10,323,000$469,537,900 $1,622,321,000 $44,700 $19,605,500$33,507,800 $97,913,300 $37,200 $3,373,700$499,892,800 $1,599,682,500 $41,700 $37,312,200$154,320,400 $485,837,700 $38,500 $11,482,200$436,112,500 $1,388,512,900 $59,400 $8,544,200$655,308,100 $1,992,092,200 $52,100 $28,667,900$34,779,200 $97,362,400 $67,700 $553,700$274,702,600 $972,543,300 $45,300 $10,924,800$79,425,300 $282,546,500 $41,700 $4,358,000$278,130,000 $852,864,700 $45,400 $17,560,800$1,167,437,600 $3,651,210,700 $49,500 $60,854,300$311,160,300 $1,017,243,500 $46,700 $16,631,100$34,269,500 $120,716,700 $47,800 $1,420,100$254,491,000 $913,380,700 $46,900 $11,589,200$317,388,100 $1,014,727,900 $46,400 $23,125,900$44,952,600 $170,323,200 $32,600 $4,084,800$226,940,300 $767,205,300 $43,800 $11,580,500$43,868,500 $160,977,400 $38,100 $3,056,400
$15,731,785,700 $52,087,506,400 $50,400 $653,764,900
Federal Excise Tax
Total Average Wages
ECONOMIC CONTRIBUTION OF ARMS AND AMMUNITION INDUSTRIES, 2018 STATE BY STATE ECONOMIC IMPACT REPORT
Jobs Wages Output Jobs Wages Output Jobs Wages Output Jobs
Alabama 3,105 $109,636,200 $384,359,200 1,137 $64,133,300 $240,912,100 1,628 $69,077,900 $249,073,000 5,870Alaska 717 $20,023,200 $45,430,900 197 $10,700,600 $36,316,100 241 $12,724,400 $40,154,600 1,155Arizona 3,476 $180,699,200 $643,856,700 1,635 $108,168,000 $353,318,100 2,932 $138,687,100 $428,734,800 8,043Arkansas 3,101 $127,077,000 $640,237,000 1,408 $78,964,100 $313,450,300 1,946 $78,840,800 $278,411,700 6,455California 9,196 $419,042,200 $1,185,500,300 4,056 $331,934,200 $1,032,530,300 6,910 $430,413,100 $1,316,689,500 20,162Colorado 2,471 $90,281,000 $273,144,800 1,109 $78,764,200 $244,616,200 1,604 $83,610,200 $250,997,500 5,184Connecticut 2,289 $172,328,300 $597,457,600 972 $96,066,700 $256,595,200 2,216 $145,529,800 $369,334,100 5,477District of Columbia 4 $117,800 $276,600 6 $819,000 $2,431,400 6 $435,800 $1,171,400 16Delaware 163 $3,935,300 $8,630,300 58 $4,107,400 $14,465,800 72 $4,066,300 $16,674,300 293Florida 7,107 $265,748,000 $1,036,599,600 3,528 $213,474,900 $777,254,000 5,056 $234,973,600 $746,876,400 15,691Georgia 4,519 $163,820,400 $684,618,900 1,940 $128,475,100 $439,534,400 2,915 $140,206,600 $475,158,300 9,374Hawaii 178 $5,966,100 $14,753,900 60 $2,970,400 $12,006,600 90 $4,193,200 $15,097,800 328Idaho 3,610 $147,785,900 $581,482,600 1,611 $83,098,900 $323,545,100 2,215 $88,876,800 $290,508,200 7,436Illinois 5,286 $305,673,000 $1,104,282,600 2,751 $212,471,000 $664,539,600 5,149 $285,586,900 $883,866,200 13,186Indiana 3,037 $78,166,900 $212,649,900 962 $65,969,300 $224,519,100 1,431 $71,725,300 $279,660,500 5,430Iowa 1,171 $31,958,200 $84,556,900 385 $24,223,700 $87,116,300 587 $28,246,900 $120,050,100 2,143Kansas 2,713 $74,149,500 $282,072,200 1,053 $63,262,300 $221,155,800 1,249 $56,935,600 $203,996,400 5,015Kentucky 2,069 $64,633,400 $185,720,900 689 $42,996,300 $156,296,600 1,021 $45,733,900 $178,962,200 3,779Louisiana 2,437 $72,335,000 $226,730,800 799 $46,086,100 $157,098,700 1,020 $47,129,800 $182,279,500 4,256Maine 1,376 $42,552,600 $142,666,600 463 $24,803,400 $91,955,600 654 $27,910,200 $92,472,200 2,493Maryland 1,599 $92,440,100 $328,527,500 640 $47,845,400 $144,733,300 1,245 $68,516,100 $202,240,400 3,484Massachusetts 3,676 $269,994,500 $1,292,773,700 1,794 $162,960,600 $459,436,200 3,818 $245,622,900 $642,540,400 9,288Michigan 4,230 $142,655,900 $404,035,000 1,609 $106,386,800 $357,404,600 2,434 $120,051,200 $417,705,500 8,273Minnesota 4,757 $311,105,300 $1,117,393,900 2,741 $212,950,500 $655,626,400 5,262 $272,807,500 $793,328,600 12,760Mississippi 2,324 $96,581,800 $405,025,100 1,080 $52,945,500 $223,689,700 1,430 $53,115,500 $201,611,800 4,834Missouri 5,513 $162,723,800 $511,027,300 2,035 $131,476,400 $459,369,700 2,833 $131,357,800 $437,597,500 10,381Montana 1,427 $43,826,200 $171,271,500 534 $25,770,400 $96,703,600 661 $26,650,200 $87,143,300 2,622Nebraska 1,831 $69,451,200 $274,769,500 762 $56,506,800 $177,307,300 1,175 $55,849,400 $191,279,500 3,768Nevada 1,405 $39,219,500 $130,238,800 501 $29,467,900 $104,443,500 586 $28,474,300 $92,812,200 2,492New Hampshire 2,551 $197,303,700 $743,438,700 1,214 $89,369,900 $261,343,500 2,705 $143,111,400 $399,700,400 6,470New Jersey 1,145 $71,305,400 $222,521,200 529 $45,982,600 $130,782,000 1,069 $68,374,000 $206,338,200 2,743New Mexico 733 $15,013,500 $49,287,000 232 $10,740,600 $47,875,400 245 $10,115,900 $38,595,900 1,210New York 3,745 $252,328,200 $855,783,100 1,837 $176,202,700 $485,636,100 3,404 $226,637,500 $653,852,900 8,986North Carolina 5,146 $188,586,000 $639,672,600 2,173 $131,956,300 $462,943,800 3,190 $148,995,600 $519,704,600 10,509North Dakota 529 $14,984,700 $33,473,200 160 $8,805,500 $29,419,300 212 $9,717,600 $35,020,800 901Ohio 6,407 $194,015,800 $508,055,300 2,215 $146,179,500 $520,897,300 3,359 $159,697,500 $570,729,900 11,981Oklahoma 2,216 $56,343,000 $162,730,000 804 $52,066,700 $173,332,000 986 $45,910,700 $149,775,700 4,006Oregon 2,885 $195,063,800 $642,840,300 1,646 $105,358,500 $335,808,500 2,811 $135,690,200 $409,864,100 7,342Pennsylvania 6,107 $236,627,500 $719,860,200 2,424 $193,684,000 $588,827,900 4,044 $224,996,600 $683,404,100 12,575Rhode Island 197 $17,275,200 $43,815,700 102 $6,479,400 $19,036,200 215 $11,024,600 $34,510,500 514South Carolina 2,957 $124,263,400 $444,007,100 1,259 $71,002,100 $254,082,100 1,848 $79,437,100 $274,454,100 6,064South Dakota 1,028 $33,370,000 $129,924,300 367 $22,815,300 $74,805,900 510 $23,240,000 $77,816,300 1,905Tennessee 3,175 $110,217,100 $293,773,200 1,139 $73,610,800 $255,571,300 1,811 $94,302,100 $303,520,200 6,125Texas 11,467 $413,027,400 $1,234,838,800 4,825 $355,015,000 $1,145,366,400 7,313 $399,395,200 $1,271,005,500 23,605Utah 3,108 $138,663,900 $411,757,500 1,385 $78,322,600 $285,830,400 2,176 $94,173,800 $319,655,600 6,669Vermont 357 $16,838,100 $61,658,100 125 $6,994,600 $24,123,000 235 $10,436,800 $34,935,600 717Virginia 2,806 $98,632,800 $395,998,700 1,076 $77,403,500 $256,776,700 1,549 $78,454,700 $260,605,300 5,431Washington 3,688 $121,338,200 $381,589,600 1,299 $92,783,100 $314,654,400 1,846 $103,266,800 $318,483,900 6,833West Virginia 817 $17,942,900 $61,034,000 267 $14,587,100 $59,892,400 294 $12,422,600 $49,396,800 1,378Wisconsin 2,619 $89,429,400 $279,630,800 1,010 $63,371,200 $219,889,400 1,558 $74,139,700 $267,685,100 5,187Wyoming 676 $20,610,700 $75,383,600 224 $12,436,000 $45,712,200 252 $10,821,800 $39,881,600 1,152United States 149,146 $6,227,108,200 $21,361,163,600 62,827 $4,342,966,200 $14,320,977,800 100,018 $5,161,711,300 $16,405,365,000 311,991
Direct Suppliers Induced Total
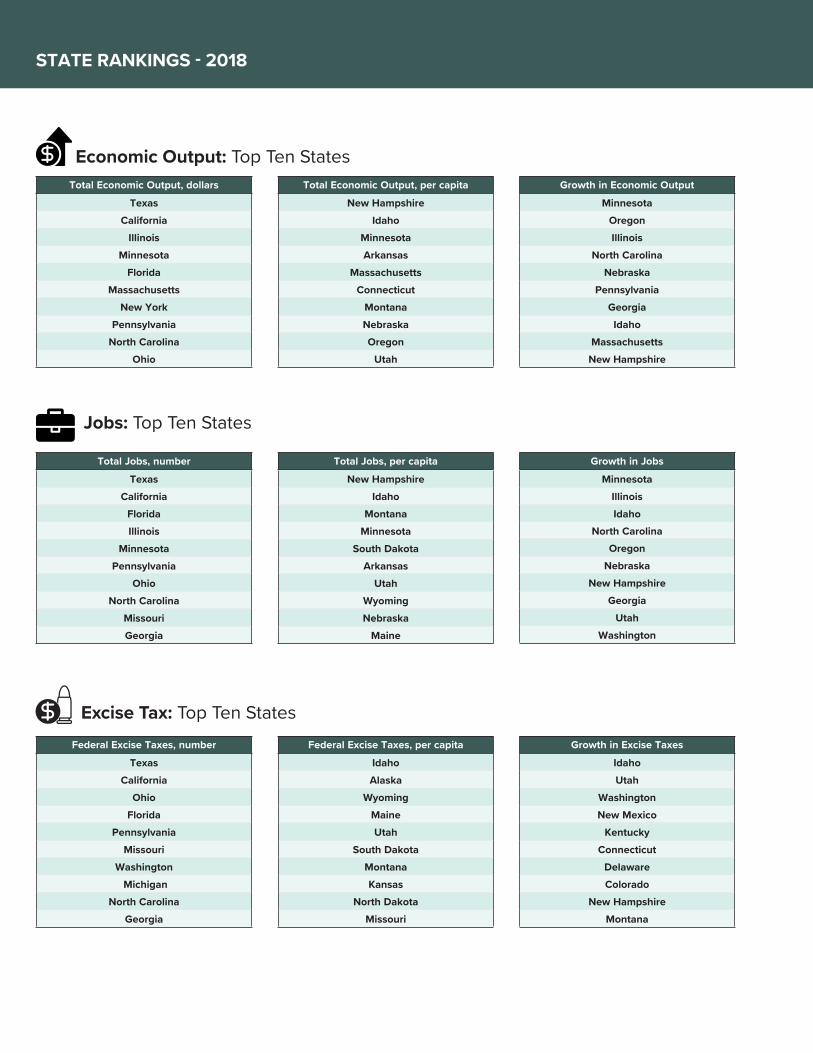
STATE RANKINGS - 2018
Total Economic Output, dollars
TexasCalifornia
IllinoisMinnesota
FloridaMassachusetts
New YorkPennsylvania
North CarolinaOhio
Total Jobs, per capita
New HampshireIdaho
MontanaMinnesota
South DakotaArkansas
UtahWyomingNebraska
Maine
Growth in Jobs
MinnesotaIllinois Idaho
North CarolinaOregon
NebraskaNew Hampshire
GeorgiaUtah
Washington
Total Jobs, number
TexasCalifornia
FloridaIllinois
MinnesotaPennsylvania
OhioNorth Carolina
MissouriGeorgia
Total Economic Output, per capita
New HampshireIdaho
MinnesotaArkansas
MassachusettsConnecticut
MontanaNebraskaOregon
Utah
Growth in Economic Output
MinnesotaOregonIllinois
North CarolinaNebraska
PennsylvaniaGeorgia
IdahoMassachusetts
New Hampshire
Federal Excise Taxes, number
Texas California
OhioFlorida
PennsylvaniaMissouri
Washington Michigan
North CarolinaGeorgia
Federal Excise Taxes, per capita
IdahoAlaska
WyomingMaineUtah
South DakotaMontanaKansas
North DakotaMissouri
Growth in Excise Taxes
IdahoUtah
WashingtonNew Mexico
KentuckyConnecticut
DelawareColorado
New HampshireMontana
Economic Output: Top Ten States
Jobs: Top Ten States
Excise Tax: Top Ten States
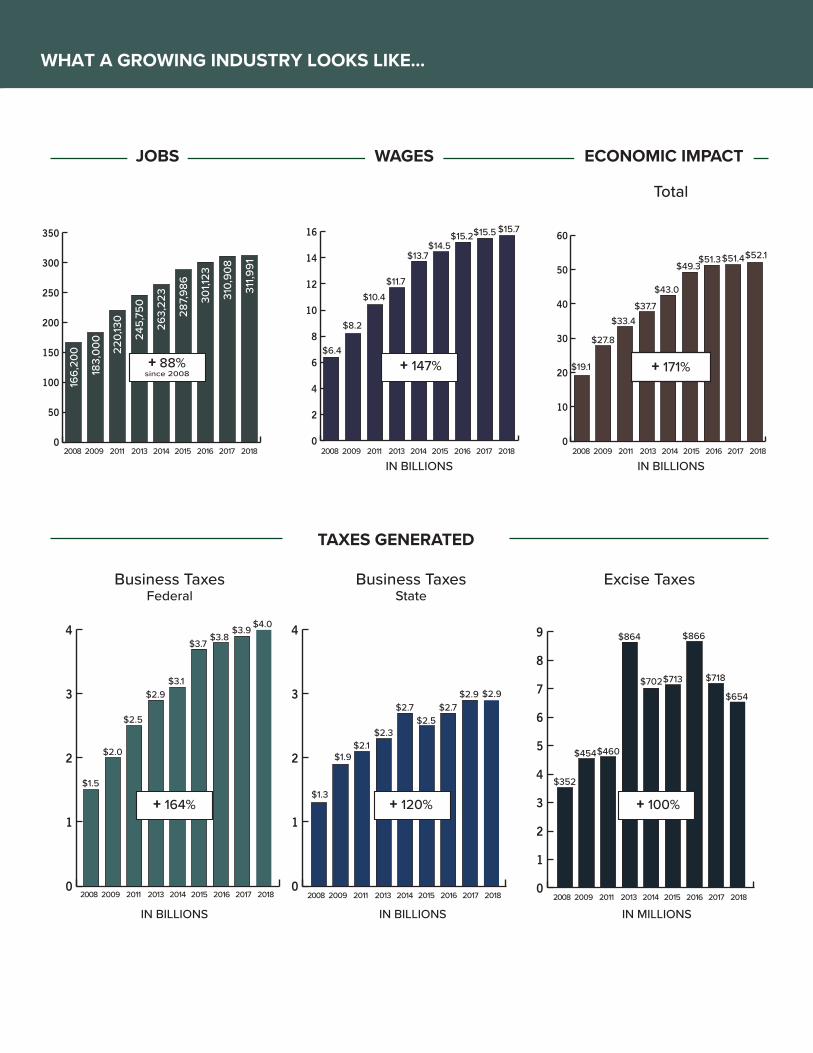
WHAT A GROWING INDUSTRY LOOKS LIKE...
TAXES GENERATED
JOBS WAGES ECONOMIC IMPACT
0
1
2
3
4
0
1
2
3
4
0
1
2
3
4
5
6
7
8
9
$352
$454$460
$864
$702$713
$866
$718
$654
$1.5
$2.0
$2.5
$2.9$3.1
$3.7$3.8
$3.9 $4.0
$1.3
$1.9$2.1
$2.3
$2.7$2.5
$2.7$2.9 $2.9
+ 164% + 120% + 100%
0
2
4
6
8
10
12
14
16
0
50
100
150
200
250
300
350
166,
200
183,
000 24
5,75
0
263
,223
287
,986
301,1
23
310,
908
311,9
91
+ 88%since 2008
+ 147%
2008 2009 2011 2013 2014 2015 2016 2017 2018 2008 2009 2011 2013 2014 2015 2016 2017 2018 2008 2009 2011 2013 2014 2015 2016 2017 2018
2008 2009 2011 2013 2014 2015 2016 2017 2018 2008 2009 2011 2013 2014 2015 2016 2017 2018 2008 2009 2011 2013 2014 2015 2016 2017 2018
220,
130
$6.4
$15.2$15.5 $15.7
$8.2
$10.4$11.7
$13.7$14.5
0
10
20
30
40
50
60
$19.1
$27.8
$33.4$37.7
$43.0
$49.3$51.3$51.4$52.1
+ 171%
Total
Business Taxes
IN BILLIONS IN MILLIONSIN BILLIONS
IN BILLIONSIN BILLIONS
Business Taxes Excise TaxesFederal State

Item #9101A 3/18© 2018 National Shooting Sports Foundation, Inc. All Rights Reserved